scoping activities disinfection by-products (dbps) … · 2017-10-20 · introduction in marine...
TRANSCRIPT
L:\med\LONCONOF\GESAMP\SESSIONS\44\Documents\44_7.docx
44th session Agenda item 7
GESAMP 44/7 8 August 2017
ENGLISH ONLY
SCOPING ACTIVITIES
CG1: Scoping paper on the relevance of the ballast water related production of disinfection by-products (DBPs) against other inputs of DBPs
in the aquatic environment
Submitted by Thomas Höfer (Member of GESAMP) in co-authorship with Matthias Grote (German Federal Institute for Risk Assessment, Berlin)
INTRODUCTION History of the document 1 In 2010, during GESAMP 37 the question was raised whether the total amount of chemicals (disinfection by-products and residual oxidants) introduced into the marine environment could endanger this vulnerable environment. The report of GESAMP 37 states:
“New and Emerging issues from GESAMP 37 7.6 One member of GESAMP noted the rapid expansion of coastal energy generating stations, industrial cooling units and desalination plants in many developing countries, most of which rely on electrolytic chlorination to prevent fouling. Attention was drawn to substances of concern such as Total Residual Oxidants (TRO) as well as halogenated disinfection by-products, which occur when chlorine interacts with organic matter. It was pointed out that GESAMP’s WG 34 was in possession of a growing body of data on the composition and concentrations of chlorination by-products such as halomethanes, e.g. tribromomethane and haloacetic acids as well as standardized environmental hazard data, which might be of use to other organizations when assessing the potential environmental impact of electrolytic antifouling systems. Recommended standards for Total Residual Oxidants (TRO) differ nationally and regionally; the World Bank discharge standard being 0.2 mg/L but which allows up to 2mg/L for shorter periods within 24h. GESAMP decided to consider this further under Agenda item 8, scoping activities, in particular environmental quality standards.”
2 During GESAMP 38 the matter was deferred to GESAMP 39 due to lack of time. An initial scoping paper was submitted to GESAMP 39 by Jan Linders, chairman of the GESAMP-BWWG, describing the structure of a study aimed at dealing with the relevance of the production of DBPs against other inputs of DBPs in the aquatic environment. The basic assumption is that, as many BWMS use chlorine (i.e. electrolysis) and ozone disinfection, the input of the disinfection by-products (DBPs) may be a significant contribution to marine pollution. 3 At the GESAMP 40, a revised version of the document was presented (GESAMP 40/8). It was agreed that the subject should be further developed and the document should be updated and restructured in order to quantify the overall inputs and concentrations of major
L:\med\LONCONOF\GESAMP\SESSIONS\44\Documents\44_7.docx
- 2 -
DBPs in sea water and allow an evaluation of contributions of the different sources. A further aim of the scoping paper is to identify and prioritize research needs. Problem formulation 4 This scoping document intends to clarify the importance of the introduction of DBPs through the use of ballast water management systems (BWMS) as well as other sources of introduction in marine waters like industrial cooling units, desalination plants and seawater toilets. Furthermore, as some compounds produced as DBPs are also produced naturally in the marine environment, the paper aims to provide an overview on compounds and quantities formed through natural processes in order to put the anthropogenic DBP production into the context of the overall production. Disinfection Byproducts in marine waters 5 Marine waters are subject to disinfection for several purposes. Ballast water treatment aims to minimize survival of organisms carried in ballast water tanks in order to limit one important vector for the spreading of potentially invasive species. In cooling water circuits, disinfection aims to reduce biofouling and clogging in order to assure good thermal exchange rates and reduce maintenance needs. In desalination plants, disinfection aims also to limit biofouling, but also to control potentially present pathogens in order to assure reliable and safe drinking water supply in arid regions. Other applications are aquaculture and seawater toilets, which are however less important in quantitative terms. 6 Different oxidizing chemicals can be used for disinfection purposes, which can either be added from storage tanks or be generated in situ. Some disinfection techniques (electro-chlorination, chlorination, ozonization), generate similar reactive intermediate oxidants and thus produce similar patterns of DBPs. Other oxidation techniques (e.g., ClO2, peracetic acid and hydrogenperoxide) typically produce different patterns of DBPs. However, relative composition and absolute concentrations of DBPs also depend on process parameters such as concentration of active substances, reaction time, and the chemical characteristics of the treated water (salinity, organic matter etc.). Therefore, DBP generation typically varies between different applications and sites even if similar techniques are used. Here we try to give an overview over patterns and quantities typically encountered in the major applications. Natural production of organohalogen compounds 7 Haloorganic (or organohalogen) compounds are not only generated during oxidative disinfection. The ubiquitous abundance of halides has resulted in the evolution of organohalogens in all regions of the earth (Gribble, 2010). Haloorganic compounds are part of the spectrum of naturally generated compounds. More than 2000 organohalogen compounds have been described to be formed in marine organisms (Gribble, 2010). Most of these compounds are distinct from disinfection by-products and are formed in small quantities by specialized organisms. However, some of the DBPs with the highest concentration in sea water disinfection are also produced as major natural organohalogens, with bromoform being a major DBP and major natural product in the marine environment. As major sources were identified sea grass and certain algae species. Therefore, in this paper the production of DBP is put into context of naturally produced compounds. NATURAL PRODUCTION OF HALOCARBONS Sources and identified compounds 8 Formation of organohalogens may result from biogenic and abiotic processes. Although haloorganic compounds may be formed photo-catalytically in the atmosphere, the main source in nature is their production by organisms that use them as part of their natural

L:\med\LONCONOF\GESAMP\SESSIONS\44\Documents\44_7.docx
- 3 -
defense mechanism against attacks by micro-organisms and predators. Marine and terrestrial organisms contain haloperoxidases that halogenate organic compounds in the presence of chloride, bromide or iodide ions (Gribble, 2010). More than 2000 organohalogen compounds have been identified as natural products in in marine organisms (Gribble, 2010). In seawater, tribromomethane, other trihalomethanes (THMs) and non-volatile compounds such as bromophenols are produced by benthic and planktonic algae. 9 Brown, green and red macroalgae produce variable amounts of bromoalkanes, which they deliver to the aquatic environment or, in inter-tidal regions, directly to the atmosphere (Quack and Wallace, 2003). Even though the actual ratios of the bromoalkanes released (CHBr3, CH2Br2, CH2BrCl, CHBr2Cl, CHBrCl2) vary from one study to another, bromoform is always the dominant compound (Quack and Wallace, 2003). In general, polar species produce the least bromocompounds, whereas subtropical and tropical species appear to be more efficient producers. Measured production rates range from 4 to 5000 pmol CHBr3 g-1 h-1 (bromoform per gram fresh weight per hour) (as summarized byQuack and Wallace, 2003). Brown algae have been estimated to produce 1.35·108 kg/year, which represents 60% of the total production (Carpenter and Liss, 2000). Quantification 10 Most of the natural haloorganic compounds produced are unique to individual marine organisms and are not widely dispersed in the marine environment (Gribble, 2010). However, some volatile haloalkanes, which have several marine sources, represent a major part in the total quantity of organohalogens in the world’s oceans. As some of these compounds play an important role in the depletion of tropospheric and stratospheric ozone, they are relatively well studied. Bromform is considered a major natural haloorganic compound and through its volatility also the major contributor to atmospheric bromine concentration and therefore a major factor in the ozone depletion process. Ziska et al. (2013) provide an overview on existing measurements and model estimates for bromoform, dibromomethane and monoiodomethane concentrations in ocean surface waters based on different studies (Carpenter and Liss, 2000; Liu et al., 2011; Quack and Wallace, 2003; Yokouchi et al., 2005) and data extracted from the HalOcAt database (https://halocat.geomar.de/web/halocat/home) consisting of data from coastal stations, ship operations and aircraft campaigns. In total, Ziska et al. (2013) used 5300 data points on ocean surface concentrations of different haloalkanes from 1989 to 2011 in order to create a 1°x1° model for the description of surface concentration of these three halomethanes. 11 Estimated annual production rates of major naturally produced halomethanes are provided in Table 1. As volatilization is assumed to be the main path of loss for CHBr3 and CH2Br2, the annual production is assumed to be similar to the global flux to the atmosphere. For CH3I concentrations in the surface water are determined by both production and degradation (Butler et al., 2007) and therefore the production and the atmospheric flux are not equivalent.
Table 1: The annual production of selected halomethanes
Substance Amount of annual marine natural production or emissions (t y-1)
iodomethane 2.4 – 4.8 Gmol I yr-1 (Quack and Wallace, 2003) (emissions)
dibromomethane 0.8 – 3.5 Gmol Br yr-1 (Quack and Wallace, 2003) (emissions)
bromoform 1.35 (0.34-2.3) · 105 (Carpenter and Liss, 2000) 10 (3–22) Gmol Br yr-1 (Quack and Wallace, 2003)
L:\med\LONCONOF\GESAMP\SESSIONS\44\Documents\44_7.docx
- 4 -
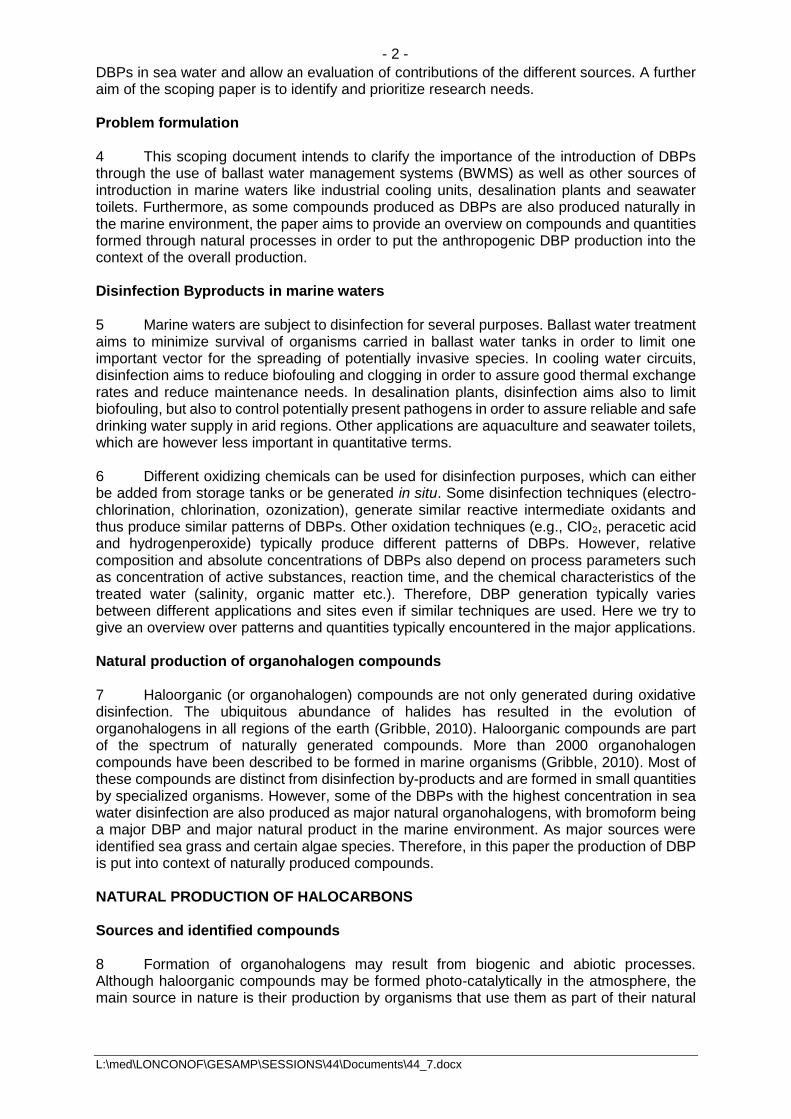
12 Table 2 provides on overview on marine surface concentrations of bromoform. Concentrations are higher in the equatorial region, upwelling areas, near coastal areas and in shelf regions. This is consistent with macroalgal and anthropogenic sources along the coast lines as well as biological sources in upwelling areas (Ziska et al., 2013). These analyses provide means in larger regions. Local concentration can be significantly higher, e.g. Nightingale et al. (1995) observed concentrations up to 470 ng/L in brown algae beds.
Table 2: Concentrations of bromoform in different sea regions
Location bromoform (ng/L)
North Atlantic 1.4 ± 0.85 (Fogelqvist and Krysell, 1991)
Northern North Sea 2.4 ± 1.4 (Fogelqvist and Krysell, 1991)
Whole North Sea 8.4 ± 7.7 (Fogelqvist and Krysell, 1991)
Open ocean 0.03-0.15 (Carpenter et al., 2009)
equatorial region ~1.5 (Ziska et al., 2013)
upwelling areas (e.g. the Mauritanian upwelling region)
~5.3 (Ziska et al., 2013)
near coastal areas ~4.3-10.6 (Ziska et al., 2013)
shelf regions ~2-8 (Ziska et al., 2013)
tropics 0.9 (Butler et al., 2007)
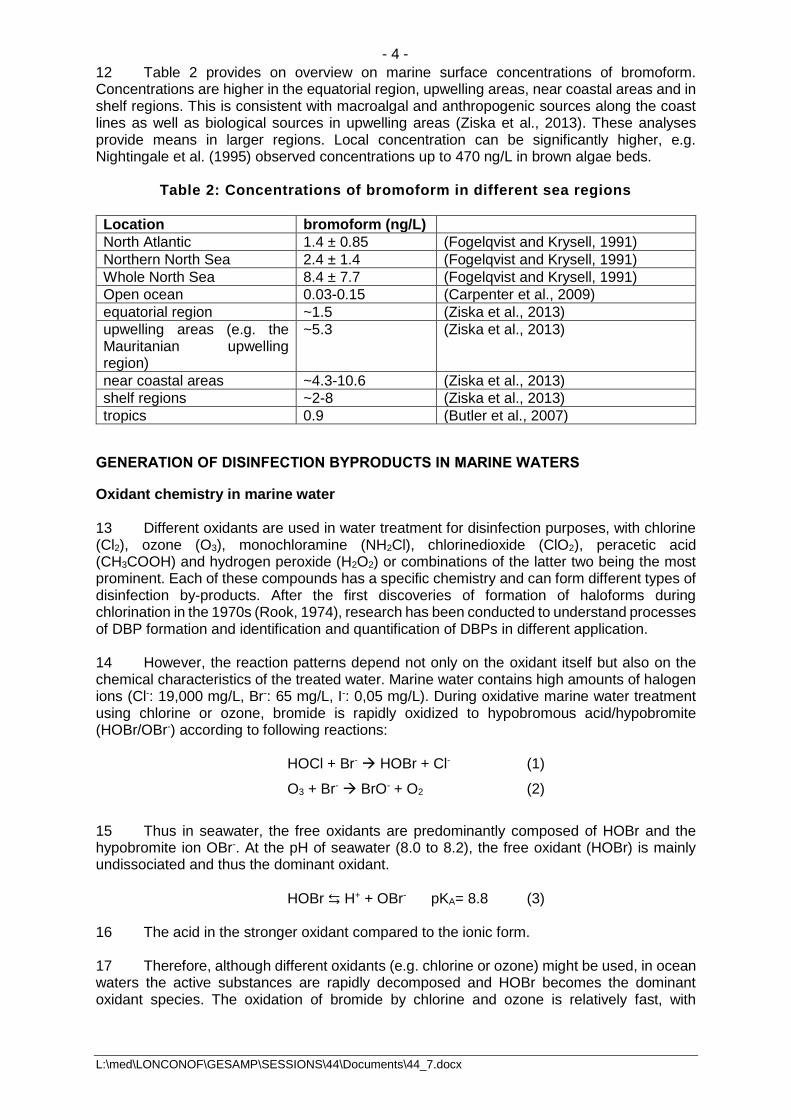
GENERATION OF DISINFECTION BYPRODUCTS IN MARINE WATERS Oxidant chemistry in marine water 13 Different oxidants are used in water treatment for disinfection purposes, with chlorine (Cl2), ozone (O3), monochloramine (NH2Cl), chlorinedioxide (ClO2), peracetic acid (CH3COOH) and hydrogen peroxide (H2O2) or combinations of the latter two being the most prominent. Each of these compounds has a specific chemistry and can form different types of disinfection by-products. After the first discoveries of formation of haloforms during chlorination in the 1970s (Rook, 1974), research has been conducted to understand processes of DBP formation and identification and quantification of DBPs in different application. 14 However, the reaction patterns depend not only on the oxidant itself but also on the chemical characteristics of the treated water. Marine water contains high amounts of halogen ions (Cl-: 19,000 mg/L, Br-: 65 mg/L, I-: 0,05 mg/L). During oxidative marine water treatment using chlorine or ozone, bromide is rapidly oxidized to hypobromous acid/hypobromite (HOBr/OBr-) according to following reactions:
HOCl + Br- HOBr + Cl- (1)
O3 + Br- BrO- + O2 (2)
15 Thus in seawater, the free oxidants are predominantly composed of HOBr and the hypobromite ion OBr-. At the pH of seawater (8.0 to 8.2), the free oxidant (HOBr) is mainly undissociated and thus the dominant oxidant.
HOBr ⇆ H+ + OBr- pKA= 8.8 (3) 16 The acid in the stronger oxidant compared to the ionic form. 17 Therefore, although different oxidants (e.g. chlorine or ozone) might be used, in ocean waters the active substances are rapidly decomposed and HOBr becomes the dominant oxidant species. The oxidation of bromide by chlorine and ozone is relatively fast, with

L:\med\LONCONOF\GESAMP\SESSIONS\44\Documents\44_7.docx
- 5 -
hypochlorous acid reacting about ten times faster with bromide than ozone. Also other bromine species such as Br2, BrCl, and Br2O are formed under certain conditions (Heeb et al., 2014). The oxidation of bromide by chlorine dioxide is very slow and negligible under typical water treatment conditions (Hoigné and Bader, 1994). The oxidation of bromide to HOBr by peracetic acid has been demonstrated (Booth and Lester, 1995) and the formation of brominated disinfection by-products has been shown (Shah et al., 2015). 18 The reactions of oxidants in sea water are complex. A systematic and critical literature review on the reactivity of HOBr/OBr- and other bromine species with inorganic and organic compounds has been conducted by Heeb et al. (2014). Further oxidation of HOBr Bromate 19 Hypobromous acid can further be oxidized to bromate. This oxidation is most relevant during ozonation where bromate is formed through a complicated mechanism including both ozone and OH-radical reactions (von Gunten, 2003; von Gunten and Hoigné, 1994; von Gunten and von Sonntag, 2012). It has also been observed in electrochlorination of seawater, but typically in lower concentrations (Jung et al., 2014). Reaction of hypobromous acid (or oxidants?) with organic compounds 20 Natural water may contain a large variety of organic compounds. Especially river and estuary waters are rich in particulate and dissolved organic matter composed of humic substances etc. These compounds can be oxidized, which may result in the cleavage of covalent bonds and the introduction of halogens into the organic structures. The introduced oxidants are typically consumed rather quickly until all oxidisable material has reacted. The amount of oxydisable material can be quantified as “oxygen demand”. The amount of oxygen not immediately consumed can be quantified as “Total Residual oxidant (TRO)”. The breakup of larger organic molecules and structures induced by the reaction with the described oxidants results in the generation of smaller so called disinfection by-products (DBPs) often containing halogens. Furthermore, some larger organic structures with introduced halogen atoms can remain. These complex structures are more difficult to study as they are less amenable to classic chemical analytics such as GC/MS, but can be detected as absorbable organic halogens (AOX) or similar measures. Identity of DPBs in marine water 21 In the following sections, an overview on some of the typically observed and most prominent DBPs is provided. As DBPs were first discovered in disinfected drinking water, for most DBP groups chlorinated species were first detected. Later, when focusing on bromine containing waters including marine waters, many bromo-analogues of Cl-containing DPBs were identified. Bromine containing compounds represent the largest group of DBPs detected in marine waters. The identity and quantity of DBPs and their relative abundance depends on the specific oxidizing conditions (oxidants, concentrations, reactions times, etc.) but also on the nature of the organic matter present. However, similar types of DBPs are formed under a variety of applications. The most prominent are presented hereafter. Trihalomethanes (THMs) and other haloalkanes 22 Trihalomethanes are quantitatively the most important group of DBPs generated during water chlorination both for freshwater and marine water. In fresh water containing low levels of bromide, chloroform (CHCl3) is the major THM generated. All four chlorinated/brominated THMs have been detected in chlorinated marine water: CHCl3, CHBrCl2, CHBr2Cl and CHBr3. with tribromomethane (CHBr3, bromoform) being by far the major THM. Bromoform was estimated to represent 93-97% of all THM formed in marine waters (Khalanski and Jenner, 2012). Iodine containing THMs with iodoform (CHI3)

L:\med\LONCONOF\GESAMP\SESSIONS\44\Documents\44_7.docx
- 6 -
predominating other iodo-THMs have been reported in drinking and seawater disinfection (Bichsel and Von Gunten, 2000; Criquet et al., 2012) but occur typically in lower concentrations than bromo-THMs. 23 Mono-, di- and tetrahalomethanes have been observed, but typically in much lower concentrations than the trihalomethanes. Furthermore, a wide range of other halogen-containing haloethanes, haloethenes and halopropanes have been detected, but also in lower concentrations. Haloacetic acids (HAAs) 24 Haloacetic acids typically represent the second largest group within the whole DBP mixture. In marine water, dibromoacetic acid (DBAA) is observed as the compound with the second highest concentration after bromoform. Other HAAs can be detected in considerably lower concentrations, including mono- and tribromoacetic acid, but also mono-, di- and trichloroacetic acid and bromochloro-, bromodichloro- and dibromochloroacetic acid. In freshwater, dichloroacetic acid is one common major DBP with presence of minor amounts of mono- and trichloroacetic acid. HAAs have been reported to represent the major DBP detectable in deep-ocean water (1500 m depth)(Fabbricino and Korshin, 2005). Haloacetonitriles 25 Haloacetonitriles constitute only 5% or less of the total halogenated by-products after chlorination. Before the relevance of HAAs was revealed, dibromoacetonitrile was considered as the second most relevant marine DBP. Due to the limited volatilization compared to THMs and haloacetonitriles, Bromate 26 Bromates were discovered early as DBP in marine cooling waters (Macalady et al., 1977). Their production is most pronounced in ozonation but it is also produced from other oxidants in the presence of bromide. Sum parameters (AOX, EOX, POX) 27 As not all disinfection by-products are identified or are amenable to chemical analysis, also sum parameters are used. Adsorbable Organohalogens (AOX) designates organohalogens adsorbable on activated carbon. This operationally defined parameter provides an estimate of the amount halogens bound to organic structures, which is in some way correlated to the total amount of disinfection by-products. However, this parameter was established as a quality parameter for fresh water treatment and is not well suited for marine waters as high amounts of inorganic halogens disturb the measurement. Sum parameters adapted to marine waters are: Purgeable Organohalogens (POX) and Extractable Organohalogens (EOX). POX designates purgeable volatile organohalogens. EOX designates organohalogens extracted in an organic solvent and was especially developed for measurements in solutions rich in chloride ions (> 1g/L) and is used on chlorinated seawater (Jenner et al., 1998). All these parameter are global microcoulometry measures and not linked to toxicological characteristics. Some polar haloorganic compounds (e.g., haloacetic acids) are not measured by these methods. 28 It is not always possible to quantitatively explain the measured valued of these sum parameter by the sum of the individually identified and quantified compounds, especially for AOX and EOX. This suggests that not all generated DBPs are identified and that a considerable proportion of unknown DBPs remains to be discovered. On the other hand, it is possible that macroscopic structures (i.e., partially halogenated but not completely fragmented

L:\med\LONCONOF\GESAMP\SESSIONS\44\Documents\44_7.docx
- 7 -
organic macromolecules) represent the major part of these unknown. Further research is needed. Trihalomethanes (THMs) typically represent a significant proportion of POX. BALLAST WATER TREATMENT 29 Ballast water is used to stabilize vessels at sea and is therefore essential for safe and efficient modern shipping operations. However, it may pose serious ecological, economic and health problems due to the multitude of species carried in ships’ ballast water that may be distributed to distant ecosystems. The transferred species may survive to establish a reproductive population in the host environment, becoming invasive, out-competing native species and severely impact local ecosystems. The introduced organisms may include bacteria, microbes, small invertebrates and plants at different stages of the life cycle (eggs, cysts, larvae, spores etc.). The effects of species invasions in many areas of the world have been devastating and are causing enormous damage to biodiversity and resources. Quantitative data show the rate of bio-invasions is continuing to increase at an alarming rate and new areas are being invaded all the time. The damage to the environment is usually irreversible. 30 The shipping industry has been identified as one major vector for the spread of species with ballast water operations being a major driver. As trade and traffic volume have continued to increase over the last few decades, the problem may not yet have reached its peak. To address the spread of species induced by ballast water operations of ships, the IMO adopted the International Convention for the Control and Management of Ships' Ballast Water and Sediments (BWM Convention) in 2004, which will enter into force in September 2017. The Convention will require all ships to carry out ballast water management procedures in order to achieve a given standard (i.e., limits for maximum numbers for different species groups). The agreed implementation schedule stipulates that approximately 80000 ships have to install ballast water treatment systems by 2024. 31 At the time of adoption of Ballast Water Management Convention (BWMC) in 2004, it was unclear what kind of treatment processes would be proposed to meet the performance standards established. In order to assure that no unacceptable harm to the marine environment and human health is induced, the IMO rules require that systems using active substances have to be approved by the GESAMP-Ballast Water Working Group prior to being type-approved by the national authorities. As many systems use oxidant treatments, formation of disinfection by-production during ballast water treatment has been observed in many systems tested. Potential risks resulting from generated DBPs have been analyzed and discussed (Werschkun et al., 2014; Werschkun et al., 2012a; Werschkun et al., 2012b). Treatment process 32 Approved systems use a wide range of physical and chemical methods to ballast water at uptake and in selected systems also at discharge in order to achieve the standard. Physical methods include filtration, ultraviolet radiation (UV) and ultrasound. Chemical methods typically employ oxidants such as chlorine (added in chemical form or generated in situ by electrochlorination), ozone, hydrogen peroxide, chlorine dioxide and others. Many systems employ a combination of those methods (e.g. filtration and electrochlorination). 33 The production of DBPs is only expected for systems that use active substances. The BWWG has thus far recommended Final Approval for 55 systems using active substances, of which 31 systems have also been type-approved by the member states. In total, 60 systems have been type-approved (status MEPC 70). 34 As the exact chemical speciation of fast reacting oxidants is difficult to establish, oxidant concentrations in water treatment are often quantified as total residual oxidants (TRO) providing a comparable measure. Oxidant concentrations ranging from 2 to 20 mg Cl2 / L are
L:\med\LONCONOF\GESAMP\SESSIONS\44\Documents\44_7.docx
- 8 -
used in IMO-approved ballast water management systems. Typically the treatment is performed during uptake but reaction times can be rather long. The reaction in the ballast water tank continues as long as oxidants are not consumed and can last up to the total holding time of the ballast water. Many systems aim to maintain a certain concentration all over the total holding time in order to maintain the biocidal potential. In order not to reject remaining oxidants, often a neutralization is performed prior to or during discharge. TRO limits of 0.1-0.2 mg Cl2/L in discharge have to be respected. 35 The composition and the concentration of DBPs depend on different factors. On the one hand system dependent factors such as oxidant type and oxidant concentration are important, e.g. chlorine dioxide has been described to produce lower concentrations and fewer DBPs compared to the most prominent oxidant treatment using chlorine, whereas ozone may produce bromate through further BrO- oxidation. On the other hand, also water quality characteristics which depend on the place and time of uptake play an important role (salinity, DOC, TOC, TSS, pH etc.). Quantification 36 When aiming to quantify the total amounts of DBP inputs into the marine environments, the following aspects have to be considered: the amount of treated ballast water, the potential ratio of systems using oxidants, the concentrations of DBPs in the treated ballast water and the locations where it is released, i.e. in dilution can be expected in the receiving environment. Amount of discharged ballast water 37 All ships of 400 gross tonnes (gt) and above fall under the BWMC (approximately 80000 vessels). At the time of writing the paper (prior to the entering into force of the convention in September 2017) only few of these vessels were equipped with BW treatment systems. By 2024 all vessels of 400 gt and above must be equipped with as BW treatment system. 38 Ballast water is used to maintain stability of the ship; to reduce hull stresses and for operational reasons. In general, vessels discharge ballast when loading cargo, and take up ballast when unloading cargo. Therefore the major part of ballast water operations is carried out in or close to ports. The quantity of ballast water carried, however, primarily depends on the cargo handling operations carried out. Additional ballast operation may be needed depending on weather conditions or specific navigation needs (low water depth or pass under bridges). When expecting to sail through bad weather conditions and heavy seas, vessels would be in heavy ballast condition to improve the safety of navigation. The annual global ballast water discharges from vessels engaged in the international seaborne trade was estimated as 3.1 billion tonnes in 2013 (David, 2015) and 3-5 billion tonnes according to the Globallast website (http://archive.iwlearn.net/globallast.imo.org/globallast.imo.org/ballast-water-as-a-vector/index.html accessed May 3rd 2017). 39 Currently, as only few vessels are equipped and even fewer operate their ballast water treatment system, the total amount of chemically treated and thus DBP containing water is negligible. However, due to the requirements of the BWMC the number of installed systems and the number of BWT operations is expected to rapidly increase. It is currently unclear, which market share the different technique will attain by 2024, i.e. which part of the total ballast water discharged will actually be chemically treated comparted to water treated with physical methods only. Furthermore, it is not clear which oxidants will be used in what quantities. As worst case, scenario, one could assume that all of the 3 billion tonnes of ballast water will be chemically treated.

L:\med\LONCONOF\GESAMP\SESSIONS\44\Documents\44_7.docx
- 9 -
Identity and concentration of DBPs in ballast water 40 An overview on the disinfection by-products detected during testing for authorization of ballast water treatment systems has been analyzed by Werschkun et al. (2012b) for the 10 approved systems at the time of the analysis. Table 3: Maximum DBP concentrations observed during land-based testing of BWMS employing oxidants (adapted from Werschkun et al. (2012b))
DBP concentration [µg/L]
Tribromomethane 670 Dibromochloromethane 21 Bromodichloromethane 4.9 Trichloromethane 0.9 Chloroacetic acid 7 Dichloroacetic acid 6.4 Trichloroacetic acid 2 Dibromoacetonitrile 21.1 Bromate 70
COOLING WATERS Purpose for oxidant treatment 41 Large amounts of water are needed for cooling purposes in thermal power stations. With this water, a wide range of organisms can be entrained into cooling water systems, some of which can colonise the concrete and metal surfaces in the cooling circuits. The conditions for growth in cooling circuits can be especially favorable for sessile organisms such as mussels, barnacles and hydroids, with steady flow conditions providing an abundance of food while preventing the equivalent establishment of predatory assemblages. Such growth, termed biofouling, can be massive; it can restrict flow, partially or wholly block condensers and heat exchangers, and permit increased rates of corrosion. 42 It is commonly distinguished between two types of biofouling: macrofouling, involving organisms such as mussels, barnacles and hydroids; and microfouling, involving bacteria and fungi which produce slimes. Macrofouling gives rise to gross blockages of pipework and culverts, while the predominant effect of microfouling is the reduction of heat transfer efficiency in condensers, thus decreasing power output. The two are closely related as the formation of a biofilm is often a necessary precursor to the successful settlement of larger organisms. Furthermore, when metal becomes fouled, microbially induced corrosion can occur (Jenner et al., 1997). 43 For an optimised energy production process, i.e. good heat exchange, low corrosion and limited need for maintenance and cleaning, the degree of biofouling needs to be controlled to tolerable limits. In the majority of direct cooled coastal power stations oxidant treatment is used for this purpose, typically low-level chlorination (Jenner et al., 1997). Proprietary biocides and seasonal higher dosing to control site-specific organisms may also be required (Pacey et al., 2011). It has to be pointed out that the aim of cooling water treatment is not disinfection, i.e. killing of organisms, but the reduction of settlement and growth pressure. Therefore, the term disinfection by-products may not be appropriate. Some authors use the term chlorination by-products instead in this context. For sake of consistency, we use DBP in this paper also for products generated by cooling water treatment.

L:\med\LONCONOF\GESAMP\SESSIONS\44\Documents\44_7.docx
- 10 -
Treatment process 44 The fouling pressure and thus the need for chemical treatment depends on the site specific water quality and the climatic conditions. For example, in very particle rich estuarine water, water flow in the system may induce an abrasive effect limiting the settlement of organisms, and thus the need for disinfection. Typically biofouling is more pronounced in warm water conditions, whereas in cold winter conditions when growth pressure is lower, oxidant treatment may not be required (Pacey et al., 2011). For macrofouling, the treatment procedure must be performed during the reproduction period in order to inhibit larval settlement and during the growth period in order to limit the growth rate of settled organisms. In most of European countries cooling waters are treated for 6–9 months of a year (from spring to fall) (Khalanski and Jenner, 2012). 45 Due to its well-tried technology, its long-term worldwide industrial uses and its reasonable cost, chlorine remains the most common antifouling treatment in industrial cooling water systems (Rajagopal, 2012). Low-level chlorination has emerged over many years as the optimal balance between cost and efficacy for many power station operators (Jenner et al., 1997). Low-level chlorination involves the addition of a chlorine-produced oxidant to the cooling water stream either at, or immediately downstream within, the intake. The oxidant is either produced via electrochlorination or introduced by means of hypochlorite injection. Typically, the applied dose is 0.5- 1.5 mg/L (expressed as Cl2), with a resultant residual oxidant level of 0.1-0.2 mg/L in the cooling water flow itself, the reduction being due to the oxidant demand of the seawater. In some cases, other treatment regimens such as pulse chlorination may be used, i.e. alternation no treatment and injection of a higher dose for a limited time. In principle, by oxidant treatment both microfouling and macrofouling can be controlled on any given site. Quantification
Water use 46 The majority of thermal electricity production relies on water for cooling purposes. In this context, the water use has to be differentiated: “withdrawal” is defined as the amount of water removed from the ground or diverted from a water source for use, while “consumption” refers to the amount of water that is evaporated or otherwise removed from the immediate water environment. 47 The dissipation of heat produced during the electricity production can either be achieved via evaporation of water (closed-loop cooling circuits using cooling towers) or by heating up water (open cooling circuits or “once through” cooling). In the first case relatively small volumes of 2-4 m3/MWh are withdrawn from which a large part is evaporated. For open cooling circuits, up to 230 m3/MWh are withdrawn of which almost the entire amount is re-injected to the water body (typically with a ΔT of 10-15°C). An overview on withdrawal and consumption of water for different power plant and cooling system types is shown in Table 4. Table 4: Approximate withdrawals and consumptions, not accounting for ambient temperature or plant efficiency (from Kohli and Frenken (2011), rounded and adapted from EPRI (2002))
Plant and Cooling System Type Water
Withdrawal (m3 / MWh)
Consumption (m3 / MWh)
Fossil fuel/biomass/waste | once-through cooling
76 – 190 1
ossil fuel/biomass/waste | closed-loop cooling
2 – 2.3 2

L:\med\LONCONOF\GESAMP\SESSIONS\44\Documents\44_7.docx
- 11 -
Nuclear steam | once-through cooling
95 – 230 1.5
Nuclear steam | closed-loop cooling
3 – 4 3
48 Both water withdrawal and consumption are important parameter when assessing the impact of power production on fresh water resources. For coastal power stations using marine waters for cooling, the water consumption is not an issue. In this case, the total amount of water withdrawn will potentially be treated and thus needs to be considered for disinfection by-product inputs. 49 Once-through cooling is the technique used in the majority of coastal power stations. These systems are considered to be responsible for different environmental effects as fish and other marine organisms can be entrained in the inflow water and subsequently be killed in the circuits. The discharged heated sea water containing dead marine organisms can furthermore impede the development of natural vegetation. There is an ongoing discussion whether other techniques induced smaller environmental effect can be used notably in California (Tetra Tech, 2008). 50 The absolute amount of water withdrawn and rejected depends on many factors, such as the plant type (nuclear, coal, gas etc.) and generation capacity (MW) and local conditions and water use permits (e.g. maximum allowed ΔT). For French nuclear power stations with unit powers between 900 and 1300 MW, water flows of 46 to 60 m3/s have been reported (Jenner et al., 1998). As at coastal sites in France up to 6 reactor blocks with 950 WM are operating simultaneously, one can expect total water flows of around 300 m3/s at a single site. Coastal power stations on a global scale 51 In 2014, approximately 24 000 TWh of electricity were produced worldwide (IEA, 2016), the majority by fossil-fuel burning power plants with an increasing trend (
Figure 1). This trend mainly driven by Asia can be expected to continue, as new coal-fired power plants are currently in construction in China and India.
Figure 1: World electricity generation [TWh] from 1971 to 2014 by fuel type from (IEA, 2016) 52 In total, annual global electricity production amounts to 15 900 TWh of thermal fossil sources and 2500 TWh of nuclear energy, both relying on cooling systems for heat dissipation. 53 It is difficult to estimate the proportion of total thermal power production capacity installed on the coast using marine waters. DBP concentrations
TW
h

L:\med\LONCONOF\GESAMP\SESSIONS\44\Documents\44_7.docx
- 12 -
54 Although the chemistry of chlorine in marine waters is similar, one can expect differences in DBP as water qualities, treatment processes vary between sites. 55 The production of DBPs in cooling circuits can be driven by different factors:
1. The water quality at the site (salinity, organic compounds that may act as precursors for DBPs).
2. The treatment concentrations may influence the amount and identity of generated DPB.
3. Residence times inside the cooling water circuit typically vary between 2 and 15 min(Bruijs and Jenner, 2012) or 30 min (oral communication from EDF). The reaction times for oxidants with natural organic matter are thus considerably shorter compared to ballast water treatment.
56 Although chlorination is used all over the world, only few studies of DBP generation in cooling circuits are available. The most extensive study of DBPs in power plant cooling water was published by Jenner et al. (1997) covering 90 analysis of cooling water in 10 different coastal power stations in the UK, France and the Netherlands. Since then, some additional data on this study were presented (Taylor, 2006) and supplemental analyses were performed in the French power stations included in the above mentioned study (Allonier et al., 1999). Additionally, studies on cooling waters of a Korean and an Indian power station were published (Padhi et al., 2012; Sam Yang, 2001). An overview on selected DBPs detected in effluents of coastal nuclear power stations is presented in Table 5 and Table 6. Table 5: Overview on selected DBPs detected in power station effluents Power station Chlorine
Dosage [mg/L as Cl2]
Bromoform [µg/L]
DBAN [µg/L]
Tribromophenol [µg/L]
DBAA [µg/L]
Source
Heysham 2 (UK) 0.5-1.0 26.1 2.64 a
Dungeness (UK) 0.75-1.0 5.75 0.2 a
Wylfa (UK) 0.3-0.4 27.25 0.83 a
Bradwell (UK) 0.6-1.0 25 0.87 a
Hartlepool (UK) 0.5-1.0 3.5 <0.1 a
Sizewell A (UK) 0.6-1.0 14.5 <0.1 a
Paluel (FR) 0.37 3.1 0.1 a
0.82 9.65 1.05 a
0.2 26.8 2.83 0.14 10.19 b
Penly (FR) 0.62±0.1 13.37 NA a
0.5±0.08 15.01 NA a
0.57 7.37 0.94 0.1 7.25 b
Gravelines (FR) 0.64 6.37 NA a
0.8 18.63 NA a
0.77 26.75 3.61 0.37 9.5 b
Maasvlakte (NL) 0.8-1.5 11.54 0.83 a
0.8-1.5 8.35 0.94 a
Madras (IND) 1.0 12-41 c
Youngkwang (KOR)
1 124 d
Ringhals (SWE) 1.5 100 e
All Data (mean) 24.90 1.35 0.20 8.98
L:\med\LONCONOF\GESAMP\SESSIONS\44\Documents\44_7.docx
- 13 -
NA: not available, in order to increase readability, in some cases values were averaged and/or standard deviations omitted Data extracted from: a Jenner et al. (1997), b Allonier et al. (1999), c Padhi et al. (2012), d Sam Yang (2001), e Fogelqvist et al. (1982)
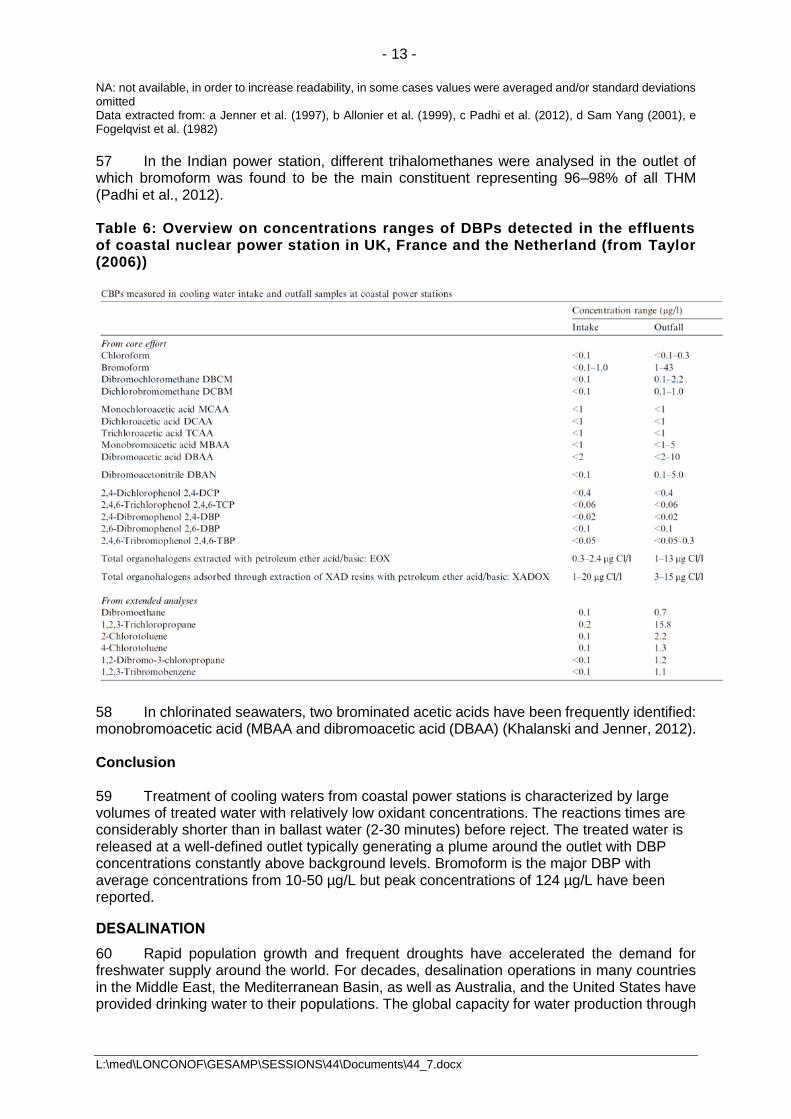
57 In the Indian power station, different trihalomethanes were analysed in the outlet of which bromoform was found to be the main constituent representing 96–98% of all THM (Padhi et al., 2012). Table 6: Overview on concentrations ranges of DBPs detected in the effluents of coastal nuclear power station in UK, France and the Netherland (from Taylor (2006))
58 In chlorinated seawaters, two brominated acetic acids have been frequently identified: monobromoacetic acid (MBAA and dibromoacetic acid (DBAA) (Khalanski and Jenner, 2012). Conclusion 59 Treatment of cooling waters from coastal power stations is characterized by large volumes of treated water with relatively low oxidant concentrations. The reactions times are considerably shorter than in ballast water (2-30 minutes) before reject. The treated water is released at a well-defined outlet typically generating a plume around the outlet with DBP concentrations constantly above background levels. Bromoform is the major DBP with average concentrations from 10-50 µg/L but peak concentrations of 124 µg/L have been reported. DESALINATION
60 Rapid population growth and frequent droughts have accelerated the demand for freshwater supply around the world. For decades, desalination operations in many countries in the Middle East, the Mediterranean Basin, as well as Australia, and the United States have provided drinking water to their populations. The global capacity for water production through
L:\med\LONCONOF\GESAMP\SESSIONS\44\Documents\44_7.docx
- 14 -
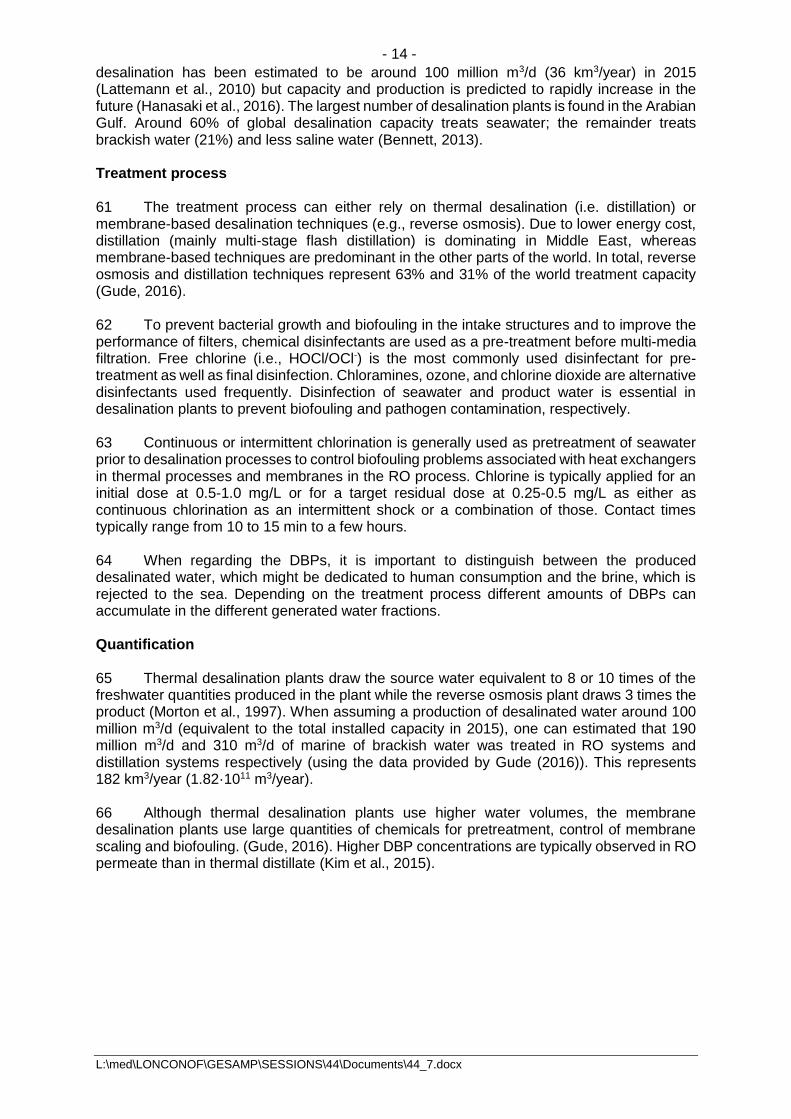
desalination has been estimated to be around 100 million m3/d (36 km3/year) in 2015 (Lattemann et al., 2010) but capacity and production is predicted to rapidly increase in the future (Hanasaki et al., 2016). The largest number of desalination plants is found in the Arabian Gulf. Around 60% of global desalination capacity treats seawater; the remainder treats brackish water (21%) and less saline water (Bennett, 2013). Treatment process 61 The treatment process can either rely on thermal desalination (i.e. distillation) or membrane-based desalination techniques (e.g., reverse osmosis). Due to lower energy cost, distillation (mainly multi-stage flash distillation) is dominating in Middle East, whereas membrane-based techniques are predominant in the other parts of the world. In total, reverse osmosis and distillation techniques represent 63% and 31% of the world treatment capacity (Gude, 2016). 62 To prevent bacterial growth and biofouling in the intake structures and to improve the performance of filters, chemical disinfectants are used as a pre-treatment before multi-media filtration. Free chlorine (i.e., HOCl/OCl-) is the most commonly used disinfectant for pre-treatment as well as final disinfection. Chloramines, ozone, and chlorine dioxide are alternative disinfectants used frequently. Disinfection of seawater and product water is essential in desalination plants to prevent biofouling and pathogen contamination, respectively. 63 Continuous or intermittent chlorination is generally used as pretreatment of seawater prior to desalination processes to control biofouling problems associated with heat exchangers in thermal processes and membranes in the RO process. Chlorine is typically applied for an initial dose at 0.5-1.0 mg/L or for a target residual dose at 0.25-0.5 mg/L as either as continuous chlorination as an intermittent shock or a combination of those. Contact times typically range from 10 to 15 min to a few hours. 64 When regarding the DBPs, it is important to distinguish between the produced desalinated water, which might be dedicated to human consumption and the brine, which is rejected to the sea. Depending on the treatment process different amounts of DBPs can accumulate in the different generated water fractions. Quantification 65 Thermal desalination plants draw the source water equivalent to 8 or 10 times of the freshwater quantities produced in the plant while the reverse osmosis plant draws 3 times the product (Morton et al., 1997). When assuming a production of desalinated water around 100 million m3/d (equivalent to the total installed capacity in 2015), one can estimated that 190 million m3/d and 310 m3/d of marine of brackish water was treated in RO systems and distillation systems respectively (using the data provided by Gude (2016)). This represents 182 km3/year (1.82·1011 m3/year). 66 Although thermal desalination plants use higher water volumes, the membrane desalination plants use large quantities of chemicals for pretreatment, control of membrane scaling and biofouling. (Gude, 2016). Higher DBP concentrations are typically observed in RO permeate than in thermal distillate (Kim et al., 2015).

L:\med\LONCONOF\GESAMP\SESSIONS\44\Documents\44_7.docx
- 15 -
Table 7: Table 8: Overview on DBP occurrences in thermal distillated and RO permeate of desalination plants (extracted from Kim et al. (2015))
67 Due to the treatment process DBP concentration substantially differ between distillates and the rejected brine. The former is most relevant when assessing risks to humans whereas the latter is determining the potential risk to the environment. Conclusion 68 The estimated total volume water used for desalination of marine and brackish water is 1.82·1011 m3/year, roughly on tenth of the volumes used for cooling purposes. Oxidant concentrations are similar to concentration used in cooling waters. The treated water is released at a well-defined outlet typically generating a plume around the outlet. Bromoform is the major DBP. OTHER APPLICATIONS USING SEA WATER DISINFECTION
Sea water toilets 69 Seawater is used for toilet flushing in different coastal areas including Hong Kong, Avalon, Marshall Islands, and Kiribati (Yang et al., 2015). According to the Water Supplies Department in Hong Kong, seawater has been supplied since the late 1950's, primarily for flushing, in the urban areas and the new towns. Nearly 80% of the population is now supplied with seawater for flushing. The extensive use of seawater has helped to reduce the demand on fresh water for flushing. During 2012, an average of 745,225 cubic meters per day of seawater was supplied for flushing purposes, conserving an equivalent amount of potable water (Water Supplies Department, Hong Kong). Seawater used to flush toilets accounts for about 22 per cent of total water use in 2008 in Hong Kong. 70 Seawater is not treated to the same standard as fresh water. The seawater is firstly screened by strainers to remove sizeable particles. It is then disinfected with chlorine or hypochlorite generated by electrochlorination before being pumped to service reservoirs and for distribution to consumers. Typical treatment concentrations are reported as 3-6 mg Cl2/L. 71 Several studies on DBPs have been performed. Ding et al. (2013) detected 54 different brominated DBPs in treated sewage water but compounds were not quantified. Also the ecotoxic effects of these treated waters were analyzed (Yang et al., 2015) to be lower than in similar treated fresh waters.
L:\med\LONCONOF\GESAMP\SESSIONS\44\Documents\44_7.docx
- 16 -
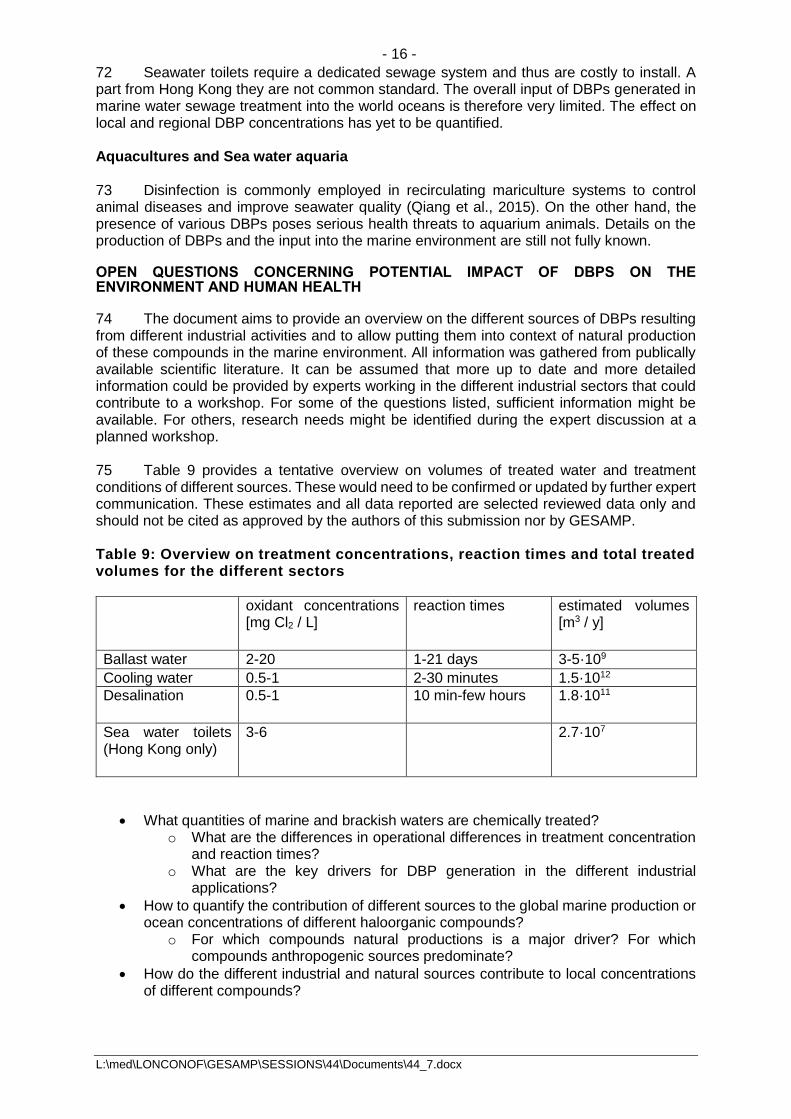
72 Seawater toilets require a dedicated sewage system and thus are costly to install. A part from Hong Kong they are not common standard. The overall input of DBPs generated in marine water sewage treatment into the world oceans is therefore very limited. The effect on local and regional DBP concentrations has yet to be quantified. Aquacultures and Sea water aquaria 73 Disinfection is commonly employed in recirculating mariculture systems to control animal diseases and improve seawater quality (Qiang et al., 2015). On the other hand, the presence of various DBPs poses serious health threats to aquarium animals. Details on the production of DBPs and the input into the marine environment are still not fully known. OPEN QUESTIONS CONCERNING POTENTIAL IMPACT OF DBPS ON THE ENVIRONMENT AND HUMAN HEALTH 74 The document aims to provide an overview on the different sources of DBPs resulting from different industrial activities and to allow putting them into context of natural production of these compounds in the marine environment. All information was gathered from publically available scientific literature. It can be assumed that more up to date and more detailed information could be provided by experts working in the different industrial sectors that could contribute to a workshop. For some of the questions listed, sufficient information might be available. For others, research needs might be identified during the expert discussion at a planned workshop. 75 Table 9 provides a tentative overview on volumes of treated water and treatment conditions of different sources. These would need to be confirmed or updated by further expert communication. These estimates and all data reported are selected reviewed data only and should not be cited as approved by the authors of this submission nor by GESAMP. Table 9: Overview on treatment concentrations, reaction times and total treated volumes for the different sectors
oxidant concentrations [mg Cl2 / L]
reaction times estimated volumes [m3 / y]
Ballast water 2-20 1-21 days 3-5·109
Cooling water 0.5-1 2-30 minutes 1.5·1012
Desalination 0.5-1 10 min-few hours 1.8·1011
Sea water toilets (Hong Kong only)
3-6 2.7·107
What quantities of marine and brackish waters are chemically treated? o What are the differences in operational differences in treatment concentration
and reaction times? o What are the key drivers for DBP generation in the different industrial
applications?
How to quantify the contribution of different sources to the global marine production or ocean concentrations of different haloorganic compounds?
o For which compounds natural productions is a major driver? For which compounds anthropogenic sources predominate?
How do the different industrial and natural sources contribute to local concentrations of different compounds?
L:\med\LONCONOF\GESAMP\SESSIONS\44\Documents\44_7.docx
- 17 -
o What are peak concentrations obtained in local natural or industrial areas (kelp beds, habours, power station outlets, desalination plant outlets)?
o Contribution of ballast water to the already existing overall human DBP exposure?
What effects to the environment induced by DBPs can be anticipated? o How do local concentrations compare to ecotoxicological reference values?
What species might be impaired?
Contribution of ballast water to the overall human DBP exposure and risk for human health?
o How does exposure of marine professionals compare to professional exposure in other sectors (pool attendants, workers in chemical industry, energy business, water suppliers)?
o How much does the exposure of the general public by ballast water treatment (e.g. swimming in habour water) contribute to the overall exposure (e.g. via drinking water, swimming pools etc.)?
Is there a need for establishing environmental quality standards concerning the introduction of these chemicals into the marine environment?
76 In order to tackle the questions sketched above, the knowledge and inputs of experts working in different scientific disciplines and of different environmental sectors are needed. For this interdisciplinary question, we propose to organize a workshop where different experts can contribute and these open questions can be discussed. This is a topic of interest for a number of UN agencies working on natural "contaminants", energy producers (power stations at the coast, in particular nuclear sites), desalination (for drinking water and irrigation), and ballast water treatment. Given this background, GESAMP would be the excellent body to evaluate the risk for the marine environment. 77 Looking at the published data and the number of studies available, one GESAMP workshop could be enough to summarize and discuss the data. Based on such a workshop a report would be possible with a scientific assessment of the potential risks to the marine environment and proposals for additional marine environmental protection if needed. We do not expect a long-running project, but would like to propose one GESAMP workshop on the issue with a GESAMP report resulting from that workshop. This would not need a new working group with more than one meeting and could be finalized in early 2019. 78 Concerning the budget for this activity, some funding has been allocated. The German Federal Institute for Risk Assessment offered to host a GESAMP workshop in Berlin, Germany in 2019. REFERENCES
Allonier, A.-S., Khalanski, M., Camel, V., Bermond, A., 1999. Characterization of Chlorination By-products in Cooling Effluents of Coastal Nuclear Power Stations. Mar. Pollut. Bull. 38, 1232-1241.
Bennett, A., 2013. 50th Anniversary: Desalination: 50 years of progress. Filtration + Separation 50, 32-39.
Bichsel, Y., Von Gunten, U., 2000. Formation of iodo-trihalomethanes during disinfection and oxidation of iodide-containing waters.
Booth, R.A., Lester, J.N., 1995. The potential formation of halogenated by-products during peracetic acid treatment of final sewage effluent. Water Res. 29, 1793-1801.
Bruijs, M.C.M., Jenner, H.A., 2012. Cooling Water System Design in Relation to Fouling Pressure, in: Rajagopa, S., Jenner, H.A., Venugopalan, V.P. (Eds.), Operational and Environmental Consequences of Large Industrial Cooling Water Systems. Springer, New York, pp. 45-63.
Butler, J.H., King, D.B., Lobert, J.M., Montzka, S.A., Yvon-Lewis, S.A., Hall, B.D., Warwick, N.J., Mondeel, D.J., Aydin, M., Elkins, J.W., 2007. Oceanic distributions and emissions of short-lived halocarbons. Global Biogeochemical Cycles 21, GB1023.

L:\med\LONCONOF\GESAMP\SESSIONS\44\Documents\44_7.docx
- 18 -
Carpenter, L.J., Jones, C.E., Dunk, R.M., Hornsby, K.E., Woeltjen, J., 2009. Air-sea fluxes of biogenic bromine from the tropical and North Atlantic Ocean. Atmospheric Chemistry and Physics 9, 1805-1816.
Carpenter, L.J., Liss, P.S., 2000. On temperate sources of bromoform and other reactive organic bromine gases. Journal of Geophysical Research: Atmospheres 105, 20539-20547.
Criquet, J., Allard, S., Salhi, E., Joll, C.A., Heitz, A., von Gunten, U., 2012. Iodate and iodo-trihalomethane formation during chlorination of iodide-containing waters: role of bromide. Environ. Sci. Technol. 46, 7350-7357.
David, M., 2015. Vessels and Ballast Water, in: David, M., Gollasch, S. (Eds.), Global Maritime Transport and Ballast Water Management - Issues and Solutions. Springer, p. 13.
Ding, G., Zhang, X., Yang, M., Pan, Y., 2013. Formation of new brominated disinfection byproducts during chlorination of saline sewage effluents. Water research 47, 2710-2718.
EPRI, 2002. Comparison of Alternate Cooling Technologies for California Power Plants - Economic, Environmental and Other Tradeoffs.
Fabbricino, M., Korshin, G.V., 2005. Formation of disinfection by-products and applicability of differential absorbance spectroscopy to monitor halogenation in chlorinated coastal and deep ocean seawater. Desalination 176, 57-69.
Fogelqvist, E., Josefsson, B., Roos, C., 1982. Halocarbons as tracer substances in studies of the distribution patterns of chlorinated waters in coastal areas. Environ. Sci. Technol. 16, 479-482.
Fogelqvist, E., Krysell, M., 1991. Naturally and anthropogenically produced bromoform in the Kattegatt, a semi-enclosed oceanic basin. Journal of Atmospheric Chemistry 13, 315-324.
Gribble, G.W., 2010. Naturally Occurring Organohalogen Compounds – A Comprehensive Update. Springer.
Gude, V.G., 2016. Desalination and sustainability - An appraisal and current perspective. Water research 89, 87-106.
Hanasaki, N., Yoshikawa, S., Kakinuma, K., Kanae, S., 2016. A seawater desalination scheme for global hydrological models. Hydrology and Earth System Sciences 20, 4143-4157.
Heeb, M.B., Criquet, J., Zimmermann-Steffens, S.G., von Gunten, U., 2014. Oxidative treatment of bromide-containing waters: formation of bromine and its reactions with inorganic and organic compounds--a critical review. Water research 48, 15-42.
Hoigné, J., Bader, H., 1994. Kinetics of reactions of chlorine dioxide (OClO) in water—I. Rate constants for inorganic and organic compounds. Water Res. 28, 45-55.
IEA, 2016. Key world energy statistics. Jenner, H.A., Taylor, C.J.L., van Donk, M., Khalanski, M., 1997. Chlorination by-products in
chlorinated cooling water of some European coastal power stations. Marine Environmental Research 43, 279-293.
Jenner, H.A., Whitehouse, J.W., Taylor, C.J., Khalanski, M., 1998. Cooling water management in European power stations - Biology and control of fouling. Hydroécologie Appiquée 10.
Jung, Y., Hong, E., Yoon, Y., Kwon, M., Kang, J.-W., 2014. Formation of Bromate and Chlorate during Ozonation and Electrolysis in Seawater for Ballast Water Treatment. Ozone: Science & Engineering 36, 515-525.
Khalanski, M., Jenner, H.A., 2012. Chlorination Chemistry and Ecotoxicology of the Marine Cooling Water Systems, in: Rajagopa, S., Jenner, H.A., Venugopalan, V.P. (Eds.), Operational and Environmental Consequences of Large Industrial Cooling Water Systems. Springer, New York, pp. 183-226.
Kim, D., Amy, G.L., Karanfil, T., 2015. Disinfection by-product formation during seawater desalination: A review. Water research 81, 343-355.
Kohli, A., Frenken, K., 2011. Cooling water for energy generation and its impact on national-level water statistics, FAO Aquastat Report. FAO.
Lattemann, S., Kennedy, M.D., Schippers, J.C., Amy, G., 2010. Chapter 2 Global Desalination Situation. 2, 7-39.

L:\med\LONCONOF\GESAMP\SESSIONS\44\Documents\44_7.docx
- 19 -
Liu, Y., Yvon-Lewis, S.A., Hu, L., Salisbury, J.E., O'Hern, J.E., 2011. CHBr3, CH2Br2, and CHClBr2in U.S. coastal waters during the Gulf of Mexico and East Coast Carbon cruise. Journal of Geophysical Research 116.
Macalady, D.L., Carpenter, J.H., Moore, C.A., 1977. Sunlight-induced bromate formation in chlorinated seawater. Science 195, 1335-1337.
Morton, A.J., Callister, I.K., Wade, N.M., 1997. Environmental impacts of seawater distillation and reverse osmosis processes. Desalination 108, 1-10.
Nightingale, P.D., Malin, G., Liss, P.S., 1995. Production of chloroform and other low molecular-weight halocarbons by some species of macroalgae. Limnol. Oceanogr. 40, 680-689.
Pacey, N., Beadle, I., Heaton, A., Newsome, L., 2011. Chemical discharges from nuclear power stations: historical releases and implications for Best Available Techniques - Report – SC090012/R1. Environment Agency, Bristol.
Padhi, R.K., Subramanian, s., Mohanty, A.K., Bramha, N., Prasad, M.V.R., Satpathy, K.K., 2012. Trihalomethanes in the Cooling Discharge of a Power Plant on Chlorination of Intake Seawater. Environmental Engineering Research 17, S57-S62.
Qiang, Z., Zhang, H., Dong, H., Adams, C., Luan, G., Wang, L., 2015. Formation of disinfection byproducts in a recirculating mariculture system: emerging concerns. Environ Sci Process Impacts 17, 471-477.
Quack, B., Wallace, D.W.R., 2003. Air-sea flux of bromoform: Controls, rates, and implications. Global Biogeochemical Cycles 17.
Rajagopal, S., 2012. Chlorination and Biofouling Control in Industrial Cooling Water Systems, in: Rajagopa, S., Jenner, H.A., Venugopalan, V.P. (Eds.), Operational and Environmental Consequences of Large Industrial Cooling Water Systems. Springer, New York, pp. 163-182.
Rook, J.J., 1974. Fromation of haloforms during chlorination of natural waters. J Water Treatment Examination 23, 234-243.
Sam Yang, J., 2001. Bromoform in the effluents of a nuclear power plant: a potential tracer of coastal water masses. Hydrobiologia 464, 99-105.
Shah, A.D., Liu, Z.Q., Salhi, E., Hofer, T., von Gunten, U., 2015. Peracetic acid oxidation of saline waters in the absence and presence of H (2)O (2): secondary oxidant and disinfection byproduct formation. Environ. Sci. Technol. 49, 1698-1705.
Taylor, C.J., 2006. The effects of biological fouling control at coastal and estuarine power stations. Marine pollution bulletin 53, 30-48.
Tetra Tech, 2008. California’s Coastal Power Plants: Alternative Cooling System Analysis. von Gunten, U., 2003. Ozonation of drinking water: Part II. Disinfection and by-product
formation in presence of bromide, iodide or chlorine. Water Res. 37, 1469-1487. von Gunten, U., Hoigné, J., 1994. Bromate Formation during Ozonation of Bromide-
Containing Waters: Interaction of Ozone and Hydroxyl Radical Reactions. Environ. Sci. Technol. 28, 1434-1242.
von Gunten, U., von Sonntag, C., 2012. Chemistry of Ozone in Water and Wastewater Treatment: From Basic Principles to Applications. IWA Publishing, London.
Werschkun, B., Banerji, S., Basurko, O.C., David, M., Fuhr, F., Gollasch, S., Grummt, T., Haarich, M., Jha, A.N., Kacan, S., Kehrer, A., Linders, J., Mesbahi, E., Pughiuc, D., Richardson, S.D., Schwarz-Schulz, B., Shah, A., Theobald, N., von Gunten, U., Wieck, S., Hofer, T., 2014. Emerging risks from ballast water treatment: the run-up to the International Ballast Water Management Convention. Chemosphere 112, 256-266.
Werschkun, B., Höfer, T., Greiner, M., 2012a. Emerging Risks from Ballast Water Treatment. BfR-Wissenschaft 08/2012, Berlin.
Werschkun, B., Sommer, Y., Banerji, S., 2012b. Disinfection by-products in ballast water treatment: an evaluation of regulatory data. Water research 46, 4884-4901.
Yang, M., Liu, J., Zhang, X., Richardson, S.D., 2015. Comparative Toxicity of Chlorinated Saline and Freshwater Wastewater Effluents to Marine Organisms. Environ. Sci. Technol. 49, 14475-14483.
Yokouchi, Y., Hasebe, F., Fujiwara, M., Takashima, H., Shiotani, M., Nishi, N., Kanaya, Y., Hashimoto, S., Fraser, P., Toom-Sauntry, D., Mukai, H., Nojiri, Y., 2005. Correlations
L:\med\LONCONOF\GESAMP\SESSIONS\44\Documents\44_7.docx
- 20 -
and emission ratios among bromoform, dibromochloromethane, and dibromomethane in the atmosphere. Journal of Geophysical Research 110.
Ziska, F., Quack, B., Abrahamsson, K., Archer, S.D., Atlas, E., Bell, T., Butler, J.H., Carpenter, L.J., Jones, C.E., Harris, N.R.P., Hepach, H., Heumann, K.G., Hughes, C., Kuss, J., Krüger, K., Liss, P., Moore, R.M., Orlikowska, A., Raimund, S., Reeves, C.E., Reifenhäuser, W., Robinson, A.D., Schall, C., Tanhua, T., Tegtmeier, S., Turner, S., Wang, L., Wallace, D., Williams, J., Yamamoto, H., Yvon-Lewis, S., Yokouchi, Y., 2013. Global sea-to-air flux climatology for bromoform, dibromomethane and methyl iodide. Atmospheric Chemistry and Physics 13, 8915-8934.
___________