scope and sequence for - brownsville independent school ......
TRANSCRIPT

Scope and Sequence for
Algebra II
2003-2004 2004-2005
107

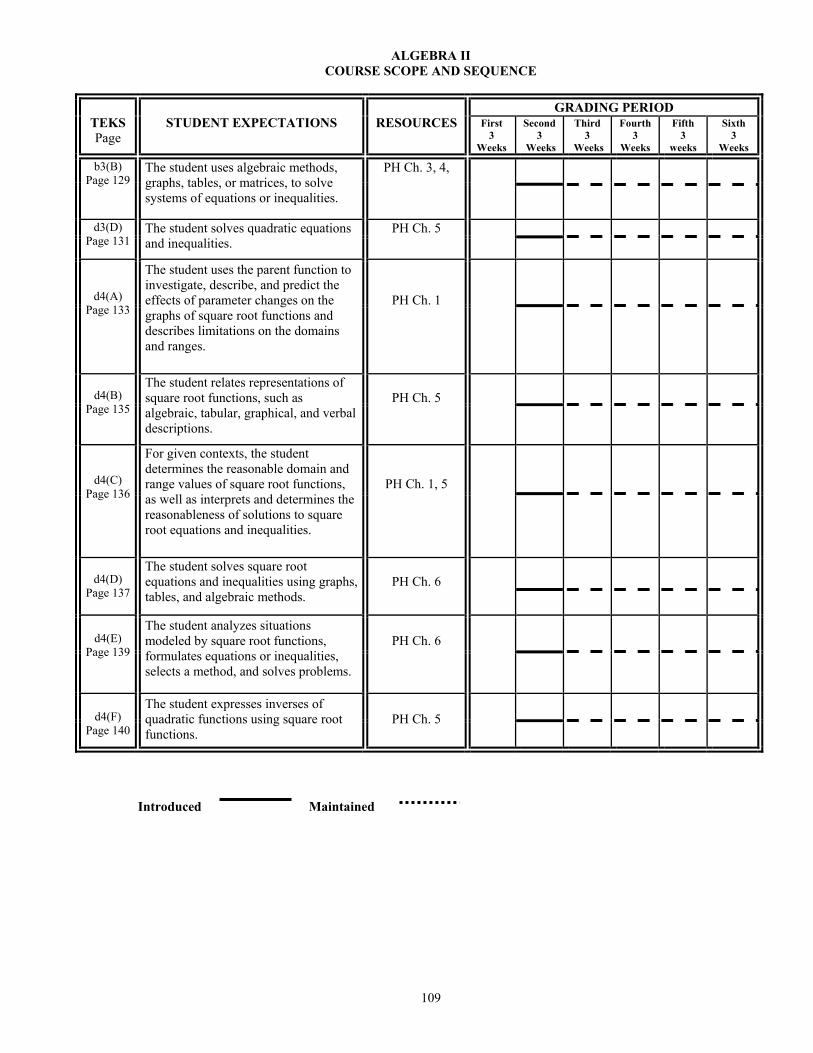
ALGEBRA II COURSE SCOPE AND SEQUENCE
GRADING PERIOD
TEKS Page
STUDENT EXPECTATIONS
RESOURCES First
3 Weeks
Second 3
Weeks
Third 3
Weeks
Fourth 3
Weeks
Fifth 3
weeks
Sixth 3
Weeks
b1(A)
Page 115
For a variety of situations, the student identifies the mathematical domains and ranges and determines reasonable domain and range values for given situations.
PH Ch. 1
SS, Activity 1
b1(B) Page 117
In solving problems, the student collects data and records results, organizes the data, makes scatterplots, fits the curves to the appropriate parent function, interprets the results, and proceeds to model, predict, and make decisions and critical judgments.
PH Ch. 1, 2 SS, Activity 3
b2(A)
Page 119
The student uses tools including matrices, factoring, and properties of exponents to simplify expressions and transforms and solve equations.
PH Ch. 3, 5
b2(C) Page 121
The student connects the function notation of y = and f(x) =.
PH Ch. 1, 5
b3(A)
Page 122
The student analyzes situations and formulates systems of equations or inequalities in two or more unknowns to solve problems.
PH Ch. 2, 4
RWM, Activity 4
b3(C) Page 123
For given contexts, the student interprets and determines the reasonableness of solutions to systems of equations or inequalities.
PH Ch. 4
c1(A) Page 124
The student identifies and sketches graphs of parent functions, including linear (y = x), quadratic (y = x²), square root (y = √x), exponential (y = ax).
PH Ch. 1
c1(B) Page 126
The student extends parent functions with parameters such as m in y = mx and describes parameter changes on the graph of parent functions.
PH Ch. 1
Introduced
Maintained
Resource Key PH – Prentice Hall SS – Sensor Sensibility RWM – Real World Math with CBL TXTM- texteams Algebra II
108
ALGEBRA II COURSE SCOPE AND SEQUENCE
GRADING PERIOD
TEKS Page
STUDENT EXPECTATIONS
RESOURCES First
3 Weeks
Second 3
Weeks
Third 3
Weeks
Fourth 3
Weeks
Fifth 3
weeks
Sixth 3
Weeks
b3(B) Page 129
The student uses algebraic methods, graphs, tables, or matrices, to solve systems of equations or inequalities.
PH Ch. 3, 4,
d3(D) Page 131
The student solves quadratic equations and inequalities.
PH Ch. 5
d4(A) Page 133
The student uses the parent function to investigate, describe, and predict the effects of parameter changes on the graphs of square root functions and describes limitations on the domains and ranges.
PH Ch. 1
d4(B)
Page 135
The student relates representations of square root functions, such as algebraic, tabular, graphical, and verbal descriptions.
PH Ch. 5
d4(C) Page 136
For given contexts, the student determines the reasonable domain and range values of square root functions, as well as interprets and determines the reasonableness of solutions to square root equations and inequalities.
PH Ch. 1, 5
d4(D)
Page 137
The student solves square root equations and inequalities using graphs, tables, and algebraic methods.
PH Ch. 6
d4(E)
Page 139
The student analyzes situations modeled by square root functions, formulates equations or inequalities, selects a method, and solves problems.
PH Ch. 6
d4(F)
Page 140
The student expresses inverses of quadratic functions using square root functions.
PH Ch. 5
Introduced
Maintained
109

ALGEBRA II COURSE SCOPE AND SEQUENCE
GRADING PERIOD
TEKS Page
STUDENT EXPECTATIONS
RESOURCES First
3 Weeks
Second 3
Weeks
Third 3
Weeks
Fourth 3
Weeks
Fifth 3
Weeks
Sixth 3
Weeks
b2(B)
Page 142
The student uses complex numbers to describe the solutions of quadratic equations.
PH Ch. 5
c1C Page 144
The student recognizes inverse relationships between various functions.
PH Ch. 5, 6, 7
d1(A) Page 145
For given contexts, the student determines the reasonable domain and range values of quadratic functions, as well as interprets and determines the reasonableness of solutions to quadratic equations and inequalities.
PH Ch. 5
d1(B)
Page 147
The student relates representations of quadratic functions, such as algebraic, tabular, graphical, and verbal descriptions.
PH Ch. 5
RWM, Activity 9
d1C Page 147
The student determines a quadratic function from its roots or a graph.
PH Ch. 5 SS, Activity 6
d2(A)
Page 148
The student uses characteristics of the quadratic parent function to sketch the related graphs and connects between the y = ax² + bx + c and the y = a(x – h)² + k symbolic representations of quadratic functions.
PH Ch. 5
d2(B) Page 149
The student uses the parent function to investigate, describe, and predict the effects of changes in a, h, and k on the graphs of y = a(x – h)² + k form of a function in applies and purely mathematical situations.
PH Ch. 5
d3(A)
Page 150
The student analyzes situations involving quadratic functions and formulates quadratic equations or inequalities to solve problems.
PH Ch. 5
d3(B)
Page 151
The solution analyzes and interprets the solutions of quadratic equations using discriminants and solves quadratic equations using the quadratic formula.
PH Ch. 5
Introduced
Maintained
110

ALGEBRA II COURSE SCOPE AND SEQUENCE
Introduced
Maintained
GRADING PERIOD TEKS Page
STUDENT EXPECTATIONS
RESOURCES First
3 Weeks
Second 3
Weeks
Third 3
Weeks
Fourth 3
Weeks
Fifth 3
Weeks
Sixth 3
Weeks
d3(C)
Page 153
The student compares and translates between algebraic and graphical solutions of quadratic equations.
PH Ch. 5
e(1)
Page 154
The student uses quotients to describe the graphs of rational functions, describes limitations on the domains and ranges, and examines asymptotic behavior.
PH Ch. 8
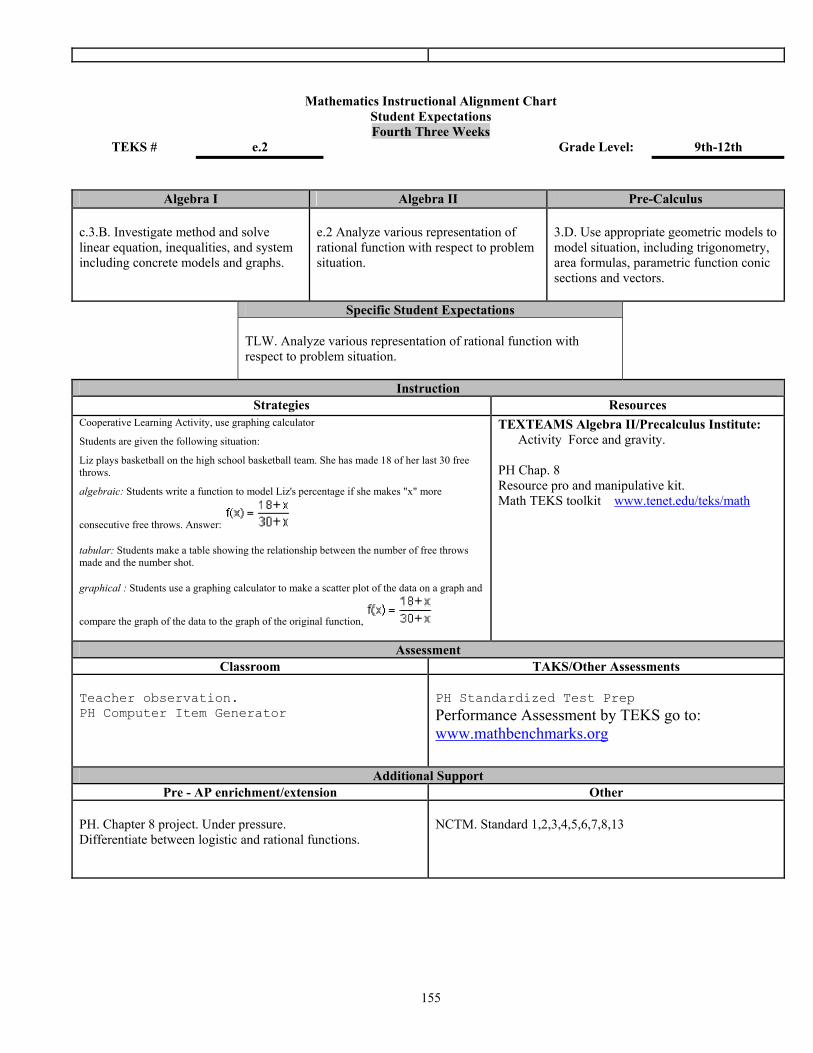
e(2) Page 155
The student analyzes various representations of rational functions with respect to problem situations.
PH Ch. 8
e(3) Page 156
For given contexts, the student determines the reasonable domain and range values of rational functions, as well as interpret and determines the reasonableness of solutions to rational equations and inequalities.
PH Ch. 8
e(4)
Page 157
The student solves rational equations and inequalities using graphs, tables, and algebraic methods.
PH Ch. 8
e(5) Page 159
The student analyzes a situation modeled by a rational function, formulates an equation or inequality composed of a linear quadratic function, and solves the problem.
PH Ch. 8
e(6)
Page 160
The student uses direct and inverse variation functions as models to make predictions in problem situations.
PH Ch. 2, 8
111

ALGEBRA II COURSE SCOPE AND SEQUENCE
Introduced
Maintained
GRADING PERIOD TEKS Page
STUDENT EXPECTATIONS
RESOURCES First
3 Weeks
Second 3
Weeks
Third 3
Weeks
Fourth 3
Weeks
Fifth 3
weeks
Sixth 3
Weeks c2(A)
Page 162 The student describes a conic section as the intersection of a plane and a cone.
PH Ch. 10
c2(B)
Page 163
In order to sketch graphs of conic sections, the student relates simple parameter changes in the equation to corresponding changes in the graph.
PH Ch. 10
c2(C) Page 164
The student identifies symmetries from graphs of conic sections.
PH Ch. 10
c2(D)
Page 165 The student identifies the conic section from a given equation.
PH Ch. 10 c2(E)
Page 166 The student uses the method of completing the square.
PH Ch. 5, 10
112

ALGEBRA II COURSE SCOPE AND SEQUENCE
GRADING PERIOD
TEKS Page
STUDENT EXPECTATIONS
RESOURCES First
3 Weeks
Second 3
Weeks
Third 3
Weeks
Fourth 3
Weeks
Fifth 3
weeks
Sixth 3
Weeks
c1(A)
Page 168
The student identifies and sketches graphs of parent functions, including inverse (y = 1/x), exponential (y = ax), and logarithmic ( y = logax) functions.
PH Ch. 7, 10
f(1)
Page 170
The student develops the definition of logarithms by exploring and describing the relationships between exponential functions and their inverses.
PH Ch. 7
RWM Activity
f(2) Page 172
The student uses the parent functions to investigate, describe, and predict the effects of parameter changes on the graphs of exponential and logarithmic functions, describes limitations on the domains and ranges, and examines asymptotic behavior.
PH Ch. 7
f(3) Page 174
For given contexts, the student determines the reasonable domain and range values of exponential and logarithmic functions, as well as interprets and determines the reasonableness of solutions to exponential and logarithmic equations and inequalities.
PH Ch. 7
f(4)
Page 175
The student solves exponential and logarithmic equations and inequalities using graphs, tables, and algebraic methods.
PH Ch. 7
f(5)
Page 176
The student analyzes a situation modeled by an exponential function, formulates an equation or inequality, and solves the problem.
PH Ch. 7
Introduced
Maintained
113

ALGEBRA II COURSE SCOPE AND SEQUENCE
GRADING PERIOD
TEKS Page
STUDENT EXPECTATIONS
RESOURCES First
3 Weeks
Second 3
Weeks
Third 3
Weeks
Fourth 3
Weeks
Fifth 3
weeks
Sixth 3
Weeks
b1(A)
Page 115
For a variety of situations, the student identifies the mathematical domains and ranges and determines reasonable domain and range values for given situations.
PH Ch. 1
SS, Activity 1
b1(B) Page 117
In solving problems, the student collects data and records results, organizes the data, makes scatterplots, fits the curves to the appropriate parent function, interprets the results, and proceeds to model, predict, and make decisions and critical judgments.
PH Ch. 1, 2 SS, Activity 3
b2(A)
Page 119
The student uses tools including matrices, factoring, and properties of exponents to simplify expressions and transforms and solve equations.
PH Ch. 3, 5
b2(C) Page 121
The student connects the function notation of y = and f(x) =.
PH Ch. 1, 5
b3(A)
Page 122
The student analyzes situations and formulates systems of equations or inequalities in two or more unknowns to solve problems.
PH Ch. 2, 4
RWM, Activity 4
b3(C) Page 123
For given contexts, the student interprets and determines the reasonableness of solutions to systems of equations or inequalities.
PH Ch. 4
c1(A) Page 124
The student identifies and sketches graphs of parent functions, including linear (y = x), quadratic (y = x²), square root (y = √x), exponential (y = ax).
PH Ch. 1
c1(B) Page 126
The student extends parent functions with parameters such as m in y = mx and describes parameter changes on the graph of parent functions.
PH Ch. 1
Introduced
Maintained
Resource Key PH – Prentice Hall SS – Sensor Sensibility RWM – Real World Math with CBL TXTM- texteams Algebra II
114

Mathematics Instructional Alignment Chart
Student Expectations First Three Weeks
TEKS # b.1.A Grade Level: 9th-12th
Algebra I Algebra II Pre-calculus b.1.A, b.2.B The student describes independent and dependent quantities in functional relationships.
b.1.A For a variety of situations, the student identifies the mathematical domains and ranges and determines reasonable domain and range values for given situations.
3.A., 3.C. Use functions and their properties to model, analyze, solve problems and make predictions.
Specific Student Expectations
TLW identify the mathematical domains and ranges and determines reasonable domain and range values for given situations.
Instruction Strategies Resources
Cooperative learning activity. A sample of an activity can be found on the next page.
TEXTEAMS Algebra II/Precalculus Institute: Applying Transformations: Applications PH chapter 1, 2, 3 Resource pro and manipulative kit toolkit www.tenet.edu/teks/math
Assessment Classroom TAKS/Other Assessments
Teacher observation. PH Computer Item Generator
TAKS Objective one PH Standardized Test Prep Performance Assessment by TEKS go to: www.mathbenchmarks.org
Additional Support Pre - AP enrichment/extension Other
PH Chapter One Project
Find domain and range of rational and radical functions
NCTM 5, 6, 7, 8, 9, 13
115

b.1.A For a variety of situations, the student identifies the mathematical domains and ranges and determines reasonable domain and range values for given situations. Students describe the domain and range for the following example:
The diagram shows a door and its position as it swings from closed to open. The width of the door is 120 cm. The distance WC is 150 cm.
The distance d can be regarded as a function of the angle POW. Students state the domain and range of this function and describe values for each that would make sense.
(verbal description) (mathematical description)
Domain: the angle POW can go from 0° (when the door is closed) to 180° (when the door is all the way open against the wall).
Domain: {a: 0° a 180°}
Range: the distance d can go from 0 cm (when the door is closed) to 240 cm (when the door is all the way open).
Range: {d: 0 cm d 240 cm}
The distance s can be regarded as a function of the angle POW. Students state the domain and range of this function and describe values for each that would make sense.
(verbal description) (mathematical description)
Domain: the angle POW can go from 0°(when the door is closed) to 180° (when the door is all the way open against the wall).
Domain: {a: 0° a 180°}
Range: the distance s can go from 150 cm (when the door is closed) to 390 cm (when the door is all the way open).
Range: {s: 150 cm s 390 cm}
116

Mathematics Instructional Alignment Chart
Student Expectations First Three Weeks
TEKS # b.1.B Grade Level: 9th-12th
Algebra I Algebra II Pre-calculus b 1 B, b 1 E. The student gathers and records data or uses data sets, to determine functional (systematic) relationships between quantities.
b.1.B In solving problems, the student collects data and records results, organizes the data, makes scatter plots, fits the curves to the appropriate parent function, interprets the results, and proceeds to model, predict, and make decisions and critical judgments
1 B, 1C, 1D, 1E. Connect symbolic representations and graphs of functions using characteristics of functions including domain and range, significant points, continuity, end behavior, vertical and horizontal asymptotes, limits and symmetry.
Specific Student Expectations
TLW collect and record data in table form.
Instruction Strategies Resources
Cooperative Learning. Use graphing calculator to plot data. A sample of an activity can be found on the next page.
TEXTEAMS Algebra II/Precalculus Institute: Airlines Ball Drop PH Chap. 1, 2, 3, 11 Resource pro and manipulative kit toolkit www.tenet.edu/teks/math
Assessment Classroom TAKS/Other Assessments
Teacher observation PH Computer Item Generator
TAKS Objective one PH Standardized Test Prep Performance Assessment by TEKS go to: www.mathbenchmarks.org
Additional Support Pre - AP enrichment/extension Other
Students will collect data, make scatter plots, and recognize the parent functions to the curves.
NCTM 5, 6, 7, 8, 9, 13
117

b.1.B In solving problems, the student collects data and records results, organizes the data, makes scatter plots, fits the curves to the appropriate parent function, interprets the results, and proceeds to model, predict, and make decisions and critical judgments.
Students make pendulums by tying a small weight to one end of a 36-inch string. To measure the period of the pendulum, students hold the other end of the string, extend the string, raise the weight, and release.
Students record the time necessary for 10 complete swings back and forth, then divide by ten to obtain the period (the time necessary to complete one swing). Students repeat this process using 6 to 8 different lengths and record the results in a table. For example,
string length period
Students make a scatter plot and determine the curve of best fit.
Students use their findings to predict the period of the pendulum for any given string length. Then they make the pendulum to test their prediction.
Note: These data generally produce an exponential curve.
118

Mathematics Instructional Alignment Chart
Student Expectations First Three Weeks
TEKS # b.2.A Grade Level: 9th-12th
Algebra I Algebra II Pre-Calculus b.4.A Find specific function value, simplify polynomials, transform equations and factor as necessary.
b.2.A Uses tools including matrices, factoring, and properties of exponents to simplify expressions and transforms and solve equations
2B. Use operation on function including function compositions.
Specific Student Expectations
TLW use tools including matrices, factoring, and properties of exponents to simplify expressions and transforms and solve equations
Instruction Strategies Resources
Cooperative Learning Activity Use manipulative Use graphing calculator A sample of an activity can be found on the next page.
PH Chap. 3, 5 Resource pro and manipulative kit toolkit www.tenet.edu/teks/math
Assessment Classroom TAKS/Other Assessments
Teacher observation. PH Computer Item Generator
TAKS Objective Two PH Standardized Test Prep Performance Assessment by TEKS go to: www.mathbenchmarks.org
Additional Support Pre - AP enrichment/extension Other
PH. Chapter 3 Project- Munching Microbes.
Solve system of equations in quadratic form and system of linear equations with 3 variables.
NCTM 5, 6, 13
119

b.2.A Uses tools including matrices, factoring, and properties of exponents to simplify expressions and transforms and solve equations.
Students use matrices to transform and solve equations.
To predict fuel usage for new delivery routes, Express Delivery conducted a study of the fuel usage of one typical truck. Use the information shown in the table below to find the rates of fuel usage for rush hour driving, city street driving, and freeway driving.
Hours of Rush Hour Driving
Hours of City Street Driving
Hours of Freeway Driving
Total Fuel Used (gallons)
Week 1 2 9 3 15
Week 2 7 8 3 24
Week 3 6 18 6 34
Students create a system of equations to represent the problem situation.
2x + 9y + 3z = 15 7x + 8y + 3z = 24
6x + 18y + 6z = 34
Students use a matrix equation to solve the system.
Let matrix A =
Let matrix C =
A • x = C
A -1 • A • x = A -1 • C
x = A -1 • C
x =
The truck uses 2 gallons of fuel per hour during rush hour driving, 1 gallon per hour for city street driving, and 2/3 gallon per hour for freeway driving.
120

Mathematics Instructional Alignment Chart Student Expectations
First Three Weeks
TEKS # b.2.C Grade Level: 9th-12th
Algebra I Algebra II Pre-Calculus b.2.A. Identify and sketch parent function y = X and y = X 2 .
b.2.C. The students connects the function notation of y = and f ( x ) =.
2.A. Apply basic transformation to parent function.
Specific Student Expectations
TLW. Connects the function notation of y = and f ( x ) =.
Instruction Strategies Resources
Cooperative Learning Activity Use manipulative Use graphing calculator Students recognize that functions can be denoted in many forms: y = , d = , y1 = , f(x) = . Only the form f(x) allows us to see both input and output values. Students choose what form they need to fit the problem: for example, at a rate of 25 miles per hour, distance is a function of time; d = 25t. A student could enter this in a graphing calculator as y1 = 25x. Or if a student wants to focus on several specific times, f(t) = 25t might be a better choice.
TEXTEAMS Algebra II/Precalculus Institute: Transformations with Technology PH Chap. 1, 5 Resource pro and manipulative kit toolkit www.tenet.edu/teks/math
Assessment Classroom TAKS/Other Assessments
Teacher observation. PH Computer Item Generator
TAKS Objective one PH Standardized Test Prep Performance Assessment by TEKS go to: www.mathbenchmarks.org
Additional Support Pre - AP enrichment/extension Other
Students will find f ( c ), g ( x ). Students will recognize f (X) = c as a point. ( X , C )
NCTM 5, 6, 7, 8, 9, 13
121

Mathematics Instructional Alignment Chart
Student Expectations First Three Weeks
TEKS # b.3.A Grade Level: 9th-12th
Algebra I Algebra II Pre-calculus b 1 C. The student describes functional relationships for given problem situations and writes equations or inequalities to answer questions arising from the situations.
b.3.A The student analyzes situations and formulates systems of equations or inequalities in two or more unknowns to solve problems.
3A. Use function and their properties to model, analyze, solve problems, and make predictions.
Specific Student Expectations
TLW write and solve an equation/inequality given a real-world situation.
Instruction Strategies Resources
Uses charts, tables, graphs manipulative and calculators to discuss patterns, relationships, and reasonableness. Students write a system of equations and/or inequalities to represent a problem situation such as the following:
The U.I.L. academic team is going to the state meet. There are 32 people going on the trip. There are 5 people who can drive and 2 types of vehicles, vans and cars. A van seats 8 people, and a car seats 4 people, including drivers. How many vans and cars does the team need for the trip?
System of Equations/Inequalities:
Let v = # vans and c = # cars
v + c 5 8v + 4c = 32
TEXTEAMS Algebra II/Precalculus Institute: Transformations with Technology PH chapter 2, 4 RWM, activity 4 Resource pro and manipulative kit toolkit www.tenet.edu/teks/math
Assessment Classroom TAKS/Other Assessments
Teacher observation. PH Computer Item Generator
TAKS Objective Two PH Standardized Test Prep Performance Assessment by TEKS go to: www.mathbenchmarks.org
Additional Support Pre - AP enrichment/extension Other
PH. Chapter 2 Project- Time Squeeze. Solve system of equations in quadratic form
NCTM 1, 2, 3, 4, 5, 6, 7, 8, 9, 13
122

Mathematics Instructional Alignment Chart
Student Expectations First Three Weeks
TEKS # b.3.C Grade Level: 9th-12th
Algebra I Algebra II Pre-Calculus b 2 B. For given contexts, the student interprets and determines the reasonableness of solutions to linear equations and inequalities
b.3.C Interprets and determines the
reasonableness of solutions to systems of equations and inequalities.
4.A Use sequences and series to represent, analyze, and solve problems.
Specific Student Expectations
TLW. Check the solutions of linear equations and inequalities by substitution to determine if they are reasonable. TLW. Select from several graphs to find a reasonable answer to a linear equation or inequality and/or use calculator technology to help in the process.
Instruction Strategies Resources
Cooperative Learning Activity Use manipulative Use graphing calculator Students discuss when answers to linear systems would not be reasonable.
For example, what answers would not be reasonable for the problem posed in b.3.B? Possible student solution: Negative numbers or fractional answers would not be reasonable answers for the number of cars or vans.
TEXTEAMS Algebra II/Precalculus Institute: Transformations with Technology PH Chap. 4 Resource pro and manipulative kit toolkit www.tenet.edu/teks/math
Assessment Classroom TAKS/Other Assessments
Teacher observation. PH Computer Item Generator
PH Standardized Test Prep Performance Assessment by TEKS go to: www.mathbenchmarks.org
Additional Support Pre - AP enrichment/extension Other
PH. Chapter 4 Project- HOT ! HOT ! HOT ! Solve system of equations in quadratic form
NCTM 1, 2, 3, 4, 5, 6, 7, 8, 13
123

Mathematics Instructional Alignment Chart
Student Expectations First Three Weeks
TEKS # c.1.A 9th-12th
Algebra I Algebra II
Grade Level:
Pre-Calculus b.2.A. Identify and sketch parent function y = X and y = X . 2
c.1.A. The student identifies and sketches graphs of parents functions, including linear( y = x ), quadratic ( y = X ), square root (
2
), and exponential ( y = a ). x
1.A. describe parent functions symbolically and graphically.
y =
y =
Assessment Classroom TAKS/Other Assessments
Teacher observation. PH Computer Item Generator
TAKS Objective Three PH Standardized Test Prep Performance Assessment by TEKS go to: www.mathbenchmarks.org
Additional Support Pre - AP enrichment/extension Other
Including inverse function and logarithmic function.
NCTM 1, 2, 3, 4, 5, 6, 7, 8, 13
X
Specific Student Expectations
TLW identify and sketch graphs of parent functions, including linear ( y = x ), quadratic ( y = X ), square root (2 ), absolute value and exponential ( y = a ). x
Strategies Resources Cooperative Learning Activity Use manipulative Use graphing calculator A sample of an activity can be found on the next page.
TEXTEAMS Algebra II/Precalculus Institute:
Activity II 3.1 (Comparing Exponential and Power Functions)
Resource pro and manipulative kit toolkit
X
Instruction
Activity IV 1.1 (Inverse Functions)
PH Chap. 1
www.tenet.edu/teks/math
124

c.1.A. The student identifies and sketches graphs of parents functions, including linear
( y = x ), quadratic ( y = X 2 ), square root ( y = X ), and exponential ( y = a x ).
Students identify and sketch the parent functions listed below as they learn them. (By the end of the course students should be able to complete the chart below.)
function identify sketch written description of graph y = x y = x2
y = 1/x y = 2x
y = log2 x
Students also connect each parent function with its inverse function in the chart. The inverses of two of the functions ( y = x and y = 1/x ) are the functions themselves.
Function Inverse y = x y = x
y = x2 y = 1/x y = 1/x y = 2x y = log2 x
y = log2 x y = 2x
Note: It is not clear in the case of y = ax what the parent function is. We have chosen to use y = 2x but one might want to investigate y = 10 x or y = (1/2) x .
125

Mathematics Instructional Alignment Chart Student Expectations
First Three Weeks TEKS # c.1.B Grade Level: 9th-12th
Algebra I Algebra II Pre-Calculus c.2.B Interpret the meaning of slopes and intercepts using data, symbolic representation, or graphs.
c.1.B The student extends parent functions with parameters such as m in y = mx and describes parameter changes on the graph of parent functions.
1C. Use characteristics of functions including domain and range, significant points, continuity, end behavior, vertical and horizontal asymptotes, limits, and symmetry.
Specific Student Expectations
TLW. Extend parent functions with parameters such as m in y = mx and describe parameter changes on the graph of parent functions.
Instruction Strategies Resources
Cooperative Learning Activity Use graphing calculator A sample of an activity can be found on the next page.
TEXTEAMS Algebra II/Precalculus Institute: Activity II 3.1 Comparing Exponential and Power Functions PH Chap. 1 Resource pro and manipulative kit Math TEKS toolkit www.tenet.edu/teks/math
Assessment Classroom TAKS/Other Assessments
Teacher observation. PH Computer Item Generator
PH Standardized Test Prep Performance Assessment by TEKS go to: www.mathbenchmarks.org
Additional Support Pre - AP enrichment/extension Other
Students will express rate of change in various ways. e.g. Let f be the function given by f(x) = x3 – 6x2 + p, where p is an arbitrary constant. For what values of the constant p does f have 3 district real roots? Explain your reasoning. Note: This question is based on the 1997 AB4 Cal. Question.
NCTM 1, 2, 3, 4, 5, 6, 7, 8, 13.
126

c.1.B The student extends parent functions with parameters such as m in y = mx
and describes parameter changes on the graph of parent functions.
Students use a graphing calculator to graph the parent function y = x. Then, for each equation related to the parent function, students predict what they think the new graph will look like, use the graphing calculator to check their prediction, sketch the graph, and describe the change. Students repeat the process with the parent function y = x2 . After they investigate examples related to both parent functions, students write general statements about:
(1) the effects of changing the coefficient of the x2 term;
(2) the effects of changing the coefficient of the x term; and
(3) the effects of adding or subtracting a constant.
function prediction describe the change
Parent: y = x y = 2x
y = x + 5 Parent: y = x2
y = 2x2 y = x2 + 5
Clarifying Activity
Students use a graphing calculator to identify parameter changes of the graphs of the parent function y = x2 . Each of the functions shown below is graphed in a calculator standard decimal window ( -4.7, 4.7, 1, -3.1, 3.1, 1). Students determine each function.
(1)
(2)
(3)
(4)
Answers:
(1) y = x2 + 1 (2) y = (x - 2)2
(3) y = (x + 1)2 - 2 (4) y = (1/2)x2 – 3
127

ALGEBRA II COURSE SCOPE AND SEQUENCE
GRADING PERIOD
TEKS Page
STUDENT EXPECTATIONS
RESOURCES First
3 Weeks
Second 3
Weeks
Third 3
Weeks
Fourth 3
Weeks
Fifth 3
weeks
Sixth 3
Weeks
b3(B) Page 129
The student uses algebraic methods, graphs, tables, or matrices, to solve systems of equations or inequalities.
PH Ch. 3, 4,
d3(D) Page 131
The student solves quadratic equations and inequalities.
PH Ch. 5
d4(A) Page 133
The student uses the parent function to investigate, describe, and predict the effects of parameter changes on the graphs of square root functions and describes limitations on the domains and ranges.
PH Ch. 1
d4(B)
Page 135
The student relates representations of square root functions, such as algebraic, tabular, graphical, and verbal descriptions.
PH Ch. 5
d4(C) Page 136
For given contexts, the student determines the reasonable domain and range values of square root functions, as well as interprets and determines the reasonableness of solutions to square root equations and inequalities.
PH Ch. 1, 5
d4(D)
Page 137
The student solves square root equations and inequalities using graphs, tables, and algebraic methods.
PH Ch. 6
d4(E)
Page 139
The student analyzes situations modeled by square root functions, formulates equations or inequalities, selects a method, and solves problems.
PH Ch. 6
d4(F)
Page 140
The student expresses inverses of quadratic functions using square root functions.
PH Ch. 5
Introduced
Maintained
128

Mathematics Instructional Alignment Chart
Student Expectations Second Three Weeks
TEKS # b.3.B Grade Level: 9th-12th
Algebra I Algebra II Pre-calculus b1D. The student represents relationships among quantities using concrete models, tables, graphs, diagrams, verbal descriptions, equations, and inequalities.
b.3.B The student use algebraic methods, graphs, tables, or matrices, to solve systems of equations or inequalities.
3A.3B.Use regression to determine functions to model situations and use functions to model real-life data.
Specific Student Expectations
TLW. Use algebraic methods, graphs, tables, or matrices, to solve systems of equations or inequalities.
Instruction Strategies Resources
Cooperative Learning Activity Use graphing calculator A sample of an activity can be found on the next page.
TEXTEAMS Algebra II/Precalculus Institute: Activity 1.2 Uncovering Quadratic PH Chap. 3, 4 Resource pro and manipulative kit Math TEKS toolkit www.tenet.edu/teks/math
Assessment Classroom TAKS/Other Assessments
Teacher observation. PH Computer Item Generator
TAKS Objective Two PH Standardized Test Prep Performance Assessment by TEKS go to: www.mathbenchmarks.org
Additional Support Pre - AP enrichment/extension Other
PH Chapter 3 project. Munching Microbes.
Solve system of equations in quadratic form
NCTM 1, 2, 3, 4, 5, 6, 7, 8, 13
129
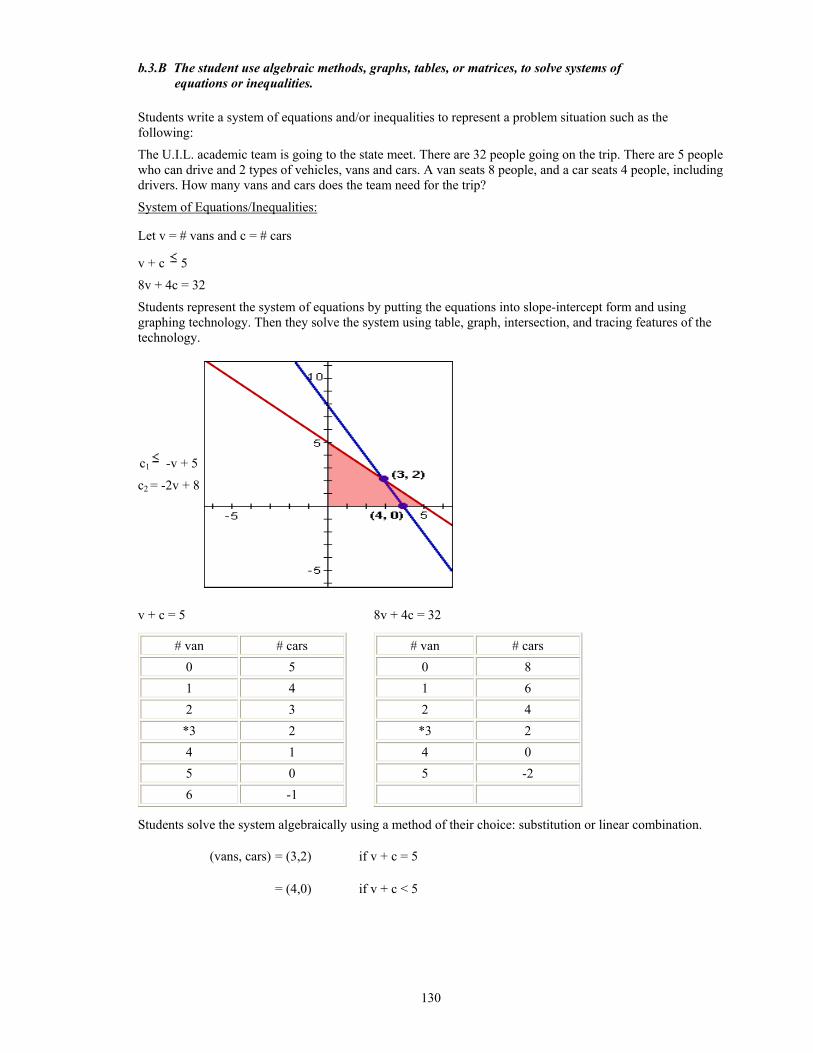
b.3.B The student use algebraic methods, graphs, tables, or matrices, to solve systems of equations or inequalities.
Students write a system of equations and/or inequalities to represent a problem situation such as the following:
The U.I.L. academic team is going to the state meet. There are 32 people going on the trip. There are 5 people who can drive and 2 types of vehicles, vans and cars. A van seats 8 people, and a car seats 4 people, including drivers. How many vans and cars does the team need for the trip?
System of Equations/Inequalities:
Let v = # vans and c = # cars
v + c 5
8v + 4c = 32
Students represent the system of equations by putting the equations into slope-intercept form and using graphing technology. Then they solve the system using table, graph, intersection, and tracing features of the technology.
c1 -v + 5
c2 = -2v + 8
v + c = 5 8v + 4c = 32
# van # cars 0 5 1 4 2 3 *3 2 4 1 5 0 6 -1
# van # cars 0 8 1 6 2 4 *3 2 4 0 5 -2
Students solve the system algebraically using a method of their choice: substitution or linear combination.
(vans, cars) = (3,2) if v + c = 5
= (4,0) if v + c < 5
130

Mathematics Instructional Alignment Chart
Student Expectations Second Three Weeks
TEKS # d.3.D Grade Level: 9th-12th
Algebra I Algebra II Pre-Calculus b1C. The student investigates methods for solving linear equations and inequalities using concrete models, graphs, and the properties of equality, selects a method, and solve the equations and inequalities.
d.3.D Solves quadratic equations and inequalities.
3.D. Use trigonometry to solve problems from physical situations.
Specific Student Expectations
TLW solve quadratic equations and inequalities. TLW solve quadratic equations and inequalities using graphs. TLW solve quadratic equations and inequalities using the properties of equality.
Instruction Strategies Resources
Cooperative Learning Activity Use graphing calculator A sample of an activity can be found on the next page.
PH Chap. 5 Resource pro and manipulative kit Math TEKS toolkit www.tenet.edu/teks/math
Assessment Classroom TAKS/Other Assessments
Teacher observation. PH Computer Item Generator
TAKS Objective Five PH Standardized Test Prep Performance Assessment by TEKS go to: www.mathbenchmarks.org
Additional Support Pre - AP enrichment/extension Other
PH. Chapter 5 project. ON Target. Find roots of 4th or 3rd degree polynomials given one or two roots. e.g. Consider the curve defined by x2 + xy + y2 = 27. Solve for y in terms of x and use your calculator to graph the curve. Determine the intercepts algebraically and very graphically. Note: This question is based on the 1994 AB3 AP Cal question.
NCTM 1, 2, 3, 4, 5, 6, 7, 8, 13
131

d.3.D Solves quadratic equations and inequalities.
Students use a variety of ways to solve a quadratic inequality. For example, solve x2 - x - 6 < 0 using a variety of methods.
graphing:
Students use a graphing calculator to graph y = x2 - x - 6.
Students trace to find the roots of the function and solve the inequality by inspection of the graph. (Some calculators allow students to calculate the roots, use a table feature to locate the roots, or solve by other methods.) (The solution of the inequality will be the interval consisting of x values for which the graph of the function lies below the x-axis: -2 < x < 3.)
algebraic:
Students solve the inequality x2 - x - 6 < 0 by
Factoring:
(x + 2)(x - 3) < 0
Then setting up the following cases and solving:
CASE 1: (x + 2) < 0 and (x - 3) > 0
CASE 2: (x + 2) > 0 and (x - 3) < 0
132
Mathematics Instructional Alignment Chart Student Expectations Second Three Weeks
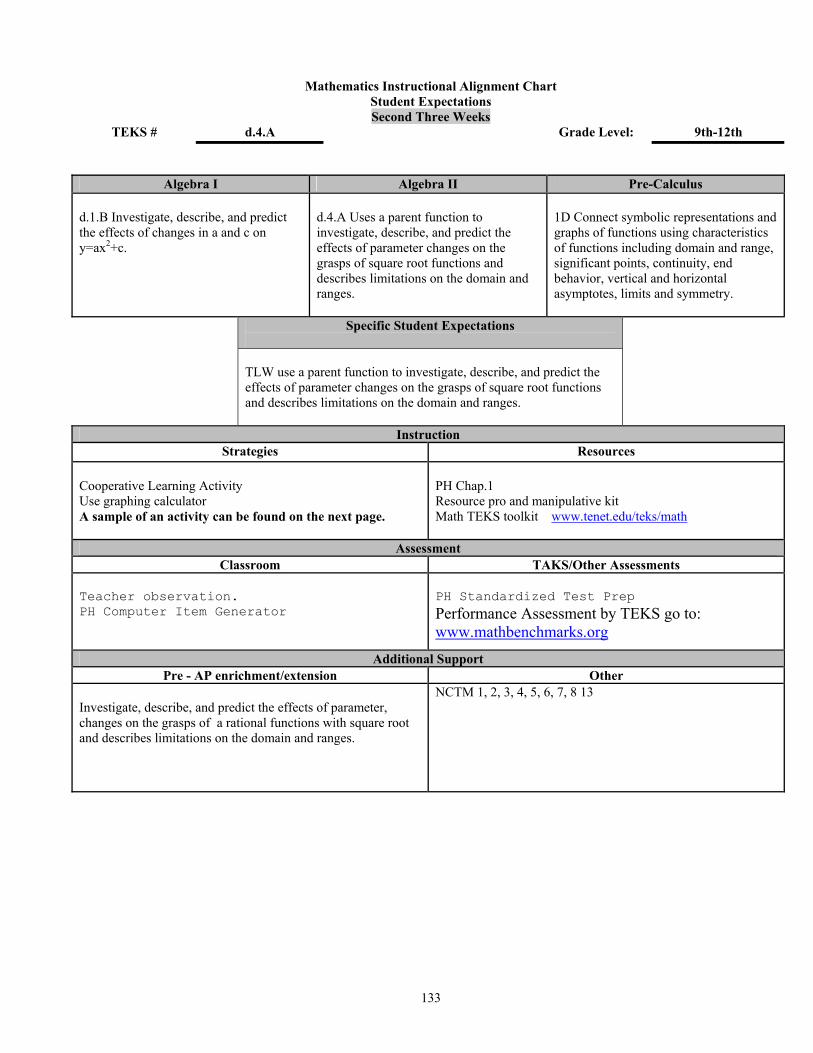
TEKS # d.4.A Grade Level: 9th-12th
Algebra I Algebra II Pre-Calculus d.1.B Investigate, describe, and predict the effects of changes in a and c on y=ax2+c.
d.4.A Uses a parent function to investigate, describe, and predict the effects of parameter changes on the grasps of square root functions and describes limitations on the domain and ranges.
1D Connect symbolic representations and graphs of functions using characteristics of functions including domain and range, significant points, continuity, end behavior, vertical and horizontal asymptotes, limits and symmetry.
Specific Student Expectations
TLW use a parent function to investigate, describe, and predict the effects of parameter changes on the grasps of square root functions and describes limitations on the domain and ranges.
Instruction Strategies Resources
Cooperative Learning Activity Use graphing calculator A sample of an activity can be found on the next page.
PH Chap.1 Resource pro and manipulative kit Math TEKS toolkit www.tenet.edu/teks/math
Assessment Classroom TAKS/Other Assessments
Teacher observation. PH Computer Item Generator
PH Standardized Test Prep Performance Assessment by TEKS go to: www.mathbenchmarks.org
Additional Support Pre - AP enrichment/extension Other
Investigate, describe, and predict the effects of parameter, changes on the grasps of a rational functions with square root and describes limitations on the domain and ranges.
NCTM 1, 2, 3, 4, 5, 6, 7, 8 13
133
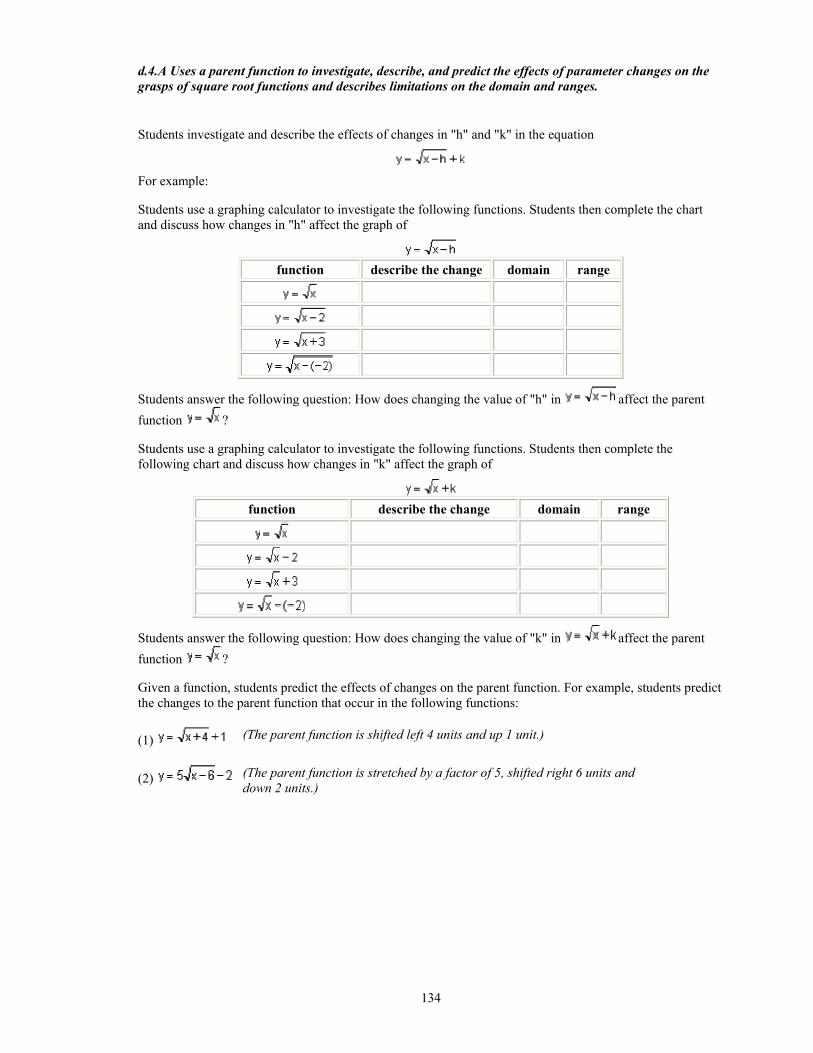
d.4.A Uses a parent function to investigate, describe, and predict the effects of parameter changes on the grasps of square root functions and describes limitations on the domain and ranges.
Students investigate and describe the effects of changes in "h" and "k" in the equation
For example:
Students use a graphing calculator to investigate the following functions. Students then complete the chart and discuss how changes in "h" affect the graph of
function describe the change domain range
Students answer the following question: How does changing the value of "h" in affect the parent function ?
Students use a graphing calculator to investigate the following functions. Students then complete the following chart and discuss how changes in "k" affect the graph of
function describe the change domain range
Students answer the following question: How does changing the value of "k" in affect the parent function ?
Given a function, students predict the effects of changes on the parent function. For example, students predict the changes to the parent function that occur in the following functions:
(1) (The parent function is shifted left 4 units and up 1 unit.)
(2) (The parent function is stretched by a factor of 5, shifted right 6 units and down 2 units.)
134
Mathematics Instructional Alignment Chart
Student Expectations Second Three Weeks
TEKS # d.4.B Grade Level: 9th-12th
Algebra I Algebra II Pre-Calculus b1D. The student represents relationships among quantities using concrete models, tables, graphs, diagrams, verbal descriptions, equations, and inequalities.
d.4.B The student relates representations of square root functions, such as algebraic, tabular, graphical, and verbal descriptions.
4A,B,C,D. Use sequences and series to represent, analyze, and solve problems.
Specific Student Expectations
TLW relate representations of square root functions, such as algebraic, tabular, graphical, and verbal descriptions.
Instruction Strategies Resources
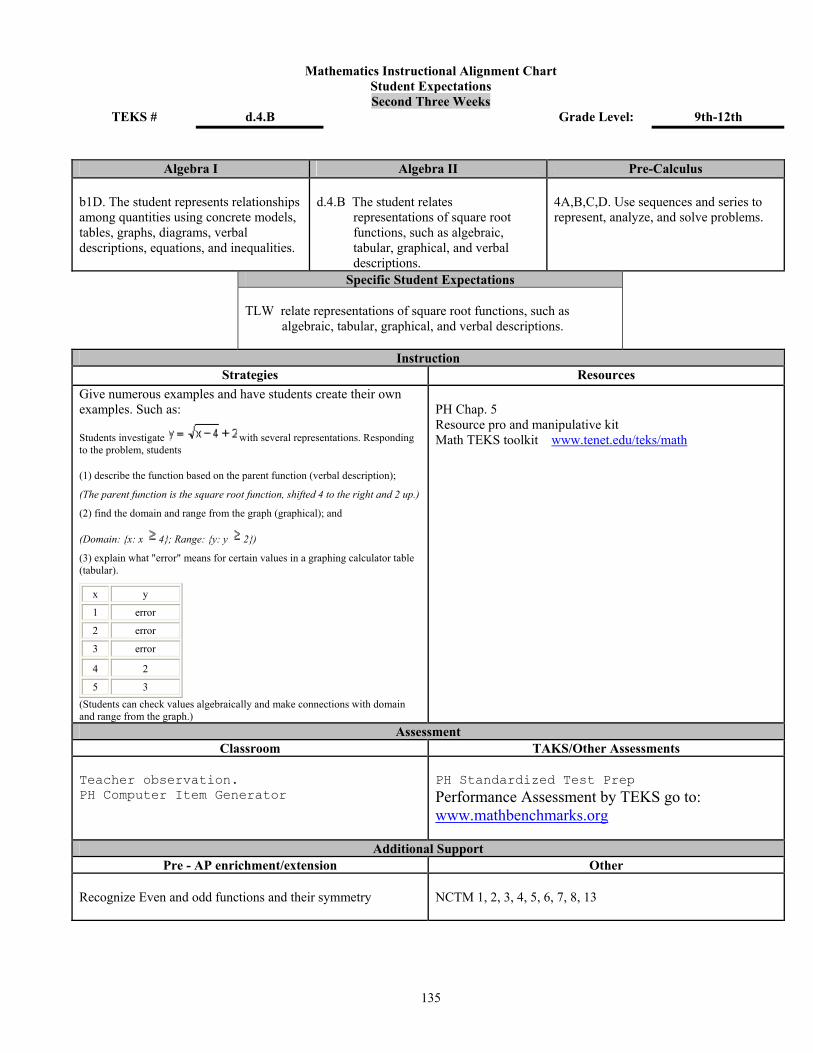
Give numerous examples and have students create their own examples. Such as:
Students investigate with several representations. Responding to the problem, students
(1) describe the function based on the parent function (verbal description);
(The parent function is the square root function, shifted 4 to the right and 2 up.)
(2) find the domain and range from the graph (graphical); and
(Domain: {x: x 4}; Range: {y: y 2})
(3) explain what "error" means for certain values in a graphing calculator table (tabular).
x y
1 error
2 error
3 error
4 2
5 3 (Students can check values algebraically and make connections with domain and range from the graph.)
PH Chap. 5 Resource pro and manipulative kit Math TEKS toolkit www.tenet.edu/teks/math
Assessment Classroom TAKS/Other Assessments
Teacher observation. PH Computer Item Generator
PH Standardized Test Prep Performance Assessment by TEKS go to: www.mathbenchmarks.org
Additional Support Pre - AP enrichment/extension Other
Recognize Even and odd functions and their symmetry
NCTM 1, 2, 3, 4, 5, 6, 7, 8, 13
135

Mathematics Instructional Alignment Chart
Student Expectations Second Three Weeks
TEKS # d.4.C Grade Level: 9th-12th
Algebra I Algebra II Pre-Calculus b2B. For given contexts, the student interprets and determines the reasonableness of solutions to linear equations and inequalities
d.4.C Determines the reasonable domain and range values of square root functions, as well as interprets and determines the reasonableness and solutions to square root equations and inequalities.
4.A Use sequences and series to represent, analyze, and solve problems.
Specific Student Expectations
TLW determine the reasonable domain and range values of square root functions, as well as interpret and determine the reasonableness and solutions to square root equations and inequalities.
Instruction Strategies Resources
Cooperative Learning Activity Use graphing calculator Students formulate a square root function to solve problems similar to the following:
If an object is dropped from a height "c" in meters, the height of the object after "t" seconds is given by the function h(t) = -4.9t2 + c. Formulate a function to determine how long it will take the object to reach the ground from a given height "c". Describe the domain and range for the new function. determining reasonable values for domain:
For h(t) = 0 , . The domain represents the height from which the object will be dropped. Therefore, the values of the domain must be positive. Domain: c > 0
determining reasonable values for range:
Since the range represents time, the values of the range must be positive. Range: t > 0
PH Chap. 1, 5 Resource pro and manipulative kit Math TEKS toolkit www.tenet.edu/teks/math
Assessment Classroom TAKS/Other Assessments
Teacher observation. PH Computer Item Generator
PH Standardized Test Prep Performance Assessment by TEKS go to: www.mathbenchmarks.org
Additional Support Pre - AP enrichment/extension Other
Investigate, describe, and predict the effects of parameter, changes on the grasps of a rational functions with square root and describes limitations on the domain and ranges.
NCTM 1, 2, 3, 4, 5, 6, 7, 8, 13
136

Mathematics Instructional Alignment Chart
Student Expectations Second Three Weeks
TEKS # d.4.D Grade Level: 9th-12th
Algebra I Algebra II Pre-Calculus c3B. The student investigates methods for solving linear equations and inequalities using concrete models, graphs, and the properties of equality, selects a method, and solve the equations and inequalities.
d.4.D Solves square root equations and inequalities using graphs, tables, and algebraic methods.
3.D. Use trigonometry to solve problems from physical situations. .
Specific Student Expectations
TLW solve square root and inequalities using concrete models. TLW solve square root and inequalities using graphs. TLW solve square root and inequalities using the properties of equality.
Instruction Strategies Resources
Cooperative Learning Activity Use graphing calculator A sample of an activity can be found on the next page.
PH Chap. 6 Resource pro and manipulative kit Math TEKS toolkit www.tenet.edu/teks/math
Assessment Classroom TAKS/Other Assessments
Teacher observation. PH Computer Item Generator
PH Standardized Test Prep Performance Assessment by TEKS go to: www.mathbenchmarks.org
Additional Support Pre - AP enrichment/extension Other
Consider the curve defined by x2 + xy + y2 = 27. Solve for y in terms of x and use your calculator to graph the curve. Determine the intercepts algebraically and very graphically. Note: This question is based on the 1994 AB3 AP Cal question.
NCTM 1, 2, 3, 4, 5, 6, 7, 8, 13
137

d.4.D Solves square root equations and inequalities using graphs, tables, and algebraic methods.
Students use a variety of ways to solve a square-root equation such as
graphing:
Students use a graphing calculator to graph simultaneously the functions and Y2 = 3. Students can trace to find the point of intersection of the two functions. (Some calculators allow students to calculate a point of intersection, use a table feature to locate a point of intersection, or solve by other methods.)
algebraic:
Students solve the equation by
squaring both sides: 2x - 1 = 9
solving for x: x = 5
checking:
Students use the same methods described with equalities to solve square-root inequalities such as:
138

Mathematics Instructional Alignment Chart Student Expectations Second Three Weeks
TEKS # d.4.E Grade Level: 9th-12th
Algebra I Algebra II Pre-Calculus b.1.C Represent, interpret, and make inferences from functional relationships.
d.4.E Analyzes situations modeled by square root functions, formulates equations or inequalities, selects a method, and solves problems.
N/A
Specific Student Expectations
TLW. Analyzes situations modeled by square root functions, formulates equations or inequalities, selects a method, and solves problems.
Instruction Strategies Resources
Cooperative Learning Activity Use graphing calculator Students formulate a square-root equation to solve problems similar to the following:
For a pendulum, the period (T) in seconds is given by where L is the length in meters and g is the acceleration due to gravity (approximately 9.8 m/sec2.) Glenn is swinging back and forth on the end of a rope swing. He sees the neighbor's dog leaping up at him from the ground below. He quickly scrambles halfway up the rope to safety. Relaxing, he finds that the period of his swing is one second shorter now that his "pendulum" is half its original length. How long is the rope swing?
While the algebra is extremely tedious in this problem, a solution can be easily found using graphing technology as the intersection of two functions. Let
and .
Answer: about 2.9 meters
PH Chap. 6 Resource pro and manipulative kit Math TEKS toolkit www.tenet.edu/teks/math
Assessment Classroom TAKS/Other Assessments
Teacher observation. PH Computer Item Generator
PH Standardized Test Prep Performance Assessment by TEKS go to: www.mathbenchmarks.org
Additional Support Pre - AP enrichment/extension Other
PH. Chapter 6 project. Curves by design. Does the weight of the pendulum affect the regression equation? Give each group a different weight and compare the results. Note: This activity introduces the student to data collection, curve fitting and experimental design—all topics of the AP Statistics curriculum.
NCTM 1, 2, 3, 4, 5, 6, 7, 8, 13
139

Mathematics Instructional Alignment Chart Student Expectations Second Three Weeks
TEKS # d.4.F Grade Level: 9th-12th
Algebra I Algebra II Pre-Calculus d.1.B Investigate, describe, and predict the effects of changes in a and c on y=ax2+c.
d.4.F Express inverses of quadratic functions using square root functions.
2B. Perform operations of and find inverses of functions, and describe procedures and results of various ways.
Specific Student Expectations
TLW. Express inverses of quadratic functions using square root functions.
Instruction Strategies Resources
Cooperative Learning Activity Use graphing calculator Students determine the inverse of the following quadratic function, f(x) = x2 + 2. Students discuss with the teacher and each other that in the original function, f(x) = x2 + 2, the value of x is squared and then 2 units are added. The inverse of those operations would involve subtracting 2 from x and then taking the
square root, thus forming the inverse, .
algebraically
f(x) = x2 + 2
y = x2 + 2
x = y2 + 2
x - 2 = y2
PH Chap. 5 Resource pro and manipulative kit Math TEKS toolkit www.tenet.edu/teks/math
Assessment Classroom TAKS/Other Assessments
Teacher observation. PH Computer Item Generator
PH Standardized Test Prep Performance Assessment by TEKS go to: www.mathbenchmarks.org
Additional Support Pre - AP enrichment/extension Other
The topic of inverses is a very important concept for the calculus student. PreAP students are expected to have been introduced to the concept of inverses early on in Algebra I and again in Algebra II.
NCTM 1, 2, 3, 4, 5, 6, 7, 8, 13
140

ALGEBRA II COURSE SCOPE AND SEQUENCE
GRADING PERIOD
TEKS Page
STUDENT EXPECTATIONS
RESOURCES First
3 Weeks
Second 3
Weeks
Third 3
Weeks
Fourth 3
Weeks
Fifth 3
Weeks
Sixth 3
Weeks
b2(B)
Page 142
The student uses complex numbers to describe the solutions of quadratic equations.
PH Ch. 5
c1C Page 144
The student recognizes inverse relationships between various functions.
PH Ch. 5, 6, 7
d1(A) Page 145
For given contexts, the student determines the reasonable domain and range values of quadratic functions, as well as interprets and determines the reasonableness of solutions to quadratic equations and inequalities.
PH Ch. 5
d1(B)
Page 147
The student relates representations of quadratic functions, such as algebraic, tabular, graphical, and verbal descriptions.
PH Ch. 5
RWM, Activity 9
d1C Page 147
The student determines a quadratic function from its roots or a graph.
PH Ch. 5 SS, Activity 6
d2(A)
Page 148
The student uses characteristics of the quadratic parent function to sketch the related graphs and connects between the y = ax² + bx + c and the y = a(x – h)² + k symbolic representations of quadratic functions.
PH Ch. 5
d2(B) Page 149
The student uses the parent function to investigate, describe, and predict the effects of changes in a, h, and k on the graphs of y = a(x – h)² + k form of a function in applies and purely mathematical situations.
PH Ch. 5
d3(A)
Page 150
The student analyzes situations involving quadratic functions and formulates quadratic equations or inequalities to solve problems.
PH Ch. 5
d3(B)
Page 151
The solution analyzes and interprets the solutions of quadratic equations using discriminants and solves quadratic equations using the quadratic formula.
PH Ch. 5
Introduced
Maintained
141
Mathematics Instructional Alignment Chart Student Expectations Third Three Weeks
TEKS # b.2.B Grade Level: 9th-12th
Algebra I Algebra II Pre-Calculus b.4.A Find the specific function values, simplify polynomial expressions, transform and solve equations, and factor as necessary.
b.2.B. The student uses complex numbers to describe the solutions of quadratic equations.
2B Use operations on functions including function composition.
Specific Student Expectations
T.L.W. use complex numbers to describe the solutions of quadratic equations.
Instruction Strategies Resources
Cooperative Learning Activity Use graphing calculator A sample of an activity can be found on the next page.
PH Chap. 5 Resource pro and manipulative kit Math TEKS toolkit www.tenet.edu/teks/math
Assessment Classroom TAKS/Other Assessments
Teacher observation. PH Computer Item Generator
TAKS Objective Two PH Standardized Test Prep Performance Assessment by TEKS go to: www.mathbenchmarks.org
Additional Support Pre – AP enrichment/extension Other
The topic of complex numbers is a very important concept for the calculus student. PreAP students are expected to have been introduced to this concept early on in Algebra I and again in Algebra II.
NCTM 1, 2, 3, 4, 5, 6, 7, 8, 13
142

b.2.B. The student uses complex numbers to describe the solutions of quadratic equations.
Students investigate and describe the effects of changes in a, h, and k on the graphs of
y = a(x - h)2 + k.
For example, students graph the following functions, then complete the chart and discuss the effects of changes in "k" in the graph of
y = (x - 2)2 + k equation prediction describe the change
y = (x - 2)2 y = (x - 2)2 - 5 y = (x - 2)2 - 2 y = (x - 2)2 + 2
Students do similar investigations to determine the effects of changing "h" and "a".
Given an equation, students predict the effects of changes on the parent function. For example, students predict the changes to the parent function that occur in the following functions:
(1) y = (x + 4)2 + 1 (The parent function is shifted left 4 units and up 1 unit.)
(2) y = 5(x - 6)2 - 2 (The parent function is stretched by a factor of 5, shifted right 6 units and down 2 units.)
143

Mathematics Instructional Alignment Chart Student Expectations Third Three Weeks
TEKS # c.1.C Grade Level: 9th-12th
Algebra I Algebra II Pre-Calculus c.2.C Investigate, describe, and predict the effect of changes of m and b on y = mx + b.
c.1.C The student recognizes inverse relationships between various functions.
2A, 2B Apply basic transformations (a*f(x), f(x) + d, f(x) –c, f(b*x), ( )f x ,
( )f x ). Perform operations and find inverses of functions.
Specific Student Expectations
TLW recognize inverse relationships between various functions.
Instruction Strategies Resources
Cooperative Learning Activity Use graphing calculator Students use a graphing calculator to graph the parent function y = x. Then, for each equation related to the parent function, students predict what they think the new graph will look like, use the graphing calculator to check their prediction, sketch the graph, and describe the change. Students repeat the process with the parent function y = x2 . After they investigate examples related to both parent functions, students write general statements about:
(1) the effects of changing the coefficient of the x2 term; (2) the effects of changing the coefficient of the x term; and
(3) the effects of adding or subtracting a constant.
function prediction describe the change
Parent: y = x y = 2x
y = x + 5 Parent: y = x2
y = 2x2 y = x2 + 5
TEXTEAMS Algebra II/Precalculus Institute: Activity 3.1 Mira Reflection. Activity 3.2 Inverse with Parametric Equations PH Chap. 5, 6,7. Resource pro and manipulative kit . Math TEKS toolkit www.tenet.edu/teks/math
Assessment Classroom TAKS/Other Assessments
Teacher observation. PH Computer Item Generator
TAKS Objective three PH Standardized Test Prep Performance Assessment by TEKS go to: www.mathbenchmarks.org
Additional Support Pre - AP enrichment/extension Other
PH. Chapter 7 project. Aging Artifacts. NCTM 1, 2, 3, 4, 5, 6, 7, 8,13
144

Mathematics Instructional Alignment Chart Student Expectations Third Three Weeks
TEKS # d.1.A Grade Level: 9th-12th
Algebra I Algebra II Pre-Calculus b.2.B Determines the reasonableness and interpret graphs, domain and range values, and solutions to equations, inequalities, or systems.
d.1.A Determines the reasonable domain and range values of quadratic functions, as well as interprets and determines the reasonableness of solutions to quadratic equations and inequalities.
3B Use regressions to determine functions to model situations.
Specific Student Expectations
T.L.W. Determine the reasonable domain and range values of quadratic functions, as well as interpret and determine the reasonableness of solutions to quadratic equations and inequalities.
Instruction Strategies Resources
Cooperative Learning Activity Use graphing calculator
Students describe the domain and range for the following example.
If a ball is thrown upwards from a tower that is 31meters tall at a velocity of 24 meters per second, the height in meters of the ball above the ground is given by the function: h(t) = 31 + 24t - 4.9t2
Here, t is the time in seconds since the ball was thrown. The graph of h(t) is given below:
For the interpretation given, what is a reasonable domain and range for the function h(t)?
(From the graph, approximately: domain -1 t 6, range 0 h(t) 60.)
PH Chap. 5 Resource pro and manipulative kit Math TEKS toolkit www.tenet.edu/teks/math
Assessment Classroom TAKS/Other Assessments
Teacher observation. PH Computer Item Generator
TAKS Objective Five PH Standardized Test Prep Performance Assessment by TEKS go to: www.mathbenchmarks.org
Additional Support Pre - AP enrichment/extension Other
Find range and domain of x = C41
( y – k ) 2 + h
NCTM 1, 2, 3, 4, 5, 6, 7, 8, 13
145

Mathematics Instructional Alignment Chart Student Expectations Third Three Weeks
TEKS # d.1.B Grade Level: 9th-12th
Algebra I Algebra II Pre-Calculus d.2.A. Solve quadratic equation using concrete models, tables, graphs, and algebraic method.
d.1.B. the students relates representation of quadratic function, such as algebraic, tabular, graphical, and verbal description.
3B Use regressions to determine functions to model situations.
Specific Student Expectations
TLW. Relate representation of quadratic function, such as Algebraic, tabular, graphical, and verbal description.
Instruction Strategies Resources
Cooperative Learning Activity Use graphing calculator
Students extend the problem in (d.1.A) to answer questions using multiple representations.
If a ball is thrown upwards from a tower that is 31 meters tall at a velocity of 24 meters per second, the height in meters of the ball above the ground is given by the function: h(t) = 31 + 24t - 4.9t2.
(1) What is the maximum height achieved by the ball, and at approximately what time does the ball achieve that height? (From the graph: h
60 m and t 2.4 sec.)
(2) At what time(s) does the ball reach a height of h = 50 meters? Answer in two ways, directly from the graph, and by solving an equation. (From the graph, the times are about t = 1 sec and t = 4 sec. Solving the equation 50 = 31 + 24t - 4.9t2 leads first to 4.9t2 - 24t + 19 = 0, and then, by the quadratic formula, to t 0.99 and t 3.90.)
(3) Solve the inequality h(t) > 40 graphically, and interpret in terms of the situation.
(From the graph, h(t) > 40 for, approximately, the values 0.5 t 4.5. The meaning is that the ball was at a height greater than 40 meters for about a 4 second interval from about 0.5 sec to about 4.5 sec.)
PH Chap. 5 Resource pro and manipulative kit. RWM. Activity 9 Math TEKS toolkit www.tenet.edu/teks/math
Assessment Classroom TAKS/Other Assessments
Teacher observation. PH Computer Item Generator
TAKS Objective Five PH Standardized Test Prep Performance Assessment by TEKS go to: www.mathbenchmarks.org
Additional Support Pre - AP enrichment/extension Other
This TEKS is developed throughout the Algebra I and Algebra II curriculums. Symbolic manipulation is a major component of Algebra I and II, and PreAP students should have many meaningful opportunities to practice these skills.
NCTM 1, 2, 3, 4, 5, 6, 7, 8, 13
146
Mathematics Instructional Alignment Chart Student Expectations Third Three Weeks
TEKS # d.1.C Grade Level: 9th-12th
Algebra I Algebra II Pre-Calculus d.1.B. Investigate, describe, and predict the effects of changes in a and c on y = ax 2 + c.
d.1.C Determines quadratic function from its roots or graphs.
1D Connect symbolic representations and graphs of functions using characteristics of functions including domain and range, significant points, continuity, end behavior, vertical and horizontal asymptotes, limits and symmetry.
Specific Student Expectations
T.L.W. Determine quadratic function from its roots or graphs.
Instruction Strategies Resources
Cooperative Learning Activity Use graphing calculator
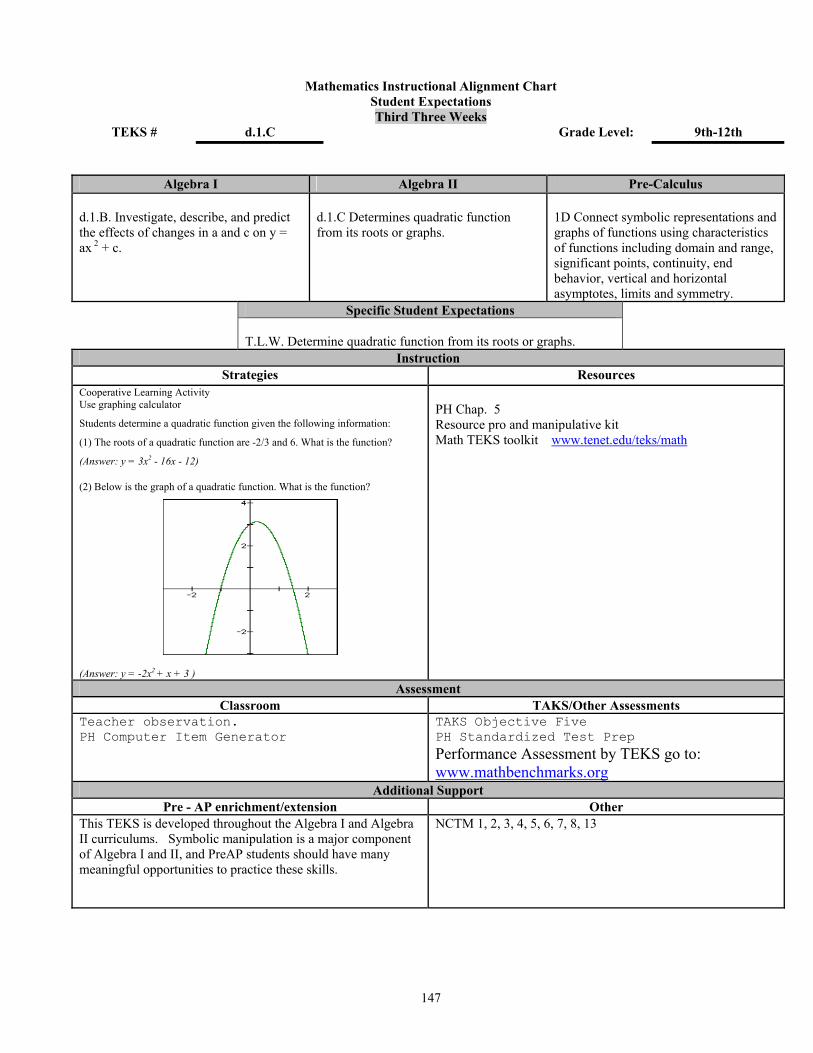
Students determine a quadratic function given the following information:
(1) The roots of a quadratic function are -2/3 and 6. What is the function?
(Answer: y = 3x2 - 16x - 12)
(2) Below is the graph of a quadratic function. What is the function?
(Answer: y = -2x2 + x + 3 )
PH Chap. 5 Resource pro and manipulative kit Math TEKS toolkit www.tenet.edu/teks/math
Assessment Classroom TAKS/Other Assessments
Teacher observation. PH Computer Item Generator
TAKS Objective Five PH Standardized Test Prep Performance Assessment by TEKS go to: www.mathbenchmarks.org
Additional Support Pre - AP enrichment/extension Other
This TEKS is developed throughout the Algebra I and Algebra II curriculums. Symbolic manipulation is a major component of Algebra I and II, and PreAP students should have many meaningful opportunities to practice these skills.
NCTM 1, 2, 3, 4, 5, 6, 7, 8, 13
147

Mathematics Instructional Alignment Chart Student Expectations Third Three Weeks
TEKS # d.2.A Grade Level: 9th-12th
Algebra I Algebra II Pre-Calculus d.2.B Analyze graphs of quadratic functions in problem situations and relates solutions to quadratic equations to the roots of their functions.
d.2.A Uses characteristics of the quadratic parent function to sketch the related graphs and connects between the y=ax +bx+c and y=a(x-h) +k symbolic representation of quadratic equations.
2A. Describe parent functions symbolically and graphically and apply basic transformations to the parent functions. 2 2
Specific Student Expectations TLW. Use characteristics of the quadratic parent function to sketch
the related graphs and connect between the y=ax +bx+c and 2 y=a(x-h)2+k symbolic representation of quadratic equations.
Instruction Strategies Resources
Cooperative Learning Activity Use graphing calculator
Students use their knowledge of parent functions to answer questions such as the following about the functions represented by:
y1 = 2(x - 3)2 + 1
y2 = 2x2 - 12x + 19
1. Justify that the functions are the same using algebraic methods.
2. What information about the sketch can you determine from y1 = 2(x - 3)2 + 1?
(Possible answers: The parabola opens up with a minimum point at (3,1). The parabola is stretched out compared to the parent function.)
3. What information about the sketch can you determine from y2 = 2x2 - 12x + 19?
(Possible answers: The parabola opens up, is stretched out, and crosses the y-axis at 19.)
4. Using information from Question 1 and Question 2, hand sketch a graph of the function, then check using graphing technology.
PH Chap. 5 Resource pro and manipulative kit Math TEKS toolkit www.tenet.edu/teks/math
Assessment Classroom TAKS/Other Assessments
Teacher observation. PH Computer Item Generator
TAKS Objective Five PH Standardized Test Prep Performance Assessment by TEKS go to: www.mathbenchmarks.org
Additional Support Pre - AP enrichment/extension Other
Quadratic function in PreAP Algebra I can be used to introduce optimization problems found in AP Calculus. Students should be allowed to investigate transformations on their own and determine the effects of the different parameters.
NCTM 1, 2, 3, 4, 5, 6, 7, 8, 13
148

Mathematics Instructional Alignment Chart Student Expectations Third Three Weeks
TEKS # d.2.B Grade Level: 9th-12th
Algebra I Algebra II Pre-Calculus d.1.B Investigate, describe, and predict the effects of changes in a and c on y=ax2+c.
d.2.B Uses the parent function to investigate, describe, and predict the effects of changes in a, h, and k on the graphs of y=a(x-h)2+k form of a function in applications and purely mathematical situations.
2A. Describe parent functions symbolically and graphically and apply basic transformations to the parent functions
Specific Student Expectations
TLW. Use the parent function to investigate, describe, and predict the effects of changes in a, h, and k on the graphs of y=a(x-h)2+k form of a function in applications and purely mathematical situations.
Instruction Strategies Resources
Cooperative Learning Activity Use graphing calculator
Students investigate and describe the effects of changes in a, h, and k on the graphs of
y = a(x - h)2 + k.
For example, students graph the following functions, then complete the chart and discuss the effects of changes in "k" in the graph of
y = (x - 2)2 + k
equation prediction describe the change
y = (x - 2)2
y = (x - 2)2 - 5
y = (x - 2)2 - 2
y = (x - 2)2 + 2
Students do similar investigations to determine the effects of changing "h" and "a".
Given an equation, students predict the effects of changes on the parent function. For example, students predict the changes to the parent function that occur in the following functions:
(1) y = (x + 4)2 + 1 (The parent function is shifted left 4 units and up 1 unit.)
(2) y = 5(x - 6)2 - 2 (The parent function is stretched by a factor of 5, shifted right 6 units and down 2 units.)
TEXTEAMS Algebra II/Precalculus Institute: Activity 1.1 Bouncing Again PH Chap. 5 Resource pro and manipulative kit. Math TEKS toolkit www.tenet.edu/teks/math
Assessment Classroom TAKS/Other Assessments
Teacher observation. PH Computer Item Generator
TAKS Objective Five PH Standardized Test Prep Performance Assessment by TEKS go to: www.mathbenchmarks.org
Additional Support Pre - AP enrichment/extension Other
Investigate the physical meaning of a in y = ax 2 + bx + c. Quadratic function in PreAP Algebra I can be used to introduce optimization problems found in AP Calculus. Students should be allowed to investigate transformations on their own and determine the effects of the different parameters.
NCTM 1, 2, 3, 4, 5, 6, 7, 8, 13
149

RWM. Project, That is the way the ball bounces.
Mathematics Instructional Alignment Chart Student Expectations Third Three Weeks
TEKS # d.3.A Grade Level: 9th-12th
Algebra I Algebra II Pre-Calculus b3A. The student analyzes situations involving linear functions and formulates linear equations or inequalities to solve problems.
d.3.A The student analyzes situations involving quadratic functions and formulates quadratic equations or inequalities to solve problems.
3.A. Use functions and their properties to model, analyze, solve problems, and make prediction.
Specific Student Expectations
TLW translates word problems into quadratic equation or inequality. TLW will study quadratic equation graphically to make inferences or predictions about two relationships. TLW study data graphically given a table of values to make inferences about a quadratic equation.
Instruction Strategies Resources
Students formulate a quadratic equation to solve problems similar to the following:
A box with a square base and no lid is to be made from a square piece of metal by cutting squares from the corners and folding up the sides. The cut-off squares are 5 cm on a side. If the volume of the box is 100 cm3, find the dimensions of the original piece of metal.
(The equation for finding the dimensions is 5(x - 10)(x - 10) = 100.)
PH Chap. 5 Resource pro and manipulative kit Math TEKS toolkit www.tenet.edu/teks/math
Assessment Classroom TAKS/Other Assessments
Teacher observation. PH Computer Item Generator
TAKS Objective Five PH Standardized Test Prep Performance Assessment by TEKS go to: www.mathbenchmarks.org
Additional Support Pre - AP enrichment/extension Other
Point Q has coordinates (100, 80)
(A) Write the eq. of the line shown in the figure. (B) Write the eq. for the Parabola shown in the figure.
(C) Suppose the graph of the parabola shown in the figure represents a hill. There is a 50-ft. tree growing vertically at the top of the hill. Does a spotlight at point P directed along line shine on any part of the tree? Explain your reasoning.
Note: This question is based on the 1996 AB6 AP Cal. Exam
NCTM. Standard 1,2,3,4,5,6,7,8,13
150

Mathematics Instructional Alignment Chart Student Expectations Third Three Weeks
TEKS # d.3.B Grade Level: 9th-12th
Algebra I Algebra II Pre-Calculus b4B. The student uses the commutative, Associative, and distributive properties to simplify algebraic expressions.
d.3.B Interpret and analyze solution to quadratic equations including the use of complex number and the Discriminant.
4.B.Use and apply sequence and series; investigate series using limits.
Specific Student Expectations
T.L.W. Interpret and analyze solution to quadratic equations including the use of complex number and the discriminants.
Instruction Strategies Resources
Cooperative Learning Activity Use graphing calculator
Students use the discriminant to predict the type of roots for a given quadratic equation. Example: Determine if the following equations will have two real roots, one real root, or no real roots (two imaginary roots).
(1) 2x2 + 8x + 12 = 0 (two imaginary roots since the discriminant is negative, d = -32)
(2) x2 - 4x + 3 = 0 (two real roots since the discriminant is positive, d = 4)
(3) 4x2 + 20x + 25 = 0 (one real root since the discriminant is zero)
Students then solve the equations above using the quadratic formula
and verify the types of roots by examining the graphs.
PH Chap. 5 Resource pro and manipulative kit Math TEKS toolkit www.tenet.edu/teks/math
Assessment Classroom TAKS/Other Assessments
Teacher observation. PH Computer Item Generator
PH Standardized Test Prep Performance Assessment by TEKS go to: www.mathbenchmarks.org
Additional Support Pre - AP enrichment/extension Other
Point Q has coordinates (100, 80)
A) Write the eq. of the line Shown in the figure.
B) Write the eq. for the Parabola shown in the figure.
C) Suppose the graph of the parabola shown in the figure represents a hill. There is a 50-ft. tree growing vertically at the top of the hill. Does a spotlight at point P directed along line shine on any part of the tree? Explain your reasoning. Note: This question is based on the 1996 AB6 AP Cal. Exam.
NCTM. Standard 1,2,3,4,5,6,7,8,13
151
ALGEBRA II COURSE SCOPE AND SEQUENCE
Introduced
Maintained
GRADING PERIOD TEKS Page
STUDENT EXPECTATIONS
RESOURCES First
3 Weeks
Second 3
Weeks
Third 3
Weeks
Fourth 3
Weeks
Fifth 3
Weeks
Sixth 3
Weeks
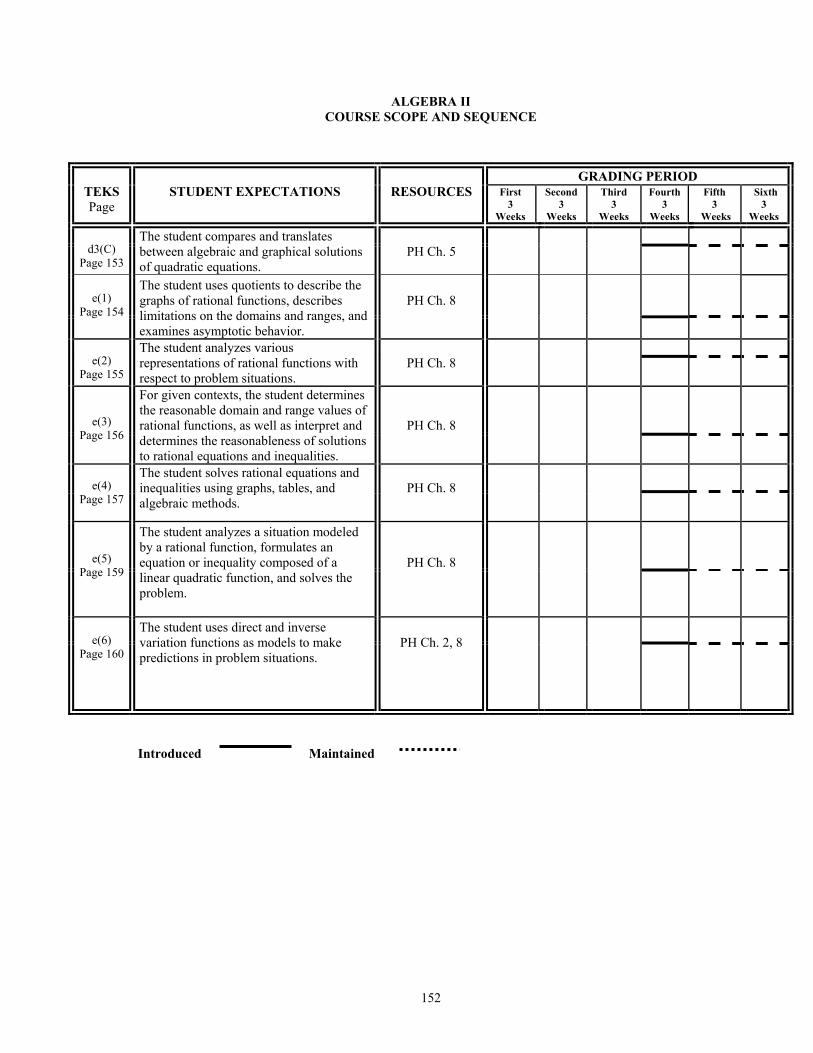
d3(C)
Page 153
The student compares and translates between algebraic and graphical solutions of quadratic equations.
PH Ch. 5
e(1)
Page 154
The student uses quotients to describe the graphs of rational functions, describes limitations on the domains and ranges, and examines asymptotic behavior.
PH Ch. 8
e(2) Page 155
The student analyzes various representations of rational functions with respect to problem situations.
PH Ch. 8
e(3) Page 156
For given contexts, the student determines the reasonable domain and range values of rational functions, as well as interpret and determines the reasonableness of solutions to rational equations and inequalities.
PH Ch. 8
e(4)
Page 157
The student solves rational equations and inequalities using graphs, tables, and algebraic methods.
PH Ch. 8
e(5) Page 159
The student analyzes a situation modeled by a rational function, formulates an equation or inequality composed of a linear quadratic function, and solves the problem.
PH Ch. 8
e(6)
Page 160
The student uses direct and inverse variation functions as models to make predictions in problem situations.
PH Ch. 2, 8
152

Mathematics Instructional Alignment Chart Student Expectations Fourth Three Weeks
TEKS # d3.C Grade Level: 9th-12th
Algebra I Algebra II Pre-Calculus d.2.A. solve quadratic equations using concrete model, tables, graphs, and algebraic method.
d.3.C. compares and translates between algebraic and graphical solution of quadratic equations.
3.C. use functions and their properties to model, analyze, solve problems, and make predictions.
Specific Student Expectations
TLW. Compare and translate between algebraic and graphical solution of quadratic equations.
Instruction Strategies Resources
Cooperative Learning Activity Use graphing calculator
Students solve the equation x2 - 4x + 3 = 0 and find the roots (a) using the graphing calculator and (b) algebraically. Students should note that the solutions they find algebraically are the places where the graph crosses the x axis. (Students should be given several opportunities to investigate this relationship.)
PH Chap. 5 Resource pro and manipulative kit Math TEKS toolkit www.tenet.edu/teks/math
Assessment Classroom TAKS/Other Assessments
Teacher observation. PH Computer Item Generator
PH Standardized Test Prep Performance Assessment by TEKS go to: www.mathbenchmarks.org
Additional Support Pre - AP enrichment/extension Other
This TEKS is developed throughout the Algebra II curriculum. Symbolic manipulation is a major component of Algebra II, and PreAP students should have many meaningful opportunities to practice these skills.
NCTM. Standard 1,2,3,4,5,6,7,8,13
153

Mathematics Instructional Alignment Chart Student Expectations
Algebra I Algebra II Pre-Calculus c.2.C. investigate, describe, and predict the effect of changes in m and b on y = mx + b, and the effect of changes in a and c on y = ax 2 + bx + c.
e.1 Uses quotients to describe the graphs of rational function, describe limitation on the domain and ranges, and examines asymptotic behavior.
2A, 2B Apply basic transformations
(a*f(x), f(x) + d, f(x) –c, f(b*x), ( )f x ,
( )f x ). Perform operations and find inverses of
functions. Specific Student Expectations
TLW. Use quotients to describe the graphs of rational function, describe limitation on the domain and ranges, and examine asymptotic behavior.
Instruction Strategies Resources
Cooperative Learning Activity, use graphing calculator
Given a rational function , students investigate the function using graph and algebra to answer the following: (1) For what value of x is the denominator equal to zero? (x = 2) (2) State the domain of the function. {x: x 2} (3) State the range of the function. (All real numbers except 0) (4) Complete the tables below to investigate asymptotic behavior.
As x approaches 2 from the left , f(x) approaches ______________.
As x approaches 2 from the right , f(x) approaches _______________
x
1
1.5
1.9
1.99
1.999
x
3
2.5
2.1
2.01
2.001
TEXTEAMS Algebra II/Precalculus Institute: Activity 1.2 Can Problem. Activity 2.2 The long and short of it. PH Chap. 8 Resource pro and manipulative kit. Math TEKS toolkit www.tenet.edu/teks/math
Assessment Classroom TAKS/Other Assessments
Teacher observation. PH Computer Item Generator
PH Standardized Test Prep Performance Assessment by TEKS go to: www.mathbenchmarks.org
Additional Support Pre - AP enrichment/extension Other
e.g. Let f be the function given by 4
)(2 −
=x
xxf .
♦ ♦ ♦
Find the domain of f. Write an equation for each vertical asymptote to the graph of f. Write an equation for each horizontal asymptote to the graph of f.
Note: This question is based on the 1989 AB4 AP Cal. Exam.
NCTM. Standard 1,2,3,4,5,6,7,8,13
Fourth Three Weeks TEKS # e.1 Grade Level: 9th-12th
154
Mathematics Instructional Alignment Chart
Student Expectations Fourth Three Weeks
TEKS # e.2 Grade Level: 9th-12th
Algebra I Algebra II Pre-Calculus c.3.B. Investigate method and solve linear equation, inequalities, and system including concrete models and graphs.
e.2 Analyze various representation of rational function with respect to problem situation.
3.D. Use appropriate geometric models to model situation, including trigonometry, area formulas, parametric function conic sections and vectors.
Specific Student Expectations
TLW. Analyze various representation of rational function with respect to problem situation.
Instruction Strategies Resources
Cooperative Learning Activity, use graphing calculator
Students are given the following situation:
Liz plays basketball on the high school basketball team. She has made 18 of her last 30 free throws.
algebraic: Students write a function to model Liz's percentage if she makes "x" more
consecutive free throws. Answer:
tabular: Students make a table showing the relationship between the number of free throws made and the number shot.
graphical : Students use a graphing calculator to make a scatter plot of the data on a graph and
compare the graph of the data to the graph of the original function,
TEXTEAMS Algebra II/Precalculus Institute: Activity Force and gravity. PH Chap. 8 Resource pro and manipulative kit. Math TEKS toolkit www.tenet.edu/teks/math
Assessment Classroom TAKS/Other Assessments
Teacher observation. PH Computer Item Generator
PH Standardized Test Prep Performance Assessment by TEKS go to: www.mathbenchmarks.org
Additional Support Pre - AP enrichment/extension Other
PH. Chapter 8 project. Under pressure. Differentiate between logistic and rational functions.
NCTM. Standard 1,2,3,4,5,6,7,8,13
155

Mathematics Instructional Alignment Chart
Student Expectations Fourth Three Weeks
TEKS # e.3 Grade Level: 9th-12th
Algebra I Algebra II Pre-Calculus c3C. For given contexts, the student interprets and determines the reasonableness of solutions to linear equations and inequalities
e.3 Determines the reasonable domain and range values of rational functions, as well as interprets and determines the reasonableness and solutions to rational equations and inequalities.
4.A Use sequences and series to represent, analyze, and solve problems.
Specific Student Expectations
TLW. Check the solutions of rational functions by substitution to determine if they are reasonable. TLW. Select from several graphs to find a reasonable answer to rational functions and/or use calculator technology to help in the process.
Instruction Strategies Resources
Cooperative Learning Activity, use graphing calculator Students formulate a rational function for a problem similar to the following one and determine a reasonable domain and range.
Liz plays basketball on the high school basketball team. She has made 18 of her last 30 free throws. Write a function to model her percentage if she makes "x" more consecutive free throws. Describe the domain and range for your new function.
(formulating a rational function):
(determining reasonable values for domain):
Since the domain represents the number of free throws, the values of the domain must be positive integers.
(Determining reasonable values for range):
Since the range represents the percentage of her free throws after completing 18 out of 30, the
values of the range must be positive and must be greater than .
(determining reasonableness of solutions):
Will Liz's free throw percentage ever be less than 50%? Will it ever be equal to 100%? Why or why not?
TEXTEAMS Algebra II/Precalculus Institute: Activity 2.1 Seeing too much. PH Chap. 8 Resource pro and manipulative kit. Math TEKS toolkit www.tenet.edu/teks/math
Assessment Classroom TAKS/Other Assessments
Teacher observation. PH Computer Item Generator
PH Standardized Test Prep Performance Assessment by TEKS go to: www.mathbenchmarks.org
Additional Support Pre - AP enrichment/extension Other
NCTM. Standard 1,2,3,4,5,6,7,8,13
156

Investigate domain, range, and end behavior of rational quadratic functions
Mathematics Instructional Alignment Chart Student Expectations Fourth Three Weeks
TEKS # e.4 Grade Level: 9th-12th
Algebra I Algebra II Pre-Calculus c4B. The student investigates methods for solving linear equations and inequalities using concrete models, graphs, and the properties of equality, selects a method, and solve the equations and inequalities.
e.4 Solves rational equations and inequalities using graphs, tables, and algebraic methods.
3.D. Use trigonometry to solve problems from physical situations.
Specific Student Expectations
TLW solve linear equations and inequalities using concrete models. TLW solve linear equations and inequalities using graphs. TLW solve linear equations and inequalities using the properties of equality.
Instruction Strategies Resources
Cooperative Learning Activity Use graphing calculator A sample of an activity can be found on the next page.
TEXTEAMS Algebra II/Precalculus Institute: Activity 1.2 Can problem. PH Chap. 8 Resource pro and manipulative kit. Math TEKS toolkit www.tenet.edu/teks/math
Assessment Classroom TAKS/Other Assessments
Teacher observation. PH Computer Item Generator
PH Standardized Test Prep Performance Assessment by TEKS go to: www.mathbenchmarks.org
Additional Support Pre - AP enrichment/extension Other
This TEKS is developed throughout the Algebra II curriculum. Symbolic manipulation is a major component of Algebra II, and PreAP students should have many meaningful opportunities to practice these skills.
NCTM. Standard 1,2,3,4,5,6,7,8,13
157

e.4 Solves rational equations and inequalities using graphs, tables, and algebraic methods.
Partway through a course, S has earned 130 points out of a possible 325.
1. If there are going to be 175 more points that can be earned, what is S's highest possible percentage?
If S earns all 175 points, the percentage will be (100) ( ) = 61%.
2. If there are going to be 275 more points that can be earned, what is S's highest possible percentage?
If S earns all 275 points, the percentage will be (100) ( ) = 67.5%.
3. In general, suppose there are going to be x more points that can be earned. Express the highest possible percentage P(x) in terms of x and graph this relationship.
If S earns all x points, the percentage will be P(x) = (100) ( ). See Question 4 for the graph.
4. How many more points must be available if S is to be able to get a final score of 80%? Answer this question both using algebra and from a graph.
If x more points are available, and if S earns x points, the percentage will be P(x) = (100) ( ). Setting
this equal to 80% gives the equation (100) ( ) = 80. Solving this equation for x gives x = 650.
The graph of P(x) from Question 3 is below. The lines show that a percentage of 80% requires 650 more points, in accords with the solution just obtained.
158

Mathematics Instructional Alignment Chart Student Expectations Fourth Three Weeks
TEKS # e.5 Grade Level: 9th-12th
Algebra I Algebra II Pre-Calculus b.1.C. represent, interpret, and make inferences from functional relationship.
e.5 Analyzes a situation model by rational function, formulates equation or inequality composed of linear quadratic function, and solve a problem.
N/A
Specific Student Expectations
TLW. Analyze a situation model by rational function, formulate equation or inequality composed of linear quadratic function, and solve a problem.
Instruction Strategies Resources
Cooperative Learning Activity, use graphing calculator Students formulate a rational equation for a problem similar to the following one and determine a solution.
Liz plays basketball on the high school basketball team. She has made 18 of her last 30 free throws. How many consecutive free throws does she need to make to raise her percentage to 75%?
(formulating a rational equation):
(Using the method of their choice, students should find the solution to be 18 more free throws.)
PH Chap. 8 Resource pro and manipulative kit. Math TEKS toolkit www.tenet.edu/teks/math
Assessment Classroom TAKS/Other Assessments
Teacher observation. PH Computer Item Generator
PH Standardized Test Prep Performance Assessment by TEKS go to: www.mathbenchmarks.org
Additional Support Pre - AP enrichment/extension Other
e.g. The City of Katy, Texas wants to enclose a 3000 square foot rectangular region as a park. The city plans to build a brick fence along 3 sides of the park that will cost $25 per linear foot. A wooden fence that will cost $10 per linear foot will enclose the fourth side of the park. Find the minimum cost of the fence. Note: This relates to the calculus concept of optimization.
NCTM. Standard 1,2,3,4,5,6,7,8,13
159

Mathematics Instructional Alignment Chart Student Expectations Fourth Three Weeks
TEKS # e.6 Grade Level: 9th-12th
Algebra I Algebra II Pre-Calculus c2G. The student relates direct variation to linear functions and solve problems involving proportional change.
e.6 Use direct and inverse variation models.
N/A
Specific Student Expectations
TLW relate direct variation to linear functions (vocabulary, direct variation, y = kx). TLW compare the contrast with the slope of linear equation. TLW solve problems involving proportional change. TLW analyze tables to see if the rate of change is proportional.
Instruction Strategies Resources
Cooperative Learning Activity, use graphing calculator Students solve direct and inverse variation problems similar to the following ones:
(direct variation)
The amount of chlorine needed varies directly as the size of the pool. If 5 units of chlorine is the amount needed for 550 gallons of water, write a function representing the amount of chlorine needed for "x" gallons of water. Predict the amount of chlorine needed for 850 gallons of water.
(indirect variation)
The equation ,
models the amount of light "E" provided by a 50 watt light bulb, where E
(measured in lux) depends on the distance "d" meters from the bulb (for d 1 meter). Find the amount of light on a desk 3 meters away from the light source. (about 6 lux)
PH Chap. 2, 8. Resource pro and manipulative kit Math TEKS toolkit www.tenet.edu/teks/math
Assessment Classroom TAKS/Other Assessments
Teacher observation. PH Computer Item Generator
PH Standardized Test Prep Performance Assessment by TEKS go to: www.mathbenchmarks.org
Additional Support Pre - AP enrichment/extension Other
This TEKS is developed throughout the Algebra II curriculum. Symbolic manipulation is a major component of Algebra II, and PreAP students should have many meaningful opportunities to practice these skills.
NCTM. Standard 1,2,3,4,5,6,7,8,13
160

161
ALGEBRA II COURSE SCOPE AND SEQUENCE
Introduced
Maintained
GRADING PERIOD TEKS Page
STUDENT EXPECTATIONS
RESOURCES First
3 Weeks
Second 3
Weeks
Third 3
Weeks
Fourth 3
Weeks
Fifth 3
weeks
Sixth 3
Weeks c2(A)
Page 162 The student describes a conic section as the intersection of a plane and a cone.
PH Ch. 10
c2(B)
Page 163
In order to sketch graphs of conic sections, the student relates simple parameter changes in the equation to corresponding changes in the graph.
PH Ch. 10
c2(C) Page 164
The student identifies symmetries from graphs of conic sections.
PH Ch. 10
c2(D)
Page 165 The student identifies the conic section from a given equation.
PH Ch. 10 c2(E)
Page 166 The student uses the method of completing the square.
PH Ch. 5, 10
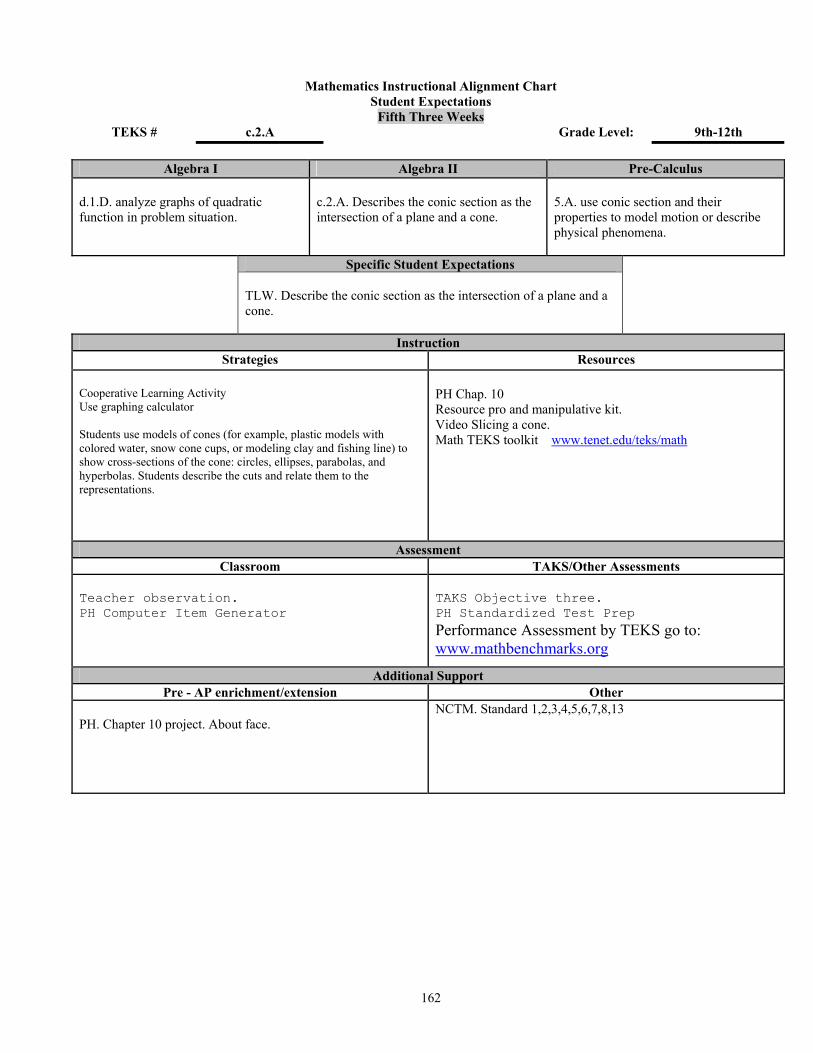
162
Mathematics Instructional Alignment Chart
Student Expectations Fifth Three Weeks
TEKS # c.2.A Grade Level: 9th-12th
Algebra I Algebra II Pre-Calculus d.1.D. analyze graphs of quadratic function in problem situation.
c.2.A. Describes the conic section as the intersection of a plane and a cone.
5.A. use conic section and their properties to model motion or describe physical phenomena.
Specific Student Expectations
TLW. Describe the conic section as the intersection of a plane and a cone.
Instruction Strategies Resources
Cooperative Learning Activity Use graphing calculator Students use models of cones (for example, plastic models with colored water, snow cone cups, or modeling clay and fishing line) to show cross-sections of the cone: circles, ellipses, parabolas, and hyperbolas. Students describe the cuts and relate them to the representations.
PH Chap. 10 Resource pro and manipulative kit. Video Slicing a cone. Math TEKS toolkit www.tenet.edu/teks/math
Assessment Classroom TAKS/Other Assessments
Teacher observation. PH Computer Item Generator
TAKS Objective three. PH Standardized Test Prep Performance Assessment by TEKS go to: www.mathbenchmarks.org
Additional Support Pre - AP enrichment/extension Other
PH. Chapter 10 project. About face.
NCTM. Standard 1,2,3,4,5,6,7,8,13

163
Mathematics Instructional Alignment Chart
Student Expectations Fifth Three Weeks
TEKS # c.2.B Grade Level: 9th-12th
Algebra I Algebra II Pre-Calculus c.2.D. Graph and write equations of lines given points, slopes, and or intercepts.
c.2.B. Relates simple parameter changes in equation to corresponding changes in the graph.
2.C. Investigate identities graphically and verify them symbolically.
Specific Student Expectations
TLW. Relate simple parameter changes in equation to corresponding changes in the graph.
Instruction Strategies Resources
Cooperative Learning Activity, use graphing calculator
Students graph the following equations of circles on graph paper, or using a graphing utility, and complete the table.
equation center of circle radius x2 + y2 = 16
(x - 3)2 + y2 = 25
(x + 2)2 + ( y - 4)2 = 9
( x - 1)2 + ( y + 3)2 = 36
( x - h )2 + ( y - k )2 = r2
Students fill in a similar chart for other conics and make generalization statements about how parameter changes in the equations change the graphs.
PH Chap. 10. Resource pro and manipulative kit Math TEKS toolkit www.tenet.edu/teks/math
Assessment Classroom TAKS/Other Assessments
Teacher observation. PH Computer Item Generator
TAKS Objective three PH Standardized Test Prep Performance Assessment by TEKS go to: www.mathbenchmarks.org
Additional Support Pre - AP enrichment/extension Other
This TEKS is developed throughout the Algebra II curriculum. Graphic manipulation is a major component of Algebra II, and PreAP students should have many meaningful opportunities to practice these skills.
NCTM. Standard 1,2,3,4,5,6,7,8,13

Mathematics Instructional Alignment Chart
Student Expectations Fifth Three Weeks
TEKS # c.2.C Grade Level: 9th-12th
Algebra I Algebra II Pre-Calculus d.1.D. analyze graphs of quadratic function in problem situation.
c.2.C. Identifies symmetries from graphs of conic sections.
5.A. use conic section and their properties to model motion or describe physical phenomena.
Specific Student Expectations
TLW. Identify symmetries from graphs of conic sections.
Instruction Strategies Resources
Cooperative Learning Activity, use graphing calculator Students use the symmetry of a conic to help them make its graph. By knowing that the point ( 1, 2.9 ) is on the graph of an ellipse centered at the origin, students use their knowledge of symmetry of an ellipse to find three other points on the ellipse.
Solutions: (1, 2.9); (-1, 2.9); (1, -2.9); (-1, -2.9)
PH Chap. 10. Resource pro and manipulative kit Math TEKS toolkit www.tenet.edu/teks/math
Assessment Classroom TAKS/Other Assessments
Teacher observation. PH Computer Item Generator
TAKS Objective three PH Standardized Test Prep Performance Assessment by TEKS go to: www.mathbenchmarks.org
Additional Support Pre - AP enrichment/extension Other
This TEKS is developed throughout the Algebra II curriculum. Graphic manipulation is a major component of Algebra II, and PreAP students should have many meaningful opportunities to practice these skills.
NCTM. Standard 1,2,3,4,5,6,7,8,13
164

165
Mathematics Instructional Alignment Chart Student Expectations
Fifth Three Weeks TEKS # c.2.D Grade Level: 9th-12th
Algebra I Algebra II Pre-Calculus d.1.D. analyze graphs of quadratic function in problem situation.
c.2.D. Identifies the conic sections from a given equation.
5.A. use conic section and their properties to model motion or describe physical phenomena.
Specific Student Expectations
TLW. Identify the conic sections from a given equation
Instruction Strategies Resources
Cooperative Learning Activity, use graphing calculator From several examples of various conics in both graph and equation form, students look for patterns and create rules to describe types of equations using characteristics of the general form of a quadratic (conic): Ax2 + Bxy + Cy2 + Dx + Ey + F = 0. (NOTE: In Algebra II, the quadratics used always have B= 0, so there is no xy term.) For example:
For a circle: A = C
For a parabola: Either A or C equals zero, but not both.
For a non-circular ellipse: A C, but they have the same sign.
For a hyperbola: A and C have opposite signs.
After creating a rule, students test their rule with other examples.
PH Chap. 10. Resource pro and manipulative kit Math TEKS toolkit www.tenet.edu/teks/math
Assessment Classroom TAKS/Other Assessments
Teacher observation. PH Computer Item Generator
TAKS Objective three PH Standardized Test Prep Performance Assessment by TEKS go to: www.mathbenchmarks.org
Additional Support Pre - AP enrichment/extension Other
This TEKS is developed throughout the Algebra II curriculum. Graphic manipulation is a major component of Algebra II, and PreAP students should have many meaningful opportunities to practice these skills.
NCTM. Standard 1,2,3,4,5,6,7,8,13

Mathematics Instructional Alignment Chart Student Expectations
Fifth Three Weeks TEKS # c.2. E. Grade Level: 9th-12th
Algebra I Algebra II Pre-Calculus d.2.A. solve quadratic equations using concrete model, tables, graphs, and algebraic method.
c.2.E. Uses the method of completing the square.
N/A
Specific Student Expectations
TLW. Use the method of completing the square. TLW. Use the method of completing the square to solve quadratic equations. TLW. Use the method of completing the square to find the coordinates of the vertices of conic sections.
Instruction Strategies Resources
Cooperative Learning Activity, use graphing calculator For a simple situation, students model the process of completing the square. For example, to complete the square for the expression x2 + ax , students create a model like the one below to show that a term of (a/2)2 must be added.
PH Chap. 5, 10. Resource pro and manipulative kit Math TEKS toolkit www.tenet.edu/teks/math
Assessment Classroom TAKS/Other Assessments
Teacher observation. PH Computer Item Generator
TAKS Objective three. PH Standardized Test Prep Performance Assessment by TEKS go to: www.mathbenchmarks.org
Additional Support Pre - AP enrichment/extension Other
Use the method of completing the square to find the coordinates of the vertices of conic sections.
NCTM. Standard 1,2,3,4,5,6,7,8,13
166

167
ALGEBRA II COURSE SCOPE AND SEQUENCE
GRADING PERIOD
TEKS Page
STUDENT EXPECTATIONS
RESOURCES First
3 Weeks
Second 3
Weeks
Third 3
Weeks
Fourth 3
Weeks
Fifth 3
weeks
Sixth 3
Weeks
c1(A)
Page 168
The student identifies and sketches graphs of parent functions, including inverse (y = 1/x), exponential (y = ax), and logarithmic ( y = logax) functions.
PH Ch. 7, 10
f(1)
Page 170
The student develops the definition of logarithms by exploring and describing the relationships between exponential functions and their inverses.
PH Ch. 7
RWM Activity
f(2) Page 172
The student uses the parent functions to investigate, describe, and predict the effects of parameter changes on the graphs of exponential and logarithmic functions, describes limitations on the domains and ranges, and examines asymptotic behavior.
PH Ch. 7
f(3) Page 174
For given contexts, the student determines the reasonable domain and range values of exponential and logarithmic functions, as well as interprets and determines the reasonableness of solutions to exponential and logarithmic equations and inequalities.
PH Ch. 7
f(4)
Page 175
The student solves exponential and logarithmic equations and inequalities using graphs, tables, and algebraic methods.
PH Ch. 7
f(5)
Page 176
The student analyzes a situation modeled by an exponential function, formulates an equation or inequality, and solves the problem.
PH Ch. 7
Introduced
Maintained

Mathematics Instructional Alignment Chart Student Expectations Sixth Three Weeks
TEKS # c.1.A Grade Level: 9th-12th
Algebra I Algebra II Pre-Calculus b.2.A. . Identifies and sketches graphs of parent functions, y = x, y = x 2
c.1.A. Identifies and sketches graphs of parent functions, including inverse
(y = x1
x1
), exponential(y = a X ), and
logarithmic( y = log a x ) functions.
2.A. describe parent functions symbolically and graphically.
Specific Student Expectations
TLW. Identify and sketch graphs of parent functions, including inverse
(y = ), exponential(y = a X ), and logarithmic( y = log a x ) functions.
Instruction Strategies Resources
Cooperative Learning Activity, use Graphing Calculator.- A sample of an activity can be found on the next page.
TEXTEAMS Algebra II/Precalculus Institute: Activity II. 3.1 Comparing Exponential and Power Functions Activity I. 2.1 Applications 3.1 Mira Reflections 3.2 Inverses with Parametric Equations 4.1 How Many Ways Can You Solve It/ 4.2 Stays the Same PH Chap. 7,10 Resource pro and manipulative kit Math TEKS toolkit www.tenet.edu/teks/math
Assessment Classroom TAKS/Other Assessments
Teacher observation. PH Computer Item Generator
TAKS Objective 3 PH Standardized Test Prep. Performance Assessment by TEKS go to: www.mathbenchmarks.org
Additional Support Pre - AP enrichment/extension Other
Transformation of Conic sections Discuss eccentricity PH Chapter 7 Project – Aging Artifacts PH Chapter 10 Project – About Face.
NCTM. Standard 1,2,3,4,5,6,7,8,13
168

x1
c.1.A. Identifies and sketches graphs of parent functions, including inverse (y = ), exponential(y = a X ),
and logarithmic( y = log a x ) functions.
Students identify and sketch the parent functions listed below as they learn them. (By the end of the course students should be able to complete the chart below.)
function identify sketch written description of graph y = x y = x2
y = 1/x y = 2x
y = log2 x
Students also connect each parent function with its inverse function in the chart. The inverses of two of the functions ( y = x and y = 1/x ) are the functions themselves.
Function Inverse y = x y = x
y = x2 y = 1/x y = 1/x y = 2x y = log2 x
y = log2 x y = 2x
Note: It is not clear in the case of y = ax what the parent function is. We have chosen to use y = 2x but one might want to investigate y = 10 x or y = (1/2) x .
169

Mathematics Instructional Alignment Chart
170
Student Expectations Sixth Three Weeks
TEKS # f.1 Grade Level: 9th-12th
Algebra I Algebra II Pre-Calculus b4 The student understands the importance of the skills required to manipulate symbols in order to solve problems and uses the necessary algebraic skill required to simplify algebraic expressions and solve equations and inequalities in problem situations.
f.1 Develops the definitions of logarithms by exploring and describing the relationship between exponential functions and their inverses.
2.B. Perform operations on and find inverses of functions.
Specific Student Expectations
TLW. Develop the definitions of logarithms by exploring and describing the relationship between exponential functions and their inverses.
Instruction Strategies Resources
Cooperative Learning Activity. Use Graphing Calculator. A sample of an activity can be found on the next page.
PH Chap. 7 RWM Activity – Cool It Resource pro and manipulative kit. Math TEKS toolkit www.tenet.edu/teks/math
Assessment Classroom TAKS/Other Assessments
Teacher observation. PH Computer Item Generator
PH Standardized Test Prep. Performance Assessment by TEKS go to: www.mathbenchmarks.org
Additional Support Pre - AP enrichment/extension Other
e.g. Let f be the function given by f(x) = 2xe2x. Use your graphing calculator to: ♦ Find all horizontal asymptotes of f(x) ♦ Locate the absolute minimum value of f ♦ Determine the domain and range of f Examine the family of functions defined by y = bxeex where b is a nonzero constant. What do all the these graphs have in common? Why? Note: This problem is based on the 1998 AB/BC2 AP Cal Exam. This is a good problem to tackle as a class. Every student can be assigned a different value of b.
NCTM. Standard 1,2,3,4,5,6,7,8,13

f.1 Develops the definitions of logarithms by exploring and describing the relationship between exponential functions and their inverses. Students work through an activity like the following one to see the mathematical relationship between exponential and logarithmic functions.
Students complete Table 1 for f(x) = 2x. Using blue ink, students graph the exponential function f(x) = 2x by plotting the Table 1 values. Then students reverse the coordinates in each ordered pair and enter them in Table 2. They plot these points in the same coordinate plane using red ink. Students plot the line y = x with pencil and study the relationships between the graphs.
Table 1
x f (x)
-2
-1
0
1
2
Table 2 x f (x)
Students need to note that the two graphs above are inverse functions. One graph is a reflection of the other across the line y = x .
Students need to know that the inverse of, the exponential function with base 2, is called the logarithmic function with base 2.
f(x) = 2x f -1(x) = log2x log2x is read "the base 2 logarithm of x" or "log base 2 of x."
Students find the value of each log:
Exponential Form Logarithmic Form
2x = 8 means log28 =____
2x = 16 means log216 =____
2x = 1 means log21 =____
2x = 1/2 means log2(1/2) =____
2x = N means log2N =____
Students recognize that the base can be any positive number except 1 (because 1 = 1 --- any power of 1 is 1).
Students connect their exploration to the following definition:
Definition of Logarithm
If b and N are positive numbers ( b 1),
logbN = k if and only if bk = N.
171
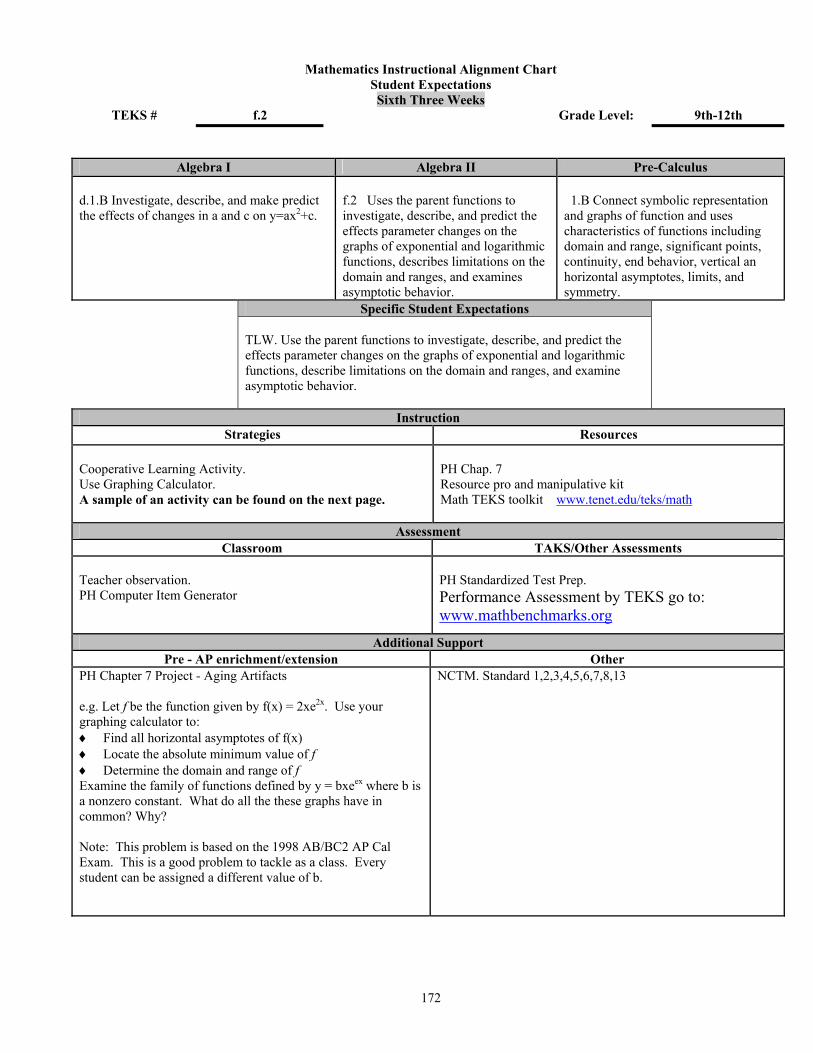
172
Mathematics Instructional Alignment Chart Student Expectations Sixth Three Weeks
TEKS # f.2 Grade Level: 9th-12th
Algebra I Algebra II Pre-Calculus d.1.B Investigate, describe, and make predict the effects of changes in a and c on y=ax2+c.
f.2 Uses the parent functions to investigate, describe, and predict the effects parameter changes on the graphs of exponential and logarithmic functions, describes limitations on the domain and ranges, and examines asymptotic behavior.
1.B Connect symbolic representation and graphs of function and uses characteristics of functions including domain and range, significant points, continuity, end behavior, vertical an horizontal asymptotes, limits, and symmetry.
Specific Student Expectations
TLW. Use the parent functions to investigate, describe, and predict the effects parameter changes on the graphs of exponential and logarithmic functions, describe limitations on the domain and ranges, and examine asymptotic behavior.
Instruction Strategies Resources
Cooperative Learning Activity. Use Graphing Calculator. A sample of an activity can be found on the next page.
PH Chap. 7 Resource pro and manipulative kit Math TEKS toolkit www.tenet.edu/teks/math
Assessment Classroom TAKS/Other Assessments
Teacher observation. PH Computer Item Generator
PH Standardized Test Prep. Performance Assessment by TEKS go to: www.mathbenchmarks.org
Additional Support Pre - AP enrichment/extension Other
PH Chapter 7 Project - Aging Artifacts e.g. Let f be the function given by f(x) = 2xe2x. Use your graphing calculator to: ♦ Find all horizontal asymptotes of f(x) ♦ Locate the absolute minimum value of f ♦ Determine the domain and range of f Examine the family of functions defined by y = bxeex where b is a nonzero constant. What do all the these graphs have in common? Why? Note: This problem is based on the 1998 AB/BC2 AP Cal Exam. This is a good problem to tackle as a class. Every student can be assigned a different value of b.
NCTM. Standard 1,2,3,4,5,6,7,8,13

173
f.2 Uses the parent functions to investigate, describe, and predict the effects parameter changes on the graphs of exponential and logarithmic functions, describes limitations on the domain and ranges, and examines asymptotic behavior.
Students investigate and describe the effects of changes in "h" and "k" in the equation y = bx-h + k . For example, students use graphing calculators to investigate the following functions. Students then complete the following chart and discuss how changes in "h" affect the graph of y= bx - h .
equation describe the change domain range y=2x
y=2x-3
y=2x+3
Students answer the following question:
How does changing the value of "h" in y = 2x-h affect the parent function y = 2x ?
Students use graphing calculators to investigate the following functions. Students then complete the following chart and discuss how changes in "k" affect the graph of y = bx + k.
equation describe the change domain range y = 2x
y = 2x + 3
y = 2x - 3
Students answer the following question:
How does changing the value of "k" in y = 2x + k affect the parent function y = bx + k ?
Given a function, students predict the effects of changes on the parent function. For example, students predict the changes to the parent function that occur in the following functions:
(1) y = 2x+4 + 1 (The parent function is shifted left 4 units and up 1unit.)
(2) y = 2x-6 - 2 (The parent function is shifted right 6 units and down 2 units.)
Students complete tables like the one below to investigate asymptotic behavior.
x f (x) = 2x+4 + 1
-10
-50
-100
-500
-1,000
As x approaches negative infinity, f(x) approaches ______________.
Students use a similar approach to investigate changes in the parameters and asymptotic behavior of a logarithmic function.

Mathematics Instructional Alignment Chart Student Expectations Sixth Three Weeks
TEKS # f.3 Grade Level: 9th-12th
Algebra I Algebra II Pre-Calculus b.2.B For given contexts, the student interprets and determines the reasonableness of solutions to linear equations and inequalities
f.3 Determines the reasonable domain and range values of exponential and logarithmic functions, as well as interprets and determines the reasonableness and solutions to exponential and logarithmic equations.
3.A. Use functions and their properties to model, analyze, solve problems and make predictions.
Specific Student Expectations
TLW. Determine the reasonable domain and range values of exponential and logarithmic functions, as well as interpret and determine the reasonableness and solutions to exponential and logarithmic equations.
Instruction Strategies Resources
Cooperative Learning Activity, use Graphing Calculator. Students formulate an exponential function for a problem similar to the following one and determine a reasonable domain and range.
The NCAA holds a championship basketball game each spring. The nation's top 64 teams in Division 1 are invited to play. When a team loses, it is out of the tournament. Describe the domain and range for a function that determines the number of teams left in the tournament f(x) after round "x":
(determining reasonable values for domain):
Since the domain represents the round, the values of the domain must be positive integers.
(determining reasonable values for range):
Since the range represents the number of teams left in the tournament, the values of the range must be positive even integers less than 64.
TEXTEAMS Algebra II/Precalculus Institute: Activity II. 2.1 The Energy of Earthquakes PH Chap. 7 Resource pro and manipulative kit Math TEKS toolkit www.tenet.edu/teks/math
Assessment Classroom TAKS/Other Assessments
Teacher observation. PH Computer Item Generator
PH Standardized Test Prep. Performance Assessment by TEKS go to: www.mathbenchmarks.org
Additional Support Pre - AP enrichment/extension Other
PH Chapter 7 Project-Aging Artifacts e.g. Let f be the function given by f(x) = 2xe2x. Use your graphing calculator to: ♦ Find all horizontal asymptotes of f(x) ♦ Locate the absolute minimum value of f ♦ Determine the domain and range of f Examine the family of functions defined by y = bxeex where b is a nonzero constant. What do all the these graphs have in common? Why? Note: This problem is based on the 1998 AB/BC2 AP Cal Exam. This is a good problem to tackle as a class. Every student can be assigned a different value of b.
NCTM. Standard 1,2,3,4,5,6,7,8,13
174
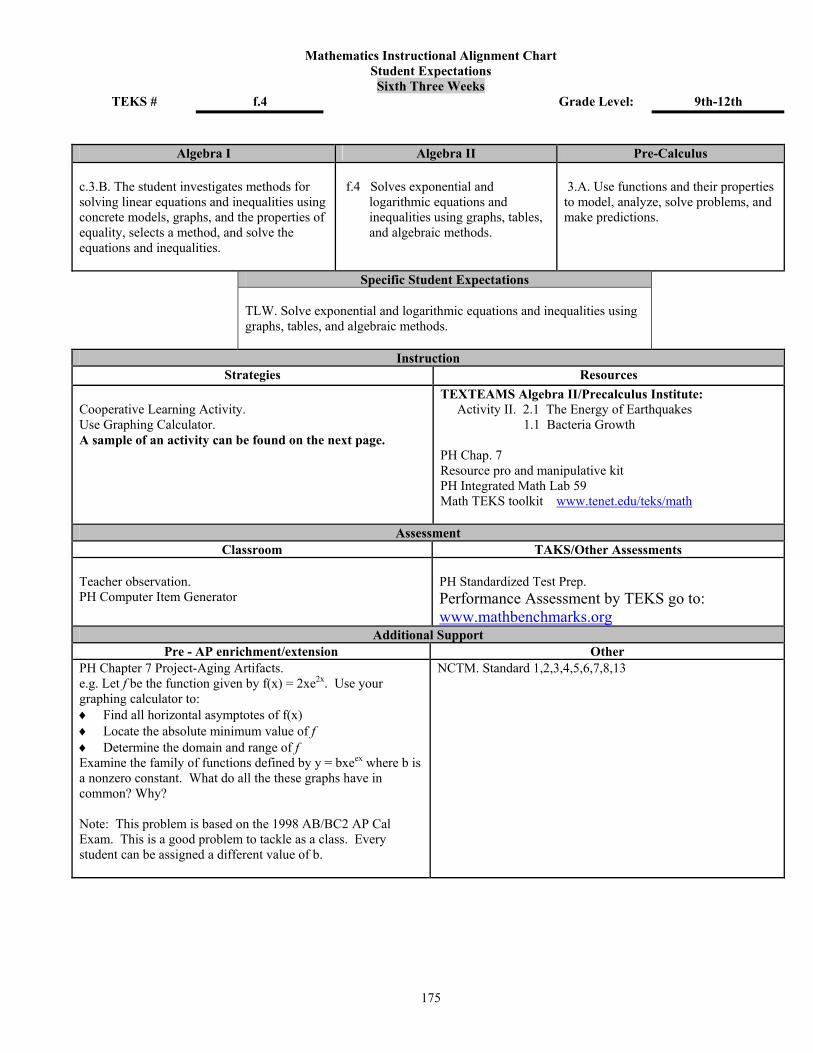
Mathematics Instructional Alignment Chart
175
Student Expectations Sixth Three Weeks
TEKS # f.4 Grade Level: 9th-12th
Algebra I Algebra II Pre-Calculus c.3.B. The student investigates methods for solving linear equations and inequalities using concrete models, graphs, and the properties of equality, selects a method, and solve the equations and inequalities.
f.4 Solves exponential and logarithmic equations and inequalities using graphs, tables, and algebraic methods.
3.A. Use functions and their properties to model, analyze, solve problems, and make predictions.
Specific Student Expectations
TLW. Solve exponential and logarithmic equations and inequalities using graphs, tables, and algebraic methods.
Instruction Strategies Resources
Cooperative Learning Activity. Use Graphing Calculator. A sample of an activity can be found on the next page.
TEXTEAMS Algebra II/Precalculus Institute: Activity II. 2.1 The Energy of Earthquakes 1.1 Bacteria Growth PH Chap. 7 Resource pro and manipulative kit PH Integrated Math Lab 59 Math TEKS toolkit www.tenet.edu/teks/math
Assessment Classroom TAKS/Other Assessments
Teacher observation. PH Computer Item Generator
PH Standardized Test Prep. Performance Assessment by TEKS go to: www.mathbenchmarks.org
Additional Support Pre - AP enrichment/extension Other
PH Chapter 7 Project-Aging Artifacts. e.g. Let f be the function given by f(x) = 2xe2x. Use your graphing calculator to: ♦ Find all horizontal asymptotes of f(x) ♦ Locate the absolute minimum value of f ♦ Determine the domain and range of f Examine the family of functions defined by y = bxeex where b is a nonzero constant. What do all the these graphs have in common? Why? Note: This problem is based on the 1998 AB/BC2 AP Cal Exam. This is a good problem to tackle as a class. Every student can be assigned a different value of b.
NCTM. Standard 1,2,3,4,5,6,7,8,13

f.4 Solves exponential and logarithmic equations and inequalities using graphs, tables, and algebraic methods.
Students use a variety of ways to solve exponential and logarithmic equations.
Example: 252x = 5x+6
(graphing):
Students use a graphing calculator to graph simultaneously the functions Y1 = 252x and Y2 = 5x+6 . Students trace to find the point of intersection of the two functions. (Some calculators allow students to calculate a point of intersection, use a table feature to locate a point of intersection, or solve by other methods.)
(algebraic):
252x = 5x+6
54x = 5x+6
So, 4x = x + 6 and x = 2.
Example: 3x = 30
(graphing):
Students use a graphing calculator to graph simultaneously the functions Y1 = 3xand Y2 = 30 . Students trace to find the point of intersection of the two functions. (Some calculators allow students to calculate a point of intersection, use a table feature to locate a point of intersection, or solve by other methods.
(algebraic)
3x = 30
log 3x = log 30
xlog3 = log 30
x 3.096
176

177
Mathematics Instructional Alignment Chart Student Expectations Sixth Three Weeks
TEKS # f.5 Grade Level: 9th-12th
Algebra I Algebra II Pre-Calculus b.1.C Formulates equations, inequalities, or systems to solve problems modeled by linear equations.
f.5 Analyzes situations modeled by an exponential function, formulates an equation or inequality, and solves a problem.
3.B. Use regression to determine functions to model situations.
Specific Student Expectations
TLW. Analyze situations modeled by an exponential function, formulate an equation or inequality, and solve a problem.
Instruction Strategies Resources
Cooperative Learning Activity. Use Graphing Calculator. A sample of an activity can be found on the next page.
TEXTEAMS Algebra II/Precalculus Institute: Activity II. 1.1 Bacteria Growth PH Chap. 7 Resource pro and manipulative kit. Math TEKS toolkit www.tenet.edu/teks/math
Assessment Classroom TAKS/Other Assessments
Teacher Observation. PH Computer Item Generator
PH Standardized Test Prep. Performance Assessment by TEKS go to: www.mathbenchmarks.org
Additional Support Pre - AP enrichment/extension Other
PH Chapter 7 Project- Aging Artifacts The rate of consumption of cola in the United States is given by S(t) = Cekt, where S is measured in billions of gallons per year and t is measured in years from the beginning of 1980. ♦ The consumption rate doubles every 5 years and the
consumption rate at the beginning of 1980 was 6 billion gallons per year. Find C and k.
♦ When did the consumption surpass 50 billion gallons per year?
Note: This question is based on the 1996 AB/BC3 AP Cal Exam.
NCTM. Standard 1,2,3,4,5,6,7,8,13

178
f.5 Analyzes situations modeled by an exponential function, formulates an equation or inequality, and solves a problem.
Students formulate exponential equations for problems similar to the following ones and determine solutions.
Example: The NCAA holds a championship basketball tournament each spring. The nation's top 64 teams in Division 1 are invited to play. When a team loses, it is out of the tournament. Determine the number of teams left in the tournament after Round 5 .
(formulating an exponential equation):
(Using the method of their choice, students should find the solution to be 2 teams.)
Example: A biologist is observing a strain of bacteria growing in a petri dish. The population of the bacteria increases exponentially over time. If the first bacterium took 1 hour to divide into two bacteria, how long will it take for 30 bacteria in the dish to grow to at least 1000?
(formulating an exponential equation):
p = 30 * 2t where t = hours and p = number of bacteria
(Using the method of their choice, students should find the solution for 1000 30 * 2t to be t 5.77. )