scms journal of indian management contents journal...and facilities to manufacture as well as to...
TRANSCRIPT

123456789012345678901234567890121234567890123456789012345678901212345678901234567890123456789012123456789012345678901234567890121234123456789012345678901234567890121234567890123456789012345678901212345678901234567890123456789012123456789012345678901234567890121234
SCMS JOURNAL OF INDIAN MANAGEMENT
C o n t e n t s
Volume 4 October - December 2007 Number 4
Indian Drug Scenario: Discovery and Development12 Pankaj M.Madhani
Business Research: Factorial Manova Israel D.
Norway Milieu: Cops’ Contentment Ronald J.Burke and
and Well-Being Aslaug Mikkelsen
US Panorama: Income Inequality William R.DiPietro
Efficiency Mapping through Sripirabaa B. and
Capacity Building Process Krishnaveni R.W
Weibull Deterioration and Sudhir K.Sahu and
Delay in Payments Gobinda Chandra Panda
Tourism: Inexhaustible Revenue SourceHory Sankar Mukerjee and
Vedha Balaji
Work-Force Indexation: Kerala SceneRajagopal N. and
Poornima Narayan R.
Six Sigma Process: Quality EnhancementGunmala Suri and
Puja Chhabra Sharma
Possession Most PrizedSeema Bhatt and
Mukesh Bhatt
Supply Chain Management Brig. Ashok Kumar M.C.
It’s Only Business! Satheesh Kumar T.N.
005- - 018
019- - 034
035- - 046
047- - 053
054- - 067
068- - 079
080- - 089
090- - 099
100- - 110
111- - 117
118- - 120
121- - 122
123456789012345678901234567890121234567890123456789012345678901212345678901234567890123456789012123456789012345678901234567890121234123456789012345678901234567890121234567890123456789012345678901212345678901234567890123456789012123456789012345678901234567890121234
123456789012345678901234567890121234567890123456789012345678901212345678901234567890123456789012123456789012345678901234567890121234123456789012345678901234567890121234567890123456789012345678901212345678901234567890123456789012123456789012345678901234567890121234
123456789012345678901234567890121234567890123456789012345678901212345678901234567890123456789012123456789012345678901234567890121234123456789012345678901234567890121234567890123456789012345678901212345678901234567890123456789012123456789012345678901234567890121234
123456789012345678901234567890121234567890123456789012345678901212345678901234567890123456789012123456789012345678901234567890121234123456789012345678901234567890121234567890123456789012345678901212345678901234567890123456789012123456789012345678901234567890121234
123456789012345678901234567890121234567890123456789012345678901212345678901234567890123456789012123456789012345678901234567890121234
123456789012345678901234567890121234567890123456789012345678901212345678901234567890123456789012123456789012345678901234567890121234
123456789012345678901234567890121234567890123456789012345678901212345678901234567890123456789012123456789012345678901234567890121234123456789012345678901234567890121234567890123456789012345678901212345678901234567890123456789012123456789012345678901234567890121234
123456789012345678901234567890121234567890123456789012345678901212345678901234567890123456789012123456789012345678901234567890121234123456789012345678901234567890121234567890123456789012345678901212345678901234567890123456789012123456789012345678901234567890121234
123456789012345678901234567890121234567890123456789012345678901212345678901234567890123456789012123456789012345678901234567890121234123456789012345678901234567890121234567890123456789012345678901212345678901234567890123456789012123456789012345678901234567890121234
123456789012345678901234567890121234567890123456789012345678901212345678901234567890123456789012123456789012345678901234567890121234123456789012345678901234567890121234567890123456789012345678901212345678901234567890123456789012123456789012345678901234567890121234
123456789012345678901234567890121234567890123456789012345678901212345678901234567890123456789012123456789012345678901234567890121234123456789012345678901234567890121234567890123456789012345678901212345678901234567890123456789012123456789012345678901234567890121234
Title of the Article Author Page No.

SCMS Journal of Indian Management, October-December , 2007. 2
A Quarterly Journal Published by SCMS-COCHIN
The Chairman speaks ...
At the outset, let me wish all our readers a more happy and prosperous 2008.
With this edition in your hand, SCMS Journal of Indian Management has now completed four years of
purposeful publication. I am sure all our readers will appreciate the steady improvements in
quality in content as well as production of the journal. We are uncompromising in our dedication
to continuously enhancing the quality of our journal.
The pharmaceutical industry in India is a success story. It has evolved from almost a non-existent
position to become a global leader in the production of high quality — low cost generic drugs,
which accounts for nearly 20 per cent of world’s production. It provides employment for nearly 75
million people while ensuring that essential drugs are made available at affordable prices to the
vast population. India has adequate resources in terms of manufacturing base, scientific manpower
and facilities to manufacture as well as to undertake research and development in bulk drugs.
Among the countries in Asia, India has the best chance to become a hub of R&D activities for
development of new drugs and formulations because of the advantages like vast patient population,
low cost, IT strength, skilled R&D workforce and favourable regulatory environment.
I am sure our readers will be interested to know more on this topical matter. The lead article in this
issue is a well-researched paper covering the Indian drug scenario with special reference to drug
discovery and development.
A variety of contemporary topics are dealt with in this issue, from business research to tourism.
We hope you find this issue worth the efforts put in.
Dr.G.P.C.NAYAR
Chairman - SCMS Group of Educational Institutions
A Quarterly Journal Published by SCMS-COCHIN
SCMS Journal of Indian Management, October-December , 2007. 3
SCMS Journal of Indian Management
A Quar ter ly Publ icat ion of
SCMS-COCHIN
Editor-in-Chief : Dr.G.P.C.NayarChairman
SCMS Group of Educational Institutions
Editor : Dr.D.Radhakrishnan NairProfessor, SCMS-COCHIN
Editorial Advisory Board
Dr.Subramanian Swamy : Professor, Har vard Univers i ty, Cambridge, MA , US.
Formerly Professor of Economics, IIT, Delhi.
Prof.Radha Thevannoor : Director, SCMS School of Technology and Management,
Kochi.
Dr.Thomas Steger : Professor of European Management, Chemnitz University
of Technology, Chemnitz, Germany.
Dr.Kishore G.Kulkarni : Professor, Metropolitan State College of Denver and
Editor - Indian Journal of Economics and Business,
Denver, US.
Dr.Naoyuki Yoshino : Professor of Economics, Keio University, Tokyo, Japan.
Dr.Mathew J.Manimala : Professor of Organ iza t ion Behav iour and Jamuna
Raghavan Chair Professor of Entrepreneurship at the
Indian Inst itute of Management, Bangalore.
Dr.Tapan K.Panda : Professor of Marketing, Indian Institute of Management,
Indore.
Dr.Azhar Kazmi : Professor, Depar tment of Management and Marketing, King
Fahd University of Petroleum & Minerals, Dhahran, Saudi
Arabia.
Dr.Jose Maria Cubillo-Pinilla : P r o f e s s o r, I n t e r n a t i o n a l M a r ke t i n g , Po l y t e c h n i c
Univers i ty of Madrid, Spain.
Dr.I.M.Pandey : Professor and Dean, Asian Institute of Technology, Klong
Luang, Pathumthani, Thailand.
Dr.George Sleeba : Chairman and Managing Director, The Fer ti l isers and
Chemicals Travancore L td. , (FACT) Udyogamandal ,
Kochi, Kerala.
Mr.Jiji Thomson IAS : Principal Secretary to Government of Kerala.

SCMS Journal of Indian Management, October-December , 2007. 4
A Quarterly Journal Published by SCMS-COCHIN
Editorial
Smell and ManagementThe sense of smell is critical for all: for finding food, for avoiding predators, or forchoosing mates. We can distinguish over ten thousand different odour molecules.Smell/odour is perfume/fragrance when it is pleasant. It’s stench /repugnant when itis unpleasant. We utilize our sense of smell to enjoy the aroma of fresh coffee, ordecide the person with whom to sit next on the bus.
Every time we inhale, currents of air swirl up through the nostrils, over the bony turbinatesto millions of olfactory receptor neurons. The interaction of the right molecule with theright receptor causes the receptor to change its shape (structural conformation). Thischange in structural conformation gives rise to an electrical signal that goes to the
olfactory bulb, then to the brain that converts the electrical signal to a smell. Yes, people interact with theenvironment through the senses.
Smell or effluvia is considered from the chemical, physical, and physiological points of view. It is interestingto note how odours may affect cognitive performance. In business, the idea that the sense of smell can havestrong effects on consumer responses to retail environments is well made use of. The claims, that theodours have strong persuasive powers, tantalize retailers looking for the competitive edge. A lot of retailingrelevant olfaction research is going on throughout the world.
Some Software company one day may announce a radical breakthrough in Computer Scent Technology.The Internet will come to its “senses.” Now, you can already chat, email, download music and watch videothrough the internet, but imagine you are able to smell fresh seaside air from the heart of the city, or savourthe smell of your favourite restaurant’s cuisine while booking a table. Digital Scent Technology can alsochange the interactive entertainment experience to movies, games, music, animation, or any digital media.
Anthropology of odour has been instrumental to establishment of many industries. It’s interesting to learnhow cultures rely on fragrance for healing, communication and hunting. The effect of odoriferous plants onthe annual economy of nations is a subject matter worth study. The scent of lavender and jasmine enhancesleep. Earlier studies investigating the effects of aroma on sleep found a tendency for the scents to disruptsleep. It can contribute to enjoyment of life through the perception of pleasant odours such as perfume,food and flowers.
Flavour and fragrance industry leaders have “telling” tales of over175 industries on the prospects in the field. The cosmetic/beauty storeindustry comprises 10,000 stores with combined annual income ofabout $7 million. The industry is labour-intensive with average annualrevenue per worker being $85000. Stenchy trash can also becomecrowning resource for industry. Trafficking in toxic waste is also anotherarea of interest of the world. Products of environmental solutions forchemically-free water treatments, air-conditioners, water conditionersand water softeners are of high demand in the markets. Anyhow
“Smell” will open up umpteen avenues for business activities.
Dr.D.Radhakrishnan Nair
Editorial Assistant: Mr.E.V.Johnson Assistant Editor: Dr.Susan Chirayath

A Quarterly Journal Published by SCMS-COCHIN
SCMS Journal of Indian Management, October-December , 2007. 5
Indian Drug Scenario:Discovery and Development
Pankaj M.Madhani
T
This paper focuses on major issues of drug discovery and development. Developing a
new drug and taking it to market is a long and costly process. The industry focus is shifted
toward developing the right drug for the right patient in the shortest time at the least cost.
Emerging trend in pharma industry is to outsource clinical trials to emerging markets. The
clinical trial is the most expensive stage of drug development and accounts for about sixty
per cent of total costs. Paper underscores India’s major strengths in clinical trials. India has
tremendous potentials to become ultimate destination for drug development.
P ro f . Panka j M .Madhan i , Facu l t y , I C FA I Bus i nes s
S c h o o l , I C FA I H o u s e , N e a r G N F C To w e r, S G
Road , Bodakdev, Ahmedabad-380054 , Ema i l :
p m m a d h a n i @ y a h o o . c o m
he Pharmaceutical industry has been associated with saving
lives of people and thus has always been held in high esteem.
But now with the high cost of drug discovery and
development, rising costs to the end users, the product recalls
being done and adverse side effects, all these topped with more
education, alertness and awareness
on the part of the consumers, the
industry image has been battered.
The average cost and t ime of
discovering a new drug and taking it
to market is about one billion dollars
and 15 years respectively. Thus it is
essential that the industry finds
means of reducing the time and
costs of drug discovery and
development and at the same time
producing drugs which are target
specific and with minimal side
effects. In shor t, focus is shifted
towards developing the right drug
for the right patient in the shortest
t i m e a t the l e a s t c o s t . T i m e - s a v i n g s b e n e f i t d r u g
developers s ince each day of delay to market for a
blockbuster drug can cost more than $1 mil l ion in sales.
Traditional Drug Discovery and
Development Process
Drug development is a very lengthy
process. The traditional approach to
drug development is expensive, time
consuming and prone to failure. Cutting
the time and costs involved in drug
discovery and development are very
crucial for ensuring continued
productivity and profitability of drug
companies. The drug discovery
process can be divided into several
stages. Once a new compound with
the potential to produce a desired
effect has been identified in the
laboratory, medicines are developed
as follows:

SCMS Journal of Indian Management, October-December , 2007. 6
A Quarterly Journal Published by SCMS-COCHIN
1. Discovery/Basic Research
1. Synthesis and Extraction – the process of identifying new
molecules with the potential to produce a desired
change in a biological system.
2. Biological Screening and Pharmacological Testing – studies
to explore the pharmacological activity and therapeutic
potential of compounds.
2. Preclinical Testing
In this study the pharmacological properties of the drug are
determined by testing the product on animals, isolated cell cultures,
enzymes and cloned receptor sites and computer models. From
these tests, it is determined whether the compound will likely
produce the required benefits and its pharmacological activity.
Adverse effects are also observed. A compound which exhibits
the most therapeutic potential and minimum side effects then
proceeds to the next stage which is the clinical stage.
3. Clinical Trials: Phase I
Phase I involves the testing of the compound in healthy volunteers,
usually men between the ages of 18-30 years to determine
absorption, distribution, metabolism and excretion (ADME) patterns.
These studies are designed to determine the pharmacokinetic (how
the drug is absorbed, distributed, metabolized, and excreted by
the body) and pharmacologic (the effect of the drug on the body)
actions of the drug in humans, the side effects associated with
increasing doses, and, if possible, early evidence on effectiveness.
Upon conclusion of Phase I studies, the company determines
whether results are promising enough to pursue a Phase II study to
help determine the scientific validity of the drug. If the answer is
negative, research on the compound is terminated.
4. Clinical Trials: Phase II
Phase II studies are designed to obtain data on the effectiveness of
the drug for a particular indication or indications in patients with the
disease or condition. They also help determine the common short-
term side effects and risks associated with the drug. Phase II studies
are closely monitored and conducted in a relatively small number
of patients. At this point, the company again evaluates whether it
should pursue further research on the molecule. A positive decision
will lead to Phase III studies.
5. Clinical Trials: Phase III
Phase III studies are normally controlled and blinded to reduce
bias. Here larger populations of patients, up to 5000, are used
and divided into several arms, usually the ones given a placebo,
the control group and the ones given the test drug. The test
drug may also be compared with the current standard treatment
if available to determine effectiveness of the drug. Once a drug
proves effective and safe, an application to market the drug is
then filed to the relevant regulatory authority, which in the case
of the USA is the Food and Drug Administration (FDA). Once
satisfied the FDA then allows the drug to be marketed. More
testing may be required to be done in the post-marketing period
as well as the continual monitoring of side effects. The number
of human subjects involved progressively increases from phase
to phase, with Phase III studies typically including several hundred
to several thousand people.
6. New Drug Application (NDA) / Biologic License
Application (BLA)
Following the completion of all three phases of clinical trials, a
company analyzes all of the data and files an NDA or BLA with FDA
if the data successfully demonstrate both safety and effectiveness.
The applications contain all of the scientific information that the
company has gathered. Applications typically run 100,000 pages
or more.
7. Approval
Once FDA approves an NDA or BLA, the new medicine becomes
available for physicians to prescribe. A company must continue to
submit periodic reports to FDA, including any cases of adverse
reactions and appropriate quality-control records.
Traditional Drug Discovery and
Development: Major Issues
Discovering and developing safe and effective new medicines is a
long, complex, and expensive process. For decades, Pharmaceutical
companies have taken the old-fashioned approach to drug
discovery: the drug in question is put through a battery of preclinical
safety tests, followed by a lengthy and very expensive set of clinical
trials on animals and humans. At the end of this nearly decade-long
process, drug developers cross their fingers in hopes that their
drug will be approved by the Federal Drug Administration
(FDA). Only five in 5,000 compounds that enter preclinical

A Quarterly Journal Published by SCMS-COCHIN
SCMS Journal of Indian Management, October-December , 2007. 7
testing make it to human testing. One of these five tested in
people is approved. On average, it takes an average of 15
years and costs a company $880 million to get one new
medicine from the laboratory to market place, according to
a repor t by the Tuf t s Center fo r the S tudy of Dr ug
Development, Boston, MA, USA.
The various stages of drug development process are given
below in Table- I.
Table - I: The Traditional Drug Discovery, Development and Approval Process
Clinical development of medicine, the process leading up to the
regulatory approval for new pharmaceutical products has been
identified as the greatest cause of increasing costs in the drug
development and is predominantly attributed to drugs failing the
stringent registration approval process. Frost and Sullivan Research
indicate that the cost of clinical development has increased by
nearly 40 per cent over the last ten years. It also estimates that only
40 per cent of drug candidates entering the clinical development
pipeline actually receive regulatory approval and reach the market.
According to the Pharmaceutical Research and Manufacturers of
America (PhRMA), in 2004 biotechnology and pharmaceutical
companies spent a whooping $38.8 billion in Research and
Development. This increase has not been matched by an increase
in the number of New Drug Applications (NDA) being submitted
to the FDA for approval. Since mid -1990s NDAs have fallen by
almost 50 per cent, this is due to the reduced flow of product
pipeline. With such a high rate of failure and such extraordinarily
high costs, researchers are eager to find ways to streamline and
accelerate the drug discovery process.
Drug Discovery and Development:
Major Trends
Pharmaceutical industry is constantly undergoing a change. In the
past pharmaceuticals had a different strategy, companies use to
build all the products internally and confine access to information
or resources to third parties. The past situation is changing; in-
house resources are getting exhausted with a very thin product
pipeline and in addition many drugs are going off patent by 2008
Target Discovery 2.5 4%
Lead Generation and Lead Optimization 3.0 15%
Preclinical Development 1.0 10%
Phase I, II & III Clinical Trials 7.0 68%
Phase I 1.5 20-100 healthy volunteers
Phase II 2.0 100-500 patient volunteers
Phase III 3.5 1000-5000 patient volunteers
FDA Review and Approval 1.5 3%
Drug to the Market 15 $880
Success
RateTest Population
Cost
Mission
Time
Years
Drug Discovery and
Development Process
Laboratory and
animal studies
5000
compounds
evaluated
5 enters trial
1 approved
Source: Tufts Center for the Study of Drug Development
SCMS Journal of Indian Management, October-December , 2007. 8
A Quarterly Journal Published by SCMS-COCHIN
hampering company sales and competitiveness. Patient recruitment
and medical personnel account for nearly 70 per cent of the
clinical costs that are required to bring a drug to market. Threat
from generics, low productivity of R&D process, higher costs for
product approval and parallel imports are the major market feature
for decreasing pharmaceutical profits.
Global outsourced R&D expenditure is increasing every year
leading to rise in business prospects for Contract Research
Organizations (CRO). CRO offers monitoring, regulatory and
compliance services for new drug development, medical devices
and biologics and combination of products. CROs also provide
clinical testing services to the pharmaceutical industry for
prescription, consumer and over the counter medications. CROs
have an in-depth experience and resources with regulatory
processes around the world. CRO have scientific, regulatory and
information management exper tise along with ready made
infrastructure of global research personnel, services and facilities
for efficient completion of drug development process. Realizing
these benefits of outsourcing clinical efforts, pharma firms have
increased the budgets for CRO contracts. The pharmaceutical
companies and outsource par tners can work in symbiotic
relationship where pharma companies provide their core
competencies in marketing and commercialization and outsource
par tners supply new innovative products. The growth in
outsourcing of the drug discovery process is being fueled primarily
by two factors: (1) Relatively new fields of genomics and
proteomics have produced a host of new drug targets to work
on and (2) Most drugs marketed were not actually discovered by
the company doing the marketing.
A number of CROs have set up shop in India to provide trial
monitoring, project management, data management, safety
repor ting, drug distribution and central laboratory services.
There are only a few CROs and pharmaceutical companies
specifically working in contract drug discovery such as
Rubicon, Syngene, Or igene, Shantha B iotech, St rand
Genomics, Avestha Gengrame and TCG The Chatterjee
Group. Publ ic ins t i tu t ions l i ke CS IR a re a l so act ive ly
par ticipating in drug discovery contract services and have
recently been awarded for their excellent performance in
drug discovery services. According to TCS Research, the
CRO segment in India has grown from $5 million in 1995 to
$120 million in 2005 and India is now holding the lion’s
share of the world’s contract research business. India is
cons idered ‘ the k ing’ of of fshor ing and outsourcing.
Contract research market in India is valued at $100-120m
and growing at a rate of 25-30 per cent each year. It is expected to
grow to $300 million by 2010. India holds nearly double the
business of its nearest rival, Italy, with a market value of $60-70m.
India is believed to inherently possess sources of competitive
advantage for clinical trials. It is estimated that nearly 20 per cent
of all global clinical trials will be conducted in India by 2010.
The challenge to the drug discovery community now is to identify
the winners earlier and advance only those into clinical
development. New technologies are likely to reshape the drug
discovery and development process. Their impact will change
the way in which drugs are discovered, developed and
manufactured. Much of the trouble enmeshing the drug industry
is blamed on the exorbitant and overblown cost of drug
discovery. The drug development process, from pre-clinical testing
through phase III clinical trials, can take anywhere from nine to
twelve years, with phase II and III clinical trials consuming half that
time. Given those numbers, it is no surprise that pharmaceutical
companies have always looked for ways to conduct trials more
quickly and inexpensively.
A major technological paradigm shift in biotechnology occurred
with the launching of the human genome project in 1990. The
entire process of drug discovery underwent a radical change.
Now drugs could be designed using the information on genes.
This developed a new upstream segment or the ‘drug discovery
platform,’ referring to the activities of companies that did not
produce drugs, but either produced something or offered a
service for a drug company interested in creating a new drug.
The drug discovery platform encompasses a diverse and
constantly evolving range of technologies that are used to exploit
the information available on the genome and proteome in order
to identify potential targets for new drugs, design the potential
drugs in new ways, test them, and predict their efficiency and
risks for health. These technologies are often grouped under
the names of genomics, proteomics, rational drug design,
pharmacogenomics, etc. The constant evolution of these
technologies is the driver of the orientation of pharmaceutical
research. A complementary sector called bioinformatics also
developed. It formed a component in the drug discovery
platform, offering its services to generate compile and analyze
biological information using computer software designed
specifically for the purpose.
Fol lowing is the g lobal t rend in drug discovery and
development process.

A Quarterly Journal Published by SCMS-COCHIN
SCMS Journal of Indian Management, October-December , 2007. 9
1. Use of Bioinformatics
2. Outsourcing and Contract Research
Time and cost required for designing a new drug are immense
and at an unacceptable level. Hence pharmaceutical industry is
in search of finding new ways of developing drugs which are
cost-effective and shorten the time-line by only working with
potential successful leads early on and eliminating failures quickly.
This is where bioinformatics comes into play. Bioinformatics
plays a crucial role at virtually every stage of the drug discovery
and development process. Bioinformatics tools help by validating
the potential drug targets and determining which ones are the
most suitable for entry into the drug development pipeline.
Application of bioinformatics can help improve efficiencies
throughout the drug discovery process and also help drugs to
“fail fast” (before expensive later-phase trials), thus saving time
and money. Pharmaceutical companies are expected to increase
their R&D expenditure in the future and a major portion of this
spending is expected to go into bioinformatics.
New drug research and development hinges on successful,
cost-effective and competent clinical development. The dual
challenge of accelerating clinical development and reducing
costs is driving global pharmaceutical companies to outsource
clinical trials. As the cost of developing new drugs and the
complexity of conducting clinical trials continue to grow, an
increas ing number of pharmaceut ica l companies are
outsourcing activities to India, China, and countries in Latin
America and Eastern Europe. And as multinational drug
companies in the United States and Western Europe look east
to outsource research and clinical trial activities, countries such
as India will gain proficiency and expertise, assisting its move
from generic and specialty contract manufacturing to innovative
drug discovery and development in its own right, setting the
stage for increased global competition.
At present, 88 per cent of global audited prescription drug
sales (US $518 billion) are jointly accounted for by North
America, Europe and Japan. US alone can be a huge value
driver for CROs. The global pharma industry spends nearly US
$70 billion on R&D activities, with the US leading with an
estimated spending of $25 billion. About 40 per cent of US
pharma companies outsource some of their R&D work and
about 33 per cent of drug development funding is spent on
outsourcing from Contract Research Organizations (CROs). The
total pharmaceutical outsourced market is currently pegged at
$36 billion and is expected to reach to $48 billion whereas R&D
outsourcing expenditure is around 50 per cent of the total market
as stated below in Table-II.
What is Bioinformatics?
Bioinformatics is defined as the application of computer technology
to the management of biological information. It involves the
development of software tools for the management and treatment
of biological information. The explosion of information resulting
from the Human Genome Project (Oct.1990 - Apr. 2003) has
propelled the rapid development of bioinformatics as a discipline.
The Human Genome Project’s information management challenge
involves tracking the sequencing of the entire human genome -
approximately three billion base pairs of DNA that make up our 23
pairs of chromosomes - and the precise mapping of the 100,000
or so genes that are interspersed on these chromosomes.
Bioinformatics is a highly interdisciplinary, using techniques and
concepts from applied mathematics, informatics, statistics,
chemistry, biochemistry, physics and computer science to solve
biological problems and is the interface between the biological
and computational sciences. It is the application of computer
technology to the management and analysis of biological data
such as the sequences of DNA (Deoxyribonucleic acid) and RNA
Table - II: Global R&D Outsourced Market and CRO Market (2001-07)
US$ Billion 2001 2002 2003 2004 2005 2006* 2007*
Global R &D Outsourcing Market 11.4 12.7 14.1 16.3 18.7 21.7 24.9
CRO Market 8 8.8 9.9 11.4 13.1 15.1 17.5
*estimated
Source: Frost & Sullivan

SCMS Journal of Indian Management, October-December , 2007. 10
A Quarterly Journal Published by SCMS-COCHIN
cost of drug discovery also benefits the patients immensely as they
will have quicker access to life saving drugs at an affordable price.
Bioinformatics is seen as an emerging field with the potential to
significantly improve how drugs are found, brought to clinical trials
and eventually released to the marketplace. It has significant
advantages over traditionally expensive and time consuming “wet
lab” research methods, because computational tools give the most
predictive and accurate information about genes and proteins with
regards to mediating aspects of drug action. Bioinformatics solutions
could help biotech companies in identifying novel biomarkers and
drug targets based on a computational approach to analyze masses
of biological data pouring out from genomic and proteomic studies.
Bioinformatics is used to solve complex biological questions related
to metabolic pathways, genes, protein function and
pharmacological/developmental aspects of drugs and medicines.
By integrating data from many inter-related yet heterogeneous
resources, bioinformatics can help in our understanding of complex
biological processes and help improve drug discovery.
Following are key areas where bioinformatics supports drug
discovery and research (See Annexure – I).
1. Similarity Searches
A common activity in pharmaceutical companies is the search
for drug analogues. Starting with a promising drug molecule,
one can search for chemical compounds with similar structure
or properties to a known compound. There are a variety of
methods used in these searches, including sequence similarity,
2D and 3D shape similarity, substructure similarity, electrostatic
similarity and others. A variety of bioinformatics tools are available
for this work.
2. Sequence Analysis
It is very useful to determine how similar or dissimilar the organisms are
based on gene or protein sequences. With this information one can
infer the evolutionary relationships of the organisms, search for similar
sequences in bioinformatics databases and find related species to those
under investigation. There are many bioinformatics sequence analysis
tools that can be used to determine the level of sequence similarity.
3. Homology Modeling
Determining the 3-D structure of proteins is an important aspect of
(Ribonucleic acid) in genes and amino acids in proteins.
Bioinformatics is a science of developing and utilizing computer
databases and algorithms to accelerate and enhance biological
research. More narrowly it is defined as the use of computer
technology to organize and analyze genomic, biological, and
chemical data in order to support the drug discovery process.
Bioinformatics deals with methods for storing, retrieving and analyzing
biological data, such as nucleic acid (DNA/ RNA) and protein
genomic, biological and chemical data to support the drug
discovery process.
Bioinformatics: A Vital Tool for Drug
Discovery and Development
Bioinformatics has a key role to play in the pharmaceutical sector. It
can be used to reduce the time and cost involved in drug discovery
process. Bioinformatics is a set of enabling technologies responsible
for the annotation, storage, analysis and retrieval of nucleic acid
sequence, protein sequence and structural information. This
interdisciplinary field drives an exciting process of understanding
the secret of life. Bioinformatics is being applied to speed up the
drug discovery process by moving towards data-driven drug
discovery, to improve efficiency, trim down costs and the time-
liness and provide wider access to the entire life sciences sector. In
order to gain a competitive advantage in the drug discovery process,
pharmaceutical and life sciences companies are placing increasing
emphasis on bioinformatics as it reduces the time and costs of
developing medicine because of its facilitation with filtering data
and with choosing the best way to proceed. Bioinformatics has
the potential to hugely decrease the risk, cost, and expertise
required for the early stages of drug development, target selection
and validation.
Bioinformatics has proven indispensable to drug discovery and
development process to solve the cost and time woes of the
pharmaceutical industry. Bioinformatics based computational drug
discovery has created many opportunities to speed up and
rationalize the multidisciplinary drug discovery process, and provide
novel approaches to the design of drugs otherwise not possible.
By eliminating potential drug failures early on during the process,
bioinformatics also helps cut the time researchers take to get a
drug from the laboratory to the patient as they only concentrate
their efforts on the leads which hold the greatest potential only.
Thus the pharmaceutical industry will increase the number of drugs
in their pipelines which has been dwindling. Reduced time and

A Quarterly Journal Published by SCMS-COCHIN
SCMS Journal of Indian Management, October-December , 2007. 11
rug design. Most drug targets are proteins, so it’s important to
know their 3-D structure in detail. It’s estimated that the human
body has 500,000 to 1 million proteins. However, the 3-D structure
is known for only a small fraction of these. Homology modeling is
one method used to predict 3-D structure. In homology modeling,
the amino acid sequence of a specific protein (target) is known,
and the 3-D structures of proteins related to the target (templates)
are known. Bioinformatics software tools are then used to predict
the 3-D structure of the target based on the known 3-D structures
of the templates.
4. Virtual High-Throughput Screening (vHTS)
Pharmaceutical companies are always searching for new leads to
develop into drug compounds. One search method is virtual high-
throughput screening. In vHTS, protein targets are screened against
databases of small-molecule compounds to see which molecules
bind strongly to the target. If there is a “hit” with a particular
compound, it can be extracted from the database for further testing
thus allowing researchers to only work with promising leads only.
With today’s computational resources, several million compounds
can be screened in a few days. Pursuing a handful of promising
leads for further development can save researchers considerable
time and expense.
5. Drug Lead Optimization
When a promising lead candidate has been found in a drug
discovery program, the next step (a very long and expensive step!)
is to optimize the structure and properties of the potential drug.
This usually involves a series of modifications to the primary structure
(scaffold) and secondary structure (moieties) of the compound.
This process can be enhanced using bioinformatics software tools
that explore related compounds (bioisosteres) to the lead candidate.
6. Drug Bioavailability and Bioactivity
Most drug candidates fail in Phase III clinical trials after many years of
research and millions have been spent on them. And most fail
because of toxicity or problems with metabolism. The key
characteristics for drugs are Absorption, Distribution, Metabolism,
Excretion, Toxicity (ADMET) and Efficacy—in other words
Bioavailability and Bioactivity. Although these properties are usually
measured in the lab, they can also be predicted in advance with
bioinformatics software.
Drug Discovery and Development:
Benefits of Bioinformatics
Bioinformatics with rapid advances in gene, protein, and drug
identification will lead to swift, sharp reductions in both the time
and cost of drug discovery. Tangible proof that the bioinformatics
revolution will economize drug discovery is emerging. Following
are major benefits of bioinformatics in drug discovery and
development process.
1. Cost Saving
Growth of the bioinformatics market is primarily attributed to its
increased usage in the pharmaceutical industry. Many pharmaceutical
companies now use computational methods and bioinformatics
tools to reduce drug discovery and development cost burden.
The application of bioinformatics is expected to reduce the annual
cost of developing a new drug by 33 per cent, and the time taken
for drug discovery by 30 per cent.
2. Time Saving
The predictive power of bioinformatics can help drug research
programs choose only the most promising drug candidates. By
focusing drug research on specific lead candidates and avoiding
potential “dead-end” compounds, pharmaceutical companies can
get drugs to market more quickly. Using bioinformatics is more like
a focused marketing aspect where one assesses the needs of the
consumer and then comes with a product to meet those needs,
instead of making a product first and then imposes it onto the
consumer hoping that it will meet their needs.
3. Insight
One of the non-quantifiable benefits of bioinformatics tools is
the deep insight that researchers acquire about drug-receptor
interactions. Molecular models of drug compounds can reveal
intricate, atomic scale binding properties that are difficult to
envision in any other way. Bioinformatics thus clearly allows
exploitation of the data that is available and this together with
increased understanding of molecular biology greatly improves
the drug discovery process. The data from the Human Genome

SCMS Journal of Indian Management, October-December , 2007. 12
A Quarterly Journal Published by SCMS-COCHIN
Project has availed great opportunities for drug discovery and
streamlining the choice of targets to support the drug discovery
pipeline.
Bioinformatics tools can be used to gather all the necessary
information about potential targets. This information includes
nucleotide and protein sequencing, homologue mapping,
function prediction, pathway information, disease associations,
variants, structural information, gene and protein expression
data and species distribution among others. The accumulation
of this information into databases about potential targets means
pharmaceutical companies can save themselves much time,
effor t and expense exerting bench effor ts on targets that will
ultimately fail.
Why should Pharma Companies
Outsource Bioinformatics?
Pharma alliance or partnership holds cost benefit advantage by
reducing huge amounts of capital outlay for producing latest
technology in-house. Outsourcing allows pharma companies to
ramp up the R&D operations at a fast pace with minimal capital
outlay.
Bioinformatics outsourcing offers the following advantages.
Companies will:
1. Decrease time from lab to market,
2. Increase manufacturing efficiency and productivity ,
3. Minimize financial risk by minimizing operational and
ownership cost ,
4. Cash in on in-depth experience and resources with
regulatory processes around the world,
5. Be able to focus on the core strengths,
6. Divert resources to focus on other competencies like
marketing,
7. Outsourcing reduce the overall costs by 30 per cent to
35 per cent ,
8. Faster and cheaper to have discovery work outsourced,
reduces drug development cost, and
9. Improve net earnings and cash flow.
Bioinformatics for Drug Discovery and
Development: Indian Advantage
India is becoming increasingly competitive in bioinformatics. India
has a wide pool of three to four million English speaking scientists
willing to work with one fifth of the salary offered in the US and
Europe. There is access to vast amounts of clinical and biological
material for conducting research. India’s globally recognized
software skills provide a natural advantage in bioinformatics. The
Bioinformatics sector in India is estimated to have grown to Rs.120
crore in 2005-06 compared to the previous year’s figure of Rs.100
crore. As per NASSCOM-KPMG Research Report (2004), India
bioinformatics market is expected to exceed US $2 billion by 2008.
The R&D being outsourced to India relates to areas such as molecular
biology, DNA sequencing, molecular biology software packages,
molecular modeling, among others.
Following are strengths of India in bioinformatics.
1. Strong IT capabilities,
2. R&D strength in modern biology and bioinformatics,
3. Highly trained manpower in biotechnology and
bioinformatics,
4. English speaking, low cost, qualified manpower,
5. Strong biotechnology infrastructure, and
6. Wide networking of research institutions and research
scientists.
Outsourcing of Clinical Trials
In the compl icated process of drug development ,
approximately 30 per cent of the costs are incurred in actual
drug development while the remaining 70 per cent are incurred
in clinical testing. Such costs could be reduced to half when
clinical research activit ies are outsourced to low cost
economies such as India. Other Asian countries like China,
Malaysia, South Korea and Taiwan are also attracting a number
of international pharma companies to outsource their R&D
activities. There are at any point in time over 500 molecules
undergoing clinical trials in various phases in a large number of
centers around the World. In contrast to the drug discovery
process, the clinical development process is heavily dependent
on the human element; hence regions of the world with cost-
competitive human resources are an attractive alternative. With
nearly one billion people as potential patients and a large number
of highly skilled investigators, India clearly falls into this category.

A Quarterly Journal Published by SCMS-COCHIN
SCMS Journal of Indian Management, October-December , 2007. 13
According to a survey by the Outsourcing Institute, the top five
criteria for the selection of an outsourcing partner by global pharma
companies are: price, commitment to quality, flexible contract
terms, reputation and scope of resources. Indian advantages apart
from lower costs rest with availability of large and diverse patient
populations, skilled clinicians, ability to meet global ICH
(International Conference on Harmonization) guidelines etc. The
recent changes in Schedule Y of the Drugs and Cosmetics Act
also permits on the merit of each case the conduct of trials in
a concurrent phase with those carried out in centers abroad.
English being the language of science and medicine in India,
excellent communication facilities and adequate documentation
and analytical systems are the other advantages that India provides.
At present many Clinical Research Organizations (CROs) have been
Figure 1: The “India Advantage”
set up in India and many trials have been carried out meeting FDA
standards.
Why India is a Potential Destination
for Clinical Trials
India’s competitive advantages in clinical trials are based on favourable
regulatory climate, English language proficiency of doctors, staff of
hospital, clinical analysts and investigators, Large pool of treatment naïve
patients, high speed of subject recruitment and low cost of clinical
studies as explained in Figure 1. These points are also elaborated below.
1. Large pool of Treatment-Naive Patients and
Faster Subject Recruitment:
India provides a large pool of “treatment-naive patients” who hail
from multi-ethnic and multi-racial backgrounds. Many of India’s
numerous poor patients are “treatment naïve,” meaning they have
never received drugs for treatment. This makes patient enrolment
and trial management much simpler. In India, subject recruitment is
rapid thereby collapsing the time needed for the clinical development
process. Subject recruitment is the most common rate-limiting step
in the drug development process. Sponsors normally cannot reduce
study timeliness, however, without sacrificing quality and incurring
increased cost. India offers sponsors the opportunity to recruit
subjects quickly while maintaining a high level of quality. The relative
cost savings result not only from shorter timeliness but also from
the low cost of performing studies in India. Globally, more than
80 per cent of clinical trials fail to enroll on time, and this subject
recruitment problem is extremely costly for drug companies,
contributing to 85–95 per cent of the lost days in a clinical trial.
Subject compliance is an important aspect of clinical trials. Subjects
generally recruited in the studies performed in India are not only
treatment naïve but also recognize that study participation can
offer access to quality health care and medicines that may not be
otherwise affordable. As result, subjects are very compliant and are
keen to attend all their study visits.
An independent study by a global CRO concluded that India has
one of the best subject return rates in the world. For example, ClinTec
International, UK claims to have decreased its time for recruiting patients
Leve
l of
im
port
ance
H i g h
L o w
C o s t
S p e e d
Period pool
L a n g u a g e
Regu la tory
Clinical Trial Success Factor

SCMS Journal of Indian Management, October-December , 2007. 14
A Quarterly Journal Published by SCMS-COCHIN
to half the time it takes in the US by conducting clinical trials in India.
The time for data analysis is also shorter. In another example,
Germany’s Mucos Pharma asked Siro Clinpharm in Mumbai to help
with a clinical trial for a drug to treat head and neck cancer. To find 650
out of 750 volunteers for the trial, Siro Clinpharm had to go to only
five hospitals in India and found the volunteers within 18 months. To
find the remaining 100 volunteers in Europe, Mucos Pharma spent
nearly twice as much time and recruited patients from 22 hospitals.
Currently, about 80 government and privately owned Indian hospitals
are engaged in global and local clinical trials. Observers predict that
this figure will increase exponentially.
2. India’s Provides Significant Cost Savings:
The global drug giants are increasingly outsourcing clinical trials to
India because of India’s large population and low costs. The cost
of conducting trials in India is cheaper by 30-50 per cent as
compared to that in the West. Over 40 per cent of drug
development costs are incurred in clinical trials and India offers
immense savings on that aspect. Trials can get done fast, which is
also an important criterion. For instance, in the US, clinical trials for
a standard drug can cost about $150 to $170 million, whereas the
Rabo India Finance study estimates that drugs could be tested in
India for as little as 60 per cent of that price.
3. India provides a Rich pool of Biodiversity:
India has large population concentrations in major urban areas
offering ready access to trial subjects and a population that offers
vast genetic diversity. Due to the high population density of the
urban areas and relatively small number of hospitals, recruiting a
large number of subjects within a short time frame is not difficult.
Also, the accessibility of these hospitals allows for cost-effective
monitoring of studies. According to a study by Rabo India Finance,
India’s huge patient pool provides a lot of genetic diversity making
India “an ideal site for clinical trials.” For example, India has the
world’s largest pool of diabetics – over 20 million suffer from it.
Diabetes is also the most researched condition across the world
nowadays. Trials are also going on in areas such as psychiatry,
neurology, cardiology, gastroenterology, endocrinology,
dermatology and ophthalmology.
4. Presence of Established Players:
Almost all top names in the pharmaceutical universe such as Eli Lilly,
GlaxoSmithKline, Pfizer, Aventis, Novo Nordisk and Novartis, are
conducting clinical trials in India. Pfizer is already conducting trials
for osteoporosis, cardiovascular diseases and psychiatric conditions
in India and has plans to hold trials for many more diseases here.
Apart from them, a number of Indian and global organizations such
as Quintiles Transnational Corp, Omnicare and Pharm-Olam, Research
Triangle Park, N.C. are holding clinical trials in India on behalf of US-
based pharmaceutical companies. Roche, the Swiss pharma major
has also set up clinical trial sites in India as part of its global trials for
treatment of a particular variant of lung cancer. One of the reasons
for considering India is that it has a vast patient population infected
by this type of lung cancer, which is primarily triggered by the use
of tobacco products. India is also being considered a prospective
site for Roche’s future clinical trials involving new drugs and therapies
for blood cancer. India is having around 25 Contract Research
service (CRO) providers with excellent infrastructure and well trained
and experienced staff to conduct clinical development activities.
5. Established Research Facilities:
Indian research/data generation capabilities are of international
standards and Indian data is accepted by all major medical
conferences and journals.
6. Favourable Regulatory Climate:
India has a commercial and legal environment which is supportive
and conducive to contract research and clinical trials. Like most
other countries, India has both local Institutional Review Boards
(IRBs) and a national regulatory body, the Drug Control General
India (DCGI.). Studies must first be approved by the local IRB, called
the Independent Ethics Committee (IEC) and then submitted to
the DCGI for additional approval. Bioequivalence studies involving
drugs that have been marketed in India for more than four years do
not need to go to the DCGI, as these studies can be approved by
the local ethics committee. The Indian government and the
pharmaceutical services sector are working together to firmly
position India as a major global player. For now, India enjoys a
distinct advantage over China due to easier regulatory hurdles and,
of course, the use of English as a major language. The Indian patent
act amended on March 2005 i.e. TRIPS opens a new avenue for
India into the global pharmaceutical market.
Compared with Russia, Latin America, China or Africa, the speed of
regulatory approval in India is relatively rapid. With proper
documentation, clinical trial applications can be approved in as
little as eight to ten weeks (for drugs marketed in India for more

A Quarterly Journal Published by SCMS-COCHIN
SCMS Journal of Indian Management, October-December , 2007. 15
than four years), or may stretch to 12–14 weeks for drugs not
approved in India. This compares with six to twelve months for
similar studies in other countries, making India look quite attractive.
7. Strong Support by Indian Government:
India announced in December 2001 that all pharmaceutical clinical
research must strictly follow government issued GCP (good clinical
practice) guidelines. These guidelines were formulated by an expert
committee set up by the Central Drugs Standard Control
Organization in consultation with relevant experts. Consequently,
the level of research and ethics in some institutions is now on par
with International Standards. High level of International Conference
on Harmonization of Technical Requirements for Registration of
Pharmaceuticals for Human Use (ICH) good clinical practice (GCP)
and US Food and Drug Administration (FDA) standards compliance
– since 2001, DCGI has implemented conformity to ICH GCP/good
laboratory practice (GLP) guidelines. Generally, most competent
authorities (CAs), including the FDA, will find the standards of Indian
clinical trials acceptable.
The 2003 budget gave encouraging gestures for R&D in the pharma
sector particularly in respect of clinical trials. Exemption of customs
duty for materials and samples was a great boost to the CROs in
bringing samples for trials. Pressure on the industry was also reduced
by abolishing the minimum export turnover concept. India is emerging
as a major player for conducting clinical research from phase I to phase
IV. Speedier customs clearance of clinical trial materials and frozen
biological samples has provided a great opportunity for the clinical trial
companies to grow and provide much needed service to pharma
companies. The Drugs and Cosmetic Rules Act has also been amended,
whereby no institution will be permitted to undertake clinical trials for
a new drug without the permission of the Drug Control General India
(DCGI). Further, post marketing surveillance studies (phase IV study)
have been made mandatory in case of clinical trials for import and
manufacture of new drugs. This will increase the demand for high
quality clinical research services.
8. Medical Infrastructure:
High quality of research professionals – India has a strong reputation
for graduating students in the medical and scientific fields. Moreover,
India also has other facilities, such as almost 14,000 hospitals,
5,00,000 doctors, 700,000 specialty hospital beds, 221 medical
colleges, 17,000 medical graduates per year and skilled English-
speaking medical personnel.
9. English Speaking Skilled Men Power:
All hospitals and private institutions store comprehensive source
data in English. India also has the world’s second largest pool of
English speakers (making communications significantly less of an
operating issue than in other countries). India has an excellent higher
education system, which produces a large number of graduates
with advanced degrees in the basic sciences, medicines, laboratory
technology and in information science. India is also having a large
pool of talented clinical research investigators. Many of them have
been trained in the US and/or Europe and are exposed to ICH
guidelines for GCP.
10. Wide Spectrum of Disease:
India has wide spectrum of disease with diseases of both the
tropical and industrialized world. Diseases such as multi-drug-
resistant pneumonia, hepatitis B, diabetes, and some cancers are
far more prevalent in India than in the West. The comparatively less
intensive medical surveillance suggests that the true cancer
caseload in India would be significantly higher than diagnosed
cases. The speed of patient recruitment for oncology clinical
trials in India is up to seven times faster than in the United States.
Following are major diseases of interest for clinical research:
1. Cardiovascular and respiratory disease:
1. 80 million individuals suffering from cardiovascular
disease,
2. 15 per cent of the population hypertensive, and
3. 50 mil l ion asthmatics, many steroid naïve with
uncontrolled symptoms.
2. The Metabo l i c Syndrome ( i n su l i n re s i s t ance ,
hyperlipidaemia and obesity):
1. Type II Diabetes Mellitus - 60 million cases with a five
fold greater prevalence in cities, and
2. Largest number of individuals with metabolic syndrome
in the world.
3. Psychiatric and Neurological Diseases:
1. One per cent of the population having schizophrenia,
mania and / or bipolar disorders,
2. Eight million epileptics,
3. 1.5 million individuals, believed to have Alzheimer’s
disease, and

SCMS Journal of Indian Management, October-December , 2007. 16
A Quarterly Journal Published by SCMS-COCHIN
4. Pa r k i n son ’ s d i sease and m ig r a i ne , w ide l y
prevalent
4. Large and growing no. of cancer patients, of whom many
seeking to participate in global trials:
1. Number of diagnosed cases, presently around
three million,
2. Cancers of the oral cavity, lung, and cervix forming
over 50 per cent of cases, and
3. Other common cancers being those of the breast,
head and neck and pancreas.
11. A Major Resource Center:
Today India is identified as a major resource center for conducting
clinical trials and data management services. With its large patient
populations, well-trained and enthusiastic investigators, and per-
subject trial costs considerably lower than those in developed
nations, it is widely recognized as a nation able to offer unique
opportunities for conducting clinical trials.
12. India’s Strong Pharmaceutical Sector:
Indian pharmaceutical industry is recognized as one of the leading
global players with 4th position in terms of volume and 13th position
in terms of value. India today has the largest number of US Food
and Drug Administration (FDA) approved drug manufacturing
facilities outside the US. India is having more than 70 FDA-approved
plants and 200 manufacturing facilities certified as having good
manufacturing practices (GMP), more than any other foreign country.
With presence of over 10,000 pharmaceutical companies, one
fourth of it can provide contract manufacturing facilities to foreign
pharmaceutical companies.
India can emerge as a world leader in drug development as Indian
pharmaceutical companies have the numerous strengths and
capabilit ies. India has long been a formidable player in
pharmaceutical manufacturing, with Indian companies producing
some 22 per cent of the world’s supply of generic drugs, according
to the Indian Pharmaceutical Alliance (IPA). By 2007, India will capture
a third of the world’s generic drug business, predicts the IPA.
Indian companies are increasingly submitting more and more
abbreviated new drug applications (ANDAs) to the FDA. Indian
companies contributed about a third of the total ANDAs, according
to a report by Credit Lyonnais Securities. Big pharma is hoping to
capitalize on the cost savings by shifting some research activities to
India. Last year Ranbaxy entered into a collaborative agreement with
GlaxoSmithKline (GSK), Brentford, UK, to develop new chemical
Annexure - 1
Applications of Bioinformatics in Drug Development and Design
Mining of
Protein/DNA3D structure
Array analysisADMET
Target
Identification
Target
Validation Hits Leads Optimization
Analysis of
Target libraryVirtual
screening
Relevance of
target proteinSimilarity
search

A Quarterly Journal Published by SCMS-COCHIN
SCMS Journal of Indian Management, October-December , 2007. 17
entities for select therapeutic targets using GSK’s libraries of patented
molecules. GSK will conduct clinical trials and market successful
drugs.
13. Fast Turnaround Time:
In India, clinical trials are conducted in 30 per cent less time, while
there has been a backlog reduction of 50 per cent in transcription
processing. Also, India and the US have a zonal time difference of
about 12 hours, thus effectively giving companies a 24 hours work
environment. Most of the processing functions are performed during
the day time in India, when it is night time in the developed countries.
As a result of this zonal time difference, there is no or little backlog
in the front end and processing tasks.
Conclusion
Although approximately $40 billion is spent annually on drug
development, pharma companies have realized that periods of
rapid growth and unprecedented profits are now far and few.
Researchers are finding fewer and fewer unique molecules, ending
the era of “blockbuster drugs” and increasing development
timeliness, sometimes to as long as 15 years. Today pharmaceutical
and life sciences companies are placing increasing emphasis on
bioinformatics investments in order to gain a competitive advantage
in the drug discovery process. India offers substantial cost
advantages in bioinformatics. By off-shoring data mining and
analytics, cost advantages range as much as 70 per cent. The
large number of patent expirations, decreasing R&D productivity
and high costs of drug development are forcing big pharmaceutical
companies to outsource their R&D operations to other low cost
locations. India is proving to be the most preferred destination to
carry out their drug discovery and development activities.
Availability of a vast patient population, low cost, strength of IT,
skilled R&D workforce and a favourable regulatory environment
are the main driving forces to transform India into the hub of R&D
activities and bioinformatics for successful drug discovery and
development.
Keywords: Bioinformatics; Clinical Trial; Drug Discovery; Drug
Development; Outsourcing.
References
Agres, Ted. “Outsourcing Spikes Competition.” Drug Discovery and
Development. August 2004. <www.dddmag.com>.
“All about the Human Genome Project.” National Human Genome
Research Institute (USA). <www.genome.gov>.
Bakhle, Dhananjay. “Global Clinical Trials in India – Challenges and
Opportunities.” Business Briefing: Pharmatech. 2003.
Barnes, Kirsty. “Outsourcing-Pharma Focus: Cutting the Cost of Clinical
Trials.” June 6, 2006.<www.drugresearcher.com>.
“Big Pharma May Be Emerging from R&D Productivity Doldrums.”
Tufts CSDD Impact Report. May/June 2006.<http://
csdd.tufts.edu>.
“Bioinformatics and Drug Discovery.” <www.ebi.ac.uk>.
“Breaking the Bottlenecks: Applying Genomics Throughout Drug
Discovery and Development.” Cambridge Healthtech
Institute (CHI) Report. November, 2001.
Chakravarthy, Rama. “Bioinformatics in Drug Development and
Design.” Developer IQ. <www.developeriq.com>.
Chaturvedi, Swati. “Benefits of Outsourcing.” Pharmabiz. July 14,
2005.<www.pharmabiz.com>.
Chigullapalli, Rajeshwer and Zaheer, Feroz. “Asia - The Emerging
Pharma R&D Hub.” Pharma Focus Asia.
<www.pharmafocusasia.com>.
“Clinical Trials: The Next Big Thing for India.” Times News Network.
November 12, 2004.
“Faststats: Drug Discovery- Drug Discovery Buzz.” June 19, 2005.
<www.redherring.com>.
Davies, Kevin. “Counting the Cost of Drug Discovery.” BIO-IT World.
July 2002. <www.bio-itworld.com>.
DiMasi J.A. et al. “The Price of Innovation: New Estimates of Drug
Development Costs.” Journal of Health Economics.
(2003): 151–185.
Dr. Casey, Richard. “Bioinformatics in Computer-Aided Drug
Design.” May 10, 2005. <www.b-eye-network.com>.
Dr. Casey, Richard. “Bioinformatics in Structure-Based Drug Design.”

SCMS Journal of Indian Management, October-December , 2007. 18
A Quarterly Journal Published by SCMS-COCHIN
Business Intelligence Network. March 28, 2006.
<www.b-eye-network.com>.
Dr.T.Madhan, Mohan. “Bioinformatics-An emerging tool: It’s
role and relevance to Biotechnology.” Advanced
Biotech. September, 2003.
“From Gene to Drug in Silico, Bioinformatics for a Better
Tomorrow.” A presentation by Supercomputing Facility
for Bioinformatics and Computational Biology. IIT,
Delhi: 2005. <www.scfbio-iitd.res.in>.
“Genomics Provides Crucial Tools for Breaking Bottlenecks in
D r u g D i s c o v e r y a n d D e v e l o p m e n t .”
<www.healthtech.com>.
Gibas, Cynthia et al Developing Bioinformatics Computer Skills. 1st
Edition, New York: O’Reilly and Associates, 2001.
Hamilton, Teacha. “Global Bioinformatics Market Set Reach Nearly
$3 Bil l ion by 2010.” OBBeC. 26 May 2005.
<www.obbec.com>.
Hede, Shantesh. “Bioinformatics.” Hypography, June 5, 2002.
<www.hypography.com>.
“How New Drugs Move through the Development and Approval
Process.” Tuf ts Center for the Study of Drug
Development . Boston, Mass. USA: November,
2001.<http://csdd.tufts.edu>.
Jayaraman, K.S. and Louët, Sabine. “India aims to become the main
bioinformatics hub.” Nature Biotechnology. 2004.
Krane, Dan. et al Fundamental concepts of Bioinformatics. 1st Indian
Reprint, Delhi: Pearson Education Inc., 2003.
Kulkarni, Narayan. “…And now its Bioinformatics” BioSpectrum.
February 10, 2003. <www.biospectrumindia.com>.
Lawrence, Stacy. “IT Use for Drug Discovery to Rise.” CIO Insight.
June 29, 2005. <www.cioinsight.com>.
Lim, Hwa. Genetically yours: Bioinforming, Biopharming, and
Biofarming. 1st Edition, London: World Scientif ic
Publishing Company, 2002.
McGee, Patrick. “Clinical Trials on the Move.” Drug Discovery and
Development. October 2004. <www.dddmag.com>.
Mudur, G. S. “Reverse Drug Design.” The Telegraph. January 17,
2005. <www.telegraphindia.com>.
“New Drug Approvals in 2004.” PHARMA Report. Pharmaceutical
Research and Manufacturers of America,2005.
<www.phrma.org>.
Nair, M.D. “India as an Outsourcing Destination - A SWOT Analysis.”
Pharmabiz. July 2005.<www.pharmabiz.com>.
“Opportunities for Bioinformatics in European Drug Discovery
Market.” Frost and Sullivan Research Repor t. <http://
healthcare.frost.com>.
Overby, Stephanie. “Drug companies on Speed: Bioinformatics.”
CIO. October 15, 2001.< www.cio.com>.
“Report describes Bioinformatics Market as explosive.” Drug
Researcher. May 26, 2005.
“TCS bags drug discovery deal from Italian bio-tech firm.” August 4,
2005. <www.tcs.com>.
Roy, Ayon. “Where Chips and Cells Collide: Bioinformatics.”
Silicon India. August 2002.<www.siliconindia.com>.
Sastry, V.V. “Potential and Trends of CRO Industry: An Analysis.”
Pharmabiz. August 2004.<www.pharmabiz.com>.
Vidyasagar, M., “India: A Destination for Drug Discovery
R&D.” Indo-Swiss Workshop, Zurich, Switzerland:
October 22, 2004.
“What is Bioinformatics?” School of Biology. Georgia Institute of
Technology. <www.biology.gatech.edu>.
Webster, Phil. “Clinical costs skyrocket to New Levels.” September
12, 2004. <www.inpharm.com>.
Worrell, Jim. “Practical Issues for Conducting Clinical Trials in
India.” Drug Development. 2006.<www.touch
briefings.com>.

A Quarterly Journal Published by SCMS-COCHIN
SCMS Journal of Indian Management, October-December , 2007. 19
M
Multivariate Analysis of Variance (Manova) has been an inherent tool in data analysis in the field of
management for several decades. Numerous articles still continue to appear in leading journals making
use of this unique technique for studying the impact of one or several categorical-scaled predictors on
several continuous-scaled dependent variables. Unfortunately, the awareness and applications of this
important tool is least amongst the researchers in the management discipline in India. The author hence
endeavours that the application of this technique is well understood and is confidently applied. Using
an illustration, this article provides non-technical step-by-step descriptions in performing a Factorial
Manova. The inclusion of SPSS screenshots and the discussions on the output will be of immense use in
enabling the practitioners in gaining full comprehension of this wonderful tool.
.
Dr. I s rae l D . , Ass i s tant P rofessor (Market ing Area) ,
School of Bus iness and Human Resources, Xav ier
L abou r Re l a t i on s I n s t i t u t e (X L R I ) , J amshedpu r,
Jha rkhand-831 001, Ema i l : d i s rae l@x l r i . ac . in
Business Research:Factorial Manova
Israel D.
ANOVA, an acronym for Multivariate Analysis of Variance,
is an extension of ANOVA to test the impact of one or
more categorical independent variables (also known as
predictors or treatment variables) on
two or more continuous scaled
dependent variables (also known as
criterion variables). Using MANOVA,
we can test the independent and
interactive effect of the predictors on
a set of dependent variables. Whereas
ANOVA measures the significant
difference in the mean values of a single
dependent variable across different
levels or categories of a single or
several predictors, the MANOVA
tests the significant differences in
the centroid (called vector) or the
mean of a set of dependent
variables say, a set of ratings of
employee performance, purchase decisions or service quality
perception etc. Thus MANOVA takes into account the inter-
correlation existing among the dependent variables thereby reducing
the information loss. In a factorial-
design MANOVA, we will have two or
more predictor variables each
measured on a categorical scale and
two or more dependent variables.
MANOVA is a dependence technique
and is formulated as:
Y1+Y2+Y3+…….+Yn = X1+X2+
X3+…..+Xn
The Y variables on the left hand side
are dependent variables that are
measured on a continuous scale viz.,
interval or ratio scale (e.g. income, sales

SCMS Journal of Indian Management, October-December , 2007. 20
A Quarterly Journal Published by SCMS-COCHIN
volume, price etc.). The X variables on the right hand side of the
equation are the independent or predictor variables measured on
nominal scale (e.g. gender, sales territory, color of the package
etc.). MANOVA aims at finding at how far different categories of a
predictor variable are different across a set of dependent variables
(i.e. Y variables) which is also known as dependent covariate. Thus
MANOVA is imperative in dissecting the impact of treatment effect
on a set of related dependent variables.
Requirements
1. The predictor variable(s) should be measured on a nominal
scale.
2. There can be one or many such predictor variables.
3. There should be at least two dependent variables.
4. The dependent variables should not be totally independent
from each other. At the same time, they should not be highly
correlated say, 0.8 or above as this will betoken the symptom
of multicollinearity. Nonetheless, the dependent variables in
the model should share a moderate amount of correlation.
This is examined through Bartlett’s test of sphericity whose
value should be significant at 0.05 level, meaning there is a
sufficient correlation between the dependent variables in the
model. In case of multicollinearity, it is advisable to remove
one or more of the highly correlated dependent variables
even before submitting the variables for analysis.
5. The subjects or respondents in different categories of the
independent variable(s) should be independent of each other.
This can be ensured through random assignment of the
subjects into different categories of the predictor variable.
Further, a minimum sample size of 20 should be present in
each cell or category of the independent variable (Hair et al.
1998).
6. There should be homogeneity of variance for each dependent
variable across subjects in different levels of predictor variable.
This can be assessed through Box’s M test. The Box’s M test
checks the null hypothesis that the dependent variable variance-
covariance matrices are equal across the levels of the
independent variable. If the Box’s M test is significant, that is,
the level of significance is greater than .05; it is an indication of
homogeneity of covariance of dependent variable across
different levels of independent variable. In case, the Box’s M
test is insignificant (that is, the level of significance is less than
.05), we have to resor t to transforming the data into
standardization or log-conversion. Or, we can rely on Pillai’s
Trace criterion while examining the significance of multivariate
effect (Tabachnik and Fidell, 2001).
7. It is also a pre-requisite to assess the normality diagnostics for
each level of independent variable on each dependent variable.
For this purpose, we can compute Kolmogorov-Smirnov or
Shapiro-Wilk tests. The level of significance obtained for these
tests should be greater than .05 to reveal no normality violations.
In addition, we have to look for the value of kurtosis and
skewness whose values should be between + or -1. Or, we
can inspect the normal Q-Q plots for the distribution of
dependent variable for each level of the factors in the model.
But normally this requirement is connived in Manova, as the
multivariate test statistics are themselves robust against the
violations of the normality assumptions.
8. MANOVA assumes linear relationships between pairs of
dependent variables. In case of non-linearity, we have to
transform the data into standardized or log format.
Illustration
A study was made to find out how the spousal influence on the
purchase of durable goods varies for (a) families in which wife is
gainfully employed outside the home and not, and (b) families
in different life-cycle stages. The spousal influence on the
purchase of a Television set and a Refrigerator was assessed
from couples belonging to 60 families who have reported having
bought them during the last one year period. The relative
influence of spouses on a set of 14 decision elements such as
initiating the idea of purchase, gathering information, decision
on brand, style, model, amount to spend, time of purchase etc.
were measured on a five point scale ranging from “Husband
exclusively =1” to “wife exclusively =5” and the total score in
respect of purchase of a television-set and refrigerator was
calculated separately for each family. Thus the two dependent
variables for this study are purchase influence (total) score for
refrigerator and television set. The predictor variables are wife’s
work status (with a code of 1= working-wife families and 2=non-
working wife families) and family life-cycle (with a code of 1=
couples married under 5 years, 2= couples married for 5-10
years and 3= above 10 years).

A Quarterly Journal Published by SCMS-COCHIN
SCMS Journal of Indian Management, October-December , 2007. 21
Procedures: Performing a MANOVA test involves the following
stages:
Stage 1: Perform Normality Diagnostic Test on each dependent
variable for each level of independent variable. For example, if we
have two dependent variables and one independent variable
with two categories, then we have to assess four sets of normality
diagnostics (2 dependent variables x 2 levels of the independent
variable = 4). Two statistics are used for this purpose: Kolmogorov-
Smirnov test and Shapiro-Wilk Statistic. These test results should
be insignificant in order to conclude normal distribution of
dependent var iable scores for each category of the
independent variable. But it is very rare to obtain a non-
significant result of these statistics. Hence, we can examine
the Kur tosis and Skewness of the dependent variables for
each category of the independent variable in the model. If
the values are between + or –1, then we need not bother
too much about the violation of normality assumption. To
obta in normal i ty d iagnost ic s ta t i s t ics , c l ick Ana lyze
Descriptive Statistics Explore.
Fig. 1: Data Editor Preparing to perform Explore Operations
In the Explore dialogue box, shift the dependent variables TV set
and Refrigerator to the Dependent List. Similarly, move the
independent variables FLC (family life-cycle) and WWS (wife work
status) to the Factor List. Select Plots… push-button to activate
Explore Plots dialogue box. Check the box Normality plots with
tests. Leave the other options default. Click Continue then click OK
in the main dialogue box.
The following results are produced: Descriptives - which indicate
the entire descriptive statistics viz., mean, median, standard
deviation, minimum and maximum values and such. But, for us
the values of skewness and kurtosis that are important. So long
as these values are between + or – 1, we can be assured of
normality property of the data. These values are computed for
each dependent variable across al l the levels of each
independent variable in the model. Thus the Descriptive table
shown below indicates that the skewness and kurtosis values
are well within the suggested boundary of + or - 1 for most of
the cases (excepting for refrigerator in respect of the second
category of FLC). Hence, it is affirmed that the normality
assumption is not seriously violated. On the contrary, the normality
tests (Kolmogorov-Smirnov and Shapiro-Wilk) are statistically
significant for most of the cases, indicating violations of normality
assumption in both the dependent variables. However, the
normal Q-Q plots in Figure – seem approximately normal that is,
most of the data points fall on the diagonal lines. With these
results, we can confidently affirm that the data are ready for
multivariate analysis.

SCMS Journal of Indian Management, October-December , 2007. 22
A Quarterly Journal Published by SCMS-COCHIN
Fig. 2: Explore Main Dialog Box and Explore Plots Dialog Box to compute
Normality Statistics and generate Normal Q-Q Plots

A Quarterly Journal Published by SCMS-COCHIN
SCMS Journal of Indian Management, October-December , 2007. 23
Fig. 3: Descriptive Statistics for the Dependent Variables TV-set and
Refrigerator separated by the Factor FLC
Descriptives
F L C Std. ErrorStatistic
TV Set 5 years or below Mean 22.6750 .22755
95% Confidence Lower Bound 22.2147
Interval for Mean Upper Bound 23.1353
5% Trimmed Mean 22.6944
Median 22.5000
Variance 2.071
St. Deviation 1.43915
Minimum 20.00
Maximum 25.00
Range 5.00
Interquartile Range 2.00
Skewness .065 .374
Kurtosis -.605 .733
6-10 years Mean 26.0250 .23339
95% Confidence Lower Bound 25.5529
Interval for Mean Upper Bound 26.4971
5% Trimmed Mean 26.0278
Median 26.0000
Variance 2.179
St. Deviation 1.47609
Minimum 23.00
Maximum 29.00
Range 6.00
Interquartile Range 2.00
Skewness -.196 .374
Kurtosis -.051 .733
Above 10 years Mean 29.0750 .22755
95% Confidence Lower Bound 28.6147
Interval for Mean Upper Bound 29.5353
5% Trimmed Mean 29.1389
Median 30.0000
Variance 2.071
St. Deviation 1.43915
Minimum 26.00
Maximum 31.00
Range 5.00
Interquartile Range 2.00
Skewness -.790 .374
Kurtosis -.342 .733

SCMS Journal of Indian Management, October-December , 2007. 24
A Quarterly Journal Published by SCMS-COCHIN
F L C Std. ErrorStatistic
Refrigerator 5 years or below Mean 40.2750 .66889
95% Confidence Lower Bound 38.9220
Interval for Mean Upper Bound 41.6280
5% Trimmed Mean 40.2500
Median 40.0000
Variance 17.897
St. Deviation 4.23046
Minimum 33.00
Maximum 49.00
Range 16.00
Interquartile Range 8.00
Skewness .104 .374
Kurtosis -.930 .733
6-10 years Mean 54.1250 .69077
95% Confidence Lower Bound 52.7278
Interval for Mean Upper Bound 55.5222
5% Trimmed Mean 54.5000
Median 55.0000
Variance 19.087
St. Deviation 4.36881
Minimum 41.00
Maximum 59.00
Range 18.00
Interquartile Range 5.75
Skewness -1.324 .374
Kurtosis 1.321 .733
Above 10 years Mean 61.3000 .22755
95% Confidence Lower Bound 59.3713
Interval for Mean Upper Bound 63.2287
5% Trimmed Mean 61.5000
Median 63.5000
Variance 36.369
St. Deviation 6.03069
Minimum 50.00
Maximum 69.00
Range 19.00
Interquartile Range 10.50
Skewness -.645 .374
Kurtosis -.841 .733
Fig. 4: Results from Tests of Normality for Factor FLC
Tests of Normality
F L CKolmogorov-Smirnova
Statistic d f StatisticSig. d f Sig.
TV set 5 years or below .180 40 .002 .926 40 0.12
6-10 years .148 40 .032 .945 40 .050
Above 10 years .265 40 .000 .867 40 .000
Refrigerator 5 years or below .143 40 .038 .958 40 .143
6-10 years .279 40 .000 .856 40 .000
Above 10 years .173 40 .004 .897 40 .002
Shapiro-Wilk
a. Lilliefors significance correction
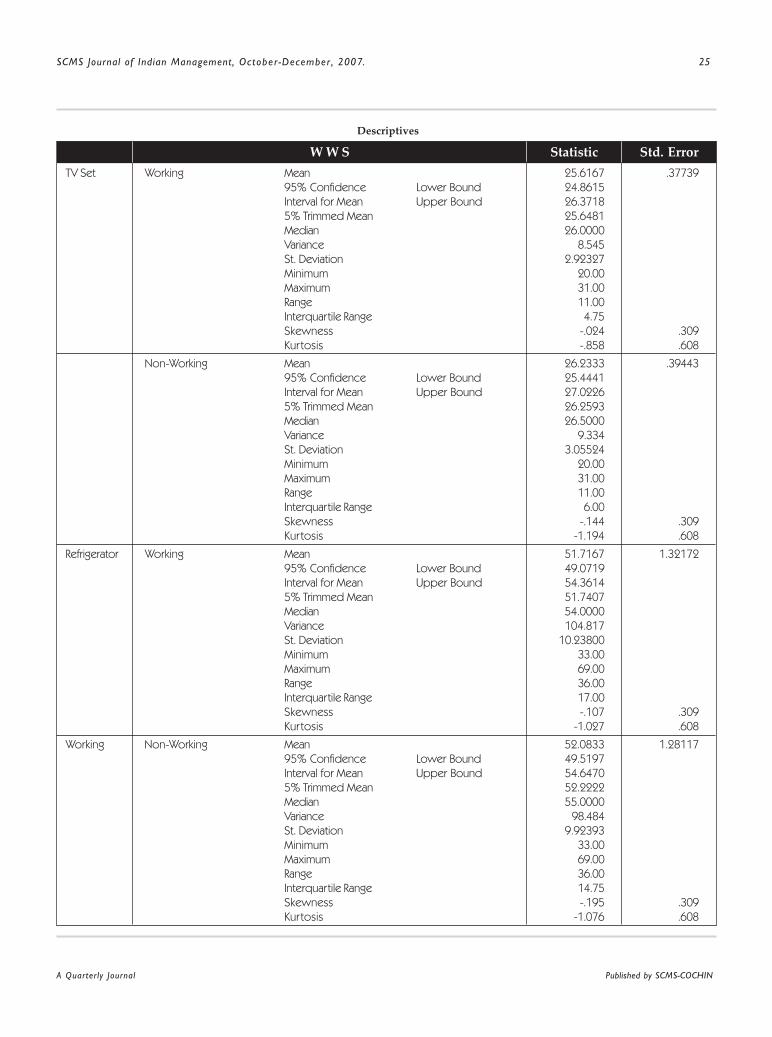
A Quarterly Journal Published by SCMS-COCHIN
SCMS Journal of Indian Management, October-December , 2007. 25
W W S Std. ErrorStatistic
TV Set Working Mean 25.6167 .37739
95% Confidence Lower Bound 24.8615
Interval for Mean Upper Bound 26.3718
5% Trimmed Mean 25.6481
Median 26.0000
Variance 8.545
St. Deviation 2.92327
Minimum 20.00
Maximum 31.00
Range 11.00
Interquartile Range 4.75
Skewness -.024 .309
Kurtosis -.858 .608
Non-Working Mean 26.2333 .39443
95% Confidence Lower Bound 25.4441
Interval for Mean Upper Bound 27.0226
5% Trimmed Mean 26.2593
Median 26.5000
Variance 9.334
St. Deviation 3.05524
Minimum 20.00
Maximum 31.00
Range 11.00
Interquartile Range 6.00
Skewness -.144 .309
Kurtosis -1.194 .608
Refrigerator Working Mean 51.7167 1.32172
95% Confidence Lower Bound 49.0719
Interval for Mean Upper Bound 54.3614
5% Trimmed Mean 51.7407
Median 54.0000
Variance 104.817
St. Deviation 10.23800
Minimum 33.00
Maximum 69.00
Range 36.00
Interquartile Range 17.00
Skewness -.107 .309
Kurtosis -1.027 .608
Working Non-Working Mean 52.0833 1.28117
95% Confidence Lower Bound 49.5197
Interval for Mean Upper Bound 54.6470
5% Trimmed Mean 52.2222
Median 55.0000
Variance 98.484
St. Deviation 9.92393
Minimum 33.00
Maximum 69.00
Range 36.00
Interquartile Range 14.75
Skewness -.195 .309
Kurtosis -1.076 .608
Descriptives

SCMS Journal of Indian Management, October-December , 2007. 26
A Quarterly Journal Published by SCMS-COCHIN
Fig. 5: Results from Tests of Normality for Factor WWS
Tests of Normality
W W SKolmogorov-Smirnova
Statistic d f StatisticSig. d f Sig.
TV set Working .083 60 .200* .960 60 .048
Non-Working .122 60 .027 .940 60 .006
Refrigerator Working .126 60 .019 .956 60 .032
Non-Working .149 60 .002 .955 60 .026
Shapiro-Wilk
Fig. 6: Normal Q-Q Plots
2
0
-2
2 3 2 4 2 5 2 6 2 7 2 8
Observed Value
Ex
pe
cte
d N
orm
al
Normal Q-Q Plot of TVset
for FLC = 6-10 years
2 0 2 2 2 4
Observed Value
1 .5
1 .0
0 .5
0 .0
.0.5
.1 .0
.1 .5
.2 .0
Normal Q-Q Plot of TVset
for FLC = 5 years or below
Ex
pe
cte
d N
orm
al
Observed Value
Ex
pe
cte
d N
orm
al
2
0
-2
1 8 2 0 2 2 2 4 2 6 2 8 3 0 3 2
2
0
. 2
2 6 2 7 2 8 2 9 3 0 3 1 3 2
Observed Value
Normal Q-Q Plot of TVset
for WWS - Working
Normal Q-Q Plot of TVset
for FLC = Above 10 years
Ex
pe
cte
d N
orm
al
* This is a lower bound of the true significance.
a. Lilliefors signifcance correction.
2 9
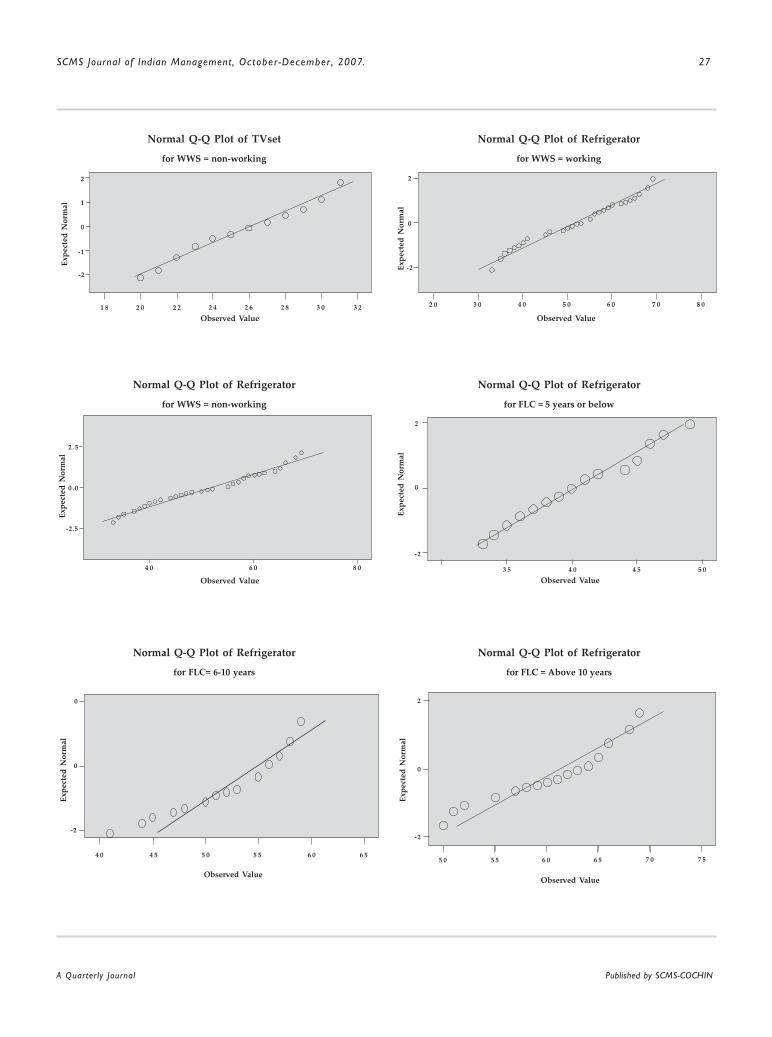
A Quarterly Journal Published by SCMS-COCHIN
SCMS Journal of Indian Management, October-December , 2007. 27
Observed Value
Ex
pe
cte
d N
orm
al
Observed Value
Ex
pe
cte
d N
orm
al
Observed Value Observed Value
2 .5
0 .0
-2.5
4 0 6 0 8 0
2
1
0
-1
-2
1 8 2 0 2 2 2 4 2 6 2 8 3 0 3 22 0 3 0 4 0 5 0 6 0 7 0 8 0
-2
2
3 5 4 0 4 5 5 0
-2
0
2
5 0 5 5 6 0 6 5 7 0 7 5
Ex
pe
cte
d N
orm
al
Ex
pe
cte
d N
orm
al
Ex
pe
cte
d N
orm
al
Ex
pe
cte
d N
orm
al
Observed ValueObserved Value
6 56 05 55 04 54 0
-2
0
0
0
2
0
-2
Normal Q-Q Plot of TVset
for WWS = non-working
Normal Q-Q Plot of Refrigerator
for WWS = working
Normal Q-Q Plot of Refrigerator
for WWS = non-working
Normal Q-Q Plot of Refrigerator
for FLC = 5 years or below
Normal Q-Q Plot of Refrigerator
for FLC= 6-10 years
Normal Q-Q Plot of Refrigerator
for FLC = Above 10 years

SCMS Journal of Indian Management, October-December , 2007. 28
A Quarterly Journal Published by SCMS-COCHIN
Stage 2: Assess the Homogeneity (Equality) of Variance-Covariance
Matrices for the dependent variables through Levene’s test and
Box’s M test statistics. Levene’s statistic can be obtained for each
dependent variable in the model. The level of significance should
be greater than .05 to ensure the equality of variance-covariance
matrices among the combined dependent variate for each level
(category) of the predictor variable(s) in the model. In case the
Levene’s statistic is significant for a particular dependent variable
indicating the violation of the assumption of equality of variance,
then we need to set a more conservative alpha level for determining
the significance for that variable in the univariate F-test which is .025
or .01 rather than the usual .05 level (Tabachnick and Fidell, 1996;
p.80).
This stage involves the execution of MANOVA and is commenced
by clicking Analyze General Linear Model Multivariate.
This opens the Multivariate dialog box as shown under.
The dependent variables are to be selected from the
variable list box in the left hand side and are to be moved
o v e r t o t h e D e p e n d e n t Va r i a b l e s b o x a n d t h e
independent variables to the Fixed Factor(s). Clicking
the Post Hoc pushbut ton wi l l produce Mul t i va r ia te :
P o s t H o c M u l t i p l e C o m p a r i s o n s f o r O b s e r v e d
Means dialog box. Of the two factors used in the present
study viz., FLC and WWS, the former has three levels or
categories. Hence, it becomes necessary to perform post
hoc evaluation. Therefore, the variable FLC is selected
from the Factor(s) box and is moved to the Post Hoc
Tests for box. As has been prescribed earl ier, Tukey ’s
HSD is used for mult iple comparison tests. Therefore,
check the Tukey box under Equal Var iances Assumed
por t ion.
Fig. 7: MANOVA Main Dialog Box and Post Hoc Multiple Comparisons for
Observed Means Dialog Box
Stage 3: Ensure the Dependent Variables Share a Moderate
Amount of Correlation between the pairs of dependent variables
across categories of the independent variable(s) by examining
Bartlett’s test of sphericity whose level of significance should be
less than .05. This gives a confidence to move forward toward
performing MANOVA test. Please note that a high positive
correlation of .8 or above for a pair of dependent variables merely
indicate that these two variables are one and the same or reflect a
same construct. In such cases, it is prudent to combine them into
a single measure or remove one of them.

A Quarterly Journal Published by SCMS-COCHIN
SCMS Journal of Indian Management, October-December , 2007. 29
This requires us to press Options pushbutton from the
Mult ivar iate main dialog box. The Mult ivar iate Options
contains a box named Factor(s) and Factor Interactions in
which the main effect of each factor (independent variable) and
the interaction of the two independent variables (FLC*WWS)
are displayed.
Here, we have moved FLC and WWS to the Display Means for
box. Doing so will produce estimate marginal mean for that
effect in the output. Also, we have to select four check boxes
from the Display box of this dialog box. They are: Descriptive
Statistics that gives means, standard deviations and counts for
each treatment combinations, Estimates of effect size that
gives the partial eta-squared value for each main and interaction
effect, the Residual SSCP matrix that gives the computed Bartlett’s
test of sphericity and the Homogeneity tests that provides
Levene’s test statistic for assessing the homogeneity of variance
assumption. Once done the appropriate selections, go back to
the Multivariate main dialog box and press OK to obtain the
Manova test results as shown below:
Fig. 8: Multivariate Options Dialog Box
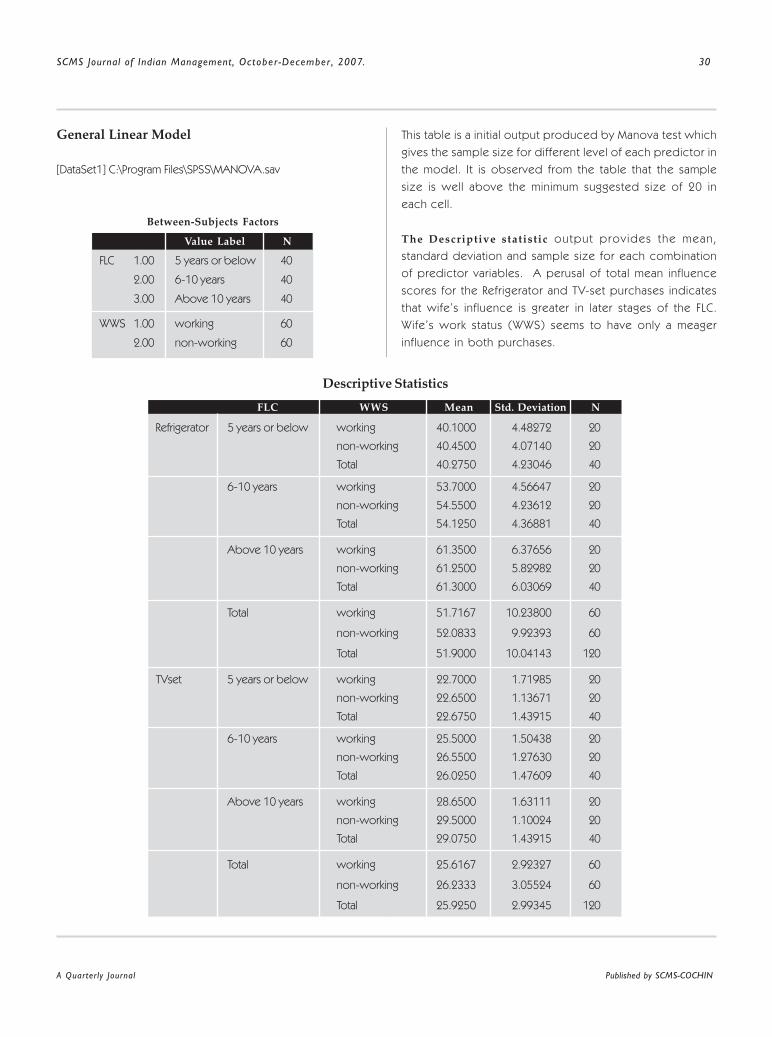
SCMS Journal of Indian Management, October-December , 2007. 30
A Quarterly Journal Published by SCMS-COCHIN
General Linear Model
[DataSet1] C:\Program Files\SPSS\MANOVA.sav
This table is a initial output produced by Manova test which
gives the sample size for different level of each predictor in
the model. It is observed from the table that the sample
size is well above the minimum suggested size of 20 in
each cell.
The Descriptive statistic output prov ides the mean,
standard deviation and sample size for each combination
of predictor variables. A perusal of total mean influence
scores for the Refrigerator and TV-set purchases indicates
that wife’s influence is greater in later stages of the FLC.
Wife’s work status (WWS) seems to have only a meager
influence in both purchases.
Descriptive Statistics
Between-Subjects Factors
FLC 1.00 5 years or below 40
2.00 6-10 years 40
3.00 Above 10 years 40
WWS 1.00 working 60
2.00 non-working 60
NValue Label
NStd. DeviationMean
Refrigerator 5 years or below working 40.1000 4.48272 20
non-working 40.4500 4.07140 20
Total 40.2750 4.23046 40
6-10 years working 53.7000 4.56647 20
non-working 54.5500 4.23612 20
Total 54.1250 4.36881 40
Above 10 years working 61.3500 6.37656 20
non-working 61.2500 5.82982 20
Total 61.3000 6.03069 40
Total working 51.7167 10.23800 60
non-working 52.0833 9.92393 60
Total 51.9000 10.04143 120
TVset 5 years or below working 22.7000 1.71985 20
non-working 22.6500 1.13671 20
Total 22.6750 1.43915 40
6-10 years working 25.5000 1.50438 20
non-working 26.5500 1.27630 20
Total 26.0250 1.47609 40
Above 10 years working 28.6500 1.63111 20
non-working 29.5000 1.10024 20
Total 29.0750 1.43915 40
Total working 25.6167 2.92327 60
non-working 26.2333 3.05524 60
Total 25.9250 2.99345 120
WWSFLC

A Quarterly Journal Published by SCMS-COCHIN
SCMS Journal of Indian Management, October-December , 2007. 31
Box’s Test of Equality of Covariance Matricesa
Box’s M 18.092
F 1.152
df1 15
df2 71084.377
Sig. .302
Tests the null hypothesis that the observed covariance matrices of
the dependent variables are equal across groups.
a. Design: Intercept+FLC+WWS+FLC * WWS
Bartlett’s Test of Sphericitya
Likelihood Ratio .000
Approx. Chl-Square 163.253
df 2
Sig. .000
Tests the null hypothesis that the residual covariance matrix is
proportional to an identity matrix.
a. Design: Intercept+FLC+WWS+FLC * WWS
Levene’s Test of Equality of Error Variancesa
Tests the null hypothesis that the error variance of the dependent
variable is equal across groups.
a. Design: Intercept+FLC+WWS+FLC * WWS
F df1 df2 Sig.
Refrigerator 2.090 5 114 .072
TVset 2.505 5 114 .034
T h e B o x ’ s Te s t o f E q u a l i t y o f C o v a r i a n c e
M a t r i c e s , s h o w n a b o v e i n d i c a t e s t h e d e p e n d e n t
variables’ covariance matr ices are equal across different
levels of predictor var iables. S ince the Box’s M test
stat is t ic is not s igni f icant , we can be assured of the
h o m o g e n e i t y o r e q u a l i t y o f v a r i a n c e - c o v a r i a n c e
assumption (Box’s M=18.092; p<.302). Hence we have
no t v io l a ted t he equa l i t y a s sumpt ion o f v a r i ance -
covar iance matr ices.
T h e B a r t l e t t ’ s Te s t o f S p h e r i c i t y , w h i c h a s s e s s e s
the presence of su f f ic ien t cor re la t ion between the
dependent var iables is s igni f icant (Chi-square 163.253;
p<.000) thus assur ing that we have not v iolated the
i m p o r t a n t a s s u m p t i o n o f c o r r e l a t i o n a m o n g t h e
dependent var iables. Th is f inding makes us st i l l more
conf idence in proceeding with the analys is .
The Levene’s Test of Equality of Error Variances computed
separately for each dependent variable is statistically non-significant
for Refrigerator (p<.072) thus suggesting equality of error variances
across different levels of the predictors in the model, in this case
FLC. In case of significant Levene’s statistic as found for the TV-set
in the present case (p>.034), we can follow the criterion of more
stringent alpha of .025 or .01 rather than the conventional .05 while
assessing the statistical significance of that factor in the univariate
analysis (Tbachnik and Fidell, 1996; p.80).
Stage 4: Once we are satisfied with the assumptions of normality,
variance-covariance and correlation among the dependent variables,
it is time to examine the main MANOVA test results. This is
done by examining the four multivariate test statistics and their
equivalent F values. The four multivariate test statistics are: Pillai’s
trace, Wilks’ Lambda, Hotelling’s T and Roy’s Largest Root. A
significant multivariate statistics (be it Pillai’s trace, Wilks’ lambda,
Roy’s largest root or Hotelling’s T) is an indication that the mean
value of dependent variate is not equal across different levels of
that independent variable. However, Wilks’ lambda is the widely
reported multivariate test statistic. The Wilks’ lambda is the ratio of
within group variation to total variation. A smaller lambda provides
more evidence of treatment effect (Stevens, 2002). A significant
Wilks’ lambda obtained for an independent variable is an indication
that that specific independent variable got an effect on the set of
dependent variables.
As shown in the Multivariate Tests result table, we find that
the main effects of both FLC and WWS factors are statistically
significant, though it is only marginally significant for WWS
(p<.056). The Wilks’ Lambda is superbly small (.159; p<.000)
as compared to WWS (.950; p<.056). This signifies the fact
that the family-life cycle (FLC) plays a vital role in the spousal
influence in the purchase of durable goods. The absence of
an interaction effect of FLC and WWS indicates us that each of
these factors is unique in influencing the spousal power
structure in the purchase decision making. Thus the statistically
significant main effects lead us to reject the null hypothesis
that the mean vectors of the dependent variables are equal for

SCMS Journal of Indian Management, October-December , 2007. 32
A Quarterly Journal Published by SCMS-COCHIN
Multivariate Testsc
Partial EtaSquared
Sig.Error dfHypothesis
dfFValueEffect
Intercept Pillai’s Trace .997 20813.974a 2.000 113.000 .000 .997
Wilk’s Lambda .003 20813.974a 2.000 113.000 .000 .997
Hotelling’s Trace 368.389 20813.974a 2.000 113.000 .000 .997
Roy’s Largest Root 368.389 20813.974a 2.000 113.000 .000 .997
FLC Pillai’s Trace .891 45.832 4.000 228.000 .000 .446
Wilk’s Lambda .159 85.290a 4.000 226.000 .000 .602
Hotelling’s Trace 4.982 139.492a 4.000 224.000 .000 .714
Roy’s Largest Root 4.918 280.302b 2.000 114.000 .000 .831
WWS Pillai’s Trace .050 2.965a 2.000 113.000 .056 .050
Wilk’s Lambda .950 2.965a 2.000 113.000 .056 .050
Hotelling’s Trace .052 2.965a 2.000 113.000 .056 .050
Roy’s Largest Root .052 2.965a 2.000 113.000 .056 .050
FLC * WWS Pillai’s Trace .035 1.001 4.000 228.000 .408 .017
Wilk’s Lambda .966 1.000a 4.000 226.000 .409 .017
Hotelling’s Trace .036 .998 4.000 224.000 .409 .018
Roy’s Largest Root .034 1.943b 2.000 114.000 .148 .033
a. Exact statistic b. The statistic is an upper bound on F that yields a lower bound on the significance level.
c. Design: Intercept+FLC+WWS+FLC * WWS
FLC and WWS factors. A perusal of the Par tial Eta-squared for
each of the main effects and the interaction effect gives us an
idea about the amount of variance explained by the each factor
on the dependent variable. Needless to say, FLC explains more
variance (60 per cent) than the one explained by WWS which
is a mere five percentage.
Stage 5: Once we have found significant multivariate effect, we
have to examine the univariate F-statistics associated with
each dependent variable. This univariate F-statistics is the ratio
of between-group variance (variation due to treatment) and with-
in group variance (variation due to measurement error). These
univariate F-statistics are available in the same table in which we
have obtained the main Manova results. It is recommended to
perform a Bonferroni-Adjustment for each dependent variable for
which the univariate F-statistic is found significant. The Bonferroni-
Adjustment is done by dividing the alpha level (usually .05) by the
number of levels or categories in the independent variable.
Suppose, if the independent variable has got three categories, the
Bonferroni-Adjusted alpha will be .05/3=.016. Now, we have to
compare the old level of significance against this newly adjusted
level of significance. If the old level of significance is less than the
Bonferroni-adjusted level of significance, we can conclude that
the mean score of the dependent variable is significant difference
across the levels of the independent variable(s).
Accordingly the univariate F-statistic is significant for both the factors
included in the model: the Bonferroni-adjusted F value of .016 is
higher than the originally obtained level of significance of .000 for
FLC on Refrigerator and Television set. This is an indication that FLC
plays a vital role in the spousal influence on durables purchases.
On the other hand, the Bonferroni-adjusted F-value of .025 is higher
than the original level of significance of .019 for WWS on TV-set
alone and not for Refrigerator. Like the multivariate test statistic, the
univariate test statistic too, does not reveal any significant difference
for the interaction of the factors viz. FLC and WWS, thus confirming
our earlier observation of main effects only.
Stage 6: Perform a Post Hoc Test. If an independent variable
has got three or more categories, then a post-hoc test should be
performed to examine how the categories of that independent
variable are different from each other. This is known as a post hoc

A Quarterly Journal Published by SCMS-COCHIN
SCMS Journal of Indian Management, October-December , 2007. 33
test. For example, if there are three categories in an independent
variable, then we need to perform n (n-1)/2 i.e. 3(3-1)/2 =3 pair-
wise comparisons say, category 1 vs.2, 1 vs.3 and 2 vs.3. SPSS
provides 18 such post hoc tests. Nonetheless, Scheffe’s test is
considered conservative and therefore recommended for the post
Tests of Between-Subjects Effects
Partial EtaSquared
Sig.FMean
Squaredf
Type III Sumof SquaresSource Dependent Variable
Corrected Model Refrigerator 9146.600a 5 1829.320 73.116 .000 .762
TVset 838.075b 5 167.615 83.716 .000 .786
Intercept Refrigerator 323233.200 1 323233.200 12919.355 .000 .991
TVset 80652.675 1 80652.675 40282.168 .000 .997
FLC Refrigerator 9138.050 2 4569.025 182.620 .000 .762
TVset 819.800 2 409.900 204.726 .000 .782
WWS Refrigerator 4.033 1 4.033 .161 .689 .001
TVset 11.408 1 11.408 5.698 .019 .048
FLC * WWS Refrigerator 4.517 2 2.258 .090 .689 .002
TVset 6.867 2 3.433 1.715 .185 .029
Error Refrigerator 2852.200 114 25.019
TVset 228.250 114 2.002
Total Refrigerator 335232.000 120
TVset 81719.000 120
Corrected Total Refrigerator 11998.800 119
TVset 1066.325 119
a. R Squared = .762 (Adjusted R Squared = .752) b. R Squared = .786 (Adjusted R Squared = .777)
hoc tests. If the level of significance is less than .05 for a pair of
comparison, then it can be inferred that the groups in that pair are
significantly different from each other. By studying the mean values
of these groups, we can find out which group is greater or lesser
on the dependent variable.
Estimated Marginal Means
1. F L C
95% Confidence Interval
Lower Bound Upper BoundStd. ErrorMean
Refrigerator 5 years or below 40.275 .791 38.708 41.842
6-10 years 54.125 .791 52.558 55.692
Above 10 years 61.300 .791 59.733 62.867
TVset 5 years or below 22.675 .224 22.232 23.118
6-10 years 26.025 .224 25.582 26.468
Above 10 years 29.075 .224 28.632 29.518
Dependent Variable FLC
Scanning through the Estimated Marginal Means table for each
factor indicates that the wife’s influence shows an increasing trend
moving from one level to the next level of FLC hierarchy for
both the products studied namely, refrigerator and television-
set. As revealed in the Post Hoc Tests table, the perceived
spousal influence is more of ‘wife-dominance’ in the purchases
of both refrigerator and television-set as one move up in the
echelon of FLC.

SCMS Journal of Indian Management, October-December , 2007. 34
A Quarterly Journal Published by SCMS-COCHIN
Conclusion
The process of performing a factorial MANOVA test using a
six-stage approach was illustrated for a study on investigating
the impact of family life-cycle and wife’s work status in the
purchase of durable goods. As a robust technique, MANOVA
reduces the risk of type-1 error by considering all the
dependent variables together. This is the only technique that
can be performed when the independent variables are
measured on nominal scales and the dependent variables on
continuous scale. While this technique is widely adopted by
the researchers in all disciplines elsewhere its prevalence is
almost a non-entity as far as Indian scenario is concerned. This
ar ticle is plenary in nature in explaining the rudiments,
assumptions, requirements and more impor tant ly the
sequences involved in performing this major multivariate test
through a versatile software SPSS version 14.0. It is hoped that
this ar ticle being an eye-opener, will enhance the readers’
interest in fur thering the applicability of this robust tool for
data analysis.
References
Hair, J.F., Anderson, R.E., Tatham, R.L., and Black, W.C. Multivariate
Data Analysis (5th Edition). Upper Saddle River, NJ: Prentice
Hall, 1998.
Israel, D. “Impact of Relative Resource Contribution on Spousal
Domiance in Durables Purchase Decisions.” Working
Paper. Jamshedpur: XLRI, 2006.
Meyers, L.S., Gamst, G., and Guarino, A.J. Applied Multivariate
Research: Design and Interpretation. Sage Publications,
London: 2006.
Tabachnik, B.G., and Fidell, L.S. Using Multivariate statistics (3rd
Edition). New York: Harper Collins,1996.
Multiple Comparisons
95% Confidence Interval
Lower Bound Upper BoundStd. Error
MeanDifference
(I-J)
Refrigerator 5 years or below 6-10 years -13.8500* 1.11847 .000 -16.6241 -11.0759
Above 10 years -21.0250* 1.11847 .000 -23.7991 -18.2509
6-10 years 5 years or below 13.8500* 1.11847 .000 11.0759 16.6241
Above 10 years -7.1750* 1.11847 .000 -9.9491 -4.4009
Above 10 years 5 years or below 21.0250* 1.11847 .000 18.2509 23.7991
6-10 years 7.1750* 1.11847 .000 4.4009 9.9491
TVset 5 years or below 6-10 years -3.3500* .31640 .000 -4.1348 -2.5652
Above 10 years -6.4000* .31640 .000 -7.1848 -5.6152
6-10 years 5 years or below 3.3500* .31640 .000 2.5652 4.1348
Above 10 years -3.0500* .31640 .000 -3.8348 -2.2652
Above 10 years 5 years or below 6.4000* .31640 .000 5.6152 7.1848
6-10 years 3.0500* .31640 .000 2.2652 3.8348
Dependent Variable (I) FLC (J) FLC
Based on observed means.
* The mean difference is significant at the .05 level.
Sig.
Post HOC TestsFLC
Scheffe
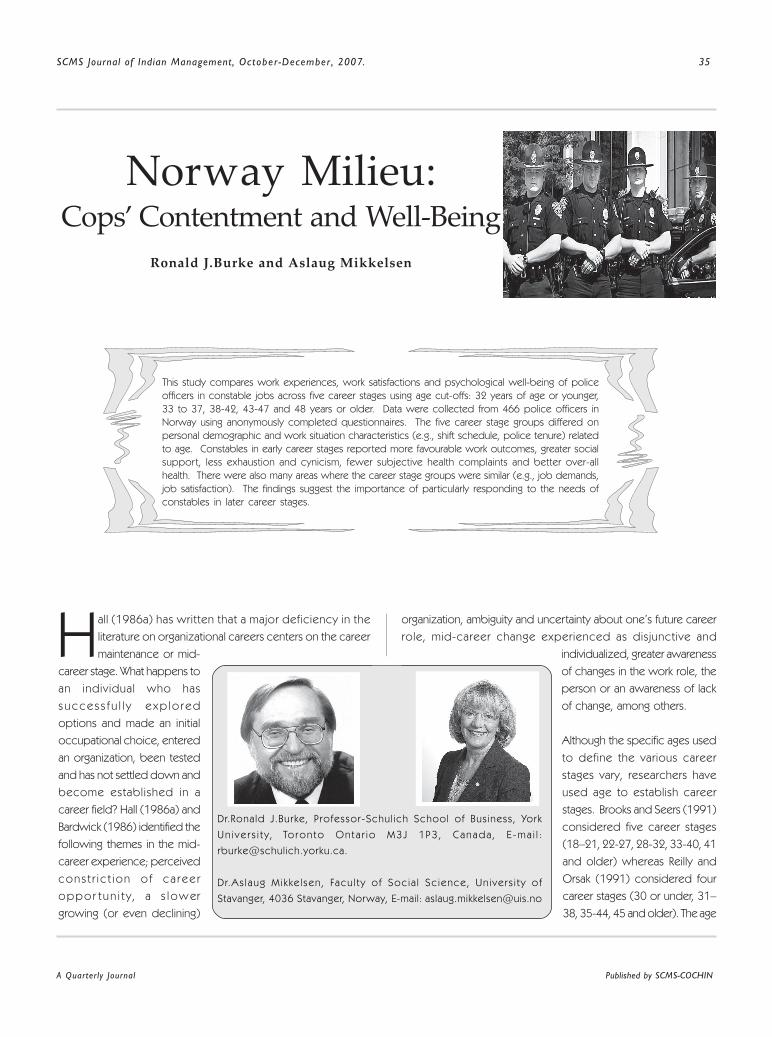
A Quarterly Journal Published by SCMS-COCHIN
SCMS Journal of Indian Management, October-December , 2007. 35
Norway Milieu:Cops’ Contentment and Well-Being
Ronald J.Burke and Aslaug Mikkelsen
H
This study compares work experiences, work satisfactions and psychological well-being of police
officers in constable jobs across five career stages using age cut-offs: 32 years of age or younger,
33 to 37, 38-42, 43-47 and 48 years or older. Data were collected from 466 police officers in
Norway using anonymously completed questionnaires. The five career stage groups differed on
personal demographic and work situation characteristics (e.g., shift schedule, police tenure) related
to age. Constables in early career stages reported more favourable work outcomes, greater social
support, less exhaustion and cynicism, fewer subjective health complaints and better over-all
health. There were also many areas where the career stage groups were similar (e.g., job demands,
job satisfaction). The findings suggest the importance of particularly responding to the needs of
constables in later career stages.
Dr.Ronald J .Burke, Professor-Schul ich School of Business, York
Un i ve r s i t y , To ron to On ta r io M3J 1P3 , Canada , E -ma i l :
Dr.As laug Mikke lsen , Facu l ty of Soc ia l Sc ience, Un ivers i ty of
Stavanger, 4036 Stavanger, Norway, E-mail: [email protected]
all (1986a) has written that a major deficiency in the
literature on organizational careers centers on the career
maintenance or mid-
career stage. What happens to
an individual who has
succes s f u l l y exp lo red
options and made an initial
occupational choice, entered
an organization, been tested
and has not settled down and
become established in a
career field? Hall (1986a) and
Bardwick (1986) identified the
following themes in the mid-
career experience; perceived
cons t r i c t ion o f ca ree r
oppor tun i t y , a s low er
growing (or even declining)
organization, ambiguity and uncertainty about one’s future career
role, mid-career change experienced as disjunctive and
individualized, greater awareness
of changes in the work role, the
person or an awareness of lack
of change, among others.
Although the specific ages used
to define the various career
stages vary, researchers have
used age to establish career
stages. Brooks and Seers (1991)
considered five career stages
(18–21, 22-27, 28-32, 33-40, 41
and older) whereas Reilly and
Orsak (1991) considered four
career stages (30 or under, 31–
38, 35-44, 45 and older). The age

SCMS Journal of Indian Management, October-December , 2007. 36
A Quarterly Journal Published by SCMS-COCHIN
ranges used in the present study fit the typical cut-offs observed
by Morrow and McElroy (1987).
There is also increasing evidence that individuals pass through a
series of psychosocial stages as they develop. Fagan and Ayers
(1982), in an interview study of 23 police officers having a mean
age of 33.9, found they passed through a series of psychosocial
stages. They observed that officers tended to split into two groups
– an active (usually promoted) group and a resigned group in their
early 30’s.
There is also research support for the notion that not only do
different factors increase or decrease in importance across various
career stages, but the importance of various factors in predicting
particular work outcomes also varies across career stages (Gould
and Hawkins, 1978; Isabella, 1988; Jans, 1989; Hurrell, McLaney
and Murphy, 1990; Cohen, 1991; Brooks and Sears 1991; Lynn,
Cao and Horn, 1996).
Bedeian, Pizzolatto, Long and Griffeth (1991) review the writing on
career stages. Career stage models build on three central
assumptions: individuals progress through distinct career stages,
each having unique and distinct developmental tasks; each stage is
characterized by different work attitudes and behaviours; and
individuals in the same career stage tend to behave and respond in
similar ways.
Three operationalizations of career stages have been used: age
ranges organizational tenure and job tenure. Unfortunately there is
still little consensus on the actual ages/years that one should use to
create the stages. It is also critical to select dependent variables that
would be relevant to career stage theory (Slocum and Cron, 1985).
It is also not clear the extent to which findings obtained in one
occupation will generalize to the same career stages in another
occupation.
Cooper (1982) described ways in which police officers’ beliefs
and feelings differ over the course of a career. How did police
officers go from being newcomers to veterans? Some officers
held positive views about policing throughout their careers; many
did not, becoming jaded and cynical. The reality for most falls
somewhere in between these two extremes; the situation of never-
promoted constables can be particularly problematic however.
He gathered questionnaire and qualitative interview data from sixty
police officers working in a large Canadian regional police force.
The sample was deliberately diverse. Officers were assigned to six
career stages: less than one year, one to two years, three to seven
years, nine or more years as constables, sergeants and staff sergeants
in patrol and traffic, and sergeants and staff sergeants in CID.
The first stage (first year) involved “breaking in” reality shock at this
time took many forms. Officers at this stage learned from more
experienced constables. Early views on promotion criteria were
developed but these were coloured by uncertainty. The second
stage involved “settling in.” As officers got more experience, their
views on promotion criteria changed, giving more weight to political
factors. Conflicts about their role also increased. The third stage,
“making out,” showed greater interest in promotion by constables.
Considerable effort was made to decipher the promotion decision-
making process; visibility became a more important factor. The
costs or toll of police work also increased at this stage.
Officers who were promoted and those who were passed over
now began to view their careers differently. Those continually passed
over became resigned; while still performing their duties, non-career
areas rose in importance. And as they got older (45 to 50), it was
more difficult to actually do the job. Some became bitter, blaming
the system for failing to see their merits. Those who were promoted
(sergeant level) faced other challenges as they now helped to
develop more junior constables. Over time, constables became
hardened, less willing to trust others (particularly the public) and
more willing to give and receive support from other officers. Family
problems increased over time. Job demands and stresses also
increased, some demands stimulating and others debilitating.
McGinnis (1985a) reported the findings of a career development
study conducted in a medium-sized Canadian police force. For
most people, the notion of a career embodies upward mobility
and advancement. The organization is the context, having both
constraints and opportunities, in which careers unfold. Police
forces may also have some unique career development issues.
First, they have a steeply graded hierarchy with about 75 per cent of
officers in constable rank. Promotions are now slower with a 15
year constable more common. Second, forces have little turnover;
job security is high, transferability of skills is low and transfer across
forces is low. Third, new recruits are better educated than previously
and they have higher expectations of promotions more rapidly.
McGinnis collected questionnaire data from 253 officers as well as
conducting interviews with 140 officers. He assigned respondents
to one of ten career stages: from (1) constables, one to five years, to

A Quarterly Journal Published by SCMS-COCHIN
SCMS Journal of Indian Management, October-December , 2007. 37
(10) Senior Officers. Constables were placed into four groups: one to
five years, six to ten years, 11-15 years, and 16 or more years. Several
sergeant groups were also considered. These were based on police
tenure (length of service), rank, and type of assignment. Lower ranked
constables were more highly educated. Higher ranked officers were
generally more satisfied with work, supervisors, pay, promotion and
co-workers. Those in lower stages were also less motivated. Constables
having 10-15 years experience indicated the lowest career satisfaction.
Constables were dissatisfied with career planning opportunities,
performance appraisal and promotion policies.
McGinnis (1985b), in the same study of Canadian police officers, reported
that about half his respondents aspired to senior officer rank leading him
to conclude that there will be great frustration and disappointment since
few will achieve this goal. No one wanted to spend a career as a patrol
constable – the backbone of a police force. Patrol work has low status.
Policies and practices of personnel assignment and promotions
downgrade the status of patrol and patrol constables. Uniformed patrol
constables are the largest group in a police force.
He reported additional findings from interviews conducted with
members of his larger questionnaire sample. Some major career
issues were identified: favouritism, unable to plan a career or get
desired assignments, lots of competition for others. Lower ranks
(tenure and career stage) used less of their abilities; this was
particularly low in the year one to five and 11-15 year groups,
the latter being the lowest of the constables. Police personnel
were oriented towards promotion. The probability of obtaining
Table 1: Demographic Characteristics of Sample
Year of Birth N % Marital Status N %
1950 or earlier 16 3.7 Single 100 22.2
1951-1960 76 17.4 Married 350 77.9
1961-1970 190 43.6
1971 and later 154 35.3 Partner in Policing
Yes 62 13.9
Education No 385 86.1
13 years or less 40 9.0
14-16 282 63.2 Parental Status
17 or more 124 27.8 Children 368 69.8
Childless 133 30.2
Location
Rural 123 27.3 Police Tenure
Urban 328 72.7 10 years or less 216 48.1
11-20 148 37.0
Size of Department 31 years or more 85 18.9
1-19 106 24.0
20-49 99 22.5 Hours worked
50-99 65 14.7 35 or less 50 11.9
100 or more 171 38.8 36-39 358 85.0
40 or more 13 3.1
Shift work
Regular 43 9.7 Overtime Hours
Sometimes 164 36.9 0-5 278 73.5
Around the Clock 238 53.5 6 or more 100 26.5
Gender
Male 352 78.0
Female 99 22.0

SCMS Journal of Indian Management, October-December , 2007. 38
A Quarterly Journal Published by SCMS-COCHIN
another career move was lowest in constables with 11-15 years
experience. This group was also low in numbers expecting
promotion. Promotions were becoming less common and
more career constables will result, so the job satisfaction of
these officers became more important. The extent to which
accomplishments were appreciated was lowest in 10-15 year
constables among the three constable groups. McGinnis then
divided his sample into: Patrol constables, one to five years,
Patrol constables six to ten years and 11-15 years, Patrol
constables 16 years and longer, and constables in
administration. Constables with 11-15 years tenure were least
satisfied; constables in administration were also dissatisfied.
The p resen t r e sea rch compa res a v a r i e t y o f wor k
experiences, satisfactions and health outcomes among a
large sample of Norwegian police officers of constable
rank across f ive age-based career stages. It replicates
these earlier studies in another country using more current
data.
Method
Respondents
Table 1 shows the demographic characterist ics of the
police sample (N = 451). Most respondents were married
(78 per cent), had children (70 per cent), worked in urban areas
(73 per cent), worked in large departments (100 or more, 39
per cent) worked between 36-39 hours per week (89 per cent),
worked five or less hours of overtime per week (74 per cent),
held fairly short police tenure (10 years or less, 48 per cent) and
were born in 1970 or before (65 per cent).
Procedure
Data were collected from 766 police officers in 2003 using
anonymously completed questionnaires, resulting in a sixty
two per cent response rate. Questionnaires were mailed
by the Pol ice union and returned to an independent
research institute. Some measures were translated from
English to Norwegian for this study while other measures
had already been translated into Norwegian (e.g. Maslach
Burnout Inventory). Only police officers at constable rank
were identified and included in this analysis of career stage
differences.
Career Stage N %
32 years or younger 154 35.3
33-37 111 25.4
38-42 79 18.1
43-47 49 11.2
48 years or older 43 9.9
436 99.9
Measures
Career Stages
Men and women serving in police constable jobs were divided
into f ive career stages using age cut-offs that formed
adequately sized groups. These groups are shown in Table 2.
The youngest group was the largest (n = 154, 35 per cent),
with each increasingly older career stage group becoming
progressively smaller.
Table 2: Career Stages of Constables
Personal Demographic and Work
Situation Characteristics
A number of personal demographic and work situation
characteristics (e.g. age, marital status, organization size, police
tenure) were measured by single items typical of those used by
others.
Work demands
A number of work demands were measured by scales from the
Copenhagen Psychosocial Questionnaire (COPSOC) developed
by Kristensen and Borg (2001).
Quantitative demands were measured by a seven item scale
( = .83). Respondents indicated their agreement with each
item on a five point scale (5 = Always, 3 = Sometimes, 1 =
Never/hardly ever). A sample item was “Do you have to work
very fast?”
Cognitive demands were assessed by an eight item scale
( = .82). One item was “Does your work require you to make
difficult decisions?”
A Quarterly Journal Published by SCMS-COCHIN
SCMS Journal of Indian Management, October-December , 2007. 39
Emotional demands were measured by a three item scale
( = 80). An item was “Does your work put you in emotionally
disturbing situations?”
Demands for Hiding Emotions were assessed by two items
( =.59). One item was “Does your work require that you hide
your feelings?”
Sensorial demands were measured by a five item scale ( = .58).
An item was “Does your work require a great deal of
concentration?”
Responsibility was assessed by a three item scale ( = .58). One
item was “Could it injure other people if you make mistakes in your
work?”
Role clarity was measured by a four item scale ( = .76) anchored
by (5) to a large extent, (3) somewhat, and (1) to a very small
extent. One item was “Do you know exactly which areas are your
responsibility?”
Role conflict was assessed by a four item scale ( - .71). An item
was “Are contradictory demands placed on you at work?
Leadership quality was measured by an eight item scale
( = .94). A sample item was “To what extent would you say that
your immediate superiors appreciate the staff and show
consideration for the individual?”
Access to information was measured by two items ( = .79).
One item was: Do you receive all the information you need to do
your work well?”
Feedback was measured by two items ( = ), part of COPSOQ.
An item was “How often do you talk with your supervisor.”
Work and Family
Work family conflict was measured by a five item scale ( = .83)
developed by Torgen, Stenlund, Ahlberg and Marklund (2001). An
item was “My work has a negative impact on my family.”
Spouse/Partner concerns were also measured by a five item scale
( = .78) developed by Torgen, et al (2001). An item was “My
spouse/partner worries that my job is affecting my health.”
Work outcomes
Five work outcomes were included, all from the COPSOQ
(Kristensen and Borg, 2001).
Job satisfaction was measured by seven items ( = .75).
Respondents indicated how satisfied they were with each item on
a four-point scale: (4) Very satisfied, (1) highly unsatisfied. One
item was “How satisfied are you with your usual take home pay?
Organizational commitment was measured by four items
( = .58). An item was “Do you enjoy telling others about your
place of work?” Responses were made on a five-point scale (5, to
a large extent, 1 = to a very small extent)
Development was assessed by seven items ( =.76). An item
was “Do you have the possibility of learning new things through
your work?”
Freedom was measured by four items ( =.77). One item was
“Can you decide when to take a break at work?”
Meaning was measured by five items ( = .79). One item was
“Do you feel that the work you do is important?”
Influence was measured by ten items ( = .80). An item was
“Do you have a large degree of influence concerning your work?”
Social Resources
Three coping and social resources were considered.
Social Support was measured by a four item scale ( = .79) from
the COPSOQ (Kristensen and Borg, 2001). An item was “How
often do you get help and support from your colleagues?”
Responses were made on a five-point scale (5 = to a large extent,
1 = to a very small extent).
Social Relations were assessed by a two item scale ( =.58)
developed by Kristensen and Borg (2001). An item was “Is it
possible for you to talk to your colleagues while you are working?”
Responses were made on a five point extent scale.
Sense of Community was measured by three items ( = .84).
An item was “Do you feel part of a community at work?”

SCMS Journal of Indian Management, October-December , 2007. 40
A Quarterly Journal Published by SCMS-COCHIN
Psychological Well-Being Burnout
Three components of burnout were measured by the Maslach
Burnout Inventory – General Survey (MBI-GS) developed by
Schaufeli, Leiter, Maslach and Jackson (1996).
Exhaustion was measured by five items ( =.86). One item was “I
feel emotionally drained from my work?”
Cynicism was also measured by five items ( =.78). “I have become
less enthusiastic about my work.”
Professional Efficacy was measured by six items ( =.80). “At my
work, I feel confident that I am effective at getting things done.”
Respondents indicated how frequently they experienced each item
on seven point frequency scale (0 = never, 6 = always).
Psychological Health
Five measures of psychological health were included.
Subjective Health Complaints were measured by a 29 item scale
( =.89) developed by Eriksson, Ihlebaek and Ursin (1999).
Respondents indicated how frequently they experienced each
complaint or symptom (e.g. headache, lower back pain dizziness)
during the past month.
Medication use was measured by a five item scale ( =.39).
Respondents indicated how frequently they had taken each
medication (e.g. sleeping pills, pain killers) during the past year.
Post Traumatic Stress Symptoms (PTSS) were measured by a ten
item scale ( =.92) developed by Knudsen, Weisaeth, Lerdal,
Wahl, Rustoen and Hanestad (2002). Respondents indicated how
often they experienced each symptom (e.g. depression, irritability)
on a seven point scale (1=never, 7=very often).
Anxiety was measured by seven items ( =.83) developed by
Zigmond and Snaith (1983). One item was “Worrying thoughts go
through my mind.” Responses were made on a four-point frequency
scale (1 = Only occasionally, 4 = A great deal of the time).
Depression was assessed by six items ( =.82) also developed
by Zigmond and Snaith (1983). An item was “I feel cheerful”
(reverse scored). Responses were made on the same four point
frequency scale used for Anxiety. Bjelland, Dahl, Haug and
Neckelmann (2002) present more recent evidence of the validity
of both the Anxiety and Depression scales.
Suicidal Ideation
Suicidal ideation was assessed by a four item measure ( = .84)
developed by Paykel, Myers, Lindenthal and Tanner (1974) and
used later by others (see Tyssen, Vaglum, Gronvold and Ekeberg,
2001). The items were: (1) Have you ever felt that life was not
worth living? (2) Have you ever wished you were dead?” (3) “Have
you ever thought of taking your own life even if you would not
really do it?” (4) “Have you ever reached the point where you
seriously considered taking your life, or perhaps made plans how
you would go about doing it?” A fifth item then asked, “Have you
tried to take your own life in the past year?” (yes/no). This question
was not used in the analysis since so few police officers had
attempted suicide (n = 1 male).
Physical Health
Respondents described their levels of physical health absenteeism
and life style behaviours on eight single item measures.
“Generally how is your health?”
“Have you taken any sick leave during the past six months?”
“If yes, how many sick days have you taken?”
“How would you rate the level of your physical fitness?”
Lifestyle Behaviours
“Do you take part in regular physical exercise (over 30
minutes per day)?”
“Do you smoke?”
“How many alcoholic drinks have you had in the past 14
days?”
“How often do you drink alcoholic beverages?”
Results
Demographic Characteristics
Table 3 shows the comparisons of the five career stage groups on
a number of demographic characteristics using one-way ANOVA;
when the overall F-value was statistically significant (p<.05), all pair
wise comparisons were undertaken. Some of the significant
differences shown in Table 3 were expected as they were related
to age.

A Quarterly Journal Published by SCMS-COCHIN
SCMS Journal of Indian Management, October-December , 2007. 41
Table 3: Demographic Characteristics over Career Stages*
Table 4: Job Demands over Career Stages
The following comments are offered in summary. There were no
career stage differences on marital status, urban vs. rural location,
size of force, hours worked per week and overtime hours worked.
Almost all of the other groups’ differences were expected. There
were more women in the first than last career stage reflecting the
recent entrance of women into police work. Respondents in later
career stages had more children reflecting their greater age. Respondents
in early career stages were more highly educated reflecting the greater
emphasis now being placed on formal education. Respondents in
later career stages were older, and had longer police tenure reflecting
their greater ages. Finally, respondents in later career stages were less
likely to work continuous shifts reflecting their greater seniority.
Gender .3a .3 .2 .1 .0a .01
Marital status 1.7 1.8 1.8 1.8 1.8 NS
Number children .5abcd 1.6aefg 2.0be 2.2cf 2.4dg .001
Education 16.5abcd 15.6aef 15.1bg 14.5ce 13.9dfg .001
Rural/urban 1.7 1.7 1.7 1.9 1.7 NS
Age 29.6abcd 35.3aefg 40.2behi 45.1cfhj 50.5dgij .001
Police tenure 3.9abcd 10.6aefg 15.8behi 21.8cfhj 25.4dgij .001
Size of force 4.6 4.6 4.4 4.6 4.0 NS
Shift schedule 2.6ab 2.4 2.4 2.3a 2.2b .01
Hours worked 36.4 37.0 36.0 35.3 37.3 NS
Overtime hours 4.9 5.3 3.5 3.8 3.7 NS
Career StagesDemographicCharacteristics 1 2 3 4 5 P
* Career stages having the same superscripts are significantly different (p < .05)
Quantitative 48.9 51.5 51.4 52.2 47.5 NS
Cognitive 58.8 60.1 60.6 57.1 58.6 NS
Emotional 41.8 44.6 43.3 41.2 43.8 NS
Hide emotions 43.3 43.0 42.5 42.3 42.4 NS
Sensorial 72.0a 68.8 68.3 63.1a 67.3 .01
Responsibility 59.8a 56.0 53.7 50.8a 52.1 .01
Information 51.0 54.9 56.6 50.8 53.5 NS
Role clarity 70.3 72.0 75.6 73.3 75.0 NS
Role conflict 42.4 44.8 39.7 42.6 41.7 NS
Leadership 53.3 53.9 55.4 47.6 54.1 NS
Feedback 38.7a 40.7b 33.2 32.4 23.8ab .001
Career StagesJob Demands
1 2 3 4 5 P
* Career stages having the same superscripts are significantly different (p < .05)

SCMS Journal of Indian Management, October-December , 2007. 42
A Quarterly Journal Published by SCMS-COCHIN
Burnout
Exhaustion 1.2abc 1.5a 1.6b 2.0c 1.5 .001
Cynicism 1.5abc 2.1ad 2.0e 2.7bde 2.0c .001
Efficacy 4.7 4.7 4.5 4.3 4.4 .05
Work and Family
Health complaints 5.6a 6.6 5.6 8.5a 7.3 .05
Medication use 5.6 5.8 5.6 6.2a 6.1 .05
Anxiety 3.6 3.9 4.0 4.6 4.1 NS
Depression 2.2abc 2.8de 3.3af 4.7bdf 4.3ce .001
Post traumatic 16.2a 19.0a 16.5 18.8 17.9 .05
Suicidal ideation .0 .1 .1 .2 .2 NS
Career Stages
1 2 3 4 5 P
* Career stages having the same superscripts are significantly different (p < .05)
Table 6: Social Resources over Career Stages*
Table 5: Work Outcomes over Career Stages*
Table 7: Psychological Well-being over Career Stages*
Work Outcomes
Influence 49.4 51.2 51.9 50.7 49.5 NS
Development 67.9a 69.0b 66.8 62.2ab 66.7 .05
Freedom 55.3 56.2 54.4 54.0 55.7 NS
Meaning 84.9a 84.2b 85.4c 77.8abc 82.0 .05
Commitment 55.2 53.6 57.6 57.3 61.3 NS
Job satisfaction 45.4 45.5 46.6 41.9 44.3 NS
Work and Family
Work-family conflict 12.8 13.5b 13.5c 12.6d 10.1abcd .001
Spouse Concerns 10.3 10.1 10.3 10.8 10.1 NS
Career Stages
1 2 3 4 5 P
Social support 69.7ab 68.6cd 66.4e 57.3ac 54.5bde .001
Social relations 82.1abc 75.7d 68.2a 64.1bd 71.4c .001
Sense of Community 89.1 89.3 90.0 86.4 83.1 NS
Career StagesSocial Resources
1 2 3 4 5 P
* Career stages having the same superscripts are significantly different (p < .05)
* Career stages having the same superscripts are significantly different (p < .05)

A Quarterly Journal Published by SCMS-COCHIN
SCMS Journal of Indian Management, October-December , 2007. 43
Job Demands
The f i ve career s tage groups were genera l l y s im i l a r
on a number of measures of Job Demands. However,
police off icers in early career stages indicated greater
Sensorial demands, greater Responsibil ity, and received
more Feedback than one or more of the later career stage
groups.
Work Outcomes
The five career stage groups were similar on Influence, Freedom,
Organizational commitment and Job satisfaction. Police officers
in early career indicated greater Development opportunities
and greater Meaning (see Table 5).
Work and Family
Police officers in early stages indicated more work-family conflict
Table 8: Physical Health and Lifestyle Behaviour over Career Stages*
than did officers in later career stages; the career stage groups
did not differ on levels of spouse concerns (see Table 5).
Social Resources
Officers in early career stages indicated higher levels of both
Social support and Social relations than did officers in later
career stages (see Table 6). The five groups indicated similar
levels of Sense of community.
Psychological Well-being
There were substantial career stage differences on measures of
psychological well-being (see Table 7). Police officers in early career
stages indicated lower levels of emotional exhaustion, less
cynicism, fewer health complaints, less medication use, and lower
levels of depression than did officers in alter career stage groups.
The career stage groups were similar on professional efficacy,
anxiety, suicidal ideation (low in general) and posttraumatic stress
symptoms.
Physical Health and Lifestyle Behaviours
Police officers in early career rated their overall health higher and
had taken fewer sick days than officers had in later career stages
(see Table 8). The two groups were similar on whether they had
taken sick days, level of self-reported physical fitness and whether
Career Stages
1 2 3 4 5 P
* Career stages having the same superscripts are significantly different (p < .05)
Physical Health
Overall Health 3.8a 3.7b 3.6 3.4ab 3.6 .001
Taken sick days 1.6 1.6 1.5 1.4 1.5 NS
Number of sick days 3.0a 5.6 7.4 14.1a 9.8 .05
Physical fitness 3.4 3.3 3.2 3.2 3.3 NS
Lifestyle Behaviours
Exercise 1.8 1.8 1.8 1.7 1.7 .05
Smoking 1.4ab 1.5cd 1.6 2.0 2.0bd .001
Alcohol consumption 4.2 3.8 3.5 5.0 3.7 NS
Frequency drinking 3.2a 3.6 3.6 3.9a 3.6 .01

SCMS Journal of Indian Management, October-December , 2007. 44
A Quarterly Journal Published by SCMS-COCHIN
they exercised regularly. Officers in early career were less likely to
be smokers and to drink alcohol less frequently. Amount of alcohol
consumption was similar across the career stage groups.
Discussion
This research compared the work experiences, satisfactions
and psychological well-being of police constables in five career
stages. The stages, based on constable age, were similar to
those used by others (Morrow and McElroy, 1987). Previous
research (Cooper, 1982; McGinnis, 1985a, 1985b) has
indicated that constables in later career stages (e.g., older and
with longer police tenure) are less satisfied with their work and
careers. These issues were examined in a different country
(Norway) and more recently (2003) making it possible to
replicate the earlier research.
The career stage groups (Table 3) were found to differ on
personal demographic and work situation characteristics related
with age (e.g., number of children, police tenure) but was
similar in other ways (size of force, hours worked, extra hours
worked).
While the career stage groups were generally similar on job
demands (see Table 4), the four significant career stage effects
showed constables in early career reporting higher reported
higher levels of Sensorial, Responsibility and Feedback – all likely
associated with more positive reactions. And while the five career
stage groups were generally similar or work outcomes (see Table
5), the differences that emerged on Development and Meaning
favoured those constables in early career. Likewise, constables
in early career indicated more support (see Table 6), a finding
also reported by Cooper (1982).
These factors were also associated with more positive attitudinal
responses (see Table 7) such as lower levels of exhaustion and
cynicism among early career stage constables and perhaps
account for the lower levels of depression and subjective health
complaints and PTSS among early career stage constables as
well. Finally, early career stage officers were less likely to be
smokers and described their overall physical health more
positively than did later career stage constables reflecting their
younger years.
Taken together these findings suggest that constables in later career
stages experience a less satisfying work experience, as others have
also found (Burke, 1989; Cannizzo and Liu, 1995). There are
suggestions of initiatives that organizations might undertake to
support this valued human resource (Hall, 1986b; Hall and Mirvis,
1985).
McGinnis (1985b) sees dealing with the plateaued constable with
many years of service as the biggest concern for Canadian police
forces. Cooper (1982) suggests three areas of intervention to help
officers more successfully navigate these career stages.
1. Recruitment and Training Providing applicants a more realistic
picture of the job through talking with police officers, reading
more realistic accounts of police work or viewing videos of
police officers talking about their jobs or working would be
helpful. Also, using more realistic training exercises and cases
in recruit training is advised.
2. Feedback and Supervision More contact with managers and
more feedback of work performance, realizing that this requires
extra effort since supervisors do not have readily available
opportunities to observe constable job performance.
3. Promotion and Assignment Information Forces can use peer
information in decision-making and provide passed over
constables with information as to what they need to do to
improve their changes of future promotions.
Senior police managers need to deal with expectations of
promotion among police officers. Officers are socialized to seek
and expect promotions. No police officer expects to be a career
constable but some will. It is important to share the numbers in a
realistic way with force members.
Police officers need to consider various practices for coping with
the plateaued constable: Police forces and police senior managers
need to understand the mentality of the plateaued constable. It is
important to keep constables growing, challenged, and feeling
valued and respected by the force, to keep them from becoming
dissatisfied, alienated, cynical and deadwood. Common practices
to address this problem include:
Negative sanctions for low performance.
Performance appraisal – Provide feedback to control expectations
Retraining – for the force or outside of it
Symbolic rewards – recognizing contributions
A Quarterly Journal Published by SCMS-COCHIN
SCMS Journal of Indian Management, October-December , 2007. 45
External therapy – for alcohol problems
Also, some non-traditional practices are possible. These would
include:
Lateral transfers within the force – this deals with content
plateauing.
Moving to a flatter organizational structure – the use of team
policing. These approaches have been found to increase decision-
making scope.
Teaching people about the career plateau. Include material on
career development in police training careers.
Career counselling provides career support and guidance to police
officers at all career stages.
Footnotes
1 Preparation of this manuscript was supported in part by the
Rogaland Institute, Norway and the School of Business, York
University. We acknowledge the support of the Police Union in
conducting the study and collecting the data. Lisa Fiksenbaum
assisted with data analysis.
References
Bardwick, J.M., The Plateauing Trap. New York: Bantam, 1986.
Bedeian, A.G., Pizzolatto, A.B., Long, R.G. and Griffith, R.W. “The
Measurement and Conceptualization of Career Stages.”
Journal of Career Development. 17 (1991):153-166.
Bjelland, I., Dahl, A.A., Haug, T.T., and Neckelmann, D. “The
Validity of the Hospital Anxiety and Depression Scale:
An Updated L i terature Rev iew.” Journa l of
Psychosomatic Research. 52 (2002): 69-77.
Brooks, J.L., and Sears, A . “Predictors of Organizational
Commitment: Variations across Career Stages.” Journal
of Vocational Behaviour. 38 (1991): 53-64.
Burke, R. “Career Stages, Satisfaction and Well-being among Police
Officers.” Psychological Reports. 65, 1989.
Cannizzo, T.A., and Liu, P. “The Relationship between Levels of
perceived Burnout and Career stage among Sworn
Police Officers.” Police Studies.18 (1995): 53 – 68.
Cohen, A. “Career Stage as a Moderator of the Relationships
between Organizat ional Commitment and i ts
Outcomes: A Meta-Analysis.” Journal of Occupational
Psychology. 64 (1991): 126-143.
Cooper, W.H., “Police Officers over Career Stages.” Canadian
Police College Journal. 6 (1982): 93-112.
Eriksen, H.R., Ihleboek, C., and Ursin, H. “A Scoring System for
Subjective Health Complaints (SHC).” Scandinavian
Journal of Public Health. 27 (1991): 63-72.
Fagan, M.M., and Ayers, K. “The Life of a Police Officer: A
Developmental Perspective.” Criminal Justice and
Behaviour. 9 (1982): 273-285.
Gould, S. and Hawkins, B. “Organizational Career stage as a
Modera tor o f the Sa t i s fac t ion-Per formance
Relationship.” Academy of Management Journal.
21(1978): 434-450.
Hall, D.T. “Breaking Career Routines: Mid-career choice and
Identity Development. In D.T. Hall (ed.).” Career
Development in Organizations. San Francisco, CA:
Jossey-Bass, (1986b): 120-159.
Hal l , D.T. , and Mir v is , P.H. “The New Career Contract:
Developing the whole person at midl i fe and
beyond.” Journal of Vocational Behaviour. 47(1995):
269-289.
Hal l , D.T. , Career Development in Organizat ions . San
Francisco, CA: Jossey-Bass, 1986a.
Hurrell, J.J., McLaney, M.A. and Murphy, L.R. “The middle years:
Career Stage Differences.” Career Stress in Changing
Times. (1990): 179-203.
Isabella, L.A. “The Effect of Career stage on the meaning of key
Organizational Events.” Journal of Organizational
Behaviour. 9 (1988): 345-358.

SCMS Journal of Indian Management, October-December , 2007. 46
A Quarterly Journal Published by SCMS-COCHIN
Jans, N.A. “Organizational Commitment, Career Factors and
Career/Life Stages.” Journal of Organizational
Behaviour. 10 (1989): 247-266.
Knudsen, O., Weisaeth, L., Lendol, Wahl, A., Rustoen, T. and
Hanestad, B.R. “Stress Symptoms in the Norwegian
General Population: The Norwegian version of the
Post Traumatic Symptoms Scale.” Scandinavian
Journal o Public Health. 30 (2002): 127-141.
Kristensen, T.S. and Borg, V. Copenhagen Psychosocial
Questionnaire. Copenhagen, Denmark: Institute of
Occupational Health, 2001.
Lynn, S., Cao, L., and Horn, B. “The Influence of Career stage
on the Work Attitudes of Male and Female accounting
professionals.” Journal of Vocational Behaviour. 47
(1996): 231-242.
McGinnis, J.H. “Career Development in Municipal Policing; Part 1.”
Canadian Police College Journal. 9 (1985a): 254-294.
McGinnis, J.H. “Career Development in Municipal Policing; Part II.”
Canadian Police College Journal. 9 (1985b): 254-294.
Morrow, P.C. and McElroy, J.C. “Work Commitment and Job
Satisfaction over three Career Stages.” Journal of
Vocational Behaviour. 30 (1987): 330-346.
Paykel, E.S., Myers, J.K., Lindenthal, J.J., and Tanner, J. “Suicidal
Feelings in the General Population: A Prevalence
Study.” Brit ish Journal of Psychiatry. 124 (1974):
460-469.
Reilly, N.P. and Orsak, C.L. “A Career Stage Analysis of Career
and Organizational Commitment in Nursing.” Journal
of Vocational Behaviour. 39 (1991): 311-332.
Schaufeli, W.B., Leiter, M.P., Maslach, C., and Jackson, S.E. The
Maslach Burnout Inventory – General Survey Test Manual.
Palo Alto, CA: Consulting Psychologists Press, 1996.
Slocum, J., and Cron, W. “Job Attitudes and Per formance
during Three Career Stages.” Journal of Vocational
Behaviour. 26 (1985): 126-145.
Torgen, M., Stenlund, C., Ahlberg, G., and Marklund, S. Ett
ha l lba r t a rbe t s l i v fo r a l l a a ld ra r. A rbets l i v s i
nt i tutet, 2001.
Tyssen, R., Vaglum, P., Gronvold, N.T. and Ekeberg, O. “Suicidal
Ideat ion among Medical Students and Young
Physicians: A Nationwide and Prospective study of
Prevalence and Predictors.” Journal of Affective
Disorders. 64 (2001): 69-79.
Zigmond, A .S., and Snaith, R .P. “The Hospital Anxiety and
Depression Scale.” Acta Psychiatry Scandinavia,
67 (1983): 361-370.

A Quarterly Journal Published by SCMS-COCHIN
SCMS Journal of Indian Management, October-December , 2007. 47
Recently, income inequality has been increasing in the United States. Some people have
attributed the rising U.S. income inequality to globalization. However, it is possible that
the expansion of corporate business and its movement into the international arena could
be a deciding factor. The paper uses annual regression analysis on data form from 1960
through 1998 for the U.S. economy to see whether greater corporate business is associated
with higher U.S. income inequality and whether increased trade results in greater income
inequality within the U.S. once the extent of incorporation of business is taken into
account.
P r o f . W i l l i a m R . D i P i e t r o , F a c u l t y , B u s i n e s s
A d m i n i s t r a t i o n D e p a r t m e n t , D a e m e n C o l l e g e ,
4 3 8 0 A m h e r s t , N e w Y o r k , U S A , E m a i l :
w d i p i e t r @ d a e m e n . e d u
US Panorama:Income Inequality
William R.DiPietro
orporate business is becoming more and more dominant.
The nature of trade is not the same as it used to be. At one
time, trade was almost exclusively
between independent producers and
traders residing within their own separate
nations with their diverse goods flowing
across national boundaries. Now a growing
amount of trade occurs within
corporations whose organizational
boundaries span across different national
borders. This new way in which trade is
conducted is likely to alter the relationship
between international trade and income
inequality changing the relationship and
making the relationship more complicated.
The purpose of this paper is to
investigate and to attempt to disentangle
the separate effects, of expanded
Ccorporate business, of greater international trade, and of greater
incorporated international business on the U.S. income distribution. The
paper uses annual time series regression
analysis on data for the United States for the
period 1960 through 1998 to empirically
estimate the effect of the number of U.S.
corporations (a proxy for the extent of U.S.
corporate business), the U.S. trade share
(a common measure of the degree of
globalization), and the interaction of the
two on several different income inequality
measures. It is hypothesized that trade
itself may not be a source of greater
income inequality within the nation,
but rather greater corporate business,
whether it be greater corporate
domestic business or greater
corporate international business.

SCMS Journal of Indian Management, October-December , 2007. 48
A Quarterly Journal Published by SCMS-COCHIN
The paper is divided into five sections. The first section gives a little
background literature. The second section discusses the
corporation, its characteristics, its spread, its importance, and the
potential consequences of incorporation for inequality. The third
section details the sources of the various variables used in the
study. The results of regression runs on four different measures of
inequality are shown in the fourth section. Finally, the fifth section
concludes.
Background Literature
In general, it seems the recent decline in income inequality in the
U.S. is taken as a fact but the explanations for its causes, both
theoretically and empirically, are an open question.
Two areas of the existing literature are directly relevant to the present
article. They are studies focusing on the relationship between
globalization and U.S. income inequality, and studies looking at the
overall nature and functions of the corporation.
In a conversation with Jasred Berstein conducted by the
Multinational Monitor, Jared Berstein, co-director of research at
the Economic Policy Institute, suggests that one of the reasons
for the recent upsurge in inequality in the U.S. is the decline of
U.S. manufacturing fostered by a trade policy that simultaneously
encourages globalization while maintaining a strong American
Dollar (Multinational Monitor 2003). Bernstein dismisses
technological change as a major factor for the increased U.S.
income inequality maintaining that the wage gap between the
technologically skilled and the technologically unskilled has
remained fairly steady over time.
In a shor t ar ticle in the Brookings Review, Gary Bur tless,
documents the recent increase in inequality of the United States
and challenges the theory that proposes that the trade of
developed countries with low wage developing countries
reduces the wages of low skilled workers in developed
countries (Burtless 1996). He theorizes that, if increased trade
is responsible for the reduction in wages of unskilled workers
in the U.S., then one initially might expect the reduction in the
wages of the unskilled to be more pronounced in industries
heavily engaged in trade compared to those that are not as
heavily engaged in trade. However, looking at the data, Burtless
finds that the reduction in the wages of the unskilled workers
in the U.S. is as great for non-traded goods industries as it is
for traded goods industries. To him, this finding indicates,
instead of greater trade, other factors, such as reduced
unionization, may be operating to reduce the wages of unskilled
workers in the U.S.
Consistent with this Burtless’ perspective, the present paper looks
at the possibility that greater incorporated business, rather than
greater trade, may be the prominent cause of higher income
inequality in the U.S.
With regard to the nature of the corporation, Litowitz in his paper,
“The Corporation as God,” does a masterful job in revealing the
resolutions of contradictions role of corporate myth in American
culture (Litowitz 2005). Litowitz looks at the corporation as an
untenable, schizophrenic, dualistic mixture of economic and social
dimensions with unresolved and irresolvable tensions between its
commitment to profit as an economic agent and its presumed
obligation to justice as a social agent. Corporate law is seen as
working primarily in the interest of the upper class in its mediating
and legitimating functions. The legitimating function of corporate
law is seen as merely providing a convenient smokescreen
obscuring the reality of the corporation’s enormous concentration
of power in the hands of a small elite, its total domination of the
culture, and its penchant to ignore responsible social behaviour in
pursuit of profits. Although corporate law is made to look as though
everyone is given equal treatment, as Litowitz sees it, the mediating
function between the classes of corporate law cannot help but
being heavily biased toward the elites, given the enormous
discrepancy in power between these groups.
In the wake of what they perceive to be growing power of
international corporations and of appropriation of power once
reserved exclusively for states, in view of what they judge as
a past poor performance of multinational corporations with
regard to human rights, and of corporate activity leading to
greater disparity between the rich and the poor, Monshipouri,
Welch, and Kennedy advocate the establishment of a truly
independent governmenta l organ iza t ion to enforce
appropriate human r ights behaviour of corporat ions
(Monshipouri, Welch, and Kennedy 2003). They maintain
that what is needed to keep corporate behaviour in check
and to enforce a t leas t some degree of corpora te
accountability is an organization with real teeth that has true
monitoring and sanctioning abilities. They feel that voluntary
compliance by corporations to human rights standards is
wishful thinking and ineffective. Even when corporations
nominally adopt protocols for behaviour such as the U.N.
A Quarterly Journal Published by SCMS-COCHIN
SCMS Journal of Indian Management, October-December , 2007. 49
g loba l compact on human r igh ts , w i thout outs ide
enforcement, lip service to words on paper are not likely to
alter corporate behaviour.
The Corporation
In the U.S. and elsewhere CEO pay has increased rapidly both in
absolute terms and relative to the wages of ordinary workers within
the corporation. The size of large corporations not only exceeds
the GDP of entire countries but also the GDP of entire countries in
combination with one another. The big corporations represent
enormous concentrations of wealth, of economic, and of political
power, and are the key determinants of both work relations and of
everyday relations of human beings.
These huge concentrations of power are bound to have an effect,
not only on the distribution of income, but on almost every aspect
of human existence. These big corporations control the nature and
character of work. They have legal rights that exceed those of
citizens. Their oversized marketing and advertising departments
create taste and are a primary instrument in framing the very identity
of human beings, the who we are as individuals, the what it means
to be human. Their research activity is responsible for establishing
the form and the direction of technological change. They control
production. They control capital and capital flows. Tons upon
tons of money flow into the corporative bowels, and, under
capitalism, money is power. They finance political campaigns,
lobbying groups, and think tanks that push their agendas.
Corporations wield enormous technological, cultural, and political
power.
Corporations are hierarchical and hierarchies are by their very nature
unequal, in power, in status, in prestige, and in income.
Just like a highly contagious disease, corporate business is spreading
around the world. One of the most important things in society is
how we are organized. Today, power is no longer vested in the
government, in the aristocracy, or in the people but, more and
more, it is concentrated in the hands of corporate enterprise. The
inequalitarian corporation is reorganizing the activities of mankind
(productive, political and cultural), and completely reforming man’s
life, man’s view of himself, man’s very identity.
Within the corporation, there is hierarchy. In the outside milieu, the
corporation fosters a goods and money conscious consumer. It
provides the goods that presumably satisfy, but never actually fulfill,
the artificial wants it generates. People are dependent on the
corporation to attain all aspects of their identity. They are dependent
on corporations to obtain work, to obtain a livelihood, and to
obtain the goods that define them.
Perhaps, it is not the trade or globalization that is the problem for
income inequality, but the form of business organization in which
the trade and globalization is conducted and orchestrated. The
recent upsurge in inequality within countries and between countries
attributed by some to globalization may not be due to globalization
itself but rather to the increased incorporation of business. While
increased trade, all other things being equal, may, on its own, tend
to reduce inequality, increased trade accompanied by greater
incorporation may end up fostering inequality. It may not be that
globalization is the culprit with regard to increasing inequality, but
rather the way business is being conducted, the incorporation of
business, and, the recent incorporation of international business.
The position of this paper is that the greater the extent of corporate
business in society the greater will be the inequality that prevails in
society. The proposition holds equally true for international business
which is merely a subset of all business. The greater the amount of
international corporate business the greater will be the prevailing
inequality.
The anti-Americanism prevailing in the world may not be so much
anti-American per say as anti-incorporation. It is corporations that
swallow up the old culture, the old identity of peoples. It just so
happens that the corporate beast first took deep roots and spread
in American soil so that a large number of multinational corporations
are American and many of the original international corporations are
American.
Data Sources
In order to empirically investigate the relationship between inequality,
corporate business, and globalization, annual time series data set
is collected and assembled. The period covered is from 1960
through 1998. The entire data set contains a total of six variables, a
trade variable, the percentage share of U.S. trade to U.S. GDP, two
corporate business variables, the number of U.S. corporations and
the receipts of U.S. corporations, and four inequality variables, the
U.S. Gini coefficient, and the concentration of U.S. income for the
top one per cent, the top one tenth of one per cent, and the top
one hundredth of a per cent, of households. The Gini coefficient
is abstracted from Dollar and Kraay (Dollar and Kraay 2001). Their

SCMS Journal of Indian Management, October-December , 2007. 50
A Quarterly Journal Published by SCMS-COCHIN
data is an update of the original data from Deininger and Squire (Deininger
and Squire 1996). The three other measures of inequality, the three
income concentration ratios for highest income households, come
from Piketty and Saez (Piketty and Saez 2001). The data on the number
of U.S. corporations and on corporate receipts comes from the Statistical
Abstract of the U.S. (Statistical Abstract of the U.S.). Finally, the
percentage share of U.S. trade of U.S. GDP, in which trade is defined as
U.S. exports plus U.S. imports, is taken from the 2002 World
Development Indicators CD of the World Bank (World Bank 2002).
Regressions of Income Inequality on
Incorporation and Globalization
Table I shows the simple regressions on annual data for the
U.S. of four different measures of income inequality on the
percentage share of trade, as measured by expor ts plus
impor ts to GDP. The f i r s t th ree measures of income
inequality are the concentration ratios for the very highest
income groups. The f i r s t concent ra t ion ra t io i s the
percentage of total income for the top one per cent of
households, the second is for the top one tenth of one
per cent of earners, and the third is for the top one
one-hundredth of one per cent of households. The
four th and final measure is a measure of income inequality
over the entire income distr ibution, the commonly used
Gin i coef f ic ient . Note that h igher va lues for a l l four
measu re s o f i ncome i nequa l i t y , t he t h r ee i ncome
concentrat ion rat ios and the Gini coeff icient, indicate
greater inequal i ty.
The first column of table I lists the independent variables. Each
of the four subsequent columns show regression results for
regression runs on the four different measures of income
inequality. The top most numbers in the body of the table are
the estimated coefficients. The parenthesized values under the
estimated coefficients are the individual t-statistics for the
estimated coefficients. The asterisks under the parenthesized t-
statistics allow for quick identification of the statistical significance
of a variable in an equation. A variable significant at the one
per cent level of significance or better is marked with a single
asterisk under the t-statistic, a variable significant at the five
per cent level of significance or better is identified with two
asterisks and a variable significant at the ten per cent level or
better is labeled with three asterisks. The third to the last row
shows the r-squared values for the various regression runs. The
second to the last row gives the number of observations (years)
contained in an equation, and the final row spells out the range
of years covered by a particular equation.
Looking at the table, reveals that, regardless of the measure of
inequality used, the share of trade is positively related to the
share of trade in GDP. In every one of the four equations, the
coefficient on the trade share is positive and significant at the
one per cent level of significance or better. The findings of table
I suggest, that, without considering the expansion of corporate
business or the movement of corporate business into the
international sphere, greater trade is associated with greater
inequality in the distribution of income.
Table 1: Annual Simple Regressions of Inequality Measures on Percentage
Trade Share of GDP
(1) (2) (3) (4)
TOP 1% TOP .1% TOP .01% GINI
Constant 5.770 (5.11)* .419 (.885) .022 (.003) 28.273 (18.99)*
Percentage Trade Share .376 (5.69)* .237 (5.77)* .108 (5.28)* .534 (5.95)*
RSQ .466 .474 .430 .503
N 39 39 39 37
Years 1960-98 1960-98 1960-98 1960-1990

A Quarterly Journal Published by SCMS-COCHIN
SCMS Journal of Indian Management, October-December , 2007. 51
Table II por trays the results of simple regressions of the four
inequality measures on the number of U.S. corporations. The
set-up for table II is exactly the same as that for table I. As
anticipated, the coefficient on the number of corporate
business is posit ive, implying that greater extension of
corporate bus iness , as measured by the number of
corporations, leads to greater income inequality. The coefficient
on the number of corporations is significant at the one per cent
level of significance or higher in every equation and, on its own,
accounts, at the very minimum, for sixty nine per cent of the
variation in income inequality. It appears that greater corporate
business increases the concentration of income in the highest
income groups and leads to greater overall income inequality in
society.
Table 2: Annual Simple Regressions of
Inequality Measures on the Number of Corporations
Table 3: Annual Multiple Regressions of Inequality
Measures on Percentage Trade Share of GDP and Number of Corporations
(1) (2) (3) (4)
TOP 1% TOP .1% TOP .01% GINI
Constant 6.408 (10.95)* 1.044 (2.87)* .191 (1.01) 29.480 (34.94)*
Number of Corporations .0021 (10.21)* .0013 (10.24)* .0006 (9.13)* .0028 (9.33)*
RSQ .738 .739 .692 .713
N 39 39 39 37
Years 1960-98 1960-98 1960-98 1960-1990
(1) (2) (3) (4)
TOP 1% TOP .1% TOP .01% GINI
Constant 9.513 (14.09)* 2.909 (6.70)* 1.135 (4.90)* 31.701 (26.35)*
Percentage Trade Share -.574 (-5.90)* -.345 (-5.51)* -.174 (-5.23)* -.423 (-2.44)**
Number of Corporations .0044 (10.41)* .0027 (9.90)* ..0013 (9.02)* .0046 (5.94)*
RSQ .867 .857 .825 .756
N 39 39 39 37
Years 1960-98 1960-98 1960-98 1960-1990

SCMS Journal of Indian Management, October-December , 2007. 52
A Quarterly Journal Published by SCMS-COCHIN
Table III takes a look at the effect of trade on inequality within the
U.S. after adjusting for the extent of incorporation. It shows
multiple regressions of the four inequality measures on both the
number of U.S. corporations and on the U.S. trade share.
The number of corporat ions is s igni f icant at the one
per cent level of significance or higher in all four equations
in table III. The trade share is significant at the one per cent
level or better in the first three equations in table III in
which the different concentration ratios are employed as
measures of inequality. In the four th equation, when the
Gini coefficient is used as a measure of inequality the trade
share is significant at the five per cent level of significance
or better. The two variables together explain anywhere from
around seventy-five to over eighty-six per cent of the annual
variation in inequality in the U.S. over the entire period (close
to forty years) that is covered.
As expected, the sign of the estimated coefficient on the
number of corporations is, once again, positive. Looking at
the coefficient on the number of corporations in equation one
shows that an increase in the number of corporations in the
U.S. by one thousand (the number of corporations is in
thousands of corporations) leads to a four thousand per cent
increase in the share of individuals in the highest one per cent
of the income distribution.
The very most important thing to note in table III, however, is
what happens to the sign of the trade share coefficient. The
sign of the trade share coefficient changes from positive in table
I to negative in table III. When the trade share is used in isolation to
explain income inequal i ty (table I) , i t looks as though
international trade has a detrimental effect on inequality within
the U.S., as, on the basis of the estimated trade share
coefficient, increases in the trade share are predicted to
lead to an increase in income inequality. However, once
the extent of incorporation is taken into account (table III),
trade appears to be beneficial to income inequality. The
negative sign on the trade share coefficient in table III means
that increases in trade lead to reduced levels of income
concentration in the highest income groups and to lower
levels of overall income inequality as measured by the Gini
coefficient. What all this would seem to suggest is that greater
trade or augmented levels of international business, is not
bad for inequality per se, but, rather, the expansion of
corporate business, greater incorporation, is.
In a rough attempt to try to isolate the separate effect of incorporated
international business on inequality, that is, of corporate international
trade (business), as distinguished from general international trade
(business) on income inequality, a trade corporation interaction
variable is constructed. The trade corporation interaction variable is
simply the trade share, the percentage of trade to GDP, disregarding
Table 4: Annual Multiple Regressions of Inequality Measures on PercentageTrade Share of GDP and Interaction Variable between Number of
Corporations and Percentage Trade share of GDP
(1) (2) (3) (4)
TOP 1% TOP .1% TOP .01% GINI
Constant 14.970 (15.79)* 6.080 (9.04)* 2.645 (7.21)* 39.230 (28.01)*
Percentage Trade Share -.713 (-7.24)* -.410 (-5.87)* -.203 (-5.32)* -.811 (-5.48)*
Trade Corporation
Interaction Variable .0002 (11.64)* .0001 (9.74)* .00005 (8.58)* .0002 (9.48)*
RSQ .898 .855 .813 .864
N 39 39 39 37
Years 1960-98 1960-98 1960-98 1960-1990
A Quarterly Journal Published by SCMS-COCHIN
SCMS Journal of Indian Management, October-December , 2007. 53
its percentage and treating it as an ordinary whole number, multiplied
by the number of corporations (measured in thousands). The trade
corporation interaction variable goes up when either the trade share
or the number of corporations rises. The new trade corporation
interaction variable is subsequently used as an explanatory variable
in concert with the trade share in regressions on the four measures
of inequality. Table IV shows the results of the new exercise using
the interaction variable.
The results are fairly impressive. Both the trade share and the trade
corporation interaction variable are significant at the one per cent
level of significance or better in every one of the four equations. In
concert, the two variables explain over eighty per cent of the annual
variation of the four different inequality measures. While the sign of
the trade share, the percentage of trade to GDP, is negative indicating
that greater trade reduces income inequality, the sign on the trade
corporation interaction variable is positive, suggesting that higher
levels of incorporated trade lead to greater income inequality.
An alternative measure of the degree of corporate business to the
number of corporations is corporate receipts. When the regression
equations contained in tables II, III, and IV are re-run using U.S.
corporate receipts in place of the number of U.S. corporations as
the measure of the extent of U.S. corporate business, similar results
are obtained.
Conclusion
The time series regression analysis for the recent decades of the
U.S. economy undertaken in this study lends support to three
basic propositions with regard to within nation income inequality.
First, the expansion of corporate business leads to greater
concentration of income in the highest income groups and to
greater overall within nation income inequality. Second, the
movement of the corporate organizational form into the international
sphere is definitely not welcome news for within nation income
equality. Third, globalization (trade openness) is favourable for within
nation income equality, once, one adjusts for the pernicious effects
of corporate business expansion.
With regard to allaying fears of potential undesirable effects of trade
on income concentration of the upper income groups and on the
entire income distribution, trade policy would seem to be
misdirected and based on a fundamental misunderstanding of the
root cause of the greater income inequality associated with higher
trade. It looks as though the volume or extent of trade is not a
problem for income inequality, but it is the incorporation of trade
that appears to be the negative force in operation with regard to
income inequality. The aim of trade policy should be to adjust,
control, or change the corporation, its inequalitarian nature, and its
behaviour. The focus of policy should not be on the amount of
trade but on how trade is conducted, the way, the form in which
trade is undertaken.
References
Anonymous. “The Hierarchy: Income Inequality in the United States.”
International Monitor. 24 (5) May, 2003.16-21.
Burtless, Gary. “Worsening American Income Inequality: Is World
Trade to Blame?” The Brookings Review. 14 (2) (1996):
26-30.
Deininger, Klaus and Lyn Squire. “A New Data Set Measuring Income
Inequality.” The World Bank Economic Review. 10 (3)
(1996): 564-591.
Dollar, David and Aart Kraay. “Growth is Good for the Poor.” Policy
Working Paper No. 2587. The World Bank, Development
Research Group, 2001.
Litowitz, Douglas. “The Corporation as God.” Journal of Corporation
Law. 30 (3) (2005): 501-537.
Monshipouri, Mahmood, Claude E.Welch Jr., and Evan T. Kennedy.
“Multinational Corporations and the Ethics of Global
Responsibility: Problems and Possibilities.” Human Rights
Quarterly. 25(4), November (2003): 965-85.
Piketty, Thomas and Emmanuel Saez. “Income Inequality in the United
States, 1913-1998.” National Bureau of Economic
Research, Working Paper. 8467, 2001.
Statistical Abstract of the U.S., U.S. Department of Commerce,
Bureau of the Census. various years.
World Bank. World Development Indicators on CD-ROM. USA: World
Bank. 2002.

SCMS Journal of Indian Management, October-December , 2007. 54
A Quarterly Journal Published by SCMS-COCHIN
M s . S r i p i r a b a a B . , R e s e a r c h S c h o l a r , P S G
I n s t i t u t e o f M a n a g e m e n t , P S G C o l l e g e o f
T e c h n o l o g y , C o i m b a t o r e – 6 4 1 0 0 4 ,
E m a i l : p i r a b a a @ g m a i l . c o m
D r. K r i s h n a v e n i R . , A s s i s t a n t P r o f e s s o r , P S G
I n s t i t u t e o f M a n a g e m e n t , P S G C o l l e g e o f
T e c h n o l o g y , C o i m b a t o r e – 6 4 1 0 0 4 .
E m a i l : r m k r i s h n a v e n i @ g m a i l . c o m
Organizations are competing for resources: men, materials, money and methods. Hence, they
constantly engage in actions aimed at increased access to these resources and effective utilization
of the available resources to compete in the changing environment. This necessitates assessment
of resources utilization and organizational performance periodically to ensure achievement of
goals. Among the plethora of tools and processes available for assessing organizational performance,
Capacity Building has gained prominence in the last two decades. This paper brings out the results
of Capacity Building Process extended to map the efficiency of the Performance Management
System, in an Automobile component manufacturing company.
Efficiency Mapping through
Capacity Building ProcessSripirabaa B. and Krishnaveni R.
arke t dynamics have c rea ted cha l lenges fo r
organizations, with the emergence of the global
economy, advances in
technology, increased societal
demands, and the need to provide
more social services with fewer
resources. Hence a systematic
process for creating and sustaining
improved performance that reflects
changes in the environment is the
need of the hour. Hence an initiative
is needed for organizations for
effective and efficient utilization of
its resources to be in line with
technology advancements, meet
societal needs and to ensure
ach ievement of i t s goa l s .
Consequently various tools that
help organizations evaluate their
performance with respect to time;
benchmark their performance with
Mindustry standards are being put forth by management gurus. Apart
from this, organizations need to align their activities with their mission
in order to ensure achievement of goals.
A plethora of tools and processes are
available for assessing performance of
organizations and its function. To
mention a few Change management
(Waterman, Peters and Phillips, 1980),
value creation model (Porter, 1985),
Five Tracks Barriers to Success Model
(Kilman, 1986), benchmarking (Pryor,
1989), capacity building (McGuire, et
al, 1994), business process
reengineering (Harsh et. al), decision
Trees, SWOT Analysis and PESTLE
Analysis (Kachru, 2005), TQM, six Sigma
and Balanced Scorecard (Pearce and
Robinson, 2005). Among the above
mentioned techniques capacity
building process is one which is
gaining impor tance in the past two

SCMS Journal of Indian Management, October-December , 2007. 55
A Quarterly Journal Published by SCMS-COCHIN
decades among the non profit organizations (De Vita and Fleming,
2001; Blumenthal, 2003; Baumqarten, 2004; Sampson, 2004). An
attempt has been made here to extend this concept of Capacity
Building Process to map the efficiency of the performance
management system in a profit organization.
Capacity Building Concept and
Theoretical Base
Capacity Building Process is one among the methodologies
extensively used by non-profit organizations, non-government
organizations, community development agencies, civil society
organizations, and funding agencies to assess the efficacy of the
programs organized or funded by them by assessing their current
level of capacities and consequently identifying strategies to
improve their capacities.
Capacity Building Concept
It was World Bank in 1996 which first focussed on how the capacities
of people, institutions and practices could be developed. Later in
Table 1: Views regarding Capacity Building
1997 UNDP and others also started focussing on the process of
Capacity Building (Table 1).
Capacity building refers to activities that improve an organizations
ability to achieve its mission. It is the process that increases the
capability of organizations and individuals to produce or perform
(Blumenthal, 2003). Capacity building could be carried out
horizontally which focuses on building individual capacity and
vertically which focuses on building organizational capacity.
Organizational capacity building is the ability of an organization to
influence its life and progress towards desired results. Organizational
Capacity building looks in depth at where an organization stands in
comparison to where it hopes to be in future and develops skills
and resources to get there (Blumenthal, 2003).
Application of the Concept in
International and Indian Scenario
In the last two decades Capacity Building activities have
gained impor tance both in the international and Indian
Scenario. The focus of such activities in the international
scenario were community development (McGuire, et. al.,
1994; Orozco and Lapointe, 2004), economy revival (Kirkpatrick, et
al., 2005; Haugh and Rubery, 2005), address environment related
issues (Cosio, 1998; Maosheng and Haites, 2006), enhancing
competency of government organizations (Wescott, 1999; Tettey,
2002), enhanced competency of public sector and private
organizations (Senge, 1997; Jones, 2001), solve cross cultural and
diversity issues (Vreede, et. al., 1998/99; Jackson, 2003),
strengthening non-profits (De Vita, 2001; Blumenthal, 2003),
enhancing effectiveness of health care services (Gerry, et al., 2006;
Birdsell, et. al.), corporate governance (Kaloumania, 2004; Armstrong,
2004), biosafety (Australia Biosafety), biotechnology (International
Chamber of Commerce), poverty elimination (Vietnam), regulatory
(Eldridge, 2004), health services (Weaver, et al, 2000), trade (Doha
Development; Prowse, 2002), protection and improvement of water
resources (Water shed program), capacity building of local
government (Reddy, et al, 2000). Majority of these activities were
initiated by NGO’s, community development agencies, civil society
organizations and the UN family. The focus of these activities was to
solve issues related to nations/ nation or region/ community.
Year
World Bank 1996 The combination of people, institutions and practices that permits countries
to achieve their development goals
UNDP 1997 The process by which individuals, organizations, institutions, and societies
develop abilities (individually and collectively) to perform functions, solve
problems and set and achieve objectives
Wange 1997 Capacity Building is a continuous and multidimensional process of nurturing
the ability of individuals and institutions to undertake quality policy analysis
and economic management
Organization /Individual
Definition

SCMS Journal of Indian Management, October-December , 2007. 56
A Quarterly Journal Published by SCMS-COCHIN
In the Indian Scenario majority of these activities were initiated by
the Government of India in coordination with International agencies
like UN family, the respective state governments, Institutions,
Foundations, etc to address issues the nation is facing in the
developing, globalized and liberalized scenario. The focus of these
activities were in agricultural sector (Agri India-US Joint Statement;
India - U.S. Agricultural Knowledge Initiative), community
development (Charca; Nagaland; Leprosy; CAPART; MacArthur
Foundation), empowering SME’s and companies (Times Foundation;
RMK; EDI Ahmedabad), e-Governance (Capacity Building – Madhya
Pradesh; Capacity Building – Rajasthan), impart knowledge on design
and construction of earth quake resistant structures (Earthquake
Engineering Research Centre - IIIT Hyderabad; NPCBAERM), enhancing
the literacy rate (Azim Premji Foundation; Akshaya Project; NCERT;
Sarva Shiksha Abhiyan; TATA Institute of Social Sciences; DEME; NIAR),
power sector (Energy Conservation Act; Capacity Building – Power
Sector), environmental protection (Welcome Mapping; NCSA Project;
Capacity Building for Climate Change), imparting IT education
(Chhattisgarh – IT; Cameron Richards – ICT), Bioresource development
and utilization (The National Bioresource Development Board),
Biodiversity Conservation (Biodiversity Conservation and Rural
Livelihood Improvement Project) and setting up a library consortium
for e-journal subscription (Library - Capacity building).
Results of Capacity Building Exercise: The substantial increase in
the application of the Process of Capacity Building is due to the
significant benefits derived out of the Capacity Building exercise.
Few results of such capacity building exercise that have been
undertaken are discussed under. Use of machines has enhanced
quick decision making in businesses, which has paved way for
more learning thereby needing less control and consequently
making the organization successful in its activity (Senge, 1997).
The twinning project of SIDA in Sweden, has established
partnership between the organizations in Sweden and similar
organizations in developing countries to overcome deficiencies in
its organizations, by focusing on learning at individual and
organizational level (Jones, 2001). Enhancing Capacity grants for
projects, developing partnership with other organizations to gain
technical expertise for current projects and training employees in
preparing structured programs for current and future projects were
the typologies identified and developed from in-depth study of
thir ty capacity building programs for nonprofit organizations
(Blumenthal, 2003). Capacity of small communities could be
enhanced through community wide strategic development planning
(McGuire, et. al., 1994). Leprosy eradication measures in India have
been successful, by partnering with International Federation of Anti
Leprosy Association and enhancing the capacity of the existing
Health Care Staff in diagnosis and management of leprosy affected
persons (Leprosy). Capacity Building through imparting knowledge
to construct earthquake resistant structures to masons, bar benders,
engineers, consultants and faculty members through workshops
and training programs were found to be successful (Earthquake
Engineering Research Centre – IIT Hyderabad). The technique of
information sharing, improving skills and increased access to quality
reproductive health services were the strategies used for creating
awareness and building the capacity among the young women’s in
India to STIs and HIV infection and thereby reducing the same
(Charca). The issue of unemployment in Nagaland was controlled
by providing self employment opportunities to unemployed youth
thereby enabling them generate sustainable income (Nagaland).
The above studies reveal that there lies no restriction in the area of
application of the concept of Capacity Building and could well be
extended to profit organizations. Further the commonality among
all these studies were that focus was on assessing the current level
of capacities and devising strategies to enhance the lacking capacities
than building up new capacities. This may be due to the fact that
organizations feel building new capacities is a daunting challenge.
Tools for Assessment: Diverse tools have been developed for
assessing the capacity of organizations based on their requirements.
Research indicated that among the tools developed for capacity
assessment few tools like Discussion Oriented Organizational Self
Assessment (DOSA), Participatory Organizational Evaluation Tool
(POET) and A Simple Capacity Assessment Tool (SCAT) appear as
the baseline tools. With these tools as the base few other tools
were developed to assess the strengths and weakness of the
organizations in all functional aspects (Participatory Capacity
Assessment, The McKinsey Capacity Assessment Grid, Marguerite
Casey Foundation Organizational Capacity Assessment Tool and
SVP Organizational Capacity Assessment Tool) and to assess the
efficacy of their services and programs to serve their clients better
(Self assessment tool developed by Southern Minnesota Initiative
Foundation, Benefits Planning, Assistance and Outreach Performance
Excellence Instrument and Organizational Assessment Tool).
Indicators for Assessment: Research indicates that a range of
indicators are used for assessing the capacity of organizations. An
in depth analysis of the diverse tools that are being used for assessing
the capacity of organizations reveal that Human Resource
Management, Financial Resource Management, Equitable Participation,
Sustainability of Program Benefits, Partnering, Organizational Learning and

SCMS Journal of Indian Management, October-December , 2007. 57
A Quarterly Journal Published by SCMS-COCHIN
Strategic Management/Governance (POET, DOSA, Marguerite Casey,
McKinsey, SVP, BPA and O, OAT, SCAT, SMI, PCA) were the prime
indicators used. These indicators could be grouped in to two categories,
group 1 includes indicators which assess the capacity of the Organization
in the program/project that it is involved in, and could be termed as
specific indicators. The indicators are Human Resource Management,
Equitable Participation, Sustainability of Program Benefits and Organizational
Learning. Group two comprises indicators that would enhance the
functioning of the program/project that is being assessed and hence
could be termed as general indicators. They include Partnering, Financial
Resource Management and Strategic Management/Governance. Overall,
all these indicators serve as the areas to be concentrated upon for
capacity assessment of the organization.
Purpose of the Study
The above literature reveals that the concept of capacity building is
pervasive and could be applied to all areas. Consequently, the
concept could well fit for profit organizations too, as the
competitive environment presses organizations to meet positive
and negative challenges globalization has posed whereby they
strive to maximize the utilization of the organizational resources
and thereby excel in all functional areas. From the previous
discussion it can be inferred that successful attempt has been
made by UN family and NGO’s in applying the concept of capacity
building in the global scenario in varied areas and by the
Government of India in the Indian scenario. The prime area of
the application of the concept was among the non profit
organizations to identify the areas where they lack the capacity
to perform and for effective and efficient utilization of the limited
resources. Since the competit ive environment presses
organizations for increased access to resources; men, material,
money and methods and also effective and efficient utilization
of the resources, organizations engage themselves in planning
and designing activities for successful accomplishment of
organizational objectives. The process of capacity building could
be applied to the organization as a whole or for few of its
functions. Hence this paper attempts to extend the capacity
building concept to profit organizations. For the purpose of
study a medium size organization engaged in the manufacturing
of Automobile components, in Coimbatore City was selected
and the capacity building process was tried for one activity of
HR function namely Performance Management System.
Theoretical Model for the Study
Performance management system could be thought of as the crown
among the HRM activities. It encompasses diverse activities, key among
which is the performance appraisal process. Performance
management system starts with determining the effectiveness of the
recruitment and selection practices of the organization and moves in
determining the performance of the employees on their job which in
turn helps in administrative decisions, promotions, demotions, pay
rises etc. and finally in determining ways to enhance the performance
(DeNisi, and Pritchard, 2006). Choice of an appropriate technique
for appraising the employees is the heart of the appraisal process.
Performance appraisal reports serves as the platform for career
planning and management activities and design and development of
training programs which aims in strategically orienting the system to
achieve the organizational objectives. Hence the study attempts to
apply the process of Capacity Building to the Performance
Management System activity.
Table 2: Research Studies in Performance Management System
Performance Management System Roberts, 2001 (quoted by Hartog, et.al., 2004); Hartog, et.al., 2004;
Soltani, et. al., 2005; DeNisi, and Pritchard, 2006.
Performance Appraisal Taylor, et. al., 1995; Wood, 1999; Viswesvaran and Ones, 2000;
Simmons and Eades, 2004; Hartog, et. al., 2004; Boyd and Kyle,
2004; DeNisi and Pritchard, 2006.
Methods of Performance Appraisal Hoffman, et. al., 1991; Welbourne, et. al., 1998; Randall, et. al., 2000;
Viswesvaran and Ones, 2000; Wallace, et. al, 2001; Bartram, 2004;
Boyd and Kyle, 2004; Brown and Heywood, 2005.
Compensation, Rewards, Landy and Farr 1983; Cleveland, et al., 1989; Townley, 1990; Pilbeam
Administrative Decisions and Corbridge, 2002.
Practices Research Study
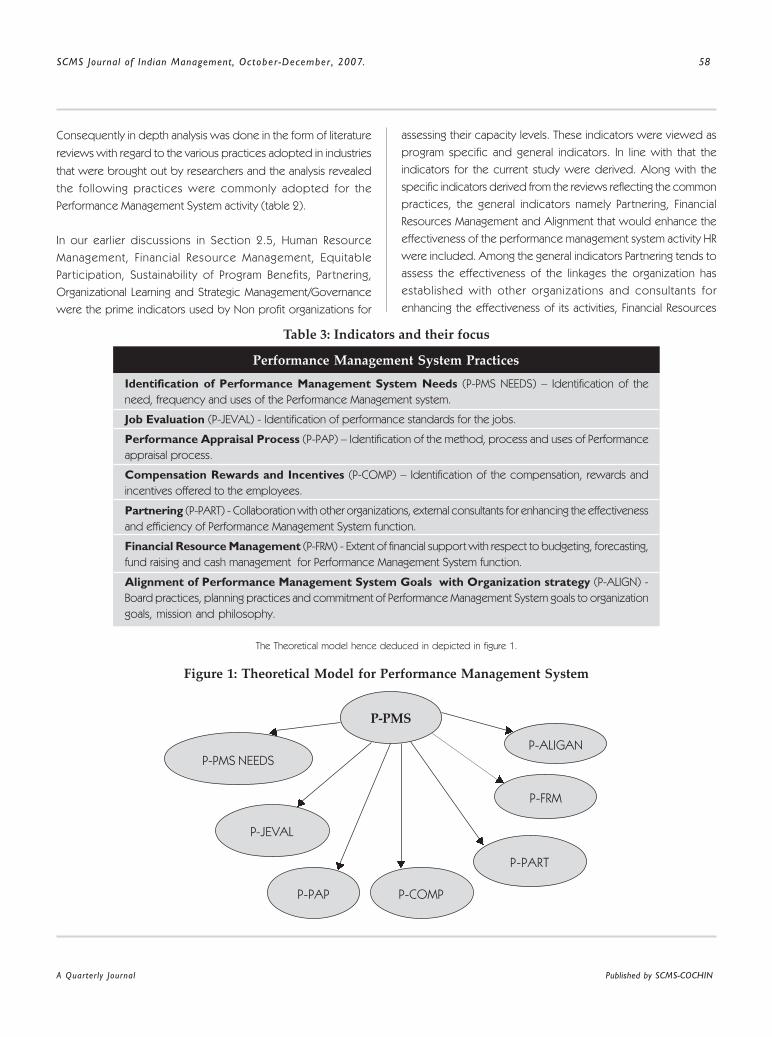
SCMS Journal of Indian Management, October-December , 2007. 58
A Quarterly Journal Published by SCMS-COCHIN
Consequently in depth analysis was done in the form of literature
reviews with regard to the various practices adopted in industries
that were brought out by researchers and the analysis revealed
the following practices were commonly adopted for the
Performance Management System activity (table 2).
In our earlier discussions in Section 2.5, Human Resource
Management, Financial Resource Management, Equitable
Par ticipation, Sustainability of Program Benefits, Par tnering,
Organizational Learning and Strategic Management/Governance
were the prime indicators used by Non profit organizations for
assessing their capacity levels. These indicators were viewed as
program specific and general indicators. In line with that the
indicators for the current study were derived. Along with the
specific indicators derived from the reviews reflecting the common
practices, the general indicators namely Partnering, Financial
Resources Management and Alignment that would enhance the
effectiveness of the performance management system activity HR
were included. Among the general indicators Partnering tends to
assess the effectiveness of the linkages the organization has
established with other organizations and consultants for
enhancing the effectiveness of its activities, Financial Resources
Table 3: Indicators and their focus
Figure 1: Theoretical Model for Performance Management System
Identification of Performance Management System Needs (P-PMS NEEDS) – Identification of the
need, frequency and uses of the Performance Management system.
Job Evaluation (P-JEVAL) - Identification of performance standards for the jobs.
Performance Appraisal Process (P-PAP) – Identification of the method, process and uses of Performance
appraisal process.
Compensation Rewards and Incentives (P-COMP) – Identification of the compensation, rewards and
incentives offered to the employees.
Partnering (P-PART) - Collaboration with other organizations, external consultants for enhancing the effectiveness
and efficiency of Performance Management System function.
Financial Resource Management (P-FRM) - Extent of financial support with respect to budgeting, forecasting,
fund raising and cash management for Performance Management System function.
Alignment of Performance Management System Goals with Organization strategy (P-ALIGN) -
Board practices, planning practices and commitment of Performance Management System goals to organization
goals, mission and philosophy.
Performance Management System Practices
P-PMS
P-ALIGAN
P-FRM
P-PMS NEEDS
P-JEVAL
P-PART
P-COMPP-PAP
The Theoretical model hence deduced in depicted in figure 1.
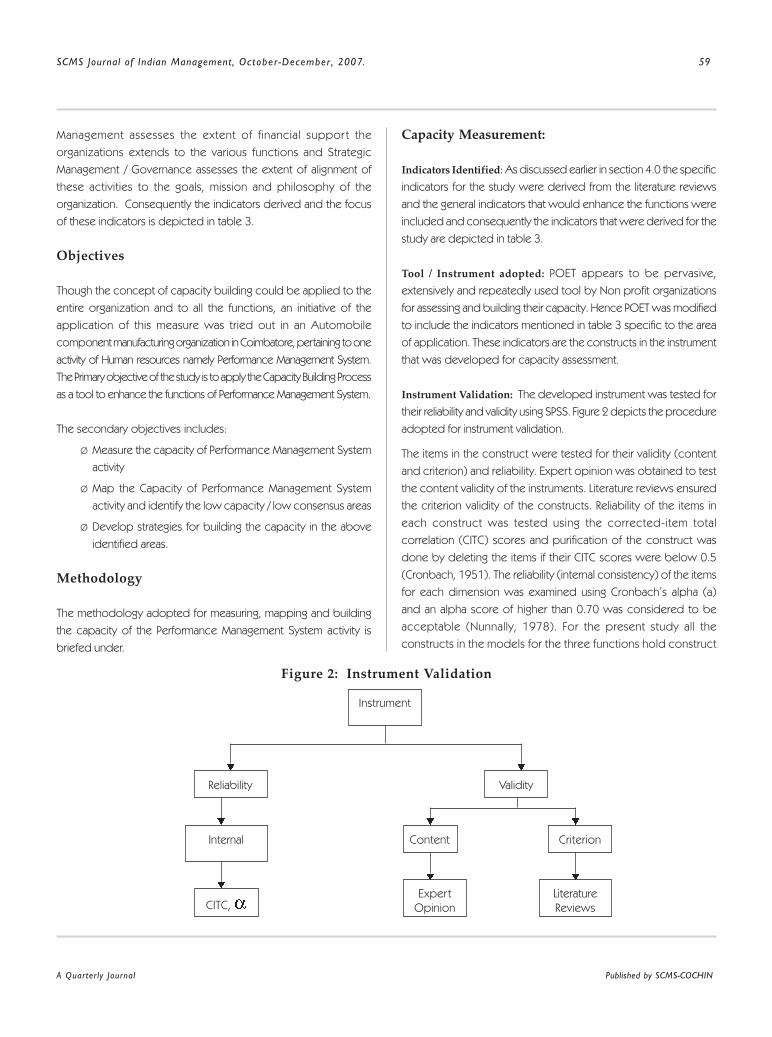
SCMS Journal of Indian Management, October-December , 2007. 59
A Quarterly Journal Published by SCMS-COCHIN
Management assesses the extent of financial suppor t the
organizations extends to the various functions and Strategic
Management / Governance assesses the extent of alignment of
these activities to the goals, mission and philosophy of the
organization. Consequently the indicators derived and the focus
of these indicators is depicted in table 3.
Objectives
Though the concept of capacity building could be applied to the
entire organization and to all the functions, an initiative of the
application of this measure was tried out in an Automobile
component manufacturing organization in Coimbatore, pertaining to one
activity of Human resources namely Performance Management System.
The Primary objective of the study is to apply the Capacity Building Process
as a tool to enhance the functions of Performance Management System.
The secondary objectives includes:
Ø Measure the capacity of Performance Management System
activity
Ø Map the Capacity of Performance Management System
activity and identify the low capacity / low consensus areas
Ø Develop strategies for building the capacity in the above
identified areas.
Methodology
The methodology adopted for measuring, mapping and building
the capacity of the Performance Management System activity is
briefed under.
Capacity Measurement:
Indicators Identified: As discussed earlier in section 4.0 the specific
indicators for the study were derived from the literature reviews
and the general indicators that would enhance the functions were
included and consequently the indicators that were derived for the
study are depicted in table 3.
Tool / Instrument adopted: POET appears to be pervasive,
extensively and repeatedly used tool by Non profit organizations
for assessing and building their capacity. Hence POET was modified
to include the indicators mentioned in table 3 specific to the area
of application. These indicators are the constructs in the instrument
that was developed for capacity assessment.
Instrument Validation: The developed instrument was tested for
their reliability and validity using SPSS. Figure 2 depicts the procedure
adopted for instrument validation.
The items in the construct were tested for their validity (content
and criterion) and reliability. Expert opinion was obtained to test
the content validity of the instruments. Literature reviews ensured
the criterion validity of the constructs. Reliability of the items in
each construct was tested using the corrected-item total
correlation (CITC) scores and purification of the construct was
done by deleting the items if their CITC scores were below 0.5
(Cronbach, 1951). The reliability (internal consistency) of the items
for each dimension was examined using Cronbach’s alpha (a)
and an alpha score of higher than 0.70 was considered to be
acceptable (Nunnally, 1978). For the present study all the
constructs in the models for the three functions hold construct
Figure 2: Instrument Validation
Instrument
ValidityReliability
Internal Content Criterion
CITC, Expert
Opinion
Literature
Reviews
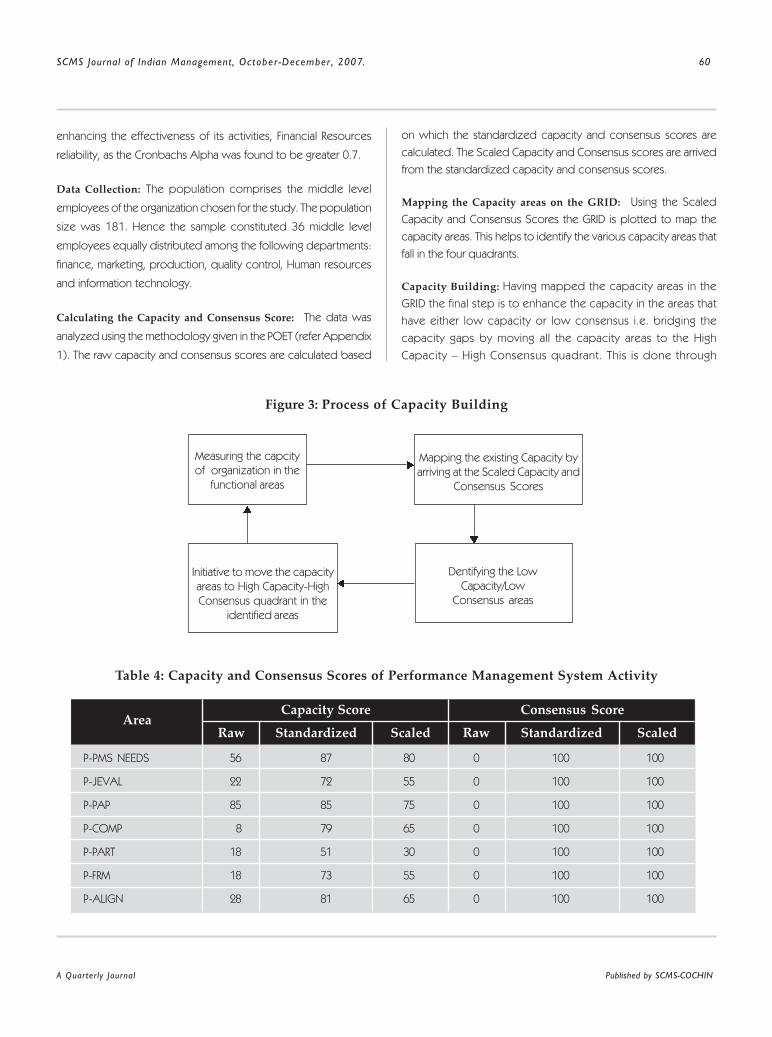
SCMS Journal of Indian Management, October-December , 2007. 60
A Quarterly Journal Published by SCMS-COCHIN
enhancing the effectiveness of its activities, Financial Resources
reliability, as the Cronbachs Alpha was found to be greater 0.7.
Data Collection: The population comprises the middle level
employees of the organization chosen for the study. The population
size was 181. Hence the sample constituted 36 middle level
employees equally distributed among the following departments:
finance, marketing, production, quality control, Human resources
and information technology.
Calculating the Capacity and Consensus Score: The data was
analyzed using the methodology given in the POET (refer Appendix
1). The raw capacity and consensus scores are calculated based
on which the standardized capacity and consensus scores are
calculated. The Scaled Capacity and Consensus scores are arrived
from the standardized capacity and consensus scores.
Mapping the Capacity areas on the GRID: Using the Scaled
Capacity and Consensus Scores the GRID is plotted to map the
capacity areas. This helps to identify the various capacity areas that
fall in the four quadrants.
Capacity Building: Having mapped the capacity areas in the
GRID the final step is to enhance the capacity in the areas that
have either low capacity or low consensus i.e. bridging the
capacity gaps by moving all the capacity areas to the High
Capacity – High Consensus quadrant. This is done through
Figure 3: Process of Capacity Building
Table 4: Capacity and Consensus Scores of Performance Management System Activity
Measuring the capcity
of organization in the
functional areas
Dentifying the Low
Capacity/Low
Consensus areas
Initiative to move the capacity
areas to High Capacity-High
Consensus quadrant in the
identified areas
Mapping the existing Capacity by
arriving at the Scaled Capacity and
Consensus Scores
Consensus ScoreCapacity ScoreArea
Raw Standardized Scaled Raw Standardized Scaled
P-PMS NEEDS 56 87 80 0 100 100
P-JEVAL 22 72 55 0 100 100
P-PAP 85 85 75 0 100 100
P-COMP 8 79 65 0 100 100
P-PART 18 51 30 0 100 100
P-FRM 18 73 55 0 100 100
P-ALIGN 28 81 65 0 100 100

SCMS Journal of Indian Management, October-December , 2007. 61
A Quarterly Journal Published by SCMS-COCHIN
brain storming session conducted with the executives of HR
department and major functional department representatives to
devise strategies to bridge the capacity gaps thereby enhancing
the capacity of the Performance Management System activity.
From the above discussion the process of Capacity Building
could be deduced as depicted in figure 3.
Analysis - Measuring and Mapping the Capacity areas of the
HR functions: The analysis of the questionnaires that were
administered and collected was carried out by arriving at the raw,
standardized and scaled capacity and consensus scores (refer
Appendix 1) and plotting the GRID for the various capacity areas of
Performance Management System activity Table 4 gives the above
scores for Performance Management System activity.
Table 5: Symbols depicted in the GRID for the Various Capacity Areas
Figure 4: GRID for Performance Management System Activity
Figure 5: Mapping the Capacity Areas in the Four Quadrants
Consensus
High
LowCapacity
Nil Ni l
P-PART
P-JEVAL, P-FRM,P-COMP, P-ALIGN,
P-PAP, P-PMS NEEDS
Co
ns
en
su
s
High
High
Low Capacity High
1009 08 07 06 05 04 03 02 01 00
1 0
2 0
3 0
4 0
5 0
6 0
0
7
0
8
0
9
0
0 �
/ �♥ ♣ £

SCMS Journal of Indian Management, October-December , 2007. 62
A Quarterly Journal Published by SCMS-COCHIN
The above capacity and consensus scores are plotted on a GRID
to map the capacity of Performance Management System activity.
Figure four depicts the plotted GRID and figure five depicts the
capacity mapping of the areas that fall in the four quadrants. Table
5 gives the symbols that depict the different capacity areas.
Discussions for Capacity Building
From the above figure we infer that only one capacity area Partnering,
in Performance Management System activity falls in the low capacity
– high consensus quadrant. This indicates that the employees have
high agreement that they lack the effectiveness with respect to the
above functions. This degree of high consensus and low capacity
that they have could be viewed in two angles i) the organization
lacks the ability and efficiency to perform those activities ii) the
organization is performing effectively and efficiently in those areas
but lack transparency. The remaining capacity areas fall in the high
capacity – high consensus quadrant indicating adequate capacity
and consensus in the above areas. Partnering turned to be low
capacity area indicating that the organization is not involving in
partnerships with consultants or other organization for enhancing
its effectiveness and efficiency.
Having identified the low capacity/low consensus area adequate
strategies are to be devised to move these areas to the high capacity
high consensus (HC-HC) quadrant. The reasons for the low capacity
profile and the strategies to overcome them were identified through
brain storming session conducted with the executives of HR
Table 6: Strategies derived through the Brain storming session for Capacity Building
department and major functional department representatives. The
team comprised twelve members. The discussions were carried
out in two stages. In the first stage the reasons for the low capacity
areas were identified and then in the second stage the strategies
that are to be adopted to move the capacity areas to the HC-HC
quadrant were arrived (table 6).
Conclusion
The above discussion reveals that with regard to partnering the
organization has a low capacity profile. Since the organization has
not engaged itself in partnership with other organizations or
consultants for enhancing its performance management system
activity the capacity profile turned to be low. Currently performance
appraisal programs are conducted by the members of the HR
department. Employees feel that the criteria fixed up for appraisal
process does not reflect their respective job positions and
professionalism is needed with regard to identifying and fixing up
job specific appraisal criteria. Hence by hiring consultants who
hold professionalism, criteria for individual job positions could be
arrived at which would make the appraisal process more effective
and efficient, which on the other hand is the motivational point for
employees as the pattern of compensation and career development
holds its base in these performance appraisal reports. This would
help the organization move the Partnering area to the HC-HC
quadrant, where by it would excel in its performance management
system activity, which implies that the employees are appraised
and rewarded appropriately. This could be viewed as stage I in
capacity building process. Once the organization reaches this
stage it can move to stage II. Stage II could be viewed as functional
capacity enhancement. In this stage organizations can extend the
above capacity building process to all the activities of HR function,
thereby excelling in that function. Once the organization has
accomplished stage II, it can move to stage III, which could be
thought as organizational capacity assessment, whereby the
organization would excel in all its functions. Then it can move to
stage IV, where in organizations belonging to the same sector in
the region can join together and form cohort and carry out the
capacity building exercise in their respective organizations. Once
the capacity areas have been mapped, the organization that has
the highest capacity and consensus score in each area can be
identified. The practices that have been adopted by the organization
in that particular activity could be taken up for discussion. This
would facilitate other members of the cohort to compare their
practices with that organization enabling them to enhance their
Area Reason for Low capacity /Low consensus Strategy to move to HC – HC
P-PART Partnering has not been engaged with external Develop partnership with consultants for
organization / consultants to organize and identifying and preparing job specific
conduct performance appraisal programs appraisal criteria

SCMS Journal of Indian Management, October-December , 2007. 63
A Quarterly Journal Published by SCMS-COCHIN
current practices. Few cohorts that exist in Coimbatore are South
India Textile Research Association (SITRA), Coimbatore Foundry and
Industry Owners Association (COFIOA), Coimbatore Tiny and Small
Foundry Owners Association (COSMOFAN), Southern India
Engineering Manufacturer’s Association (SIEMA). This would help
capacity enhancement among all the organizations in that region
thereby enabling them meet the challenges posed by the globalized
scenario.
Appendix 1: Key words and Terminologies
The raw capacity score is the average team response to a given capacity area.
The standardized capacity score uses an index to allow different POET capacities to
be compared meaningfully. The standardized score is tabulated by dividing a capacity
area’s raw score by the area’s maximum number of points and then multiplying by 100
to get an indexed score.
The consensus score measures the degree to which team members agree with one
another concerning their assessment of a given capacity area. The consensus score is
obtained by taking the standard deviation to measure the spread of answers, and then
tabulating the coefficient of variance.
Standard deviation and the coefficient of variance are measures of dispersion. The raw
consensus score expresses disagreement hence it is inverted and converted to a
1-100 scale in order to be graphed in the same way as the capacity dimension.
To plot in the grid the Standardized Capacity and Consensus Scores are converted in
to scaled Capacity and Consensus Scores.
1. The raw capacity score is the average team response to a given capacity area. The
score is tabulated by obtaining each respondent’s total score for the section and then
obtaining an average score for the section.
2. The standardized capacity score is tabulated by dividing a capacity area’s raw
score by the area’s maximum number of points and then multiplying by 100.
3. The raw consensus score is obtained by taking the standard deviation as a
percentage of the raw capacity score.
4. The standardized consensus score is obtained by multiplying the raw consensus
score by 2 and subtracting the value from 100.
GRID stands for Guided Reflections for Institutional Development gives a plot of the
capacity and consensus scores in each area to explore the relative strengths and
weaknesses of the individual organization. The standardized capacity and consensus
score are converted into scaled capacity and consensus score and then plotted in the
GRID.
A cohort is composed of organizations that want to improve performance, want to
engage in deep organizational learning, and are open to change. Cohorts are
comprised of organizations in related fields and cohort members agree in general
terms issues they intend to focus. Cohort concept enables users to benchmark their
organization’s performance against a wider group of like entities in order to accelerate
progress toward goal achievement.
Corrected-item total correlation: Purification is carried out by examining the (CITC)
score of each item with respect to a specific dimension of a construct. The correlation
of each item with the total score was calculated and items with correlations near zero
would be eliminated.
Measures how well each item contributes to the internal consistency of a particular
construct.
Raw Capacity Score
Standardised Capacity Score
Consensus Score
Standardised Consensus Score
Scaled Capacity andConsensus Score
Procedure for calculating Rawand Standardised Capacityand Consensus Score
GRID
Gohort
CITC
Cronbach’s Alpha (a) co-efficient
1.
2.
3.
4.
5.
6.
7.
8.
9.
10.
9.

SCMS Journal of Indian Management, October-December , 2007. 64
A Quarterly Journal Published by SCMS-COCHIN
References
“Agri India-US Joint Statement.” <http://www.dae.gov.in/
press/020306j ts tmt .htm>.
“Akshaya Project.” <http://www.210.212.236.212/akshaya/
capacityprgms.html>.
Alliance Annual Conference. “Emerging Approaches: The
Expanding Universe of Non-profit Capacity Building.”
Proceedings of the Alliance Annual Conference.
2003.14- 30.
“Australia Biosafety.” <http://www.dfat.gov.au/environment/
bsp/bio_sub/capacity.html>.
“Azim Premji Foundation.” <http://ww.azimpremjifoundation.org/
html/capacitybuilding.htm>.
Bartram, D. “Assessment in Organizations.” Applied Psychology:
An International Review. Vol.53, No. 2: (2004): 237–259.
Baumqarten, L. “Building Capacity for Public Advocacy.” 2004.
<http://www.clpi.org>.
“Biodiversity Conservation and Rural Livelihood Improvement
Project.” <http://projecttiger.nic.in/BCRLIProject.htm>.
Birdsell, J.M., Zerbe, W., O’Connell, P., Thornley, R ., and
Haywood, S. Unpacking Organizational Capacity
for Research.
Blumenthal, B. “Investing in Capacity Building: A Guide to
High –Impact Approaches.” 2003.
Boyd, N.M. and Kyle, K. “Expanding the View of Performance
Appraisal by Introducing Social Justice Concerns.”
Administrative Theory and Praxis. Vol. 26, No. 3:
(2004): 249–278.
BPA and O.<http://www.ilr.cornell.edu/ped/benequal>.
Brown, M. and Heywood, J .S. “Performance Appraisa l
Systems: Determinants and Change.” British Journal
of Industrial Relations. Vol.43, No.4: (2005): 659–679.
Cameron, Richards. – ICT. <http://www.digitallearning.in/
maymag06/e_learning.asp>.
Capacity.<http: / /www.gdrc .org /uem/capac i ty - def ine
. h tm l> .
“Capac i t y Bu i ld i ng . ” Madhya P r adesh : <ht tp : / /
www.mp.n ic . in/d i t /Capaci ty%20Bui ld ing%20R
oa d % 2 0 M a p % 2 0 M P. p d f > .
11. Key for converting the standardized capacity and consensus scores into Scaled Capacity and Consensus Scores
Standardized Score 0 - 22 23 - 32 33 - 39 40 - 45 46 - 50 51 - 55
Scaled Score 5 10 15 20 25 30
Standardized Score 56 - 59 60 - 63 64 - 67 68 - 71 72 - 74 75 - 78
Scaled Score 35 40 45 50 55 60
Standardized Score 75 - 78 79 - 81 82 - 84 85 - 87 88 - 89
Scaled Score 60 65 70 75 80
Standardized Score 90- 92 93 - 95 96 - 98 99 - 100
Scaled Score 85 90 95 100

SCMS Journal of Indian Management, October-December , 2007. 65
A Quarterly Journal Published by SCMS-COCHIN
“Capacity Building – Power Sector.” <http://powermin.nic.in/
i n d i a n _ e l e c t r i c i t y _ s c e n a r i o / b l u e % 2 0 p r i n t /
distribution_reforms.htm>.
“Capacity Building.” Rajasthan: <http://www.rajasthan.gov.in/
Rajasthan%20CBRM.pdf>.
“Capacity Building for Climate Change.” <http://www.ficci.com/
media-room/speeches-presentations/2002/oct/oct-
climate-milind.ppt.>.
CAPART. <http://capar t.nic. in/mou_CAPART_I ISC.htms>.
CAPART. <http://capar t.nic. in/mou_CAPART_I ISC.htms>.
CapBuild GMI. <http://www.gmi.org/research/capbuild.htm>.
Charca. <http://www.youandaids.org/Charca/AboutUs.asp>.
Chhattisgarh – IT. <http://www.chips.gov.in/capacity.htm>.
Cleveland, J.N., Murphy, K.R. and Williams, R.E. “Multiple Uses of
Performance Appraisal: Prevalence and Correlates.” Journal
of Applied Psychology. Vol.74: (1989): 130 –135.
Cosio, R.G.G. “Social Constructivism and Capacity Building for
Environmental Governance.” Journal of International
Planning Studies. Vol.3, No.3; (1998): 367- 390.
Cronbach, L.J. “Coefficient Alpha and Internal Structure of Tests.”
Psychometrika. Vol.16; (1951): 297-334.
De Vita, C.J. and Fleming, C. “Building Capacity in Nonprofit
Organizations.” The Urban Institute, Washington DC.,
USA: 2001.
DEME.<ht tp : / /www.nce r t . n i c . i n / s i t e s / PAC%20P rog /
deme.pdf>.
DeNisi, A.S. and Pitchard, R.D. “Performance Appraisal, Performance
Management and Improving Individual Performance: A
Motivational Framework.” Management and Organization
Review. Vol.2, No.2: (2006): 253–277.
DeVreede, De, Jones, Gert-Jan., Noel, M. and Rabson, J. “Exploring
the Applications and Acceptance of Group Support
Systems.” Africa Journal of Management Information
Systems. Vol.15, No.3 (1998/99): 198 –236.
Doha Development. “The Doha Development Issue 3.”
International Trade Forum. 2002.
DOSA. <http: / /www.edc.org/GLC?CapDev/dosaf i le>.
“Ear thquake Engineering Research Centre - IIIT Hyderabad.”
<http: / /www.eerc . i i i t . ac . in / index_f i les /eerc-
cbp.html>.
EDI Ahmedabad.<http://www.ediindia.org/Org_Suppor t.
asp>.
Eldridge, D. “Capacity Building for Regulation.” The University of
Manchester, Manchester, November 4, 2004.
Empowering Nonprofits. Empowering the Non-profit Sector.
Proceedings of the Fifth Annual Conference, (2004,
August 12-15); 1-39.
Energy Conservation Act.<http://powermin.nic. in/acts_
n o t i f i c a t i o n / e n e r g y _ c o n s e r v a t i o n _ a c t /
introduction.htm>.
Field Building Alliance Conference. “Studies in Field Building: Linking
Capacity Building and Social Change.” Proceedings of
the Alliance Annual Conference. (2003): 1-10.
Gerry, S.V., Fitch, C., Jarlais, D., Poznyak, V., Perils, T., Edna
Oppenheimer, E., and Rhodes, T. “Rapid Assessment
and Response Studies of Injection Drug Use: Knowledge
Gain, Capacity Building, and Intervention Development in
a Multisite Study.” American Journal of Public Health. Vol.
96, No.2 (2006): 288-295.
Harsh, S., Acharya, A. and Ranga, B.T.K., “Business Process
Reengineering, in Strategic Management Current Trends
and Issues.” Deep and Deep Publications.
Hartog, D.N., Boselie, P. and Paauwe, J. Performance Management:
A Model and Research Agenda. Applied Psychology:
An International Review, Vol. 53, No.4 (2004): 556 –569.
Haugh, H. and Rubery, E. “Educating Managers to Lead Community
Enterprises.” International Journal of Public
Administration. Vol.28; (2005) 887–902.
Hoffman, C., Nathan, B., and Holden, L. “A comparison of validation
criteria: Objective versus subjective performance
measures and self versus supervisor ratings.” Personnel
Psychology. Vol.44, (1991): 601-609.
“India - U.S. Agricultural Knowledge Initiative.” <http://
w w w. f a s . u s d a . g o v / i c d / i n d i a _ k n o w l _ i n i t /
AKI_bdmtg3_062006.asp>.

SCMS Journal of Indian Management, October-December , 2007. 66
A Quarterly Journal Published by SCMS-COCHIN
International Chamber of Commerce. <http://www.iccwbo.org/
home/environment/roadmap/roadmap.asp>.
Jackson, T. “Cross- Cultural Management and NGO Capacity
Building. How Should Impact be Assessed Cross-
Culturally?” The International NGO Training and Research
Centre. (2003):1-9.
Jones, M.L. “Sustainable Organizational Capacity Building: Is
Organizational Learning a Key.” International Journal of
Human Resource Management. Vol.12, No.1 (2001): 91-98.
Kachru, U. Strategic Management Concepts and Cases. 1st Edn,
Excel Books, 2005.
Kaloumaria, I. “Capacity Building in Corporate Governance in Island
Economies- An Experience.” Indian Journal of Training
and Development. Vol. 34, No.4 (2004): 129-138.
Kirkpatrick, C., Parker, D. and Zhang, F. “Private Investment in
Infrastructure in Asia: The Impact of Regulation.” The
Singapore Economic Review. Vol.50; (2005): 369–391.
Landy, F.J., and Farr, J.L. “Performance rating.” Psychological Bulletin.
Vol.87: (1980): 72-107.
Leprosy. <http://mohfw.nic. in>.
Library - Capacity building. <http://dspace.iimk.ac.in/bitstream/
2259/249/1/09-mgs-sunitha-paper+new.pdf>.
MacArthur Foundation.<http://www.iimahd.ernet.in/faculty/
centers_health.htm>.
Maosheng, D. and Haites, E. “Implementing the Clean Development
Mechanism in China.” International Review for
Environmental Strategies, Vol.6, No.1 (2006):153 – 168 .
Marguerite Casey. <http: / /www.caseygrants .org>.
McGuire, M., Rubin, B.Rober t, A . and Richards, C. “Building
Development Capacity inNonmetropolitan Communities.”
Journal of Public Administration Review. 54, No. 5; (1994):
426-433.
M c K i n s e y . < h t t p : / / w w w . e m c f . o r g / e v a l u a t i o n /
mckinsey_assessment_ tool .htm>.
Michael, Porter. “The Value Chain and Competitive Advantage,
Competitive Advantage: Creating and Sustaining Superior
Performance.” New York: Free Press,1985.
Nagaland. <http://nagaland.nic.in/planning&coord/corpus%20
fund.htm>.
NCERT. <http://ncert.nic.in/sites/girls’%20education/girls’%20
education.htm>.
NCSA Project.<http://www.undp.org.in/index.php?>option=
co m _ c o n t e n t & t a s k = v i e w & i d = 1 5 7 and
Itemid= 9 9999999.
NIAR <http://www.ssa.nic.in/planning/Capacity_Building_4th_J
RM_NIAR.pdf>.
N o n - p r o f i t C B P r i n c i p l e s . < h t t p : / / w w w. e n v s c . o r g /
bestpractices.pdf>.
NPCBAERM. http://www.ndmindia.nic.in/EQProjects/NPCBAERM.
pdf.
Nunnally, J.C. “Psychometric Theory.” NY: McGraw-Hill, 1978.
OAT.<ht tp : / /www.ngomanage r.o rg / too l s /OAT_Ju l y_
2004.pdf>.
Orozco, M. and Lapointe, M. “Mexican Hometown Associations
and Development Oppor tunit ies.” Journal of
International Affairs. Vol.57, No.2 (2004): 31-49.
PCA .<www.careinter nat ional .org.uk/download.php>.
Pearce II, J.A . and Robinson, R.B. “Strategic Management
formulation, implementation and control.” 9th Edn, Tata
McGraw Hill, 2005.
Pilbeam, S. and Corbridge, M. “People Resourcing: HRM in
Practice.” London: Prentice Hall, 2002.
POET Manual. <http://www.comminit.com/pdf/POET_Users
Manual.pdf>.
POET.<http://www.comminit.com/planningmodels/pmodels/
planningmodels>.
Prowse, S. “The Role of International and National Agencies in
Trade –Related Capacity Building.” Blackwell Publishers
Ltd., UK: (2002): 1235-1261.
Pryor, L.S. “Benchmarking: A self – improvement Strategy.” The
Journal of Business Strategy. Vol.10 (1989): 28-32.
Ralph Kilman, “Beyond the Quick Fix.” U.S.: Jossey-Bass,
(1986): 31-58.

SCMS Journal of Indian Management, October-December , 2007. 67
A Quarterly Journal Published by SCMS-COCHIN
Randall, R., Ferguson, E. and Patterson, F. “Self-Assessment Accuracy
and Assessment Centre Decisions.” Journal of
Occupational and Organizational Psychology, Vol.73,
(2000): 443—459.
Reddy, P.S., Moodley, S. and Maharajj, S. “Human Resources Capacity
– Building in Local Government A Case Study of the
Training and Development Scheme in Durban.” Journal of
Public Personnel Management. Vol. 29, No.2 (2000):
293 – 304.
RMK. <http://www.rmk.nic.in/chap2.htm>.
Sampson, A. “Capacity Building for Smaller Foundations: Making an
Investment in Ourselves.” Human Interaction Research
Institute. May 2004.
Sarva Shiksha Abhiyan. <http://www.education.nic.in/ssa/
ssa_2.asp>.
SCAT. <http://www.gdrc.org/ngo/bl-scat.htm>.
Senge, P. M. “Communities of Leaders and Learners.” Harvard
Business Review. September- October; (1997): 30-32.
Simmons, J. and Eades, E. “Challenging Aporia in the Performance
Appraisal of Consultants: A Stakeholder Systems
Response.” Clinician in Management. Vol.12 (2004):
153–163.
SMI. <http://www.smifoundation.org/NPAssessmentTool.pdf>.
Soltani, E., Meer, R.B. van der, and Williams, T.M. “A Contrast of HRM
and TQM Approaches to Performance Management:
Some Evidence.” British Journal of Management. Vol.16:
(2005): 211–230.
SVP. <ht tp : / /www.svpsea t t l e .o rg / key_documen t s /
OCAT.xls>.
TATA Institute of Social Sciences. <http://www.tiss.edu/
ongoingfap.htm>.
Taylor, M.S., Tracy, K.B., Renard, M.K., Harrison, J.K., and Carroll, S.J.
“Due Process in Performance Appraisal: A Quasi-
Experiment in Procedural Justice.” Administrative Science
Quarterly. Vol.40 (1995): 459-523.
Tettey, W.J., ICT. “Local Governmental Capacity Building and Civic
Engagement: An Evaluation of the sample Initiative in
Ghana.” Journal of Perspectives on Global Development
and Technology. Vol.1, No.2 (2002): 165 – 192.
“The National Bio resource Development Board.” <http://dst.gov.in/
whats_new/nbdb.htm>.
Times Foundation. <http://timesfoundation.indiatimes.com/
articleshow/866159.cms>.
Townley, B. “The politics of appraisal: lessons of the introduction
of appraisal into UK universities.” Human Resource
Management Journal. Vol. 1, No.2 (1990): 27–44.
Vietnam.<http://magnet.undp.org/cdrb/CATCHER3. htm>.
Visweswaran, C. and Ones, D.S. “Perspectives on Models of Job
performance.” International Journal of Selection and
Assessment. Vol. 8, No.4 (2000): 216-226.
Wallace, L., Spurgeon, P., Latham, L., Freeman, T. and Walshe, K.
“Clinical governance, organizational culture and change
management.” Clinician in Management. Vol.10: (2001):
23–31.
Water shed program. <http://www.epa.gov/twg/2006/
2006faqcapbldg.html>.
Waterman, R., Peters, T. and Phillips, J. “Structure is not Organization,
Business Horizons.” June 1980; 59, 1990.
Weaver, J.D., Dingman, R.L., Morgan, J., Hong, B.A. and North, C.S.
“The American Red Cross Disaster Mental Health Services:
Development of a Cooperative, Single Function,
Multidisciplinary Service Model.” The Journal of
Behavioural Health Services and Research. Vol. 27, No.3
(2000): 314 – 320.
Welbourne, T.M., Johnson, D.E. and Erez, A. “The Role-Based
Performance Scale: Validity Analysis of a Theory-Based
Measure.” Academy of Management Journal. Vol. 41
(1998): 540-555.
Welcome Mapping. <http://www.cpcb.nic.in/zonprog.htm>.
Wescott, C. “Guiding Principles on Civil Service Reform in Africa:
An Empirical Review.” The International Journal of
Public Sector Management. Vol. 12, No. 2 (1999):
145-170.
Wood, S. “Human Resource Management and Performance.”
International Journal of Management Research .
Vol.1, No.4 (1999): 367-413.

SCMS Journal of Indian Management, October-December , 2007. 68
A Quarterly Journal Published by SCMS-COCHIN
I
D r. S u d h i r K u m a r S a h u , L e c t u r e r i n S t a t i s t i c s ,
S a m b a l p u r U n i v e r s i t y , J y o t i v i h a r, B u r l a - 7 6 8 0 1 9 ,
O r i s s a , I n d i a , E m a i l : d r s u d h i r 1 9 7 2 @ g m a i l . c o m
M r . G o b i n d a C h a n d r a P a n d a , L e c t u r e r i n
M a t h e m a t i c s , U n i v e r s i t y C o l l e g e o f E n g i n e e r i n g ,
B u r l a - 7 6 8 0 1 9 , S a m b a l p u r , O r i s s a , E m a i l :
g o b i n d a 1 9 0 0 @ g m a i l . c o m
Weibull Deteriorationand Delay in Payments
Sudhir K.Sahu and Gobinda Chandra Panda
This paper derives a production model for the lot-size inventory system with
finite production rate taking into consideration the effect of weibull deterioration
and the condit ion of permiss ible delay in payments, in which the restr ict ive
assumption of a permissible delay is relaxed to that at the end of the credit
period, the retailer will make a par tial payment on total purchasing cost to the
supplier and payoff the remaining balance by loan from the bank. Numerical
examples are also presented to il lustrate the results of the proposed model.
n recent years , inventory problems for deter iora t ing
i t ems have been widely studied. The first attempt to describe
the optimal ordering policies for such items was made by Ghare
and Schrader (1963). They presented an EOQ model for an
exponentially decaying inventory.
Recently, Goyal and Giri (2001), Sahu,
Samal and Kalam (2006) provided an
excellent and detailed review of
deteriorating inventory literatures.
Furthermore, in deriving the traditional
EOQ inventory model, it was tacitly
assumed that the payment must be
made to the supplier for the items
immediately after receiving the
consignment. However, in practice,
for encouraging the retailer to buy
more, the supplier allows a certain
fixed period for settling the account
and does not charge any interest
from the retailer on the amount owed during this period. Goyal
(1985) first derived an EOQ model under the conditions of
permissible delay in payments. It was assumed that the unit
purchase cost is the same as the selling price per unit. Aggarwal
and Jaggi (1995) then extended
Goyal’s (1985) model to consider
the deteriorating items. Next, Jamal,
Sarker and Wang (1997)
generalized the model to allow for
shor tages. Hwang and Shinn
(1997), Liao, Tsai and Su (2000),
Chang and Dye (2001), Ouyang,
Chen and Chuang (2002),
Chang, Ouyang, and Teng (2003),
Huang and Chung (2003),
Shinn and Hwang (2003), Chang
(2004), Shah (2004), Ouyang,
Teng, Recently, Teng (2002)
amended Goyal’s (1985) model
by considering the difference

A Quarterly Journal Published by SCMS-COCHIN
SCMS Journal of Indian Management, October-December , 2007. 69
between unit price and unit cost, and found that it makes economic
sense for a well-established buyer to order less quantity and take
the benefits of permissible delay more frequently. There were several
interesting and relevant papers related to the trade credits such as
Sahu, Kalam, Sukla and Chand (2005), Davis and Gaither (1985),
Sahu, Acharya and Tripathy (2002), Shah (1993), ARCelus and
Srinivasan (1995), Khouja and Mehrez (1996), Sahu, Dash and Sukla
(2007), Chen (2005), Sahu and Dash (2006) and Sahu, Samal and
Kalam (2007) and so forth.
The restrictive assumption of a permissible delay is relaxed to that
end of the credit period; the retailer will make a partial fulfillment on
the purchasing cost and payoff the remaining balance by loan from
the bank. The main purpose of this paper is to show that there
exists an optimal cycle time to minimize the total variable cost per
unit time. Numericals examples are also presented to illustrate the
results of the proposed model.
Notation
D Annual demand rate
P Annual replenishment rate, P > DA Cost of placing one order
c Unit purchasing price per item
s Unit selling price per item of good quality
h Unit stock holding cost per item per year excluding
interest charges
I Interest, which can be earned per rupee per year
Ie Interest charges per rupees investment in inventory per year
Ip(t) The inventory level that changes with time t during
production period
I2(t) The inventory level that changes with time t during non-
production period
M The trade credit period
T The optimal cycle time
weibull deterioration rate
Assumptions:
♦ Demand rate is known and constant.
♦ Replenishment rate P is known and constant.
♦ Shortages are not allowed.
♦ Time period is infinite.
♦
1
t -1
s > c, Ip > I
e and cI
p > sI
e.
♦ If the credit period is not longer than the cycle length, the
retailer can sell the items, accumulate sales revenue and earn
interest throughout the inventory cycle. At the end of the
credit period, the retailer will make a partial payment cDM on
total purchasing cost to the supplier and pay off the
remaining balance by loan from the bank. The retailer does
not return money to the bank until the end of the inventory
cycle.
Model Formulation
A constant production rate starts at t=0, and continues up to
t=t1
where the inventory level reaches the maximum level.
Production then stops at t=t1, and the inventory gradually depletes
to zero at the end of the production cycle t=T due to
deterioration and consumption. Thereafter, during the time
interval (0,t1), the system is subject to the effect of production,
demand and deterioration. Then, the change in the inventory level
can be described by the following differential equation:
(1)
with in i t ia l condit ion I1(0) = 0.
On the other hand, in the time interval (t1,T), the system is
affected by the combined effect of demand and deterioration.
Hence, the change in the inventory level is governed by the
following differential equation:
(2)
with ending condition I2(T) = 0.
The solution of the differential equation (1) and (2) are
represented by
(3)
,
,
,
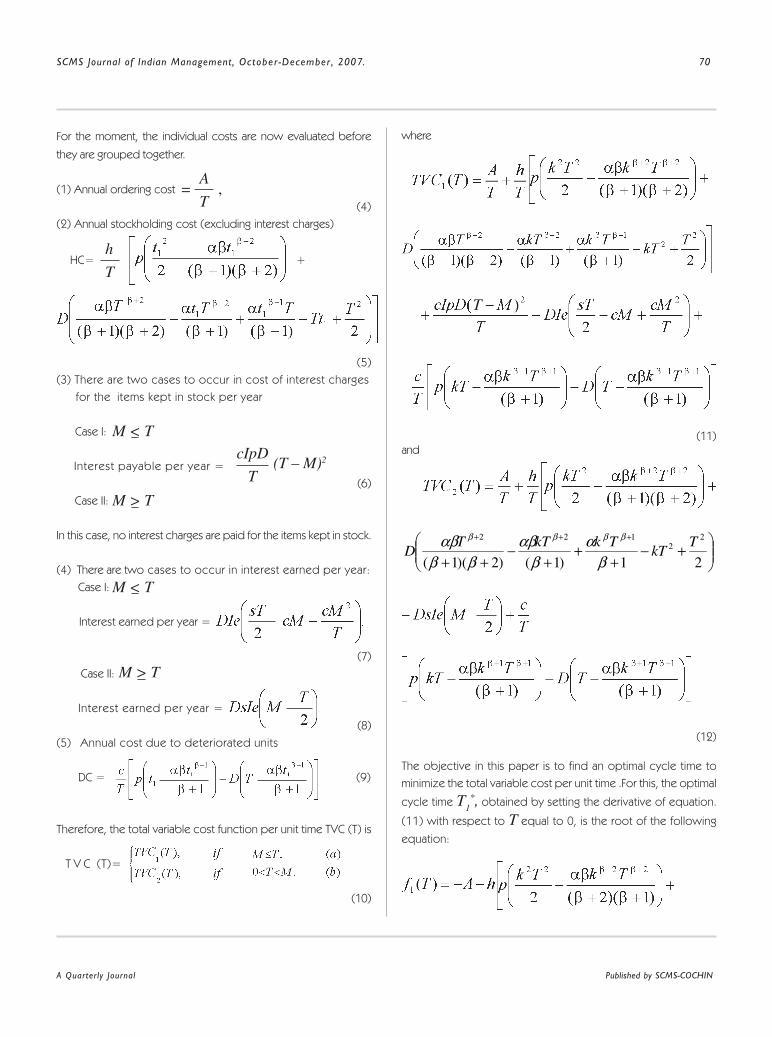
SCMS Journal of Indian Management, October-December , 2007. 70
A Quarterly Journal Published by SCMS-COCHIN
For the moment, the individual costs are now evaluated before
they are grouped together.
(1) Annual ordering cost
(4)
(2) Annual stockholding cost (excluding interest charges)
HC= +
(5)
(3) There are two cases to occur in cost of interest charges
for the items kept in stock per year
Case I:
Interest payable per year =
(6)
Case II:
In this case, no interest charges are paid for the items kept in stock.
(4) There are two cases to occur in interest earned per year:
Case I:
Interest earned per year =
(7)
Case II:
Interest earned per year =
(8)
(5) Annual cost due to deteriorated units
DC = (9)
Therefore, the total variable cost function per unit time TVC (T) is
T V C (T)=
(10)
where
(11)
and
(12)
The objective in this paper is to find an optimal cycle time to
minimize the total variable cost per unit time .For this, the optimal
cycle time T1*, obtained by setting the derivative of equation.
(11) with respect to T equal to 0, is the root of the following
equation:
A
T= ,
h
T
M < T
cIpD
T(T – M)2
M > T
M < T
M > T
+−
++
+−
++
+++
21)1()2)(1(
22
122 TkT
TkkTTD
βα
βαβ
ββαβ ββββ
IT

A Quarterly Journal Published by SCMS-COCHIN
SCMS Journal of Indian Management, October-December , 2007. 71
(15)
Then both and have the same sign and
domain. We also have
Numerical Examples:
I n o rde r to i l l u s t r a te t he above so l u t ion p rocedu re ,
we cons ide r t he fo l l ow ing examp le s .
Example 1.
Given an inventory system with the following parameter
=1000 units/year, A=50units.
h=Rs4/unit/year,Ie=0.13/Rs/year,Ip=0.15/Rs/year,c=Rs5 /unit/
per order, S=Rs6/unit/per order =. 00001, =2,k=. 5,P=Rs
5000 per unit and M=0.0411years.Here we have taken M < T, so the
optimal value is T1* =. 16155 and t
1* =. 080775 and the total annual
relevant inventory cost TVC1
*(T) = 8237.645329.We can find
various replenishment policies under different values of all the
parameters, which are present in table-1.
Example 2
G i v e n a n i n v e n t o r y s y s t e m w i t h t h e f o l l o w i n g
parameter=1000 un i t s /yea r, A=50un i t s h=Rs4/un i t /
year, Ie=0.13/Rs/year, Ip=0.15/Rs/year, c=Rs5 /unit/ per
order, S=Rs6/unit/per order =. 00001, =2, k=. 5, P=
Rs.5000 per unit and M=0.0411years.Here we have taken
T<M, so the optimal value is =. 131533 and =. 065767
and t he to t a l annua l r e l e van t i n ven to r y cos t
=8228.205089.We can find various replenishment policies
under different values of al l the parameters, which are
present in table-2.
+10% .084839 .169678 8275.482957
+20% .088698 .177397 8331.597031
+30% .092378 .184756 8346.196773
+40% .095898 .191797 8379.454310
+50% .099275 .198555 8411.512090
A -10% .076475 .152949 8197.819254
-20% .071896 .143791 8155.663527
-30% .066985 .13397 8110.732582
-40% .061669 .123338 8062.415277
-50% .055841 .111682 8009.837880
(16)
Table -1
Parameter A=50 % change in A t1* T1
* TVC1* (T)

SCMS Journal of Indian Management, October-December , 2007. 72
A Quarterly Journal Published by SCMS-COCHIN
Parameter P=5000 % change in P t1* T1
* TVC1* (T)
+10% .075809 .151618 9517.487214
+20% .71643 .143287 10796.638192
+30% .068089 .136178 12075.074488
+40% .065011 .130023 13352.800255
+50% .062315 .124629 14629.836277
P -10% .086822 .173644 6957.194057
-20% .094378 .188756 5676.316285
-30% .104127 .208255 4395.384418
-40% .117208 .234417 3115.096302
-50% .135569 .271137 1836.627176
Parameter D=1000 % change in D t1* T1
* TVC1* (T)
+10% .082058 .164116 7742.646163
+20% .083463 .166926 7248.253265
+30% .0849221 .169843 6754.360958
+40% .086463 .172927 6261.070592
D +50% .088095 .176191 5768.439156
-10% .079534 .159069 8733.054063
-20% .078356 .156712 9228.883958
-30% .077235 .154471 9725.100488
-40% .076169 .152337 10221.671243
-50% .075152 .150304 10718.568256

A Quarterly Journal Published by SCMS-COCHIN
SCMS Journal of Indian Management, October-December , 2007. 73
Parameter c=5 % change in c t1* T1
* TVC1* (T)
+10% .081203 .162406 8997.247595
+20% .081641 .163282 9757.016906
+30% .082088 .164177 10516.957417
+40% .082546 .165092 11277.075570
c +50% .083014 .166028 12037.378179
-10% .080356 .160713 7478.203739
-20% .079947 .159894 6718.917047
-30% .079546 .159092 5959.779705
-40% .079154 .158308 5200.787695
-50% .078770 .15754 4441.935221
Parameter s=6 % change in s t1* T1
* TVC1* (T)
+10% .081639 .163277 8232.932014
+20% .082530 .165059 8228.204484
+30% .08344 .166898 8223.462474
+40% .084399 .168797 8218.706579
+50% .085380 .17076 8213.938211
s -10% .079938 .159876 8242.344440
-20% .079125 .15825 8247.026663
-30% .078336 .156672 8251.693765
-40% .077569 .155139 8256.344650
-50% .076825 .15365 8260.980010
Parameter h=4 % change in h t1* T1
* TVC1* (T)
+10% .075809 .151618 8267.487220
+20% .071643 .143287 8296.638202
+30% .068089 .136178 8325.074502
+40% .065011 .130023 8352.80027
h +50% .062315 .124629 8379.836296
-10% .086822 .173644 8207.194050
-20% .094378 .188756 8176.316268
-30% .104127 .208255 8145.384386
-40% .117208 .234417 8115.096249
-50% .135569 .271137 8086.6270

SCMS Journal of Indian Management, October-December , 2007. 74
A Quarterly Journal Published by SCMS-COCHIN
Parameter =2 % change in t1* T1
* TVC1* (T)
+10% .080775 .16155 8237.645306
+20% .080775 .16155 8237.645315
+30% .080775 .16155 8237.645320
+40% .080775 .16155 8237.645323
+50% .080775 .16155 8237.645326
-10% .080775 .16155 8237.645273
-20% .080775 .16155 8237.645243
-30% .080775 .16155 8237.645200
-40% .080775 .16155 8237.645141
-50% .080775 .16155 8237.645067
Parameter =.000001 % change in t1* T1
* TVC1* (T)
+10% .080775 .16155 8237.645290
+20% .080775 .16155 8237.645286
+30% .080775 .16155 8237.645283
+40% .080775 .16155 8237.645279
+50% .080775 .16155 8237.645275
-10% .080775 .16155 8237.645297
-20% .080775 .16155 8237.645300
-30% .080775 .16155 8237.645304
-40% .080775 .16155 8237.645308
-50% .080775 .16155 8237.645311
Parameter k-5 % change in k t1* T1
* TVC1* (T)
+10% .081934 .148971 9526.307307
+20% .082510 .137516 10819.444341
+30% .082707 .127241 12116.403002
k +40% .082663 .11809 13416.582663
+50% .082473 .109964 14719.465891
-10% .078751 .175002 6954.121413
-20% .075502 .188756 5676.316297
-30% .070642 .201833 4404.636583
-40% .063858 .212859 3139.245393
-50% .055077 .220308 1880.098117
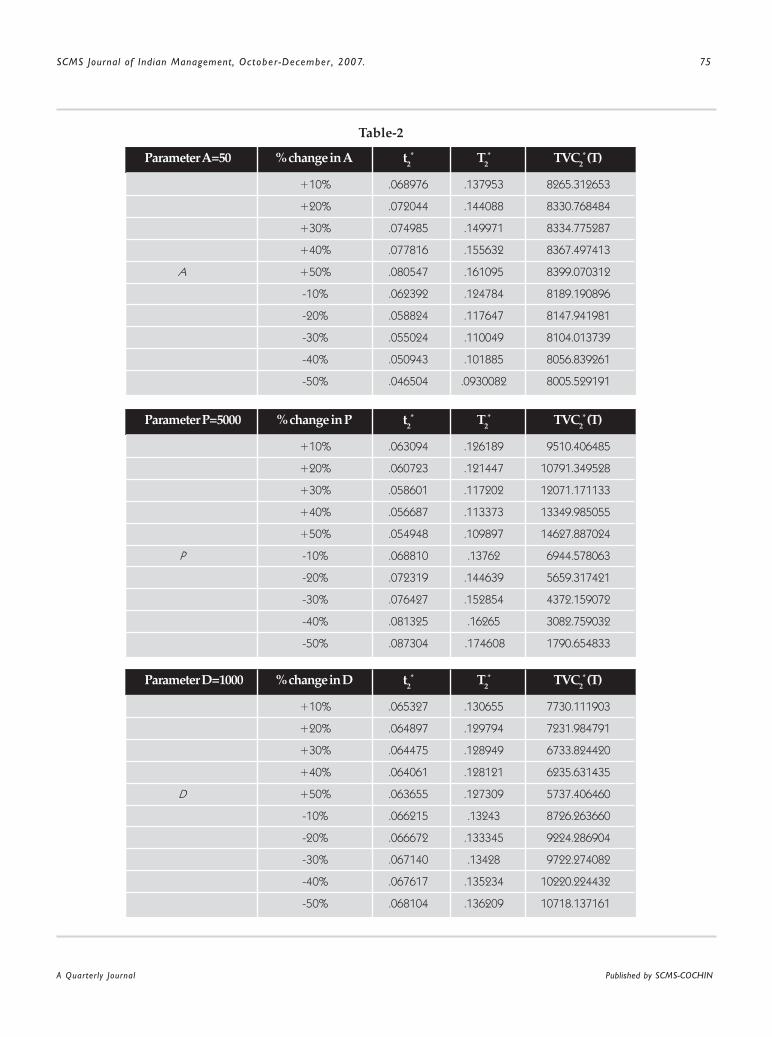
A Quarterly Journal Published by SCMS-COCHIN
SCMS Journal of Indian Management, October-December , 2007. 75
Parameter A=50 % change in A t2* T2
* TVC2* (T)
Table-2
+10% .068976 .137953 8265.312653
+20% .072044 .144088 8330.768484
+30% .074985 .149971 8334.775287
+40% .077816 .155632 8367.497413
A +50% .080547 .161095 8399.070312
-10% .062392 .124784 8189.190896
-20% .058824 .117647 8147.941981
-30% .055024 .110049 8104.013739
-40% .050943 .101885 8056.839261
-50% .046504 .0930082 8005.529191
Parameter P=5000 % change in P t2* T2
* TVC2* (T)
+10% .063094 .126189 9510.406485
+20% .060723 .121447 10791.349528
+30% .058601 .117202 12071.171133
+40% .056687 .113373 13349.985055
+50% .054948 .109897 14627.887024
P -10% .068810 .13762 6944.578063
-20% .072319 .144639 5659.317421
-30% .076427 .152854 4372.159072
-40% .081325 .16265 3082.759032
-50% .087304 .174608 1790.654833
Parameter D=1000 % change in D t2* T2
* TVC2* (T)
+10% .065327 .130655 7730.111903
+20% .064897 .129794 7231.984791
+30% .064475 .128949 6733.824420
+40% .064061 .128121 6235.631435
D +50% .063655 .127309 5737.406460
-10% .066215 .13243 8726.263660
-20% .066672 .133345 9224.286904
-30% .067140 .13428 9722.274082
-40% .067617 .135234 10220.224432
-50% .068104 .136209 10718.137161

SCMS Journal of Indian Management, October-December , 2007. 76
A Quarterly Journal Published by SCMS-COCHIN
Parameter c=5 % change in c t2* T2
* TVC2* (T)
+10% .065767 .131533 8978.205086
+20% .065767 .131533 9728.205083
+30% .065767 .131533 10478.205077
+40% .065767 .131533 11228.205077
+50% .065767 .131533 11978.205074
c -10% .065767 .131533 7478.205092
-20% .065767 .131533 6728.205095
-30% .065767 .131533 5978.205097
-40% .065767 .131533 5228.205100
-50% .065767 .131533 4478.205103
Parameter s=6 % change in s t2* T2
* TVC2* (T)
+10% .065327 .130655 8230.111902
+20% .064897 .129794 8231.984788
+30% .064475 .128949 8233.824416
+40% .064061 .128121 8235.631430
+50% .063655 .127309 8237.406453
s -10% .066215 .13243 8226.263661
-20% .066672 .13334 8224.286906
-30% .067140 .13428 8222.274086
-40% .067617 .135234 8220.224437
-50% .068104 .136209 8218.137168
Parameter h=4 % change in h t2* T2
* TVC2* (T)
+10% .063094 .126189 8260.406489
+20% .060723 .121447 8291.349535
+30% .058601 .117202 8321.171143
+40% .056687 .113373 8349.985067
h +50% .054948 .109897 8377.887039
-10% .068810 .13762 8194.578059
-20% .072319 .144639 8159.317411
-30% .076427 .152854 8122.159055
-40% .081325 .16265 8082.759007
-50% .087304 .174608 8040.654796

A Quarterly Journal Published by SCMS-COCHIN
SCMS Journal of Indian Management, October-December , 2007. 77
values of t1*, T
1* and decreases in TVC
1*(T). Increase
in the value of demand rate D and selling cost s, increases the
values of t1*, T
1* and decreases in TVC
1*(T) and decrease
the value of demand rate D and selling cost s, decreases the
values oft1*, T
1* and increases in TVC
1*(T). Increase in the
value of α and β, values of t1*, T
1*, remain same. When α
increases, TVC1
*(T) decreases and When α decreases,
TVC1*(T) increases. When β increases, TVC
1*(T) increases
and When β decreases, TVC1*(T) decreases. Increase in the
value of k, increases the values of t1
*, TVC1
*(T) and
decreases in T1* and decrease in the value of k, decrease the
values of t1*, TVC
1*(T), and increases in T
1* .
Sensitivity Analysis
On the basis of the results of table-1, the following observation
can be made.
Increase in the va lue of order ing cost A and purchase
cost c, increases the va lues of t1*, T
1* and TVC
1*(T),
decrease in the va lue of order ing cost A and purchase
cost c, decreases the va lues of t1*, T
1* and TVC
1*(T),
Increase in the value of annual replenishment rate P and
holding cost h, decreases the va lues of *1t , *
1T and
increases in TVC1*(T) and decrease the value of annual
replenishment rate P and holding cost h, increases the
Parameter =2 % change in t2* T2
* TVC2* (T)
+10% .065767 .131533 8228.205098
+20% .065767 .131533 8228.205104
+30% .065767 .131533 8228.205107
+40% .065767 .131533 8228.205109
+50% .065767 .131533 8228.205111
-10% .065767 .131533 8228.205074
-20% .065767 .131533 8228.205051
-30% .065767 .131533 8228.205016
-40% .065767 .131533 8228.204967
-50% .065767 .131533 8228.204902
Parameter =.000001 % change in t2* T2
* TVC2* (T)
+10% .065767 .131533 8228.205086
+20% .065767 .131533 8228.205084
+30% .065767 .131533 8228.205082
+40%. .065767 .131533 8228.205079
+50% .065767 .131533 8228.205077
-10% .065767 .131533 8228.205091
-20% .065767 .131533 8228.205094
-30% .065767 .131533 8228.205096
-40% .065767 .131533 8228.205098
-50% .065767 .131533 8228.205101
Parameter k-5 % change in k t2* T2
* TVC2* (T)
+10% .068589 .124708 9519.814779
+20% .070809 .118015 10815.290772
+30% .072536 .111594 12114.044633
k +40% .073869 .105527 13415.570574
+50% .074888 .0998503 14791.440827
-10% .062202 .138227 6941.129371
-20% .057856 .144639 5659.317427
-30% .052585 .150244 4383.524443
-40% .046402 .154672 3114.471190
-50% .039381 .157524 1852.764808

SCMS Journal of Indian Management, October-December , 2007. 78
A Quarterly Journal Published by SCMS-COCHIN
On the bas is of the resul ts of table-2, the fol lowing
observation can be made.
Increase in the value of ordering cost A, increases the values of t2*,
T2* and TVC
2*(T), decrease in the value of ordering cost A,
decreases the values of t2*, T
2* and TVC
2*(T). Increase in the
value of annual replenishment rate P and holding cost h, decreases
the values of t2
*, T2
* and increases in
t2*, T
2* and decrease the value of annual replenishment rate P and
holding cost h, increases the values of *2t , *
2T and decreases in
TVC2*(T). Increase in the value of demand rate D, increases the
values of t2*, T
2* and TVC
2*(T) and decrease the value of demand
rate D , decreases the values of t2*, T
2* and TVC
2*(T). Increase
in the value of α and β and the purchase cost c, values of t2*, T
2*
remain same. When α increases, TVC2*(T) decreases and When
α decreases, TVC2*(T) increases. When β and purchase cost c
increases, TVC2*(T) increases and When β and purchase cost c
decreases, TVC2
*(T) decreases. Increase in the value of k,
increases the values of t2*, TVC
2*(T) and decreases in T
2* and
decrease in the value of k, decrease the values of t2*, TVC
2*(T)
and increases in T2*. Increase in the value of selling cost s, decreases
the values oft2*, T
2* and increasesTVC
2*(T) and decrease the
value of selling cost s, increases the values of t2*, T
2* and decreases
TVC2
*(T).
Conclusion
This study presents a production inventory model for weibull
deterioration items under permissible delay in payments. In
this proposed model numerical examples shows that there a
exist a optimal cycle time to minimize the total variable cost
per unit time. Briefly, results in this study not only provide a
valuable reference for decision makers in planning the
production and controlling the inventory but also provide a
useful model for many organizations that the use the decision
rule to improve their total operation cost in real world. Finally,
a future study will incorporate more realistic assumption in the
proposed model such as variable deterioration rate, stochastic
nature of demand and production rate which depends on the
both on-hand inventory and demand.
Keywords: Inventory, Permissible delay in payments,
Deterioration, Demand, Trade credit.
References
Aggarwal, S.P., and Jaggi, C.K. “Ordering Policies of Deteriorating
Items under Permissible Delay in Payments.” Journal of
Operational Research Society. 46 (1995): 658-662.
Arcelus, F.J., and Srinivasan, G. “Discount Strategies for One-Time-
Only Sales.” AIEE Transactions. 27 (1995): 618-624.
Chang, C.T. “An EOQ Model for Deteriorating Items under Inflation
when Partial Backlogging and Permissible Delay in
Payments.” International Journal of Production
Economics. 88 (2004): 307-316.
Chang, H.J.,and Dye, C.Y. “An Inventory Model for Deteriorating
Items with Partial Backlogging and Permissible Delay
in Payments.” International Journal of Systems
Science. 32 (2001): 345-316.
Chang, C.T., Ouyang, L.Y., and Teng, J.T. “An EOQ Model for
deteriorating Items under Supplier Credits Linked to
Ordering Quantity.” Applied Mathematical Modelling.
27 (2003): 983-996.
Covert, R.P., and Philip, G.C. “An EOQ Model for Items with Weibull
Distribution Deterioration.” AIIE Transaction. 973, 5
323-326.
Davis, R .A ., and Gaither, N. “Optimal Ordering Policies
unde r Cond i t i ons o f E x tended Paymen t
Privileges.” Management Sciences. 31(1985):
499-509.
Ghare, P.M., and Schrader, G.H. “A Model for Exponential ly
Decay ing Inventory System.” I n te rnat iona l
Journal of Production Research . 21 (1963):
449-460.
Goyal, S.K., “Economic Order Quantity under Conditions of
Permissible Delay in Payments.” Journal of the
Operational Society. 36 (1985): 335-338.
Goyal, S.K., and Giri, B.C. “Recent Trends in Modeling of
Deteriorating Inventory.” Europian Journal of
Operations Research. 134 (2001): 1-16.

A Quarterly Journal Published by SCMS-COCHIN
SCMS Journal of Indian Management, October-December , 2007. 79
Huang, Y.F., and Chung, K.J. “Optimal Replenishment and
Payment Policies in the EOQ Model under Cash
Discount and Trade Credit.” Asia-Pacific Journal of
Operational Research. 20 (2003): 177-190.
Hwang, H., and Shinn, S.W. “Retailer ’s Pricing and Lot Sizing
Policy for Exponentially Deteriorating Products under
the Conditions of Permissible Delay in Payments.”
Computers and Operations Research. 24 (1997):
539-547.
Jamal, A.M., Sarker, B.R., and Wang, S. “An Ordering Policy for
deteriorating Items with Allowable Shortages and
Permissible Delay in Payments.” Journal of the
Operational Research Society. 8 (1997): 826-833.
Khouja, M., and Mehrez, A. “Optimal inventory policy under
credit policies.” Journal of the Manufacturing
Systems. 15 (1996): 334-339.
Kosmala, W.A.J. “Advance Calculus: A Friendly Approach.” Upper
Saddle River. N.J: Prentice-Hall, 1999.
Liao, H.C., Tsai, C.H., and Su, C.T. “An Inventory Model with
deteriorating Items under Inflation When a Delay in
Payment is Permissible.” International Journal of
Production Economics. 63 (2000): 207-214.
Ouyang, L.Y., Chen, M.S., and Chuang, K.W. “Economic Order
Quantity Model under Case Discount and Payment
Delay.” Internat ional Journal of Information
Management Sciences. 13 (2002): 1-10.
Ouyang, L.Y., Teng, J.T., and Chen, L.H. “Optimal Ordering Policy
for deteriorating Items with Par tial Backlogging
under Permissible in Payments.” Journal of Global
Optimizations. 34 (2005): 245-271.
Sahu , S .K . , Sama l , D . , and Ka lam, A . “An Economic
P roduct ion Lot -S ize Inventory Mode l fo r
Deteriorating Items with Weibull Production and
Weibull Demand Rate.” Vision, Journal of The
Jayaprakash Narayan Institute of Social And
Economic Studies. Vol.XXVI.No.3 (2006): 67-
79.
Sahu, S.K., Kalam, A ., Sukla, P.K., and Chand, A . “Corporate
Inventory Ordering Policy with Fixed Demand
and Par tial Backlogging under Conditions of
Permissible Delay in Payments.” Excellence, The
Journal of Management. Volume –II (2005): 21-
29.
Sahu, S.K., Acharya, M., and Tripathy, P.K. “An Inventory
Model for deteriorating Items with Permissible
Delay Payment with Shor tage.” Applied Science
Periodical. Volume–IV, No.3 (2002): 128-130.
Sahu, S.K., and Dash, S .K . “An Order Leve l Inventor y
Model for Weibul l deter iorat ing I tems with
Cons t an t Demand Ra te . ” Marke te logy , A
Quar ter ly Jour nal of Inst i tute of Market ing
and Management . Vo lume.1 , No.1 (2006):
52-58.
Sahu, S .K . , Dash, D.R . , and Suk la , P.K . “An Inventor y
Model for Weibul l deter iorat ing I tems with
Time Dependent Demand.” ACCST Research
Journal . Volume-V, No.2, accepted, 2007.
Sahu, S .K . , Ka lam, A . , and Samal , D . “An Inventor y
Model with on Hand Inventory Dependent
Demand Rate without Shor tage.” Journal of
the Indian Academy of Mathematics. Volume-
29, No.1, accepted, 2007.

SCMS Journal of Indian Management, October-December , 2007. 80
A Quarterly Journal Published by SCMS-COCHIN
I
Tourism in India is the least discussed subject in the Indian planning scenario. Although the
travel and tourism industry is growing at a very rapid pace across the world, here we have not
been able to generate enough revenue, through this industry. The problems are very basic and
addressable. Not only that, definite actions are not taken. It is the subject matter least discussed.
It is also not that there is no attraction within our country. We are one of the countries in the
world, wherein we have evidences from the earliest civilizations to modern day history. But
the apathy is that we still have less than one percent of market share of world tourism and
more Indians are heading towards offshore destinations for their holidays.
Tourism:Inexhaustible Revenue Source
Hory Sankar Mukerjee and Vedha Balaji
Mr.Hory Sankar Mukerjee, Faculty-Al-Ameen Institute
of Management Studies, Hosur Road, Opposite to Lal
Bagh Ma in Gate , Banga lore -560027, Emai l :
Ms.Vedha Ba la j i , Facu l ty -Al -Ameen Ins t i tu te of
Management Studies, Hosur Road, Opposite to Lal
Bagh Main Gate , Banga lore -560027, Emai l :
ndia is a land of beauty, art, culture, heritage, and people. It has
been attracting the rich, poor, knowledge seekers, tourists, from
the very early years. We also do have
substantial evidence in history to
prove that. Over the years India
became the seat of power,
intelligence, economic strength and
it was the envy for all foreign rulers.
Today the scenario has changed. We
have lost to the foreign nationals in
terms of tourism inflows. Our country
was a source of attraction to the west
from the medieval times and we have
been at the pinnacle of success in all
ages. There was a lot of glory that
was attached to India.
This gives a great challenge to the
country, because our economic
backwardness can be removed through better tourism
management. Tourism is an industry which is non-polluting and
does require investment, not as high
as other industries. However
somewhere down the line we have
lost focus in tourism, as this is one of
the sectors which is concentrated the
least in the governmental affairs. What
is required in tourism is the
willingness of the government, and
“substance” within a country for
people to enjoy. We have
“substance” in plenty. No Indian
would ever accept the fact that we
have comparatively lesser number of
destinations. What now is essentially
required is aligning the strategies, and
channelis ing the force to one
direction for better prospects.
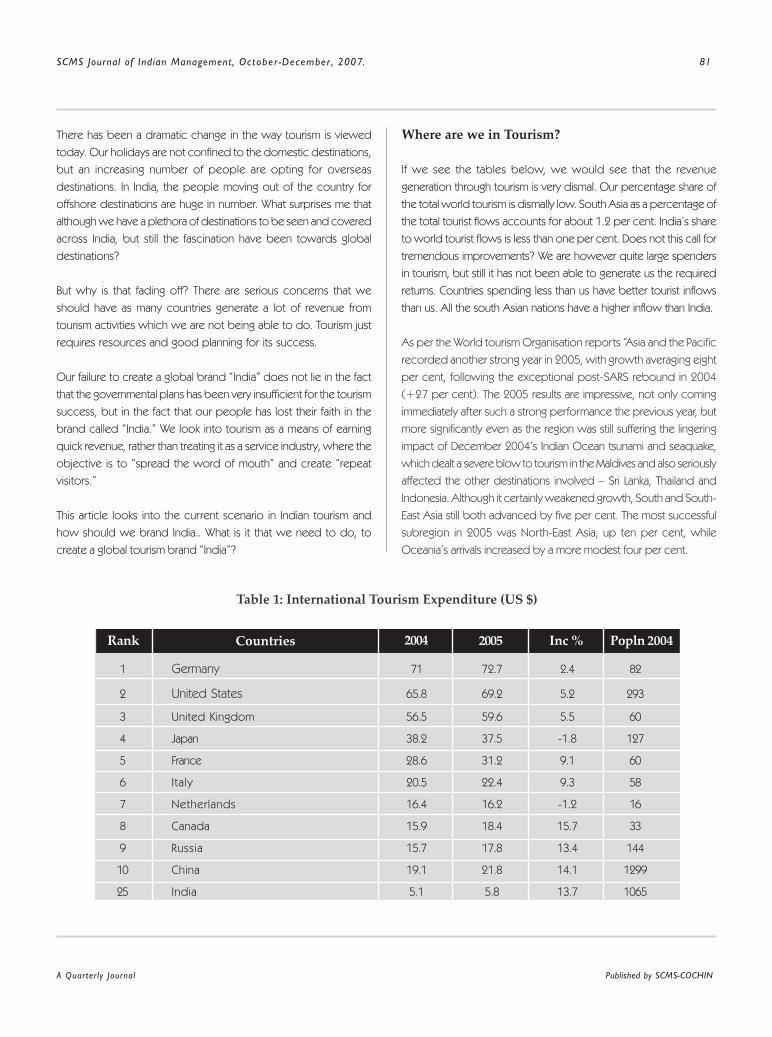
A Quarterly Journal Published by SCMS-COCHIN
SCMS Journal of Indian Management, October-December , 2007. 81
There has been a dramatic change in the way tourism is viewed
today. Our holidays are not confined to the domestic destinations,
but an increasing number of people are opting for overseas
destinations. In India, the people moving out of the country for
offshore destinations are huge in number. What surprises me that
although we have a plethora of destinations to be seen and covered
across India, but still the fascination have been towards global
destinations?
But why is that fading off? There are serious concerns that we
should have as many countries generate a lot of revenue from
tourism activities which we are not being able to do. Tourism just
requires resources and good planning for its success.
Our failure to create a global brand “India” does not lie in the fact
that the governmental plans has been very insufficient for the tourism
success, but in the fact that our people has lost their faith in the
brand called “India.” We look into tourism as a means of earning
quick revenue, rather than treating it as a service industry, where the
objective is to “spread the word of mouth” and create “repeat
visitors.”
This article looks into the current scenario in Indian tourism and
how should we brand India.. What is it that we need to do, to
create a global tourism brand “India”?
Where are we in Tourism?
If we see the tables below, we would see that the revenue
generation through tourism is very dismal. Our percentage share of
the total world tourism is dismally low. South Asia as a percentage of
the total tourist flows accounts for about 1.2 per cent. India’s share
to world tourist flows is less than one per cent. Does not this call for
tremendous improvements? We are however quite large spenders
in tourism, but still it has not been able to generate us the required
returns. Countries spending less than us have better tourist inflows
than us. All the south Asian nations have a higher inflow than India.
As per the World tourism Organisation reports “Asia and the Pacific
recorded another strong year in 2005, with growth averaging eight
per cent, following the exceptional post-SARS rebound in 2004
(+27 per cent). The 2005 results are impressive, not only coming
immediately after such a strong performance the previous year, but
more significantly even as the region was still suffering the lingering
impact of December 2004’s Indian Ocean tsunami and seaquake,
which dealt a severe blow to tourism in the Maldives and also seriously
affected the other destinations involved – Sri Lanka, Thailand and
Indonesia. Although it certainly weakened growth, South and South-
East Asia still both advanced by five per cent. The most successful
subregion in 2005 was North-East Asia, up ten per cent, while
Oceania’s arrivals increased by a more modest four per cent.
Table 1: International Tourism Expenditure (US $)
Popln 200420052004 Inc %CountriesRank
1 Germany 71 72.7 2.4 82
2 United States 65.8 69.2 5.2 293
3 United Kingdom 56.5 59.6 5.5 60
4 Japan 38.2 37.5 -1.8 127
5 France 28.6 31.2 9.1 60
6 Italy 20.5 22.4 9.3 58
7 Netherlands 16.4 16.2 -1.2 16
8 Canada 15.9 18.4 15.7 33
9 Russia 15.7 17.8 13.4 144
10 China 19.1 21.8 14.1 1299
25 India 5.1 5.8 13.7 1065
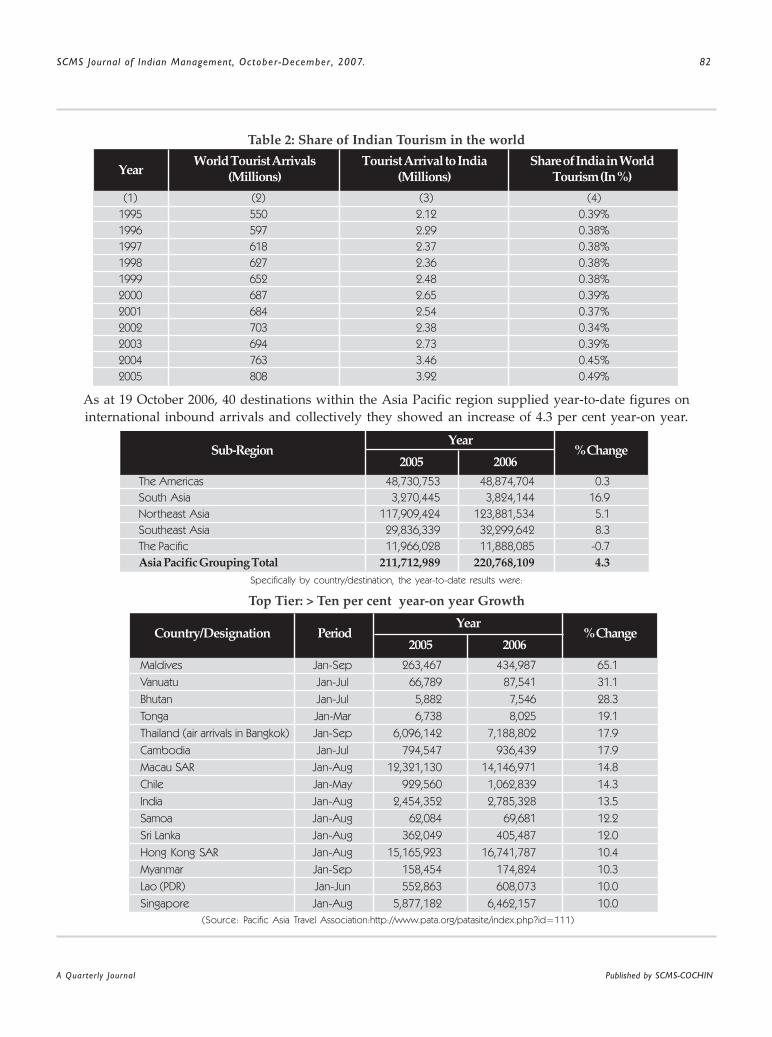
SCMS Journal of Indian Management, October-December , 2007. 82
A Quarterly Journal Published by SCMS-COCHIN
Table 2: Share of Indian Tourism in the world
As at 19 October 2006, 40 destinations within the Asia Pacific region supplied year-to-date figures on
international inbound arrivals and collectively they showed an increase of 4.3 per cent year-on year.
Top Tier: > Ten per cent year-on year Growth
World Tourist Arrivals(Millions)Year
Tourist Arrival to India(Millions)
Share of India in WorldTourism (In %)
(1) (2) (3) (4)
1995 550 2.12 0.39%
1996 597 2.29 0.38%
1997 618 2.37 0.38%
1998 627 2.36 0.38%
1999 652 2.48 0.38%
2000 687 2.65 0.39%
2001 684 2.54 0.37%
2002 703 2.38 0.34%
2003 694 2.73 0.39%
2004 763 3.46 0.45%
2005 808 3.92 0.49%
% Change
The Americas 48,730,753 48,874,704 0.3
South Asia 3,270,445 3,824,144 16.9
Northeast Asia 117,909,424 123,881,534 5.1
Southeast Asia 29,836,339 32,299,642 8.3
The Pacific 11,966,028 11,888,085 -0.7
Asia Pacific Grouping Total 211,712,989 220,768,109 4.3
20062005
YearSub-Region
% Change
Maldives Jan-Sep 263,467 434,987 65.1
Vanuatu Jan-Jul 66,789 87,541 31.1
Bhutan Jan-Jul 5,882 7,546 28.3
Tonga Jan-Mar 6,738 8,025 19.1
Thailand (air arrivals in Bangkok) Jan-Sep 6,096,142 7,188,802 17.9
Cambodia Jan-Jul 794,547 936,439 17.9
Macau SAR Jan-Aug 12,321,130 14,146,971 14.8
Chile Jan-May 929,560 1,062,839 14.3
India Jan-Aug 2,454,352 2,785,328 13.5
Samoa Jan-Aug 62,084 69,681 12.2
Sri Lanka Jan-Aug 362,049 405,487 12.0
Hong Kong SAR Jan-Aug 15,165,923 16,741,787 10.4
Myanmar Jan-Sep 158,454 174,824 10.3
Lao (PDR) Jan-Jun 552,863 608,073 10.0
Singapore Jan-Aug 5,877,182 6,462,157 10.0
20062005
YearCountry/Designation Period
(Source: Pacific Asia Travel Association:http://www.pata.org/patasite/index.php?id=111)
Specifically by country/destination, the year-to-date results were:

A Quarterly Journal Published by SCMS-COCHIN
SCMS Journal of Indian Management, October-December , 2007. 83
In 2005, global Travel and Tourism activity (Total Demand) grew by 5.7
per cent on top of 2004’s rebound of 6.9 per cent and for 2006 with
Total Demand growing 4.6 per cent. It seems like Travel and Tourism
is doing quite well considering the growing list of natural and man-
made disasters it has had to contend with over the past few years as
well as macroeconomic forces such as the increasing price of oil,
which is making all forms of travel more expensive.
Demand
Encompassing all components of Travel and Tourism consumption,
investment, government spending and exports is expected to grow
4.6 per cent (real terms) and total US$6.5 trillion in 2006. The ten-
year annualized growth (2007-2016) forecast is 4.2 per cent per
annum illustrating the outlook for strong long-term growth.
Visitor Exports
The continued strength of international tourism is expected to push
Visitor Exports to nearly US$900 billion in 2006 or real growth of
6.5 per cent..
GDP
Travel and Tourism’s contribution to the world economy is
illustrated by the direct industry impact of 3.6 per cent of the
total GDP.
Employment
The global Travel and Tourism industry is expected to produce
2.5 million new jobs in 2006 over its 2005 level to total 76.7
million jobs or 2.8 per cent of total world employment. The
broader perspective of the Travel and Tourism economy
(direct and indirect) is expected to create nearly 10 million
new jobs for the world economy for a total of 234.3 million
jobs dependent on Travel and Tourism or 8.7 per cent of
total employment.
India has the potential to become the number one tourist destination
in the world with the demand growing at 10.1 per cent per annum,
the World Travel and Tourism Council (WTTC) has predicted. China
spends more of its budget on tourism and rates fifth in receiving
the largest tourist arrivals (31.2 million) after France, U.S., Spain and
Italy. India gets only 2.6 million tourists on an average per annum.
The earlier setbacks in global tourism have strengthened the
Department of Tourism’s resolve to promote India’s tourism through
aggressive marketing strategies. The campaign under the banner of
‘Incredible India’ includes a wide ranging advertisement campaign
in all prime print publications besides a global television campaign
encompassing prominent English, French, German and Italian
channels and an innovative online campaign on the world’s most
popular websites. The ‘marketing mantra’ for the Department of
* 2006 real growth adjusted for inflation (%), ** 2007-2016 annualized real growth for inflation (%)
Personal Travel and Tourism 935.4 3.8 6.9 2,857.1 4.0 6.7
Business Travel 260.8 - 8.3 822.1 - 7.0
Government Expenditures 41.2 1.0 7.7 119.0 1.0 6.1
Capital Investment 681.5 7.2 8.3 2,314.2 7.5 7.8
Visitor Exports 302.2 3.3 10.9 1,031.3 1.3 7.8
Other Exports 121.5 1.3 14.6 984.6 1.3 17.6
Travel and Tourism Demand 2,342.7 - 8.4 8,128.2 - 8.0
T&T Industry GDP 713.8 2.1 7.2 1,881.9 1.7 5.1
T&T Economy GDP 1,827.6 5.3 7.8 5,542.3 5.0 6.6
T&T Industry Employment 10,679.6 2.4 0.8 10,591.8 2.0 -0.1
T&T Economy Employment 24,349.2 5.4 1.4 27, 015.8 5.1 1.0
INR(Billion)India
% of Tot2006
INR(Billion) Growth**
% of Tot2016Growth*
Source: WTTC (Adapted from http://www.indiainbusiness.nic.in/industry-infrastructure/service-sectors/tourism.htm)
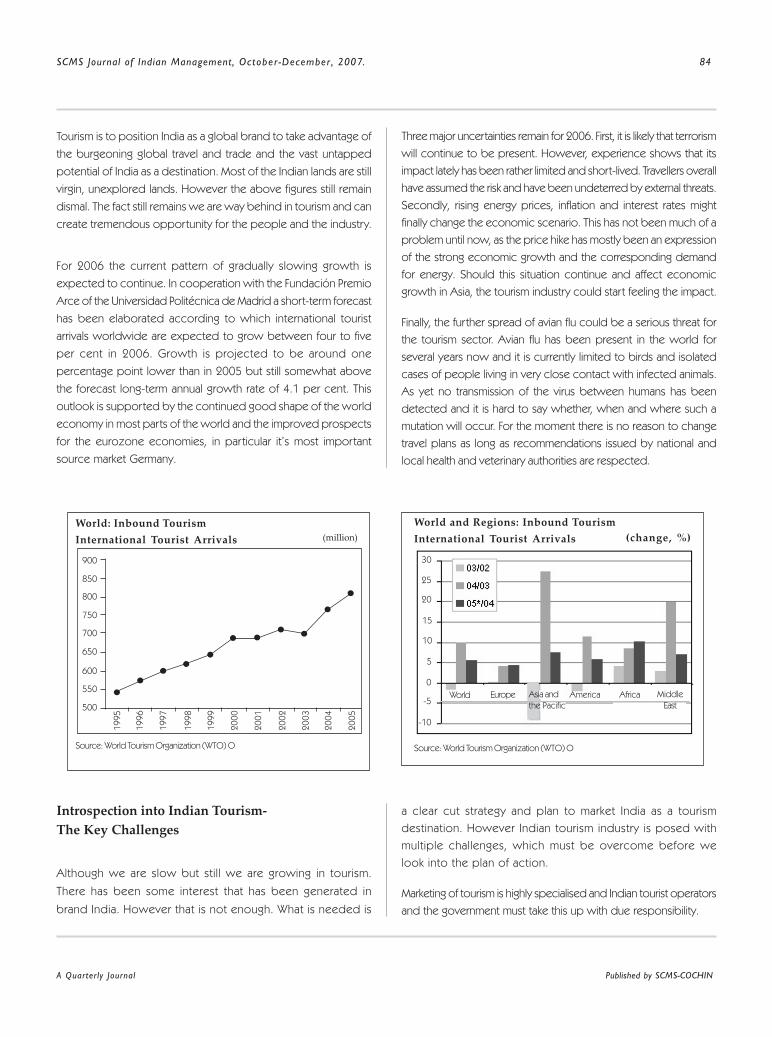
SCMS Journal of Indian Management, October-December , 2007. 84
A Quarterly Journal Published by SCMS-COCHIN
Tourism is to position India as a global brand to take advantage of
the burgeoning global travel and trade and the vast untapped
potential of India as a destination. Most of the Indian lands are still
virgin, unexplored lands. However the above figures still remain
dismal. The fact still remains we are way behind in tourism and can
create tremendous opportunity for the people and the industry.
For 2006 the current pattern of gradually slowing growth is
expected to continue. In cooperation with the Fundación Premio
Arce of the Universidad Politécnica de Madrid a short-term forecast
has been elaborated according to which international tourist
arrivals worldwide are expected to grow between four to five
per cent in 2006. Growth is projected to be around one
percentage point lower than in 2005 but still somewhat above
the forecast long-term annual growth rate of 4.1 per cent. This
outlook is supported by the continued good shape of the world
economy in most parts of the world and the improved prospects
for the eurozone economies, in particular it’s most important
source market Germany.
Three major uncertainties remain for 2006. First, it is likely that terrorism
will continue to be present. However, experience shows that its
impact lately has been rather limited and short-lived. Travellers overall
have assumed the risk and have been undeterred by external threats.
Secondly, rising energy prices, inflation and interest rates might
finally change the economic scenario. This has not been much of a
problem until now, as the price hike has mostly been an expression
of the strong economic growth and the corresponding demand
for energy. Should this situation continue and affect economic
growth in Asia, the tourism industry could start feeling the impact.
Finally, the further spread of avian flu could be a serious threat for
the tourism sector. Avian flu has been present in the world for
several years now and it is currently limited to birds and isolated
cases of people living in very close contact with infected animals.
As yet no transmission of the virus between humans has been
detected and it is hard to say whether, when and where such a
mutation will occur. For the moment there is no reason to change
travel plans as long as recommendations issued by national and
local health and veterinary authorities are respected.
Introspection into Indian Tourism-
The Key Challenges
Although we are slow but still we are growing in tourism.
There has been some interest that has been generated in
brand India. However that is not enough. What is needed is
a clear cut strategy and plan to market India as a tourism
destination. However Indian tourism industry is posed with
multiple challenges, which must be overcome before we
look into the plan of action.
Marketing of tourism is highly specialised and Indian tourist operators
and the government must take this up with due responsibility.
500
850
800
750
700
650
600
550
900
20
05
20
04
20
03
20
02
20
01
20
00
19
99
19
98
19
97
19
96
19
95
World: Inbound Tourism
International Tourist Arrivals (million)
Source: World Tourism Organization (WTO) O Source: World Tourism Organization (WTO) O
(change, %)
World and Regions: Inbound Tourism
International Tourist Arrivals
30
25
20
15
10
5
0
-5
-10
World Europe Africa Middle
East
AmericaAsia and
the Pacific
Africa
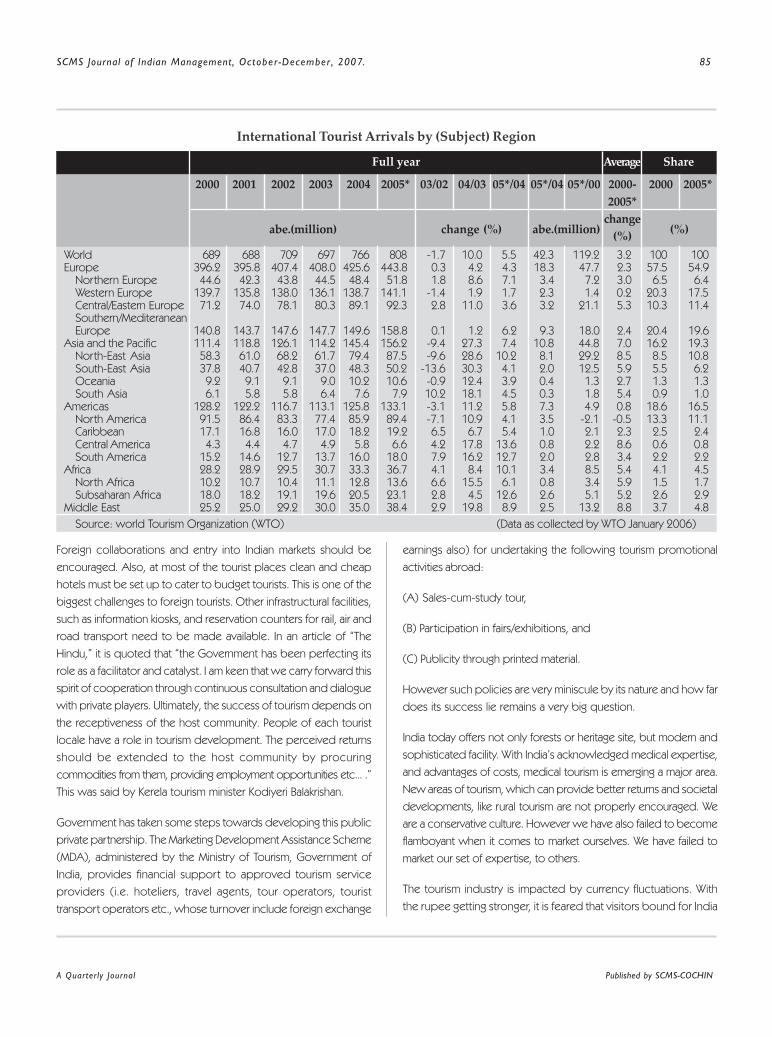
A Quarterly Journal Published by SCMS-COCHIN
SCMS Journal of Indian Management, October-December , 2007. 85
Foreign collaborations and entry into Indian markets should be
encouraged. Also, at most of the tourist places clean and cheap
hotels must be set up to cater to budget tourists. This is one of the
biggest challenges to foreign tourists. Other infrastructural facilities,
such as information kiosks, and reservation counters for rail, air and
road transport need to be made available. In an article of “The
Hindu,” it is quoted that “the Government has been perfecting its
role as a facilitator and catalyst. I am keen that we carry forward this
spirit of cooperation through continuous consultation and dialogue
with private players. Ultimately, the success of tourism depends on
the receptiveness of the host community. People of each tourist
locale have a role in tourism development. The perceived returns
should be extended to the host community by procuring
commodities from them, providing employment opportunities etc... .”
This was said by Kerela tourism minister Kodiyeri Balakrishan.
Government has taken some steps towards developing this public
private partnership. The Marketing Development Assistance Scheme
(MDA), administered by the Ministry of Tourism, Government of
India, provides financial support to approved tourism service
providers (i.e. hoteliers, travel agents, tour operators, tourist
transport operators etc., whose turnover include foreign exchange
International Tourist Arrivals by (Subject) Region
earnings also) for undertaking the following tourism promotional
activities abroad:
(A) Sales-cum-study tour,
(B) Participation in fairs/exhibitions, and
(C) Publicity through printed material.
However such policies are very miniscule by its nature and how far
does its success lie remains a very big question.
India today offers not only forests or heritage site, but modern and
sophisticated facility. With India’s acknowledged medical expertise,
and advantages of costs, medical tourism is emerging a major area.
New areas of tourism, which can provide better returns and societal
developments, like rural tourism are not properly encouraged. We
are a conservative culture. However we have also failed to become
flamboyant when it comes to market ourselves. We have failed to
market our set of expertise, to others.
The tourism industry is impacted by currency fluctuations. With
the rupee getting stronger, it is feared that visitors bound for India
Full year Average Share
2005*20002000-
2005*
change
(%)
05*/0005*/04
(%)abe.(million)
05*/0404/03
change (%)
03/022005*2004
abe.(million)
2003200220012000
World 689 688 709 697 766 808 -1.7 10.0 5.5 42.3 119.2 3.2 100 100Europe 396.2 395.8 407.4 408.0 425.6 443.8 0.3 4.2 4.3 18.3 47.7 2.3 57.5 54.9
Northern Europe 44.6 42.3 43.8 44.5 48.4 51.8 1.8 8.6 7.1 3.4 7.2 3.0 6.5 6.4Western Europe 139.7 135.8 138.0 136.1 138.7 141.1 -1.4 1.9 1.7 2.3 1.4 0.2 20.3 17.5Central/Eastern Europe 71.2 74.0 78.1 80.3 89.1 92.3 2.8 11.0 3.6 3.2 21.1 5.3 10.3 11.4Southern/MediteraneanEurope 140.8 143.7 147.6 147.7 149.6 158.8 0.1 1.2 6.2 9.3 18.0 2.4 20.4 19.6
Asia and the Pacific 111.4 118.8 126.1 114.2 145.4 156.2 -9.4 27.3 7.4 10.8 44.8 7.0 16.2 19.3North-East Asia 58.3 61.0 68.2 61.7 79.4 87.5 -9.6 28.6 10.2 8.1 29.2 8.5 8.5 10.8South-East Asia 37.8 40.7 42.8 37.0 48.3 50.2 -13.6 30.3 4.1 2.0 12.5 5.9 5.5 6.2Oceania 9.2 9.1 9.1 9.0 10.2 10.6 -0.9 12.4 3.9 0.4 1.3 2.7 1.3 1.3South Asia 6.1 5.8 5.8 6.4 7.6 7.9 10.2 18.1 4.5 0.3 1.8 5.4 0.9 1.0
Americas 128.2 122.2 116.7 113.1 125.8 133.1 -3.1 11.2 5.8 7.3 4.9 0.8 18.6 16.5North America 91.5 86.4 83.3 77.4 85.9 89.4 -7.1 10.9 4.1 3.5 -2.1 -0.5 13.3 11.1Caribbean 17.1 16.8 16.0 17.0 18.2 19.2 6.5 6.7 5.4 1.0 2.1 2.3 2.5 2.4Central America 4.3 4.4 4.7 4.9 5.8 6.6 4.2 17.8 13.6 0.8 2.2 8.6 0.6 0.8South America 15.2 14.6 12.7 13.7 16.0 18.0 7.9 16.2 12.7 2.0 2.8 3.4 2.2 2.2
Africa 28.2 28.9 29.5 30.7 33.3 36.7 4.1 8.4 10.1 3.4 8.5 5.4 4.1 4.5North Africa 10.2 10.7 10.4 11.1 12.8 13.6 6.6 15.5 6.1 0.8 3.4 5.9 1.5 1.7Subsaharan Africa 18.0 18.2 19.1 19.6 20.5 23.1 2.8 4.5 12.6 2.6 5.1 5.2 2.6 2.9
Middle East 25.2 25.0 29.2 30.0 35.0 38.4 2.9 19.8 8.9 2.5 13.2 8.8 3.7 4.8
Source: world Tourism Organization (WTO) (Data as collected by WTO January 2006)

SCMS Journal of Indian Management, October-December , 2007. 86
A Quarterly Journal Published by SCMS-COCHIN
would wait. The government will also have lesser pie of the US
dollars as taxes.
India has to do much to improve its tourism related infrastructure
aggressively. Good infrastructure not only will aid economic growth,
but also will aid growth in tourism. Offshore flights which are still a
highly reserved sector in the Indian aviation industry should be left
free. Faster coverage on land, facilities given to tourists will also
need to be dramatically improved, which probably is in its worst
stages today. Although India has progressed a lot, it is way behind
the developed, even the developing countries. The development
depends upon an integrated infrastructure of national and
international highways, rai lways, por ts, civi l aviation,
telecommunication, hotel accommodation and allied services.
As per a report of the United Nations on HRD requirements of the
tourism sector in India, there are about 121 airports maintained by
the Airport Authority of India and about 139 airports are maintained
by state governments and other agencies, but only ten airports
have runway lengths, over 10,000 feet. This includes the five
international airports, although none have the latest Instrument
Landing Systems (ILS) and other equipment to facilitate safe and
secure landing in all weather conditions. The quality of maintenance
and management of services at the airports also needs much
improvement. A survey of 2,126 tourists showed that only
24.8 per cent of them found the airport facilities very good, 45 per cent
considered them average and 30 per cent found them poor.
International air seat capacity for India is about 5.3 million, which is
just enough to cover the current level of passenger traffic. A number
of tourist-generating countries do not have direct connections to
India by air. International air seat capacity would have to be increased
by at least two million in order to receive 3.2 million tourists by
2000. In the event that the target is five million tourists, an additional
increase in air seat capacity by five million would require. The distance
to India from the Americas and Europe is considered as a long
haul, and this discourages tourists from these areas. The lack of air
seat capacity further compounds the problem and blocks the
increase in international tourists. While there is some expression of
interest in an opensky policy, it has yet to happen in practice.
Foreign airlines still do not have free access to India.
Another serious impediment to tourism in India is the scarcity and
high cost of hotel accommodation. In 1997, the number of
approved hotel rooms available was about 64,500 and about
36,000 rooms were under construction. Demand by 2000 is
estimated to be 125,000 rooms, but there will be a shortfall of
27,000 hotel rooms. A report in The Hindustan Times on 10th June
writes that “The Federation of Hotel and Restaurant Associations of
India estimates that there are at present 97,000 hotel rooms in the
country. It says if foreign-tourist arrival grows at eight to ten per cent
over the next three years, India will need 30,000 additional rooms
in various categories.
The Planning Commission estimates that India will need 1.6 lakh
rooms more to accommodate the projected 58 lakh tourists by
2010, and three lakh rooms by 2020 to meet the projected tourist
arrivals of 89 lakh.
The current growth of hotel rooms is less than 2,000 rooms a year,
forcing hoteliers to double room tariffs in the past two years. Also
owing to high land prices, there are more five-star hotels than
budget hotels, making India a high-cost destination. Tarun Thakral,
chief operating officer of Delhi-based Le Meridien hotel, says the
land for hotel construction should be given on long-term lease as
in countries like China and Malaysia.”
The lack of accommodation during the tourist season is cited as a
reason why tourists do not choose India as a holiday destination.
There is also a dire requirement of the government to look into the
tax aspects of the hotel industry: high tax structures, burden on
forex,and little choice to the hoteliers. Moreover double rates for
room and discriminatory pricing for foreigners leave them to be
treated with differentiation. Another thing that bugs me no end is
the differential pricing scheme that they have for entry into tourist
places in India. Atanu Dey (http://www.deeshaa.org/2004/12/
13/) speaks on the issues of differential pricing. At the Golconda
Fort, an Indian is charged Rs.5 (about $0.10) as entry fee but for
foreigners it is Rs.100 (about $2.) It makes you wonder. Are the
people who make up these schemes stupid or are they zenophobic
or are they racist or all of the above? Surely, ripping foreigners off
cannot amount to welcoming them. Besides, how do they enforce
this sort of blatant discrimination? Technically I am a foreigner
because I don’t have an Indian passport anymore. So unless they
ask people to produce passports, the only way for them to suspect
that one is a foreigner is by the colour of their skin. Basically it boils
down to this: if you don’t look Indian, you are required to pony up
20 times what an Indian-looking person would pay to have the
same privilege.
It is morally repugnant to discriminate against people, even if the
discrimination is against those who are presumed rich. Not just

A Quarterly Journal Published by SCMS-COCHIN
SCMS Journal of Indian Management, October-December , 2007. 87
that, it is commercially short-sighted because people notice this
sort of blatant double-standards and it affects the overall tourist
traffic into the country.
Taxes — like luxury, service and transport tax — which total about
25 per cent do not help either. On one hand we say “Athithi Devo
Bhava” on the other hand such practices would subdue the essence
of the culture from which we originate.
Granting visa-on-arrival to the foreign tourists at the airports can
cer tainly give a boost to the foreign tourist arrivals in the
country. Visa-on-arrival for tourists from friendly countries,
countries which do not pose a security threat to our country
and is tourism generating markets. While countries like Malaysia,
Thailand, and Sri Lanka have initiated visa-on-arrival scheme, a foreign
tourist to India has to wait for a month to get an Indian visa. “If we
do not implement a similar scheme foreign tourists with a South
Asia itinerary will skip India,” says Subash Goyal, president of the
Indian Association of Tour Operators (The Hindustan Times).
Safety and security of the foreign tourists is a cause of great
concern. There is a dire need of setting up a special force
specifically for the tourists visiting the country. Deployment of
Special Tourism Police Force can be an effective tool for ensuring
safety and security of the tourists.
Areas like Lakshadweep and Andaman and Nicobar Islands have
not been explored. Although it can generate huge foreign
tourism traffics but still government permit required to visit these
places have acted as a bottleneck. A study by Rajavel (1998)
repor ts var ious problems which are deter rents in the
expansion of tour ism in the is lands, l i ke, most of the
accommodations do not have proper catering facility, and
some guest houses have canteen faci l i t ies but charge
exorbitant prices for the meals. This problem is more acute in
inter islands. There is a lack of accommodation in other islands.
Most of lodges do not have laundry, protected drinking water,
proper ventilation, lavatories, mosquito net and these lodges
are in an unhygenic condition. Summers witness low rainfall
and thus water scarcity. There are also parking problems, and
narrow roads. There are also issues relating to environmental
degradation. (From Sunita Reddy-Mega tourism in Andaman
and Nicobar islands-Some concerns).
The action taken by the states is very poor. Poor website
content, details regarding the individual states act as a barrier. If
everything is left to the central government with no initiative
from the respective state governments, the whole exercise is of
waste. It seems only governments of Kerala and Rajasthan are
interested in developing their tourism markets.
Two major challenges of India as a tourism destination is the lack
of basic education amongst the people to handle tourists.
Unnecessary harassment of Indian as well as foreign tourists
leaves many of them with bad tastes, especially religious places.
Cab drivers, rickshaw pullers, or the sales guy from the travels
acts very roughly and does not have the basic consideration for
the tourists. There is also no live forum where the tourists can
discuss their travel information required on India. Atanu Dey
(http://www.deeshaa.org/2004/12/13/) speaks on the issues of
cleanliness at some of our heritage sites. It says something about
the culture of the people and I am ashamed of the Indian
acceptance of filth and squalor. I assume that at least some Indian
tourists are put off by the filth and I suppose most foreign tourists
find it unappealing as well, which would explain at least in part that
India gets about three million tourists a year while neighbouring
China gets about 60 million tourists.
The hotel and catering sector is now highly personalized.
Customer satisfaction is the prerequisite for a smooth and
successful operat ion in the hotel industry, requir ing
professionally trained and highly skilled personnel. According
to estimates of requirements for additional hotel rooms, the
number of personnel who will need formal training in the
hospitality and catering sector would increase by about 400 a
year, from 16,000 to 20,000 people a year by 2010. The existing
training facilities currently produce only about 5,000 to 6,000
trained personnel a year.
Although we have progressed a lot, we are still way behind the
developing countries. The development depends upon an
integrated infrastructure of national and international highways,
railways, por ts, civi l aviation, telecommunication, hotel
accommodation and allied services.
Inadequacies of such infrastructural facilities have adversely
affected our tourism industry. The sluggish growth arises from
India’s inability to sell effectively its rich tourist potential.
India should market itself as a value added destination stressing its
variety and cost effectiveness. Satisfaction of the tourist, thereby
ensuring repeat visits should be the top priority of the tourist
industry. Apart from infrastructural development, the industry
requires an environment of peace and stability where the tourist is
sure of his safety and security.

SCMS Journal of Indian Management, October-December , 2007. 88
A Quarterly Journal Published by SCMS-COCHIN
Building the Brand “INDIA”-
The Road Ahead
Every tourist destination in the world has a “brand image.” The
brand should be able to differentiate a destination from competing
destinations. However some destinations do not have a brand
strategy, and are supported by inconsistent advertising campaigns,
creating a confused image to prospective customers. Image must
be controlled by a clear projection of brand identity.
When consumers decide on a destination for a holiday or a
business conference, several “brands” compete for their
attention. A strong brand is differentiated from others, has several
strong advantages when compared to others, and has an
attractive appeal to consumers. In tourism, while factors such as
cost of travel, convenience, and quality of facilities are important,
the strongest motivator is “image.” Image puts a destination on
the consumer ’s “shopping list” and creates an emotional appeal,
which enhances that destination’s chances of being chosen
over others. Every country has been able to create an image
with lot of difference. China’s dominant image and attraction
was “culture.” Malaysia was seen as “multicultural with many
beaches.” Thailand had a brand image of “exotic, fun, and friendly
people.”
Promotion campaigns affect the image as of a country as a tourist
destination. If that image is unfocused or not clear, the destination
will have difficulty competing with images created by competing
countries. Advertising, PR and promotion must complement
informal information obtained through word of mouth and
personal recommendations, by either building upon the latter
or correcting negative perceptions that may be incorrect.
Developing a strong image for any brand requires a carefully
planned brand strategy based on:
1. A unique brand personality,
2. Correct positioning strategies,
3. Product development, and
4. Adver tising and promotional activities.
The basic consumer needs must be understood. The
success will only come across when consumers have a
strong and favourable image about destination India and
the consumers be l ieve tha t i t i s d i f fe ren t f rom the
competing destinations.
Natural and Physical Environment Protection
If the Indian tourism industry is to attract and retain capital, the
country must first pass this first test of physical environment and
natural environment. The need to have a strong infrastructure is very
basic need to get the fundamental structure in place. Destroying of
the natural heritage, flora and fauna, has caused a very poor image
amongst visitors.
The Need for more Hotels and
Better Infrastructure
The infrastructure has always put us to shame specially safety, water,
sanitation, roads, railways and airports, bus and railways. These are
the major reasons why a tourist would not like to visit India. Planning
months in advance also creates problem. Facilities are not provided
to meet the travellers’ needs. Hotels to suit all pockets, and products
to satisfy all kinds of travellers should be available.
Focus on Customers, Products and Promotion
Customers – The challenge is to target new and emerging markets
that can be targeted.
There are many other niche markets that could be offered, like
medical tourism, adventure tourism, festival tourism, ecotourism,
MICE, culinary tourism and rural tourism.
Promotion–The usage of the internet is at least in the Indian tourism
industry. A simple experiment would do. Visit the site of Singapore
tourism or Srilanka tourism board and compare it with the kind of
Information that our web sites contain. We should have the right
prices, words, images, movies, and sounds to put into both digital
and traditional channels so that individual customers can assemble
their experiences on line in real time.
Products- There is a split in the tourists: people who want to enjoy
new experiences and who spend a lot on tourism, and tourists who
have a relatively small budget but who still want to travel. The tourist
industry will accordingly have to develop target group specific
packages for both groups, to a greater extent than it now does.
Promoting Tourism starts from us
The practice of sound tourism starts from the people within India.
The product needs to be promoted amongst the local people and
it would generate the word of mouth that is necessary. It is also
very essential that we as citizens believe in the product first, before
we promote it to others.
A Quarterly Journal Published by SCMS-COCHIN
SCMS Journal of Indian Management, October-December , 2007. 89
We are too slow in our Tourism Policy-
The Need of Good Planning
The first ever Tourism Policy was announced by the Government of
India in November 1982. It took ten long years for the Government
to feel the need to come up with a possible improvement over
this. Thus the National Action Plan for Tourism was announced in
May 1992. Between these two policy statements, various legislative
and executive measures were brought about. It took ten years to
make most of the States to fall in line and accord the same status
within their legislative framework. This shows nothing but apathy.
We have failed in planning and in the unnecessary delays caused
due to multiple reasons.
(In) Security, Risks and Crisis in Tourism
A safe country with little or no political economic and social risk is always
more preferred. Conflicts within India, international terrorism, new diseases
and epidemics and the increasing number of natural disasters and extreme
weather conditions have resulted in a current increase in attention to the
need for security has hampered the tourism structure of the country. It is
reasonable to assume that new security risks and crises will take on a
new scale, because of the growing shift in wars from the state level to,
for example, ethnic and religious armed conflict.
Tourism is one of the industries particularly affected by climate
change and natural disasters, specifically because these ultimately
lead to a change at different levels in the pattern of “most favoured”
and “least favoured” tourist areas.
We must realign ourselves in the branding exercise that we do.
Some of the steps enlisted here to the branding Indian tourism
exercise would be helpful. They are:
♦ Tourism is a revenue-generating industry, non-polluting and
investing money in developing it is quite necessary.
♦ Segment, targeting and positioning brand “India” to
distinguish and to stand out from the competition. It is
also essential to have a strong image with the brand.
♦ Study your customer; develop focused communication
channels for reaching them.
♦ Building customer loyalty is important. Like any other
service industry, repeat visitors and positive word of mouth
is very essential.
♦ Educate the people. Treating visitors with respect and
hard selling to tourists should be avoided. We require
getting it right.
♦ Faster actions by the central and state governments shall
be initiated.
Conclusion
The need for a successful brand of the country can only be built if
there is sustained effort from the people and the government. It is
very essential to understand that the success will depend upon the
participation of the state, central and the local governments. The
belief in the Indian destinations has to be increased amongst the
citizens. The challenge is marketing to our people because we
have not done that job to the very best. The dynamics of global
tourism and the increasing demands from tourists also require
realignment of our products. Flexibility in our policies, faster actions,
better infrastructure, are essential for the Indian tourism industry.
Bibliography
“Buhalis. D-Limits of Tourism Development in Peripheral Destinations:
Problems and Challenges: Tourism Management.”
“Department Related Parliamentary Standing Committee on Transport,
Tourism and Culture Sixtieth Report on Development of
Tourism in the Country.”
“India Figures: Tourism Satell ite Account for India (TSA).”
“Indian tourism-Unlocking the strategic opportunity- Ian Graham.”
“Marketing of Tourism Services in India- A Study with Special
Reference to Orissa-Prafulla Chandra Mohanty.”
“Matheison, A. and G.Wall: Tourism – Economic, Physical and Social
Impacts. Longman, London.”
“Pacific Asia Travel Association.”
“Sunita Reddy-Mega tourism in Andaman and Nicobar Islands-Some
concerns.”
“The Branding of Tourism Destinations-Past Achievements and Future
Challenges- JR Brent Ritchie and Robin JB Ritchie.”
“World Figures: World Tourism and Travel Council (WTTC).”
<http://www.world-tourism.org/>.
<http://www.wttc.org/
<h t t p : / / w w w . i n d i a i n b u s i n e s s . n i c . i n / i n d u s t r y -
in f ras t ructure/serv ice-sectors / tour i sm.htm>.
<http://www.unescap.org/ttdw/Publications/TPTS_pubs>.

SCMS Journal of Indian Management, October-December , 2007. 90
A Quarterly Journal Published by SCMS-COCHIN
T
The s tudy has made a compara t i ve ana l y s i s o f d i f fe ren t t ypes o f worke r s such as
cu l t i va to r s , ag r icu l tu ra l l aboure r s , worke r s i n househo ld indus t r y and o the r worke r s
ba sed on Censu s o f I nd i a 2001 . The s t a t e s t h a t h a ve h i gh and low r an k s w i t h
r e spec t t o t he d i f f e r en t c a t ego r i e s o f wo r ke r s we re compa red w i t h Ke r a l a . A
w o r k e r s ’ i n d e x h a s a l s o b e e n d e v e l o p e d f o r a n e f f e c t i v e c o m p a r i s o n o f
d i s t r i b u t i o n a n d c o n c e n t r a t i o n o f w o r k e r s o f s t a t e s i n I n d i a . T h e s t u d y g i v e s
some i nd ica t ion abou t t he chang i ng deve lopmen t equa t ion o f t he s t a te , Ke r a l a
i . e . a sh i f t f rom a p roduc t ion -o r i en t a ted soc ie t y to consumer -o r i en ted one .
-
Work-Force Indexation:
Kerala SceneRajagopal N. and Poornima Narayan R.
he total population can be categorized into workers1 and
non-workers2. According to 2001 Census 39.10 per cent
of the population are
‘workers’ and 60.90 per cent
are ‘non-workers.’ All the main
workers3 and the marginal
workers4 have been classified
under one or other of the four
main categories of economic
activity during 1981, 1991 and
2001 Census. They are
cult ivators, agr icul tura l
labourers, workers in
household industry and other
workers. A person is classified
as a ‘cultivator ’ if he or she is
engaged in cultivation of land
owned or held from
government or held from
Dr.Rajagopal N., Associate Professor - Economics, SCMS School
of Technology and Management, Prathap Nagar, Muttom, Aluva-
683 106, Ernakulam, Email: [email protected]
Dr.Poornima Narayan R ., Asstistant Professor - Economics, SCMS
School of Technology and Management, Prathap Nagar, Muttom,
Aluva-683 106, Ernakulam, Email: [email protected]
private persons or institutions for payment in money, kind or
share. ‘Agricultural labourers’ are those persons who work on
other person’s land for wages
in money or kind or share. A
‘household industry’ is defined
as an industry conducted by
one or more members of the
household at home or within
the village in rural areas and only
within the precincts of the
house where the household
lives in urban areas. A majority
of workers in the household
industry should consist of
members of the household. It
should be smaller in scale than
a registered factory and should
be engaged in manufacturing,
p r o c e s s i n g , s e r v i c i n g o r

A Quarterly Journal Published by SCMS-COCHIN
SCMS Journal of Indian Management, October-December , 2007. 91
repairing or making and selling of articles or goods. Mere selling of
goods or articles is not considered as household industry. All
workers who have been engaged in some economic activity during
the last one-year, but are not cultivators or agricultural labourers or
in household industry are ‘other workers.’ All government servants,
municipal employees, teachers, factory workers, plantation workers,
those engaged in trade, commerce, business, transport, banking,
mining, construction, political or social work, priests, entertainment
artists etc. will come under the category of other workers.
A comparison of the Census data of 1991 and 2001 shows that,
when the total population increased by 21.20 per cent (from 837
million to 1,015 million), the number of workers increased by 27.20
per cent (from 314 million to 399 million). Corresponding increase
in the total male population was 20.80 per cent and that of the male
workers was 21.80 per cent. The most interesting finding when the
comparison is made is that, when the total female population
increased by 21.70 per cent between 1991 and 2001, the
percentage increase in the female workers was 40.60 per cent. The
shift in the labour distribution pattern – from the agricultural sector
to the non-agricultural sector is quite evident from the above
comparison. Of the four categories mentioned above, the
‘agricultural labourers’ category and the ‘cultivators’ category are
directly linked with the agricultural sector. When the Census data
for 1991 and 2001 are compared, one can observe that the share
of workers in the agricultural sector decreased from about 67.00
per cent (39.71 per cent ‘cultivators’ and 27.34 per cent agricultural
labourers) in 1991 to about 58.0 per cent (31.7 per cent cultivators
and 26.5 agricultural labourers) in 2001. One striking feature is in the
case of ‘cultivators’ - there is a decline in male workforce by 7.00
per cent. Out of the 85 million accretions in the total workforce the
largest contribution of 63.00 per cent is from the category of ‘other
workers’ followed by an addition of 25 per cent from the category
of ‘agricultural labourers,’ 10.12 per cent from workers in the
household industry and 1.7 per cent from the ‘cultivators’ side
(Chart 1).
Over 10 years there has been significant improvement in the female
workforce. In 1991, 22.30 per cent of the total female population
was working, whereas in 2001 the corresponding figure is 25.60
per cent. However there is not much of a change in the male
workforce (Chart 2).
This study is conducted in two sections. The first phase compares
the actual distribution of different categories of workers—All India,
Kerala and Tamil Nadu. The pattern of distribution of workers among
the states in India and the comparative position of Kerala are
considered. The selection of Tamil Nadu is considered for
comparison, because its contribution of ‘workers’ to the total
‘workers’ of India is ahead (6.93%) the neighbouring state
of Karnataka (5.85 per cent). In the second phase of this
study, a ‘workers’ index’ is computed to find out the position
of different states according to the workers’ categories.
Results and Discussions
Section I
According to the 2001 Census, the total number of workers in
India is 402,234,724, of which 68.37 per cent are males and 31.63
per cent are females. Among the total workers, the contribution of
‘other workers’ tops with 37.60 per cent, followed by cultivators
(31.70 per cent), agricultural workers (26.50 per cent) and
household industry workers (4.20 per cent). Females dominate in
all the categories of workers except in ‘other workers’ category. In
the ‘other workers’ category there are 44.90 per cent male workers
as against 21.7 per cent of females (Table 1).
Uttar Pradesh shares 13.42 per cent of the total workers in India,
and remains at the top (Table 2). Sikkim has the lowest contribution
of 0.07 per cent. The share of workers in Kerala is only 2.56
per cent of India’s total labour force and that of nearby Tamil Nadu
(6.93 per cent). The position of Kerala is 12th among the states in
this regard.
Uttar Pradesh has also got the highest share of cultivators in India
(17.41 per cent). Males dominate with 20.46 per cent of the total
male cultivators in India. On the other hand, Goa has the lowest
share of cultivators (0.04 per cent). Kerala’s share of total cultivators
is less than 0.57 per cent. Unlike the general trend, the share of
male cultivators is higher than the female cultivators in Kerala. Tamil
Nadu contributes 4.02 per cent (Table 3).
Andhra Pradesh has the largest share of agricultural workers in
India and Sikkim the lowest (12.95 per cent and 8.09 per cent of
the total agricultural workers respectively). The corresponding
figure is 1.58 per cent for Kerala. It is interesting to note that
contradictory to the all India picture, in Kerala male workers
dominate in the agr icultural sector. Tami l Nadu shares
8.09 per cent of the total agricultural workforce in India. Females
outnumbered males in both Andhra Pradesh and Tamil Nadu.
However, in this regard the share of male and female is 50:50 in
Sikkim (Table 4).

SCMS Journal of Indian Management, October-December , 2007. 92
A Quarterly Journal Published by SCMS-COCHIN
Table 1: Distribution of Workers in India
Table 2: Distribution of Total Workers
Table 3: Distribution of Cultivators
Persons 402,234,724 127,312,851 31.70 106,775,330 26.50 16,956,942 4.20 151,189,601 37.60
Male 275,014,476 85,426,498 31.10 57,329,100 20.80 8,744,183 3.20 123,524,695 44.90
Female 127,220,248 41,896,353 32.90 49,446,230 38.90 8,212,759 6.50 27,664,906 21.70
%Other
Workers%HouseholdIndustryWorkers
%Agriculture
Workers%CultivatorsTotal
WorkersCategory
Source: Calculated from the Censes. Note: Percentages are the share of each category of workers in the total workers in India.
Source: Same as table 1. Note: Percentage represents the share of each category of workers in the total of the respective category of workers in India
%TamilNadu%Sikkim%
UttarPradesh%KeralaCategory
Persons 10,283,887 2.56 53,983,824 13.42 263,043 .07 27,878,282 6.93
Male 7,765,645 2.82 40,981,558 14.90 165,716 .06 18,100,397 6.58
Female 2,518,242 1.98 13,002,266 10.22 97,327 .08 9,777,885 7.69
Source: Same as table 1. Note: Percentage represents the share of each category of workers in the total of the respective category of workers in India
%TamilNadu%Sikkim%
UttarPradesh
%Category
Persons 724,155 0.57 22,167,562 17.41 50,395 0.04 5,116,039 4.02
Male 602,038 0.70 17,479,887 20.46 25,708 0.03 3,262,489 3.82
Female 122,117 0.29 4,687,675 11.19 24,687 0.06 1,853,550 4.42
Kerala
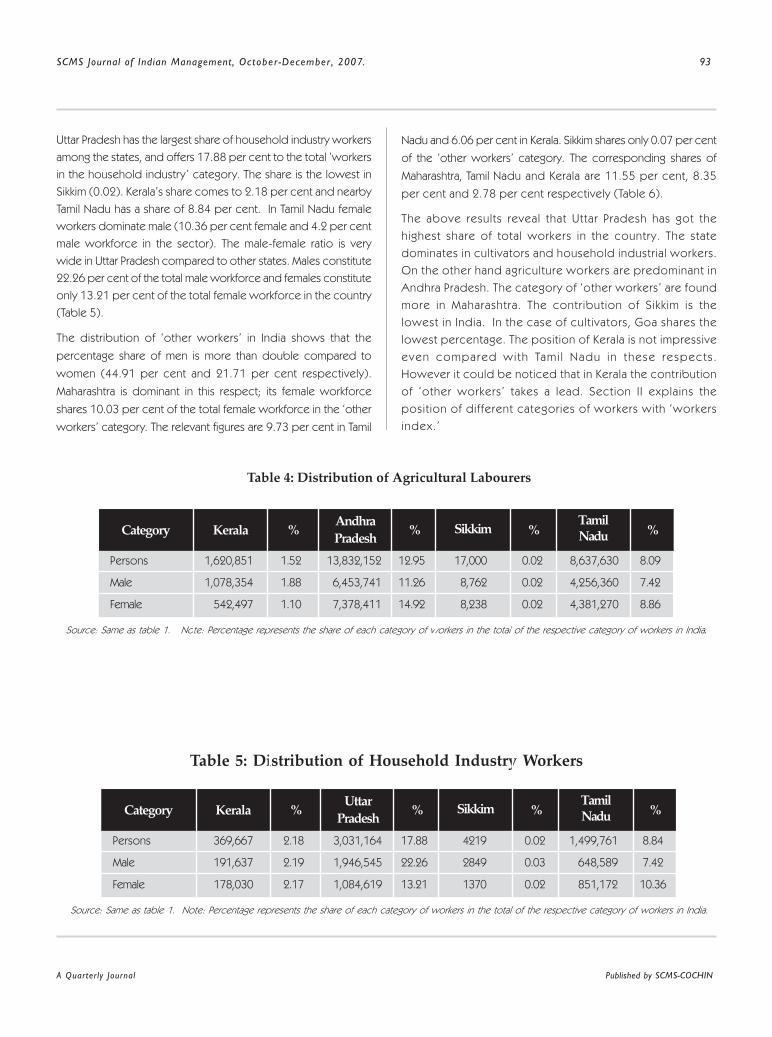
A Quarterly Journal Published by SCMS-COCHIN
SCMS Journal of Indian Management, October-December , 2007. 93
Uttar Pradesh has the largest share of household industry workers
among the states, and offers 17.88 per cent to the total ‘workers
in the household industry’ category. The share is the lowest in
Sikkim (0.02). Kerala’s share comes to 2.18 per cent and nearby
Tamil Nadu has a share of 8.84 per cent. In Tamil Nadu female
workers dominate male (10.36 per cent female and 4.2 per cent
male workforce in the sector). The male-female ratio is very
wide in Uttar Pradesh compared to other states. Males constitute
22.26 per cent of the total male workforce and females constitute
only 13.21 per cent of the total female workforce in the country
(Table 5).
The distribution of ‘other workers’ in India shows that the
percentage share of men is more than double compared to
women (44.91 per cent and 21.71 per cent respectively).
Maharashtra is dominant in this respect; its female workforce
shares 10.03 per cent of the total female workforce in the ‘other
workers’ category. The relevant figures are 9.73 per cent in Tamil
Nadu and 6.06 per cent in Kerala. Sikkim shares only 0.07 per cent
of the ‘other workers’ category. The corresponding shares of
Maharashtra, Tamil Nadu and Kerala are 11.55 per cent, 8.35
per cent and 2.78 per cent respectively (Table 6).
The above results reveal that Uttar Pradesh has got the
highest share of total workers in the country. The state
dominates in cultivators and household industrial workers.
On the other hand agriculture workers are predominant in
Andhra Pradesh. The category of ‘other workers’ are found
more in Maharashtra. The contr ibution of Sikkim is the
lowest in India. In the case of cult ivators, Goa shares the
lowest percentage. The position of Kerala is not impressive
even compared wi th Tami l Nadu in these respects .
However it could be noticed that in Kerala the contribution
of ‘other workers’ takes a lead. Section I I explains the
posit ion of different categories of workers with ‘workers
index.’
Table 4: Distribution of Agricultural Labourers
Table 5: Distribution of Household Industry Workers
Source: Same as table 1. Note: Percentage represents the share of each category of workers in the total of the respective category of workers in India.
%TamilNadu%Sikkim%
AndhraPradesh
%Category
Persons 1,620,851 1.52 13,832,152 12.95 17,000 0.02 8,637,630 8.09
Male 1,078,354 1.88 6,453,741 11.26 8,762 0.02 4,256,360 7.42
Female 542,497 1.10 7,378,411 14.92 8,238 0.02 4,381,270 8.86
Kerala
Source: Same as table 1. Note: Percentage represents the share of each category of workers in the total of the respective category of workers in India.
%TamilNadu%Sikkim%
UttarPradesh
%Category
Persons 369,667 2.18 3,031,164 17.88 4219 0.02 1,499,761 8.84
Male 191,637 2.19 1,946,545 22.26 2849 0.03 648,589 7.42
Female 178,030 2.17 1,084,619 13.21 1370 0.02 851,172 10.36
Kerala

SCMS Journal of Indian Management, October-December , 2007. 94
A Quarterly Journal Published by SCMS-COCHIN
Table 6: Distribution of Other Workers
Section II
Workers Index
A workers’ index has been developed for a useful comparison of
distribution and concentration of workers. For calculating workers’
index for the 28 states5, an intra-category comparison of the four
categories of workers is made. This will help in positioning the
different states according to their worker distribution and thereby
locating the position of Kerala.
The study follows a mechanism to calculate index value (Iyengar et
al, 1982) for total workers for the different states of India and
compare the position of Kerala with the rest of India.
Let Xid represent the value of the ith worker category in the dth state
(i=1, 2, 3……….m: d=1, 2, 3…………, n)
Xid-Min (Xid)
Index Value (Xid) = —————————
(Max (Xid)-Min (Xid)
Where Min (Xid) and Max (Xid) are, respectively, the minimum and
maximum (Xi1, Xi2, ……Xin). The composite index is the simple
average of all the indices. The states are ranked in descending
order based on the indices calculated. Uttar Pradesh gets the highest
rank and Sikkim the lowest.
The workers’ index shows that the state of Uttar Pradesh ranks first
(Tables 7 and 8). However, the state is second in the case of ‘other
workers’ and third in the case of ‘household industrial workers.’
On the other hand, Sikkim, which has the lowest workers’ index,
holds the lowest position for all categories except cultivators. In
the case of cultivators Goa holds the lowest position. Kerala holds
the 12th position in the calculated index. Here the status of ‘other
workers’ is comparatively favourable compared to other
categories. The state holds 8th position in the case of ‘other
workers.’ The ranks in the categories of ‘household industries’
and ‘agricultural labourers’ are 13 and 14 respectively. The state
fares badly with 20th rank for ‘cultivators.’ The position of the
neighbouring state of Tamil Nadu is much better compared to
Kerala. The state ranks 5th in the workers’ index for the states.
Except for the ‘cultivators’ category, the state’s position falls on
or below 5th (5th position for agricultural labourers and 4th position
for household industries and other workers). In the case of
cultivators the state ranks ten. The index value shows that the
position of Kerala is far below than Tamil Nadu in all the cases.
Table 9 compares the index value of Kerala with the lowest and
highest ranked states.
The scatter diagram clearly shows the distribution of the various
states according to the workers’ index. The performances of the
states of Sikkim, Mizoram, Manipur, Arunachal Pradesh, Nagaland,
Tripura, Meghalaya and Goa are comparatively low. The mediocre
position of Kerala is also plotted clearly in Chart 3.
Distribution of Workers in Kerala
The share of Kerala’s total workers (both male and female) in India
is marginal at 2.56 per cent. This itself could be interpreted as the
major reason for Kerala’s economic backwardness. The share of
cultivators, agricultural labourers and household industry workers
are low compared to other states. The distribution of the workforce
among the four categories in Kerala reveals that ‘other workers’
emerge as the major segment, 62.00 per cent (Chart 4). Agricultural
workers contribute 23.00 per cent and cultivators 10.00 per cent.
The household industrial workers share only a marginal 5.00 per cent.
Source: Same as table 1. Note: Percentage represents the share of each category of workers in the total of the respective category of workers in India.
%TamilNadu%Sikkim%Maharashtra%Category
Persons 4,199,374 2.78 17,455,496 11.55 110,566 0.07 12,624,852 8.35
Male 5,893,616 2.19 14,680,504 6.48 26,568 0.10 9,932,959 7.42
Female 1,675,598 6.06 2,774,992 10.03 83,998 0.03 2,691,893 9.73
Kerala

A Quarterly Journal Published by SCMS-COCHIN
SCMS Journal of Indian Management, October-December , 2007. 95
Table 7: Workers’ Index
Jammu & Kashmir 0.069680 0.016606 0.076068 0.090565 0.063230
Himachal Pradesh 0.086108 0.005586 0.015957 0.044989 0.038160
Punjab 0.091091 0.106612 0.108872 0.295660 0.150559
Uttaranchal 0.068712 0.017566 0.022541 0.064643 0.043365
Haryana 0.134177 0.091336 0.069554 0.216508 0.127894
Rajasthan 0.591833 0.181447 0.222591 0.421697 0.354392
Uttar Pradesh 1.000000 0.968785 1.000000 0.880581 0.962342
Bihar 0.368186 0.970003 0.362149 0.297047 0.499346
Sikkim 0.003656 0.000000 0.000000 0.000000 0.000914
Arunachal Pradesh 0.010350 0.000133 0.000603 0.003929 0.003754
Nagaland 0.022537 0.001007 0.005832 0.007818 0.009298
Manipur 0.014889 0.006994 0.030625 0.014090 0.016650
Mizoram 0.009311 0.000708 0.000952 0.003827 0.003700
Tripura 0.011887 0.018757 0.010265 0.024461 0.016343
Meghalaya 0.018837 0.011197 0.005618 0.011511 0.011791
Assam 0.166404 0.090229 0.112553 0.235735 0.151230
West Bengal 0.253356 0.531732 0.716184 0.817655 0.579732
Jharkhand 0.173581 0.205159 0.140982 0.162970 0.170673
Orissa 0.189774 0.360626 0.230379 0.243160 0.255985
Chhattisgarh 0.192644 0.222535 0.064247 0.113470 0.148224
Madhya Pradesh 0.496787 0.534462 0.339978 0.358091 0.432329
Gujarat 0.260082 0.372392 0.140559 0.562178 0.333803
Maharashtra 0.531844 0.781625 0.358480 1.000000 0.667987
Andhra Pradesh 0.353080 1.000000 0.541102 0.660107 0.638572
Karnataka 0.308966 0.449502 0.315647 0.539279 0.403349
Goa 0.000000 0.001361 0.003478 0.017950 0.005697
Kerala 0.030463 0.116094 0.120732 0.430019 0.174327
Tamil Nadu 0.229037 0.623998 0.494076 0.721495 0.517152
AverageIndex
Other workersWorkers inhousehold industry
Agriculturelabour
CultivatorsState
Note: Index is calculated based on a standard formula as mentioned in the text.
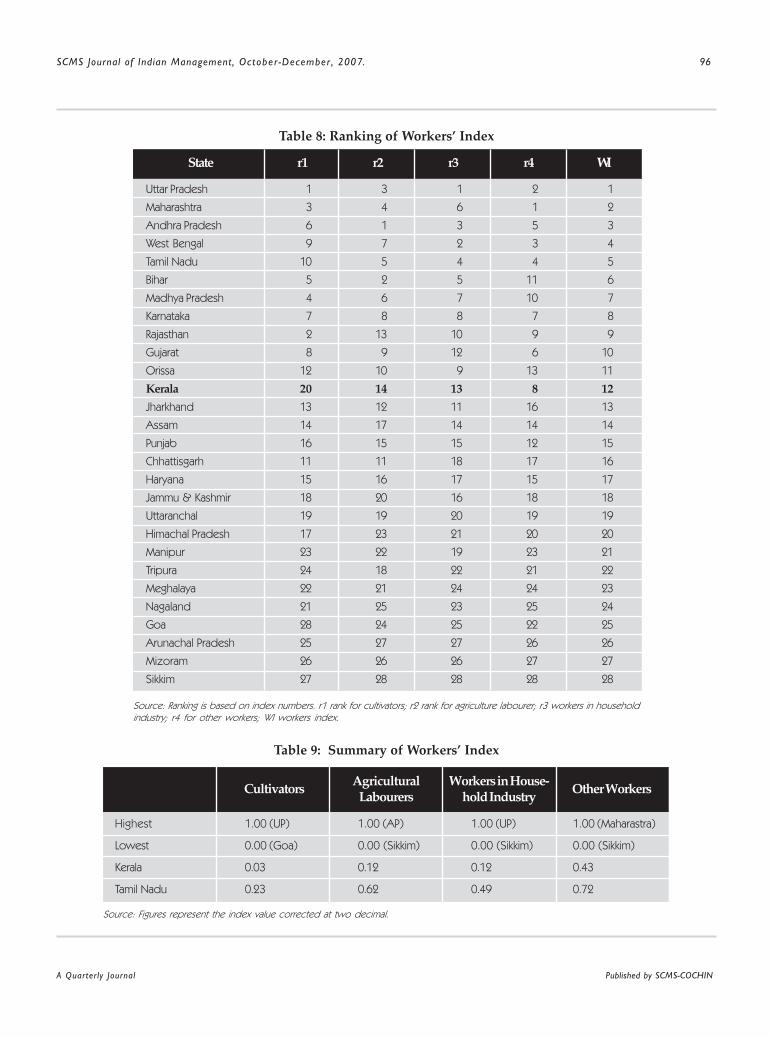
SCMS Journal of Indian Management, October-December , 2007. 96
A Quarterly Journal Published by SCMS-COCHIN
Uttar Pradesh 1 3 1 2 1
Maharashtra 3 4 6 1 2
Andhra Pradesh 6 1 3 5 3
West Bengal 9 7 2 3 4
Tamil Nadu 10 5 4 4 5
Bihar 5 2 5 11 6
Madhya Pradesh 4 6 7 10 7
Karnataka 7 8 8 7 8
Rajasthan 2 13 10 9 9
Gujarat 8 9 12 6 10
Orissa 12 10 9 13 11
Kerala 20 14 13 8 12
Jharkhand 13 12 11 16 13
Assam 14 17 14 14 14
Punjab 16 15 15 12 15
Chhattisgarh 11 11 18 17 16
Haryana 15 16 17 15 17
Jammu & Kashmir 18 20 16 18 18
Uttaranchal 19 19 20 19 19
Himachal Pradesh 17 23 21 20 20
Manipur 23 22 19 23 21
Tripura 24 18 22 21 22
Meghalaya 22 21 24 24 23
Nagaland 21 25 23 25 24
Goa 28 24 25 22 25
Arunachal Pradesh 25 27 27 26 26
Mizoram 26 26 26 27 27
Sikkim 27 28 28 28 28
State r1 r2 r3 r4 WI
Source: Ranking is based on index numbers. r1 rank for cultivators; r2 rank for agriculture labourer; r3 workers in household
industry; r4 for other workers; WI workers index.
Table 8: Ranking of Workers’ Index
Table 9: Summary of Workers’ Index
Highest 1.00 (UP) 1.00 (AP) 1.00 (UP) 1.00 (Maharastra)
Lowest 0.00 (Goa) 0.00 (Sikkim) 0.00 (Sikkim) 0.00 (Sikkim)
Kerala 0.03 0.12 0.12 0.43
Tamil Nadu 0.23 0.62 0.49 0.72
Cultivators AgriculturalLabourers
Workers in House-hold Industry
Other Workers
Source: Figures represent the index value corrected at two decimal.

A Quarterly Journal Published by SCMS-COCHIN
SCMS Journal of Indian Management, October-December , 2007. 97
Chart 2: Sex-wise Distribution of Workforce 1991-2001
3
24
11
62
- 7
7
18
68
18
28
14
40
- 20
- 10
0
10
20
30
40
50
60
70
80
Cultivators Agri HHI OW
Categories of Workers
Acc
reti
onR
ates
Persons
Male
Female
Chart 1: Category and Sex-wise Distribution of Workers (1991-2001)
C t Co p s o o o o ce( 00 )
51.6
22.3
37.5
51.7
25.6
39.1
0
10
20
30
40
50
60
Total Persons Male Female
Distribution of Workers
%sh
are
of
wo
rkfo
rce
inp
op
ula
tio
n
1991
2001
Source: Derived from census data of 1991 and 2001.
J&KHP
PUN
UtnclHar
Raj
UP
Bih
Mgly
Asm
WB
JrkdOri
Chts
MP
Guj
MahAP
Ktk
Goa
Ker
TN
TrprNglnd
Skm Mzm
ArnP
Mnpr0
0.2
0.4
0.6
0.8
1
1.2
States
Index
Val
ues
Chart 3: Mapping of States according to WI
Work
ers
’ (%
)
Source: Derived from census data of 1991 and 2001.
J & KHP
◆◆

SCMS Journal of Indian Management, October-December , 2007. 98
A Quarterly Journal Published by SCMS-COCHIN
The rank of workers’ index reflects the comparative position of
Kerala in the workers’ distribution in the country. Kerala gets 12th
position in the index, which is much lower than the fifth position of
the neighbouring state of Tamil Nadu. The comparative ranking of
the various categories are 20 (cultivators), 14 (agricultural labourers),
13 (household industries) and 8 (other workers). This clearly
proves that the state is not a primary producer and asserts
that the development of the state mainly depends on the
service sector (which includes all government servants,
municipal employees, teachers, factory workers, plantation
workers, those engaged in trade, commerce, business,
transpor t, banking, mining, construction, political or social
work, priests, entertainment artists etc). The pattern of Kerala’s
distribution of Kerala’s workforce is skewed and is in favour of
the skilled labour force of the state.
Conclusion
The percentage change of workforce over a decade (1991-
2001) in Kerala was only 11.06 per cent. The contribution of
female workers (6.76 per cent) to the total workers during
this period represents only half of the contribution of male
(12.46 per cent). The growth rate of agricultural workers and
cultivators are found to be negative over the decade (-.31 and -
.40). This is a clear indication that the development equation
of the state is shifting very fast from a production-orientated
society to a consumer-oriented one. This is an alarming situation
where the state is forced to depend on other states even for
basic consumption goods. The implication of this must be
analysed deeply and intervention strategies must be planned.
Notes
1. Census of India defines ‘work’ as par ticipation in any
economica l l y p roduct i ve ac t i v i t y w i th or w i thout
compensation, wages or profit. All persons engaged in ‘work’
as defined above are ‘workers.’
2. A person who had not participated in any economic activity
even for a day during the last one year preceding the day of
enumeration was considered as non-worker.
3. Those working for a period of six months or more during the
reference period.
4. Those who had worked for less than six months during the
reference period.
5. Union territories are not included in calculating the index.
Source: Derived from Census data 2001
Chart 4: S hare of Categories of W orkers in Kerala
10%
23%
5%
62%
Cultivators
Agriculturallabourers
HouseholdIndustry Workers
Other Workers
Chart 4: Distribution of Workers in Kerala - 2001

A Quarterly Journal Published by SCMS-COCHIN
SCMS Journal of Indian Management, October-December , 2007. 99
References
Census of India. “Population Projections for India and States
– 2001-2026.” from the “Repor t of the Technical
Group on Population Projections.” Constituted by
the National Commission on Population, May, 2006.
Iyengar and Sudarshan Iyengar, N.S. and Sudarshan, P. “A
Method of classifying regions from Multivariate Data.”
Economic and Political Weekly . Vol.7 (51),1982.
2048-2052.
Planning Commission of India. “Population - A Human and
Social Development.” Planningcommission.nic.in/
data/dt_pophsd.pdf.
Todaro, Michael, P. and Smith, C. Stephen. “Economic
Development.” Dorling Kidersley, New Delhi: 2006.
United Nations. “Multilingual Demographic Dictionary.” English
Section. Department of Economic and Social Affairs,
Populat ion Studies . No.29 (Uni ted Nat ions
publication, Sales No. E.58.XIII.4), 1958.

SCMS Journal of Indian Management, October-December , 2007. 100
A Quarterly Journal Published by SCMS-COCHIN
S
Six Sigma Process:Quality Enhancement
Gunmala Suri and Puja Chhabra Sharma
Six Sigma incorporates a pivotal process to aggressively pursue a campaign that boosts customer
sat isfact ion, increases capabi l i ty, improves prof i tabi l i ty and generates higher yields. Six Sigma
involves use of statistical tools within a structured methodology for gaining the knowledge required
to deliver better and cost effective services and products than the competit ion. A continual ly
s a t i s f i ed cus tomer i s a t r ue founda t ion fo r p ro f i t ab i l i t y , bo t tom l i ne re su l t s and g loba l
competitiveness. Six Sigma methodologies are practised at corporate business and suppor t units
to deliver better values in products and services in terms of size, schedule and quality. Researcher
has attempted to find out how Six Sigma is implemented at Select IT Companies in India. Case
studies of WIPRO, SATYAM and TATA CONSULTANCY SERVICES are presented.
ix Sigma (6 ) is a high performance and metric driven
methodology conceptualized in early 80’s for breakthrough
improvements in processes
and product designs leading to
higher monetary benefits and
customer delight. Six sigma success
stories involve drastic improvements
in bottom line by designing and
monitoring everyday business
activities that minimize waste and
resources while increasing customer
satisfaction. The methodology has
been successfully implemented in
many companies as diverse as
Motorola, Allied Signal, Ford, General
Electric, Honda, Sony, Texas
Instruments and has become a way
of life for others.
Six Sigma incorporates a pivotal
process to aggressively pursue a
campaign that boosts customer satisfaction, increases capability,
improves profitability and generates higher yields. Six Sigma involves
use of statistical tools within a
structured methodology for gaining
the knowledge required to deliver
better and cost effective services
and products than the competition.
This quantified and objective
process enables decision-making
easier and faster. Repeated and
consistent application of Six Sigma
recreates the process so the
defects and errors never arise in the
first place. The list of tools and
techniques encapsulated in Six
Sigma may be largely familiar.
The methodological framework
into which they fit and the overall
structure of a Six Sigma effor t
distinguishes it from other
approaches.
Dr.Gunmala Sur i , Facu l ty -Un ivers i ty Bus iness School ,
P a n j a b U n i v e r s i t y , C h a n d i g a r h - 1 6 0 0 1 4 , E m a i l :
g_sur [email protected]
Dr. Pu j a Chhab ra Sha r ma , Facu l t y -Ansa l I n s t i t u te o f
Te c h n o l o g y ( A I T ) , S e c t o r 5 5 , G u r g a o n , H a r y a n a -
122003, Ind ia , Ema i l : pu [email protected]
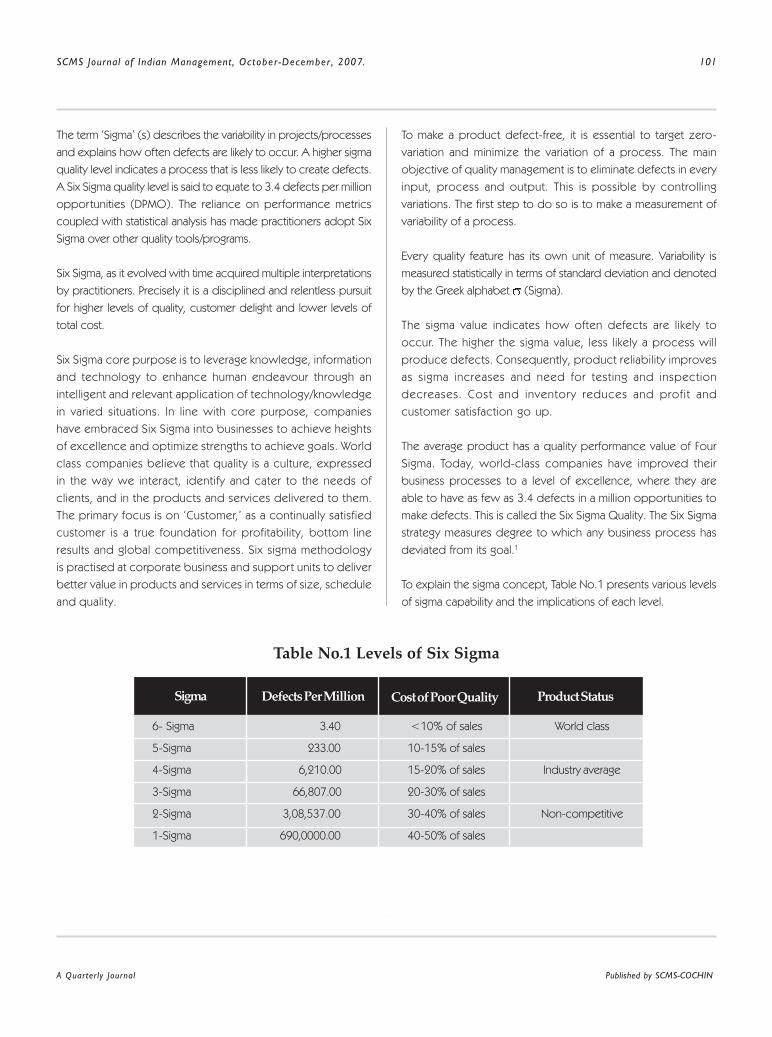
A Quarterly Journal Published by SCMS-COCHIN
SCMS Journal of Indian Management, October-December , 2007. 101
The term ‘Sigma’ (s) describes the variability in projects/processes
and explains how often defects are likely to occur. A higher sigma
quality level indicates a process that is less likely to create defects.
A Six Sigma quality level is said to equate to 3.4 defects per million
opportunities (DPMO). The reliance on performance metrics
coupled with statistical analysis has made practitioners adopt Six
Sigma over other quality tools/programs.
Six Sigma, as it evolved with time acquired multiple interpretations
by practitioners. Precisely it is a disciplined and relentless pursuit
for higher levels of quality, customer delight and lower levels of
total cost.
Six Sigma core purpose is to leverage knowledge, information
and technology to enhance human endeavour through an
intelligent and relevant application of technology/knowledge
in varied situations. In line with core purpose, companies
have embraced Six Sigma into businesses to achieve heights
of excellence and optimize strengths to achieve goals. World
class companies believe that quality is a culture, expressed
in the way we interact, identify and cater to the needs of
clients, and in the products and services delivered to them.
The primary focus is on ‘Customer,’ as a continually satisfied
customer is a true foundation for profitability, bottom line
results and global competitiveness. Six sigma methodology
is practised at corporate business and support units to deliver
better value in products and services in terms of size, schedule
and quality.
To make a product defect-free, it is essential to target zero-
variation and minimize the variation of a process. The main
objective of quality management is to eliminate defects in every
input, process and output. This is possible by controlling
variations. The first step to do so is to make a measurement of
variability of a process.
Every quality feature has its own unit of measure. Variability is
measured statistically in terms of standard deviation and denoted
by the Greek alphabet (Sigma).
The sigma value indicates how often defects are likely to
occur. The higher the sigma value, less likely a process will
produce defects. Consequently, product reliability improves
as sigma increases and need for testing and inspection
decreases. Cost and inventory reduces and profit and
customer satisfaction go up.
The average product has a quality performance value of Four
Sigma. Today, world-class companies have improved their
business processes to a level of excellence, where they are
able to have as few as 3.4 defects in a million opportunities to
make defects. This is called the Six Sigma Quality. The Six Sigma
strategy measures degree to which any business process has
deviated from its goal.1
To explain the sigma concept, Table No.1 presents various levels
of sigma capability and the implications of each level.
Table No.1 Levels of Six Sigma
6- Sigma 3.40 <10% of sales World class
5-Sigma 233.00 10-15% of sales
4-Sigma 6,210.00 15-20% of sales Industry average
3-Sigma 66,807.00 20-30% of sales
2-Sigma 3,08,537.00 30-40% of sales Non-competitive
1-Sigma 690,0000.00 40-50% of sales
Product StatusCost of Poor QualityDefects Per MillionSigma

SCMS Journal of Indian Management, October-December , 2007. 102
A Quarterly Journal Published by SCMS-COCHIN
Practical Impact of Process
Capability of Quality
Six Sigma is aimed at reducing defects at the breakthrough level
through a disciplined and practical application of statistical methods
by reducing variations. The application of Six Sigma begins with
translating a practical problem into a statistical one. Statistics then
helps in finding an optimal solution, which is implemented as a
practical solution in a real life situation.
The main focus of Six Sigma, like most other quality initiatives, is the
reduction of waste and cost, improvement in yields, increased
capacity utilization, reduction in cycle time with an ultimate objective
of satisfying customer needs.
Six Sigma breakthrough strategy involves a series of five basic steps
that are specifically developed for making the above improvements.
These steps are: Define Measure, Analyze, Improve, and Control.
The implementation stresses effective leadership at the highest level
of the company. When these five steps are completed for all the
key processes within a business, breakthrough improvement occurs
in profitability and customer satisfaction.2
Six Sigma quality programme combines the following key
ingredients:
♦ A super ordinate goal of total customer satisfaction.
♦ Common and uniform quality metrics for all areas of
business.
♦ Identical improvement rate goals for all areas of business,
based on uniform metrics.
♦ Goal-directed incentives for both management
and employees.
♦ Coordinated training in ‘why’ and ‘how’ to achieve
the goal.
Review of Literature
In 1999, M. Harry and R. Schroeder published Six Sigma: The
Breakthrough Management Strategy Revolutionizing the World’s Top
Corporation. Since then, there has been considerable interest in
the subject.
According to James Harrington, “Six sigma was simply a
TQM process that uses process capability analysis as a
way of measuring progress. Sigma ( ) is the Greek symbol
for statistical measurement of dispersion called standard
deviation. It is the best measurement of process variability,
because the smal ler the deviat ion value, there is less
variability in the process. Figure 1 shows a process that is
normally distributed and centered with the upper and lower
specification limits (USL and LSL) established at ± 6 . For
this situation, 99.9999998 per cent of the products or
services wil l be between specif ications, and the non-
conformance rate will be 0.002 par ts per mill ion, or 2.0
per billion. The situation diagrammed represents a process
capability index (Cp) of 2.0 AC
p of 1.33 has been a de-
facto standard.3
Figure - 1
USLLSL
-6 -3 -1 +1 +3 +6
A Quarterly Journal Published by SCMS-COCHIN
SCMS Journal of Indian Management, October-December , 2007. 103
None of the case studies in the literature have indicated a shift as
great as 1.5 . The automotive industry recognized the concept in
the mid-1980’s, evaluated it and deemed it unacceptable. In fact,
the original work, Six Sigma was based on only a few empirical
studies of a single process.4
The statistical aspects of Six Sigma tell us that we should reduce the
process variability, , and try to keep the process centered on the
target, µ;. These concepts are not new. They have been long
advocated by Shewhart, Deming, and Taguchi.
Harry and Schroeder use a methodology called DMAIC, which
stands for define, measure, analyze, improve and control. This
approach is somewhat similar but not as comprehensive as the
seven phases of the problem-solving method. Their methodology
features a breakthrough strategy using the project approach, which
is similar to the same strategy advocated by Juran. Projects are
identified by the amount of savings they can generate, which is
simply good business sense and is one of the duties of quality
council. Six Sigma has little to offer that is not already available
through other approaches.5
The Harry and Schroeder approach, however, does introduce an
infrastructure of trained personnel to ensure that projects have
necessary resources to make improvements. A small group of
individuals in the organization has a full-time job of making
improvements. Competency levels of these individuals use Karate
designations of Green Belts, Black Belts, and Master Black Belts.
Green Belts are project leaders and have five days of classroom
training. Black Belts help Green Belts define their projects, attend
training with their Green Belts, and assist them with their projects
after the training. Black Belts receive 160 hours of classroom
instructions and one-on-one project coaching from Master Belts.
Master Black Belts provide the technical leadership and much of
the training for the programme.6
There are a number of problems associated with the Six Sigma
methodology. It would be very difficult and not cost effective for a
small business to develop the required infrastructure. Even a medium
sized business would have difficulty paying for the high cost of the
training. General Electric has spent over two billion dollars to develop
their infrastructure.
In large companies, there is a great danger that the infrastructure will
become a bureaucracy. At one flagship Six Sigma Company, a
technical employee was admonished by a Black Belt for fixing several
processes rather than turn them into Six Sigma projects. It is possible
that operating personnel who know most about the process will
be outside the improvement loop.7
According to Stamatis, Six Sigma presents absolutely nothing new
to the quality field of defect prevention. It is little more than an old
appraisal methodology that focuses on problems after they have
already occurred.
Iomega, maker of Zip drives, began the implementation of its six-
sigma program in 1998. The infrastructure of over 400 Master Black
Belts, Black Belts, and Green Belts out of 3400 employees made
impressive improvements. However, by May 2001, the company
was losing money, the share price went from $4.00 to $1.75 and
the CEO, a former General Electric Manager, was fired along with
many employees. It should also be pointed out that Motorola,
where the Six Sigma concept originated, has lost a considerable
amount of market share of its wireless business and did not show
a profit in 2001 for the first time in many years.8
Some experts believe that there is no real difference between Six
Sigma and TQM. Six Sigma employs some of the same tried-and-
true tools and techniques of TQM. Both Six Sigma and TQM
emphasize importance of top down support and leadership. Both
approaches make it clear that continuous improvement of quality is
critical to long-term business success. The PDCA cycle used in
TQM is not fundamentally different from the Six Sigma DMAIC cycle.
However, there are differences and critical differences. These
differences explain why popularity of TQM has waned, while Six
Sigma’s popularity continues to grow.
The difference, in short, is management. TQM provides only very
broad guidelines for management to follow. Guidelines are abstract
and general that only the most gifted leaders are able to knit together
a successful deployment strategy for TQM. Business magazines
and newspapers reported widespread failure of TQM efforts.
Research showed that organizations, which succeeded in
successfully implementing TQM, reaped substantial rewards. The
low probability of success deterred many organizations trying TQM.
Instead, many organizations opted for ISO 9000. ISO 9000 promises
not world-class performance levels, but ‘standard’ performance. It
provides a clear criteria and a guarantee that meeting these criteria
will result in recognition. In contrast, TQM offered a set of
philosophical guidelines and no way to prove that one had
accomplished quality goals.

SCMS Journal of Indian Management, October-December , 2007. 104
A Quarterly Journal Published by SCMS-COCHIN
Six Sigma was created by some of America’s most gifted CEOs.
People like Motorola’s Bob Galvin, Allied Signal’s Larry Bossidy, and
GE’s Jack Welch. These people had a single goal in mind: to make
their business as successful as possible. Once they were convinced
that the tools and techniques of the quality profession could help
they developed a framework to make it happen, ie. Six Sigma.9
The CEOs could visualize the problems and evolved an approach
that fixed them. Six Sigma addressed the following issues:-
1. Six Sigma extends to a use of the improvement tools to
cost, cycle time and other business issues.
2. Six Sigma discards majority of the quality toolkit. It keeps
a subset of tools that ranges from basic to the advanced.
Six Sigma discards esoteric statistical tools and
completely ignores such staples of quality professional
as ISO 9000 and Malcolm Baldrige criteria. Training focuses
on using tools to achieve tangible business results.
3. Six Sigma integrates goals of the organization as a whole
into an improvement effort. Six Sigma creates top-level
oversight to assure that interests of the entire organization
are considered.
4. Six Sigma strives for world-class performance. Six Sigma
standard is 3.4-DPM failures per million opportunities. It
goes beyond looking at errors. The best of the Six Sigma
firms try to meet or exceed their customer’s expectations
999,996.4 times out of every million encounters.
5. Six Sigma creates an infrastructure of change agents who
are not employed in a quality department. These people
work full and part-time on projects in their areas or in
other areas. Six Sigma Black Belts do not make careers in
Six Sigma. Instead, they focus on Six Sigma for two years
and then continue their careers elsewhere. Green Belts
work on Six Sigma projects while holding down other
jobs. These subject matter experts are provided with
training to give the skills they need to improve processes.
Six Sigma ‘belts’ are not certified unless they demonstrate
that they have effectively used the approach to benefit
customers, shareholders and employees.
Methodology
A Six Sigma Project consists of the following phases:
Define: The product of process to be improved is identified.
Customer needs are identified and translated into Critical to Quality
characteristics (CTQs). The problem/goal statement, the project
scope, team roles and milestones are developed. A high level
process is mapped for the existing.
Measure: The key internal processes that influence the CTQs are
identified and the defects generated relative to the identified CTQs
are measured.
Analyze: The objective of this phase is to understand why defects
are generated. Brainstorming and statistical tools are used to identify
key variables that cause defects. The output of this phase is the
explanation of the variables that are most likely to affect process
variation.
Improve: The objective of this phase is to confirm the key variables
and quantify the effect of these variables on the CTQs. It includes
identifying the maximum acceptable range of the key variables,
validating the measurement systems and modifying the existing
process to stay within these ranges.
Control: The objective of this phase is to ensure that the modified
process now enables the key variables to stay within the maximum
acceptable ranges, using tools like Statistical Process Control (SPC)
or simple checklists.
Six Sigma project on the improvement of product quality
compliance, gives a better understanding of approach,
methodology and benefits of Six Sigma.
Case Study- I
Six Sigma at WIPRO
In 1997, the Rs.3,468 crore Wipro Limited started implementing the
Motorola developed Six Sigma process in its businesses ranging
from toilet soaps to computer peripherals.10
Wipro has initiated more than 1,000 projects, trained more than
200 Black Belts and generated savings of approximately Rs.110
crore.
This was not achieved overnight. In the first year Wipro achieved no
gains. Six Sigma has benefited Wipro across businesses. In its
hardware business installation failures were brought down to one
per cent from 4.5 per cent in the past. The instances of having to
rework software dropped from twelve to five per cent. Productivity

A Quarterly Journal Published by SCMS-COCHIN
SCMS Journal of Indian Management, October-December , 2007. 105
in toilet soaps increased by 100 per cent and in the printers business
by 50 per cent.
Most importantly, it has taken the Sigma level of the company to 5.1
Sigma from three Sigma over the past five years. This means the
number of defects per million opportunities (DPMO) has dropped
from more than 66,807 (which is the average of a company at the
3 Sigma level) to 233 DPMO.
This also worked at the customer end. The company provides the
NAMP 3.0 software to a large Indian telecom services provider,
software links, GSM networks to the Internet. When cell-phone
users wanted to access a service like a cricket score update, the
service provider’s requirement was 30 pull per second.
When daily updates like weather had to be relayed to cell-phone
users then the requirement was 30 pull and 30 push per second.
Wipro claims to have managed to provide 38 pull per second and
45 push per second to the service provider.
Wipro also saves on the cost of poor quality. For an average
company operating at Three Sigma, the cost of poor quality could
be as high as 30 per cent of sales. For a Four Sigma company, it
could be between 15 and 25 per cent and for a Five Sigma company
between five and ten per cent of sales. As a company gets
closer to Six Sigma levels, the cost of poor quality falls below one
per cent. In Wipro’s case, the cost of quality is on par with Six
Sigma standards.
According to C.R.Nagaraj, corporate vice president, Mission:
Quality, Wipro Limited, “When liberalization started in the early 1990s,
Wipro was suddenly confronted with two challenges. First,
competition came right up to their doorstep and the beginning of
the software business boom made it seek clients abroad.”
As a result, says Nagaraj, ‘Customer focus became the key and so
did the efficiencies of internal operations. The urge to differentiate
ourselves and add value to the customer led us to embark on a
quality journey.’
Wipro started offering Six Sigma consulting services to other
companies. The company claims to have already bagged one major
client and negotiations with more clients are in the final stages.
Unlike ERP, EVA, TQM and all the other management solutions that
have at one time or the other raised in popularity, Six Sigma is
harder to implement. Six Sigma is a much more rigorous
methodology. Closely linked to business metrics, it produces
breakthrough results by the use of statistics.
Wipro has one of the most mature Six Sigma programs in the industry
ensuring that 91 per cent of projects are completed on schedule,
much above the industry average of 55 per cent. Six Sigma provides
tools for continuous improvement on existing processes thereby
helping sustain the SEI-CMM Level 5 and CMMI certifications.
As the pioneers of Six Sigma in India, Wipro has put in more than
five years into process improvement through Six Sigma. Along the
way they have scaled Six Sigma ladder within Wipro, while helping
to roll out 1000 projects. Wipro has built up a Six Sigma skill base of
over 200 blacks belts. Wipro’s Six Sigma consulting experience has
peaked with indigenous development of new methodologies that
go to their customers.
DSSS (Development of Six
Sigma Software) Methodology
At Wipro, they employ DSSS methodology for software
development. The methodology uses rigorous in-process metrics
and cause analysis throughout software development life cycle for
defect free deliveries and lower customer cost of application
development.
♦ Six Sigma brings in customer focus, measuring all
deliverables with respect to customer CTQs.
♦ Defect reduction (software defects reduced by 50
per cent) and cycle time reduction (rework in software
down from twelve per cent to five per cent) leading to
improved product quality.
♦ Waste elimination and increased productivity up to 35
per cent.
♦ Cost of failure avoidance (Installation failures down from
4.5 per cent to one per cent in hardware business).
♦ Tangible cost savings due to lower application
development cost for customer.
Wipro is the first software services organization in the world to be
assessed at SEI CMM level 5 – the highest maturity level for any

SCMS Journal of Indian Management, October-December , 2007. 106
A Quarterly Journal Published by SCMS-COCHIN
software process. Company achieved CMM level five certification
in June, 1999. As part of CMM level 5 initiatives, their process
capabilities focus on defect analysis; cause identification and defect
prevention and technologies incorporation- tools, methods and
process so as to facilitate continuous improvement in software
quality and productivity.
Case Study –II
Organization
Satyam Computer Services Ltd. (Satyam) is a diverse end-to-end IT
solutions provider, engaged in application development and
maintenance, systems integration, and engineering services. Satyam
specializes in providing customized IT solutions for industries in
the areas of manufacturing, financial services, insurance,
transportation, telecom, healthcare, power etc. Satyam is one of
the first ten companies in the world achieving the Quality credential
SEI CMM level five, in March 1999. Satyam is the first organization in
the world, certified by BVQI, complying with ISO 9001:2000
International Standards, under the Tick IT scheme. Satyam has won
the prestigious IMC Ramakrishna Bajaj National Quality Award for the
year 2001. Satyam’s core values emphasize a strong belief in people,
pursuit of excellence, entrepreneurship and customer orientation.
Six Sigma initiatives are drawn from LIFE (Leading Initiatives for
Excellence) model. It facilitates creation, integration and leadership
of initiatives to achieve and sustain strategic and operational
excellence. From a strategic perspective, Six Sigma Model for
Business Support Process has been developed.
Six Sigma is defined as a methodology to achieve operational
excellence and to delight three key dimensions of business-
Customers, Investors and Employees. The vision statement of Six
Sigma initiatives is:
Vision
To achieve operational excellence by monitoring and improving
key business process through defect prevention and reduction in
cost of poor quality.
Six-sigma initiative provides methodology for Quantitative Process
Management.
Six-Sigma approach has several goals as listed below:-
♦ Delighting Employees, Investors and Customers.
♦ Metrics drive decisions and actions.
♦ Business units operate at their peak performance levels.
♦ Six Sigma skills are a pre-requisite for leadership positions.
Company has a strong foundation with synergistic combination of
strategic planning, leadership and technology. All key systems and
processes are compliant of ISO 9001: 2000, and key practices of
SEI-CMM level five and people processes. These processes churn-
out vital business performance metrics status and direction. This is
an input for performance metrics indicating existing status and
direction. This is also an input for performance excellence initiative
- ‘Measure and Lead.’ Six Sigma methodologies reinforce this initiative
in commitment towards delighting the three basic components-
Customers, Investors and Employees.
Data-> Information-> knowledge->Actions
At SATYAM Six Sigma improvements are realized through
continuous
♦ Measurement process performance through data
♦ Analysis to extract meaningful information
♦ Achievement of better process knowledge
♦ Initiation of positive actions to effect breakthrough
improvements.
As part of integrating the best-in-class practices, Six Sigma
methodologies is tailored to suit industry practices and is merged
with optimizing and continuous improvement aspects of quality
system. Six Sigma methodologies reinforce Measure and Lead
paradigm. The model is unique that the project delight
parameters (PDPs) are derived out of the expectations of three
main stakeholders of business-Customers, Investors and
Employees. The business support processes constantly meet
the changing market requirements and must ensure value
creation. The time taken for analysis and improvement of
deficiencies or issues in a business support process influence
the business results drastically. Business support processes are
those processes, which enable value creation. They include
visioning, payroll process, recruitment process, procurement,
invoice and systems support. Business support processes are
critical to business existence and to realize set objectives.
Considering these merits, a unique model is developed and is
suppor ted by detailed step-by-step activities/tasks and
respective tools and techniques for measuring and enabling
decision-making.

A Quarterly Journal Published by SCMS-COCHIN
SCMS Journal of Indian Management, October-December , 2007. 107
Six Sigma Model for Business
Support Processes
It is a continual improvement model developed with the perspective
of business support processes. The methodology covered in this
model, implements systematic data gathering and statistical analysis
to pinpoint the sources of variation/error, thereby helping to draw
plans to eliminate them. In pursuit of excellence, resource
optimization and defect prevention forms the key for the continuous
improvement. This is possible only by understanding variability in
processes and determining the process capability. This is done to
continuously reduce process variability by aligning the process/
product delight parameters with the customer targets. This model
helps build the capability within the organization and not just limit
itself to eliminating the product/service defects.
Six sigma projects are chosen with their bearing on customer
feedback and potential cost savings. The model defines a
methodology that is easy to implement and provides ample
guidance to project teams applying Six Sigma. The model embodies
the philosophy that centers on the themes of Employee-Investor-
Customer needs, careful measurement of facts rather than opinions
and fixing the process rather than the product-and also defines an
implementation support system.
It improves ability of the team towards defining the process
specifications meeting customer expectations and satisfying the
investors and employees involved. Six sigma quality of 3.4 defects
per million opportunities may not necessarily be the right goal for
all business support process, for some, it may be too low while for
others it may be too high.
It envisages identifying a problem precisely along with expectations
setting the right project delight parameter (PDP) with targets, defining
process variables and assuring measurement system capability; track
the process base lining the PDPs; review process data to identify
causal factors and problem’s root cause; improve the process by
establishing the solution matrix; validate results through new process
sigma and control system to prevent problem recurrence; and execute
the new process. The model incorporates clear exit criteria for each
phase with decision points to ease the implementation process.
Rigorous implementation of the model makes quantum difference
in, business outputs resulting in optimal use of resources with
reduction in Cost of Poor Quality (COPQ) and improving customer
satisfaction.
Phases of Six Sigma Business Process Model
� Identify : P ro jec t , Emp loyees - I nves to r -
Customer (E-I-C) involved and their
needs and expectations.
� Set : Project Delight Parameters (PDP),
Goals, Benefits and Cost
� Track : Frequency of defects and process
variables
� Review : P r o c e s s a n a l y s i s a n d c a u s a l
hypothesis
� Improve : Proposed solution to fix the process
� Validate : Pilot the solution and confirm results
� Execute : Sustainable benefits and integrate
systems
In the model, the project team identifies the delight parameters
that cover E-I-C’s latent requirements; properties of a product/
service that are most essential to satisfying the E-I-C’s expectations.
The delight parameters should be at high-level having significant
impact potential and not the trivia. Goals are set for these delight
parameters and the main thrust is to control and reduce variations.
The delight parameters are derived from the voice of E-I-C and
the most relevant and critical ones are known as project delight
parameters (PDPs).
Six Sigma Problems
Six Sigma is aimed towards improving both performance and design
problems. It addresses all performance-related problems arising
out of either non-compliance issues and/or improving efficiency of
existing business support processes. While the model addresses
process re-engineering problems as part of efficiency/productivity
improvements, it is necessary to keep a balanced perspective
towards the project time limitations, resources, management
continued support and efforts towards change management.
Deployment Process
Projects with significant importance are identified and assigned to
Black belts/Green Belts as six-sigma projects. Each six-sigma project
is assigned a leader trained in six sigma methodology and respective
tools and techniques. Senior Leadership is responsible for strategic
plan and selecting potential Six Sigma project areas.
Companies need to have internal goals on number of people to be

SCMS Journal of Indian Management, October-December , 2007. 108
A Quarterly Journal Published by SCMS-COCHIN
trained in Green Belt (GB) and Black Belt (BB) aspect of Six sigma
implementation and sponsorship criteria. The size and scope of
projects and their duration are also defined.
Green Belt training on Six sigma methodology and requisite statistical
and analytical tools is imparted to the selected employees. The
training span is five days and conducted in two waves. In Course –
I participants undergo a two-day training; they are exposed to
concepts, advantages of Six Sigma and are introduced to the model
with focus on the first three phases and the relevant tools and
techniques. In Course - II advanced statistical concepts; statistical
software and other phases are covered. The time gap between
these two courses is maintained around six-eight weeks to enable
par ticipants initiate project work and act. Par ticipants are
encouraged to take-up two individual projects, where the project
performance is reviewed on a regular basis. Six Sigma initiative
group from Quality facilitates and periodically reviews these projects.
Upon successful completion training management recognizes
efforts with certification.
Satyam has created a web site on Satyam Intranet where all the Six
Sigma related information is made available for employees. Success
stories and lessons learnt are highlight of this website, which to a
larger extent work towards change management to push for
quantitative process management and gain the buy-in from all
employees.
A Balanced Perspective of Six Sigma
at SATYAM Envisages:
� Six Sigma is not a universal answer to all business
problems, and it is not an end in itself.
� It is not just a tool kit but is a methodology with problem
solving approach.
� It is not a replacement for process knowledge.
� It can not be a substitute for human actions.
Action Points for going forward:
� Improve/re-engineer/simplify current processes to drive
productivity and cost reductions.
� Incorporate quality standards and measurements in all
process/project implementations.
Satyam began its Six Sigma deployment journey in year 2000. All
Satyamites are playing a vital role in the success of this initiative.
Business support processes are constantly revisited to produce
higher levels of quality, as per the expectations of employees,
investors and customer and reducing costs.
Case Study – III
TQM – The Six Sigma Way:
Six Sigma provides an effective mechanism to focus on customer
requirements, through improvement of process quality. In the Global
Engineering Development Center of TATA Consultancy Service (TCS-
GEDC) at Chennai, India, Six Sigma projects are carried out with the
objective of improving on time delivery, product quality and in-
process quality.
This describes an application of the Six Sigma methodology
comprising five phases-Define, Measure, Analyze, Improve and
Control.
The Global Engineering Development Center of Tata Consultancy
Services (TCS-GEDC) located at Chennai, India, has been
executing projects for various businesses of General Electric
Company (GE) since 1995. The project spans the areas of
Engineering design, Computer Aided Design, Finite Element
Analysis, Software Development for Engineering Management
Solutions. TCS-GEDC has a number of initiatives in quality and
process management and is on its journey to Level five of the
Capability Maturity Model (CMM) enunciated by the software
Engineering Institute of Carnegie Mellon University. TCS-GEDC’s
long association with GE has influenced it to adopt the Six
Sigma approach for making disciplined and rigorous progress
in quality improvement. TCS-GEDC learns and leverages from
the experience of GE in the implementation of Six Sigma
initiatives.
Six Sigma Quality quantitatively means that the average review
process generates 3.4 defects per million units-where a unit
can be anything ranging from a component to a line of code or
an administrative form. This implies that nearly flawless execution
of key processes is critical to achieve customer satisfaction
and productivity growth.
The Six Sigma initiatives in TCS-GEDS star ted in 1995, and,
since then, ten Six Sigma projects have been completed. These
include Improvement of Schedule Compliance, Quality compliance,
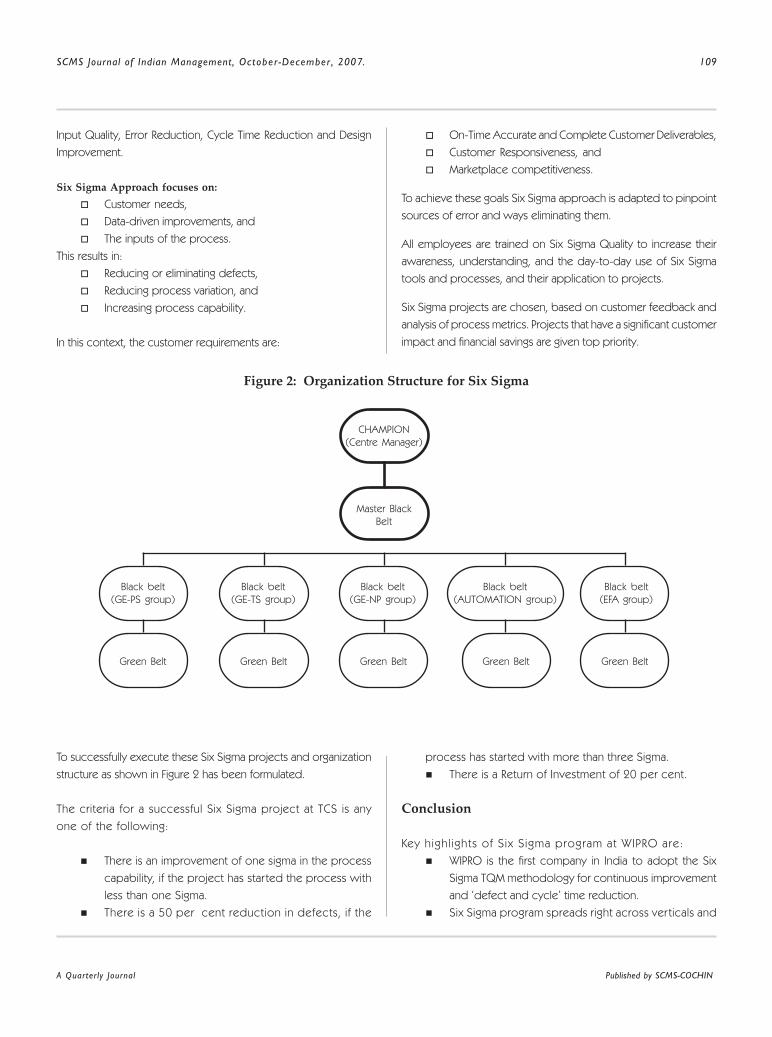
A Quarterly Journal Published by SCMS-COCHIN
SCMS Journal of Indian Management, October-December , 2007. 109
To successfully execute these Six Sigma projects and organization
structure as shown in Figure 2 has been formulated.
The criteria for a successful Six Sigma project at TCS is any
one of the following:
� There is an improvement of one sigma in the process
capability, if the project has started the process with
less than one Sigma.
� There is a 50 per cent reduction in defects, if the
Input Quality, Error Reduction, Cycle Time Reduction and Design
Improvement.
Six Sigma Approach focuses on:
� Customer needs,
� Data-driven improvements, and
� The inputs of the process.
This results in:
� Reducing or eliminating defects,
� Reducing process variation, and
� Increasing process capability.
In this context, the customer requirements are:
� On-Time Accurate and Complete Customer Deliverables,
� Customer Responsiveness, and
� Marketplace competitiveness.
To achieve these goals Six Sigma approach is adapted to pinpoint
sources of error and ways eliminating them.
All employees are trained on Six Sigma Quality to increase their
awareness, understanding, and the day-to-day use of Six Sigma
tools and processes, and their application to projects.
Six Sigma projects are chosen, based on customer feedback and
analysis of process metrics. Projects that have a significant customer
impact and financial savings are given top priority.
Figure 2: Organization Structure for Six Sigma
process has started with more than three Sigma.
� There is a Return of Investment of 20 per cent.
Conclusion
Key highl ights of Six Sigma program at WIPRO are:
� WIPRO is the first company in India to adopt the Six
Sigma TQM methodology for continuous improvement
and ‘defect and cycle’ time reduction.
� Six Sigma program spreads right across verticals and
CHAMPION(Centre Manager)
Master BlackBelt
Black belt(GE-PS group)
Black belt(GE-TS group)
Black belt(GE-NP group)
Black belt(AUTOMATION group)
Black belt(EFA group)
Green Belt Green Belt Green Belt Green Belt Green Belt
SCMS Journal of Indian Management, October-December , 2007. 110
A Quarterly Journal Published by SCMS-COCHIN
impacts multiple areas such as project management,
market development and resource utilization.
� They have over 4000 employees trained in Six Sigma
with 150 certified black belts.
They have more than 500 on going Six Sigma projects and an
expected financial return is ten per cent of PBT.
At SATYAM Six Sigma improvements are realized through
continuous
� Measurement process performance through data,
� Analysis to extract meaningful information,
� Achievement of better process knowledge, and
� Initiation of positive actions to effect breakthrough
improvements.
Six Sigma Initiatives at TCS started in 1995, and, since then, ten Six
Sigma projects have been completed. These include Improvement
of Schedule Compliance, Quality compliance, Input Quality, Error
Reduction, Cycle Time Reduction and Design Improvement.
A thrust on Six Sigma Quality has helped in creating and sustaining
customer focus in the TCS, leading to improved customer satisfaction
as indicated in the feedback from the customers. At the same time,
active participation of the team members from all levels in the Six
Sigma projects has evolved a culture of effective and creative
teamwork. The goal is to achieve Six Sigma level not only in product
quality, which is currently at 5.85 Sigma, but also in other client
specified metrics of on-time delivery and estimate compliance.
As part of integrating the best-in-class practices, Six Sigma
methodologies are tailored to suit industry practices and are merged
with optimizing and continuous improvement aspects of quality
system. Six Sigma methodologies reinforce Measure and Lead
paradigm. The model is unique that the Project Delight Parameters
(PDPs) are derived out of the expectations of three main
stakeholders of business-Customers, Investors and Employees.
The business support processes constantly meet the changing
market requirements and ensure value creation.
Six Sigma Quality quantitatively means that the average review
process generates 3.4 defects per million units-where a unit can
be anything ranging from a component to a line of code or an
administrative form. This implies that nearly flawless execution of
key processes is critical to achieve customer satisfaction and
productivity growth and it will eventually result into following
benefits:
� Defect reduction (software defects reduced by 50
per cent) and cycle time reduction (rework in software
down from twelve per cent to five per cent) leading to
improved product quality,
� Six Sigma bringing in customer focus, measuring all
deliverables with respect to customer CTQs,
� Waste elimination and increased productivity up to 35
per cent,
� Cost of failure avoidance (Installation failures down from
4.5 per cent to one per cent in hardware business), and
� Tangible cost savings due to lower application
development cost for customer.
References
1. Ryan, Thomas, P. “Stat is t ica l Methods for Qual i ty
Improvement.” John Wiling and Sons, New York: 1989.
2. Sullivan, I.P. “Reducing Variability a New Approach to
Quality.” Quality Prefers. (1984): 15-20.
3. H. James, Harrington. “Six Sigma’s Long-Term Impact.”
Quality Digest. June (2001): 16-17.
4. D.H. Stamatis, “Who Needs Six Sigma, Anyway?” Quality
Digest. May (2000): 33-39.
5. Stamaits.
6. Thomas, Pyzdek. “The Six Sigma Infrastructure.” Quality
Digest 54, August 2001.
7. Anonymous. “The Emperor ’s New Woes, Revisited.”
Quality Digest. 80, August 2001.
8. Bester field. Dale H. Total Quality Management. Third
Edition (Pearson Education). (2003): 146-150.
9. Why Six Sigma is not TQM. Thomas Pyzdeh – Feb., 2001.
10. Business Standard. July 30, 2002.
< www.wipro.com>.
< www.tcs.com>.
< www.satyam.com>.

A Quarterly Journal Published by SCMS-COCHIN
SCMS Journal of Indian Management, October-December , 2007. 111
With the advent of globalization, there has been a sea change in the working conditions in
Indian organization. The old reality in which people needed companies has been replaced
with the new reality where companies need people. With the rising attrition rate maintaining
the correct talent pool has gained paramount impor tance in the IT/ITES sector. The new
age “Generation Y,” the hallmark of IT/ITES sector is techno savvy and highly aware of the
market realities and the oppor tunity that they have. This has placed a heavy demand on
the organizations that vie for the same talent pool. In order to succeed the organizations
today have to attract and retain the key talent by offering unique and innovative employee
proposition to its potential and present employees. Those organizations, that are able to
evolve a culture that satisfies generation “Y,” provide them a career path and align the
current and the future programs around the EVP, will be able to win the war in which the
talent is the most prized possession.
Possession: Most Prized
Seema Bhatt and Mukesh Bhatt
he globalization and the opening of the Indian economy in
1990s coupled with the favourable government policies
have given a boost to India
industry. India saw a phenomenal
growth in the service sector especially
in information technology. The
development of computer and
information technology is perhaps
one of the most dominating factors
in the ever-changing working life of
today. The IT/ITES sector continues
to record a strong growth rate. The
NASSCOM-McKinsey Report 2006
states that the Indian IT industry is
targeting exports worth US $60 billion
by 2009-10. As per NASSCOM,
Indian IT-ITES industry showed a
record growth of 31 per cent to
reach $29.6 billion, in FY 2005-06 with
the domestic market revenues growing at 24 per cent. Indian IT
software and services industry is poised to register a growth of
around 25-28 per cent in FY 06-07.
Also, the industry has recorded
export revenues of US $23.6 billion
in FY 2005-06, an increase of 33
per cent growth in exports from FY
2004-05, of which the export of IT
software and services grew by 33
per cent to reach $13.3 billion, the
export by ITES-BPO amounted to
$6.2, engineering services and
product exports reached $4 billion
and the revenues from the domestic
market amounted to $6 billion. This
translates to an estimated demand of
43 lakh professionals (The Hindu,
2006). Thus there is a huge upsurge for
the demand for the IT/ITES personnel. This
T
Ms.Seema Bhatt, Faculty-NIILM-Centre for Management
S t u d i e s , N I I L M - C M S B - I I / 6 6 , M o h a n C o o p e r a t i v e
I n d u s t r i a l E s t a t e , N e w D e l h i - 4 4 , I n d i a , E m a i l :
seemabha t t11@gma i l . com, sbha t t@n i i lm .com
M r. M u k e s h B h a t t , M a n a g e r - Tr a n s i t i o n s , E q u i n o x
Global Ser v ices ( I -F lex Company), 3rd F loor, Inf in i ty
Towers A , DLF Phase- I I , Gurgaon-122002, Harayana,
Emai l : mukesh_bhatt@rediffmai l .com

SCMS Journal of Indian Management, October-December , 2007. 112
A Quarterly Journal Published by SCMS-COCHIN
has cascaded into providing huge opportunity to the present
generation. Between April 2006 and December 2006, IT industry’s
top five companies namely TCS, Infosys, Wipro, Satyam and HCL
have stated an average top line growth of 40 per cent and average
manpower growth of 28 per cent (Thanuja B.M, 2007). Yet, this
industry is plagued by high attrition of with the average attrition rate
of 30 per cent in the IT and 40 per cent in the ITES industry at the
junior level. In call centres and BPO companies the attrition rate can
reach to around 30-35 per cent. A large part of attrition is due to
individuals moving to higher-level jobs in other companies (Runa
Mukherjee, 2006).
This industry has emerged as one of the fastest growing industries
and is being referred to as the sunshine industry. The human
resource is seen as the biggest resource in this industry. As Narayana
Murthy, Chairman and Chief Mentor of Infosys Technologies Limited
has stated “Our assets walk out of the door each evening. We have
to make sure that they come back the next morning.” With high
attrition rate this has become a mammoth task and has places a
huge demand on HR.
Talent Shortage: An Alarming View
In USA until now, the executive population has grown roughly in
line with GDP. This means that an economic growth rate of two
per cent for 15 years would increase demand for executives by
about a third. But supply is moving in the opposite direction: the
number of 35 to 44 year-olds in the United States will decline by 15
per cent between 2000 and 2015 (Elizabeth et al, 1998).
India with 54 per cent of population under 24 years (Goyal, M.
2006) has large workforce, which is young and is poised to take
advantage of this opportunity. But, with the rise in demand the
shortage of talent is soon making its presence felt in India too.
There has been a cut throat competition for the talent leading to a
dynamic and volatile demand-supply equation which has resulted
in the high attrition trends which is now no longer restricted to local
or regional boundaries and has become a global phenomenon.
Early observations by AC Nielsen extracted from a regional CEO
Vision Study, that Korn/Ferry has conducted in Asia Pacific show
that 72 per cent of executives in India cite “gaining and retaining
talent and people” as the main hurdle they will have to face in the
next two years. ‘The War for Talent’ by Mckinsky goes on to explain
how the old reality in which people need companies has been
replaced by the new reality where companies need people. Today
machines or capital or geography are no longer the competitive
advantage rather its people and the talent that they possess which
is becoming more and more scarce. According to a survey by
Hewitt Associates (Leadership and Talent in Asia, (2004) pg.168)
acquisition and retention of talent has the highest impact on the
business results.
Organizations are fast realizing this change. They are trying to evolve
so that employee views their organization as best place to work.
The pay package has become more generous along with the other
benefits. Organizations are emphasising on training and
development and are imparting employees’ necessary skills for
development. Yet, attracting and retaining the employees is
becoming difficult.
In recent years, there has been a paradigm shifts in the way human
resource is viewed, in terms of its acquisition, maintenance,
utilization, development and retention. The business process
outsourcing (BPO) industry is facing the challenge of finding quality
human resources given the current attrition rate of around 50
per cent. (www.bpoindia.org).
The New Age Workforce:
Opportunities Galore
The present workforce in IT and ITES, is relatively younger comprising
around 83 per cent of the workers which are below 30 years of age
(Goyal, M. 2006). This younger generation is techno-savvy and is
very much aware of market realities and the opportunities that they
Declining Supply of Future Executives
Source THE McKINSEY QUARTERLY 1998 NUMBER 3 Page No.47
220
200
180
160
140
120
100
801970 1960 1990 2000 2010 2020
Source: United Nations
▲ ▲
▲
▲
Number of 35-to-44-year-olds in the United States:
Index: 1970 =100
Peak in 2000 (190)
Trough
(163Today
15% decline
from peak
to trough
over 15 years

A Quarterly Journal Published by SCMS-COCHIN
SCMS Journal of Indian Management, October-December , 2007. 113
have. They have high aspirations and expectations and coupled
with a flexible mind-set about job and careers.
They are ready to take risk and relocate anywhere. They keep an eye
on the market and are ready to face challenges, take risk and explore
new opportunities.
Today’s generation ‘Y’ employees are more self-aware want a
workplace that promises to relate to them and their needs. In the
winter 1998 issue of Organizational Dynamics, Hall and consultant
Jonathan Moss said that employees now-a-days pursue a “protean
career” rather than the “organizational career.” The employees today
want to manage their own careers and want to have a career choice
based on their own self-direction. Job hopping for them have
become an easy way of collecting experience and skills for
enhancing their employability. Therefore the firms need to provide
opportunities to the employees to enable them to develop skills
and adaptability to enable to manage their own career. Those
organizations that can make a strategic decision to proactively fulfill
the needs of employees will become the dominant players.
This new age workforce has placed a heavy demand on the
organizations that vie for the same talent pool. Organizations are
today expected to analyze, conceptualize, innovate and implement
relevant strategies for building the correct talent pool. There is a
need for having an effective sensing mechanism, which can gauge
the environment and conjure up mechanism that can attract and
retain key talent in the organization. Attracting and retaining have
become vital for the company’s very survival and growth. For this
they have to create a brand image for them to attract, inspire, cultivate
and retain the employees amidst a cut throat competition for the
talent. A properly constructed Employee Value Proposition will
help organizations in acquiring and retaining the valuable talent.
Employee Value Proposition:
A New Age Mantra
Nowadays, a lot of companies are adopting Employee Value
Proposition (EVP). The term ‘employee value proposition’ is heavily
used in recruitment circles to describe a job’s full worth. But it’s
more than just a fancy word. It is a management style that tries to
retain talent rather than repel it. “An Employee Value Proposition is
the summation of everything the employees in the company
experience and receive while they are a part of the organization;
from the intrinsic satisfaction of the work, to the environment,
leadership, colleagues and compensation. Employee Value
Proposition is a combination of challenges, growth, prospects,
self-dignity, job satisfaction and much more. It’s about how well
the company fulfills people’s needs, expectations and dreams
(Drue De Angelis, 2004). EVP is an employer’s stated promise to
the employees and delivery of which satisfies employee needs. It
is a measurement of the balance created between what employee
receives from the organization and in return for their performance
on the job.
An EVP of any organization should be able to answer the five W’s
– ‘Who,’ ‘What,’ ‘Where,’ ‘When’ and ‘Why.’
� Who describes the company, its brand, its position in
market and the image of the organization.
� What’ describes the various aspects of the job like job
description, job responsibil it ies and repor ting
relationships?
� Where and when describes the location of the job and
the timings.
� ‘Why’ answers the most important question as to why
an individual should join this organization. It describes
the unique, credible and compelling advantages or the
promise of the employer to the employees over what its
competitors are offering.
EVP establishes a two-way relationship between the organization
and its employees. It is an understanding of employees’ expectations
and their key needs and of providing them with a career path helps
them to face new challenges and opportunities. Nokia describes
its EVP as “a concrete employment offering for each employee
from the very first day onwards.” It comprises Nokia’s way and
values, performance - based rewards, professional and personal
growth and work life balance (David Pollitt, 2004).
According to Hewitt survey the key to successful Employer Branding
is collaboration and contribution from other departments like
Marketing and Corporate Communications. In TCS, which is focused
on creating a global organization that is multi-cultural and diverse, a
cross-functional team with communication, HR branding and logistic
specialists, handles the Employer branding (HR Connect, 2006).
Employer Branding
With so much churn and war of the talent taking place, companies
are now focusing on employer branding. Employer branding refers
to the perception that present and potential employees have of
the organization. Willingly or unwillingly every organization has an

SCMS Journal of Indian Management, October-December , 2007. 114
A Quarterly Journal Published by SCMS-COCHIN
employment brand whether it is conscious of it or not. Employer
branding presents a challenge to the organization to articulate,
shape, manage and influence the perception of the brand in such
a way as to attract and retain the right attitude, capabilities and talent
of people that are essential for the success of the organization.
Companies that have strong brand image have the natural advantage
to attracting and hiring the best employees as; there is always a
sense of pride and social status attached to them. Especially in
India where the decision to join an organization is influenced by
socio-culture environment, peer group, family and friends. Yet,
there is a need for the Employer Brand even when there is a strong
Organization/Customer Brand present. Employer Branding Survey
conducted by Hewitt Associates and Accor Services which
covered a 105 small, medium and large IT/ITES organizations in
India found that only 38 per cent of managers strongly agree that
their organization has the right Employer Brand to attract the talent
they need and 85 per cent of surveyed managers feel that Employer
Branding will become more important in the future. This also results
in communicating the EVP of the organization. One of the most
effective ways for the organizations to create their Employer Brand
is through the company website. On an average 25 per cent of
employees apply to a company through the career website. In a
few companies this percentage was higher than 75 per cent.
However presently, only 25 per cent of organizations feel that their
communication of employment information (employee benefits,
workplace culture etc.) to potential recruits through the career
website is very good (Employer Survey 2006, Hewitt Associates
and Accor Services). Therefore, maintaining a career website can
also become one of the importance aspects of employer branding.
Organizations need to realize that all interactions of potential or
present employees with the organization result in developing an
image of the organization in the mind of theses people. TCS has
one of the lowest attrition rates which is below ten per cent and is
a much sought after brand among potential employees. They have
ensured that in TCS, Employer Brand is consistently communicated
in all their external interactions. Some of them include the campus
presentation, recruitment advertisements, client presentations, and
organizing IT quiz concept for schools across the nation for students
of 8th to 12th standard. They chose Quiz as medium to enhance the
IT awareness and provide a window to the world of IT. The event
has also helped them in brand building besides extending “IT for
Schools” (HR Connect, 2006).
Along with the employee branding for potential employees, there
should be an internal branding for the employees. Southwest
created an internal tagline for the emotional part: “Freedom begins
with me,” to capture the personal commitment they want each
employee to make to themselves, customers, and the company.
Internal branding starts from the induction itself. During the induction,
organization expectations regarding performance management,
professionalism and other values expected from the employees
should be communicated as well as inductees’ expectations should
also be captured. New employee should be introduced to the
organization culture. At TCS the branding exercise is well connected
with their internal processes. Their efforts at consistent branding
message are communicated across the organization. This higher
brand awareness is attracting talented people to the company,
which is increasingly being recognized as the preferred employer
in key world markets (HR Connect, 2006).
In fact, employer branding and attracting and retaining correct talent
pool are the two sides of the same coin and aim to achieve the
same purpose. Employer branding helps to attract the correct talent
pool. For organization engaged in employer branding, its easier to
get the requisite number and kind of employees but, with multiple
job opportunities available retaining them becomes difficult. So,
even if the employee joins an organization, he/she will not stay
onboard until and unless he/she finds that the organization is catering
to his/her needs. For having more satisfied employees and increased
retention it is necessary that employees’ perceive that they “get”
rewards equal to or exceeding what they “give.” If a company
ignores the employee’s value, it will lose its most talented
people. For this organization needs to have favourable HR
policies that provide employee flexibility and growth and makes
consistent efforts for retention of the talent. High retention rate
helps to build a strong employer brand. Thus, a favourable
employer branding is possible only when the organization is
committed towards the welfare of the employees.
Employer
Brand
Retain
EmployeesAttract Potential
Employees
HR Policies
Employee
Value proposition

A Quarterly Journal Published by SCMS-COCHIN
SCMS Journal of Indian Management, October-December , 2007. 115
Culture
Organizational culture plays an important part in improving the
perception of the company especially when there are a lot of
fundamental changes taking place. EVP helps bridge the individual
values and the culture of the organization. Today there is no dearth
of free flow of information causing a phenomenal change in the
organization culture. Culture is what bind the organization in a single
thread and drives the organization and its actions. It conditions the
employees to think, act, feel and bring in sense of belongingness
to the organization. Some aspects of culture are visible and tangible
and others are intangible and unconscious. A culture that is open,
trusting, nurturing, authentic as well as empowering can make the
difference in attracting and retaining top talent. With the emergence
of new technology, networking and vir tual organizations are
becoming a reality leading to changes in the organizational structures.
The workplace environment is changing with new management
processes emerging and more and more employees opting for
flexi-timing and flexibility in the work itself. IBM is offering this flexibility
as a part of the value proposition for the employees. In IBM
employees can start working in the technical services division, and
later shift to software group or could potentially go into the business-
consulting group (David Creelman, 2005).
Career Path
The employee should be able to see and visualize their career path
and feel that the organization is investing and helping them gear for
their future responsibilities. According to a survey of the HR heads
of 22 IT companies conducted by HR Connect, ‘Lack of career
development opportunities’ is one of the top three reasons for the
talent to leave the organization (HR Connect, February 2006). Thus,
an organization with inadequate career opportunities is not able to
retain its talent and encourages employees to leave. The present
generation ‘X’ will stay in the organization as that as long as they
find it challenging and furthering their career goals. For them it’s not
disloyalty but the way of managing their career (Bova B. et al 2001).
Therefore, the organization should be able to build and
communicate career plan for each and every employee. The career
paths that IBM offers are huge and there is opportunity to work on
projects around the world, without necessarily having to travel. The
organizations offer to their employees the opportunity to expertise
in supporting solutions for the European financial sector and at the
same time work on software solutions in their Asian market or in
New York. It’s has its unique and a very valuable proposition for the
right people (David Creelman, 2005).
Aligning the current and the future people program: The Road Map
EVP basically aims at aligning the current and the future people
program around the proposition, which helps in creating reasons
for an employee to join or stay in the organization. With attrition rate
increasing there is a mammoth task for the HR manager to attract
and retain the people needed and for this it is necessary to create
and perpetually refine an employee value proposition (EVP) so that
it explains to a smart, energetic and ambitious individual the benefits
of working in the particular organization than with someone else.
EVP involves information gathering mechanisms for understanding
why people stay or leave and take suitable actions on it. This stronger
employee value proposition translates into a stronger pull on talent.
Developing the right EVP strategy will build the positive brand for
the company. It also means creating innovative strategies to attract
and retain strong performer. Managing and Creating an attractive
EVP means to tailor the company’s “brand” and the jobs to appeal
to the specific talent pool it wants to attract, maintain and retain.
According to Mckinsey, the following six characteristics make a
‘great job.’
� Provide enough room for maneuvering to executives.
� Allow them to make decisions without seeking constant
approval from above.
� Have a clear link between daily activities and business
results.
� Provide opportunities and position that stretches the
individual.
� Provide something new to work on as often as possible.
� Provide an atmosphere, which encourages colleagues
to work with, above, around, and below.
If we talk about some best practices in the industry, TCS with its
vision of being one among the global top 10 companies by 2010
has focused on creating a global organization. Their EVP includes
world class training aimed at enhancing learning and development
capabilities, right from the initial years as well as an opportunity to
work across technology platforms, domains and various
geographies opportunities. They provide an exposure to the
international environments with their world-wide presence. They
offer careers in more than five streams. Their reward and recognition
program is a unique mix of monetary and non monetary benefits
which tries to engage with the employees beyond the work space
with initiatives like Maitree, which aims to create professionals with

SCMS Journal of Indian Management, October-December , 2007. 116
A Quarterly Journal Published by SCMS-COCHIN
a global mindset. Also ongoing engagement in the work and life
space enables employees to have long term careers. In short the
TCS employee brand stands for Global opportunities, world’s best
training ground and employee friendliness (HR Connect, June, 2006).
Conclusion
For having a robust EVP that can comprehend, conceptualize
sustain and implement strategies that can attract, create and
maintain the relevant talent pool it is necessary to first
understand the present EVP which the organizations are
offering. They need in-depth understanding of the complete
package that they are offering. Second they need to understand
the value drivers for their present or potential employees.
Organizations need to know what exactly attracts candidates
to the organization and the job. Also they need to know what
par t or attribute of the employment experience have the
maximum impact on the present or the potential employees.
They need to analyze what influences the employees the most.
Is it the future promises of learning and growth, providing
technical or business leadership, rewards or recognition or
any other incentive. Sometimes, there can be discrepancies
between HR professional or recruiter, in understanding the
drivers that constitute the EVP. For this the HR manager has to
get input from various stakeholder groups such as ex-
employees, clients, suppliers and senior management team as
well as current employees. This can help him to gain insights.
Otherwise focus groups with a mix of participants both internal
and external to the organization can be set up. This can be
done either by HR Manager or any consultant. Thirdly after
analyzing and understanding this gap between what is being
offered and what drives the employees a new value proposition
needs to be designed. After creating a new or a unique EVP
organization needs to message it across the target audience.
This message should be reinforced by the actions taken.
Creating an EVP is not enough. For ensuring that it is effective
and serves the purpose, it is necessary to periodically review
it. Instead of relying on standard questionnaires or other data,
the organization needs to have its own data collected through
a ta i lor -made quest ionna i re which emphas izes on
organization’s EVP. Creating a unique and effective EVP that
revolves around the employees, taking care of their needs and
aspirations and provides them with challenges and opportunity
they want will help the organization in winning the war in which
talent is the most prized possession.
References
Addicam, Sanjay. “Turnover in the IT Industry.”
<www.projectper fect.com.au. 2006>.
Andrew, N. Bell. “The Employee Value Proposition Redefined.”
Strategic HR Review. Volume 4, Issue 4; May-June 2005.
Breda, Bova and Michael, Kroth. “Workplace learning and Generation
X.” Journal of Workplace Learning. Volume 13. Number
2. 2001. 57±65; MCB University Press. ISSN (2001):
1366-5626.
D.Hellriegel, J. Slocum and R. Woodman. Organizational Behaviour.
South-Western College Publishing, 2001.
David, Creelman. “IBM Optimizes Its Workforce to Address New
Business Goals.” Workforce Management Online. July
2005.
David, Pollitt. “Nokia connects HR policy with company success.”
Human Resource Management. Vol.12. No. 6, 31, 2004.
Dilip, Mohapatra. “Kicking Retention Strategies into High Gear.”
Douglas, T. Hall and Jonathan, E. Moss. “The New Protean Career
Contract.” Organizational Dynamics. Winter (1998): 22-36.
Drue, De, Angelis. “Competing for Talent to Drive Your Growth The
Employee Value Proposition.” 50 BONEZone Summer
2004. <http://www.orthosupplier.com/bonezone/
online/2004/summer/editorial-deangelis.pdf>.
Elizabeth, G. Chambers. Helen, Handfield-Jones, Steven, Marc,
Hankin and Edward, G. Michaels III. “Win the War For Top
Talent.” Workforce Management Online. Vol. 77, No. 12,
December (1998): 50-56. <www.workforce.com>.
Elizabeth, G. Chambers, Mark, Foulon, Helen, Handfield-Jones,
Steven M., Hankin, and Edward, G. Michaels III. The War
For Talent: The Mckinsey Quarterly. 3, (1998): 47.
Employer Survey, Hewitt Associates and Accor Services. “HR
Connect.” Accor Services. Issue 2, June 2006.
Goodman, J.B. and Loveman, G.W. “Does privatization serve the

A Quarterly Journal Published by SCMS-COCHIN
SCMS Journal of Indian Management, October-December , 2007. 117
pub l i c i n te re s t ? ” Ha r va rd Bus i nes s Rev iew.
November- December, 1991.
“HR Connec t . ” Accor Se rv ices . I s sue 1 , June 2006 .
<h t t p : / / w w w . b p o i n d i a . o r g / r e s e a r c h /
a t t r i t i o n . s h t m l . , http://www.tcs.com/0_features/
articles/k i c k i ng_ re ten t ion_s t r a teg i e s . h tm >.
“Leadership and Talent in Asia.” Hewitt Associates, 2004.
Malini, Goyal. “Young to turn critical for India, Inc.” Times
News Network. Friday, July 07, 2006. <http://
economic t imes . i nd ia t imes .com/a r t i c leshow/
msid-1712167, pr tpage-1.cms>.
Parker, D. “Agency Status, Pr ivat izat ion and Improved
Per formance: Some Ev idence f rom the UK.”
I n t e r n a t i o n a l J o u r n a l o f P u b l i c S e c t o r
Management.” Vol.5 No.1, 1992.
Rita, C.Cunha and Cary, L. Cooper. “Does Privatization Affect
Corporate Culture and Employee Wellbeing?” Journal
of Managerial Psychology. Vol.17 No.1, 2001.
Runa, Mukherjee. “Getting Better than Ever - The BPO story.”
Information Technology. July 27, 2006., <http://
w w w. c o n v e r g e n c e p l u s . c o m / j u l 0 6 % 2 0 i t %
2003.html>.
Sheree, R. Curry. “To Win India’s Talent War, Get to Know the
Candidates’ Workforce Management Online.” March 2005.
Strategic Review. The IT industry in India, NASSCOM, 2006.
Thanuja, B.M. and P.P. Thimmaya. “IT Giants on a Hiring Drive.”
Times News Network. January 26, 2007., <http://
economic t imes . i nd ia t imes .com/a r t i c leshow/
1462166.cms>.
The Hindu. “Nasscom projects lower growth in exports.” June
02, 2006.

SCMS Journal of Indian Management, October-December , 2007. 118
A Quarterly Journal Published by SCMS-COCHIN
he book Supply Chain Management edited by Dubey and Sai
Kumar, is a collection of ar ticles on various dimensions
of SCM, as varied a fare as can be compiled into a single
volume. The book consists of 28 articles authored by different
scholars, on topics star ting from Basics of Supply Chain
Management and ranging through different applications of SCM
practices in various sectors such as food, finance, health care,
pharmaceutical sector, Public Sector Enterprises, Government, and
mobile industry and also includes interesting chapters on reverse/
green logistics, role of ethics and Value Stream Mapping. The
chapters are not laid out in any particular sequence.
The bulk of the chapters naturally cover the general topics of
SCM, viewed from different perspectives. Chapter 1 -
"Basics of Supply Chain Management” is a useful reading
which touches upon the elements of SCM, logistics integration
and measurement of supply chain performance. Chapter 5,
“Developing Supply Chain Competencies” stresses on
the importance of SCM in the successes of businesses through
a few live case illustrations of successful adoption of SCM
practices. In Chapter 6, the authors touch upon the
E-Choupal supply chain initiative of ITC and how it has benefited
both the farmers and the company and how the company has
successfully combined a social mission with a commercial
venture. Chapter 7 – “Supply Cha in Management
Operat ions under Sa les Tax/Va lue Added Tax” i s
perhaps an antiquated ar ticle, which focuses on the impact of
VAT regime in Supply Chain Management, particularly with the
then different status of implementation of VAT in various States.
TChapter 8, “Efficiency of Supply Chain: A Study of the
Food Sector in India” is a relevant and useful article. In the
introductory part of the paper, the authors highlight the significance
of the food sector and also give a brief but useful insight in supply
chain concepts such as Efficient Consumer Response (ECR), the
Bullwhip Effect and Burbridge Effect. In the main part of the paper,
the authors analyze various aspects of supply chains in food sector
including the cold chain and conclude with a few illustrations of
some leading supply chain players in the field in India. Chapter
13 - “Contemporary Issues in Supply Chain Management”
gives out a brief but interesting genesis of the evolution of the
concept of SCM and touches upon the contemporary issues in
SCM, with an illustration of implementation of ERP solutions in Marico
followed by a few examples of SCM initiatives in Mahindra and
Mahindra, Whirlpool, Dell Computer Company and LG Electronics
India. Chapter 14 - “Reinventing the Supply Chain” highlights
the consequence of SCM on giving the ultimate value to the
customer and describes how SCM can be re-engineered by
disintegration of existing sub-processes and then restructured
through business process reengineering, to be ultimately integrated
to deliver maximum customer value. Chapter 15 – “Promotional
Strategies of Mobile Telephone Services” gives out the
application of Markov Brand Switching Model in assessing consumer
behaviour with respect to competing mobile services providers
offering promotions. The authors have also very wisely included
the limitations of such models. Chapter 22 – “Outsourcing in
Supply Chain Management” is a short but useful article on the
‘whys’ and ‘hows’ of outsourcing and includes the result of a
survey conducted on the topic by the author. Chapter 23 –
123456789012345678901234567890121234567890123456789012345678901212345678901234567890123456789012123456789012345678901234123456789012345678901234567890121234567890123456789012345678901212345678901234567890123456789012123456789012345678901234
Skimming andScanning
Book Title : SUPPLY CHAIN MANAGEMENT
Edited by : Jayashree Dubey and M.L.Sai Kumar
Edition : 2007
Price : Rs.670/-
ISBN : 81-7708-142-X
Pages : 294
Publisher : New Century Publications, New Delhi.
A Quarterly Journal Published by SCMS-COCHIN
SCMS Journal of Indian Management, October-December , 2007. 119
“Supply Chain Management: An Integrated Approach”
attempts to identify common supply chain performance areas and
benefits of SCM, as well as explains the four major decision areas in
SCM viz., location decisions, production decisions, inventory
decisions and transpor tation decisions. Chapter 24 –
“Technical Training of Employees and Supply Chain
Management” discusses the effect of technical training on the
capabilities of the employees, which considerably improves the
supply chain management. The authors give out the results of a
survey conducted by them on the subject.
A few chapters cover the Government, Public and Cooperative
Enterprises. Chapter 16 is a study of the existing inventory
control model in Hindustan Latex Ltd., a public sector enterprise
which ends with recommendations albeit simple, to optimize
inventory of their production processing materials such as chemicals
and packing material. Equally simplistic is Chapter 19 “Supply
Chain Management in Carpet Industry in Erode,” which
appears to be a straight and simple study of a localized industry.
The chapter is characterized by poor drafting and editing.
Chapter 21, “Government Procurement in Supply Chain
Management” is a short chapter which touches cursorily on a few
aspects of Government procurement, again concluding with a few
remedies and a suggested code of ethics for Government service.
Chapter 26 – “Logistics Management in Central Public
Enterprises in India,” is an analytical article which highlights the
point that reduction in logistic costs in public enterprises can unlock
huge resources for development. The author suggests that intensive
application of e-commerce, elimination of red tape and delay in
decision making, transparency and participative decision-making
to bring about much higher rates of return.
The book incorporates a few chapters on health care and
pharmaceuticals viz., Chapters 3, 10 and 12. Chapter 3 - “E
Healthcare: Transforming Hospital Supply Chain” is an
interesting ar ticle which emphasizes the role of internet in
transforming healthcare, and expounds on the roles of
E-Commerce and SCM in modern healthcare. Chapter 10 –
“Radio Frequency Identification in Redefining the Global
Pharma Value Chain,” brings out the emergence of RFID in
pharmaceutical supply chain management and brings out the
benefits including its use as an anti-counterfeiting device.
Chapter 12 “Supply Chain Management Practices in
Pharmaceutical Industries” focuses on the SCM practices in
vogue in the pharmaceutical companies of Hyderabad including
the extent of outsourcing of SCM functions.
The chapters on IT in SCM are useful additions to the volume and
enables the non IT reader to grasp the nuances of the least
understood dimension of Supply Chain Management. Chapter 2
– “Supply Chain Management and ERP” gives a useful insight
into the evolution of ERP and how it became important to SCM. It
goes further in analyzing the aspects of reinforcing ERP in Supply
Chain Management and extending ERP through logistics automation.
Chapter 4 - “IT in Supply Chain Management” gives an in-
depth understanding of the relationship between ERP and SCM. It
also highlights the importance of supply chain collaboration through
real time information sharing and illustrates the same through
examples of the success of Wal-Mart - P & G collaboration. The
author also covers briefly the emerging technologies such as RFID
and concludes with the dictum that the battleground of the future
is going to be e-enabled supply chain versus e-enabled supply
chain instead battle between firms. Chapter 9 “E-Payments in
E-Financial Supply Chain” is another useful chapter which gives
insights into various dimensions of e-financial supply chain to include
e-payments, electronic currency and e-payment mechanism. The
author also highlights the fact that the major impediment to universal
acceptance of e-payments is security concerns. Chapter 20
“Modern ERP Systems vis-à-vis Orientations In Modern
Manufacturing and Operations” highlights the evolution pattern
of modern industries from the past, lists out the 34 modern
manufacturing systems and production modes proposed in the
last decade or so and agent & agent based manufacturing. In the
context of the foregoing, the author proposes few design changes
including incorporation of artificial intelligence in the ERP systems
of the future. Chapter 27 – “Role of E Business in Supply
Chain Management” is another ar ticle which amplifies the
potential of enhanced supply chain efficiencies through e-business.
The author has expounded upon the benefits of e-business in
supply chain related functions and has illustrated the same through
examples of Federal Express, Dell and Amazon.com enhancing
revenues through e-business and cost reduction opportunities
there-in.
The book aptly covers the aspects of reverse logistics in Chapters
17 and 25. In Chapter 17 - “Green Logistics,” the author presents
an overview of reverse logistics from the perspective of ecology
and environment. A fairly new and relevant concept, the author
gives the reader a fresh perspective on ‘returns,’ undoubtedly, this
will be more and more relevant in the years to come in Supply
Chain Management. Chapter 25 – “Turning Returns
Management into a Competitive Advantage” also touches
upon current flaws in returns management and recommends
SCMS Journal of Indian Management, October-December , 2007. 120
A Quarterly Journal Published by SCMS-COCHIN
ex tens i ve use o f web se rv ices fo r e f fec t i ve re tu rn
management.
The varied fare that the volume offers includes a chapter: Chapter
11 – “Protein Photosynthesis Based on Bi-Mimetic
Framework of Supply Chain Management” – a very interesting
article (though a little complex for the lay reader) draws the parallel
between the highly developed and sophisticated Supply Chain
Management in nature and an ideal conventional SCM. The author
very vividly illustrates the supply chain processes involved in protein
biosynthesis process viz., its components, distribution networks,
inventory management, warehousing, information flows, reliability,
quality management, organization and packaging, logistics
management and outsourcing. The author contends that the supply
chain components observed in conventional supply chains when
integrated with supply chain innovations noticed in protein
biosynthesis process can lead to supply chain excellence. Chapter
18 “Role of ethics in Supply Chain Management”
emphasizes the necessity of pursuing SCM through sound and
proper value system. It covers the attributes of attitude, openness,
integrity, understanding and empowerment. The last Chapter,
Chapter 28 – “Value Stream Mapping as a Tool of
Effective Supply Chain Management,” illustrates the concept
of value stream mapping in analyzing the current state, visualizing
the desired future state and crystallizing the means to achieve the
end desired future state. A live example of the Study carried out in
KFCL (Karnataka Fertilizers and Chemicals Limited) has been covered
in some detail concluding with viable recommendations.
Overall, the book is a useful addition to any library and will
help to serve the stated objective of the editors in contributing
to the existing body of literature available on SCM. The quality
of the book however has been slightly marred by a couple of
ar ticles which could well have been omitted out. In par ts,
poor editing has left its marks and tables referred to in the
articles have been edited out without removing the references
to them (pages 156 and 252). Poor syntax marks a couple of
chapters (Chapters 16 & 19).
Brig. Ashok Kumar M.C.
Head - Supply Chain
Reliance Retail Ltd.,
Cochin - 682019
E-mail: [email protected]

A Quarterly Journal Published by SCMS-COCHIN
SCMS Journal of Indian Management, October-December , 2007. 121
even beyond the statutory requirements, how the IT companies
embarked on programs for using IT for preparing and managing
change at grass root levels, how corporate look at doing business
itself in a socially responsible way by embracing a market driven
CSR making it more sustainable as against the conventional
philanthropic approach through the role of government and the
NGOs to what future holds for CSR in India.
The author goes into great detail the specific role the market plays
and how a market orientation has been happening in the CSR
scenario in India. As an example the author cites the proactive step
taken by Ashok Leyland to be ahead of environmental legislation by
introducing CNG (Compressed Natural Gas)-run buses as early as
1997 in the National Capital Region (NCR) to reduce vehicle emission
levels which helped the company to be ahead of competition.
Also dealt in greater detail is the role of NGOs play in a civil society
to further the scope of CSR. Many corporate in India like NIIT, Wipro,
Infosys etc have entered into working partnerships with NGOs to
further the cause of CSR.
The author also discusses about the various codes and standards
like Global Reporting Initiative (GRI), UN Global Compact, SA 8000
etc which provide corporate an opportunity to adhere to certain
standards when it comes to CSR and its reporting and stakeholders
to evaluate a company in terms of its execution of CSR. This provides
Skimming andScanning
1234567890123456789012345678901212345678901234567890123456789012123456789012345678901234567890121234567890123456789012312345678901234567890123456789012123456789012345678901234567890121234567890123456789012345678901212345678901234567890123
Book Title : It’s Only Business! India’s Corporate Social
Responsiveness in a Globalized World
Author : Meera Mitra
Edition : 2007
Price : Rs.395/-
ISBN : 0-19-568433-8
Pages : 192
Publisher : Oxford University Press, New Delhi.
The issue of Corporate Social Responsibil ity (CSR) has
become a topic of intense discussion and debate in India
of late. Post-liberalization, the private corporate sector has
acquired a new-found status which has brought them to the forefront
of the Indian economy. Business in India has become a major
institution influencing every facet of life. This has also given rise to
the growing expectations of the role the business can play in social
development of the country. And corporate India has taken
concrete and creative steps to respond to this expectation by the
society. Meera Mitra’s book narrates the current state of affairs on
the corporate social responsibility front by having a serious look at
how the corporate in India have been responding to what she
terms as “market force of social expectation.”
Ms.Mitra does this by briefly describing the various stages of
evolution of CSR in India, liberally quoting from Vedas and Puranas
to how the system operates in India today, an era of unprecedented
euphoria of economic growth. She provides hands-on account
of the practices of some of the companies like Wipro, Infosys,
Hindustan Unilever, Companies in the Tata Group, Hewlett-Packard
India etc.
The author goes through the philosophies and political aspects of
the CSR, the historical backdrop of CSR in India, how some of the
companies or groups have been proactive and doing a good job

SCMS Journal of Indian Management, October-December , 2007. 122
A Quarterly Journal Published by SCMS-COCHIN
readers with necessary insight regarding the various guidelines and
standards that are available in the area of CSR. Also dealt is the role
played by industry chambers like FICCI, CII etc.
While the author has dealt with the CSR evolution and progress in
India and with some of the specific issues in the BPO segment in a
host country like India, it is felt that the author should have addressed
some of the current issues causing serious concerns like outsourcing
by developed economies from developing economies, dumping
of waste by developed countries into developing nations on the
pretext of helping those economies to grow and overuse of
resources by developed countries and over-consumption by the
rich leaving lesser resources available for the developing countries
and lesser consumption opportunities for the less privileged. While
the liberalization of and reforms in the economy are aimed more at
bringing a market mechanism to the forefront, the pertinent question
that needs to be addressed today is whether the market mechanism
favours the corporations and the economically powerful, widening
the already existing gap between the privileged and the
underprivileged and CSR interventions can help in reducing or
bridging the gap.
The author seems to be overwhelmed by the growth and
contribution of IT to the economy and the role played by IT and IT
companies in bringing about social changes by devoting maximum
number of pages to the subject. While IT can be an enabler, CSR
has been happening and still can happen devoid of IT. Tatas did
their pioneering works on the CSR front when IT was not heard of.
True, today IT industry hogs the limelight as one of the most
profitable and top paying industry in India. It is only natural that the
companies and those working there allocate the highest amounts
towards the cause of CSR. And, may be matters of coincidence,
the leadership of the industry has also shown serious inclination
for CSR.
It was very shocking and astonishing to find a number of mistakes
in the text like spelling mistakes, sentence construction mistakes,
and wrong usages. For example, on page 65, a sentence reads like
“A significant aspect of this programme was that it was closely
watched and monitored results.” On page 72 the mistake appears
in the sentence. “This national al l iance is led
Prof.M.S.Swaminathan.” Then on page 132 “plant” is given in place
of ‘planet’(‘The triple bottom-line refers to what is popularly called
the “people, plant, and profit” approach…….’). A word
“unbundelling” appears on page 133, which hopefully should
have been “unbundling.” Page 134 depicts one of the worst
mistakes of using “peoples.” And on the index page 189, the
name of the company Hindustan Lever Limited is shown as
“Hindustan Levers Limited.” One wouldn’t expect these kinds of
mistakes in a book published by Oxford University Press. I wanted
to point out these mistakes because the two earlier books by
OUP (Governing The Modern Corporation by Roy C. Smith and
Ingo Walter and Stock Market Capitalization and Corporate
Governance by Lalita Som) which I read in the recent past also
contained number of such mistakes.
Despite the shor tcomings and mistakes, by and large a
commendable effort has been taken by Ms.Mitra in dealing with
the CSR issues in India in the current context. The crisp forward by
Mr.Narayana Murthy will definitely kindle interest in the minds of
discernible readers.
About the Author
Dr.Meera Mitra is an independent consultant working with corporate
and development sectors. She has had the experience in teaching,
research and consultancy both in India and abroad. She was involved
in designing and managing numerous projects in different sectors
like health, education, poverty alleviation and governance in different
parts of the country in her capacity as Senior Director of ACORD
(Agency for Cooperation and Research in Development). She was
also actively involved in implementing a CSR Reporting for NTPC,
and is currently involved in consultancy and research on the role of
governance and labour in public sector reforms.
Prof.Satheesh Kumar T.N.
Faculty-ICFAI Business School,
Palarivattom, Kochi - 25,
Email: [email protected]

A Quarterly Journal Published by SCMS-COCHIN
SCMS Journal of Indian Management, October-December , 2007. 123123456789012345678901234567890121234567890123456789012345678901212345678901234567890123456789012123456789012345678901234567890121234567890123123456789012345678901234567890121234567890123456789012345678901212345678901234567890123456789012123456789012345678901234567890121234567890123123456789012345678901234567890121234567890123456789012345678901212345678901234567890123456789012123456789012345678901234567890121234567890123123456789012345678901234567890121234567890123456789012345678901212345678901234567890123456789012123456789012345678901234567890121234567890123123456789012345678901234567890121234567890123456789012345678901212345678901234567890123456789012123456789012345678901234567890121234567890123123456789012345678901234567890121234567890123456789012345678901212345678901234567890123456789012123456789012345678901234567890121234567890123123456789012345678901234567890121234567890123456789012345678901212345678901234567890123456789012123456789012345678901234567890121234567890123123456789012345678901234567890121234567890123456789012345678901212345678901234567890123456789012123456789012345678901234567890121234567890123123456789012345678901234567890121234567890123456789012345678901212345678901234567890123456789012123456789012345678901234567890121234567890123123456789012345678901234567890121234567890123456789012345678901212345678901234567890123456789012123456789012345678901234567890121234567890123123456789012345678901234567890121234567890123456789012345678901212345678901234567890123456789012123456789012345678901234567890121234567890123123456789012345678901234567890121234567890123456789012345678901212345678901234567890123456789012123456789012345678901234567890121234567890123123456789012345678901234567890121234567890123456789012345678901212345678901234567890123456789012123456789012345678901234567890121234567890123123456789012345678901234567890121234567890123456789012345678901212345678901234567890123456789012123456789012345678901234567890121234567890123123456789012345678901234567890121234567890123456789012345678901212345678901234567890123456789012123456789012345678901234567890121234567890123123456789012345678901234567890121234567890123456789012345678901212345678901234567890123456789012123456789012345678901234567890121234567890123123456789012345678901234567890121234567890123456789012345678901212345678901234567890123456789012123456789012345678901234567890121234567890123123456789012345678901234567890121234567890123456789012345678901212345678901234567890123456789012123456789012345678901234567890121234567890123123456789012345678901234567890121234567890123456789012345678901212345678901234567890123456789012123456789012345678901234567890121234567890123123456789012345678901234567890121234567890123456789012345678901212345678901234567890123456789012123456789012345678901234567890121234567890123123456789012345678901234567890121234567890123456789012345678901212345678901234567890123456789012123456789012345678901234567890121234567890123123456789012345678901234567890121234567890123456789012345678901212345678901234567890123456789012123456789012345678901234567890121234567890123123456789012345678901234567890121234567890123456789012345678901212345678901234567890123456789012123456789012345678901234567890121234567890123123456789012345678901234567890121234567890123456789012345678901212345678901234567890123456789012123456789012345678901234567890121234567890123123456789012345678901234567890121234567890123456789012345678901212345678901234567890123456789012123456789012345678901234567890121234567890123123456789012345678901234567890121234567890123456789012345678901212345678901234567890123456789012123456789012345678901234567890121234567890123123456789012345678901234567890121234567890123456789012345678901212345678901234567890123456789012123456789012345678901234567890121234567890123123456789012345678901234567890121234567890123456789012345678901212345678901234567890123456789012123456789012345678901234567890121234567890123123456789012345678901234567890121234567890123456789012345678901212345678901234567890123456789012123456789012345678901234567890121234567890123123456789012345678901234567890121234567890123456789012345678901212345678901234567890123456789012123456789012345678901234567890121234567890123123456789012345678901234567890121234567890123456789012345678901212345678901234567890123456789012123456789012345678901234567890121234567890123123456789012345678901234567890121234567890123456789012345678901212345678901234567890123456789012123456789012345678901234567890121234567890123123456789012345678901234567890121234567890123456789012345678901212345678901234567890123456789012123456789012345678901234567890121234567890123123456789012345678901234567890121234567890123456789012345678901212345678901234567890123456789012123456789012345678901234567890121234567890123123456789012345678901234567890121234567890123456789012345678901212345678901234567890123456789012123456789012345678901234567890121234567890123123456789012345678901234567890121234567890123456789012345678901212345678901234567890123456789012123456789012345678901234567890121234567890123123456789012345678901234567890121234567890123456789012345678901212345678901234567890123456789012123456789012345678901234567890121234567890123123456789012345678901234567890121234567890123456789012345678901212345678901234567890123456789012123456789012345678901234567890121234567890123123456789012345678901234567890121234567890123456789012345678901212345678901234567890123456789012123456789012345678901234567890121234567890123123456789012345678901234567890121234567890123456789012345678901212345678901234567890123456789012123456789012345678901234567890121234567890123123456789012345678901234567890121234567890123456789012345678901212345678901234567890123456789012123456789012345678901234567890121234567890123123456789012345678901234567890121234567890123456789012345678901212345678901234567890123456789012123456789012345678901234567890121234567890123123456789012345678901234567890121234567890123456789012345678901212345678901234567890123456789012123456789012345678901234567890121234567890123123456789012345678901234567890121234567890123456789012345678901212345678901234567890123456789012123456789012345678901234567890121234567890123123456789012345678901234567890121234567890123456789012345678901212345678901234567890123456789012123456789012345678901234567890121234567890123123456789012345678901234567890121234567890123456789012345678901212345678901234567890123456789012123456789012345678901234567890121234567890123123456789012345678901234567890121234567890123456789012345678901212345678901234567890123456789012123456789012345678901234567890121234567890123123456789012345678901234567890121234567890123456789012345678901212345678901234567890123456789012123456789012345678901234567890121234567890123123456789012345678901234567890121234567890123456789012345678901212345678901234567890123456789012123456789012345678901234567890121234567890123123456789012345678901234567890121234567890123456789012345678901212345678901234567890123456789012123456789012345678901234567890121234567890123123456789012345678901234567890121234567890123456789012345678901212345678901234567890123456789012123456789012345678901234567890121234567890123123456789012345678901234567890121234567890123456789012345678901212345678901234567890123456789012123456789012345678901234567890121234567890123123456789012345678901234567890121234567890123456789012345678901212345678901234567890123456789012123456789012345678901234567890121234567890123123456789012345678901234567890121234567890123456789012345678901212345678901234567890123456789012123456789012345678901234567890121234567890123123456789012345678901234567890121234567890123456789012345678901212345678901234567890123456789012123456789012345678901234567890121234567890123123456789012345678901234567890121234567890123456789012345678901212345678901234567890123456789012123456789012345678901234567890121234567890123123456789012345678901234567890121234567890123456789012345678901212345678901234567890123456789012123456789012345678901234567890121234567890123123456789012345678901234567890121234567890123456789012345678901212345678901234567890123456789012123456789012345678901234567890121234567890123123456789012345678901234567890121234567890123456789012345678901212345678901234567890123456789012123456789012345678901234567890121234567890123123456789012345678901234567890121234567890123456789012345678901212345678901234567890123456789012123456789012345678901234567890121234567890123123456789012345678901234567890121234567890123456789012345678901212345678901234567890123456789012123456789012345678901234567890121234567890123123456789012345678901234567890121234567890123456789012345678901212345678901234567890123456789012123456789012345678901234567890121234567890123123456789012345678901234567890121234567890123456789012345678901212345678901234567890123456789012123456789012345678901234567890121234567890123123456789012345678901234567890121234567890123456789012345678901212345678901234567890123456789012123456789012345678901234567890121234567890123123456789012345678901234567890121234567890123456789012345678901212345678901234567890123456789012123456789012345678901234567890121234567890123123456789012345678901234567890121234567890123456789012345678901212345678901234567890123456789012123456789012345678901234567890121234567890123123456789012345678901234567890121234567890123456789012345678901212345678901234567890123456789012123456789012345678901234567890121234567890123123456789012345678901234567890121234567890123456789012345678901212345678901234567890123456789012123456789012345678901234567890121234567890123123456789012345678901234567890121234567890123456789012345678901212345678901234567890123456789012123456789012345678901234567890121234567890123123456789012345678901234567890121234567890123456789012345678901212345678901234567890123456789012123456789012345678901234567890121234567890123123456789012345678901234567890121234567890123456789012345678901212345678901234567890123456789012123456789012345678901234567890121234567890123123456789012345678901234567890121234567890123456789012345678901212345678901234567890123456789012123456789012345678901234567890121234567890123123456789012345678901234567890121234567890123456789012345678901212345678901234567890123456789012123456789012345678901234567890121234567890123123456789012345678901234567890121234567890123456789012345678901212345678901234567890123456789012123456789012345678901234567890121234567890123123456789012345678901234567890121234567890123456789012345678901212345678901234567890123456789012123456789012345678901234567890121234567890123123456789012345678901234567890121234567890123456789012345678901212345678901234567890123456789012123456789012345678901234567890121234567890123123456789012345678901234567890121234567890123456789012345678901212345678901234567890123456789012123456789012345678901234567890121234567890123123456789012345678901234567890121234567890123456789012345678901212345678901234567890123456789012123456789012345678901234567890121234567890123123456789012345678901234567890121234567890123456789012345678901212345678901234567890123456789012123456789012345678901234567890121234567890123123456789012345678901234567890121234567890123456789012345678901212345678901234567890123456789012123456789012345678901234567890121234567890123123456789012345678901234567890121234567890123456789012345678901212345678901234567890123456789012123456789012345678901234567890121234567890123123456789012345678901234567890121234567890123456789012345678901212345678901234567890123456789012123456789012345678901234567890121234567890123123456789012345678901234567890121234567890123456789012345678901212345678901234567890123456789012123456789012345678901234567890121234567890123123456789012345678901234567890121234567890123456789012345678901212345678901234567890123456789012123456789012345678901234567890121234567890123123456789012345678901234567890121234567890123456789012345678901212345678901234567890123456789012123456789012345678901234567890121234567890123123456789012345678901234567890121234567890123456789012345678901212345678901234567890123456789012123456789012345678901234567890121234567890123123456789012345678901234567890121234567890123456789012345678901212345678901234567890123456789012123456789012345678901234567890121234567890123123456789012345678901234567890121234567890123456789012345678901212345678901234567890123456789012123456789012345678901234567890121234567890123123456789012345678901234567890121234567890123456789012345678901212345678901234567890123456789012123456789012345678901234567890121234567890123123456789012345678901234567890121234567890123456789012345678901212345678901234567890123456789012123456789012345678901234567890121234567890123123456789012345678901234567890121234567890123456789012345678901212345678901234567890123456789012123456789012345678901234567890121234567890123123456789012345678901234567890121234567890123456789012345678901212345678901234567890123456789012123456789012345678901234567890121234567890123123456789012345678901234567890121234567890123456789012345678901212345678901234567890123456789012123456789012345678901234567890121234567890123123456789012345678901234567890121234567890123456789012345678901212345678901234567890123456789012123456789012345678901234567890121234567890123123456789012345678901234567890121234567890123456789012345678901212345678901234567890123456789012123456789012345678901234567890121234567890123123456789012345678901234567890121234567890123456789012345678901212345678901234567890123456789012123456789012345678901234567890121234567890123123456789012345678901234567890121234567890123456789012345678901212345678901234567890123456789012123456789012345678901234567890121234567890123123456789012345678901234567890121234567890123456789012345678901212345678901234567890123456789012123456789012345678901234567890121234567890123123456789012345678901234567890121234567890123456789012345678901212345678901234567890123456789012123456789012345678901234567890121234567890123123456789012345678901234567890121234567890123456789012345678901212345678901234567890123456789012123456789012345678901234567890121234567890123123456789012345678901234567890121234567890123456789012345678901212345678901234567890123456789012123456789012345678901234567890121234567890123123456789012345678901234567890121234567890123456789012345678901212345678901234567890123456789012123456789012345678901234567890121234567890123123456789012345678901234567890121234567890123456789012345678901212345678901234567890123456789012123456789012345678901234567890121234567890123123456789012345678901234567890121234567890123456789012345678901212345678901234567890123456789012123456789012345678901234567890121234567890123123456789012345678901234567890121234567890123456789012345678901212345678901234567890123456789012123456789012345678901234567890121234567890123123456789012345678901234567890121234567890123456789012345678901212345678901234567890123456789012123456789012345678901234567890121234567890123123456789012345678901234567890121234567890123456789012345678901212345678901234567890123456789012123456789012345678901234567890121234567890123123456789012345678901234567890121234567890123456789012345678901212345678901234567890123456789012123456789012345678901234567890121234567890123123456789012345678901234567890121234567890123456789012345678901212345678901234567890123456789012123456789012345678901234567890121234567890123123456789012345678901234567890121234567890123456789012345678901212345678901234567890123456789012123456789012345678901234567890121234567890123123456789012345678901234567890121234567890123456789012345678901212345678901234567890123456789012123456789012345678901234567890121234567890123123456789012345678901234567890121234567890123456789012345678901212345678901234567890123456789012123456789012345678901234567890121234567890123123456789012345678901234567890121234567890123456789012345678901212345678901234567890123456789012123456789012345678901234567890121234567890123123456789012345678901234567890121234567890123456789012345678901212345678901234567890123456789012123456789012345678901234567890121234567890123123456789012345678901234567890121234567890123456789012345678901212345678901234567890123456789012123456789012345678901234567890121234567890123123456789012345678901234567890121234567890123456789012345678901212345678901234567890123456789012123456789012345678901234567890121234567890123123456789012345678901234567890121234567890123456789012345678901212345678901234567890123456789012123456789012345678901234567890121234567890123123456789012345678901234567890121234567890123456789012345678901212345678901234567890123456789012123456789012345678901234567890121234567890123123456789012345678901234567890121234567890123456789012345678901212345678901234567890123456789012123456789012345678901234567890121234567890123123456789012345678901234567890121234567890123456789012345678901212345678901234567890123456789012123456789012345678901234567890121234567890123123456789012345678901234567890121234567890123456789012345678901212345678901234567890123456789012123456789012345678901234567890121234567890123123456789012345678901234567890121234567890123456789012345678901212345678901234567890123456789012123456789012345678901234567890121234567890123123456789012345678901234567890121234567890123456789012345678901212345678901234567890123456789012123456789012345678901234567890121234567890123123456789012345678901234567890121234567890123456789012345678901212345678901234567890123456789012123456789012345678901234567890121234567890123123456789012345678901234567890121234567890123456789012345678901212345678901234567890123456789012123456789012345678901234567890121234567890123123456789012345678901234567890121234567890123456789012345678901212345678901234567890123456789012123456789012345678901234567890121234567890123123456789012345678901234567890121234567890123456789012345678901212345678901234567890123456789012123456789012345678901234567890121234567890123123456789012345678901234567890121234567890123456789012345678901212345678901234567890123456789012123456789012345678901234567890121234567890123123456789012345678901234567890121234567890123456789012345678901212345678901234567890123456789012123456789012345678901234567890121234567890123123456789012345678901234567890121234567890123456789012345678901212345678901234567890123456789012123456789012345678901234567890121234567890123123456789012345678901234567890121234567890123456789012345678901212345678901234567890123456789012123456789012345678901234567890121234567890123123456789012345678901234567890121234567890123456789012345678901212345678901234567890123456789012123456789012345678901234567890121234567890123123456789012345678901234567890121234567890123456789012345678901212345678901234567890123456789012123456789012345678901234567890121234567890123123456789012345678901234567890121234567890123456789012345678901212345678901234567890123456789012123456789012345678901234567890121234567890123123456789012345678901234567890121234567890123456789012345678901212345678901234567890123456789012123456789012345678901234567890121234567890123123456789012345678901234567890121234567890123456789012345678901212345678901234567890123456789012123456789012345678901234567890121234567890123123456789012345678901234567890121234567890123456789012345678901212345678901234567890123456789012123456789012345678901234567890121234567890123123456789012345678901234567890121234567890123456789012345678901212345678901234567890123456789012123456789012345678901234567890121234567890123123456789012345678901234567890121234567890123456789012345678901212345678901234567890123456789012123456789012345678901234567890121234567890123123456789012345678901234567890121234567890123456789012345678901212345678901234567890123456789012123456789012345678901234567890121234567890123123456789012345678901234567890121234567890123456789012345678901212345678901234567890123456789012123456789012345678901234567890121234567890123123456789012345678901234567890121234567890123456789012345678901212345678901234567890123456789012123456789012345678901234567890121234567890123123456789012345678901234567890121234567890123456789012345678901212345678901234567890123456789012123456789012345678901234567890121234567890123123456789012345678901234567890121234567890123456789012345678901212345678901234567890123456789012123456789012345678901234567890121234567890123123456789012345678901234567890121234567890123456789012345678901212345678901234567890123456789012123456789012345678901234567890121234567890123123456789012345678901234567890121234567890123456789012345678901212345678901234567890123456789012123456789012345678901234567890121234567890123123456789012345678901234567890121234567890123456789012345678901212345678901234567890123456789012123456789012345678901234567890121234567890123123456789012345678901234567890121234567890123456789012345678901212345678901234567890123456789012123456789012345678901234567890121234567890123123456789012345678901234567890121234567890123456789012345678901212345678901234567890123456789012123456789012345678901234567890121234567890123123456789012345678901234567890121234567890123456789012345678901212345678901234567890123456789012123456789012345678901234567890121234567890123123456789012345678901234567890121234567890123456789012345678901212345678901234567890123456789012123456789012345678901234567890121234567890123123456789012345678901234567890121234567890123456789012345678901212345678901234567890123456789012123456789012345678901234567890121234567890123123456789012345678901234567890121234567890123456789012345678901212345678901234567890123456789012123456789012345678901234567890121234567890123123456789012345678901234567890121234567890123456789012345678901212345678901234567890123456789012123456789012345678901234567890121234567890123123456789012345678901234567890121234567890123456789012345678901212345678901234567890123456789012123456789012345678901234567890121234567890123123456789012345678901234567890121234567890123456789012345678901212345678901234567890123456789012123456789012345678901234567890121234567890123123456789012345678901234567890121234567890123456789012345678901212345678901234567890123456789012123456789012345678901234567890121234567890123123456789012345678901234567890121234567890123456789012345678901212345678901234567890123456789012123456789012345678901234567890121234567890123123456789012345678901234567890121234567890123456789012345678901212345678901234567890123456789012123456789012345678901234567890121234567890123123456789012345678901234567890121234567890123456789012345678901212345678901234567890123456789012123456789012345678901234567890121234567890123123456789012345678901234567890121234567890123456789012345678901212345678901234567890123456789012123456789012345678901234567890121234567890123123456789012345678901234567890121234567890123456789012345678901212345678901234567890123456789012123456789012345678901234567890121234567890123123456789012345678901234567890121234567890123456789012345678901212345678901234567890123456789012123456789012345678901234567890121234567890123123456789012345678901234567890121234567890123456789012345678901212345678901234567890123456789012123456789012345678901234567890121234567890123123456789012345678901234567890121234567890123456789012345678901212345678901234567890123456789012123456789012345678901234567890121234567890123123456789012345678901234567890121234567890123456789012345678901212345678901234567890123456789012123456789012345678901234567890121234567890123123456789012345678901234567890121234567890123456789012345678901212345678901234567890123456789012123456789012345678901234567890121234567890123123456789012345678901234567890121234567890123456789012345678901212345678901234567890123456789012123456789012345678901234567890121234567890123123456789012345678901234567890121234567890123456789012345678901212345678901234567890123456789012123456789012345678901234567890121234567890123123456789012345678901234567890121234567890123456789012345678901212345678901234567890123456789012123456789012345678901234567890121234567890123123456789012345678901234567890121234567890123456789012345678901212345678901234567890123456789012123456789012345678901234567890121234567890123123456789012345678901234567890121234567890123456789012345678901212345678901234567890123456789012123456789012345678901234567890121234567890123123456789012345678901234567890121234567890123456789012345678901212345678901234567890123456789012123456789012345678901234567890121234567890123123456789012345678901234567890121234567890123456789012345678901212345678901234567890123456789012123456789012345678901234567890121234567890123123456789012345678901234567890121234567890123456789012345678901212345678901234567890123456789012123456789012345678901234567890121234567890123123456789012345678901234567890121234567890123456789012345678901212345678901234567890123456789012123456789012345678901234567890121234567890123123456789012345678901234567890121234567890123456789012345678901212345678901234567890123456789012123456789012345678901234567890121234567890123123456789012345678901234567890121234567890123456789012345678901212345678901234567890123456789012123456789012345678901234567890121234567890123123456789012345678901234567890121234567890123456789012345678901212345678901234567890123456789012123456789012345678901234567890121234567890123123456789012345678901234567890121234567890123456789012345678901212345678901234567890123456789012123456789012345678901234567890121234567890123123456789012345678901234567890121234567890123456789012345678901212345678901234567890123456789012123456789012345678901234567890121234567890123123456789012345678901234567890121234567890123456789012345678901212345678901234567890123456789012123456789012345678901234567890121234567890123123456789012345678901234567890121234567890123456789012345678901212345678901234567890123456789012123456789012345678901234567890121234567890123123456789012345678901234567890121234567890123456789012345678901212345678901234567890123456789012123456789012345678901234567890121234567890123123456789012345678901234567890121234567890123456789012345678901212345678901234567890123456789012123456789012345678901234567890121234567890123123456789012345678901234567890121234567890123456789012345678901212345678901234567890123456789012123456789012345678901234567890121234567890123123456789012345678901234567890121234567890123456789012345678901212345678901234567890123456789012123456789012345678901234567890121234567890123123456789012345678901234567890121234567890123456789012345678901212345678901234567890123456789012123456789012345678901234567890121234567890123123456789012345678901234567890121234567890123456789012345678901212345678901234567890123456789012123456789012345678901234567890121234567890123123456789012345678901234567890121234567890123456789012345678901212345678901234567890123456789012123456789012345678901234567890121234567890123123456789012345678901234567890121234567890123456789012345678901212345678901234567890123456789012123456789012345678901234567890121234567890123123456789012345678901234567890121234567890123456789012345678901212345678901234567890123456789012123456789012345678901234567890121234567890123123456789012345678901234567890121234567890123456789012345678901212345678901234567890123456789012123456789012345678901234567890121234567890123123456789012345678901234567890121234567890123456789012345678901212345678901234567890123456789012123456789012345678901234567890121234567890123123456789012345678901234567890121234567890123456789012345678901212345678901234567890123456789012123456789012345678901234567890121234567890123123456789012345678901234567890121234567890123456789012345678901212345678901234567890123456789012123456789012345678901234567890121234567890123123456789012345678901234567890121234567890123456789012345678901212345678901234567890123456789012123456789012345678901234567890121234567890123123456789012345678901234567890121234567890123456789012345678901212345678901234567890123456789012123456789012345678901234567890121234567890123123456789012345678901234567890121234567890123456789012345678901212345678901234567890123456789012123456789012345678901234567890121234567890123123456789012345678901234567890121234567890123456789012345678901212345678901234567890123456789012123456789012345678901234567890121234567890123
CERTIFICATE OF REGISTRATION
Title of Newspaper : SCMS JOURNAL OF INDIAN MANAGEMENT
Language : English(in which it is to be published)
Registration Number of the Newspaper :
Periodicity of the publication and the : Quarterlyday on which it is published 1 January, 1 April, 1 July, and 1 October
Retailing Selling price of the : Rs.1000/- (One Year Subscription)Newspaper
Publisher’s Name : Dr.G.P.C.Nayar
Nationality : Indian
Address : SCMS House, Alfia NagarSouth Kalamassery, Cochin-682 022
Place of publication : Prathap Nagar, Muttom(with complete Postal address) Aluva-683 106, Ernakulam District, Kerala
Printer’s Name : Mr.George P.A.
Nationality : Indian
Address : Jomini Nivas, Alexander GardensKalamassery, Cochin-683109
Name of the Printing Press(with complete address where printing : Maptho Printings, Kalamassery, Cochin-683104is to be conducted)
Editor’s Name : Dr.D.Radhakrishnan Nair
Nationality : Indian
Address : 25/74, Ambady,Kothamangalam-686 691, Ernakulam
Owner’s Name : SCMS-COCHIN
Place : Kalamassery
Date : 1-1-2008.


SCMS Journal of Indian Management
Subscription / Advertisement Form
Name :
Address :
City :
Zip Code :
Country :
E-mail :
Phone :
Draft Number :
(in favour of “SCMS Journal of Indian Management, Cochin”)
Companies/Academic Institutes : 1000 ($60) 1800 ($100) 250 ($15)
Individual : 400 700 125
Students : 280 450 100
Advertisement Rate
Outside back cover : Rs.30,000 in color, Rs.15,000 in black and white
Inside front cover : Rs.17,500 in color, Rs.10,000 in black and white
Inside back cover : Rs.15,000 in color, Rs.6,000 in black and white
Inner full-page : Rs.7500 in color, Rs.4,000 in black and white
Inner half-page : Rs.5000 in color, Rs.3,000 in black and white
For all communications contact:
Editor, SCMS Journal of Indian Management, SCMS New Campus, Prathap Nagar, Muttom,
Aluva - 683 106, Kochi, Kerala, India.
Phone: 91-484-262 3803 / 262 3804 / 262 3885 / 262 3887 Fax: 91-484-262 3855Website: www.scmsgroup.org E-mail: [email protected] / [email protected]
1 year 2 years Per issueSubscription Rates
�������������� �����������
� � � � � � � � �
������������
�� ������������� � �� � � � � � � � � � �
� � � � � � �� � � � � � � � � �
���� ������� �
������� �������
����������
����� �����
� � �� � � � � � � � � � � � �
�� ��������
�� � � � �
12345678901234567890123456789012123456789012345678901234567890121234567890123456789012345678901212345678901231234567890123456789012345678901212345678901234567890123456789012123456789012345678901234567890121234567890123
���������
������������������
� ���������� ����������
� � � � � � �
������������������������� ��������� ���!"��������� ��������
#��������$�����%��&�������'�� � ���� ���
���(��'��������!� �������"�������)����#����������� ����������� ����������� ��
*��+���"�������"�����,�����������������������
-..��������'!!�����%����%�!�����#��������+�������������������������� �� ������
)�������������������������������+�"������������������!������"���������
/�����"�� ���0%��������$� �����������#��$��������������������%���������
)��1�&����� ����0������ �2�������������������&��������������&���$�����
��0����"�+��������3������-�%���"���!����������� ���������"����������
+����������'����+��4������������ �������� �����
������������� ������������ �����������"�
����������������������� �������'�&�
1234567890123456789012345678901212345678901234567890123456789012123456789012345678901234567890121234567890123
�������������� ����������� ��������� ���� �����
�������������
�� � ������� ��� �
������� � � 5�����'��%������6!���
������� �� � 6! � � � � 5 �� � � � � � � � 5 � � �
������� ��� � 5������!��"���� ��� � � 7������
������� �� � 7�����������"��������� 5����
�������������� ������������������������������������������������������������� !�"#���$�%����$������������&�'"�( (�)�)�! #!�*�)�)�! #(�*�)�)�! +�*�)�)�! ,���-�.&�'"�( (�)�)�! ++����/�0����&����1�%������1��2�����& �����3�%������1����*���%�������%�%��34����1%���*��%��3���1%��
�� � � ����� ���� ���1������ � �� ��� �� ���0� �%�� �����4�0�������%������4� ���������������� � � ���%������ ������0� � ���1 ��%���� �� �������%� � �������������� �� ��� ��� ������������ � � �� ��� �� ��������� �������������� �0 � � � � 4 � � ������ ������.�������� �� ���� ��� � � �����04����������� 1 �2� � ���������0� � �����04����2� � �� � � ������0��� � �� ���������� � ����� � ��������� � � ��� � ���%� ��� !"#(1
�������������� ��������������������
������������� ������������������ �������������� ������ ������� �� !"��
��#�$��%�%�&�&������'�&�&����%�'�&�&����(�'�&�&����)��*�+#�$��%�%�&�&���((,����#��" � � � � - � � � � � � � . � � � �' �� � � � " � � � � � � � � � ! - / � � � � . � �
0�1����#����.�������.���

����� ����������� ��������������� 12345678901234567890123456789012123456789012345678901234567890121234567890123456789012345678901212345678901234567890123456789012123456789012345678901234567890123456789012345678901212345678901234567890123456789012123456789012345678901234567890121234567890123456789012345678901212345678901234567890
6�"��������!�
5����������������� ��������������������������������1�5����������������������������������0����������������� ��� ����� �����������������������%��%����� �%�����������������%�1��5��� ������ ��������������������������� ����415����%��������������%������������������4��%%����������������1
5��������� ���6�� �����%����%�%�������4�����������%�������������%���4�������1��5��������� ��������������6����������������������4������%��%������������4����������1��/����������� ���������0��� ���1��/���������������������������������� ����������������%������������������� �0������������0� �%���41
7 ��������� ��� ��%�������������������%�������0�������6���� ���������� �����������%%����0������8���� ���.��������������0��������������4����������1�5��� ����������4�0�������������� ��%�������������1
7 /���� ��� ����%�������������� � ����� ��%���4���������� �������9�������������� ���������� ����%������������������������0����4�������9
7 /�������������������������%������� ����������������%��9��������%�������������0������������0�������������4����� ��������9
7 /���������������%�� ��4���� ��%��9�/�4����������0��4���������������������9
7 /����6���� �����%�������4���%���%�������������������������������%���4������%��9
7 /�����%�����%���� �������������������.����%�������4��������������6�������������%���%��9����������������������������%��� �4����������49
7 5�������%����� ������0���������������0�������������2����:�������������� ����������;<���� ��������������%���%���0������������������������������=1
/%��"������!���%��������"!����%��.����(������!������7 ���0���%��;�0����"##�����=����0�� �0�������%����6��%��� ��0����"##������ ������������%�0�������������
� ������������%����>��������0��� �0��6������ ��%������0�������������� ����8����������0�����������������0�������%����������%1
7 5�����%��������������� �%�������������6������������������������0�����0�������������������0�����1
7 5�0�����%���������������������0���4��������������������1��5��4��������0����0�������5�0���"��?����"���%1
7 @� ��%���������������0�������������������� �������.�1
7 2���������������������������� 4�������������������%����������������������A����������� ����������������4��1
7 2����������� �������������%%�������8�%�������%��� ����0��%����1��2����������%�����������0��%�����%�������������������� � ������6��� ������%������ ���������%����1
7 ���� �������������0��������������������� ������ ��%��������������������1��5����4����%������������������������>�� ���11234567890123456789012345678901212345678901234567890123456789012123456789012345678901234567890121234567890123456789012345678901212345678901234567890112345678901234567890123456789012123456789012345678901234567890121234567890123456789012345678901212345678901234567890123456789012123456789012345678901
6�������.������"������-���������� ���"������& 2�����& ��� � ��3�%������1��*
�%�������%�%��34����1%��5������%���%���0������������0��������� ���� �������%�������������%�������� �� ����0����� ��������� �
+�������"������ & 5���2�� �������������� ����������������������������������������������������������B�� !�"#���$�%����$�������������&��C'"�( (�)�)! #!��)�)! #(��)�)! +��)�)! ,-�.�&�C'"�( (�)�)! ++
1234567890123456789012345678901212345678901234567890123456789012123456789012345678901234567890121234567890123456789012345678901212345678901234567890112345678901234567890123456789012123456789012345678901234567890121234567890123456789012345678901212345678901234567890123456789012123456789012345678901

890123456789012345678901212345678901234567890123456789012123456789012345678901234567890121234567890123456789012345678901212345678901234567890123456789012123456789012345678901890123456789012345678901212345678901234567890123456789012123456789012345678901234567890121234567890123456789012345678901212345678901234567890123456789012123456789012345678901890123456789012345678901212345678901234567890123456789012123456789012345678901234567890121234567890123456789012345678901212345678901234567890123456789012123456789012345678901890123456789012345678901212345678901234567890123456789012123456789012345678901234567890121234567890123456789012345678901212345678901234567890123456789012123456789012345678901890123456789012345678901212345678901234567890123456789012123456789012345678901234567890121234567890123456789012345678901212345678901234567890123456789012123456789012345678901890123456789012345678901212345678901234567890123456789012123456789012345678901234567890121234567890123456789012345678901212345678901234567890123456789012123456789012345678901890123456789012345678901212345678901234567890123456789012123456789012345678901234567890121234567890123456789012345678901212345678901234567890123456789012123456789012345678901
890123456789012345678901212345678901234567890123456789012123456789012345678901234567890121234567890123456789012345678901212345678901234567890123456789012123456789012345678901890123456789012345678901212345678901234567890123456789012123456789012345678901234567890121234567890123456789012345678901212345678901234567890123456789012123456789012345678901890123456789012345678901212345678901234567890123456789012123456789012345678901234567890121234567890123456789012345678901212345678901234567890123456789012123456789012345678901890123456789012345678901212345678901234567890123456789012123456789012345678901234567890121234567890123456789012345678901212345678901234567890123456789012123456789012345678901890123456789012345678901212345678901234567890123456789012123456789012345678901234567890121234567890123456789012345678901212345678901234567890123456789012123456789012345678901890123456789012345678901212345678901234567890123456789012123456789012345678901234567890121234567890123456789012345678901212345678901234567890123456789012123456789012345678901
890123456789012345678901212345678901234567890123456789012123456789012345678901234567890121234567890123456789012345678901212345678901234567890123456789012123456789012345678901890123456789012345678901212345678901234567890123456789012123456789012345678901234567890121234567890123456789012345678901212345678901234567890123456789012123456789012345678901890123456789012345678901212345678901234567890123456789012123456789012345678901234567890121234567890123456789012345678901212345678901234567890123456789012123456789012345678901890123456789012345678901212345678901234567890123456789012123456789012345678901234567890121234567890123456789012345678901212345678901234567890123456789012123456789012345678901890123456789012345678901212345678901234567890123456789012123456789012345678901234567890121234567890123456789012345678901212345678901234567890123456789012123456789012345678901890123456789012345678901212345678901234567890123456789012123456789012345678901234567890121234567890123456789012345678901212345678901234567890123456789012123456789012345678901
890123456789012345678901212345678901234567890123456789012123456789012345678901234567890121234567890123456789012345678901212345678901234567890123456789012123456789012345678901890123456789012345678901212345678901234567890123456789012123456789012345678901234567890121234567890123456789012345678901212345678901234567890123456789012123456789012345678901890123456789012345678901212345678901234567890123456789012123456789012345678901234567890121234567890123456789012345678901212345678901234567890123456789012123456789012345678901890123456789012345678901212345678901234567890123456789012123456789012345678901234567890121234567890123456789012345678901212345678901234567890123456789012123456789012345678901890123456789012345678901212345678901234567890123456789012123456789012345678901234567890121234567890123456789012345678901212345678901234567890123456789012123456789012345678901890123456789012345678901212345678901234567890123456789012123456789012345678901234567890121234567890123456789012345678901212345678901234567890123456789012123456789012345678901
890123456789012345678901212345678901234567890123456789012123456789012345678901234567890121234567890123456789012345678901212345678901234567890123456789012123456789012345678901890123456789012345678901212345678901234567890123456789012123456789012345678901234567890121234567890123456789012345678901212345678901234567890123456789012123456789012345678901890123456789012345678901212345678901234567890123456789012123456789012345678901234567890121234567890123456789012345678901212345678901234567890123456789012123456789012345678901890123456789012345678901212345678901234567890123456789012123456789012345678901234567890121234567890123456789012345678901212345678901234567890123456789012123456789012345678901890123456789012345678901212345678901234567890123456789012123456789012345678901234567890121234567890123456789012345678901212345678901234567890123456789012123456789012345678901890123456789012345678901212345678901234567890123456789012123456789012345678901234567890121234567890123456789012345678901212345678901234567890123456789012123456789012345678901
890123456789012345678901212345678901234567890123456789012123456789012345678901234567890121234567890123456789012345678901212345678901234567890123456789012123456789012345678901890123456789012345678901212345678901234567890123456789012123456789012345678901234567890121234567890123456789012345678901212345678901234567890123456789012123456789012345678901890123456789012345678901212345678901234567890123456789012123456789012345678901234567890121234567890123456789012345678901212345678901234567890123456789012123456789012345678901890123456789012345678901212345678901234567890123456789012123456789012345678901234567890121234567890123456789012345678901212345678901234567890123456789012123456789012345678901890123456789012345678901212345678901234567890123456789012123456789012345678901234567890121234567890123456789012345678901212345678901234567890123456789012123456789012345678901890123456789012345678901212345678901234567890123456789012123456789012345678901234567890121234567890123456789012345678901212345678901234567890123456789012123456789012345678901

���
�����
������
��
��
����
��������
��� �
������
���� �
����������
����������
������������������ ������