scientific report - ercim ferreira lopes... · scientific report first name / family name roberto...
TRANSCRIPT
Scientific Report
First name / Family name
Roberto Rigolin Ferreira Lopes
Nationality Brazilian Name of the Host Organisation NTNU – Norwegian University of
Science and Technology First Name / family name
of the Scientific Coordinator Sverre Hendseth
Period of the fellowship 01/11/2012 to 31/10/2013

ABCDE Scientific Report
2/4
I – SCIENTIFIC ACTIVITY
The fellowship started discussing the viability of deploy web-based third party
services using the broadband connection already available at the smart grid end users (e.g.,
ADSL, cable or fiber-to-the-home). With the meter/controller connected to the Internet, the
web is the logical place to create the full-duplex links aimed in the smart grid vision, as
illustrated in Figure 1. From a software engineering perspective, this scenario combined
with open application programming interfaces (APIs) builds the basis to the development
and deployment of third party services.
3
Web
Digital TVDigital TV
20% Battery
Grid company
Service provider
1
Mobile deviceMobile device
Consumption
monitoring application
Recharge application
Smart meter/
controller
Smart meter/
controller
2
Broadband link
HAN
Figure 1. Car monitoring scenario.
WebPublic all-IP network(s)
Apache 2
End user
Smart meter/controller
Smart meter/controller
Last-mile
7-45 msLatency
Healthy < 90 ms
Warning < 180 ms
Critical > 180 ms
Broadband gateway
Broadband gateway ServerServer
1
2
Deploying the services closer
to the userCentralized
Distributed
Geographical distance
2 1
User
< 350 Km
private or public public
Several km and hops
Figure 2. Emulated IPv6 network environment.
We started with the hypothesis that applications protocols, such as SPDY introduced
by Google, can meet the quality of service (QoS) requirements from typical smart grid
services. Our strategy to verify this hypothesis was composed by three steps. First, compile
the smart grids QoS requirements, in the literature, composed by throughput, latency and
reliability. Second, define and setup an IPv6 emulated network environment between the
meter/controller and the service provider at the web, as illustrated in Figure 2. Third,
perform and discuss a quantitative evaluation of HTTP, HTTPS and SPDY, with focus on
meeting the QoS requirements compiled.
Motivation scenario: let’s suppose that an electric car manufacturer wants to provide
an application to clients monitor their cars autonomy. This application shows the cars
power consumption summary and detailed history using digital TVs or through mobile
devices, as illustrated in Figure 1. Moreover, the car manufacturer made a partnership with
a grid company to offer low energy prices to shared users.
Three communication links are necessary to realize the scenario, also illustrated in
Figure 1: (1) between the meter/controller and the grid company (e.g., using a broadband
link); (2) between the devices inside the house and the meter/controller using a LAN or
WLAN; and (3) over the web among the grid company, the service provider and the users
devices (e.g., a mobile device or a digital TV). We performed quantitative experiments to
delimit the connectivity available at the link (1).
Then, the investigation unfolded addressing the challenge of how to compile the user-
centric data related to consumption, generation and storage. Figure 3 illustrates the
continuous loop of data sensing which orchestrates the system to compile and share the
microgrid status. This figure also highlights the components to (1) gather, (2) compile and
(3) share the user-centric information. Empowered by graph-based data model, the loop is
also able to track new users, generators/storages and consumption behaviours.
ABCDE Scientific Report
3/4
Cloud
Public or private
Microgrid current state
Generator(s)
New generator
+
Continuous cycle
60%
35%
5% Others
Wind
Solar33%
66% Macrogrid
Micro grid
Weather
conditions
New userNew user
Usage Sources
40%
60%
Storage
Storage
Changes
Gathering
Sharing Compiling
1
23
UsersUsers
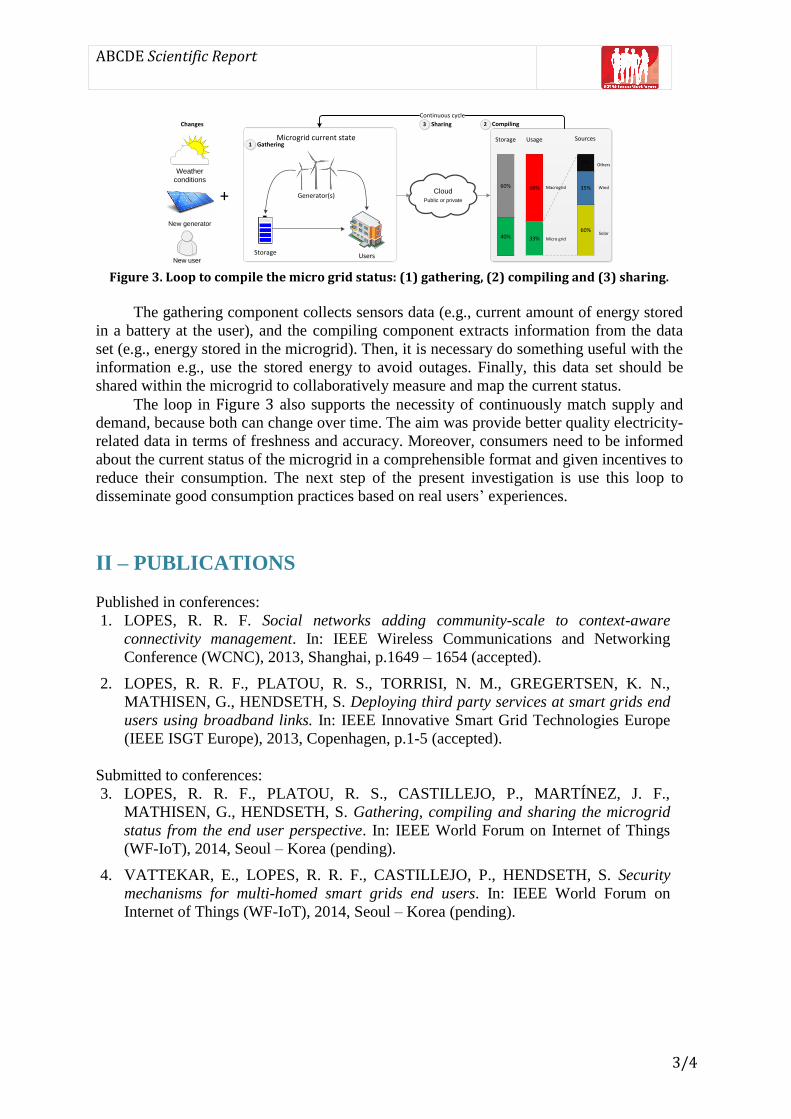
Figure 3. Loop to compile the micro grid status: (1) gathering, (2) compiling and (3) sharing.
The gathering component collects sensors data (e.g., current amount of energy stored
in a battery at the user), and the compiling component extracts information from the data
set (e.g., energy stored in the microgrid). Then, it is necessary do something useful with the
information e.g., use the stored energy to avoid outages. Finally, this data set should be
shared within the microgrid to collaboratively measure and map the current status.
The loop in Figure 3 also supports the necessity of continuously match supply and
demand, because both can change over time. The aim was provide better quality electricity-
related data in terms of freshness and accuracy. Moreover, consumers need to be informed
about the current status of the microgrid in a comprehensible format and given incentives to
reduce their consumption. The next step of the present investigation is use this loop to
disseminate good consumption practices based on real users’ experiences.
II – PUBLICATIONS
Published in conferences:
1. LOPES, R. R. F. Social networks adding community-scale to context-aware
connectivity management. In: IEEE Wireless Communications and Networking
Conference (WCNC), 2013, Shanghai, p.1649 – 1654 (accepted).
2. LOPES, R. R. F., PLATOU, R. S., TORRISI, N. M., GREGERTSEN, K. N.,
MATHISEN, G., HENDSETH, S. Deploying third party services at smart grids end
users using broadband links. In: IEEE Innovative Smart Grid Technologies Europe
(IEEE ISGT Europe), 2013, Copenhagen, p.1-5 (accepted).
Submitted to conferences:
3. LOPES, R. R. F., PLATOU, R. S., CASTILLEJO, P., MARTÍNEZ, J. F.,
MATHISEN, G., HENDSETH, S. Gathering, compiling and sharing the microgrid
status from the end user perspective. In: IEEE World Forum on Internet of Things
(WF-IoT), 2014, Seoul – Korea (pending).
4. VATTEKAR, E., LOPES, R. R. F., CASTILLEJO, P., HENDSETH, S. Security
mechanisms for multi-homed smart grids end users. In: IEEE World Forum on
Internet of Things (WF-IoT), 2014, Seoul – Korea (pending).

ABCDE Scientific Report
4/4
III – ATTENDED SEMINARS AND CONFERENCES
IEEE Wireless Communications and Networking Conference (WCNC)
April 7-10, 2013. Shanghai, P.R. China.
ESEIA – International Summer School “Sustainable Smart Metropolitan Regions of
Tomorrow”. July 14-28, 2013. Brasov, Romania.
Norwegian Research School in Renewable Energy
August 12-16, 2013. Asker, Norway.
Internet of Things and Smart Cities Ph.D. School
September 16-20, 2013. Lerici, Italy
IEEE 4th European Innovative Smart Grid Technologies Conference (ISGT)
October 6 - 9, 2013. Copenhagen, Denmark.
ABCDE Seminar III
October 31st to November 1
st, 2013. Athens, Greece
IV – RESEARCH EXCHANGE PROGRAMME (REP)
Technical University of Madrid – UPM February 11-16, 2013. Madrid, Spain Scientific coordinator: José Fernán Martínez
Collaboration was started to design a user-centric solution to track the microgrids status. The focus was on modelling consumption, generation and storage at the smart grids end users. Swedish ICT - SICS October 14-18, 2013. Stockholm, Sweden Scientific coordinator: Joel Hoglund
Discussion about deploying third party services at smart grids end users was started. With focus on how guarantee QoS in multi-hop networks and how to push sensed data to public clouds.