scientific opinion on nitrofurans and their metabolites in food · nitrofurans are antimicrobial...
TRANSCRIPT
General rights Copyright and moral rights for the publications made accessible in the public portal are retained by the authors and/or other copyright owners and it is a condition of accessing publications that users recognise and abide by the legal requirements associated with these rights.
Users may download and print one copy of any publication from the public portal for the purpose of private study or research.
You may not further distribute the material or use it for any profit-making activity or commercial gain
You may freely distribute the URL identifying the publication in the public portal If you believe that this document breaches copyright please contact us providing details, and we will remove access to the work immediately and investigate your claim.
Downloaded from orbit.dtu.dk on: Mar 25, 2020
EFSA CONTAM Panel (EFSA Panel on Contaminants in the Food Chain), 2015.Scientific Opinion on nitrofurans and their metabolites in food
EFSA Publication
Link to article, DOI:10.2903/j.efsa.2015.4140
Publication date:2015
Document VersionPublisher's PDF, also known as Version of record
Link back to DTU Orbit
Citation (APA):EFSA Publication (2015). EFSA CONTAM Panel (EFSA Panel on Contaminants in the Food Chain), 2015.Scientific Opinion on nitrofurans and their metabolites in food. Parma, Italy: Europen Food Safety Authority. theEFSA Journal, No. 4140, Vol.. 13(6) https://doi.org/10.2903/j.efsa.2015.4140
EFSA Journal 2015;13(6):4140
Suggested citation: EFSA CONTAM Panel (EFSA Panel on Contaminants in the Food Chain), 2015. Scientific Opinion on
nitrofurans and their metabolites in food. EFSA Journal 2015;13(6):4140, 217 pp. doi:10.2903/j.efsa.2015.4140
Available online: www.efsa.europa.eu/efsajournal
© European Food Safety Authority, 2015
SCIENTIFIC OPINION
Scientific Opinion on nitrofurans and their metabolites in food1
EFSA Panel on Contaminants in the Food Chain (CONTAM)2,3
European Food Safety Authority (EFSA), Parma, Italy
ABSTRACT
Nitrofurans are antimicrobial agents not authorised for use in food-producing animals in the European Union.
Nitrofurans are rapidly metabolised, occurring in animal tissues as protein-bound metabolites. The European
Commission requested EFSA to provide a scientific opinion on the risks to human health related to the presence
of nitrofurans in food and whether a reference point for action (RPA) of 1.0 µg/kg for the marker metabolites is
adequate to protect public health. Data on occurrence of nitrofuran marker metabolites in food were extracted
from the national residue monitoring plan results and from the Rapid Alert System for Food and Feed (RASFF).
The CONTAM Panel concluded that these data were too limited to carry out a reliable human dietary exposure
assessment. Instead, human dietary exposure was calculated for a scenario in which a single nitrofuran marker
metabolite is present at 1.0 µg/kg in foods of animal origin, excluding milk and dairy products. The mean
chronic dietary exposure for this worst-case scenario would range from 3.3 to 8.0 and 1.9 to 4.3 ng/kg b.w. per
day for toddlers and adults, respectively. Nitrofurans and their marker metabolites, generally, are genotoxic and
carcinogenic and, also, have non-neoplastic effects in animals. Margins of exposure (MOEs) were calculated at
2.0 × 10⁵ or greater for carcinogenicity and at 2.5 × 10
3 or greater for non-neoplastic effects. The CONTAM
Panel concluded that it is unlikely that exposure to food contaminated with nitrofuran marker metabolites at or
below 1.0 µg/kg is a health concern. A scenario in which foods are considered to be contaminated with
semicarbazide, from use of carrageenan as a food additive, at 1 µg/kg was used to assess whether it is
appropriate to apply the RPA to foods of non-animal origin; MOEs of greater than 104 calculated for non-
neoplastic effects do not indicate a health concern.
© European Food Safety Authority, 2015
KEY WORDS
1 On request from the European Commission, Question No EFSA-Q-2013-00925, adopted on 5 June 2015. 2 Panel members: Diane Benford, Sandra Ceccatelli, Bruce Cottrill, Michael DiNovi, Eugenia Dogliotti, Lutz Edler, Peter
Farmer, Peter Fürst, Laurentius (Ron) Hoogenboom, Helle Katrine Knutsen, Anne-Katrine Lundebye, Manfred Metzler,
Antonio Mutti (from 6 October 2014), Carlo Stefano Nebbia, Michael O’Keeffe, Annette Petersen (from 6 October 2014), 2 Panel members: Diane Benford, Sandra Ceccatelli, Bruce Cottrill, Michael DiNovi, Eugenia Dogliotti, Lutz Edler, Peter
Farmer, Peter Fürst, Laurentius (Ron) Hoogenboom, Helle Katrine Knutsen, Anne-Katrine Lundebye, Manfred Metzler,
Antonio Mutti (from 6 October 2014), Carlo Stefano Nebbia, Michael O’Keeffe, Annette Petersen (from 6 October 2014),
Ivonne Rietjens (until 2 May 2014), Dieter Schrenk, Vittorio Silano (until 15 July 2014), Hendrik van Loveren, Christiane
Vleminckx and Pieter Wester. Correspondence: [email protected] 3 Acknowledgement: The Panel wishes to thank the members of the Standing Working Group on non-allowed
pharmacologically active substances in food and feed and their reference points for action: Bitte Aspenström-Fagerlund,
Metka Filipič (from 18 September 2014), Peter Fürst, Laurentius (Ron) Hoogenboom, Anne-Katrine Lundebye, Marcel
Mengelers (from 8 August 2014), Carlo Stefano Nebbia, Michael O’Keeffe, Wout Slob (from 16 December 2014), Rolaf
Van Leeuwen and Pieter Wester, for the preparatory work on this scientific opinion, and the hearing experts: Noel Joseph
and Oliver Lindtner, and EFSA staff members: Katleen Baert, Barbara Dörr, Athanasios Gkrillas and Sofia Ioannidou for
the support provided to this scientific opinion. The CONTAM Panel acknowledges all European competent institutions that
provided occurrence data on nitrofurans in food, and supported the data collection for the Comprehensive European Food
Consumption Database, as well as the stakeholders that provided toxicity studies, usage levels of carrageenan (E 407), or
information on semicarbazide in seaweeds.

Nitrofurans in food
EFSA Journal 2015;13(6):4140 2
nitrofurans, nitrofuran marker metabolites, semicarbazide, food, reference point for action, non-allowed
pharmacologically active substance, risk assessment
SUMMARY
Nitrofurans are synthetic broad spectrum antimicrobial agents. The nitrofurans considered in this
opinion are furazolidone, furaltadone, nitrofurantoin, nitrofurazone and nifursol. Nitrofurans are not
authorised for use in food-producing animals in the European Union (EU), but furazolidone,
nitrofurantoin and nitrofurazone may be used in human medicine.
Nitrofurans share a nitrofuran ring which is coupled to a side-chain via an azomethine bond. The side-
chains differ for the various drugs, being 3-amino-2-oxazolidinone (AOZ) for furazolidone, 3-amino-
5-methylmorpholino-2-oxazolidinone (AMOZ) for furaltadone, 1-aminohydantoin (AHD) for
nitrofurantoin, semicarbazide (SEM) for nitrofurazone, and 3,5-dinitrosalicylic acid hydrazide
(DNSH) for nifursol. Nitrofurans have short half-lives in animals and therefore they do not occur
generally as residues in foods of animal origin. Reactive metabolites are formed that are able to bind
covalently to tissue macromolecules, such as proteins and DNA. When animal tissues are consumed as
food, the side-chains may be released from the metabolites, namely AOZ, AMOZ, AHD, SEM and
DNSH.
The EFSA Scientific Opinion, titled ‘Guidance on methodological principles and scientific methods to
be taken into account when establishing Reference Points for Action (RPAs) for non-allowed
pharmacologically active substances present in food of animal origin’, identified an approach for
establishing RPAs for various categories of non-allowed pharmacologically active substances.
However, the opinion also identified certain categories of non-allowed pharmacologically active
substances that are considered to be outside the scope of the procedure, including substances that are
high potency carcinogens, such as nitrofurans. As nitrofurans are excluded from that opinion, and
taking into account that the presence of SEM in food may be from sources other than use of
nitrofurazone, the European Commission (EC) requested the European Food Safety Authority (EFSA)
for a scientific opinion on the risks to human health related to the presence of nitrofurans and their
metabolites in food. The opinion should include (a) an evaluation of the toxicity of nitrofurans and
their metabolites for humans, considering all relevant toxicological endpoints and identification of the
toxicological relevance of nitrofurans and their metabolites present in food, and (b) an exposure
assessment of the EU population to nitrofurans and their metabolites from food, including the
consumption patterns of specific (vulnerable) groups of the population. In addition, the opinion should
assess the appropriateness of using marker metabolites of nitrofurans for the reference point for action
for food of animal origin. The opinion should evaluate whether a reference point for action of 1 µg/kg
for nitrofuran metabolites, as defined in legislation, in food of animal origin is adequate to protect
public health, and it should assess the appropriateness of applying the reference point for action,
considered adequate to protect public health, to other commodities than food of animal origin.
Because the nitrofuran parent compounds can only be detected in animal tissues and products for a
short period after treatment of the animals, monitoring of nitrofuran residues in livestock based on the
identification of the parent compounds is not appropriate. Metabolites binding covalently to proteins
and persisting for several weeks in edible tissues, from which the side-chains AOZ, AMOZ, AHD,
SEM and DNSH may be released, serve as excellent marker metabolites for the illicit use of
nitrofurans in food-producing animals. Generally, both screening and confirmatory methods for the
nitrofuran marker metabolites in foods of animal origin use acid hydrolysis and nitrobenzaldehyde
derivatisation of the released marker metabolites. Screening for the resulting nitrophenyl derivatives is
generally undertaken by enzyme-linked immunosorbent assays (ELISA) or biosensor methods,
providing sufficient analytical sensitivity to meet the current minimum required performance limit
(MRPL) of 1 µg/kg. Confirmatory methods are based on liquid chromatography–tandem mass
spectrometry (LC-MS/MS) and also adequately meet the MRPL of 1 µg/kg.

Nitrofurans in food
EFSA Journal 2015;13(6):4140 3
The EFSA Panel on Contaminants in the Food Chain (CONTAM Panel) concluded that, since other
nitrofuran metabolites that could persist at higher concentrations have not been identified, the marker
metabolites AOZ, AMOZ, AHD, SEM and DNSH are appropriate as the RPA for foods of animal
origin.
Data on occurrence of nitrofuran metabolites (AOZ, AMOZ, AHD and SEM) in food, reported by
Member States from the National Residue Monitoring Plans, have been extracted for the period 2002
to 2013; there were 214 non-compliant targeted samples reported for nitrofurans over that 12 year
period. The categories in which nitrofurans were reported in decreasing level of incidence were
poultry, bovines, sheep/goats, pigs, farmed game, honey, rabbit, aquaculture, horses and wild game.
Data were extracted also from the Rapid Alert System for Food and Feed (RASFF) database for the
years 2002 to 2014; there were 808 notification events reported for nitrofuran metabolites (AOZ,
AMOZ, AHD and SEM), of which 416 were for crustaceans and products thereof and 150 were for
poultry meat and poultry meat products.
The CONTAM Panel concluded that data extracted from the EC database and the RASFF database
were too limited to carry out a reliable human dietary exposure assessment. Instead, the CONTAM
Panel calculated the hypothetical human dietary exposure for a scenario in which foods of animal
origin, excluding milk and dairy products, are considered to contain one nitrofuran marker metabolite
at a concentration level equal to the RPA of 1 µg/kg. This scenario, representing a worst-case situation
for the occurrence of nitrofuran marker metabolites due to illicit nitrofuran use, is a highly unlikely
situation. The mean chronic dietary exposure across dietary surveys for this scenario would range
from 1.9 to 4.3 ng/kg b.w. per day for adults and would be the highest for toddlers, at 3.3 to 8.0 ng/kg
b.w. per day.
Besides arising from nitrofurazone use, SEM may occur in food from other sources, including use of
the food additive carrageenan. The CONTAM Panel considered scenarios covering the different
sources. In one exposure scenario, foods of animal origin (including only those milk and dairy
products for which carrageenan is authorised as an additive) and foods of non-animal origin for which
carrageenan is authorised as an additive, were included. These foods are considered to be
contaminated with SEM at a concentration level equal to the RPA of 1 µg/kg; this scenario covers all
potential dietary exposure. The mean chronic dietary exposure to SEM across dietary surveys for this
scenario would range from 6.4 to 16 ng/kg b.w. per day for adults and would be the highest for
toddlers, at 17 to 55 ng/kg b.w. per day.
Reduction of the nitro group seems to be the most important metabolic pathway for nitrofurans,
potentially leading to reactive intermediates that are capable of binding to proteins and to DNA.
Nitroreduction and subsequent redox-cycling results in the generation of reactive species (including
oxygen species) that might be responsible for some of the adverse effects.
Based on studies with radiolabelled nitrofurans, high levels (mg/kg range) of metabolites are present
in tissues shortly after the last treatment. A proportion of the metabolites cannot be extracted from the
tissues with organic solvents and are assumed to be protein-bound. Levels of these residues decrease
gradually but are still detectable after 45 days in muscle, kidney and liver of treated pigs and probably
for much longer. The decrease of residues in liver and kidney is faster than in muscle tissue.
Feeding of rats with protein-bound residues of radiolabelled furazolidone showed that some of the
radiolabel was excreted in urine and so must have been absorbed in the gastrointestinal tract. The
radiolabel was also detected in tissues of rats and was partly non-extractable. AOZ could be released
by acid treatment from these non-extractable residues in rat tissues. Free AOZ was detected in blood
of rats fed with meat containing only protein-bound residues of furazolidone, showing that AOZ can
also be released from these residues, probably due to acid hydrolysis in the stomach.

Nitrofurans in food
EFSA Journal 2015;13(6):4140 4
Acute toxicity studies in laboratory animals showed that for furazolidone, nitrofurantoin and
nitrofurazone the lung is an important target for toxicity, leading to decreased respiratory function and
death. Signs of neurotoxicity such as hyperirritability, tremors and convulsions were also found.
In repeated dose toxicity studies, AOZ caused hepatotoxicity, decreased body weight gain and
anaemia at the lowest tested dose of 0.9 mg/kg b.w. per day in rats and at 1 mg/kg b.w. per day in
dogs. Nitrofurantoin caused toxic effects in liver, kidney and testes, and caused necrosis of the ovarian
follicles, decreased weight gain and neurotoxicity, with a no observed adverse effect level (NOAEL)
of about 120 mg/kg b.w. per day in rats and mice. Nitrofurazone caused similar effects as
nitrofurantoin, with the exception of necrosis of the ovarian follicles, and the NOAEL for effects on
the testes in rats was 13.5 mg/kg b.w per day. SEM caused severe deformation of limbs and
osteochondral lesions at the lowest tested dose of 23 mg/kg b.w. per day in rats. Nifursol caused slight
changes in red blood cell parameters and a NOAEL of about 14 mg/kg b.w. per day was identified.
In studies on spermatogenesis, furazolidone, furaltadone, nitrofurantoin and nitrofurazone caused toxic
effects on the testes in rats and mice but no NOAEL could be identified. Effects were observed at the
lowest dose tested of 10 mg/kg b.w. per day for nitrofurantoin.
In studies on embryotoxicity and teratogenicity, furazolidone in mice was embryotoxic at the lowest
dose tested of 200 mg/kg b.w. per day and caused decreased body weight and viability of pups after
birth, but no malformations were found. Nitrofurantoin was embryotoxic in mice and rats and caused
decreased body weight and viability of pups after birth. A NOAEL of 10 mg/kg b.w. per day was
identified for embryotoxicity in rats. Malformations were not found in offspring of rats and rabbits,
with a NOAEL of 30 mg/kg b.w. per day for teratogenicity. Nitrofurazone was not teratogenic in mice
and rabbits at doses that were not maternotoxic. For fetotoxicity/maternotoxicity an overall NOAEL of
14 mg/kg b.w. per day was identified. For SEM, in a study looking at the incidence of cleft palate and
resorptions only, an effect was found when rats were treated orally with SEM at 25 mg/kg b.w. per
day or higher, but not when treated at 10 mg/kg b.w. per day.
In multigeneration studies, nitrofurazone showed reproductive toxicity in mice for two generations at
doses of 14 to 102 mg/kg b.w. per day. Nifursol did not have any effects on reproduction in rats
treated for three generations at doses of 54 mg/kg b.w. per day or lower.
In studies on neurotoxicity, nitrofurantoin caused peripheral nerve damage in rats treated orally at the
lowest dose tested of 20 mg/kg b.w. per day. SEM caused neurobehavioural effects in juvenile rats
when treated orally at the lowest dose tested of 40 mg/kg b.w. per day for 10 days.
In genotoxicity studies, furazolidone and its marker metabolite AOZ were found to be genotoxic in
vitro and possibly also in vivo. Since AOZ can be released from bound residues of furazolidone
metabolites, these bound residues should be considered as genotoxic. Furaltadone was found to be a
bacterial and mammalian cell mutagen in vitro. The marker metabolite AMOZ is not genotoxic in
vitro. In vitro, nitrofurantoin induces mutations, chromosomal aberrations and DNA damage and, in
vivo, nitrofurantoin has been shown to induce DNA damage in multiple organs, micronuclei formation
in mice and gene mutations in a transgenic mouse mutation assay. For AHD, the only in vivo
mutagenicity study which is available shows a negative result. Nitrofurazone and its marker metabolite
SEM are genotoxic in vitro. In vivo tests gave negative results with nitrofurazone, whereas no
conclusion can be drawn on the in vivo genotoxicity of SEM. Nifursol is genotoxic in vitro, whereas in
vivo it induced neither chromosomal aberrations nor mutations.
In chronic toxicity and carcinogenicity studies, furazolidone induced malignant mammary tumours in
rats, bronchial adenocarcinomas in male and female mice and neural astrocytomas in male rats. The
CONTAM Panel concluded that furazolidone is carcinogenic in mice and rats. No information on the
carcinogenicity of AOZ, the marker metabolite of furazolidone, was identified, but it is presumed that
AOZ may play a role in tumour formation. Furaltadone induced malignant mammary tumours in
female rats. The CONTAM Panel concluded that furaltadone is carcinogenic in rats. There is no
Nitrofurans in food
EFSA Journal 2015;13(6):4140 5
information on the chronic toxicity or the carcinogenicity of AMOZ. Nitrofurantoin induced an
increase mainly in benign tumours in mice and rats, but in male rats a few malignant tumours were
found. Based on these observations, the CONTAM Panel concluded that there is limited evidence that
nitrofurantoin is carcinogenic in rats. No information on the chronic toxicity or the carcinogenicity of
AHD was identified. Nitrofurazone increased the incidence of mainly benign tumours in mice and rats
following oral administration. In male rats a non-dose related increase in carcinomas of the preputial
gland was observed. The CONTAM Panel concluded that there is no evidence for the carcinogenicity
of nitrofurazone in mice, and that evidence for its carcinogenicity in rats is equivocal. Non-neoplastic
effects of nitrofurazone were observed in a chronic toxicity study at the lowest dose tested of
14 mg/kg b.w. per day in mice (ovarian atrophy in females and reduced survival in males) and the
lowest dose tested of about 11 mg/kg b.w. per day in rats (testes degeneration). SEM increased the
incidence of malignant lung tumours, particularly in female mice. In rats, no increase in tumour
incidence was found. The CONTAM Panel concluded that there is limited evidence that SEM is
carcinogenic in mice, but not in rats. Based on effects on bones observed in a chronic toxicity study in
male rats, a NOAEL of 0.6 mg/kg per day was derived for non-neoplastic effects of SEM. For nifursol
the available chronic toxicity studies in rats and dogs did not show clear indication for carcinogenicity.
The toxicological information was too limited to derive a NOAEL for non-neoplastic effects of
nifursol. No information on the chronic toxicity or the carcinogenicity of DNSH was identified.
In relation to the mode of action, reduction of the nitro-group seems to be the key metabolic pathway
leading to reactive intermediates, including reactive oxygen species. Reactive metabolites are capable
of binding to proteins and to DNA, being thereby responsible for most of the adverse effects resulting
from exposure to nitrofurans. Only for AOZ information was identified regarding the mode of action
of the nitrofuran marker metabolites. AOZ plays a role in the inhibition of monoamine-oxidase in
animals treated with furazolidone. This may result in an increased susceptibility to neurotoxic effects
of certain biogenic amines such as tyramine. Protein binding of reactive nitrofuran metabolites may
play a role in the irreversible inhibition of the pyruvate dehydrogenase complex, another potential
mechanism underlying neurotoxic effects of nitrofurans, such as polyneuritis.
In human studies, oral administration of furazolidone and nitrofurantoin may lead to a range of
adverse reactions, particularly nausea, vomiting and abdominal pain. Both drugs have also been
associated with haemolytic anaemia observed in patients deficient in glucose-6-phosphate
dehydrogenase. The topical use of nitrofurazone may lead to allergic reactions. Epidemiological
studies are reported only for patients treated with nitrofurantoin, and associations were found for
cancers of the nervous system in adults, for drug-induced liver injury, and for increased risk of
pulmonary adverse events in patients with renal impairment.
Because most of the nitrofurans and their marker metabolites are genotoxic and/or carcinogenic,
derivation of health-based guidance values (HBGVs) is not appropriate.
In the case of furazolidone, a lower 95 % confidence limit for a benchmark response of 10 % extra risk
(BMDL10) value for bronchial adenocarcinomas in mice of 3.5 mg/kg b.w. per day (1.6 mg/kg b.w. per
day, expressed as AOZ) was selected as a reference point for carcinogenic effects. Non-neoplastic
effects of furazolidone and AOZ were found on red blood cell parameters and enzymes in blood. The
lowest BMDL was estimated for the effect of AOZ on alkaline phosphatase (ALP) (BMDL05 of
0.02 mg/kg b.w. per day). The CONTAM Panel concluded that this value can be used as reference
point for the risk characterisation for non-neoplastic effects.
For furaltadone, the CONTAM Panel concluded that the available data do not provide a suitable basis
for deriving a reference point. For AMOZ there is no information on carcinogenicity, and the limited
available data indicate that it is non-genotoxic in vitro. Therefore, the CONTAM Panel concluded that
the risk for carcinogenicity cannot be assessed. There is no information on non-neoplastic effects of
furaltadone or AMOZ that could be used for the derivation of a reference point.

Nitrofurans in food
EFSA Journal 2015;13(6):4140 6
In the case of nitrofurantoin, a BMDL10 value for osteosarcomas in male rats of 61 mg/kg b.w. per day
(29.5 mg/kg b.w. per day, expressed as AHD) was selected as a reference point for carcinogenic
effects. For non-neoplastic effects, the most sensitive endpoint for nitrofurantoin is impaired
spermatogenesis, but the available data did not allow for a BMD analysis or the derivation of a
NOAEL. Effects were observed at the lowest dose tested of 10 mg/kg b.w. per day (4.8 mg/kg b.w. per
day, expressed as AHD) and this was selected as a reference point for non-neoplastic effects. The
CONTAM Panel noted that the effects at this dose are substantial.
For nitrofurazone, no conclusion could be drawn on its possible carcinogenicity and in the case of
SEM, the available information was not suitable to derive a reference point for carcinogenic effects.
Non-neoplastic effects of nitrofurazone were found on the testes and the epididymis in rats, while for
SEM effects on bone development were observed. The lowest BMDL was estimated for the effect of
SEM on bone development (BMDL10 of 1.0 mg/kg b.w.). The CONTAM Panel concluded that this
value can be used as reference point for the risk characterisation for non-neoplastic effects.
While nifursol is genotoxic in vitro, there is no clear indication that it is carcinogenic and for DNSH
there is no information on mutagenicity/genotoxicity or carcinogenicity. For non-neoplastic effects, a
BMDL05 value for the effect of nifursol on liver weight of 11 mg/kg b.w. per day (7.3 mg/kg b.w. per
day, expressed as DNSH) was selected as reference point.
Since different critical effects are observed for the different marker metabolites, the CONTAM Panel
characterised the risk for each marker metabolite separately. For the actual exposure to nitrofuran
marker metabolites, no reliable human dietary exposure assessment could be carried out and,
therefore, the CONTAM Panel could not characterise the risk.
To evaluate whether the RPA for nitrofuran metabolites in food of animal origin is adequate to protect
public health, the CONTAM Panel considered the scenario in which foods of animal origin, excluding
milk and dairy products, are considered to contain one nitrofuran marker metabolite at a concentration
level equal to the RPA of 1 µg/kg.
For AOZ, median chronic dietary exposure across dietary surveys for the average consumer would
result in a margin of exposure (MOE) for carcinogenicity of about 2.9 × 10⁵ for toddlers and 6.2 × 10
5
for adults and an MOE for non-neoplastic effects of about 3.6 × 10³ for toddlers and 7.7 × 10
3 for
adults. The CONTAM Panel considered that for AOZ these MOEs for carcinogenicity and non-
neoplastic effects are sufficiently large and do not indicate a health concern.
For AMOZ, the CONTAM Panel could not conclude on the carcinogenicity. Given that there are no
clear indications that furaltadone is more potent than furazolidone with respect to the induction of
mammary adenocarcinomas, the CONTAM Panel concluded that the cancer risk from AMOZ, if any,
would not be greater than that from AOZ and hence does not indicate a health concern. The CONTAM
Panel could not identify a reference point for non-neoplastic effects for AMOZ.
For AHD, median chronic dietary exposure across dietary surveys for the average consumer would
result in an MOE for carcinogenicity of about 5.4 × 10⁶ for toddlers and 1.1 × 10
7 for adults and an
MOE for non-neoplastic effects of about 8.7 × 10⁵ for toddlers and 1.8 × 10
6 for adults. The
CONTAM Panel considered that for AHD these MOEs for carcinogenicity and non-neoplastic effects
are sufficiently large and do not indicate a health concern.
For SEM the cancer risk could not be assessed. For non-neoplastic effects, median chronic dietary
exposure across dietary surveys for the average consumer would result in an MOE of about 1.8 × 10⁵
for toddlers and 3.8 × 10⁵ for adults. The CONTAM Panel considered that for SEM these MOEs for
non-neoplastic effects are sufficiently large and do not indicate a health concern.
For DNSH, median chronic dietary exposure across dietary surveys for the average consumer would
result in an MOE for non-neoplastic effects of about 1.3 × 10⁶ for toddlers and 2.8 × 10
6 for adults.

Nitrofurans in food
EFSA Journal 2015;13(6):4140 7
The CONTAM Panel considered that for DNSH these MOEs for non-neoplastic effects are
sufficiently large and do not indicate a health concern.
To assess the appropriateness of applying the RPA that is considered adequate to protect public health
to other commodities than food of animal origin, the CONTAM Panel considered the scenario in
which foods of animal origin, including only those milk and dairy products for which carrageenan is
authorised as an additive, and foods of non-animal origin for which carrageenan is authorised as an
additive, are considered to be contaminated with SEM at a concentration level equal to the RPA of
1 µg/kg.
AOZ, AMOZ, AHD or DNSH have not been reported to occur in foods of non-animal origin. Only
SEM is reported to occur in food of non-animal origin due to its potential presence in the food additive
carrageenan, which is used in a large variety of foods. The food additive carrageenan may also be used
in foods of animal origin. For SEM, the cancer risk could not be assessed. For non-neoplastic effects,
median chronic dietary exposure across dietary surveys for the average consumer would result in an
MOE of about 3.4 × 10⁴ for toddlers and 1.0 × 10
5 for adults. The CONTAM Panel considered that for
SEM these MOEs for non-neoplastic effects are sufficiently large and do not indicate a health concern.
The CONTAM Panel recommends that there is need for a carcinogenicity study on SEM according to
the current guidelines and that there is need for information on the mechanisms underlying the
genotoxic and carcinogenic effects of SEM.

Nitrofurans in food
EFSA Journal 2015;13(6):4140 8
TABLE OF CONTENTS
Abstract .................................................................................................................................................... 1 Summary .................................................................................................................................................. 2 Background as provided by the European Commission ......................................................................... 10 Terms of reference as provided by the European Commission .............................................................. 11 Assessment ............................................................................................................................................. 13 1. Introduction ................................................................................................................................... 13
1.1. Previous assessments ............................................................................................................ 14 1.1.1. International and European agencies ................................................................................ 14 1.1.2. National agencies .............................................................................................................. 16
1.2. Chemical characteristics ....................................................................................................... 17 1.3. Therapeutic use of nitrofurans .............................................................................................. 20
1.3.1. Therapeutic use of nitrofurans in humans ........................................................................ 20 1.3.2. Therapeutic use of nitrofurans in livestock, horses and fish ............................................. 20
2. Legislation ..................................................................................................................................... 22 3. Methods of analysis ....................................................................................................................... 23
3.1. Sampling and storage ............................................................................................................ 23 3.2. Determination of nitrofurans and their marker metabolites .................................................. 23
3.2.1. Extraction and sample clean-up ........................................................................................ 24 3.2.2. Screening methods ............................................................................................................ 24 3.2.3. Confirmatory methods ...................................................................................................... 26
3.3. SEM analysis ........................................................................................................................ 27 3.4. Analytical quality assurance: performance criteria, reference materials and proficiency
testing .............................................................................................................................................. 28 3.5. Concluding comments .......................................................................................................... 29
4. Assessment of the appropriateness of using marker metabolites of nitrofurans for the reference
point for action for foods of animal origin ............................................................................................. 29 5. Occurrence of nitrofurans in food .................................................................................................. 30
5.1. Previously reported occurrence results ................................................................................. 30 5.1.1. Meat and meat products .................................................................................................... 30 5.1.2. Honey ............................................................................................................................... 31 5.1.3. Fish and other seafood ...................................................................................................... 31 5.1.4. Eggs .................................................................................................................................. 32
5.2. Current occurrence results .................................................................................................... 33 5.2.1. Data sources ...................................................................................................................... 33
5.2.1.1. National residue monitoring plans ........................................................................... 33 5.2.1.2. Rapid Alert System for Food and Feed .................................................................... 34
5.2.2. Distribution of samples across food categories ................................................................ 34 5.2.2.1. National residue monitoring plans ........................................................................... 34 5.2.2.2. Rapid Alert System for Food and Feed .................................................................... 37
5.3. Food processing .................................................................................................................... 39 6. Food consumption ......................................................................................................................... 40 7. Exposure assessment ..................................................................................................................... 41
7.1. Previously reported human exposure assessments ................................................................ 41 7.2. Dietary exposure to nitrofuran marker metabolites for different scenarios .......................... 41 7.3. Non-dietary exposure ............................................................................................................ 46
8. Hazard identification and characterisation .................................................................................... 46 8.1. Toxicokinetics ....................................................................................................................... 46
8.1.1. Introduction ...................................................................................................................... 46 8.1.2. Humans ............................................................................................................................. 50 8.1.3. Laboratory animals ........................................................................................................... 52 8.1.4. Biotransformation in livestock, horses and fish ............................................................... 54
8.1.4.1. Ruminants ................................................................................................................ 55 8.1.4.2. Pigs........................................................................................................................... 55

Nitrofurans in food
EFSA Journal 2015;13(6):4140 9
8.1.4.3. Poultry ...................................................................................................................... 57 8.1.4.4. Horses ...................................................................................................................... 59 8.1.4.5. Fish and other seafood ............................................................................................. 59 8.1.4.6. Concluding comments ............................................................................................. 61
8.1.5. Bioavailability of bound residues ..................................................................................... 61 8.2. Toxicity in experimental animals .......................................................................................... 63
8.2.1. Acute toxicity ................................................................................................................... 63 8.2.2. Repeated-dose toxicity ..................................................................................................... 65 8.2.3. Immunotoxicity ................................................................................................................ 71 8.2.4. Developmental and reproductive toxicity ......................................................................... 72
8.2.4.1. Studies on spermatogenesis ..................................................................................... 72 8.2.4.2. Embryotoxicity and teratogenicity ........................................................................... 75 8.2.4.3. Multigeneration studies ............................................................................................ 80
8.2.5. Neurotoxicity .................................................................................................................... 82 8.2.6. Genotoxicity ..................................................................................................................... 84 8.2.7. Chronic toxicity and carcinogenicity ................................................................................ 91
8.3. Modes of action..................................................................................................................... 99 8.4. Observations in humans ...................................................................................................... 102
8.4.1. Human pharmacological and toxicological data ............................................................. 102 8.4.2. Epidemiological data on nitrofurans ............................................................................... 106
8.5. Considerations of critical effects, dose–response modelling and possibilities for derivation
of a health-based guidance value ..................................................................................................... 107 8.5.1. Furazolidone and AOZ ................................................................................................... 108 8.5.2. Furaltadone and AMOZ .................................................................................................. 109 8.5.3. Nitrofurantoin and AHD ................................................................................................. 110 8.5.4. Nitrofurazone and SEM .................................................................................................. 111 8.5.5. Nifursol and DNSH ........................................................................................................ 112
9. Risk characterisation .................................................................................................................... 113 9.1. Evaluation whether a reference point for action of 1 µg/kg for nitrofuran metabolites as
defined in the legislation in food of animal origin is adequate to protect public health .................. 113 9.2. Assessment of the appropriateness of applying the reference point for action that is
considered adequate to protect public health to other commodities than food of animal origin ..... 117 10. Uncertainty analysis ................................................................................................................ 120 Conclusions and recommendations ...................................................................................................... 121 Documentation provided to EFSA ....................................................................................................... 128 References ............................................................................................................................................ 132 Appendices ........................................................................................................................................... 155 Appendix A. Sources of semicarbazide in food, other than those arising from nitruforazone use, and
resulting exposures ............................................................................................................................... 155 Appendix B. Occurrence data .............................................................................................................. 158 Appendix C. Consumption data ........................................................................................................... 159 Appendix D. Dietary exposure for scenario 1B ................................................................................... 161 Appendix E. Semicarbazide ................................................................................................................. 162 Appendix F. Dietary exposure for scenarios 2B and 2D ...................................................................... 173 Appendix H. In vitro and in vivo genotoxicity studies ........................................................................ 176 Appendix I. Benchmark dose analyses ................................................................................................. 189 Abbreviations ....................................................................................................................................... 214
Nitrofurans in food
EFSA Journal 2015;13(6):4140 10
BACKGROUND AS PROVIDED BY THE EUROPEAN COMMISSION
Nitrofurans are synthetic broad-spectrum antimicrobial agents used in some countries in human and
veterinary medicine. However, nitrofurans have been prohibited from use in food-producing animals
in most countries due to public health and safety concerns, particularly in relation to the carcinogenic
potential of either the parent compounds or their metabolites.
In the European Union, nitrofurans were allowed for use in veterinary medicinal products4 until 1 July
1993, when all nitrofurans were classified as prohibited substances with the exception of furazolidone.
This remained the case until 1 July 1995, when furazolidone was also reclassified as a prohibited
substance.
Nitrofurans have been evaluated on several occasions by the European Medicines Agency (EMA) and
Joint FAO/WHO Expert Committee on Food Additives (JECFA). EMA proposed that nitrofurans5
(excluding furazolidone) be classified as ‘prohibited substances’ as there was insufficient information
related to mutagenicity and carcinogenicity, while for furazolidone,6 EMA proposed to classify it as a
prohibited substance due to evidence of mutagenicity and carcinogenicity. At its 40th session, JECFA
concluded that nitrofurazone was carcinogenic but not genotoxic whereas furazolidone was
carcinogenic and genotoxic.
A minimum required performance limit (MRPL) for nitrofurans is set in European Union legislation7
for the metabolites of furazolidone, furaltadone, nitrofurantoin and nitrofurazone for poultry meat and
aquaculture products at the level of 1 µg/kg for all metabolites.
Analytically, residues are checked only for marker metabolites of the 4 nitrofuran chemicals, in
particular: 3-amino-2-oxazolidinone (AOZ) for furazolidone, 3-amino-5-methylmorpholino-2-
oxazolidinone (AMOZ) for furaltadone, 1-aminohydantoin (AHD) for nitrofurantoin and
semicarbazide (SEM) for nitrofurazone.
By virtue of Commission Decision 2005/34/EC,8 the MRPL is applicable as a reference point for
action (RPA) in products of animal origin imported from third countries irrespective of the matrix
tested: all food of animal origin containing residues9 (at or above the RPA of 1 µg/kg is considered
non-compliant and removed from the food chain (destruction, re-dispatch, recall). Confirmed findings
below the RPA, indicating a recurrent pattern, also trigger specific actions directed towards the third
countries of origin.
A similar approach,10
including possible enforcement actions, applies to food of animal origin
produced within the Union, as laid down in Directive 96/23/EC. The two above provisions are
confirmed by Regulation (EC) No 470/2009.
As regards SEM, it has repeatedly been demonstrated or claimed that its presence can be caused by
other sources than nitrofurazone treatments. Its presence in packaged food has been attributed in the
4 Nitrofurans were classified as ‘All substances belonging to the nitrofuran group’ with marker residue ‘All residues with the
intact 5 nitro structure’ for all food-producing animals with a maximum residue limit (MRL) of 5 µg/kg for the target
tissues muscle, liver, kidney and fat. The MRL applied to the total residues for all substances within this group. 5 Nitrofurans Summary Report—Committee for Veterinary Medicinal Products. Available online: http://www.ema.
europa.eu/docs/en_GB/document_library/Maximum_Residue_Limits_-_Report/2009/11/WC500015183.pdf 6 Furazolidone summary report—Committee for Veterinary Medicinal Products. Available online: http://www.ema.
europa.eu/docs/en_GB/document_library/Maximum_Residue_Limits_-_Report/2009/11/WC500014332.pdf 7 Commission Decision 2002/657/EC implementing Council Directive 96/23/EC concerning the performance of analytical
methods and the interpretation of results. OJ L 221, 17.8.2002, p. 8. 8 Commission Decision 2005/34/EC laying down harmonised standards for the testing for certain residues in products of
animal origin imported from third countries. OJ L 1, 20.1.2005, p. 6. 9 Expressed as the sum of the four nitrofurans’ marker metabolites. 10 SANCO -E.2(04)D/521927. Available online: http://ec.europa.eu/food/committees/regulatory/scfcah/controls_imports/
summary35_en.pdf

Nitrofurans in food
EFSA Journal 2015;13(6):4140 11
past to the use of azodicarbonamide as a blowing agent used to foam the plastic gaskets in the metal
lids of jars and bottles. However, this use of azodicarbonamide is no longer permitted in the EU.
Presence of SEM could also be possible due to the use of azodicarbonamide as a flour treatment agent
(dough improver) in bread production, however, such use is also not permitted in the EU. SEM can
also result as a reaction product of hypochlorite with some food additives (e.g. carrageenan) with some
foods (such as egg white powder). Natural background levels, formation during drying of certain
foods, as well as unidentified sources are often cited as possible reason for detection of SEM in food
commodities (e.g. certain crayfish, seaweed, eggs, whey and certain varieties of honey).
In analysis of food of animal origin, this has led – where possible – to the introduction of washing
steps in the analytical techniques in order to detect only tissue bound molecules, as only these are
considered indicative for illegal treatment.
Findings of nitrofurans
From 2000 onwards, nitrofurans have been the subject of more than 700 messages in the Rapid Alert
System for Food and Feed. For the different marker metabolites, reported levels ranged from 0.1–
1 200 µg/kg for AOZ (282 messages), 0.3–140 µg/kg for AMOZ (97 messages), 0.3–40 µg/kg for
AHD (6 messages) and from 0.37–7 500 µg/kg for SEM (351 messages).
Commodities reported as containing residues of nitrofurans were: crustaceans and products thereof
(482), poultry meat and poultry meat products (150), fish and fish products (54), meat other than
poultry and derived products (46), honey and royal jelly (20), eggs and egg products (13), food
additives and flavourings (2) and prepared dishes and snacks (1).
Safeguard measures11
have been adopted for a number of food commodities originating from several
third countries. Only once the import checks have demonstrated that all consignments are compliant
the safeguard measures could be lifted or no longer prolonged.
Article 19 (2) of Regulation (EC) No 470/2009 states that the Commission shall, where appropriate,
submit a request to EFSA for a risk assessment as to whether the reference points for action are
adequate to protect human health.
TERMS OF REFERENCE AS PROVIDED BY THE EUROPEAN COMMISSION
The Commission requests EFSA in accordance with Article 29 of Regulation (EC) No 178/2002 for a
scientific opinion on the risks to human health related to the presence of nitrofurans and their
metabolites in food.
In particular this opinion should comprise the:
a) evaluation of the toxicity of nitrofurans and their metabolites for humans, considering all
relevant toxicological endpoints and identification of the toxicological relevance of nitrofurans
and their metabolites present in food;
b) exposure of the EU population to nitrofurans and their metabolites from food, including the
consumption patterns of specific (vulnerable) groups of the population;
c) assessment of the appropriateness of using marker metabolites of nitrofurans for the reference
point for action for food of animal origin;
11 For example: Commission Decision 2008/630/EC on emergency measures applicable to crustaceous imported from
Bangladesh and intended for human consumption (OJ L 205, 1.8.2008, p. 49); Commission Decision 2002/994/EC
concerning certain protective measures with regard to the products of animal origin imported from China (OJ L 348,
21.12.2002, p. 154); Commission Decision 2010/381/EU on emergency measures applicable to consignments of
aquaculture products imported from India and intended for human consumption (OJ L 174, 9.7.2010, p. 51).
Nitrofurans in food
EFSA Journal 2015;13(6):4140 12
d) evaluation whether a reference point for action of 1 µg/kg for nitrofuran metabolites as
defined in legislation in food of animal origin is adequate to protect public health;
e) assessment of the appropriateness of applying the reference point for action considered
adequate to protect public health to other commodities than food of animal origin.
Nitrofurans in food
EFSA Journal 2015;13(6):4140 13
ASSESSMENT
1. Introduction
Nitrofurans are synthetic chemotherapeutic agents with a broad antimicrobial spectrum, including
Gram-positive and Gram-negative bacteria and protozoa. Nitrofurans are bacteriostatic but, at high
doses, their action may also be bactericidal. Structurally, the essential component of nitrofurans is a
furan ring with a nitro-group, and the latter is a requisite for antimicrobial activity. Nitrofurans are
very effective antimicrobial agents that, prior to their prohibition for use in food-producing animals in
the European Union (EU), were widely used in livestock (cattle, pigs and poultry), aquaculture and
bees.
The nitrofurans considered in this opinion are furazolidone, furaltadone, nitrofurantoin,
nitrofurazone (also known as nitrofural or Furacilin) and nifursol. In the case of furazolidone,
furaltadone, nitrofurantoin and nitrofurazone, these are the nitrofurans specifically listed in Annex II
to Commission Decision 2002/657/EC12
for the metabolites for which a minimum required
performance limit (MRPL) of 1 µg/kg is specified. Nifursol is also included in this opinion because of
its former widespread use as an additive in feedingstuffs for turkeys for the prevention of ‘blackhead
disease’ (histomoniasis).
In human medicine, furazolidone, nitrofurantoin and nitrofurazone are still used (see Section 1.3.1). In
veterinary medicine, nitrofurans are no longer authorised for use in food-producing animals in the EU
because no acceptable daily intake (ADI) could be established owing to positive results in genotoxicity
testing. Nitrofurans are also not allowed to be used in food-producing animals in countries such as the
USA, Australia, the Philippines, Thailand and Brazil.
Nitrofurans share a nitrofuran ring but have different side-chains (such as 3-amino-2-oxazolidinone in
the case of furazolidone), connected via a so-called azomethine bond. A characteristic of nitrofurans is
the short half-life of the parent compounds due to extensive metabolism, primarily a reduction of the
nitro-group, such that they do not occur generally as residues in foods of animal origin. This
nitroreduction results in the formation of reactive metabolites able to bind covalently to tissue
macromolecules, including proteins. In food-producing animals, these metabolites have a relatively
long half-life. When such animal tissues are consumed as food, side-chains may be released from
these metabolites under the acidic conditions of the human stomach, namely 3-amino-2-oxazolidinone
(AOZ) from the metabolites of furazolidone, 3-amino-5-methylmorpholino-2-oxazolidinone (AMOZ)
from the metabolites of furaltadone, 1-aminohydantoin (AHD) from the metabolites of nitrofurantoin,
semicarbazide (SEM) from the metabolites of nitrofurazone and 3,5-dinitrosalicylic acid hydrazide
(DNSH) from the metabolites of nifursol. These released side-chains of nitrofuran metabolites have
the potential to be carcinogenic and mutagenic. In principle, the side-chains can also be released
during acid hydrolysis from the parent compounds and other metabolites. This implies that the side-
chains are potential metabolites themselves following hydrolysis of the parent compound in the
stomach, but this has been demonstrated only for pigs treated with furazolidone. Free AOZ was also
detected in rats fed with protein-bound residues of furazolidone. The side-chains are also excellent
marker metabolites for the presence of protein-bound residues following sample treatment with acid
and derivatisation with nitrobenzaldehyde.
The European Food Safety Authority (EFSA) scientific opinion entitled ‘Guidance on methodological
principles and scientific methods to be taken into account when establishing Reference Points for
Action (RPAs) for non-allowed pharmacologically active substances present in food of animal origin’
(EFSA CONTAM Panel, 2013) identified an approach based on both analytical and toxicological
considerations for establishing RPAs for various categories of non-allowed pharmacologically active
substances. However, the opinion also identified certain categories of non-allowed pharmacologically
active substances for which toxicological screening values based on the procedure described might not
12 Commission Decision 2002/657/EC implementing Council Directive 96/23/EC concerning the performance of analytical
methods and the interpretation of results. OJ L 221, 17.8.2002, p. 8–36.
Nitrofurans in food
EFSA Journal 2015;13(6):4140 14
be sufficiently health protective and such substances are considered to be outside the scope of the
procedure. Such substances include those causing blood dyscrasias (such as aplastic anaemia) or
allergy, or which are high-potency carcinogens. As the side-chains of nitrofurans are hydrazines and
are as such considered as potential high-potency carcinogens, a specific risk assessment is required.
The scope of this opinion is primarily directed at nitrofurans and their metabolites, in accordance with
the Commission request ‘for a scientific opinion on the risks to human health related to the presence of
nitrofurans and their metabolites in food’. However, to adequately address the issue of ‘assessment of
the appropriateness of applying the reference point for action considered adequate to protect public
health to other commodities than food of animal origin’ (see Terms of Reference), consideration of the
potential occurrence of SEM in food, from a variety of sources other than as a metabolite of
nitrofurazone, is included in the opinion (Appendix A). For this purpose, the concentrations of SEM in
food and dietary exposure calculated by the EFSA Scientific Panel on Food Additives, Flavourings,
Processing Aids and Materials in Contact with Food (AFC Panel) in its opinion on SEM (EFSA,
2005)—updated by changes in regulations such as the subsequent prohibition of certain uses of
azodicarbonamide in food and new information on SEM, particularly relating to its occurrence in food
products from use of the food additive carrageenan—are considered.
1.1. Previous assessments
Nitrofurans have been the subject of several previous assessments by international, European and
national organisations.
1.1.1. International and European agencies
At its 40th meeting, the Joint FAO/WHO Expert Committee on Food Additives (JECFA) evaluated
furazolidone and nitrofurazone.
Based on the positive results of furazolidone in genotoxicity tests in vitro and the increased incidence
of malignant tumours in mice and rats, JECFA concluded that furazolidone is a substance that is
genotoxic and carcinogenic. Owing to the genotoxic and carcinogenic nature of furazolidone, and the
lack of sufficient data on the nature and toxic potential of the bound residues, JECFA was unable to
establish an ADI (FAO/WHO, 1993a). As a result, JECFA could not recommend a maximum residue
limit (MRL). The residue data were insufficient to identify a marker residue and insufficient
information was available on the quantity and nature of the total residues (FAO/WHO, 1993c, e).
Nitrofurazone caused benign tumours that were restricted to endocrine organs and the mammary
gland. Nitrofurazone is genotoxic in vitro but not in vivo. From these data, JECFA concluded that
nitrofurazone is a secondary carcinogen causing effects in endocrine-responsive organs by a
mechanism that remains to be elucidated. Effects on steroidogenesis may be involved in the process of
tumour development. No ADI could be established because a no-effect level had not been identified
for the tumorigenic effects. JECFA noted that the lowest dose tested of 11 mg/kg body weight (b.w.)
per day caused a high incidence of testicular degeneration in a 2-year carcinogenicity study. Moreover,
no study on reproductive performance was available. A no-effect level could also not be identified for
the degenerative changes in the joints of rats (FAO/WHO, 1993b). JECFA could not recommend an
MRL because no ADI was established. Furthermore, the residue data were insufficient to identify a
marker residue and insufficient information was available on the quantity and nature of the total
residues (FAO/WHO, 1993d, f).
The International Agency for Research on Cancer (IARC) evaluated furazolidone in 1983, furaltadone
in 1974, nitrofurantoin in 1990, nitrofurazone in 1974 and 1990, and SEM hydrochloride in 1976.
Data on the carcinogenicity of furazolidone in experimental animals were not available for
evaluation. In the absence of epidemiological data, no evaluation of the carcinogenicity of
furazolidone in humans could be made and the IARC concluded that furazolidone is not classifiable as
regards its carcinogenicity to humans (group 3) (IARC, 1983, 1987). Furaltadone caused mammary
carcinomas and lymphoblastic lymphomas in rats following oral administration of its hydrochloride.

Nitrofurans in food
EFSA Journal 2015;13(6):4140 15
No case reports or epidemiological studies were available (IARC, 1974). Based on this information,
the IARC concluded that furaltadone is possibly carcinogenic to humans (group 2B) (IARC, 1987).
For the evaluation of the carcinogenicity of nitrofurantoin, only limited evidence was available in
experimental animals and inadequate evidence in humans. The IARC concluded that nitrofurantoin is
not classifiable as to its carcinogenicity in humans (group 3) (IARC, 1990a). During its most recent
evaluation of nitrofurazone, the IARC concluded that only limited evidence was available for its
carcinogenicity in experimental animals and inadequate evidence in humans. The IARC concluded
that nitrofurazone is not classifiable as to its carcinogenicity in humans (group 3) (IARC, 1990b).
SEM hydrochloride caused angiomas, angiosarcomas and lung tumours in mice after oral
administration. Therefore, the IARC concluded that SEM hydrochloride is carcinogenic in mice after
oral administration. No human data (case reports or epidemiological studies) were available (IARC,
1976). The IARC concluded that SEM hydrochloride is not classifiable as regards its carcinogenicity
in humans (group 3), as no adequate data were available for humans and limited evidence was
available for experimental animals (IARC, 1987).
The Scientific Committee on Animal Nutrition (SCAN) evaluated the use of furazolidone,
nitrofurazone and bifuran (furazolidone + nitrofurazone) in feedingstuffs (SCAN, 1977). The
Committee identified numerous data gaps concerning methods of analysis, metabolism,
carcinogenicity and mutagenicity. It was concluded that, in the absence of additional data, the use of
furazolidone, nitrofurazone and bifuran as feed additives should be prohibited.
In 1982, the SCAN evaluated the use of nifursol in feedingstuffs for turkeys. Nifursol showed some
hepatotoxic effects in a chronic feeding study in rats, but no carcinogenicity was observed. In rats, no
reproductive toxicity was observed in a three-generation study. From these long-term studies, a no-
effect level of 400 mg/kg feed was identified. Mutagenicity studies in several strains of Salmonella
enterica subsp. enterica serovar Typhimurium were negative. No embryotoxicity/teratology studies
were available. Fertility and hatchability of eggs were not affected by a 4-month exposure to 75 mg
nifursol/kg feed. Based on the available information, the Committee concluded that the use of nifursol
as an additive in feedingstuffs for turkeys at a level of 50–75 mg/kg could be maintained, subject to a
withdrawal period of 5 days before slaughter (SCAN, 1982). In 2001, the use of nifursol as a feed
additive was re-evaluated. Based on the available data, no conclusion could be drawn regarding the
genotoxicity of nifursol. The available data did not give a clear indication of any tumorigenicity from
nifursol. However, owing to the shortcomings of the study and limited reporting, the Committee
indicated that this conclusion should be regarded as provisional. In addition, the Committee noted the
non-conclusive results of a chronic toxicity study in dogs, the lack of data on developmental toxicity
and that only one metabolic route is common between turkeys and rats. It was concluded that no ADI
could be established. The human exposure to nifursol residues (including metabolites) could not be
determined because of a lack of data. Overall, it was concluded that the safety of nifursol for the
human consumer cannot be ensured (SCAN, 2001). In 2003, additional studies on mutagenicity and
residues became available. However, the data did not allow the Committee to conclude that nifursol is
non-genotoxic in vivo. It was reiterated that no ADI could be established. The new residue studies did
not allow the human exposure to nifursol residues (including metabolites) to be determined. The
SCAN reiterated the conclusion that the safety of nifursol for human consumers cannot be ensured
(SCAN, 2003).
The Committee for Veterinary Medicinal Products (CVMP) of the European Agency for the
Evaluation of Medicinal Products (EMEA; now the European Medicines Agency (EMA)) published
an evaluation of nitrofurans in 1996. Owing to the lack of sufficient data for nitrofurazone,
nitrofurantoin and furaltadone, the CVMP recommended that these nitrofurans be included in
Annex IV of council regulation (EEC) No 2377/90, which is the ‘list of pharmacologically active
substances for which no maximum levels can be fixed’. Because industry was planning further
toxicological studies for furazolidone, the provisional MRL was retained until the following
evaluation (EMA, 1996). After this evaluation, new data on mutagenicity, subchronic toxicity, residue
depletion, bioavailability of residues and residue analysis were submitted by industry for
furazolidone. Based on this new information, the CVMP concluded that a no-observed-effect-level

Nitrofurans in food
EFSA Journal 2015;13(6):4140 16
(NOEL) could not be established and that AOZ is mutagenic in all investigated test systems. It was
noted that furazolidone itself is mutagenic and carcinogenic in mice and rats. Total residues were in
the mg/kg range in all edible tissues. Bound residues were shown to be bioavailable in rats fed with
meat from furazolidone-treated pigs that were slaughtered 45 days after the last treatment. AOZ could
be released from the bound residues in pig liver, even after 45 days. Therefore, the CVMP proposed
that furazolidone also be included in Annex IV of Council Regulation (EEC) No 2377/90 (EMA,
1997).
SEM can be present in food from different sources (see Section 3.3 and Appendix A). The AFC Panel
issued preliminary advice on SEM in packaged foods in July and October 2003. In 2005, the AFC
Panel assessed the risk posed by SEM in all types of food. The AFC Panel concluded that SEM is
mutagenic but not clastogenic in some test systems in vitro, notably in the absence of an exogenous
metabolising system. However, the weak genotoxicity exerted by SEM in vitro is not expressed in
vivo. SEM has been shown to be carcinogenic in mice, but not in rats. The AFC Panel concluded that
SEM is a weak non-genotoxic carcinogen for which a threshold mechanism can be assumed. A large
margin of at least five orders of magnitude exists between the dose causing tumours in experimental
animals and human exposure. The AFC Panel therefore concluded that the issue of carcinogenicity is
not of concern for human health at the concentrations of SEM encountered in food (EFSA, 2005).
1.1.2. National agencies
In 2002, the German Federal Institute for Consumer Health Protection and Veterinary Medicine
(BgVV) evaluated the findings of positive nitrofuran metabolites in poultry, shrimps and rabbits. In its
statement, BgVV concluded that, based on the available data, an estimation of human dietary exposure
to nitrofuran metabolites was not feasible. In addition, a no-observed-adverse-effect level (NOAEL)
could not be established and information on dose–response relationships was insufficient. Therefore,
BgVV could not perform a risk assessment; however, it stated that a health risk, especially through
repeated consumption of food containing nitrofuran metabolites, cannot be excluded (BgVV, 2002).
The National Institute for Public Health and Environment (RIVM; Rijksinstituut voor
Volksgezondheid en Milieu) in 2003 evaluated the risk of furazolidone occurrence in shrimps. AOZ
had been detected in shrimps at a concentration of 5 µg/kg. The RIVM concluded that furazolidone is
genotoxic and carcinogenic and that, therefore, no ADI could be established. AOZ is genotoxic, but no
carcinogenicity studies were available. However, it was assumed that AOZ is involved in the
carcinogenicity of furazolidone and that, as such, AOZ is also genotoxic and carcinogenic. Based on
tumour incidences in rats and mice reported by JECFA (FAO/WHO, 1993a), a virtual safe dose
(VSD)13
of 50 ng/kg b.w. per day was derived. Because AOZ and not furazolidone was analysed in the
shrimp samples, the ratio of the molecular weights of AOZ and furazolidone (2.2) was used to convert
the AOZ concentration of 5 µg/kg into the furazolidone concentration of 11 µg/kg. Based on a mean
shrimp consumption of 8.4 g per week, the exposure was estimated to be 0.22 ng furazolidone/kg b.w.
per day for a 60-kg person. The margin of safety between the exposure and the VSD was about 200,
and the risk to public health of such an exposure was considered nil (RIVM, 2003).
Food Standards Australia New Zealand (FSANZ) in 2004 assessed the risk of nitrofurans in prawns. It
was noted that furazolidone induces malignant tumours in rats at doses of 25 mg/kg b.w. per day.
Therefore, furazolidone was considered a potential carcinogen in humans. However, insufficient data
were available to conclude that tumour formation is initiated through a genotoxic mechanism and it
remained unclear if a threshold mechanism can be assumed. Owing to the lack of data, FSANZ
assumed that the toxicity of AOZ is the same as the toxicity of furazolidone. FSANZ estimated the
exposure to AOZ from prawns. Based on a mean consumption of prawns of 75 g per day and a high
consumption (95th percentile) of 250 g per day, and the lower- (LB) and upper-bound (UB) mean
concentrations of AOZ in prawns, dietary exposure was estimated to range between 0.9 and 1.9 ng/kg
b.w. per day for consumers of the mean level and between 3.0 and 6.4 ng/kg b.w. per day for high-
level consumers. The margin of exposure (MOE) between the dose of furazolidone causing tumours in
13 The dose estimated to be associated with an additional lifetime cancer risk of 1 in 106.

Nitrofurans in food
EFSA Journal 2015;13(6):4140 17
experimental animals and the dietary exposure to AOZ from prawns ranged between 4.2 × 10⁶ and
25 × 106. The risk was also characterised by comparing the dietary exposure with the ADI (0.4 µg/kg
b.w.) that had previously been established in Australia. Using the highest exposure calculated, the
exposure is 1.5 % of the ADI. The nitrofuran marker metabolites AMOZ, AHD and SEM were not
included in the risk assessment because of the low prevalence of these marker metabolites in prawn
samples, the lack of toxicological data on furaltadone and AMOZ, and the lower carcinogenic
potential of nitrofurazone than of furazolidone. FSANZ concluded that the public health risk from
nitrofuran residues in prawns is very low (FSANZ, 2004).
1.2. Chemical characteristics
Furazolidone14
(3-{(E)-[(5-nitro-2-furyl)methylene]amino}-1,3-oxazolidin-2-one; Chemical
Abstracts Service (CAS) No 67-45-8; Figure 1) consists of odourless yellow crystals with the
molecular formula C8H7N3O5 and a molecular weight of 225.16 g/mol. It darkens under strong light.
Furazolidone decomposes at 256–257 °C. Its solubility in water at pH 6 is 40 mg/L. The octanol/water
partition coefficient (log Kow) is –0.04 and the vapour pressure is 2.6 10–6
mmHg at 25 °C. Henry’s
law constant is estimated to be 3.3 10–11
atm-m3/mol at 25 °C.
Furazolidone can be hydrolysed at low pH to AOZ (3-amino-2-oxazolidinone, C3H6N2O2, molecular
weight 102.09 g/mol, Figure 1) (see Section 8.1). However, AOZ, as a side-chain, will also be present
in metabolites, including protein-bound residues, from which it can be released by acid treatment.
Therefore, AOZ is regarded as the marker residue in food analysis.
Furaltadone14
(5-(4-morpholinylmethyl)-3-{(E)-[(5-nitro-2-furyl)methylene]amino}-1,3-oxazolidin-
2-one; CAS No 139-91-3; Figure 1) consists of odourless yellow crystals with the molecular formula
C13H16N4O6 and a molecular weight of 324.29 g/mol.
Furaltadone decomposes at 206 °C. Its solubility in water is 750 mg/L. The log Kow is 0.25 and the
vapour pressure is 2.9 10–9
mmHg at 25 °C. Henry’s law constant is estimated to be 1.46 10-16
atm-
m3/mol at 25 °C.
Furaltadone can be hydrolysed at low pH to AMOZ (3-amino-morpholinomethyl-2-oxazolidinone,
C8H15N3O3, molecular weight 201.22 g/mol, Figure 1) (see Section 8.1). However, AMOZ, as a side-
chain, will also be present in metabolites, including protein-bound residues, from which it can be
released by acid treatment. Therefore, AMOZ is regarded as the marker residue in food analysis.
Nitrofurantoin14
(1-{(E)-[(5-nitro-2-furyl)methylene]amino}-2,4-imidazolidinedione; CAS No 67-
20-9; Figure 1) consists of orange-yellow needles with the molecular formula C8H6N4O5 and a
molecular weight of 238.16 g/mol.
Nitrofurantoin decomposes at 270–272 °C. Its solubility in water is 80 mg/L. The log Kow is –0.47 and
the vapour pressure is 2.8 10–10
mmHg at 25 °C. Henry’s law constant is estimated to be
1.33 10-12
atm-m3/mol at 25 °C.
Nitrofurantoin can be hydrolysed at low pH to AHD (1-aminohydantoin, C3H5N3O2, molecular weight
115.09 g/mol, Figure 1) (see Section 8.1). However, AHD, as a side-chain, will also be present in
metabolites, including protein-bound residues, from which it can be released by acid treatment.
Therefore, AHD is regarded as the marker residue in food analysis.
Nitrofurazone14
(2-(E)-[(5-nitro-2-furyl)methylene]hydrazinecarboxamide; CAS No 59-87-0; Figure
1) consists of pale-yellow needles with the molecular formula C6H6N4O4 and a molecular weight of
198.14 g/mol. It darkens after prolonged exposure to light.
14 The main chemical characteristics were taken from the Merck Index, ChemSpider and the Toxnet databases ChemIDplus
and HSDB.

Nitrofurans in food
EFSA Journal 2015;13(6):4140 18
Nitrofurazone decomposes at 236–240 °C. Its solubility in water is 210 mg/L. The log Kow is 0.23 and
the vapour pressure is 4.31 10–6
mmHg at 25 °C. Henry’s law constant is estimated to be
3.1 10-13
atm-m3/mol at 25 °C.
Nitrofurazone can be hydrolysed at low pH to SEM (semicarbazide, CH5N3O, molecular weight
75.08 g/mol, Figure 1) (see Section 8.1). However, SEM, as a side-chain, will also be present in
metabolites, including protein-bound residues, from which it can be released by acid treatment.
Therefore, SEM is regarded as the marker residue in food analysis.
Nifursol14
(2-hydroxy-3,5-dinitro-N-[(E)-(5-nitro-2-furyl)methylene]benzohydrazide; CAS No
16915-70-1; Figure 1) is a yellow solid with the molecular formula C12H7N5O9 and a molecular weight
of 365.21 g/mol.
Nifursol decomposes at 215–220 °C. The log Kow is estimated to be 2.48. Using this value, the water
solubility was estimated to be 38 mg/L. Henry’s law constant is estimated to be 1.21 10–14
atm-
m3/mol at 25 °C (EPISuite, ChemSpider).
Nifursol can be hydrolysed at low pH to DNSH (3,5-dinitrosalicylic acid hydrazide, C7H6N4O6,
molecular weight 242.15 g/mol, Figure 1) (see Section 8.1). However, DNSH, as a side-chain, will
also be present in metabolites, including protein-bound residues, from which it can be released by acid
treatment. Therefore, DNSH is regarded as the marker residue in food analysis.
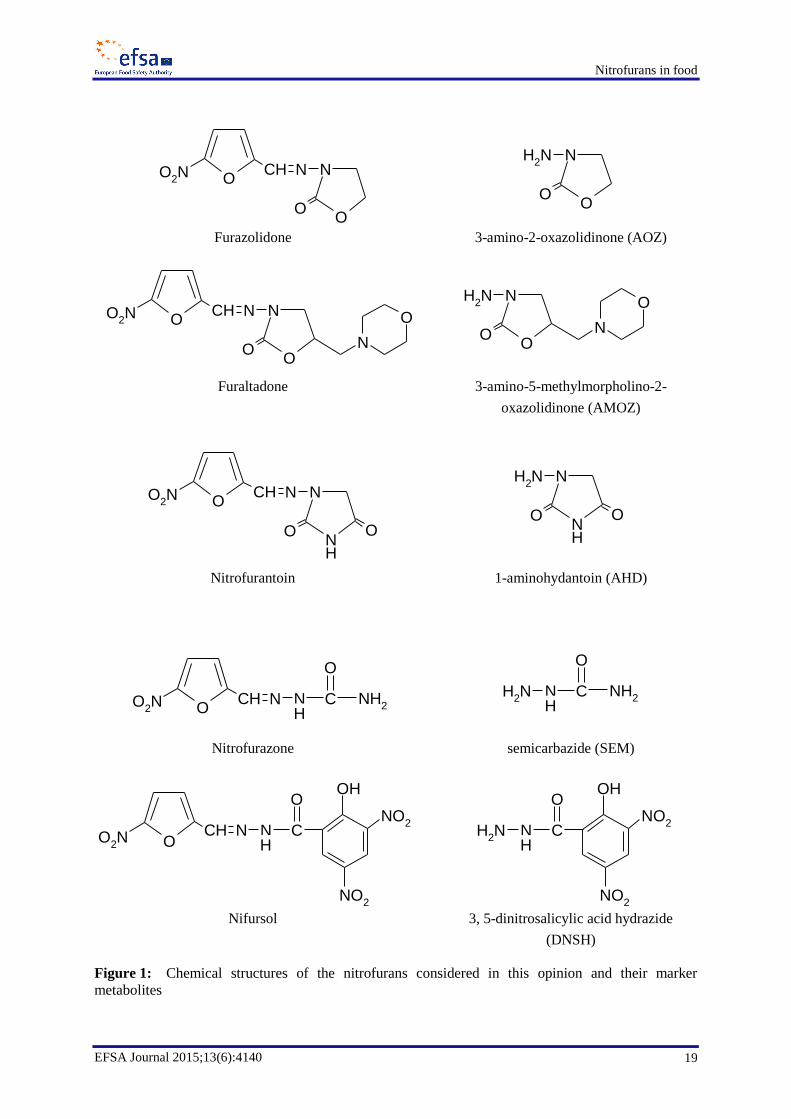
Nitrofurans in food
EFSA Journal 2015;13(6):4140 19
Furazolidone 3-amino-2-oxazolidinone (AOZ)
Furaltadone 3-amino-5-methylmorpholino-2-
oxazolidinone (AMOZ)
Nitrofurantoin 1-aminohydantoin (AHD)
Nitrofurazone semicarbazide (SEM)
Nifursol 3, 5-dinitrosalicylic acid hydrazide
(DNSH)
Figure 1: Chemical structures of the nitrofurans considered in this opinion and their marker
metabolites
O
NNOO
2N CH
O O
NNH2
O
O
NNOO
2N CH
O N
O
O
NNH2
O N
O
NH
NNOO
2N CH
O O NH
NNH2
O O
N CNOO
2N CH
O
NH2
H
N C
O
NH2
NH2
H
OO2N NCH N C
ONO
2
OH
NO2
HN C
O
NH2
NO2
OH
NO2
H

Nitrofurans in food
EFSA Journal 2015;13(6):4140 20
1.3. Therapeutic use of nitrofurans
1.3.1. Therapeutic use of nitrofurans in humans
Furazolidone has antiprotozoal and antibacterial activity. Furazolidone is bactericidal and appears to
act by interfering with bacterial enzyme systems. Resistance is reported to be limited. It is used in the
treatment of giardiasis and cholera. Owing to its low cost and low rate of primary Helicobacter pylori
resistance, the World Gastroenterology Organisation recommends its use against H. pylori infections
in developing countries (Hunt et al., 2011; Zullo et al., 2012). Furazolidone is available in some EU
countries. It may be given orally at a dose of 100 mg four times daily (EMA personal communication,
2015). It is usually given for 2 to 5 days. For the treatment of giardiasis, cholera and other diarrhoeal
diseases caused by susceptible organisms, children and infants from 1 month of age might be given
oral furazolidone at a dose of 1.25 to 1.5 mg/kg b.w. four times daily for 2 to 5 days normally
(Brayfield, 2014).
Furaltadone was formerly given orally as an antibacterial agent but was later withdrawn owing to its
toxic effects (Brayfield, 2014).
Nitrofurantoin is used in the treatment of uncomplicated lower urinary tract infections, including
prophylaxis, or for long-term suppressive therapy in recurrent infection. It is given orally at a usual
dose of 50 to 100 mg four times daily (Brayfield, 2014).
In the past, formulations were used with micro- and/or macrocrystalline nitrofurantoin (see also
Section 8.1.2; Cunha, 1988; D’Arcy, 1985; Brumfitt and Hamilton-Miller, 1998). Nowadays,
macrocrystalline nitrofurantoin is mostly used. A common long-term prophylactic dose is 50 to
100 mg at bedtime (Brayfield, 2014).
Contraindications
Nitrofurantoin should not be given to patients with renal impairment, as antibacterial concentrations in
the urine may not be attained and toxic concentrations in the plasma can occur. Nitrofurantoin is also
contraindicated in patients known to be hypersensitive to nitrofurans, in those with glucose-6-
phosphate dehydrogenase (G6PD) deficiency, and in infants (in the UK it is contraindicated below 3
months of age, although the USA permits use from 1 month of age) (Brayfield, 2014).
Nitrofurazone has a broad spectrum of antibacterial and antitrypanosomal activity. Nitrofurazone is
used topically for wounds, burns and skin infections. It is usually applied at a concentration of 0.2 %
in a water-soluble or water-miscible basis (Brayfield, 2014). Nitrofurazone is also available in
ointments and cutaneous powders at a concentration of 0.2 % (2 mg/g) (EMA personal
communication, 2015).
Nifursol has not been used in human medicine (Brayfield, 2014).
In short, furazolidone and nitrofurantoin may be used orally. Furazolidone is used for certain
gastrointestinal infections and cholera. Nitrofurantoin is mainly used to treat urinary tract infections
and for long-term prophylaxis of urinary tract infections. Nitrofurazone is used topically for wounds,
burns and skin infections.
1.3.2. Therapeutic use of nitrofurans in livestock, horses and fish
The use of nitrofurans for animal production (including fish) was prohibited in the EU because of
concerns about their carcinogenicity and potential harmful effects on human health. The use of
nitrofurans in food-producing animals is also not allowed in countries such as the USA, Australia, the
Philippines, Thailand and Brazil (Khong et al., 2004). Previously, they had been widely used in the
prophylactic and therapeutic treatment of infections caused by bacteria and protozoa mainly affecting
Nitrofurans in food
EFSA Journal 2015;13(6):4140 21
the gastrointestinal or the urinary tracts of swine, cattle, poultry and rabbits. Nifursol was commonly
used as a feed additive in turkeys (Vass et al., 2008c).
In certain third countries, nitrofurans may be applied to prevent or control a number of bacterial fish
diseases (e.g. edwardsiellosis, vibriosis, branchiomycosis, columnaris and tail rot disease) and
bacterial shell disease, appendage rot, septicaemias, bacterial fouling, gill diseases and necrotic
hepatopancreas of shrimps (Liao et al., 2000). Limited data are available on the specific types and
amounts of antibiotics used in aquaculture. The Food and Agriculture Organization (FAO) have
compiled a list of antibiotics that are potentially used in aquaculture facilities throughout the world
(26 different antibiotics, including nitrofurans); however, specific data on actual antibiotic usage were
not available (FAO, 2005). To investigate global antibiotic usage in aquaculture, Sapkota et al. (2008)
compiled country-specific data for the top 15 aquaculture-producing countries during the period 1990–
2007, which together accounted for 94 % of global aquaculture production; according to this paper,
furazolidone was used in China, the Philippines, Chile, Norway and Taiwan.
Aside from the ban on the use in food-producing species, their therapeutic application has been limited
by a number of adverse effects in target species (Huber, 1982).
Furazolidone has been administered to chickens, turkeys and swine for the control of various
digestive infections, especially salmonellosis and coccidiosis. Furazolidone has been widely used as an
antibacterial and antiprotozoal feed additive for poultry, cattle and farmed fish in China (Hu et al.,
2007). For poultry, it was administered in the feed at a concentration of 0.04 % for 10 days, while in
large animals it was given orally at doses of 10–12 mg/kg b.w. for 5–7 days (Brander et al., 1991). In a
more recent study by Chadfield and Hinton (2003), the inclusion of lower levels of furazolidone
(200 mg/kg) in broiler chick feed was unsuccessful in treating already established Salmonella enterica
subsp. enterica serovar Enteritidis infections; by contrast, furazolidone administration at the same dose
regime 1 week prior to challenge with the same bacterial strains and continuous dosing for a further
week prevented bacterial colonisation of the intestine, liver and spleen. Therapeutic schedules for fish
and shrimp diseases were 10 mg/L baths for 1 day or 10 mg/kg b.w. daily by oral administration for 3–
6 days (Liao et al., 2000). Furazolidone is well absorbed by fish, and has typically been administered
as medicated feed, unlike most nitrofurans, which are poorly absorbed from the gastrointestinal tract
(Park et al., 2012). The most used nitrofuran in salmon farming in Norway was furazolidone. The
quantity of furazolidone sold annually for treating farmed fish in Norway varied between 0 and
15 840 kg from 1980 to 1993 (the maximum quantity sold was in 1987 (Grave et al., 1990, 1996).
From 1994, the use of furazolidone for salmon was prohibited in Norway.
Furaltadone has been primarily used for the treatment of enteric diseases of poultry (salmonellosis,
colibacillosis, coccidiosis, histomoniasis) at a dose of 0.02–0.04 % in feed or drinking water for a
maximum of 10 days. The drug has also been used for the treatment of mammary infections in dairy
cows (500 mg/quarter) and for strangles (equine adenitis) in horses, in which case it was applied
systemically (13 mg/kg b.w. per os (p.o. (orally)) for 5 days (Huber, 1982).
Nitrofurantoin has been used by the oral route in calves and horses at daily doses of 10 mg/kg b.w.
for the treatment of severe urinary infections (Botsoglou and Fletouris, 2001).
Nitrofurazone has been used locally at a concentration of 0.2 % to treat wounds and diseases of the
skin, ear, eye and reproductive tract. Intramammary application has also been used to treat mastitis in
dairy cows (Huber, 1982). Like other nitrofurans, it has also been applied by the oral route to treat
enteric infections, such as coccidiosis and salmonellosis in poultry and swine, as well as in small
ruminants (Robertson, 1982) and for pasteurellosis in rabbits (dosages not found). It has also been
widely used as a feed additive, in general at an inclusion rate of 0.05 % in the feed or at 100 mg/head
for piglets (Brander et al., 1991).
Finally, nifursol is a chemotherapeutic agent that was authorised in the EU as a feed additive for the
first time in 1982 for the prevention of histomoniasis in turkeys. The inclusion rate into complete

Nitrofurans in food
EFSA Journal 2015;13(6):4140 22
feedingstuffs was regulated by EU law to be between 50 and 75 mg/kg. The authorisation of nifursol
as a feed additive was withdrawn in the EU with effect of 31 March 2003.
2. Legislation
According15
to Article 3 of Regulation (EC) No 470/2009 of the European Parliament and of the
Council,16
any pharmacologically active substance intended for use in the Union in veterinary
medicinal products (VMPs) which are to be administered to food-producing animals shall be subject to
an opinion of the EMA on the MRL, formulated by the CVMP. The opinion consists of a scientific
risk assessment and risk management recommendations. Pharmacologically active substances, for
which the opinion concludes that no MRL is needed or that a (provisional) MRL should be
established, are subsequently classified in Table 1, ‘allowed substances’, of Regulation (EU)
37/2010.17
All use of other pharmacologically active substances in VMPs is not allowed. A specific
group of the non-allowed substances is the group of ‘prohibited substances’, listed in Table 2 of
Regulation (EU) 37/2010. This group of ‘prohibited substances’ includes, inter alia, nitrofurans,
without specifying individual substances. In the EU, the application of furaltadone, nitrofurantoin and
nitrofurazone to food-producing animals was banned in 1993. The ban on furazolidone followed in
1995. For these nitrofurans, no MRL could be recommended because the available data were not
sufficient to allow a safe limit to be identified or because a final conclusion concerning human health
with regard to residues of a substance could not be established, given the lack of scientific
information.
Article 18 of Regulation (EC) No 470/2009 stipulates that, for substances which are not classified as
‘allowed substances’ in accordance with that Regulation, an RPA may be established to ensure the
functioning of controls for food of animal origin. Food of animal origin containing residues of such
substances at or above the RPA is considered not to comply with EU legislation. Until now, RPAs
have been based on only analytically driven MRPLs, and no consideration has been given to the
toxicological profile of non-allowed substances. The MRPLs for four nitrofuran marker metabolites
and a few other prohibited substances are specified in Annex II of Commission Decision
2002/657/EC. For the metabolites of furazolidone, furaltadone, nitrofurantoin and nitrofurazone, an
MRPL value of 1 µg/kg each is specified for poultry and aquaculture products. Nifursol is not
included in the Annex.
Under the terms of Commission Decision 2005/34/EC,18
these MRPLs are currently to be used as
RPAs, irrespective of the matrix tested, for the purpose of the control of residues when analytical tests
are being carried out in the framework of import control. However, this Decision regulated imports
from third countries only and did not apply to food produced within the Union. As a number of
products of animal origin originating from Member States were found to contain nitrofurans and other
prohibited substances below and above the MRPLs, the European Commission (EC) and the Member
States agreed to also apply the approach laid down in Decision 2005/34/EC, with the necessary
changes, to food of animal origin produced within the Union. This implies, in particular, that the
MRPLs set in accordance with Commission Decision 2002/657/EC shall also be used as RPAs. This
approach, moreover, means that any detection of substances, the use of which is not authorised in the
Union, regardless of the level found, shall be followed by an investigation into the source of the
15 In this scientific opinion, where reference is made to European legislation (Regulations, Directives, Decisions), the
reference should be understood as relating to the most current amendment, unless otherwise stated. 16 Regulation (EC) No 470/2009 of the European Parliament and of the Council of 6 May 2009 laying down Community
procedures for the establishment of residue limits of pharmacologically active substances in foodstuffs of animal origin,
repealing Council Regulation (EEC) No 2377/90 and amending Directive 2001/82/EC of the European Parliament and of
the Council and Regulation (EC) No 726/2004 of the European Parliament and of the Council. OJ L 152, 16.6.2009, p. 11–22. 17 Commission Regulation (EU) No 37/2010 of 22 December 2009 on pharmacologically active substances and their
classification regarding maximum residue limits in foodstuffs of animal origin. OJ L 15, 20.1.2010, p. 1–72. 18 Commission Decision 2005/34/EC laying down harmonised standards for the testing for certain residues in products of
animal origin imported from third countries. OJ L 16, 20.1.2005, p. 61–63.
Nitrofurans in food
EFSA Journal 2015;13(6):4140 23
substance in question and appropriate enforcement measures shall be applied, in particular aiming to
prevent re-occurrence in the case of documented illegal use (SANCO-E.2(04)D/521927).19
Nifursol was authorised in the EU as a feed additive for the first time by Commission Directive
82/822/EEC20
and amended by Commission Directive 89/23/EEC21
for the prevention of
histomoniasis in turkeys. Three preparations were authorised with maximum nifursol contents of
14.6 %, 44 % and 50 %. The carriers for the three preparations were also regulated, which were maize
starch and 12 %, 33 % or 34 % of soya bean oil, respectively. The Directive stipulated that the nifursol
content in the complete feedingstuff should be between 50 mg/kg (minimum content) and 75 mg/kg
(maximum content). The use of nifursol-containing feedingstuffs was prohibited at least 5 days before
slaughter. Following the SCAN opinion on nifursol, the authorisation of nifursol as a feed additive
was withdrawn with effect from 31 March 2003 by Council Regulation (EC) No 1756/2002.22
3. Methods of analysis
3.1. Sampling and storage
Most of the sampling of food, and of related materials, for nitrofurans testing in foods of animal origin
is undertaken in the context of the national residue monitoring plans as specified in Council Directive
96/23/EC,23
with residue testing undertaken in accordance with Commission Decision 2002/657/EC.
For details of the protocols and procedures specified for such sampling and testing, see Section 5.2.1
of this opinion.
Commission Decision 2002/657/EC states that samples shall be obtained, handled and processed in
such a way that there is a maximum chance of detecting the substance. Sample handling procedures
shall prevent the possibility of accidental contamination or loss of analytes. To achieve this goal,
samples are stored in suitable, secure, clearly identified containers and in conditions such as frozen
storage (animal tissues, urine, blood plasma, milk, fish and shellfish, feed water) or at
refrigerated/ambient temperatures (eggs, honey, animal feed) prior to analysis.
3.2. Determination of nitrofurans and their marker metabolites
Initially, testing for residues of nitrofurans in animal tissues was conducted using methods directed at
the parent compounds, using high-performance liquid chromatography–ultraviolet (HPLC-UV)
(Vroomen et al., 1986; Degroodt et al., 1992; Bellomonte et al., 1993) and later using liquid
chromatography–mass spectrometry (LC-MS) (McCracken et al., 1995) techniques. However, it was
unusual to find any residues of nitrofurans using these methods directed at the parent compounds.
Studies on furazolidone showed that residues of the parent compound are highly unstable in treated
animals (Nouws and Laurensen, 1990; McCracken et al., 1995), but that metabolites containing AOZ
are covalently bound to tissue protein (Vroomen et al., 1986; Hoogenboom et al., 1991c) and that
these metabolites persist for much longer than the parent compound (Hoogenboom et al., 1992a).
Nitrofuran drugs contain a side-chain connected via an azomethine bond to the nitrofuran moiety. This
bond is unstable under acidic conditions, a feature used by Buzard et al. (1956) for a generic method
for nitrofuran drugs, starting with acid treatment and subsequent detection of the nitrofuran ring after
derivatisation. By reversing this feature, it was shown that AOZ could be released from tissue-bound
metabolites in pig liver under mildly acidic conditions followed by derivatisation with
19 http://ec.europa.eu/food/fs/rc/scfcah/biological/rap16_en.pdf 20 Forty-first Commission Directive of 19 November 1982 amending the annexes to Council Directive 70/524/EEC
concerning additives in feedingstuffs. OJ L 347, 07.12.1982, p. 16–19. 21 Commission Directive 89/23/EEC of 21 December 1988 amending the annexes of Council Directive 70/524/EEC
concerning additives in feedingstuffs. OJ L 11, 14.1.1989, p. 34–35. 22 Council Regulation (EC) No 1756/2002 of 23 September 2002 amending Directive 70/524/EEC concerning additives in
feedingstuffs as regards withdrawal of the authorization of an additive and amending Commission Regulation (EC) No
2430/1999. OJ L 265, 03.10.2002, p. 1–2. 23
Council Directive 96/23/EC of 29 April 1996 on measures to monitor certain substances and residues thereof in live
animals and animal products and repealing Directives 85/358/EEC and 86/469/EEC and Decisions 89/187/EEC and
91/664/EEC. OJ L 125, 23.5.1996, p. 10–32.

Nitrofurans in food
EFSA Journal 2015;13(6):4140 24
2-nitrobenzaldehyde (NBA) to form 3([(2-nitrophenyl) methylene]-amine)-2-oxazolidinone (NPAOZ),
which was determined by HPLC-UV (Hoogenboom et al., 1991c). It was shown that this HPLC-UV-
based method also worked for the detection of bound residues of other nitrofurans such as furaltadone,
nitrofurantoin and nitrofurazone (Hoogenboom and Polman, 1993).
This principle became the basis for an analytical method for the determination of residues of tissue-
bound metabolites of furazolidone and tissue-bound metabolites of furaltadone, such as 3([(2-
nitrophenyl) methylene]-amine)-5-methylmorpholino-2-oxazolidinone (NPAMOZ), in pig liver, using
both HPLC and LC-MS techniques (Horne et al., 1996). Subsequently, a method based on similar
acidic hydrolysis and NBA derivatisation was developed for tissue-bound metabolites of four
nitrofurans, using AOZ, AMOZ, AHD and SEM as the marker metabolites, in pig muscle, with
determination of residues by liquid chromatography–tandem mass spectrometry (LC-MS/MS) (Leitner
et al., 2001). The limits of quantitation (LOQs) for these methods were in the order of 5–10 µg/kg.
The analytical methodology for tissue-bound nitrofuran metabolites was further developed through
application of solid phase extraction (SPE) to improve clean-up of extracts and concentrate the
derivatised marker metabolites (Conneely et al., 2003). An LC-MS/MS method, with hexane washing
following hydrolysis and derivatisation of the marker metabolites and further clean-up by SPE on a
reversed-phase polymeric sorbent, was applied to poultry and shrimp samples with an LOQ of 0.5–
1.0 µg/kg (Edder et al., 2003).
Because tissue-bound metabolites of the nitrofurans are the principal target for residue analysis, testing
for the parent compounds is limited, generally, to samples of animal feed and feed water, whereas
samples of animal tissues, urine, blood plasma, milk, fish and shellfish, eggs and honey are tested for
the nitrofuran marker metabolites.
3.2.1. Extraction and sample clean-up
For nitrofuran marker metabolites, a combined acid hydrolysis with hydrochloric acid and
derivatisation with NBA is performed to release the protein-bound residues. Where determination of
only the protein-bound metabolites is required, for example to specifically identify the SEM marker
metabolite of nitrofurazone from other sources of SEM (see Section 3.3), a series of washing steps
with organic solvents (methanol, ethanol, diethyl ether) may be performed prior to the
hydrolysis/derivatisation step (Hoogenboom et al., 1991c). Following derivatisation, extraction of the
nitrophenyl marker metabolites is undertaken using ethyl acetate (O’Keeffe et al., 2004).
Further clean-up of the sample extracts may be performed using SPE, particularly for honey samples
(Tribalat et al., 2006; Lopez et al., 2007; O’Mahony et al., 2011), or washing with hexane (Bock et al.,
2007). Some alternative approaches have been proposed for the release and derivatisation of marker
metabolites, such as protease digestion of samples and extraction of the derivatised marker metabolites
using mixed-mode cation exchange SPE instead of ethyl acetate (Cooper et al., 2007; Stastny et al.,
2009), accelerated solvent extraction with methanol/5 % trichloroacetic acid (1/1, v/v) (Tao et al.,
2012), incubation at 55 °C instead of at 37 °C (Verdon et al., 2007) or incubation in a microwave oven
(Palaniyappan et al., 2013).
In the case of the parent nitrofurans, extraction from feed samples is carried out using solvent
extraction with ethyl acetate, with acetonitrile or with a mixture of acetonitrile and /methanol (1/1,
v/v). Typically, the solvent extract is subjected to further clean-up with SPE, using reversed-phase
(C18 or polymeric sorbents), aminopropyl or neutral alumina sorbent chemistries. For water samples,
parent nitrofurans are extracted using reversed-phase SPE with C18 or polymeric sorbents.
3.2.2. Screening methods
Screening methods should measure nitrofuran marker metabolites with sufficient sensitivity to satisfy
regulatory requirements, currently at the MRPL of 1.0 µg/kg for poultry meat and aquaculture
products (Annex II of Commission Decision 2002/657/EC). Screening methods for nitrofuran marker
Nitrofurans in food
EFSA Journal 2015;13(6):4140 25
metabolites include immunoassays (enzyme-linked immunosorbent assays (ELISA), lateral flow
immunoassays, biosensors) and HPLC techniques.
Immunoassays have been very widely applied as screening methods for individual nitrofuran marker
metabolites, typically directed at the nitrophenyl derivatives following acid hydrolysis and
derivatisation with nitrobenzaldehyde, as described in Section 3.2.1 above.
An ELISA was developed for the determination of NPAOZ in prawns with a limit of detection (LOD)
of 0.1 µg/kg and a detection capability (CCβ)24
of < 0.7 µg/kg (Cooper et al., 2004). Franek et al.
(2006) developed an ELISA for NPAOZ in eggs with a CCβ of 0.3 µg/kg. For fish, a number of
NPAOZ ELISAs have been developed with LOD/LOQ values of 0.1/0.3 µg/kg (Cheng et al., 2009;
Tsai et al., 2009; Liu et al., 2010b). For pork, chicken and beef muscle and liver samples, ELISA tests
for NPAOZ were developed with a CCβ value of 0.4 µg/kg (Diblikova et al., 2005), with LOD values
of 0.3–0.4 µg/kg (Chang et al., 2008) and with an LOD value of 1.0 µg/kg (Nesterenko et al., 2012).
A number of ELISA methods have been reported for the determination of NPAMOZ in shrimps and
fish samples with reported LOD values of 0.1–0.3 µg/kg and LOQ or CCβ values of 0.3–0.36 µg/kg
(Pimpitak et al., 2009; Shen et al., 2012; Sheu et al., 2012; Yang et al., 2012; Liu et al., 2013). Other
ELISA methods were developed and applied to the determination of NPAMOZ in chicken, pork, fish
and shrimp samples, reporting LOD values ranging from < 0.1 to 0.34 µg/kg (Luo et al., 2012; Xu et
al., 2013; Shu et al., 2014). A number of ELISA methods have also been reported for direct
determination of AMOZ, without derivatisation, with reported LOD values of 0.4 µg/kg (Song et al.,
2012; Yan et al., 2012).
ELISA methods have been described for the determination of 1([(2-nitrophenyl) methylene]-amine)-
hydantoin (NPAHD) in pork, fish, shrimps and chicken with LOD values ranging between 0.09 and
0.15 µg/kg (Wenxiao et al., 2012) and in shrimps with an LOD value of 0.11 µg/kg (Chadseesuwan et
al., 2013).
ELISAs have been developed for [(2-nitrophenyl) methylene]-semicarbazide (NPSEM) in chicken
(Cooper et al., 2007), pork (Vass et al., 2008a) and eggs (Vass et al., 2008b) with CCβ values of 0.25,
0.3 and 0.3 µg/kg, respectively.
Not published ELISA methods have been identified for the nitrophenyl derivative of the nifursol
marker metabolite, 3[(2-nitrophenyl) methylene]-5-dinitrosalicylic acid hydrazide (NPDNSH).
The performance of commercial ELISA kits has been assessed by a number of authors and reported to
be suitable for nitrofuran marker metabolite screening. Krongpong et al. (2008) reported that an
ELISA kit was capable of detecting AOZ at 1.0 µg/kg in eel samples with excellent accuracy and
precision. Dimitrieska-Stojkovic et al. (2012) validated test kits for AOZ, AMOZ, AHD and SEM in
liver, eggs and honey and estimated CCβ values to be in the range of 0.56 to 0.68 µg/kg for all
analytes. Shen et al. (2012) estimated the LODs for AOZ, AMOZ, AHD and SEM to be 0.02, 0.06,
0.13 and 0.04 µg/kg, respectively, for the application of commercial ELISA kits to the analysis of
pork, chicken, fish and shrimp samples. Jester et al. (2014) tested commercial ELISA kits for AOZ
and AMOZ in fish samples and reported that the LODs were 0.05 and 0.2 µg/kg, respectively.
Using an alternative carboxybenzaldehyde derivatisation, lateral flow immunoassays were developed
for 1([(2-carboxyphenyl) methylene]-amine)-hydantoin (CPAHD) and [(2-carboxyphenyl)
methylene]-semicarbazide (CPSEM) in pork with visual LODs of 1.4 and 0.72 µg/kg, respectively
(Tang et al., 2011a, b). Li et al. (2013) developed a lateral flow immunoassay for underivatised
AMOZ in chicken and pork samples and reported a visual LOD of 0.3 µg/kg.
24 CCβ is the detection capability, meaning the smallest content of the substance that may be detected, identified and/or
quantified in a sample with an error probability of β.
Nitrofurans in food
EFSA Journal 2015;13(6):4140 26
A number of biosensor assays for nitrofuran marker metabolites have been developed, including a
chemiluminescence-based biochip array sensing technique for the nitrophenyl derivatives of AOZ,
AMOZ, AHD and SEM in honey samples with CCβ values of < 0.5 µg/kg for AOZ, AMOZ and AHD
and of < 0.9 µg/kg for SEM (O’Mahony et al., 2011).
Following the identification of tissue-bound metabolites of nitrofurans as the target analytes for
residue analysis, HPLC-UV determination of the nitrophenyl derivatives was used initially
(Hoogenboom et al., 1991c; Horne et al., 1996; Conneely et al., 2003). These methods had LOQ
values of 2–10 µg/kg, which are not suitable for testing at the MRPL of 1 µg/kg. Recently, methods
based on HPLC with diode-array detection (DAD) and fluorescence detection (FL) have been
developed for nitrofuran marker metabolites, using 2-naphthaldehyde and 2-hydroxy-1-
naphthaldehyde, respectively, as the derivatising reagent following acid hydrolysis. Following
extraction with ethyl acetate, the derivatised nitrofuran marker metabolites were determined in
shrimps by HPLC-DAD with LOQ values of 0.70–0.91 µg/kg (Chumanee et al., 2009) and in shrimp
and pork muscle by HPLC-FL (λex 395 nm; λem 463 nm) with LOQ values of 0.63–0.86 µg/kg (Sheng
et al., 2013; Du et al., 2014).
The parent nitrofurans have been determined in feed samples using ELISA (Li et al., 2009, 2010),
chemiluminescence (Thongsrisomboon et al., 2010; Liu et al., 2012a), HPLC-UV (McCracken et al.,
1997; Wang and Zhang, 2006; Vinas et al., 2007) and LC-MS/MS (Barbosa et al., 2007b) techniques
and in water samples using HPLC-UV (Pietruszka et al., 2007; Vinas et al., 2007) and LC-MS/MS
(Ardoosngnearn et al., 2014) techniques. The reported LODs for such methods range from < 1 µg/kg
to > 1 mg/kg; in the case of parent nitrofurans, the MRPL of 1 µg/kg for nitrofuran marker metabolites
in foods of animal origin does not apply.
3.2.3. Confirmatory methods
LC-MS/MS has become the most widely used methodology for confirmatory analysis of nitrofuran
marker metabolites in a broad range of sample types. Single quadrupole LC-MS has been shown not to
be sufficiently sensitive (Cooper and Kennedy, 2005) or selective (Tribalat et al., 2006) for the
determination of marker metabolites at the MRPL of 1 µg/kg. Most of the published LC-MS/MS
methods are multi-residue methods, covering AOZ, AMOZ, AHD and SEM, with a few methods also
including DNSH. Some other methods have been developed for only one or two marker metabolites.
Typical MS conditions used for the confirmatory analysis of nitrofuran marker metabolites are a
positive electrospray interface (ESI) with two precursor-to-product ion transitions being monitored for
each marker metabolite (O’Keeffe et al., 2004). Sample treatment, prior to LC-MS/MS determination
of the marker metabolites, typically involves acid hydrolysis and NBA derivatisation, with ethyl
acetate or acetonitrile extraction and/or hexane washing and reversed-phase polymeric sorbent SPE
clean-up.
LC-ESI-MS/MS methods for the determination of AOZ, AMOZ, AHD and SEM in animal tissues
have been applied to poultry, pork, beef and rabbit muscle and liver samples. The range of values of
the decision limit (CCα),25
CCβ, LOD and LOQ for the various analytes by these methods are 0.11–
0.45, 0.19–0.88, 0.01–0.2 and 0.5 µg/kg, respectively (Finzi et al., 2005; Mottier et al., 2005; Barbosa
et al., 2007a; Xia et al., 2008; Ryad et al., 2013). A number of papers have been published on the
determination of DNSH in turkey and chicken muscle and liver, with reported CCβ values of
≤ 0.1 µg/kg (Kaufmann et al., 2004; Mulder et al., 2005; Vahl, 2005; Zuidema et al., 2005). A method
directed at the analysis of all five marker metabolites (AOZ, AMOZ, AHD, SEM, DNSH) in turkey
muscle reported CCα values of 0.08–0.20 µg/kg and CCβ values of 0.10–0.25 µg/kg (Verdon et al.,
2007).
Because of the high numbers of samples of shrimps (prawns) imported into the EU that have been
found to contain residues of nitrofuran marker metabolites in the early years of this century (Kennedy
25 CCα is the decision limit at and above which it can be concluded with an error probability of α that a sample is non-
compliant.

Nitrofurans in food
EFSA Journal 2015;13(6):4140 27
et al., 2003), considerable attention has been given to developing methods for testing shrimps.
Methods have been described using an atmospheric pressure chemical ionisation (APCI) interface with
reported LOD/LOQ values in the range of 0.05–0.3/0.1–0.5 µg/kg (Chu and Lopez, 2005; An et al.,
2012) or an ESI interface with reported CCα/CCβ values in the range of 0.08–0.36/0.12–0.61 µg/kg
(Douny et al., 2013; Hossain et al., 2013). A further method that uses 2-naphthaldehyde, rather than
2-nitrobenzaldehyde, as the derivatising reagent reports LOD/LOQ values of 0.16–0.27/0.54–
0.90 µg/kg (Chumanee et al., 2009).
For fish, methods are described with reported CCα values of 0.19 to 0.43 µg/kg and CCβ values of
0.23 to 0.54 µg/kg (Tsai et al., 2010) and LOD values of 0.03 to 0.15 µg/kg (Zhao et al., 2011). An
alternative method involving accelerated solvent extraction was described by Tao et al. (2012); CCα
values of 0.07 to 0.13 µg/kg and CCβ values of 0.31 to 0.49 µg/kg are reported.
Methods for AOZ, AMOZ, AHD and SEM in egg samples (Bock et al., 2007; Sniegocki et al., 2008)
by LC-MS/MS using a positive ESI have reported CCα values of 0.03 to 0.22 µg/kg for the former
method and CCα values of 0.16 to 0.25 µg/kg and CCβ values of 0.22 to 0.36 µg/kg reported for the
latter method. In addition to these multi-nitrofuran methods for eggs, a number of methods have been
published for individual marker metabolites in eggs. For SEM, methods with reported CCα values of
0.41 to 0.91 µg/kg and CCβ values of 0.46 to 0.97 µg/kg for eggs and egg products (Szilagy and de la
Calle, 2006) and CCα/CCβ values of 0.20/0.25 µg/kg for eggs (Stastny et al., 2009) have been
reported. Barbosa et al. (2012a) describe a method for AMOZ and DNSH in eggs with reported
CCα/CCβ values of 0.1/0.5 µg/kg for AMOZ and 0.3/0.9 µg/kg for DNSH.
For honey samples, methods using LC-ESI-MS/MS with CCα values of 0.07 to 0.46 µg/kg and CCβ
values of 0.12 to 0.56 µg/kg (Khong et al., 2004), LOD values of 0.2 to 0.6 µg/kg (Tribalat et al.,
2006) and an LOQ value of 0.25 µg/kg (Lopez et al., 2007) are reported.
Methods for AOZ, AMOZ, AHD and SEM in milk samples (Chu and Lopez, 2007; Rodziewicz,
2008) use APCI or positive ESI. An LOD of < 0.2 µg/kg is reported for the former method and CCα
values of 0.12 to 0.29 µg/kg and CCβ values of 0.15 to 0.37 µg/kg are reported for the latter method.
Determination of nitrofuran marker metabolites and parent compounds in pig and chicken eyes by LC-
ESI-MS/MS have been described by Cooper and Kennedy (2005) and Cooper et al. (2008b). This
analytical approach was adopted to take advantage of the higher concentration of drug residues in eye
tissues and, particularly, to confirm the source of SEM as a nitrofuran marker metabolite through
confirmation of the parent compound nitrofurazone in the eye. Another approach to unequivocal
identification of nitrofurazone usage is the determination of the open-chain cyano-metabolite of
nitrofurazone (Wang et al., 2010). Muscle samples from nitrofurazone-treated fish are analysed by
LC-MS/MS; the cyano-metabolite is measurable for up to 14 days after treatment with nitrofurazone,
compared with only 4 days for the parent compound. The authors suggest that the cyano-metabolite
can be used as an alternative confirmatory marker for monitoring the use of nitrofurazone in fish. A
method for the determination of marker metabolites in bovine, ovine, equine and porcine plasma has
been developed as a method for pre-slaughter, on-farm testing for illicit use of nitrofuran drugs. The
plasma samples are derivatised with NBA and analysed by ultra-(U)HPLC-MS/MS, with reported
CCα values for AOZ, AHD, SEM and AMOZ of 0.059, 0.054, 0.070 and 0.071 µg/kg, respectively
(Radovnikovic et al., 2011). An alternative method for pre-slaughter, on-farm testing for illicit use of
nitrofuran drugs is based on urine, using SPE on a reversed-phase polymeric sorbent to extract the
derivatised marker metabolites and analysis by LC-ESI-MS/MS. For AOZ, AHD, SEM and AMOZ in
urine, the CCα/CCβ values were 0.11–0.34/0.13–0.43 μg/kg (Rodziewicz and Zawadzka, 2013).
3.3. SEM analysis
A particular problem with using SEM as an unequivocal marker for nitrofurazone arises owing to the
occurrence of SEM in food from a number of other sources. Apart from its occurrence as a marker
metabolite for nitrofurazone, SEM or compounds from which SEM may be released may occur in food
Nitrofurans in food
EFSA Journal 2015;13(6):4140 28
(1) as a migration or breakdown product from azodicarbonamide which has been used both as a
blowing agent to foam the plastic sealing gaskets on metal lids of food jars and as a flour treatment
agent in bread production (Becalski et al., 2004; Stadler et al., 2004); (2) as a reaction product formed
between hypochlorite, used in cleaning, and carrageenan or powdered egg white (Hoenicke et al.,
2004); and (3) as a naturally occurring compound from which SEM may be released in shrimps,
prawns and crayfish and in honey (Saari and Peltonen, 2004; Van Poucke et al., 2011; McCracken et
al., 2013; Crews, 2014). It should be noted that the use of azodicarbonamide has been prohibited
within the EU for use both as a blowing agent (Commission Directive 2004/1/EC26
) and as a food
additive for flour, not being included in the Community list of food additives approved for use in
foods (Annex II of Regulation (EC) No 1333/200827
), but it may continue to be used in other
countries. Because no alternative marker residue for nitrofurazone has been identified to date,
particular steps need to be taken when positive screening results for SEM are found (Sanders, 2003;
Points et al., 2015). Some examples of these steps include the following: (1) testing for the marker
metabolite for nitrofurazone in breaded food products should be carried out on only the animal tissue
part of the product, (2) the inner core of products such as shrimps, prawns and crayfish should be
tested for the marker metabolite for nitrofurazone, as the naturally occurring SEM occurs in only the
outer part, and (3) the sample should be extensively washed with a range of organic solvents to
remove any free SEM from the sample prior to the hydrolysis and derivatisation step for SEM as the
marker metabolite for nitrofurazone.
3.4. Analytical quality assurance: performance criteria, reference materials and proficiency
testing
The performance criteria for methods used to test for nitrofuran marker metabolites are those laid
down in Commission Decision 2002/657/EC for screening and confirmatory methods to be used for
Group A substances, i.e. substances having anabolic effects and unauthorised substances, such as
nitrofurans, which are included in Table 2 of Commission Regulation (EU) No 37/2010. Methods
must have a satisfactory level of performance for the characteristics of specificity, trueness,
ruggedness and stability of the analyte in standard solutions and in test matrices. The methods must be
validated for recovery, repeatability, within-laboratory reproducibility, calibration curves, CCα and
CCβ in accordance with procedures specified in the Decision or equivalent procedures.
Isotopically labelled nitrofuran marker metabolites, such as D4-AOZ, D5-AMOZ, 13
C15
N2-SEM and 13
C3-AHD, are available commercially for use as internal standards. No certified reference materials
for nitrofuran marker metabolites are commercially available to date. There is a report (PhD thesis) on
the preparation of two certified reference materials of prawns containing AOZ at levels of 3.0–3.5 and
14–15 µg/kg (Muaksang, 2009).
Several proficiency tests and interlaboratory studies have been reported for nitrofuran marker
metabolites in various food products. In 2003, the European Reference Laboratory prepared shrimp
samples (three containing AOZ, two containing AOZ plus SEM and three blank samples) for
distribution to 20 laboratories for analysis by LC-MS/MS methods. Four of the laboratories reported
one or more false-negative or false-positive results and the rate of laboratories having satisfactory
z-scores was 70 to 87 % for AOZ and 64 to 69 % for SEM; the assigned marker metabolite contents in
the incurred samples were 0.9–1.2 µg/kg AOZ and 1.3–1.4 µg/kg SEM (Hurtaud-Pessel et al., 2006).
An interlaboratory validation study was organised by the Institute for Reference Materials and
Measurements (IRMM) to evaluate the effectiveness of an LC-MS/MS method for the determination
of SEM in whole egg and egg powder samples. Five samples each of whole egg and of egg powder
were analysed by 12 laboratories; the relative standard deviations for repeatability and for
reproducibility ranged from 2.9 to 9.3 % and from 22.5 to 38.1 %, respectively, demonstrating that the
method showed acceptable within- and between-laboratory precision (De la Calle and Szilagyi, 2006).
26 Commission Directive 2004/1/EC of 6 January 2004 amending Directive 2002/72/EC as regards the suspension of the use
of azodicarbonamide as blowing agent. OJ L 7, 13.1.2004, p. 45–46. 27 Regulation (EC) No 1333/2008 of the European Parliament and of the Council of 16 December 2008 on food additives. OJ
L 354, 31.12.2008, p. 16–33.

Nitrofurans in food
EFSA Journal 2015;13(6):4140 29
In the UK, the Food Analysis Performance Assessment Scheme (FAPAS) provides samples of honey
and prawns containing nitrofuran marker metabolites for testing.28
3.5. Concluding comments
With some exceptions, both screening and confirmatory methods for nitrofuran marker metabolites in
foods of animal origin use acid hydrolysis and NBA derivatisation of the released marker metabolites.
Screening methods for the resulting nitrophenyl derivatives is generally undertaken by ELISA or
biosensor methods, providing sufficient analytical sensitivity to meet the MRPL of 1 µg/kg.
Confirmatory methods are based on LC-MS/MS and this technology typically provides CCα values of
< 0.3 µg/kg and CCβ values of < 0.5 µg/kg for the range of sample types, again adequately meeting
the MRPL of 1 µg/kg.
4. Assessment of the appropriateness of using marker metabolites of nitrofurans for the
reference point for action for foods of animal origin
Nitrofuran parent compounds have a short in vivo half-life due to extensive metabolism, primarily a
reduction of the nitro-group, such that they do not occur generally as residues in foods of animal origin
(Nouws and Laurensen, 1990; McCracken et al., 1995). Therefore, monitoring of nitrofuran residues
in livestock based on the identification of the parent compounds is not appropriate. Instead, an
approach based on marker metabolites has been adopted for monitoring purposes, with the particular
marker metabolites chosen to reflect residues of nitrofurans which persist in treated animals. The
nitroreduction results in the formation of reactive metabolites able to bind covalently to tissue
macromolecules, including proteins, which, in food-producing animals, have relatively long half-lives,
persisting for several weeks in edible tissues (Vroomen et al., 1986; Hoogenboom et al., 1991c, 1992a;
Vass et al., 2008c). Side-chains may be released from these protein-bound metabolites, namely AOZ,
AMOZ, AHD, SEM and DNSH in the case of furazolidone, furaltadone, nitrofurantoin, nitrofurazone
and nifursol, respectively. These side-chains are therefore excellent marker metabolites for the
presence of protein-bound residues, following their release by sample treatment with acid and
derivatisation with nitrobenzaldehyde (Hoogenboom et al., 1991c; Hoogenboom and Polman, 1993;
Horne et al., 1996; Leitner et al., 2001).
As nitrofuran parent compounds do not persist as residues in animal tissues and do not occur at
concentrations comparable to those of the marker metabolites (as protein-bound adducts), the marker
metabolites AOZ, AMOZ, AHD, SEM and DNSH are appropriate for identifying the illicit use of
nitrofurans. Other nitrofuran metabolites that persist and that are at concentrations higher than the
marker metabolites AOZ, AMOZ, AHD, SEM and DNSH have not been identified. Therefore, these
marker metabolites are appropriate for the RPA for foods of animal origin.
In the case of SEM, there is a problem with its use as a marker metabolite for nitrofurazone in that
SEM may occur as a residue in some foods from other sources (Becalski et al., 2004; Hoenicke et al.,
2004; Saari and Peltonen, 2004; Stadler et al., 2004; Van Poucke et al., 2011; McCracken et al., 2013;
Crews, 2014), potentially giving rise to false-positive results for illicit use of nitrofurazone. However,
a suitable alternative marker metabolite for nitrofurazone has not been identified. Wang et al. (2010)
suggested the determination of the open-chain cyano-metabolite of nitrofurazone in fish muscle as an
alternative marker metabolite, but this has not been applied more widely; in pigs, it was shown that the
cyano-metabolite has a much shorter half-life than the protein-bound residues (Vroomen et al., 1987a).
Instead, as SEM is an appropriate marker metabolite for nitrofurazone, the problem of potential false-
positive results for illicit use of nitrofurazone has been addressed by appropriate analytical strategies
(Sanders, 2003; Points et al., 2015) (see Section 3.3).
28 http://fapas.com/proficiency-testing-schemes/fapas/
Nitrofurans in food
EFSA Journal 2015;13(6):4140 30
5. Occurrence of nitrofurans in food
5.1. Previously reported occurrence results
Owing to the previous use of nitrofurans as veterinary drugs or feed additives, most controls on the
presence of nitrofuran marker metabolites are focused on foods of animal origin. However, SEM can
also be present in food from sources other than nitrofurazone use (see Appendix A). Because the
MRPL for nitrofuran marker metabolites was established by Commission Decision 2002/657/EC (see
Section 2), the EFSA Scientific Panel on Contaminants in the Food Chain (CONTAM Panel)
considered occurrence data for samples that have been collected since 2002. It should be noted that
some of the studies described in this section may also be included in the databases described in
Section 5.2, relating to samples taken in national residue monitoring plans. The information presented
below provides examples of the occurrence of nitrofuran marker metabolites in foods of animal origin.
5.1.1. Meat and meat products
In 2002, the Food Standards Agency (FSA) analysed AOZ, AMOZ, AHD and SEM in chicken meat
(n = 45). The reporting limit was 0.3 µg/kg for AOZ, AMOZ and AHD, and was 1 µg/kg for SEM.
AMOZ was detected in four samples with concentrations ranging from 0.55 to 18.19 µg/kg and AOZ
was detected in one sample with a concentration of 0.63 µg/kg. None of the samples contained more
than one nitrofuran marker metabolite and AHD and SEM were not detected (FSA, 2002).
Meat samples (n = 226) from various species such as broilers, turkeys, quails, rabbits, bovine and
swine were analysed for the presence of AOZ, AMOZ, AHD and SEM. Samples had been collected in
Portugal in 2002 under the Portuguese residue monitoring plan and analysis was done by LC-MS/MS
(CCα/CCβ: 0.29/0.34, 0.20/0.32, 0.45/0.88 and 0.15/0.46 µg/kg, respectively). From the 226 samples,
78 contained AMOZ at a concentration above the MRPL of 1 µg/kg. Most non-compliant samples
were broiler meat (n = 61), but non-compliant samples were also reported for turkeys (n = 11), quails
(n = 5) and pigs (n = 1). The average concentration of AMOZ in non-compliant samples was 6.3 µg/kg
for broilers, 125 µg/kg for turkeys and 5.8 µg/kg for quails. No results were reported for the other
nitrofuran marker metabolites tested (Barbosa et al., 2007a).
Poultry and rabbit samples (n = 55 and n = 8, respectively) taken from the Swiss market and mainly
originating from Asian countries (year of sampling not indicated) were analysed for AOZ, AMOZ,
AHD and SEM using LC/MS-MS (LOD/LOQ: 0.2/0.5 µg/kg for AOZ, AMOZ and SEM, and
2.0/5.0 µg/kg for AHD). AOZ was found in 20 poultry samples (36 %, range: 0.6–895 µg/kg) and one
rabbit sample (13 %, concentration: 5.1 µg/kg). The other nitrofuran marker metabolites were not
detected (Edder et al., 2003).
A survey on pork (n = 1 500) was undertaken across 15 European countries for AOZ, AMOZ, AHD
and SEM. Sampling was done at retail and in pig slaughterhouses in 2002. Analysis was done by LC-
MS/MS and LOQs were 0.1µg/kg for AOZ and AMOZ, 0.5 µg/kg for AHD and 0.2 µg/kg for SEM.
In 12 samples (0.8 %), measurable nitrofuran marker metabolites were detected. AOZ was quantified
in one sample from Portugal and one sample from Greece (range: 0.3–3.0 µg/kg). AMOZ was
quantified in one sample from Italy and nine samples from Portugal (range: 0.2–1.0 µg/kg). No
measurable concentrations of AHD and SEM were shown and none of the samples contained more
than one nitrofuran marker metabolite (O’Keeffe et al., 2004).
In Denmark, chicken and turkey meat was sampled in retail outlets in 2003 and analysed for the
presence of DNSH by LC-MS/MS (CCα/CCβ: 0.05/0.08 µg/kg). DNSH was not detected in any of the
chicken meat samples (n = 16), but 10 of the 37 samples of turkey meat contained DNSH (range:
0.05–0.6 µg/kg) (Vahl, 2005).
Meat-based products (chicken and pork) mainly of Asian origin were tested for the presence of AOZ,
AMOZ, AHD and SEM. Analysis was done by LC/MS-MS (CCα/CCβ: 0.11/0.19, 0.12/0.21,
0.21/0.36 and 0.20/0.34 µg/kg, respectively). More than 100 samples were tested (precise number and
Nitrofurans in food
EFSA Journal 2015;13(6):4140 31
year of sampling not indicated). AOZ was detected in 15 % of the samples (median: 0.6 µg/kg;
maximum: 193 µg/kg) and AMOZ was detected in 10 % of the samples (median: 0.5 µg/kg;
maximum: 9 µg/kg). SEM was most frequently detected (21 %, median: 10.9 µg/kg; maximum:
19.6 µg/kg), while AHD was not found in any of the samples (Mottier et al., 2005).
AOZ was analysed in samples of chicken liver (n = 90) collected from local supermarkets and retail
stores in Turkey between December 2008 and August 2009. A commercial ELISA kit was used with
an LOD of 0.1 µg/kg. AOZ was detected in 11 samples (12 %) with a concentration between 0.1 and
1 µg/kg (Yibar et al., 2012).
Radovnikovic et al. (2013) reported the analysis of samples of bovine liver (n = 316), ovine liver
(n = 62), porcine liver (n = 104) and poultry liver (n = 80) that had been undertaken in the framework
of the Irish national residue monitoring plan between 2009 and 2010. Analysis was done using
UHPLC-MS/MS for AOZ, AMOZ, AHD and SEM (CCα: 0.067, 0.073, 0.074 and 0.064 µg/kg,
respectively). SEM was detected in four ovine liver samples at concentrations ranging from 0.122 to
0.258 µg/kg. The other nitrofuran marker metabolites were not detected.
5.1.2. Honey
An LC-MS/MS method was used to analyse AOZ, AMOZ, AHD and SEM in more than 120 honey
samples of different geographical origins that were collected from various honey suppliers and retail
outlets in Switzerland in 2002 and 2003. The CCα/CCβs were 0.12/0.18, 0.07/0.12, 0.46/0.56 and
0.36/0.43 µg/kg, respectively. AMOZ and AHD were not detected in any of the samples. AOZ and
SEM were detected in 14 and 21 % of the samples, with maximum concentrations of 5.1 and
24.5 µg/kg, respectively (Khong et al., 2004).
Between 2007 and 2009, 55 honey samples were collected from local apiaries in Romania and
analysed for AOZ and AMOZ with a commercial ELISA kit (LOD/LOQ/CCα/CCβ not reported).
AOZ was detected in six samples at concentrations ranging from 0.63 to 0.89 µg/kg and AMOZ was
detected in five samples at concentrations ranging from 0.84 to 0.89 µg/kg (Simion et al., 2012).
Radovnikovic et al. (2013) reported the analysis of honey samples (n = 271) that had been undertaken
in the framework of the Irish national residue monitoring plan and during an additional retail survey
between 2009 and 2010. Analysis was done using UHPLC-MS/MS for AOZ, AMOZ, AHD and SEM
(CCα: 0.093, 0.096, 0.138 and 0.090 µg/kg, respectively). SEM was detected in nine samples at
concentrations ranging from 0.091 to 1.27 µg/kg. The other nitrofuran marker metabolites were not
detected.
5.1.3. Fish and other seafood
Because SEM may be released from a naturally occurring compound in the shell of shrimps, prawns
and crayfish (Saari and Peltonen, 2004; Van Poucke et al., 2011; McCracken et al., 2013; Crews,
2014), the part (e.g. meat, shell) of these shellfish tested in the studies below is described, where
known.
Fish (n = 16) and shrimp samples (n = 157, details on part tested not given) taken from the Swiss
market and mainly originating from Asian countries (year of sampling not indicated) were analysed
for AOZ, AMOZ, AHD and SEM using LC/MS-MS (LOD/LOQ: 0.2/0.5 µg/kg for AOZ, AMOZ and
SEM, and 0.5/1.0 µg/kg for AHD). Nitrofuran marker metabolites were found in 54 shrimp samples
(34 %) and five fish samples (31 %). In shrimps, both AOZ (range: 0.5–324 µg/kg) and SEM (range:
0.7–227 µg/kg) were found, while, in fish samples, only AOZ (range: 0.9–68 µg/kg) was detected. The
other nitrofuran marker metabolites were not detected (Edder et al., 2003).
Saari and Peltonen (2004) analysed SEM in crayfish (meat part tested) caught from rivers not near
aquaculture farming that had been boiled in fresh salty water (year of sampling not indicated). The
analysis was done by LC-MS/MS (LOD/LOQ: 0.04/0.4 µg/kg). SEM was quantified in all samples
Nitrofurans in food
EFSA Journal 2015;13(6):4140 32
(mean: 4.2 µg/kg; range: 0.7–12 µg/kg; n = 18). Tissue-bound SEM was detected in 12 samples and
quantified in four samples (range: 0.4–0.6 µg/kg).
FSANZ reported the analysis of AOZ, AMOZ, AHD and SEM in prawn samples (n = 136, details on
part tested not given). The limit of reporting for all nitrofuran marker metabolites was 1 µg/kg. AHD
was not detected in any of the samples. AMOZ was detected in one sample at a concentration of
2.2 µg/kg and SEM was detected in a sample of dried prawn at a concentration of 8.9 µg/kg. AOZ was
found in 10 samples at concentrations ranging from 1.1 to 40 µg/kg (FSANZ, 2004).
In the framework of a Canadian total diet study, 12 composite samples of marine, freshwater and
canned fish and shrimps (meat part tested) were collected between 2002 and 2004. AOZ, AMOZ,
AHD and SEM were analysed using LC-MS (LOD: 0.1 µg/kg for AOZ, AMOZ and AHD, and
0.4 µg/kg for SEM). AOZ was detected in two composite shrimp samples (1.3 and 0.5 µg/kg) and
SEM was detected in one composite shrimp sample (0.8 µg/kg). The other nitrofuran marker
metabolites were not detected (Tittlemier et al., 2007).
In Belgium, an increase of positive SEM analyses of prawns (Macrobrachium rosenbergii) was
observed in 2008–2009 compared with other EU Member States. It was noted that Belgium analysed
the whole prawns (meat and shell) while other countries used only the edible part (meat). Therefore,
Van Poucke et al. (2011) analysed 12 samples of crustaceans for the occurrence of tissue-bound SEM
in the meat and shell by LC-MS/MS (LOD: 0.5 µg/kg). SEM was detected in the shell of 11 samples
at concentrations ranging from 1.5 to 12.6 µg/kg, while it was detected in the meat of only one sample
at a much lower concentration (0.6 µg/kg) (Van Poucke et al., 2011).
Radovnikovic et al. (2013) reported the analysis of samples of prawns (n = 88, details on part tested
not given), sea bass (n = 7), trout (n = 24) and salmon (n = 71) that had been undertaken in the
framework of the Irish national residue monitoring plan and during an additional retail survey between
2009 and 2010. Analysis was done using UHPLC-MS/MS for AOZ, AMOZ, AHD and SEM (CCα:
0.041, 0.061, 0.057 and 0.064 µg/kg, respectively). SEM was detected in three prawn samples
(reported range: 0.159–0.206 µg/kg) and one salmon sample (0.088 µg/kg). AOZ was detected in two
prawn samples at a concentration above the MRPL (reported concentrations: 1.144 µg/kg and
1.626 µg/kg). AMOZ and AHD were not detected.
McCracken and co-workers analysed SEM using LC-MS/MS (CCα: 0.06 µg/kg) in wild-caught
shrimps from 29 sites across Bangladesh (upstream, downstream or around M. rosenbergii aquaculture
sites; year of sampling not indicated). Tissue-bound SEM was detected in approximately 65 % of the
meat samples at concentrations below the MRPL of 1 µg/kg and concentrations were unrelated to
sampling location, suggesting natural occurrence. In addition, higher concentrations were observed in
the shell than in the meat, and higher concentrations were also observed in the outer meat layer
(epidermis) than in the core meat (McCracken et al., 2013).
Crustacean samples (n = 17, details on part tested not given) were collected from local markets in
Almeria (Spain; year of sampling not indicated) and analysed using UHPLC-MS/MS for AOZ,
AMOZ, AHD and SEM (CCα/CCβ/LOD/LOQ: 1.5/1.6/0.5/1.0, 2.0/2.3/0.6/1.0, 2.0/2.2/0.8/1.0 and
2.6/3.1/0.6/1.0 µg/kg, respectively). The tested nitrofuran marker metabolites were not detected in any
of the samples (Valera-Tarifa et al., 2013).
5.1.4. Eggs
Radovnikovic et al. (2013) reported the analysis of egg samples (n = 52) that had been undertaken in
the framework of the Irish national residue monitoring plan between 2009 and 2010. Analysis was
done using UHPLC-MS/MS for AOZ, AMOZ, AHD and SEM (CCα: 0.066, 0.079, 0.079 and
0.074 µg/kg, respectively). None of the marker metabolites was identified in the samples.

Nitrofurans in food
EFSA Journal 2015;13(6):4140 33
5.2. Current occurrence results
5.2.1. Data sources
Data on the occurrence of nitrofurans and their marker metabolites in food are not currently collected
by EFSA. The only analytical results on nitrofurans and their marker metabolites present in the EFSA
Chemical Occurrence database have been voluntarily submitted by the Czech Republic (584),
Denmark (10 232) and Spain (40), and are all left-censored (LOD/CCα/CCβ: ≤ 1 µg/kg). Information
on the above-mentioned data is presented in Appendix B, Table B.1. The Czech Republic and
Denmark confirmed that the same data were also submitted to the EC database on residues of
veterinary medicines, relating to the national residue monitoring plan (see below).
5.2.1.1. National residue monitoring plans
Council Directive 96/23/EC on measures to monitor certain substances and residues thereof in live
animals and animal products requires that Member States draft a national residue monitoring plan for
the groups of substances detailed in Annex I of this Directive. These plans must comply with the
sampling rules in Annex IV of the Directive. Nitrofurans and their marker metabolites are in Group
A6 of prohibited substances, as listed in Table 2 of Commission Regulation (EU) No 37/2010, for
which MRLs cannot be established. These substances are not allowed to be administered to food-
producing animals.
The minimum number of each species of animal to be controlled each year for all kinds of residues
and substances is specified as a proportion of the animals of each species slaughtered in the previous
year. In the case of Group A substances, substances having anabolic effects and unauthorised
substances, a proportion of the total samples taken are to come from live animals or related materials
(feed, drinking water, urine, faeces, etc.) on farms and the remainder of the samples are to be taken at
the slaughterhouse. Each subgroup of Group A, such as Group A6, which includes nitrofurans and
their marker metabolites, must be checked each year using a minimum of 5 % of the total number of
samples to be collected for Group A. Sampling under the national residue monitoring plan should be
targeted; samples should be taken on-farm and at slaughterhouse level with the aim of detecting illegal
treatment.
Member States submit data on the occurrence of non-compliant results determined in the residue
monitoring, including for nitrofurans and their marker metabolites, to the EC database on residues of
veterinary medicines. Data on the occurrence of nitrofurans and their marker metabolites in food have
been extracted from the EC database on residues of veterinary medicines. This database contains the
annual sampling plan and the results from 2004 onwards29
provided by all Member States. The results
are reported as aggregate data with the following level of detail:
animal category and animal products: bovines, pigs, sheep and goats, horses, poultry,
aquaculture, milk, eggs, rabbits, farmed game, wild game and honey;
production volume;
sampling strategy: targeted, suspect, import and others;
number of samples analysed for each substance group as defined in Annex I of Council
Directive 96/23/EC and for each animal category or animal product;
number of non-compliant results within each substance group or subgroup and within each
animal category or animal product;
place of sampling: farm or slaughterhouse.
29 The results for 2013 currently present in the European Commission’s database are provisional and will be complete and
available at the end of 2014.

Nitrofurans in food
EFSA Journal 2015;13(6):4140 34
However, there is no indication of the sample matrix tested (muscle, blood, urine, kidney, fat, etc.) and
no concentration for the chemical residue or contaminant detected in the sample is provided. In
addition, the number of samples analysed for the individual substances are reported by the Member
States only if there is at least one non-compliant sample for the substance in question. Where all
samples are compliant, the number of samples analysed is not reported. Furthermore, where controls
are carried out at farm and slaughterhouse, the total number of samples recorded may refer to samples
taken at either farm or slaughterhouse, depending on where the non-compliant samples were found,
and this may be on a substance group basis rather than on the individual substance basis. Where non-
compliant samples were found at both farm and slaughterhouse, the number of samples represents the
sum of samples taken at both sampling points.
Data on nitrofurans and their marker metabolites reported by Member States during 2002 and 2003
have been extracted from the Commission staff working papers on the implementation of national
residue monitoring plans in the Member States in 2002 and 2003. Unfortunately, the data presented in
these papers are not consistent with the reports for the following years. The number of samples
analysed for each food category represents in most cases the total of samples for all prohibited
substances. Only for the food categories of bovines, pigs, poultry, and sheep and goats does the
number of samples represent those analysed for the Group A6 substances only, which includes
nitrofurans and their marker metabolites.
5.2.1.2. Rapid Alert System for Food and Feed
The CONTAM Panel considered the Rapid Alert System for Food and Feed (RASFF) 30
database as
another source of information on the occurrence of nitrofurans and their marker metabolites in food.
RASFF notifications mostly concern controls at the outer European Economic Area (EEA) borders at
points of entry or border inspection posts when a consignment is not accepted for import into the EU.
The second largest category of notifications concerns official controls on the internal market. A small
number of notifications are triggered by an official control in a non-member country, where a risk
found during its official controls concerning a product that may be on the market in one of the member
countries is transmitted to the RASFF network.
After an inspection is conducted within a country and unfavourable results of the analysis are
obtained, the risk needs to be evaluated, as does the probability that the product may be present on the
market of other member countries. Notifications are provided when non-compliant samples for a
contaminant are found, providing also quantified values. However, information on the total number of
samples analysed, the number of compliant samples, the concentrations and the type of analysis
undertaken is rarely provided.
Searches in the RASFF database were performed for the hazard category ‘veterinary residues’—
nitrofuran (metabolite)— that had been notified between 01/01/2002 and 31/12/2014.
5.2.2. Distribution of samples across food categories
5.2.2.1. National residue monitoring plans
In the period 2002–2013, 842 294 targeted samples (ranging from about 58 000 to 91 000 per year)
were analysed for Group A6 prohibited substances by the European Member States.31
While this
number includes all A6 prohibited substances, the number of samples analysed for nitrofuran marker
metabolites is unknown. For nitrofurans and their marker metabolites, the results shown in the residue
database are as follows:
30 http://ec.europa.eu/food/safety/rasff/docs/rasff_annual_report_2013.pdf 31 The data for 2013 were extracted from the database between January 2015 and February 2015 and are reflective of the
database during this time period.
Nitrofurans in food
EFSA Journal 2015;13(6):4140 35
There were 214 targeted samples reported to be non-compliant for nitrofurans and their
marker metabolites distributed across the years, as shown in Table 1. Most cases were
detected in 2002 in poultry. In subsequent years, there was no clear trend.
The animal species in which nitrofurans and their marker metabolites were most commonly
reported were poultry, bovines, and sheep and goats with 105, 35 and 23 non-compliant cases,
respectively. Other categories for which non-compliant samples were reported include farmed
game, pigs, honey, rabbits, aquaculture, horses and wild game (Table 1).
The type of nitrofurans and their marker metabolites of which samples were found to be non-
compliant are shown in Table 2, with the highest number of non-compliant cases for AMOZ
owing to problems in poultry in 2002. AHD was detected in only a few cases.
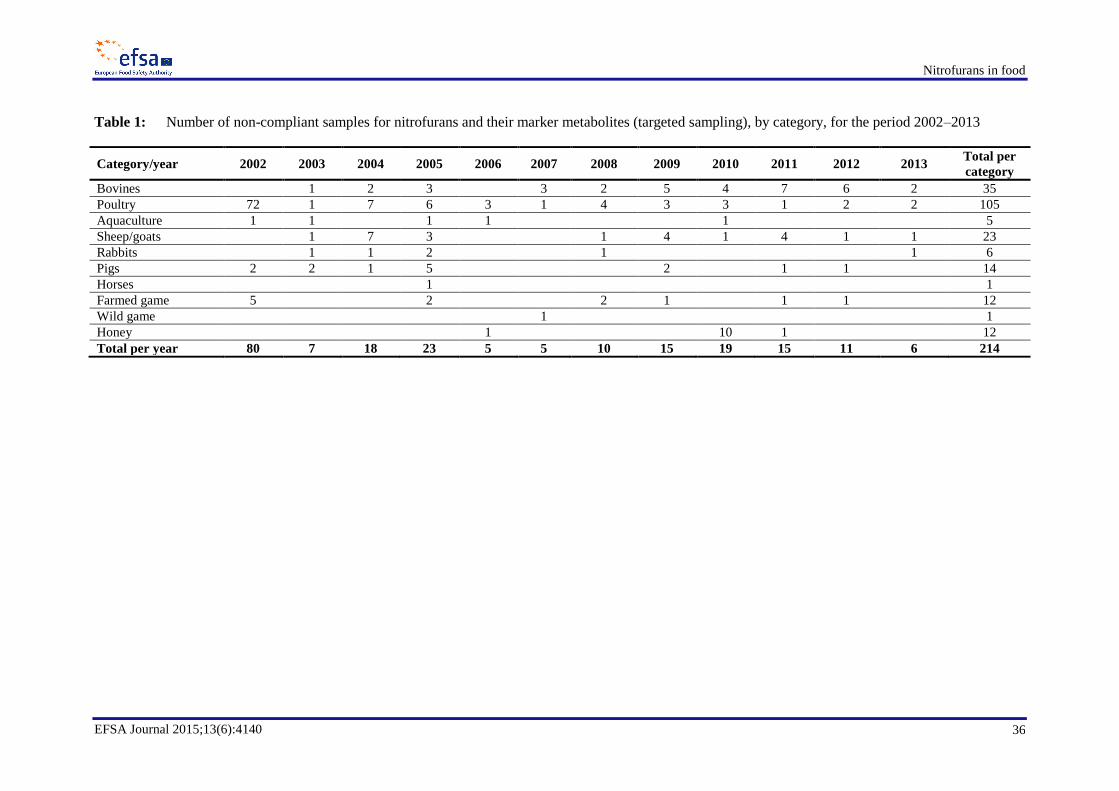
Nitrofurans in food
EFSA Journal 2015;13(6):4140 36
Table 1: Number of non-compliant samples for nitrofurans and their marker metabolites (targeted sampling), by category, for the period 2002–2013
Category/year 2002 2003 2004 2005 2006 2007 2008 2009 2010 2011 2012 2013 Total per
category
Bovines 1 2 3 3 2 5 4 7 6 2 35
Poultry 72 1 7 6 3 1 4 3 3 1 2 2 105
Aquaculture 1 1 1 1 1 5
Sheep/goats 1 7 3 1 4 1 4 1 1 23
Rabbits 1 1 2 1 1 6
Pigs 2 2 1 5 2 1 1 14
Horses 1 1
Farmed game 5 2 2 1 1 1 12
Wild game 1 1
Honey 1 10 1 12
Total per year 80 7 18 23 5 5 10 15 19 15 11 6 214

Nitrofurans in food
EFSA Journal 2015;13(6):4140 37
Table 2: Number of non-compliant samples, by nitrofuran and marker metabolite, for the period
2002–2013
Furazolidone(a)
/AOZ
Furaltadone(a)
/
AMOZ
Nitrofurantoin(a)
/
AHD
Nitrofurazone(a)
/
SEM
Nitrofuran not
specified(b)
2002 77 3
2003 1 2 1 3
2004 7 1 10
2005 9 1 9 4
2006 2 1 1 1
2007 1 2 2
2008 2 6 2
2009 2 1 12
2010 13 2 4
2011 1 4 10
2012 2 1 8
2013 3 3
Total 40 99 13 55 7
AHD: 1-aminohydantoin; AMOZ: 3-amino-5-methylmorpholino-2-oxazolidinone; AOZ: 3-amino-2-oxazolidinone; SEM:
semicarbazide.
(a): The CONTAM Panel noted the different ways of reporting among Member States, as some report the parent compound
and others report the marker metabolite.
(b): The samples are reported as being analysed for nitrofurans without specifying the identity of the nitrofuran or the marker
metabolite.
5.2.2.2. Rapid Alert System for Food and Feed
The findings in the RASFF database for nitrofurans and their marker metabolites for the period 2002–
2014 are shown below:
There were 808 notification events32
reported for nitrofuran marker metabolites in food
products (Table 3).
The notifications covered the following product categories: cephalopods and products thereof,
crustaceans and products thereof, eggs and egg products, farmed crustaceans and products
thereof,33
farmed fish and products thereof (other than crustaceans and molluscs),33
fish and
fish products, food additives and flavourings, honey and royal jelly, meat and meat products
(other than poultry), poultry meat and poultry meat products, prepared dishes and snacks,
wild-caught crustaceans and products thereof33
and wild-caught fish and products thereof
(other than crustaceans and molluscs).33
The two products categories for which the highest numbers of notification events were
reported were crustaceans and products thereof and poultry meat and poultry meat products,
with 416 and 150 notification events, respectively. The majority of the cases were in 2002 and
2003, but in subsequent years there was no real trend.
The notification events34
were reported for the four nitrofuran marker metabolites (AOZ,
AMOZ, SEM and AHD) across the years as seen in Table 4. Most reports were for AOZ and
SEM, followed by AMOZ (incident in 2002), and there were only a few cases for AHD.
32 The total number of notification events is not the sum of the total number of notifications, because one notification event
may include more than one notification. Notification events include alerts, border rejections, information, information for
attention, information for follow-up and news. 33 This product category is no longer used in the RASSF database. 34 One notification event could report more than one marker metabolite. There were 27 notification events where the marker
metabolite was not specified (18 for 2002, one for 2003, two for 2008, one for 2009, one for 2010, two for 2011, one for
2012 and one for 2013).

Nitrofurans in food
EFSA Journal 2015;13(6):4140 38
Table 3: Number of notification events in the Rapid Alert System for Food and Feed database for nitrofurans and their marker metabolites in food, by
category, for the period 2002–2014
Category 2002 2003 2004 2005 2006 2007 2008 2009 2010 2011 2012 2013 2014
Cephalopods and products thereof 1 1
Crustaceans and products thereof 68 11 31 33 54 33 50 87 11 10 9 5 14
Eggs and egg products 13
Farmed crustaceans and products thereof 18 37
Farmed fish and products thereof (other than
crustaceans and molluscs)
1 28
Fish and fish products 7 1 3 3 2 2 2 1 5 20
Food additives and flavourings 2
Honey and royal jelly 2 5 4 1 1 1 3 2 1
Meat and meat products (other than poultry) 7 12 3 2 1 7 1 3 1 4 1 4 4
Poultry meat and poultry meat products 88 55 4 2 1
Prepared dishes and snacks 1
Wild-caught crustaceans and products thereof 2 21
Wild-caught fish and products thereof (other than
crustaceans and molluscs)
1
Total 192 183 46 44 58 43 54 95 12 20 13 10 38

Nitrofurans in food
EFSA Journal 2015;13(6):4140 39
Table 4: Number of notification events in the Rapid Alert System for Food and Feed database, by
nitrofuran and marker metabolite in food, for the period 2002–2014
Furazolidone/
AOZ
Furaltadone/
AMOZ
Nitrofurantoin/
AHD
Nitrofurazone/
SEM
Nitrofuran not
specified(a)
2002 78 68 5 45 18
2003 95 27 2 69 1
2004 24 1 24
2005 15 3 27
2006 15 3 41
2007 27 2 1 16
2008 19 36 2
2009 12 1 83 1
2010 2 10 1
2011 9 10 2
2012 7 5 1
2013 4 5 1
2014 17 21
Total 324 105 8 392 27
AHD: 1-aminohydantoin; AMOZ: 3-amino-5-methylmorpholino-2-oxazolidinone; AOZ: 3-amino-2-oxazolidinone; SEM:
semicarbazide.
(a): The notification events do not specify the identity of the nitrofuran or the marker metabolite.
5.3. Food processing
Cooper and Kennedy (2007) studied the stability of nitrofuran marker metabolites during cooking and
freezing. Analysis was done using LC-MS/MS (CCα/CCβ: < 1.0 µg/kg). Muscle and liver of pigs,
treated with furazolidone, furaltadone, nitrofurantoin or nitrofurazone, were cooked by frying, grilling,
roasting and microwaving. The concentrations of AOZ, AMOZ, AHD and SEM in uncooked liver
were 51.3, 32.8, 41.0 and 40.2 µg/kg, respectively. Following correction for water loss during
cooking, frying caused a reduction of the marker metabolite concentration in the liver of 6 to 21 % and
roasting caused a reduction of 22 to 33 %. The concentrations of AOZ, AMOZ, AHD and SEM in
uncooked muscle were 45.6, 72.3, 25.4 and 240.9 µg/kg, respectively. Following correction for water
loss during cooking, grilling caused a reduction of the marker metabolite concentration in the liver of
0 to 14 % and similar results were observed for microwaving and roasting (0 to 15 %). Storage of liver
and muscle at –20 °C for 8 months did not cause a significant reduction of the concentrations of the
four studied marker metabolites.
Eggs from laying hens treated with nitrofurazone were used to study the effect of pasteurisation and
spray drying on the concentration of nitrofurazone and SEM in liquid egg. The nitrofurazone
concentration in whole egg decreased during processing from 502.1 to 177.6 µg/kg dry weight (d.w.)
(65 % reduction), in yolk from 267.6 to 151.9 µg/kg d.w. (43 % reduction) and in albumen from
1 085.6 to 44.5 µg/kg d.w. (96 % reduction). The SEM concentration in whole egg decreased during
processing from 676.5 to 330.7 µg/kg d.w. (51 % reduction), in yolk from 608.7 to 507.6 µg/kg d.w.
(17 % reduction) and in albumen from 954.3 to 264.5 µg/kg d.w. (72 % reduction). The authors
indicated that direct comparisons between residue concentrations in whole egg, yolk and albumen
cannot be made, because the pooled samples were derived from different populations of eggs (Cooper
et al., 2008a).
The effect of boiling on AOZ concentration in nitrofuran-positive eggs was studied by homogenising
13 eggs individually and splitting each egg into two parts. One part was immersed in water at 100 °C
for 10 minutes and the other part was analysed without heat treatment. The AOZ concentration in the
uncooked eggs was 0.76–0.97 µg/kg and was 2.04–2.55 µg/kg after cooking. No correction for water
loss during cooking was described. The authors postulated that the observed increase (p < 0.001) may
Nitrofurans in food
EFSA Journal 2015;13(6):4140 40
be a result of enhanced efficiency of extraction in boiled samples and proposed that boiled eggs be
used for the analysis of AOZ to obtain more reliable and more predictive results (Yibar et al., 2013).
Honey spiked with AOZ, AMOZ, AHD and SEM was processed to study the influence of the different
processing steps (preheating, filtration, concentration and pasteurisation) on the concentration of these
nitrofuran marker metabolites. The initial concentrations of the nitrofuran marker metabolites were
2.50, 1.83, 2.14 and 2.16 µg/kg, respectively. Overall, the initial concentration was reduced during
processing by 56.6, 71.3, 90.4 and 88.4 %, respectively. For AMOZ, AHD and SEM, the highest
reduction occurred during preheating (45 °C for 1 hour), namely 33.0, 74.9 and 76.9 %, while for
AOZ the highest reduction (33.7 %) occurred during filtration. The authors attributed the losses of the
marker metabolites from honey during processing to heat instability during preheating, lipophilicity
and wax removal during filtration, and volatility during concentration heating (Jia et al., 2014).
Overall, only limited information about the effect of food processing on nitrofuran marker metabolites
is available.
6. Food consumption
The EFSA Comprehensive European Food Consumption Database (Comprehensive Database) was
built in 2010 from existing detailed national information on food consumption provided by EU
Member States and food consumption data for children obtained through an EFSA Article 36 project
(Huybrechts et al., 2011). The Comprehensive Database contains results from a total of 32 different
dietary surveys carried out in 22 different Member States covering more than 67 000 individuals
(EFSA, 2011b).
Within the dietary studies, subjects are classified in different age classes as follows:
Infants: < 12 months old
Toddlers: ≥ 12 months to < 36 months old
Other children: ≥ 36 months to < 10 years old
Adolescents: ≥ 10 years to < 18 years old
Adults: ≥ 18 years to < 65 years old
Elderly: ≥ 65 years to < 75 years old
Very elderly: ≥ 75 years old
Overall, the food consumption data gathered by EFSA in the Comprehensive Database are the most
complete and detailed data currently available in the EU. However, it should be pointed out that
different methodologies were used between surveys to collect the data and thus direct country-to-
country comparisons can be misleading.
The CONTAM Panel considered that only chronic exposure to nitrofurans and their marker
metabolites needed to be assessed. As suggested by the EFSA Working Group on Food Consumption
and Exposure (EFSA, 2011b), dietary surveys with only one day per subject were not considered, as
they are not adequate to assess repeated exposure. Similarly, subjects who participated only one day in
the dietary studies, when the protocol prescribed more reporting days per individual, were also
excluded for the chronic exposure assessment. Thus, for chronic exposure assessment, food
consumption data were available from 26 different dietary surveys carried out in 17 different European
countries. These included infants from two surveys (two countries), toddlers from seven surveys
(seven countries), other children from 15 surveys (13 countries), adolescents from 12 surveys
Nitrofurans in food
EFSA Journal 2015;13(6):4140 41
(10 countries), adults from 15 surveys (14 countries), the elderly from seven surveys (seven countries)
and the very elderly from six surveys (six countries) (Appendix C, Table C.1).
Consumption records were codified based on the FoodEx classification system, which was developed
by the DATA Unit in 2009 (EFSA, 2011a). Further details on how the Comprehensive Database is
used are published in the Guidance of EFSA (2011b).
7. Exposure assessment
7.1. Previously reported human exposure assessments
Radovnikovic et al. (2013) studied the occurrence of nitrofuran marker metabolites in different foods
of animal origin (see Section 5.1). SEM was the nitrofuran marker metabolite most frequently found in
the tested samples. The exposure to SEM from prawns, salmon, honey and ovine liver was assessed
for the Irish population using a probabilistic approach. The 95th percentile of the middle-bound
dietary exposure was 0.04, 0.03 and 0.04 ng/kg b.w. per day, for adults, teenagers and children,
respectively. The 95th percentile of the lower-bound dietary exposure was 0.005, 0.003 and
0.005 ng/kg b.w. per day, for adults, teenagers and children, respectively.
In addition, several national agencies evaluated the dietary exposure from shrimps/prawns in which
AOZ had been detected (see Section 1.1).
7.2. Dietary exposure to nitrofuran marker metabolites for different scenarios
Only limited occurrence data on nitrofurans and their marker metabolites in food were available for
this opinion (see Section 5.2). Therefore, the CONTAM Panel concluded that these data are too
limited to carry out a reliable human dietary exposure assessment. Instead, the CONTAM Panel
calculated the hypothetical human chronic dietary exposure using the RPA value of 1 µg/kg for two
scenarios:
Scenario 1A, in which foods of animal origin, excluding milk and dairy products, are
contaminated with one nitrofuran marker metabolite at a concentration equal to the RPA level
of 1 µg/kg. These are mainly meat and meat products, fish and fish products, eggs and egg
products and honey.
Scenario 1B, in which foods of animal origin, including milk and dairy products, are
contaminated with one nitrofuran marker metabolite at a concentration equal to the RPA value
of 1 µg/kg.
The CONTAM Panel noted that the foods of animal origin that are contaminated with nitrofuran
marker metabolites, as reported in the EC database on residues of veterinary medicines and the
RASFF database (see Section 5.2.2), are meat and meat products, fish and fish products, eggs and egg
products and honey. These foods are included in scenario 1A. The CONTAM Panel emphasises that
this scenario, in which all the consumed foods (meat and meat products, fish and fish products, eggs
and egg products and honey) are considered to be contaminated with a nitrofuran marker metabolite at
the RPA of 1 µg/kg, represents a highly unlikely situation.
Although raw milk is sampled and analysed for the presence of nitrofuran marker metabolites by some
Member States in the EU (e.g. in 2013, 140 milk samples were analysed for the presence of AOZ,
AMOZ, AHD and SEM by 13 Member States), no non-compliant results for nitrofuran marker
metabolites in milk have been reported in the EC database and no notifications have been reported for
milk or milk products in the RASFF database. However, the CONTAM Panel is aware that, in the
past, furaltadone and nitrofurazone were used in dairy cattle, e.g. intramammary use to treat mastitis
(Huber, 1982). In addition, use in sheep and goats to treat coccidiosis has been reported (Robertson,
1982). Therefore, the occurrence of nitrofurans and their marker metabolites in milk and dairy
products owing to the illicit use of nitrofurans in individual diseased animals cannot be excluded. Milk

Nitrofurans in food
EFSA Journal 2015;13(6):4140 42
and milk products are included with the other foods of animal origin in scenario 1B. However, given
that the illicit use of nitrofurans on a widespread basis in dairy animals is highly unlikely and the
dilution effect of contaminated milk with uncontaminated milk that occurs at farm level (holding
tanks), during transport (bulk tankers) and at the dairy processing plant (milk silos), scenario 1B is
considered extremely unlikely.
The further scenario, in which all the foods included in scenarios 1A and 1B would be contaminated
with all five nitrofuran marker metabolites, each at 1 µg/kg, is considered to be totally unrealistic, as
samples containing multiple nitrofuran marker metabolites have not been found in the EC database on
residues of veterinary medicines and have only rarely been found in the RASFF database. Therefore,
this scenario was not considered.
To calculate a more refined dietary exposure to nitrofurans and their marker metabolites, the
CONTAM Panel also considered that the above-mentioned foods are also consumed as part of
composite dishes present in the FoodEx1 classification system. These are, for example, meat-based
meals, fish-based meals, egg-based meals, soups and salads. In addition, in the case of infants and
toddlers, meat and fish are normally consumed through ready-to-eat meals for infants and young
children. For all the above-mentioned cases where it was clearly stated in the name of the meal that
this was a mixture of meat or fish and other foods items (e.g. meat stew, fish and rice meal, fish and
potatoes meal, fish and vegetables meal, ready-to-eat meal for children, meat and vegetables, etc.), a
factor of 0.5 was applied, meaning that half of the quantity reported to be consumed was considered as
referring to the meat or fish and the other half to the other food items present in the dish. All
composite dishes and infants’ foods were grouped based on their main ingredient.
For calculating the chronic dietary exposure to nitrofurans and their marker metabolites, food
consumption and body weight data at the individual level were accessed in the Comprehensive
Database. Exposure estimates were calculated for 26 different dietary surveys carried out in
17 different European countries. Not all countries provided consumption information for all age
groups, and, in some cases, the same country provided more than one consumption survey.
Exposure was calculated by multiplying the occurrence concentration of 1.0 µg/kg for each food or
food group with the consumption amount per kg b.w. separately for each individual in the database,
calculating the sum of exposure for each survey day and then deriving the daily average for the survey
period.
The mean dietary exposure and the high dietary exposure (95th percentile) to nitrofuran marker
metabolites were calculated separately for each survey and age class using consumption data recorded
at individual level from the Comprehensive Database (see Section 6). In accordance with the
specification of the EFSA Guidance on the use of the Comprehensive Database (EFSA, 2011b), 95th
percentile estimates for dietary surveys/age classes with fewer than 60 observations may not be
statistically robust and therefore should not be considered in the risk characterisation.
As scenario 1B was considered extremely unlikely, this scenario was not used for the risk
characterisation, and exposure estimates are presented in Appendix D, Table D.1. For scenario 1A,
Table 5 provides per group the minimum, median and maximum of the mean and 95th percentile
exposure values across dietary surveys. The mean chronic dietary exposure to nitrofuran marker
metabolites ranges, for scenario 1A, from 1.7 to 8.0 ng/kg b.w. per day and the 95th percentile ranges
from 3.5 to 13 ng/kg b.w. per day across dietary surveys and age classes.
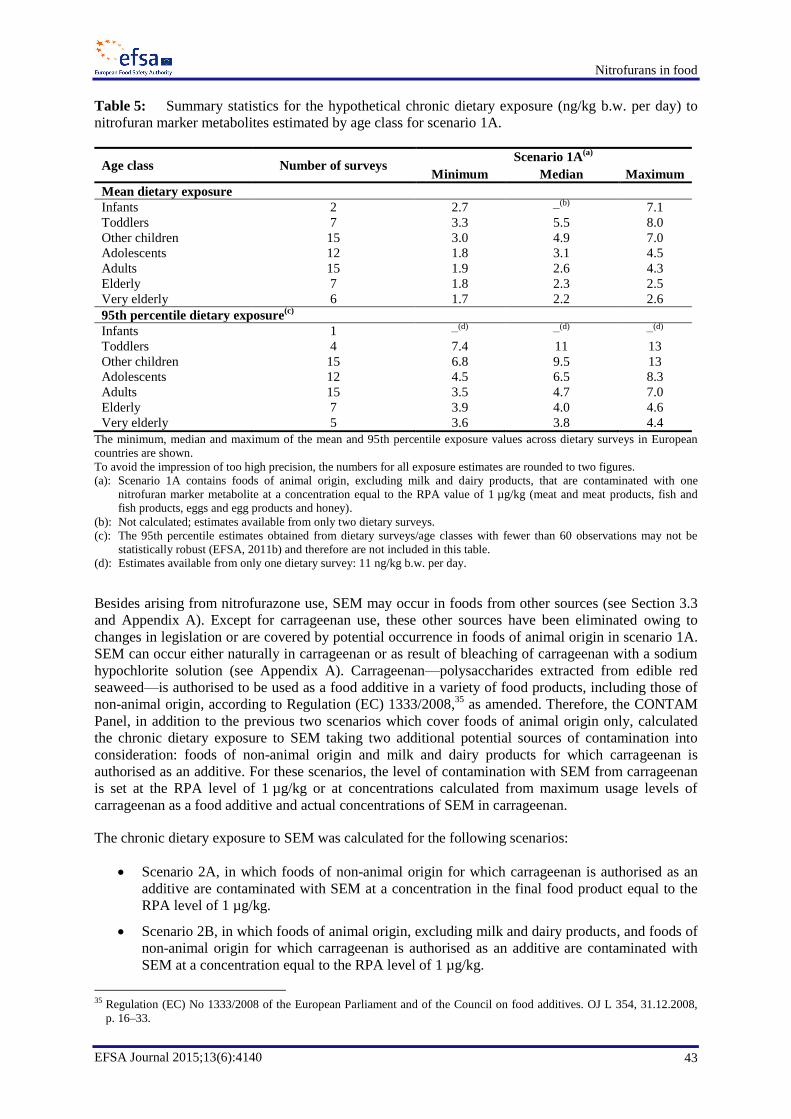
Nitrofurans in food
EFSA Journal 2015;13(6):4140 43
Table 5: Summary statistics for the hypothetical chronic dietary exposure (ng/kg b.w. per day) to
nitrofuran marker metabolites estimated by age class for scenario 1A.
Age class Number of surveys Scenario 1A
(a)
Minimum Median Maximum
Mean dietary exposure
Infants 2 2.7 –(b)
7.1
Toddlers 7 3.3 5.5 8.0
Other children 15 3.0 4.9 7.0
Adolescents 12 1.8 3.1 4.5
Adults 15 1.9 2.6 4.3
Elderly 7 1.8 2.3 2.5
Very elderly 6 1.7 2.2 2.6
95th percentile dietary exposure(c)
Infants 1 –(d)
–(d)
–(d)
Toddlers 4 7.4 11 13
Other children 15 6.8 9.5 13
Adolescents 12 4.5 6.5 8.3
Adults 15 3.5 4.7 7.0
Elderly 7 3.9 4.0 4.6
Very elderly 5 3.6 3.8 4.4
The minimum, median and maximum of the mean and 95th percentile exposure values across dietary surveys in European
countries are shown.
To avoid the impression of too high precision, the numbers for all exposure estimates are rounded to two figures.
(a): Scenario 1A contains foods of animal origin, excluding milk and dairy products, that are contaminated with one
nitrofuran marker metabolite at a concentration equal to the RPA value of 1 µg/kg (meat and meat products, fish and
fish products, eggs and egg products and honey).
(b): Not calculated; estimates available from only two dietary surveys.
(c): The 95th percentile estimates obtained from dietary surveys/age classes with fewer than 60 observations may not be
statistically robust (EFSA, 2011b) and therefore are not included in this table.
(d): Estimates available from only one dietary survey: 11 ng/kg b.w. per day.
Besides arising from nitrofurazone use, SEM may occur in foods from other sources (see Section 3.3
and Appendix A). Except for carrageenan use, these other sources have been eliminated owing to
changes in legislation or are covered by potential occurrence in foods of animal origin in scenario 1A.
SEM can occur either naturally in carrageenan or as result of bleaching of carrageenan with a sodium
hypochlorite solution (see Appendix A). Carrageenan—polysaccharides extracted from edible red
seaweed—is authorised to be used as a food additive in a variety of food products, including those of
non-animal origin, according to Regulation (EC) 1333/2008,35
as amended. Therefore, the CONTAM
Panel, in addition to the previous two scenarios which cover foods of animal origin only, calculated
the chronic dietary exposure to SEM taking two additional potential sources of contamination into
consideration: foods of non-animal origin and milk and dairy products for which carrageenan is
authorised as an additive. For these scenarios, the level of contamination with SEM from carrageenan
is set at the RPA level of 1 µg/kg or at concentrations calculated from maximum usage levels of
carrageenan as a food additive and actual concentrations of SEM in carrageenan.
The chronic dietary exposure to SEM was calculated for the following scenarios:
Scenario 2A, in which foods of non-animal origin for which carrageenan is authorised as an
additive are contaminated with SEM at a concentration in the final food product equal to the
RPA level of 1 µg/kg.
Scenario 2B, in which foods of animal origin, excluding milk and dairy products, and foods of
non-animal origin for which carrageenan is authorised as an additive are contaminated with
SEM at a concentration equal to the RPA level of 1 µg/kg.
35 Regulation (EC) No 1333/2008 of the European Parliament and of the Council on food additives. OJ L 354, 31.12.2008,
p. 16–33.
Nitrofurans in food
EFSA Journal 2015;13(6):4140 44
Scenario 2C, in which foods of animal origin, including only those milk and dairy products for
which carrageenan is authorised as an additive, and foods of non-animal origin for which
carrageenan is authorised as an additive are contaminated with SEM at a concentration equal
to the RPA level of 1 µg/kg.
Scenario 2D, in which foods of animal origin, excluding milk and dairy products, are
contaminated with SEM at a concentration equal to the RPA level of 1 µg/kg, and foods of
non-animal origin and milk and dairy products, for which carrageenan is authorised as an
additive, are contaminated with SEM at concentrations calculated from maximum usage levels
of carrageenan and actual concentrations of SEM in carrageenan.
For scenarios 2A to 2D above, the following information and data have been used:
1. The detailed list of foods for which carrageenan is authorised to be used, according to
Regulation (EC) 1333/2008, and their equivalent FoodEx1 food category.
2. Usage levels of carrageenan, reported by industry to EFSA through a public call for data,36
contained in the EFSA additive database.
3. The concentration of SEM in the final food products calculated based on the mean SEM
concentration of 65 µg/kg in carrageenan (AFC Panel, 2005; Appendix A) and the maximum
usage level of carrageenan in different food categories.
Appendix E, Table E.1, presents the food categories for which carrageenan is authorised as an
additive, the additive’s classification code, the maximum permitted level, the equivalent food category
in the FoodEx1 classification system of EFSA, the maximum usage level reported for the specific food
category and the concentration of SEM in the final food.
Scenario 2A represents the hypothetical human chronic dietary exposure to SEM from use of
carrageenan as a food additive in foods of non-animal origin, where all such foods would contain SEM
at a level equal to the RPA of 1 µg/kg. Scenario 2B represents the hypothetical human chronic dietary
exposure to SEM from use of carrageenan as a food additive in foods of non-animal origin (scenario
2A) and, in addition, from all meat and meat products, fish and fish products, eggs and egg products
and honey that are contaminated with nitrofurazone marker metabolite (scenario 1A), where all such
foods would contain SEM at a level equal to the RPA of 1 µg/kg. Scenario 2C is a further
development of scenario 2B in that it represents the hypothetical human chronic dietary exposure to
SEM from use of carrageenan as a food additive both in foods of non-animal origin and in milk
products and, in addition, from all meat and meat products, fish and fish products, eggs and egg
products and honey that are contaminated with nitrofurazone marker metabolite (scenario 1A), where
all such foods would contain SEM at a level equal to the RPA of 1 µg/kg. The CONTAM Panel
considers that all of these scenarios for human chronic dietary exposure to SEM represent highly
unlikely situations. However, scenario 2A provides a basis for assessing the appropriateness of
applying the RPA considered adequate to protect public health to commodities other than foods of
animal origin and was therefore used for the risk characterisation.
Scenario 2D is a refinement of scenario 2C in that, rather than using the RPA of 1 µg/kg as a measure
of the hypothetical human chronic dietary exposure to SEM from use of carrageenan as a food additive
in foods of non-animal origin and in milk products, the contamination of these foods with SEM is
considered to be at concentrations calculated from maximum usage levels of carrageenan and actual
concentrations of SEM in carrageenan. This scenario also includes the hypothetical human chronic
dietary exposure to SEM from all meat and meat products, fish and fish products, eggs and egg
products and honey that are contaminated with nitrofurazone marker metabolite at a level equal to the
RPA of 1 µg/kg. The CONTAM Panel, therefore, while considering scenario 2D to represent a highly
unlikely situation with respect to human chronic dietary exposure to SEM from all food sources,
36 Call for food additives usage level and/or concentration data in food and beverages intended for human consumption.
Published: 27 March 2013. Deadline 15 September 2013. Available at: http://www.efsa.europa.eu/en/data/call/130327.htm

Nitrofurans in food
EFSA Journal 2015;13(6):4140 45
considers it to be a less extreme scenario than scenario 2C. As the exposure to SEM from dairy
products in which carrageenan is used is not covered by scenarios 1A or 2A, the CONTAM Panel also
considered scenario 2C in the risk characterisation to evaluate the RPA of 1 µg/kg.
All exposure scenarios that were considered for SEM are summarised in Table 6.
Table 6: Exposure scenarios considered for the nitrofuran marker metabolites
Scenario
Sources of contamination
Foods of
animal origin,
excluding
milk and
dairy
products
Milk and
dairy
products
Milk and
dairy
products for
which
carrageenan
is authorised
Milk and
dairy
products for
which
carrageenan
is
authorised
Foods of non-
animal origin
for which
carrageenan
is authorised
Foods of
non-animal
origin for
which
carrageenan
is authorised
mm(a)
:
1 µg/kg
mm:
1 µg/kg
SEM(b)
:
1 µg/kg
SEM:
calculated
from use
SEM: 1 µg/kg
SEM:
calculated
from use
1A x
1B x x
2A x
2B x x
2C x x x
2D x x x
mm: marker metabolite; SEM: semicarbazide.
(a): Concentration of one nitrofuran marker metabolite.
(b): Concentration of SEM.
Table 7 summarises the hypothetical chronic dietary exposure (ng/kg b.w. per day) to nitrofuran
marker metabolites estimated by age class for scenarios 2A and 2C. For scenario 2A, the mean chronic
dietary exposure to nitrofuran marker metabolites ranges from 2.3 to 41 ng/kg b.w. per day and the
95th percentile ranges from 5.9 to 63 ng/kg b.w. per day across dietary surveys and age classes. For
scenario 2C, the mean chronic dietary exposure to nitrofuran marker metabolites ranges from 5.5 to
55 ng/kg b.w. per day and the 95th percentile ranges from 9.1 to 80 ng/kg b.w. per day across dietary
surveys and age classes.
The exposure estimates for scenarios 2B and 2D are shown in Appendix F.
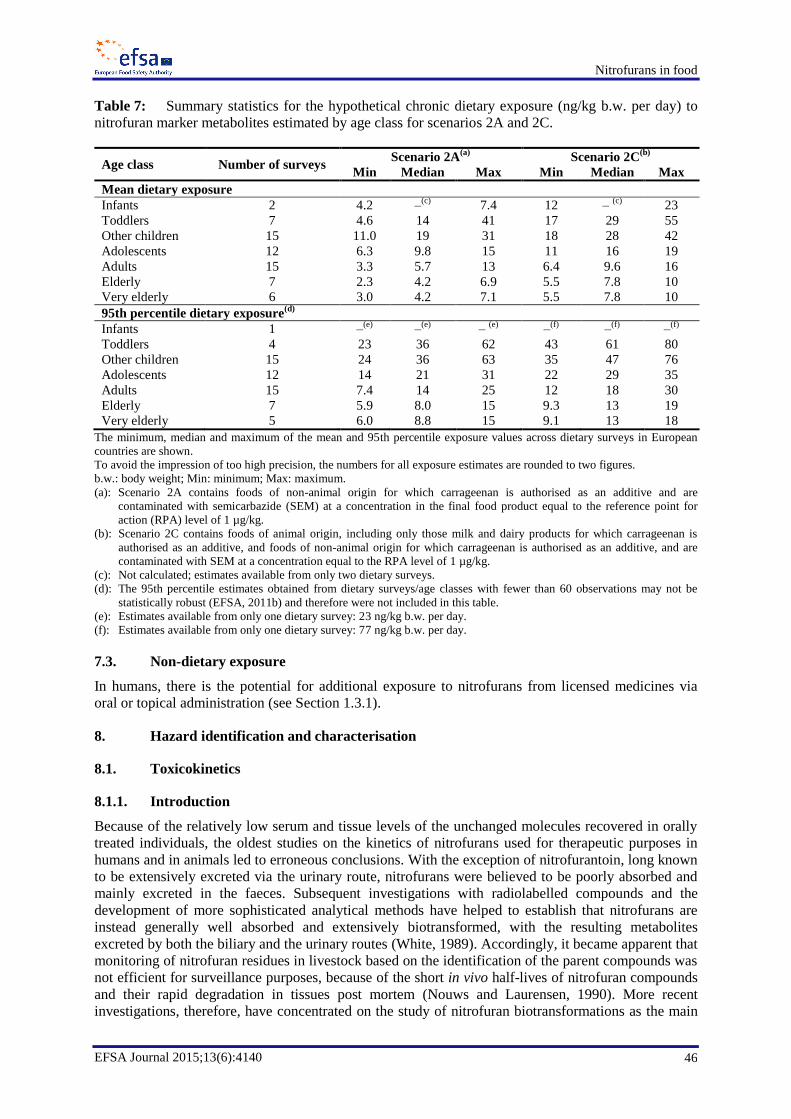
Nitrofurans in food
EFSA Journal 2015;13(6):4140 46
Table 7: Summary statistics for the hypothetical chronic dietary exposure (ng/kg b.w. per day) to
nitrofuran marker metabolites estimated by age class for scenarios 2A and 2C.
Age class Number of surveys Scenario 2A
(a) Scenario 2C
(b)
Min Median Max Min Median Max
Mean dietary exposure
Infants 2 4.2 –(c)
7.4 12 – (c)
23
Toddlers 7 4.6 14 41 17 29 55
Other children 15 11.0 19 31 18 28 42
Adolescents 12 6.3 9.8 15 11 16 19
Adults 15 3.3 5.7 13 6.4 9.6 16
Elderly 7 2.3 4.2 6.9 5.5 7.8 10
Very elderly 6 3.0 4.2 7.1 5.5 7.8 10
95th percentile dietary exposure(d)
Infants 1 –(e)
–(e)
– (e)
–(f)
–(f)
–(f)
Toddlers 4 23 36 62 43 61 80
Other children 15 24 36 63 35 47 76
Adolescents 12 14 21 31 22 29 35
Adults 15 7.4 14 25 12 18 30
Elderly 7 5.9 8.0 15 9.3 13 19
Very elderly 5 6.0 8.8 15 9.1 13 18
The minimum, median and maximum of the mean and 95th percentile exposure values across dietary surveys in European
countries are shown.
To avoid the impression of too high precision, the numbers for all exposure estimates are rounded to two figures.
b.w.: body weight; Min: minimum; Max: maximum.
(a): Scenario 2A contains foods of non-animal origin for which carrageenan is authorised as an additive and are
contaminated with semicarbazide (SEM) at a concentration in the final food product equal to the reference point for
action (RPA) level of 1 µg/kg.
(b): Scenario 2C contains foods of animal origin, including only those milk and dairy products for which carrageenan is
authorised as an additive, and foods of non-animal origin for which carrageenan is authorised as an additive, and are
contaminated with SEM at a concentration equal to the RPA level of 1 µg/kg.
(c): Not calculated; estimates available from only two dietary surveys.
(d): The 95th percentile estimates obtained from dietary surveys/age classes with fewer than 60 observations may not be
statistically robust (EFSA, 2011b) and therefore were not included in this table.
(e): Estimates available from only one dietary survey: 23 ng/kg b.w. per day.
(f): Estimates available from only one dietary survey: 77 ng/kg b.w. per day.
7.3. Non-dietary exposure
In humans, there is the potential for additional exposure to nitrofurans from licensed medicines via
oral or topical administration (see Section 1.3.1).
8. Hazard identification and characterisation
8.1. Toxicokinetics
8.1.1. Introduction
Because of the relatively low serum and tissue levels of the unchanged molecules recovered in orally
treated individuals, the oldest studies on the kinetics of nitrofurans used for therapeutic purposes in
humans and in animals led to erroneous conclusions. With the exception of nitrofurantoin, long known
to be extensively excreted via the urinary route, nitrofurans were believed to be poorly absorbed and
mainly excreted in the faeces. Subsequent investigations with radiolabelled compounds and the
development of more sophisticated analytical methods have helped to establish that nitrofurans are
instead generally well absorbed and extensively biotransformed, with the resulting metabolites
excreted by both the biliary and the urinary routes (White, 1989). Accordingly, it became apparent that
monitoring of nitrofuran residues in livestock based on the identification of the parent compounds was
not efficient for surveillance purposes, because of the short in vivo half-lives of nitrofuran compounds
and their rapid degradation in tissues post mortem (Nouws and Laurensen, 1990). More recent
investigations, therefore, have concentrated on the study of nitrofuran biotransformations as the main

Nitrofurans in food
EFSA Journal 2015;13(6):4140 47
determinants of their adverse effects (Rao and Mason, 1987; Dalvie et al., 2002; Boelsterli et al.,
2006) and the identification of metabolites to be used as proof of nitrofuran exposure in food-
producing species (Radovnikovic et al., 2011) and in animal production (McCracken et al., 2005a;
McCracken and Kennedy, 2007). In contrast with their parent compounds, it was found that residues
of nitrofuran metabolites may persist for several weeks in edible tissues owing to extensive protein
binding and are therefore suitable for residue monitoring purposes (Vass et al., 2008c).
There is sparse information about the biotransformation of nitrofurans and so it is difficult to provide a
general overview of the metabolic fate of the nitrofurans considered in this opinion. Some species-
related (Vroomen et al., 1990) and compound-related (Hoogenboom et al., 1994) differences in their
biotransformation pathways have been reported.
It is generally accepted that the metabolic degradation of nitrofurans involves the reductive
biotransformation of the 5-nitrofuran ring, which is quantitatively the most important reaction. In
addition, unlike the nitroaromatic compounds, in which the ring systems are generally refractory to
metabolic cleavage, the nitroheterocyclic rings are more prone to ring opening resulting in the
formation of open-chain metabolites (Kedderis and Miwa, 1988).
Like other nitroaromatic compounds, 5-nitrofurans may undergo a one-electron and a two-electron
reduction. The one-electron pathway leads to the formation of the nitroanion radical, which has been
demonstrated by electron paramagnetic resonance spectroscopy using spin traps; nitroanion radicals
may also be formed in the presence of catecholamine neurotransmitters and ascorbic acid (Rao and
Mason, 1987; Lax and Kukolich, 1992; Rossi et al., 1996). The nitroanion intermediate may then have
two different fates. Under aerobic conditions (Figure 2A) it can react, in a futile cycle, with molecular
oxygen being oxidised back to the parent compound and producing superoxide anion, which, in turn,
may generate other reactive oxygen species (ROS) (Boelsterli et al., 2006; Aracena et al., 2014). By
contrast, under anaerobic conditions, or in tissues with low oxygen tension, such as the renal inner
medulla and urinary bladder (Aperia and Leebow, 1964), the dismutation of the nitroanion radical may
occur yielding a nitroso-derivative (Figure 2B), which may be further reduced to a hydroxylamino-
and amino-derivative and then biotransformed to more stable metabolites (see below) (Zenser et al.,
1981; Fau et al., 1992).
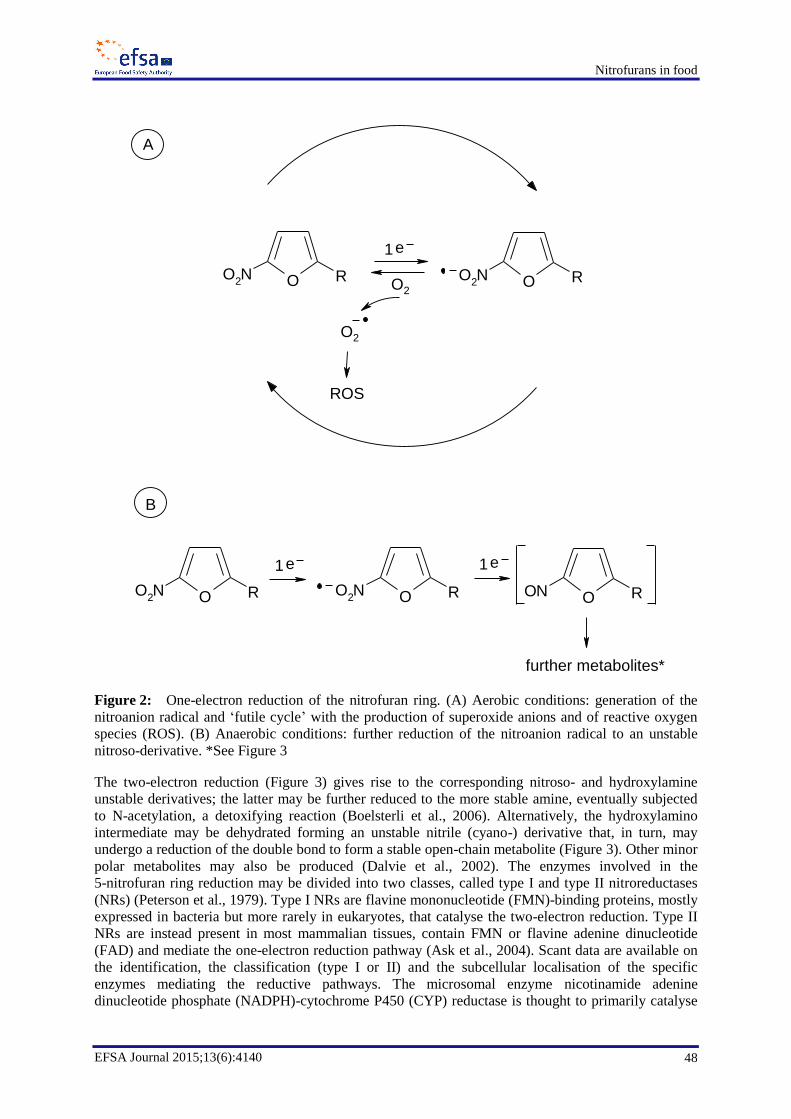
Nitrofurans in food
EFSA Journal 2015;13(6):4140 48
Figure 2: One-electron reduction of the nitrofuran ring. (A) Aerobic conditions: generation of the
nitroanion radical and ‘futile cycle’ with the production of superoxide anions and of reactive oxygen
species (ROS). (B) Anaerobic conditions: further reduction of the nitroanion radical to an unstable
nitroso-derivative. *See Figure 3
The two-electron reduction (Figure 3) gives rise to the corresponding nitroso- and hydroxylamine
unstable derivatives; the latter may be further reduced to the more stable amine, eventually subjected
to N-acetylation, a detoxifying reaction (Boelsterli et al., 2006). Alternatively, the hydroxylamino
intermediate may be dehydrated forming an unstable nitrile (cyano-) derivative that, in turn, may
undergo a reduction of the double bond to form a stable open-chain metabolite (Figure 3). Other minor
polar metabolites may also be produced (Dalvie et al., 2002). The enzymes involved in the
5-nitrofuran ring reduction may be divided into two classes, called type I and type II nitroreductases
(NRs) (Peterson et al., 1979). Type I NRs are flavine mononucleotide (FMN)-binding proteins, mostly
expressed in bacteria but more rarely in eukaryotes, that catalyse the two-electron reduction. Type II
NRs are instead present in most mammalian tissues, contain FMN or flavine adenine dinucleotide
(FAD) and mediate the one-electron reduction pathway (Ask et al., 2004). Scant data are available on
the identification, the classification (type I or II) and the subcellular localisation of the specific
enzymes mediating the reductive pathways. The microsomal enzyme nicotinamide adenine
dinucleotide phosphate (NADPH)-cytochrome P450 (CYP) reductase is thought to primarily catalyse
OO2N R OO
2N R
e1
O2
OO2N R
e1
OON R
e1
OO2N R
B
O2
ROS
further metabolites*
A

Nitrofurans in food
EFSA Journal 2015;13(6):4140 49
this reaction, but xanthine oxidase, aldehyde dehydrogenase, mitochondrial NRs and nitric oxide
synthases have also been implicated in this pathway (Boelsterli et al., 2006). Bacterial NRs expressed
in a number of species found in the gut flora have also been shown to perform the 5-nitrofurans
reduction (Hoogenboom et al., 1994; Ryan et al., 2011).
The oxidation of certain nitrofurans may also occur. Furaltadone is reported to undergo N-oxidation of
the tertiary nitrogen of the morpholino ring in pig hepatocytes; interestingly, the resulting N-oxide
derivative is not subjected to further metabolism to an open-chain nitrile derivative, which is instead
produced upon the incubation of furaltadone with S. Typhimurium bacteria (Hoogenboom et al.,
1994). Finally, the isolation of urinary 4-hydroxylated derivatives of a number of nitrofurans has also
been reported in rats, rabbits, swine and chickens (Swaminathan and Lower, 1978; Streeter et al.,
1988).
Figure 3: Two-electron reduction of the nitrofuran ring with generation of a stable (N-acetyl)
amino-derivative or a number of reactive intermediates capable of reversibly binding to thiol groups
and to proteins (NAT, N-acetyltransferases)
There is a general consensus that the nitroreductive pathway is clearly linked to the bioactivation of
nitrofurans. Owing to their ability to form covalent adducts with macromolecules, unstable metabolites
arising from the nitroreduction have been implicated in both the cytotoxic and the mutagenic effects of
nitrofurans, as well as in the formation of the tissue-bound residues. All the metabolites giving rise to
tissue-bound residues include an intact side-chain that is currently used as the marker residue for the
nitrofurans under consideration (see Section 1.2). Finally, such metabolites may be released in the
stomach of several species and be responsible for other adverse effects, such as monoamine oxidase
OO2N R OON R
OHOHN R
O RNH2
O RH3COCHN
OHN R
OC
RN
OC
RN
S X
X SH
OC
RN
nitroso-derivative
cyano-derivative
e2
e2
NAT
+covalent adducts
with macromolecules
reversible bindingwith thiol groups
polar metabolites
reversiblebinding
with proteins
DNA ?
e2
hydroxylamino-derivative
amino-derivative
N-acetylamino-derivative
nitrenium-derivative
nitrile-derivative
Nitrofurans in food
EFSA Journal 2015;13(6):4140 50
(MAO) inhibition (Yeung and Goldman, 1981). The exposure to nitrofurans results in an increased
intracellular oxidative stress as reflected by the generation of superoxide anions and other toxic ROS.
While the redox cycling of the nitroanion and/or the nitroso intermediates are mainly involved in the
generation of oxidant species, other pathways such as the related alteration of the NADP+ to NADPH
ratio and the depletion of glutathione (GSH) and of other critical thiol groups may participate in the
enhancement of the nitrofuran-mediated oxidative stress (Boelsterli et al., 2006). GSH and other thiols
may prevent the formation of certain reactive nitrofuran derivatives (Lax and Kukolich, 1992) and,
under certain conditions, may also be depleted upon in vitro exposure to certain nitrofurans
(Hoogenboom et al., 1992b; De Angelis et al., 1999). However, it should be noted that the nature of
the reactive chemical species which bind to thiol groups has yet to be fully elucidated (and may vary
with the different compounds). The formation of a GSH conjugate with the nitroanion derivatives of
nitrofurazone and other 2-substituted nitrofurans could not be demonstrated in vitro (Polnaszek et al.,
1984). Conflicting reports are available for nitrofurantoin, as the thiyl conjugate of the nitroanion
metabolite detected by Nuñez-Vergara et al. (2000) by means of a spin trapping technique was not
identified in other reports (Miller et al., 2002).
While the formation of GSH conjugates with nitroso- or hydroxylamino-derivatives cannot be
excluded, in vitro studies with swine liver microsomes or hepatocytes suggest that, in the case of
furazolidone, an open-chain acrylonitrile derivative identified as N-(4-cyano-2-oxo-3-butenylidene)-3-
amino-2-oxazolidinone may be trapped by thiol-containing compounds such as GSH or
mercaptoethanol (Vroomen et al., 1987b; Hoogenboom et al., 1992b) leading to the formation of
unstable reversible conjugates. In fact, at physiological pH, the acrylonitrile derivative may be
released and become covalently bound to cellular proteins forming protein adducts (Hoogenboom et
al., 1992b). When incubated with thiols, the acrylonitrile derivative can be released from the protein
again. The behaviour of such an intermediate is similar to that displayed by thiols in the reaction with
α,β-unsaturated ketones, referred to as Michael and ‘retro-Michael’ reaction (Vroomen et al., 1988). It
is unclear to what extent these unstable thiol adducts of nitrofurans play a role in vivo, as incubations
of tissues from treated pigs with mercaptoethanol did not result in the formation of the
mercaptoethanol conjugate (Vroomen et al., 1990).
At low pH, as in the stomach of many species, the azomethine bond (C=H) between the two parts of
the molecule can be cleaved resulting in the release of the side-chain. Only in the case of pigs treated
orally with furazolidone was it investigated and shown that the side-chain (in this case AOZ) is
actually a metabolite occurring in the blood (Hoogenboom et al., 2002).
Finally, it has been demonstrated that some nitrofurans (nitrofurantoin and furaltadone) are able to
cross the placental barrier in a variety of mammalian species (Buzard and Conklin, 1964; Perry and
LeBlanc, 1967; Zhang et al., 2007), while data on the mammary excretion of the parent compounds
are available for nitrofurantoin only. There is also evidence that nitrofuran metabolites may be
excreted in (dairy) milk (Chu and Lopez, 2007) and eggs (McCracken and Kennedy, 2007).
8.1.2. Humans
Only very limited information is available concerning the pharmacokinetics of furazolidone. Ten
healthy adults (weight, gender and age not specified) were orally administered 400 mg furazolidone in
doses of 200 mg each for 21 days and the levels of the unchanged drug were determined in daily
collected plasma and urine samples with an HPLC method. A wide range of plasma concentrations
were reported (0.002–0.489 µg/mL) while the urinary excretion rates varied from 0.003 to 0.06 % of
the daily dose. The authors conclude that furazolidone appears to be extensively metabolised in
humans (Guinebault et al., 1981, as reported in White, 1989).
A single tablet of a commercial formulation containing 200 mg furazolidone (Giarlam™) was
administered to 18 human volunteers (body weight range 55–100 kg); blood was collected 0.5, 1, 1.5,
2, 3, 4, 6, 8, 12, 18 and 24 hours after dosing and the drug concentrations were measured by an HPLC
method (LOD: 0.01 µg/mL; LOQ: 0.05 µg/mL). Kinetic data pointed to a good bioavailability of the

Nitrofurans in food
EFSA Journal 2015;13(6):4140 51
drug after oral administration, being detectable in serum as soon as 30 minutes after treatment and
reaching a maximum serum concentration (Cmax; 0.34 µg/mL) within the first 3 hours, with a t1/2 of
4.87 hours (Calafatti et al., 2001).
The kinetics of nitrofurantoin were reviewed by Mandell and Sande (1985). It is rapidly and
extensively absorbed by the gastrointestinal tract; slower absorption and urinary excretion rates and a
lower incidence of adverse effects have been reported for the macrocrystalline form of nitrofurantoin
than for the microcrystalline one (D’Arcy, 1985; Cunha, 1988; Brumfitt and Hamilton-Miller, 1998).
Nowadays, mostly macrocrystalline nitrofurantoin is used (see section 1.3.1) but there are still a few
formulations that contain the microcrystalline form. Only in a few studies the particle size was
specified (Conklin and Hailey, 1969; Borsa et al., 1976; Rosenberg and Bates, 1976; Männistö, 1978).
Microcrystalline nitrofurantoin has a particle size smaller than 10 µm (Rosenberg and Bates, 1976;
Conklin and Hailey, 1969), approximately 10 µm (Borsa et al., 1976) or 4–15 µm (Männistö, 1978).
The reported particle sizes of macrocrystalline nitrofurantoin were: 75–180 µm (Conklin and Hailey,
1969; Rosenberg and Bates, 1976), 80–180 µm (Borsa et al., 1976) or 90–200 µm (Männistö, 1978).
A study was designed in which six healthy human volunteers (weight range 62–80 kg) were
administered 50 mg of nitrofurantoin (Ivadantin™) either as a tablet or as a slow intravenous (i.v.)
infusion (Hoener and Patterson, 1981). The concentrations of both the parent compound and its amino-
derivative arising from the complete reduction of the nitrofuran ring (aminofurantoin) were measured
in plasma and urine specimens by means of an HPLC method. The drug kinetics after i.v. dosing could
be described by a two-compartment open-body model with a calculated terminal plasma half-life of
58 ± 15 minutes, with about 60 % of the drug bound to plasma proteins. The average fraction of the
drug that was excreted unchanged in the urine was 34 % when given orally and 47 % when
administered i.v., reaching the peak at about between 105 and 170 minutes; the urinary excretion of
the metabolite aminofurantoin amounted to about 1.2–1.4 % of the administered drug with no
differences between the administration routes; a further minor urinary metabolite was tentatively
identified as the N-acetylamino-derivative. Following the oral administration, Cmax (428 ± 146 ng/mL)
was reached after about 2 hours and slight differences in the kinetic parameters and in the
bioavailability were observed between fasted and unfasted individuals. In contrast, both the
bioavailability and the persistence of effective urinary concentrations were enhanced (from 20 to
400 %) in unfasted compared with fasted individuals administered with a single nitrofurantoin dose
(100 mg), the largest differences being observed with dose forms exhibiting the lowest dissolution rate
(i.e. tablets) (Rosenberg and Bates, 1976). A very limited drug excretion rate was reported in uraemic
patients (Sachs et al., 1968), while genetic polymorphism of the ABCG2 C421A drug transporter had
no apparent effects on plasma and urine kinetics in human volunteers orally administered with a single
dose (100 mg) of the drug (Adkinson et al., 2008).
Scant information is available concerning the placental transfer of nitrofurantoin. In the only available
report, 17 women in labour received 90 mg of the drug by i.v. infusion over a period of 30 minutes
(Perry and Leblanc, 1967). At the time of delivery, samples of maternal venous blood, umbilical cord
blood and, whenever possible, amniotic fluid were collected at different time points and nitrofurantoin
concentrations were determined by means of a colorimetric method. The drug was found to readily
cross the placental barrier reaching cord blood concentrations of the same order of magnitude of those
measured in maternal blood (range < 1.0–9.8 μg/mL) with a ratio ranging from 0.4 to 2, but showing
at the same time a rapid disappearance from fetal circulation. The overall usefulness of the study is
limited by the poor sensitivity of the analytical method (LOD 1 μg/mL).
To investigate the transfer rate of nitrofurantoin in human milk, four healthy lactating women were
treated with a single oral dose of macrocrystalline nitrofurantoin with food, and blood and milk
samples were collected at different time intervals up to 12 hours after dosing (Gerk et al., 2001). Drug
concentrations measured with an HPLC method (LOQ 0.01 μg/mL) were much higher in milk than in
serum at any time point, displaying Cmax values of 2.71 ± 0.65 versus 0.50 ± 0.14 μg/mL, which were
reached in about 5 hours in both cases. As the milk–serum ratio was much higher (nearly 6) than that
expected based on an in vitro model of passive diffusion, the authors concluded that nitrofurantoin is

Nitrofurans in food
EFSA Journal 2015;13(6):4140 52
actively excreted in human milk, as confirmed later by further in vitro studies (Gerk et al., 2003); in
addition, they expressed health concerns for suckling infants younger than 1 month, or infants with a
high frequency of G6PD deficiency or sensitivity to nitrofurantoin.
In conclusion, limited information is available on the kinetics of nitrofurans in humans. The oral
bioavailability of the parent compound seems to be good, and in the case of nitrofurantoin was shown
to be affected by drug particle size and possibly by fasting. No reliable data could be found on the
biotransformative profile of all nitrofurans considered in this opinion.
8.1.3. Laboratory animals
Little information on the in vivo kinetics of furazolidone is available in the open literature. In rats
administered with a single oral dose of 100 mg furazolidone/kg b.w., plasma levels of the nitrofuran
measured with a colorimetric method amounted to 2.5 µg/mL 4 hours after treatment; after 48 hours,
3.2 % of the administered dose could be recovered in the faeces as the unchanged molecule using a
microbiological method (Paul et al., 1960b). In a more recent study (Tatsumi et al., 1984), the
excretion profile was investigated in rats using the labelled compound. In animals receiving a single
oral dose of 14
C-furazolidone (10 mg/kg b.w.), 50 % of the radioactivity was recovered in faeces and
urine collected over 7 days; the identification of the N-acetylamino-derivative in urine samples
provided evidence of the formation of the amino-derivative as an intermediate metabolite of
furazolidone in rats. In a further experiment in which the labelled compound was administered orally
to rats at doses of 100 mg/kg b.w. for 4 days, an open-chain cyano-derivative (3-(4-cyano-2-
oxobutylideneamino)-2-oxazolidone), an open-chain carboxylic derivative ((4-carboxy-2-
oxobutylideneamino)-2-oxazolidone) and α-ketoglutaric acid were also identified in urine, accounting
for 25 % of urinary radioactivity. Water-soluble unidentified metabolites accounted for the rest of the
urinary radioactivity.
The in vitro metabolism of 14
C-furazolidone was characterised using rat liver S9 or Escherichia coli
whole cell extracts or lysates under aerobic and anaerobic conditions (Abraham et al., 1984). In line
with the results of the in vivo studies, in all cases, the major metabolite was the result of a reductive
pathway and was unequivocally identified as an open-chain cyano-derivative (3-(4-cyano-2-
oxobutylideneamino)-2-oxazolidone). It is also worth noting that a significant proportion of the
radioactivity remained covalently bound to liver proteins. In a subsequent study investigating the
metabolic fate of 14
C-furazolidone using rat liver microsomes, Vroomen et al. (1987b) found two main
non-polar metabolites, i.e. the known open-chain cyano-derivative and a second one (2,3-dihydro-3-
cyanomethyl-2-hydroxy-5-nitro-1α,2-di-(2-oxo-oxazolidin-3-yl)iminomethylfuro[2,3-b]furan), both
resulting from the reduction of the nitrofuran under aerobic or anaerobic conditions. CYP was not
involved in the generation of the above metabolites, which could also be produced upon incubation
with purified NADPH-CYP reductase. The addition of GSH (2 mM) to the incubation mixture
drastically decreased both the formation of the above-mentioned non-polar metabolites and the extent
of the covalent binding to microsomal proteins, which was most likely due to (reversible) GSH
interaction with unstable nitroso and hydroxylamino furazolidone derivatives.
Very little is known about the kinetics of furaltadone in laboratory species. In rats administered a
single oral dose of 100 mg furaltadone/kg b.w., plasma levels of the nitrofuran measured with a
colorimetric method amounted to 3.0 µg/mL 4 hours after treatment; after 48 hours, 3.4 % of the
administered dose (138 mg/kg b.w.) could be recovered in urine, while faecal excretion was negligible
(Paul et al., 1960b). To study the placental transfer of furaltadone, the drug was i.v. infused at doses
ranging from 5 to 15 mg per hour for various lengths of time to M-F strain guinea pigs, New Zealand
White rabbits, mongrel dogs or Hampshire sheep in their last trimester of pregnancy. A colorimetric
method able to measure the nitrofurfurylidene moiety was used to quantify the nitrofuran in maternal
and fetal plasma. The placental transfer of furaltadone could be demonstrated in all examined species
with a plasma fetal–maternal ratio ranging from about 0.35 to about 0.47 (Buzard and Conklin, 1964).
In vitro studies performed with rat liver homogenates pointed to an NADPH-mediated reductive
biotransformation involving the nitro-group (Akao et al., 1971).
Nitrofurans in food
EFSA Journal 2015;13(6):4140 53
Buzard et al. (1961) studied the kinetics of nitrofurantoin in the rat. To investigate the site of
absorption after oral administration, nitrofurantoin (25 or 100 mg/kg b.w.) was injected into different
segments of the rat gastrointestinal tract, namely the stomach, small intestine, caecum and colon. After
blood collection and nitrofurantoin analysis, it was concluded that the drug was rapidly and
extensively absorbed in the small intestine and, to a minor extent, in the colon. A plasma half-life of
25 minutes could be measured following the i.v. dosing (25 mg/kg b.w.). As, after bilateral
nephrectomy or ligation of the ureters, the half-life of nitrofurantoin increased to around 70 minutes, it
was concluded that urinary excretion is an important elimination pathway. In this respect, a higher rate
of tubular reabsorption (up to 10-fold) was noted in young (5- or 15-day-old) than in older (33- or 55-
day-old) rats treated with 20 mg nitrofurantoin/kg b.w. (i.v.); the reason for this age-related difference
resides in the lower urinary pH displayed by the young rats causing the shift of nitrofurantoin (a weak
acid) towards the non-ionised form.
The bioavailability and the kinetic parameters of nitrofurantoin were investigated in rabbits (Watari et
al., 1983). Two groups of male Japanese white rabbits (n = 16) were dosed with the drug (1.25 or
10 mg/kg b.w.) using one of the following routes: i.v., intraduodenal or oral administration. Plasma
samples were collected before administration and over a 90-minute period after administration for the
low-dose group and over a 2.5-hour period after administration for the high-dose group. Urine was
collected 8 hours after administration. Nitrofurantoin was measured with a fluorometric method (LOD
not reported). The plasma concentration–time course after i.v. dosing could be fitted by a one-
compartment model. Plasma levels were significantly lower after oral administration with respect to
the other routes. At the low dose, the Cmax was 0.26 μg/mL after oral administration and around
1.55 μg/mL after the other routes of administration, whereas at the high dose it was 1.73 μg/mL after
oral administration and approximately 14 μg/mL after the other routes of administration. The reason
for the reduced bioavailability was attributed to a rapid drug decomposition in the stomach, probably
due to the (reversible) cleavage of the azomethine bond under acidic conditions. Finally, the
percentage of the unchanged drug that was excreted in urine varied depending on the route of
administration and the administered dosage. While in the animals given 1.25 mg nitrofurantoin/kg
b.w. it ranged from around 16 % (oral route) to around 50 % (other routes), at 10 mg/kg b.w. it
amounted to about 20 %, irrespective of the administration route.
The presence of 4-hydroxynitrofurantoin was unequivocally demonstrated in urine samples from male
Sprague–Dawley rats after a single oral dose of 14
C-nitrofurantoin (33 mg/kg b.w.); the amount of
such urinary metabolite was found to sharply increase (up to about 16-fold) in 3-methylcholanthrene-
or β-naphthoflavone-induced rats over phenobarbital pretreated or untreated animals (Jonen et al.,
1980), pointing to the involvement of the CYP1 family in the 4-hydroxylation of the drug.
The role of caecal microflora in the in vivo nitroreduction of nitrofurantoin was demonstrated by
Rowland et al. (1983). A negligible rate of nitrofurantoin reduction was found upon the incubation
with caecal suspensions from rats administered a diet supplemented with carrageenan (50 g/kg diet)
with respect to rats offered a basal diet; such an effect was attributed to the strong decrease of gut
bacterial populations observed in animals exposed to the food additive.
The in vitro metabolism of nitrofurantoin in rats was characterised using an HPLC method by Aufrère
et al. (1978) who demonstrated that, under anaerobic conditions, the drug was rapidly biotransformed
in liver and small intestinal wall preparations and by colon or caecum content as well, but only to a
lesser extent in kidney and lung. The main metabolite was the open-chain acrylonitrile derivative
resulting from the nitroreduction followed by the opening of the furan ring. In another in vitro study,
the one-electron reduction of nitrofurantoin by rat liver mitochondria with the generation of the
nitroanion radical and the superoxide anion could be demonstrated by direct electron spin resonance
spectroscopy and spin trapping experiments, respectively (Moreno et al., 1984). An increasing body of
literature (Oo et al., 2001; Merino et al., 2005, 2010; Wang and Morris, 2007; Wang et al., 2008)
indicates that, based on both in vitro and in vivo studies using knock-out mice, nitrofurantoin is a
substrate of the transmembrane breast cancer resistance protein (BCRP/ABCG2), a member of the
ATP-binding cassette family of transporters affecting the kinetics of several drugs, toxins and

Nitrofurans in food
EFSA Journal 2015;13(6):4140 54
food/feed components. Remarkable differences in oral bioavailability (almost a 2-fold increase),
hepatobiliary excretion rate (nearly abolished) and milk–plasma ratio (80-fold decrease) were reported
between BCRP–/– and wild-type nitrofurantoin-treated mice (Merino et al., 2005). The effects of the
co-administration of nitrofurantoin and a mixture of two soy isoflavones known for their inhibitory
effects on drug transporters (Okura et al., 2010), namely genistein and daidzein, were investigated in
mice (Merino et al., 2010). Wild-type mice were orally dosed with nitrofurantoin alone (20 mg/kg
b.w.) or nitrofurantoin plus the isoflavones (both at 100 mg/kg b.w.). The isoflavone addition resulted
in both a statistically significant increase in nitrofurantoin plasma concentration at 30 minutes
(1.7-fold) and a strong inhibition of the BCRP/ABCG2-mediated nitrofurantoin secretion in milk, as
reflected by the lower milk–plasma ratio (7.1 ± 4.2 versus 4.2 ± 1.6). Mice with isoflavones also
showed a remarkable reduction in nitrofurantoin bile levels (3.7 ± 3.2 versus 8.8 ± 3.4 µg/mL). The
authors concluded that the co-administration of other BCRP/ABCG2 substrates may significantly
affect the in vivo kinetics of nitrofurantoin.
Limited information is available concerning the kinetics of nitrofurazone in experimental species. In
rats administered with a single oral dose of 100 mg nitrofurazone/kg b.w., plasma levels of the
nitrofuran measured with a colorimetric method amounted to 4.5 µg/mL 4 hours after treatment; after
48 hours, 4.6 % of the administered dose could be recovered in the faeces as the unchanged molecule
using a microbiological method (Paul et al., 1960a). In a further study, the excretion products
recovered in the urine of nitrofurazone-treated rats (dosage and route of administration not specified)
were tentatively identified as hydroxylamino or aminofuraldehyde semicarbazone (Paul et al., 1960b).
The oral absorption and the urinary and biliary excretion rates of 14
C-nitrofurazone were investigated
by Tatsumi et al. (1971) in rats administered with a single dose of the nitrofuran (100 mg/kg b.w.).
After 48 hours, the percentage of recovered radioactivity amounted to approximately 60 % in urine,
27 % in the bile and 12 % in the gastrointestinal tract. Because, as determined by reverse dilution
analysis or spectrophotometry, very little radioactivity was attributable to the unchanged compound in
all examined matrices (less than 0.3 %), it was concluded that oral nitrofurazone is extensively
absorbed and biotransformed in rats. To characterise the in vivo reduction of nitrofurazone, male
conventional or germ-free Sprague–Dawley rats were treated with 0.13 mg 14
C-nitrofurazone/kg b.w.
by gavage and the urinary metabolites analysed by HPLC (Tin-Chuen et al., 1983). The main reduced
metabolite was identified as the open-chain stable cyano-derivative 4-cyano-2-oxobutyraldehyde
semicarbazone; the amount of such a metabolite in urine from conventional rats was approximately
twice that measured in germ-free rats, suggesting an important contribution of the enteric flora in the
reductive pathway of nitrofurazone.
In experiments carried out with the isolated perfused rat liver (Hoener, 1988), the nitrofurazone-
mediated oxidative stress induced by both the nitroanion redox cycling and the generation of further
reactive unstable reduced metabolites (see Section 8.1.1) could be inferred by the marked increase in
biliary glutathione-disulphide (GSSG) along with a marked decline of tissue GSH levels. Using 35
S-methionine, a GSH adduct with nitrofurazone (or its metabolites) could be identified by means of
HPLC.
In conclusion, only sparse information is available for laboratory species concerning the in vivo
biotransformation profile of the nitrofurans considered in the present opinion and the form in which
they are deposited in tissues.
8.1.4. Biotransformation in livestock, horses and fish
Prior to the discovery of protein-bound residues and the development of a method to detect them by
releasing the side-chain under acid conditions (Hoogenboom et al., 1991c), studies focused primarily
on the parent compound and, in some cases, on metabolites such as the open-chain cyano metabolite.
In general, these studies show rather low levels of the parent compound, if it is detectable at all. This is
quite different for the bound residues and the side-chains, which show rather high levels and long half-
lives. For the current opinion, the focus was primarily on studies to determine these bound residues
and their kinetics.

Nitrofurans in food
EFSA Journal 2015;13(6):4140 55
8.1.4.1. Ruminants
Limited information is available on the transfer of nitrofurans or their metabolites into milk. In a study
by the United States Department of Agriculture (USDA), Smith et al. (1998) applied radiolabelled
nitrofurazone (label in the carbon of the azomethine bond) to dairy cows with intramammary
application, intrauterine application or application via the eyes (single doses of 65.6 mg
(intramammary) or 36.8 mg (intrauterine), or 4 days of 2.1 mg on the surface of the eyes), in order to
determine to what extent this off-label use would result in residues in milk. In all cases, a small part of
the label was excreted via the milk; in the case of the intramammary infusion, 1.25 and 1.09 % of the
label was excreted in the dosed and undosed quarters, respectively; in the case of the intrauterine
treatment, 0.45 % was excreted; and, in the case of the eye treatment, 0.45 % was also excreted. All
three animals were slaughtered on day 6 and the radiolabel was detected in all tissues examined, with
the highest levels in liver and kidney and in the tissues where the drug was applied. Levels of the
parent drug were determined in milk and accounted for only a small part of the radiolabel. The highest
level was 11.4 µg/kg in milk from the treated quarter collected between 0 and 12 hours after the
treatment, compared with 2.8, 0.7 and 0.3 µg/kg in milk collected between 12 and 24 hours, between
24 and 36 hours and between 36 and 48 hours, respectively. In the case of the intrauterine treatment,
the parent drug was detected in the milk collected between 0 and 12 hours only, at a level of 1.2 µg/kg.
It was apparently not possible to detect the released side-chain, but the method was not described.
Chu and Lopez (2007) developed a method to detect the released side-chains from residues in milk
and treated one cow orally with one dose of a cocktail of nitrofurazone, furazolidone, furaltadone
(each 648 mg) and nitrofurantoin (3.2 g). Initial levels in milk collected during the first 12 hours were
around 54, 46, 33 and 33 µg/kg for AMOZ, AHD, AOZ and SEM, respectively. Levels rapidly
decreased to below detection limits (0.2 µg/kg) at 72 hours.
The milk excretion of nitrofurantoin and its modulation by isoflavones, which are known inhibitors of
the efflux protein BCRP/ABCG2 (Okura et al., 2010), were investigated by Pérez et al. (2009) in
sheep. Lactating ewes (weight range 70-75 kg) were offered a standard diet or a diet without
isoflavones and all animals received a single dose of nitrofurantoin (20 mg/kg b.w.) by gavage with or
without the prior oral administration of genistein and daidzein, each at the dose of 10 mg/kg b.w. Milk
samples were collected up to 24 hours after dosing and nitrofurantoin concentrations were measured
by an HPLC/UV method. While the time to peak concentration (Tmax) values (range 1.6-3.5 hours) did
not display statistically significant changes, much higher Cmax values (P<0.05) were recorded in the
group fed the isoflavone-deprived diet (18.3 ± 14.2 μg/mL) with respect to those measured in animals
fed the isoflavone-adequate diet without (5.2 ± 3.9 μg/mL) or with (2.6 ± 1.5 μg/mL) genistein and
daidzein administration. The results indicate that in sheep, nitrofurantoin is excreted in the milk and
that this process is very likely mediated by BCRP/ABCG2.
8.1.4.2. Pigs
Vroomen et al. (1987a) treated 6-month-old pigs (n = 10) with medicated feed containing 300 mg
furazolidone/kg for 10 days. Animals were killed 2 hours or 1, 3, 7 or 14 days after the last treatment.
Blood, urine and various tissues were analysed for the parent compound and for the only known
metabolite, the open-ring cyano metabolite, using HPLC-UV. Levels of the parent drug reached
plasma levels up to 80 µg/L but decreased to non-detectable levels 7 hours after treatment. Very
similar levels and patterns were observed for the cyano-metabolite, reaching the highest levels of
35 µg/L. In muscle, kidney and liver, the parent compound could not be detected (< 2 µg/kg). The
cyano-metabolite was detected in muscle, but only 2 hours after the last treatment. These studies
showed that the treatment of pigs with furazolidone did not result in detectable residues of the parent
compound.
In order to study the fate of furazolidone in pigs, Vroomen et al. (1986) carried out a study with two
piglets treated orally with 75 mg per day of the drug radiolabelled in the AOZ side-chain. This was
done in accordance with the former therapeutic dose. One piglet was killed after 10 days of treatment,
and the other one after a withdrawal period of 7 days. Various tissues were collected and examined for

Nitrofurans in food
EFSA Journal 2015;13(6):4140 56
the radiolabel. In the piglet killed just after the last treatment, the amount of the 14
C-label, expressed as
furazolidone equivalents, was 6 000 µg/kg in muscle, 33 000 µg/kg in kidney and 30 000 µg/kg in
liver. In the other piglet, levels were considerably lower, being 2 000 µg/kg in muscle, 3 000 µg/kg in
kidney and 3 000 µg/kg in liver. Tissues were examined for the presence of furazolidone, showing that
most of the radiolabel was present as unknown metabolites. A major part of the radiolabel could not be
extracted from the tissues with various organic solvents and was therefore called protein-bound
residues. This fraction was 14, 9 and 35 % for liver, kidney and muscle, respectively, from the piglet
killed directly after the last treatment, and 27, 31 and 56 % for liver, kidney and muscle, respectively,
from the piglet killed 7 days after the last treatment. It should be stressed that the extraction included
an extraction with water, potentially resulting in the loss of small proteins/peptides and as such an
underestimation of the actual fraction of bound residues. The same may occur with organic solvents
that are not able to precipitate all the proteins.
Bound residues could be drug-like adducts, but it was also argued that the drug was very extensively
metabolised and that radiolabelled fragments were incorporated into amino acids and subsequently
proteins. However, muscle and liver tissues of this experiment were used by Hoogenboom et al.
(1991c) to show that, similar to treated pig hepatocytes, AOZ could also be released from muscle and
liver samples of animals treated with the drug. Levels of AOZ released from the liver were 23 and
14 % of the bound residues for the pigs killed just after the last drug treatment and 7 days later,
respectively.
Hoogenboom et al. (1992a) performed a follow-up study with 3-month-old pigs (n = 10) to further
study the fate of the bound residues. Animals were given the therapeutic dose through the feed
(300 mg/kg feed) for 7 days. Withdrawal periods of 0, 1, 2, 3 and 4 weeks were applied. As observed
previously, residue levels of the parent compound were non-detectable. However, in this study, the
newly developed method for the marker residue, AOZ, was applied on samples from these pigs
showing a gradual decrease in the levels. However, AOZ was still detected in liver, kidney and muscle
samples from pigs killed 4 weeks after the last treatment at levels of 41, 7 and 10 µg/kg, compared
with 993, 600 and 124 µg/kg, respectively, when slaughtered without any withdrawal period. When
plotted on a log scale, this study showed a linear decrease in the levels of released AOZ. As also
observed in the previous study with piglets by Vroomen et al. (1986), the decrease in muscle tissue
seemed slower than that in liver and kidney.
Gottshall and Wang (1995) performed a study with six pigs (40–45 kg) treated with furazolidone 14
C-labelled in both the nitrofuran and the AOZ rings. The drug was orally applied for 14 days and
animals were slaughtered 10 hours, 21 days and 45 days after the last treatment. Initial levels of
residues (10 hours) in liver, kidney and muscle, expressed in furazolidone equivalents, were 41, 34,
and 13 mg/kg and decreased to 4.4, 3.4 and 3.3 mg/kg, respectively, after 21 days and to 2 mg/kg in all
tissues after 45 days. In addition, in this study, tissues were analysed for the marker residue AOZ,
showing that the fraction of AOZ that could be released from the residues decreased over time; for
example, in liver, the fraction started at 18 % at 10 hours and decreased to 13 % at 21 days and to 9 %
at day 45. Nevertheless, levels of AOZ released from liver were 3 404 µg/kg at 10 hours, 247 µg/kg at
day 21 and 79 µg/kg at day 45. In muscle, these levels were 1 291, 110 and 62 µg/kg, respectively,
confirming that the difference between liver and muscle gets smaller after time, possibly as a result of
a higher turn-over of tissue proteins in liver.
In order to validate their improved analytical method, Leitner et al. (2001) treated two pigs for 3 days
with a therapeutic dose of either furazolidone or furaltadone. Animals were slaughtered immediately
after the last treatment and analysed without prior extraction. Levels of AOZ and AMOZ in muscle
meat were 100 and 30 µg/kg, being lower than observed before, possibly owing to the short treatment.
Cooper et al. (2005) treated 8-week-old piglets for 10 days with feed medicated with furazolidone,
furaltadone, nitrofurantoin or nitrofurazone at a dose of 400 mg/kg feed. Animals were slaughtered
after a withdrawal period of 0, 1, 2, 3, 4 or 6 weeks and liver, kidney and muscle tissue was collected.
Tissues were first extracted with organic solvents and the precipitate containing the bound residues

Nitrofurans in food
EFSA Journal 2015;13(6):4140 57
was treated with hydrogen chloride to release the respective side-chains. Levels were determined with
LC-MS. With the exception of some low levels at time 0, no parent compounds could be detected. In
the case of furazolidone, initial levels of AOZ released from liver, kidney and muscle were around
2 000, 1 000 and 400 µg/kg, respectively, being in a similar range as that observed previously. Levels
decreased gradually to about 40 µg/kg in liver and muscle and 10 µg/kg in kidney after 6 weeks.
Depletion half-lives varied between 7 days for liver and kidney and 12 days for muscle. In the case of
furaltadone, initial levels of AMOZ released from liver, kidney and muscle were around 5 000,
3 000 and 1 700 µg/kg, respectively—all higher than for furazolidone, and also higher when corrected
for molecular weight. Levels showed a similar decline as for furazolidone during the withdrawal
period, again with relatively high levels after 6 weeks. Nitrofurantoin showed somewhat lower levels
of AHD released from the various tissues, with levels just below 10 µg/kg after 6 weeks, but again
showing a similar decline. In the case of nitrofurazone, initial levels were relatively high, especially in
muscle and when expressed on a molar basis, showing initial levels of 2 000 and 300 µg/kg,
respectively, after 6 weeks. This depletion from muscle was much slower than for the other
nitrofurans, which is also shown by the long half-life of 15 days.
Liu et al. (2010a) treated young piglets (15–18 kg) for 7 days with medicated feed containing
400 mg/kg furazolidone, followed by a withdrawal period of 0.5, 7, 21, 35, 56 or 63 days. In addition
to liver, kidney and muscle, plasma and urine were also collected and analysed to examine the
potential use of these matrices to predict the levels in tissues. Tissues were not extracted prior to
analysis, and an immunoassay was applied to quantify AOZ after derivatisation. Half a day after the
last treatment, levels in liver, kidney and muscle were around 2 000, 1 000 and 700 µg/kg,
respectively, which are very similar to those observed in other studies. The decrease in these levels
was relatively slow and, after 63 days, AOZ was still detectable at levels around 1 µg/kg. Interestingly,
levels in both plasma and urine showed a very good correlation with those in tissues, indicating the
gradual release of AOZ-containing peptides and excretion into the urine. As such, urine and plasma
can be used to determine the treatment of animals even after a prolonged time.
8.1.4.3. Poultry
Transfer to eggs
Various studies have shown that nitrofurans in poultry feed may result in residues in eggs. McCracken
et al. (2001) were the first to also include the releasable side-chains in these studies. Laying hens were
fed for 11 days with a feed containing furazolidone at 400 mg/kg, which was the former therapeutic
level. Within 3 days, the levels of furazolidone reached a plateau level around 400 µg/kg, very similar
to the level of AOZ. On a molar base, the parent compound could explain only part of the AOZ. When
ending the treatment, the levels of furazolidone dropped to around 4 µg/kg after 4 days, while AOZ
was still detectable at levels around 3 µg/kg after 21 days. Most of the furazolidone was detected in
the egg white during the treatment, whereas, for AOZ, levels were similar in egg white and yolk.
However, 11 days after the treatment, AOZ levels in the yolk were three-fold higher, which might be
related to the fact that production of yolk requires much more time than the albumen.
In a second study, McCracken and Kennedy (2007) also included nitrofurazone, nitrofurantoin and
furaltadone as well as furazolidone. Hens were fed for 1 week with medicated feed containing
300 mg/kg of either one of these four nitrofurans. Yolk of eggs collected for 2 days after the treatment
showed levels for furazolidone, furaltadone, nitrofurantoin and nitrofurazone of, respectively, 1.82,
1.83, 0.28 and 4.18 nmol/g (corresponding to, respectively, 410, 593, 67 and 828 µg/kg). Levels of the
side-chains AOZ, AMOZ, AHD and SEM were, respectively, 4.68, 2.93, 1.47 and 15.13 nmol/g
(corresponding to, respectively, 477, 589, 222 and 1 135 µg/kg), and again, on a molar base, the levels
were much higher than for the parent compounds. In egg white, the levels for the parent compounds
were slightly lower, except for nitrofurazone where the difference was much larger. A similar
difference between egg yolk and egg white was also found for the side-chains. Both the parent
compounds and side-chains were also detected in the shell, and levels were particularly high for SEM

Nitrofurans in food
EFSA Journal 2015;13(6):4140 58
(24 nmol/g). When compared with the previous study, levels for furazolidone and AOZ were in a
similar range.
Cooper et al. (2008a) fed broiler breeder hens with feed containing nitrofurazone at levels of 0.03, 0.3,
3, 30 or 300 mg/kg for a period of 16 days. Levels of the parent compound in whole eggs increased
rapidly, reaching plateau levels within 4 days, being around 1, 7, 70 and 700 µg/kg for the four highest
dose groups. A similar pattern was observed for SEM, but levels were slightly higher. Hens fed the
highest dose were transferred to clean feed, resulting in a decrease in the levels of nitrofurazone and
SEM with half-lives of 1.1 and 2.4 days, respectively. About 75 % of SEM and 60 % of nitrofurazone
was present in the yolk. About 16 % of the SEM in yolk could be attributed to the parent compound,
compared with 36 % in the case of the albumen (overall about 28 %). These data all refer to total
SEM. Tissue-bound SEM was determined in whole eggs of the 3 and 30 mg/kg dose groups, showing
that about 30 % of the SEM was present in the non-extractable part.
McCracken et al. (2005b) also studied the transfer of metabolites of furazolidone, nitrofurazone,
nitrofurantoin and furaltadone from breeder hens via the eggs to the progeny. Hens received feed with
400 mg/kg of the drugs, and eggs that were collected after more than 1 week on the drugs were bred.
Young chicks were slaughtered at various ages; at day 1, liver levels of AOZ, AMOZ, AHD and SEM
of, respectively, 7, 11, 3 and 27 µg/kg and muscle levels around, respectively, 5, 1, 3 and 33 µg/kg
were found. Levels in both liver and muscle rapidly declined to below 1 µg/kg, but remained
detectable up to 10 to 42 days, depending on the nitrofuran. In general, tissue levels were much lower
than those in eggs, being 573, 1 004, 501 and 825 µg/kg for AOZ, AMOZ, AHD and SEM,
respectively, and were comparable to those from the previous study (McCracken et al., 2001). This
study implies that there is carry-over via the eggs but that only part of the residues end up in the
progeny.
Barbosa et al. (2012) fed laying hens with medicated feed containing either 150 mg/kg of furaltadone
or 100 mg/kg of nifursol for a period of 3 weeks followed by 3 weeks on clean feed. Eggs were
analysed for both the parent compounds and the side-chains AMOZ and DNSH (without prior
extraction of the proteins with solvents). As shown before, the parent compounds could be detected
during the treatment but not at the end of the first week on clean feed. Levels of furaltadone in egg
yolk and egg white were 384 and 242 µg/kg, and of nifursol were 271 and 83 µg/kg, respectively,
suggesting a more selective excretion of nifursol into yolk. Levels of AMOZ in egg yolk/egg white
during the treatment were 629/494 µg/kg and decreased to 29/31, 5.2/3.2 and 3.1/2.9 µg/kg at the end
of 1, 2 or 3 weeks on clean feed, respectively. This shows that, during the treatment, the parent
compound was responsible for a maximum of one-third of the detected side-chain, taking into account
the difference in molecular weights. For nitrofurazone, the levels of the side-chain DNSH in egg
yolk/egg white were 1 595/220 during the treatment and decreased to 65/12, 2.1/ND (not detectable)
and ND/ND at the end of 1, 2 or 3 weeks on clean feed, respectively. In this case the parent compound
could explain 11 and 25 % of DNSH in egg yolk and white, respectively, which is even less than in the
case of furaltadone. When given feed with a mixture of 15 mg/kg furaltadone and 10 mg/kg nifursol,
levels of parent compounds and side-chains in eggs were roughly 10-fold lower, with the exception of
DNSH in yolk, which showed a higher ratio of almost 20-fold.
Transfer to meat and tissues
Zuidema et al. (2005) investigated the presence of tissue-bound residues of nifursol in 2-week-old
broilers. A medicated feed containing 50 mg/kg nifursol was supplied for 7 days, followed by a switch
to clean feed. Animals were slaughtered 0, 3, 7, 14 or 21 days after the switch. The parent compound
could be detected in bile and plasma at days 0 and 3, but not in any of the tissues collected. Tissues
were analysed for the releasable side-chain DNSH after extraction with organic solvents. DNSH levels
were 900, 2 000 and 225 µg/kg in liver, kidney and muscle tissue. The extracted fraction was also
analysed, showing levels of about 10 % of the non-extractable part. After 21 days, DNSH could still
be detected at levels around 10 µg/kg in liver and kidney, just below 1 µg/kg in muscle and around
3 µg/kg in plasma. The study also describes levels of AOZ and AMOZ in liver of broilers treated for

Nitrofurans in food
EFSA Journal 2015;13(6):4140 59
7 days with either furazolidone- or furaltadone-medicated feed containing 200 mg/kg of the drugs. At
day 0, levels of AMOZ and AOZ were around 5 000 and 1 000 µg/kg, declining to 50 and 20 µg/kg,
respectively, after 21 days. In muscle, levels of AMOZ and AOZ were 30 and 10 µg/kg, respectively,
at day 21.
McCracken et al. (2005a) performed a study with 28-day-old broilers treated via the feed for a period
of 12 days, after which the animals were slaughtered and muscle and liver were collected. Feed
contained 30, 100, 300, 1 000 or 3 000 µg/kg of furazolidone, furaltadone, nitrofurantoin or
nitrofurazone—levels which were all well below the previous therapeutic level of 300 mg/kg. Tissues
were first extracted with organic solvents prior to release of the side-chain, meaning that only protein-
bound residues were taken into account. In the case of furazolidone, this resulted in AOZ levels in
liver from 1.1 to about 25 µg/kg, compared with 0.3 to 10 µg/kg in muscle, with a clear linear dose–
response relationship. AMOZ levels in liver and muscle at the highest dose were as high as 40 and
15 µg/kg, respectively, which is very similar to AOZ in the case of treatment with furazolidone when
corrected for molecular weights. In the case of nitrofurantoin, levels of AHD in muscle were very low,
whereas in liver they amounted to 35 µg/kg, which again is very similar to AOZ in the case of
furazolidone treatment, expressed on a molar basis. For nitrofurazone, the situation was somewhat
different, showing SEM levels in liver and muscle of up to 35 and 28 µg/kg, respectively, which on a
molar basis were also much higher than observed for the other drugs.
Barbosa et al. (2011) fed 19-week-old laying hens with feed containing either 150 mg/kg of
furaltadone or 100 mg/kg of nifursol for a period of 5 weeks followed by 3 weeks on clean feed.
Animals were slaughtered at the end of the treatment or after the additional 3 weeks on clean feed, and
muscle, liver and gizzards were examined for the parent compound and the side-chains, the latter
without prior extraction of tissues. Parent compounds could be detected directly after the treatment,
with levels of furaltadone in meat, liver and gizzards around 35, 40 and 55 µg/kg, and with levels of
nifursol a bit lower, i.e. 15, 13 and 12 µg/kg, respectively. Parent compounds were not detectable after
3 weeks on clean feed. Levels of the AMOZ and DNSH side-chains directly after the treatment were
much higher, with levels of furaltadone in meat, liver and gizzards around 1 800, 3 300 and
3 300 µg/kg, respectively, and levels of nifursol again lower, i.e. in all tissues between 300 and
350 µg/kg. Levels decreased after 3 weeks on clean feed but were still detectable, being 270, 80 and
331 µg/kg for furaltadone and 2.5, 6.4 and 10.3 µg/kg for nifursol in meat, liver and gizzards,
respectively. Overall, the results are in agreement with those obtained by Zuidema et al. (2005). When
similar animals were fed a diet containing a mixture of 15 mg/kg furaltadone and 10 mg/kg nifursol,
roughly 10-fold lower levels of parent drugs and side-chains were detected, with some variation. This
implies that, at these relatively low feed levels compared with the formerly used doses, tissue levels of
AMOZ and DNSH were still well above the MRPL of 1 µg/kg at the end of the treatment period, and
this was still the case after a 3-week withdrawal period for AMOZ but not for DNSH.
8.1.4.4. Horses
Despite the documented use of furaltadone in horses (Huber, 1982), no data on kinetics were identified
for any of the nitrofurans.
8.1.4.5. Fish and other seafood
Heaton and Post (1968) exposed brook trout (Salvelinus fontinalis), brown trout (Salmo trutta),
rainbow trout (Oncorhynchus mykiss) and cutthroat trout (Oncorhynchus clarkii) to 35 mg
furazolidone/kg b.w. per day for 20 days, followed by a 10-day depuration period. Brown trout had
the highest mean muscle residue concentration (482 µg/kg) after 10 days of medication. Mean
furazolidone levels in fish fillets in all species were less than 75 µg/kg after 10 days’ depuration,
achieved by feeding on non-medicated feed.
Plakas et al. (1994) administered a single oral dose of 1 mg 14
C-furazolidone/kg b.w. (labelled in the
AOZ side-chain) to channel catfish (Ictalurus punctatus) to examine the pharmacokinetics, tissue
distribution and excretion of furazolidone. The oral bioavailability of furazolidone was 28 % in a feed

Nitrofurans in food
EFSA Journal 2015;13(6):4140 60
mixture. Elimination of the parent compound was rapid, with a half-life of 0.27 hours and total body
clearance of 1 901 mL/kg b.w. per hour. The plasma concentration of furazolidone was highest 1 hour
after dosing, and was below the LOD (< 20 µg/L) at 5 hours. Levels of furazolidone and its
metabolites were highest in the excretory tissues and lowest in the muscle. Parent furazolidone
comprised 10 % of the total radiolabel in muscle tissue after 8 hours and was below the LOD
(< 1 µg/kg) after 24 hours. Total 14
C concentrations declined from 274 to 59 ng furazolidone
equivalents/g between 8 and 168 hours. Bound residues accounted for 18 % of total 14
C in muscle after
8 hours and 33 % after 168 hours. The primary route of excretion of 14
C-labelled residues was via the
kidney in urine and accounted for about 55 % of the oral dose.
Rainbow trout (Oncorhynchus mykiss) were exposed for 10 days to 135 mg/kg b.w. of 14
C-furazolidone, labelled in either part of the molecule, through the feed (Law and Meng, 1996).
When labelled in the nitrofuran part, the amount of radiolabel was higher than in the case of
furazolidone labelled in the AOZ side-chain. This suggests that part of the side-chain is cleaved either
before or after formation of the protein adducts. Hepatic protein-bound radiolabel remained high for at
least 30 days following dietary treatment. AOZ could be cleaved from part of the protein-bound
residues, showing that AOZ is also suitable as a marker residue in trout. The effect of dose and water
temperature on the amount of protein-bound 14
C in the liver was investigated further, showing higher
bound residue formation at higher temperatures. Results indicate that protein-bound radiolabel in the
muscle and liver of trout is related to the formation of reactive intermediates from furazolidone.
Guo et al. (2003) investigated the disposition of the cyano-metabolite of furazolidone, 3-(4-cyano-2-
oxobutylidene amino)-2-oxazolidinone, in the orange-spotted grouper (Epinephelus coioides) after
oral treatment with 50 mg furazolidone/kg b.w. The cyano-metabolite was mainly distributed in the
serum and muscle rather than in the liver and kidney. The peak concentrations of the cyano-metabolite
following oral exposure were 167.2 μg/L in serum and 283.2 μg/kg in muscle, which were reached
after 5.1 and 6.7 hours, respectively. The elimination half-life of the cyano-metabolite was 4 hours.
The residues of furazolidone and its marker metabolite (AOZ) were investigated in Nile tilapia
(Oreochromis niloticus) (Xu et al., 2006). After oral dosing with 30 mg/kg b.w. for 7 days, the
maximum concentration of furazolidone in Nile tilapia was 413 μg/kg after 6 hours, whereas AOZ
reached its maximum concentration (31 μg/kg) when treatment ceased. In contrast to the rapid
metabolism of furazolidone, AOZ was eliminated slowly; thus, the withdrawal time in Nile tilapia was
at least 22 days.
The elimination of furazolidone from Vietnamese black tiger shrimp (Penaeus monodon) muscle was
examined for up to 28 days following 7 days’ dosing (dose not given (Douny et al., 2013)). The
maximum concentration of NPAOZ following 7 days’ treatment was 874 ± 326 μg/kg. After the
treatment ceased, residue levels decreased. However, after 28 days the concentration of NPAOZ in
shrimp muscle was 115 ± 37 μg/kg.
Krongpong et al. (2008) measured the persistence of AOZ in eel (Anguilla japonica) following aquatic
exposure to 2 or 10 mg furazolidone/L for 3 hours, with a 160-day depuration period in clean water.
The half-lives of AOZ were 25.0 days in muscle and 21.6 days in liver from fish exposed to 2 mg/L
furazolidone. The eels with 10 mg/L furazolidone had higher AOZ concentrations in liver and muscle
following exposure than those in the low-dose group; however, the half-lives of AOZ were similar to
those in fish treated with 2 mg/L furazolidone (26.6 and 21.9 days in muscle and liver, respectively).
Channel catfish were exposed via feed to 200 mg furazolidone/b.w. per day for 5 days followed by a
3-month elimination period to examine the half-life and tissue distribution of AOZ (Liu et al.,
2012b37
). Samples of muscle, skin, liver and kidney were taken from fish after1, 2, 4, 6, 8, 12, 24, 48,
96, 192, 288, 384, 480, 720, 1 080, 1 440, 2 160 and 2 880 hours; fish were not starved prior to
sampling. AOZ reached peak concentration in all blood and all tissues sampled 4 hours following
37 Original paper in Chinese. The text in this Scientific Opinion is based on the English translation of the paper.
Nitrofurans in food
EFSA Journal 2015;13(6):4140 61
discontinuation of the drug and the drug remained detectable in all samples examined after
1 440 hours (60 days). AOZ levels were below the LOD after 2 160 hours (90 days). The
concentration of AOZ was highest in kidney tissue followed by liver tissue, skin tissue, and blood and
muscle tissue. The elimination half-life of the drug in skin tissue was longest, followed by in muscle
tissue, which in turn had a longer half-life than in liver and kidney tissue. The authors claimed that the
study is representative of the behaviour of furazolidone in aquaculture; however, it does not appear
that the dietary treatment was conducted in triplicate and there is no feed intake data presented, which
are both requirements relevant for feeding trials.
Wang et al. (2010) characterised a cyano-derivative as a major metabolite of nitrofurazone in channel
catfish. The depletion of cyano metabolite was examined in the muscle of channel catfish after single
oral dosing (10 mg nitrofurazone/kg b.w.). Parent nitrofurazone was rapidly eliminated in muscle,
with a half-life of 6.3 hours. The cyano metabolite was detected for up to 2 weeks, with an elimination
half-life of 81 hours. The authors suggest that the cyano metabolite represents an alternative biomarker
for confirming the use of nitrofurazone in channel catfish.
Chu et al. (2008) investigated the depletion of furazolidone, nitrofurazone, furaltadone, and
nitrofurantoin and their tissue-bound metabolites AOZ, SEM, AMOZ and AHD, respectively, from
the muscle tissue of channel catfish (Ictalurus punctatus) following single oral dosing with 1 mg/kg
b.w. Parent compounds were quantifiable in muscle tissue within 2 hours. Peak concentrations were
found after 4 hours for furazolidone (30.4 μg/kg) and after 12 hours for nitrofurazone, furaltadone and
nitrofurantoin (104, 35.2 and 9.8 μg/kg, respectively). Concentrations of the parent compounds in
muscle fell below the LOD (1 μg/kg) at 96 hours. Peak levels of tissue-bound AMOZ and AOZ (46.8
and 33.7 μg/kg, respectively) were measured at 12 hours, and of SEM and AHD (31.1 and 9.1 μg/kg,
respectively) were measured at 24 hours. Tissue-bound metabolites were measurable for up to 56 days
following treatment.
8.1.4.6. Concluding comments
The studies performed with various animal species show that, in general, the parent compounds are
rapidly metabolised. Only in the case of eggs are the parent compounds detected in considerable
amounts. Furazolidone has been studied most but, in general, there is limited information on
metabolites of nitrofurans. Radiolabelled studies indicate the formation of a large number of different
metabolites. The most studied metabolite is the open-chain cyano metabolite resulting from the six-
electron reduction of the nitro-group. Studies with radiolabelled drugs also revealed the formation of
protein-bound residues, both in vivo and in vitro. These adducts are likely to result from the formation
of reactive intermediates during the reduction of the nitro-group. As a result, the side-chains are still
intact in at least part of the bound residues and can be released by cleavage of the azomethine bond
between the nitrofuran ring and the side-chain under acid conditions. Residue formation of
furazolidone, furaltadone, nitrofurantoin and nitrofurazone has been studied in pigs and poultry,
showing that the side-chains can be released and detected even after long withdrawal times, with some
minor differences between the drugs. Initial levels after therapeutic use are in the mg/kg range but
decrease to the µg/kg range after several weeks, which is thought to be the result of protein turn-over
and partly the growth of animals. Nifursol was studied in broilers only, showing similar behaviours as
the other nitrofurans. The side-chains can also be released from the parent compounds at low pH but
the extent to which this occurs is unclear.
8.1.5. Bioavailability of bound residues
When feeding pig meat containing radiolabelled protein-bound residues of furazolidone to rats, part of
the radiolabel (present in the AOZ side-chain) was detected in the urine and in the tissues of the rats,
showing that these residues are bioavailable and might be of concern (Vroomen et al., 1990). This was
confirmed by studies of Gottshall and Wang (1995) using bile duct-cannulated rats given meat and
liver of pigs treated with radiolabelled furazolidone (label in both rings). It was concluded that 40 and
37 % of the radiolabelled compounds present in liver and muscle, respectively, of pigs slaughtered just
after the last treatment were absorbed from the gastrointestinal tract. This fraction decreased to 19 %
Nitrofurans in food
EFSA Journal 2015;13(6):4140 62
for liver from pigs slaughtered after a withdrawal period of 45 days but remained similar (41 %) for
muscle. When focusing on non-extractable radiolabelled residues only, the fraction absorbed was quite
similar, being 31 and 16 % for liver of day-0 and day-45 animals, respectively, and 37 % for muscle of
day-45 animals. Vroomen et al. (1990) also observed that, in the rats, part of the radiolabel was
present in tissues and part was present as non-extractable, protein-bound residues. These studies show
that residues in muscle and liver from treated pigs, including the non-extractable residues, are
bioavailable, although the nature of the radiolabelled compounds could not be identified.
It was discussed whether the radiolabelled residues were actually adducts of the nitrofurans (drug-like)
or whether the labelled nitrofuran was extensively degraded resulting in small radiolabelled fragments
that were reused for the synthesis of amino acids and subsequently incorporated into proteins. The fact
that AOZ could be released from part of the protein-bound residues (Hoogenboom et al., 1991c)
confirmed that they were drug-like and this caused a renewed interest in the potential risk of the
residues, especially regarding the fact that the AOZ side-chain could be released by acid treatment and
thus potentially in the stomach. In the case of furazolidone itself, it had already been shown that the
formation of AOZ in the stomach was probably the basis of one of the adverse effects (neurotoxic
effects) of the drug in human patients. AOZ was shown to be an inhibitor of MAO and its inhibition
would result in a decreased detoxification of compounds such as tyramine formed in the
gastrointestinal tract (Stern et al., 1967). It had been hypothesised that the effect was due to the
formation of 2-hydroxy-ethylhydrazine (HEH) from AOZ following ring opening, although this was
never demonstrated.
In vitro studies with Caco-2 cells or perfused rat guts strongly indicated that free AOZ was released
and absorbed from protein-bound residues of furazolidone (Klee et al., 1999). Free AOZ was shown to
be transported from the apical to the basolateral side of either a monolayer of human Caco-2 cells or
isolated perfused rat gut segments. To investigate the possible release and absorption of AOZ from
bound residues, liver microsomes containing protein-bound adducts of furazolidone were first digested
with hydrogen chloride and pronase and then added to either Caco-2 cells or rat gut segments. Again,
AOZ was detected on the other side, suggesting release and absorption from bound residues. However,
in this study, AOZ was detected after derivatisation with NBA at low pH, leaving the possibility that
AOZ was not present in its free form. By applying a newly developed method for the extraction and
LC-MS detection of free AOZ (Hoogenboom et al., 2002), it was shown that free AOZ was present in
the blood of pigs treated orally with AOZ but also furazolidone. With the same method it was possible
to show the presence of free AOZ in the blood of rats fed with pig meat containing bound residues.
This demonstrated that AOZ is released during digestion and is actually absorbed.
Studies with isolated pig hepatocytes revealed that exposure to AOZ also resulted in the formation of
non-extractable protein-bound residues, and that AOZ could be released from these residues by acid
treatment (Hoogenboom et al., 2002). This observation also explains the results obtained by
McCracken and Kennedy (1997) who fed rats with liver, kidney or muscle from furazolidone-treated
pigs. It was shown that AOZ could be released from the rat tissues that were first extracted with
organic solvents. This shows that AOZ is released from bound residues in the stomach of the rat and
subsequently binds to proteins in the organs of the rat. In addition, bound residues in tissues from
food-producing animals may be derived from both furazolidone itself and AOZ, released from the
parent drug in the stomach by acid hydrolysis.
Studies on the bioavailability of bound residues or side-chains of other nitrofuran drugs are not
available.
In conclusion, these studies show that protein-bound residues may be formed by metabolism of the
parent compound (adduct type I), but also of the side-chains released in the stomach of animals and
humans (adduct type II) (Figure 4). As shown in the case of furazolidone, the protein-bound residues
are bioavailable owing to the release of the AOZ side-chain from either type of protein-bound residues
in the stomach. The absorbed AOZ may subsequently be metabolised to a compound able to form
adducts (adduct type II).
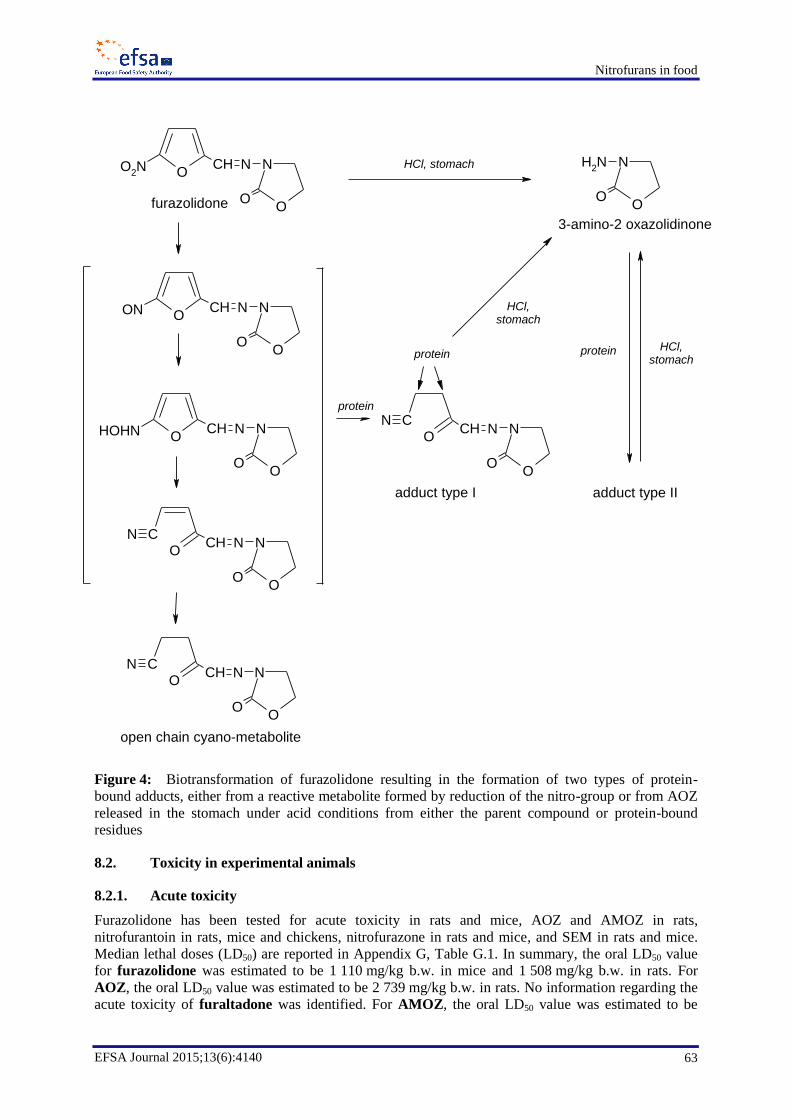
Nitrofurans in food
EFSA Journal 2015;13(6):4140 63
Figure 4: Biotransformation of furazolidone resulting in the formation of two types of protein-
bound adducts, either from a reactive metabolite formed by reduction of the nitro-group or from AOZ
released in the stomach under acid conditions from either the parent compound or protein-bound
residues
8.2. Toxicity in experimental animals
8.2.1. Acute toxicity
Furazolidone has been tested for acute toxicity in rats and mice, AOZ and AMOZ in rats,
nitrofurantoin in rats, mice and chickens, nitrofurazone in rats and mice, and SEM in rats and mice.
Median lethal doses (LD50) are reported in Appendix G, Table G.1. In summary, the oral LD50 value
for furazolidone was estimated to be 1 110 mg/kg b.w. in mice and 1 508 mg/kg b.w. in rats. For
AOZ, the oral LD50 value was estimated to be 2 739 mg/kg b.w. in rats. No information regarding the
acute toxicity of furaltadone was identified. For AMOZ, the oral LD50 value was estimated to be
O
NNOO
2N CH
O O
NNH2
O
O
NNCH
O
OON
O
NNCH
O
OHOHN
O
NNCH
O
OCN
O
NNCH
O
OCN
O
NNCH
O
OCN
open chain cyano-metabolite
HCl, stomach
protein
furazolidone
protein
HCl, stomach
adduct type I adduct type II
3-amino-2 oxazolidinone
protein HCl, stomach

Nitrofurans in food
EFSA Journal 2015;13(6):4140 64
> 2 000 mg/kg b.w. in rats. For nitrofurantoin, the oral LD50 value was estimated to be 360 mg/kg
b.w. in mice and 148 mg/kg b.w. in chicken, and ranged between 89 and 1 493 mg/kg b.w. in rats,
depending on the age of the rats. No information regarding the acute toxicity of AHD was identified.
For nitrofurazone, the oral LD50 value was estimated to be between 460 and 640 mg/kg b.w. in mice
and between 590 and 800 mg/kg b.w. in rats. For SEM, the oral LD50 value was estimated to be
176 mg/kg b.w. in mice. No information regarding the acute toxicity of nifursol or DNSH was
identified. The lungs are an important target organ for acute toxicity of furazolidone, nitrofurantoin
and nitrofurazone in rats, mice and chickens. Decreased food consumption and body weight loss,
hyperirritability, tremors, convulsions, alopecia, corneal opacity, discoloration of the lungs and
decreased respiratory function were observed.
To investigate the role of oxidative stress in the toxicity of nitrofurans, several studies on antioxidants
have been carried out. The acute toxic effect of nitrofurantoin (nitrofurantoin macrocrystals) on the
lungs was tested in rats with subcutaneous (s.c.) treatment (Boyd et al., 1979). Male rats (Sprague–
Dawley, 8 to 10 per group) were treated s.c. on a single occasion with 300 to 500 mg/kg b.w.
nitrofurantoin in an aqueous suspension. Between 4 to 12 hours after dosing, severe toxicity in the
lungs was found with respiratory suffering. Microscopic examination revealed interstitial and intra-
alveolar oedema, vascular haemorrhage and consolidations (alveoli and small airways filled with
dense material). The highest doses caused death owing to respiratory failure and convulsions. No
pathological changes were found in organs other than the lungs. The LD50 for s.c. dosing with
nitrofurantoin was 35 mg/kg b.w. for rats fed a vitamin E-deficient diet compared with 400 mg/kg b.w.
for rats fed a normal diet. The impact of vitamin E deficiency, dietary fat and oxygen on the toxicity of
nitrofurantoin was also tested. Rats (n = 10 to 15 per group) were treated for 6 weeks with feed
deficient in vitamin E and with a high content of polyunsaturated fatty acids or saturated fatty acids
(lard), followed by 3 weeks’ treatment with a vitamin E-fortified diet (200 mg/kg diet) or a diet
without vitamin E fortification. Following the pretreatments, the rats were treated s.c. with 100 mg/kg
b.w. nitrofurantoin. After prefeeding with unsaturated fatty acids, all rats that were fed the diet without
fortification with vitamin E before treatment died within 7 hours after nitrofurantoin treatment.
Approximately 90 % died after 24 hours when pre-fed with saturated fatty acids and without a vitamin
E fortification. In the groups treated with a vitamin E-fortified diet for 3 weeks before treatment with
nitrofurantoin only, approximately 10 % of the rats died within 24 hours after treatment, independent
of the type of fat used in pre-feeding. It was also shown that pulmonary lesions and deaths increased
when rats were placed in oxygen-enriched atmospheres (sealed cages in which 2 L/min of 100 %
oxygen passed) for 24 hours, directly after administration of nitrofurantoin. As indicated in the dose
levels used, rats fed a vitamin E-deficient diet high in polyunsaturated fat (15, 20 and 25 mg/kg b.w. of
nitrofurantoin) showed more severe pulmonary lesions, appearing at an earlier time point, than rats fed
a normal diet treated with higher doses (250 or 400 mg/kg b.w.) of nitrofurantoin. Groups of rats at all
dose levels were treated with or without an oxygen-enriched atmosphere for 24 hours. The rats treated
in an oxygen-rich atmosphere showed much more severe lesions in the lungs than rats treated under a
normal atmosphere. Rats treated at the highest doses died within 4 (400 mg/kg b.w.) and 6 (25 mg/kg
b.w.) hours. Thus, the toxicity of nitrofurantoin was decreased by vitamin E but was increased by
unsaturated fats in the diet and by treatment under high-oxygen atmospheres.
Effects of selenium and vitamin E deficiency on the acute oral toxicity of nitrofurantoin
(nitrofurantoin macrocrystals) in chickens were studied (Peterson et al., 1982). Chickens (Leghorn,
8 days old) born from dams fed a vitamin E- and selenium-depleted basal diet for two generations
were used. The LD50 for chickens fed the same basal diet supplemented with selenium and vitamin E
was 148 mg/kg b.w. after 48 hours mortality observation. The LD50 for chickens fed the basal diet
without supplementation was 53 mg/kg b.w. Different diets, with or without selenium and vitamin E,
were also tested. It was found that selenium but not vitamin E had a protective effect against lethality
from nitrofurantoin treatment in chickens. Histological examination of the lungs of treated chickens
showed hyperaemia and variable oedema; some changes in the kidney were noted, but there were no
signs of toxicity in the liver or the heart.
Nitrofurans in food
EFSA Journal 2015;13(6):4140 65
The effect of nitrofurantoin (chemical form not specified) on blood pressure was investigated in rats
(Murakami et al., 1989). Wistar rats (250 g, n = 7) were treated with nitrofurantoin at single i.v. doses
of 0.1 to 0.3 mg/rat, corresponding to 0.4 and 1.2 mg/kg b.w., respectively, for a 250 g rat. The
enzyme activity of GSH reductase decreased in the brain stem and the hypothalamus, which led to an
increased ratio of oxidised GSSG to reduced glutathione. In addition, blood pressure and heart rate, as
well as plasma renin activity and plasma noradrenaline, increased in rats. These effects were blocked
or reduced by the sympathetic ganglion blocker pentolinium tartrate. It was concluded that the
decreased activity of GSH reductase caused by nitrofurantoin treatment led to increased blood
pressure by activating the sympathetic nervous system and the renin–angiotensin system.
8.2.2. Repeated-dose toxicity
No repeated-dose toxicity studies were identified for furazolidone.
AOZ, the marker metabolite for furazolidone, was tested in repeated-dose toxicity studies in rats and
dogs.
AOZ (crystalline, suspended in water and included in pellets) was fed to rats (Wistar, 9 weeks old, five
of each sex in each dose group) in the diet for 14 days in concentrations of 0, 100, 500, 2 500 or
10 000 mg/kg feed (NOTOX, 1995a). These concentrations correspond to 0, 12, 60, 300 and
1 200 mg/kg b.w. per day, respectively, using the default factor of 0.12 as recommended by the EFSA
SC (2012). No mortality was found during the study, but animals in the two highest dose groups died
after blood sampling just before sacrifice. Dose-related clinical signs such as piloerection, hunched
postures, rales (abnormal lung sounds) and pale appearance were found in the three highest dose
groups, and laboured respiration was found in the highest dose group. No clinical signs were found in
the 12 mg/kg b.w. per day group or in the control group. Food consumption, body weight and body
weight gain dose-dependently decreased in all treated groups compared with the control group.
Haematology analyses showed that there was damage to the red blood cells in all treated groups and
the total leucocyte counts were very low in the three highest dose groups. Furthermore, increased
serum bilirubin, aspartate aminotransferase (AST) levels and alkaline phosphatase (ALP) levels were
found in the two highest dose groups. Decreased protein levels were found in all treated males, but in
females were found in only the two highest dose groups. Relative weights of spleen, kidney and liver
increased in the two highest dose groups. Histopathology revealed congestion, haemosiderosis and
increased haematopoiesis in the spleen of all treated animals. In the groups treated with 60 mg/kg b.w.
per day and higher, effects on the thymus, intracellular oedema in tubules of the kidney and erosion of
the fundic mucosa were found. In the two highest dose groups, vacuolisation in the liver was noted
and, in the highest dose group, reduced spermatogenesis was also found. The increased levels of the
enzymes AST and ALP, the increased liver weights and the macroscopic changes indicate that AOZ
caused toxic effects in the liver. Effects in the lungs were not investigated, but laboured respiration
was found in the 1 200 mg/kg b.w. per day dose group and rales were seen in dose groups at or higher
than 60 mg/kg b.w. per day. According to the authors, effects on the spleen, red blood cell parameters
and weight gain were found in the lowest dose group (12 mg/kg b.w. per day). However, because no
numerical data were provided, the CONTAM Panel was not able to verify this conclusion.
AOZ (crystalline, suspended in water and included in pellets) was fed to rats (Wistar, 9 weeks old,
10 of each sex in each dose group) in the diet for 90 days in concentrations of 0, 10, 50 or 100 mg/kg
feed (NOTOX, 1995b). These concentrations correspond to 0, 0.9, 4.5 or 9 mg/kg b.w. per day,
respectively, using the default factor of 0.09 as recommended by the EFSA SC (2012). No deaths or
relevant clinical signs were found during the treatment period. Body weights and body weight gain
and food consumption decreased in animals treated with 4.5 or 9 mg/kg b.w. per day. No effects on
body weight, body weight gain or feed consumption were found in the lowest dose group. Red blood
cell parameters decreased in females and males treated with 9 mg/kg b.w. per day, but in only males
treated with 4.5 mg/kg b.w. per day. Upon histological examination, the only finding was an increased
severity of diffuse hepatocellular vacuolisation in the highest dose group, but no effects on the lungs
were identified. According to the authors, no changes in haematology parameters, clinical chemistry

Nitrofurans in food
EFSA Journal 2015;13(6):4140 66
analyses or organ weights, or histological examination were found in the lowest dose group, 0.9 mg/kg
b.w. per day, compared with control animals. However, because no numerical data were provided, the
CONTAM Panel was not able to conclude on a NOAEL from this study.
Dogs (Beagle dogs, 3–4 months old, three of each sex in each dose group) were treated orally with
AOZ (crystalline powder, suspended in water) in the diet for 90 days with 0, 1, 3 or 6 mg/kg b.w. per
day (Brinck et al., 1995). No treatment-related mortality or clinical signs were found during the study.
Effects on body weight, body weight gain or food consumption were not statistically significantly
different from the control group. Increased relative liver weights were found in males and increased
absolute and relative spleen weights were found in females in the highest dose group. Several
haematology parameters were dose-dependently changed (decreased or increased) in treated groups
compared with controls, showing that AOZ caused a macrocytic, hypochromic anaemia. In animals in
the two highest dose groups, the thrombin time was prolonged but the fibrinogen levels were normal,
which causes inhibition of fibrin formation. Clinical chemistry analyses of serum showed significant
increased bilirubin, ALP and gamma-glutamyl transferase (GGT), as well as increased AST, alanine
aminotransferase (ALT) and triglyceride levels, in the two highest dose groups indicating a dose-
dependent cholestasis. In the lowest dose group, only ALP in males and GGT in females significantly
increased. Many organs were histopathologically examined, including the lungs. Macroscopic changes
in the liver were found in only the highest dose group. Perivascular cell accumulations in the liver
were found in all treated groups. An increased cellularity in the bone marrow, femur and sternum was
found in all treated females and in all males treated with 3 and 6 mg/kg b.w. per day, but in only one
male in the lowest dose group. Congestions in the spleen were found in all treated animals and in one
out of six control animals. AOZ caused liver toxicity and anaemia at all dose levels. Therefore, a
NOAEL in dogs cannot be identified from this study.
No repeated-dose toxicity studies were identified for furaltadone and AMOZ.
Toxicity of nitrofurantoin was tested for 14 days (dose range finding studies) and 13 weeks in mice
and rats (NTP, 1989).
Nitrofurantoin (microcrystalline powder) was fed to mice (B6C3F1, 4–6 weeks old, five of each sex
per group) for 14 days at concentrations of 0, 600, 1 300, 2 500, 5 000 or 10 000 mg/kg feed (NTP,
1989). These concentrations correspond to 0, 120, 260, 500, 1 000 or 2 000 mg/kg b.w. per day,
respectively, using the default factor of 0.2 as recommended by the EFSA SC (2012). Four out of five
males and females in the 2 000 mg/kg b.w. per day dose group and one out of five in the 1 000 mg/kg
b.w. per day dose group died between days 6 and 14. All mice in the 2 000 mg/kg b.w. per day dose
group and male mice in the 1 000 mg/kg b.w. per day dose group lost weight, but the weights in the
lower dose groups (120, 260 and 500 mg/kg b.w. per day) were not different from the controls.
Clinical signs in mice from the highest dose group were lethargy, sunken eyes and altered gait. No
histological examination was conducted.
Nitrofurantoin (microcrystalline powder) was fed to mice (B6C3F1, 5–6 weeks old, 10 of each sex in
each group) for 13 weeks at concentrations of 0, 300, 600, 1 300, 2 500 or 5 000 mg/kg feed (NTP,
1989). These concentrations correspond to 0, 60, 120, 260, 500 or 1 000 mg/kg b. w. per day,
respectively, using the default factor of 0.2 as recommended by the EFSA SC (2012). Most mice
survived except 2 out of 10 in the highest dose group and 1 out of 10 in the lowest dose group. Clinical
signs were lethargy, hypothermia and sunken eyes in the highest dose group. The body weight gain
decreased in the highest dose group to approximately 85 % of that of the control group. Feed
consumption was not affected by treatment. The relative liver weights decreased in the two lowest
dose groups, but not in the higher dose groups. Upon histopathological examination, minimal to mild
necrosis of the kidney epithelium was observed in two out of nine high-dose males, necrosis of the
ovarian follicle was observed in 8 out of 10 high-dose females and minimal to mild degeneration of
the germinal epithelium of the testes, accompanied by aspermatogenesis, was observed in male mice
administered a dose of 260 mg/kg b.w. per day or higher. No such effect was observed in the lower
dose groups. A NOAEL of 120 mg/kg b.w. per day was identified from this study.

Nitrofurans in food
EFSA Journal 2015;13(6):4140 67
Nitrofurantoin (microcrystalline powder) was fed to rats (F344/N, 4–5 weeks old, five of each sex in
each group) for 14 days at concentrations of 0, 1 300, 2 500, 5 000, 10 000 or 20 000 mg/kg feed
(NTP, 1989). These concentrations correspond to 0, 156, 300, 600, 12 00 or 2 400 mg/kg b.w. per day,
respectively, using the default factor of 0.12 as recommended by the EFSA SC (2012). All rats
survived, but dose-related decreases in weight gain were observed at doses ≥ 300 mg/kg b.w. per day,
reaching 47 % of that of the control group for males and 55 % for females in the highest dose group at
the end of the study. Rats from the four highest dose groups had lower feed intakes than control
animals during the first week of treatment, but, during the second week, the feed intake increased so
that it was close to the control group and the lowest dose group. Rough hair coat, lethargy, sunken
eyes and brighter yellow urine was found as clinical symptoms in all dose groups. Necropsy, but not
histological examination, was performed. In the highest dose group, a discoloration to blue was seen in
the joints.Nitrofurantoin (microcrystalline powder) was fed to rats (F344/N, 5–6 weeks old, 10 of each
sex in each group) for 13 weeks at concentrations of 0, 600, 1 300, 2 500, 5 000 or 10 000 mg/kg feed
(NTP, 1989). These concentrations correspond to 0, 54, 117, 225, 450 or 900 mg/kg b.w. per day,
respectively, using the default factor of 0.09 as recommended by the EFSA SC (2012). Only 1 out of
10 females died during the study. Weight gain decreased dose dependently at doses ≥ 225 mg/kg b.w.
per day, reaching 47 % of that of the control group for males and 41 % for females in the highest dose
group at the end of the study. Feed consumption was not influenced. Upon histopathological
examination, aspermatogenesis was found, as well as minimal to mild degeneration of the germinal
epithelium of the seminiferous tubules of the testes, in 29 out of 30 male rats treated with doses
≥ 225 mg/kg b.w. per day. A dose-dependent necrosis of the ovarian follicles in females was found in
groups treated with 900 mg/kg b.w. per day (8 out of 10), 450 mg/kg b.w. per day (3 out of 10) and
225 mg/kg b.w. per day (1 out of 10). No effects were observed in the lungs. In addition, the relative
liver weight was significantly higher in the two highest dose groups. From this study, a NOAEL of
117 mg/kg b.w. per day in rats treated for 13 weeks with nitrofurantoin in feed was identified.Rabbits
(New Zealand White, 12 in each group and six in each control group) were treated with nitrofurantoin
(chemical form not specified, 0.1 mg/mL aqueous solution) at a dose of 6 mg/kg b.w. per day for
1 week or 3, 6 or 12 months through drinking water to study the effect on the bladder (Levin et al.,
1988). Up to 12 months’ treatment did not affect bacterial adherence to the rabbit bladder and
histopathology of the bladders did not show any harmful effect in the epithelial layer, mucosal layer or
mucin coating.
No repeated-dose toxicity studies were identified for AHD.Toxicity of nitrofurazone (chemical form
not specified) was tested for 14 days (dose range finding studies) and for 13 weeks in both mice and
rats (NTP, 1988).
Mice (B6C3F1, 6–8 weeks old, five of each sex in each group) were fed nitrofurazone for 14 days at
concentrations of 0, 630, 1 250, 2 500, 5 000 or 10 000 mg/kg feed, corresponding to 0, 126, 250, 500,
1 000 or 2 000 mg/kg b.w. per day, respectively, using the default factor of 0.2 as recommended by the
EFSA SC (2012). All mice in the 500, 1 000 and 2 000 mg/kg b.w. per day groups and three out of
five males in the 250 mg/kg b.w. per day group died before the end of the study. Feed consumption in
groups treated with doses higher than 126 mg/kg b.w. per day was dose-dependently decreased.
Treated mice had rough hair coats and convulsive seizures (NTP, 1988).
Mice (B6C3F1, 5 weeks old, 10 of each sex in each group) were treated with nitrofurazone for
13 weeks at concentrations of 0, 70, 150, 310, 620 or 1 250 mg/kg feed (NTP, 1988). These
concentrations correspond to 0, 14, 30, 62, 124 or 250 mg/kg b.w. per day, respectively, using the
default factor of 0.2 as recommended by the EFSA SC (2012). Mortality in males and females
increased in the two highest dose groups; only 1out of 10 females and 4 out of 10 males survived
during the 13 weeks. Final weights decreased in only the highest dose group. Relative liver weights
increased by 35 % in the two highest dose groups compared with the control group. Liver weights
decreased in the two lowest dose groups, which resulted in a 20 % decrease in relative liver weight
compared with the control group. No effects in the lungs were found. Convulsive seizures and
hyperexcitability were noted in both sexes at doses at or higher than 124 mg/kg b.w. per day.
Moderate and severe testicular hypoplasia were found in the two highest dose groups: in 8 out of
Nitrofurans in food
EFSA Journal 2015;13(6):4140 68
10 mice in the 250 mg/kg b.w. per day dose group and 9 out of 10 mice in the 124 mg/kg b.w. per day
dose group. From this study, the CONTAM Panel identified a NOAEL of 62 mg/kg b.w. per day for
mice treated orally with nitrofurazone for 13 weeks.
Nitrofurazone was fed to rats (F344/N, 6–7 weeks old, five of each sex in each group) for 14 days at
concentrations of 0, 630, 1 250, 2 500, 5 000 or 10 000 mg/kg feed. These doses correspond to 0, 75.6,
150, 300, 600 or 1 200 mg/kg b.w. per day, respectively, using the default factor of 0.12 as
recommended by the EFSA SC (2012). Mortality in rats increased at the two highest dose levels. In all
rats, rough hair coats and lethargy were found. Rats treated with 300 mg/kg b.w. per day and higher
suffered from intermittent seizures and lethargy. A dose-dependent reduction in weight gain was found
in all dose groups compared with controls. Food intake decreased in both males and females at doses
above 75.6 mg/kg b.w. per day. Histopathology was performed in 10 % of the animals, indicating that
males from all dose groups failed to produce sperm cells. No effects on the lungs were recorded.Rats
(F344/N, 4–6 weeks old, 10 of each sex in each group) were treated with nitrofurazone for 13 weeks at
doses of 0, 150, 310, 620, 1 250 or 2 500 mg/kg feed (NTP, 1988). These doses correspond to 0, 13.5,
28, 56, 112.5 or 225 mg/kg b. w. per day, respectively, using the default factor of 0.09 as
recommended by the EFSA SC (2012). No mortality was found, but body weight gain at the end of the
study was dose-dependently decreased at doses of 28 mg/kg b.w. per day in males and 56 mg/kg b.w.
per day in females and higher. Feed consumption decreased in the highest dose group. Relative liver
weights were significantly higher in all treated animals (males and females), but without any dose–
response relationship. Stimulus-induced convulsive seizures were observed in the highest dose group,
and hyperexcitability was found in females in the two highest dose groups and in males at only the
highest dose. No effects in the lungs were found. Osteoporosis was found in males from 56 mg/kg
b.w. per day and higher, and in females in the two highest dose groups. Nitrofurazone caused
moderate to severe degeneration of the seminiferous epithelium in the testes in all males treated with
doses of 28 mg/kg b.w. per day and higher. From this study, a NOAEL of 13.5 mg/kg b.w. per day
could be identified.Rats were given nitrofurazone (macrocrystals) in the diet at concentrations of
1 000, 2 000 or 4 000 mg/kg for 5 weeks (Krantz and Evans, 1945), corresponding to 90, 180 or
360 mg/kg b.w. per day, respectively, using the default factor of 0.09 as recommended by the EFSA
SC (2012). The rats in the highest dose group showed cachexia and hyperexcitability, and died during
the first week. Histopathology of these rats (n = 4) showed small focal cellular and necrotic areas in
the liver and coagulated albuminous fluid in the tubules in the kidney. Rats fed 90 or 180 mg/kg b.w.
per day showed no effects on growth rate but higher white blood cell counts. Mild histopathology
changes such as cloudy swelling of the liver cells and of the tubules in the kidney were found in some
animals from the groups treated with 90 and 180 mg/kg b.w. per day. No histopathology of the lungs
was conducted. The study is poorly reported.
Nitrofurazone (solid crystals, ground and included in the diet) was fed to rats (Wistar strain, 15 males
and seven females) for 4 to 15 weeks at concentrations of 2 000 or 3 000 mg/kg feed, corresponding to
180 or 270 mg/kg b.w. per day, respectively, using the default factor of 0.09 as recommended by the
EFSA SC (2012) (Miyaji, 1971). In this study, furylfuramide and sorbic acid were also tested. A
markedly decreased body weight was found in the rats treated with 270 mg/kg b.w. per day of
nitrofurazone for 4 weeks, but when treated with 180 mg/kg b.w. per day the decrease was less.
Therefore, the dose of 180 mg/kg b.w. per day was chosen when rats were treated for 1 to 15 weeks.
Relative liver weight increased in the nitrofurazone-treated group. A distinct atrophy of the testes was
found in rats treated for more than 1 week. Histopathological examination after 4 weeks of treatment
showed enlarged liver cells. After 10 weeks of treatment, hypertrophic liver cells became visible, but
this effect was reversible. Histochemistry on the liver showed no changes in ALP, phosphorylase or
glucose-6-phosphatase activity.
Rats (male Fischer, 10–11 weeks old) were treated with nitrofurazone (chemical form not specified,
suspension in 0.5 % methylcellulose) orally at a dose of 80 mg/kg b.w. per day either as a single dose
or as repeated doses for 1, 2, 3, 5 or 7 days (Ito et al., 2002). The body weight of the rats treated with
80 mg/kg b.w. per day was unchanged after dosing for 3 consecutive days, but decreased slightly after
dosing for 5 or 7 days. Incorporation of bromodeoxyuridine (BrdU) in hepatocytes, indicating

Nitrofurans in food
EFSA Journal 2015;13(6):4140 69
increases in proliferating cells, increased reversibly after 1 and 2 days’ dosing with 80 mg/kg b.w. per
day, but decreased somewhat after 3 days’ dosing, despite maintenance of treatment. Enzymes in
plasma were not affected by treatment with nitrofurazone (80 mg/kg b.w. per day) for 1 to
3 consecutive days. The relative liver weight gradually increased during dosing up to 3 days with
80 mg/kg b.w. per day and remained at the same level thereafter. Histopathology, carried out on the
liver from rats treated with two doses of 80 mg/kg b.w. per day only, revealed no cell damage but
increased amounts of tangled, dark stained threads of chromosomes, i.e. mitotic figures. Mitotic
figures can indicate an abnormal mitosis but, in this study, the effect was only minor. In addition, rats
were treated with 20, 40 and 80 mg/kg b.w. per day for 2 days to study the BrdU incorporation in
hepatocytes, for which a dose-dependent increase was observed. The authors concluded that
nitrofurazone caused reversible hepatocyte proliferation without loss of cells.
Nitrofurazone was tested in monkeys (Macacus rhesus, n = 2) treated orally with 300 mg
nitrofurazone (macrocrystals) daily for 5 weeks (Krantz and Evans, 1945). No effects on body weight,
electrocardiogram, electroencephalogram or haematology parameters were found. Histopathology
examination in liver and kidney showed slight changes in liver but not in kidney. An additional three
monkeys were treated with 500 mg nitrofurazone for 6 days. Histopathology analysis showed minor
changes such as pale, granular and swollen liver cells, but no changes in the kidney. The study is
poorly reported.
Juvenile rats (Sprague–Dawley) were treated orally by gavage for 28 days with SEM hydrochloride
dissolved in water (Maranghi et al., 2009). The rats were treated from postnatal day (PND) 23 until
PND 51 with 0, 40, 75 or 140 mg/kg b.w. per day (n = 10/group). The concentrations in the drinking
water were adjusted every 2 days as body weight changed with time. All animals were sacrificed at
PND 60 and histological examination was carried out in various organs—thyroid, adrenals, thymus,
spleen, uterus, ovaries and testes—and in the coxal–femoral joints. Significant mortality was found in
the two highest dose groups, 19 and 20 %, compared with 0 % in the control group. Body weight gain
was dose-dependently decreased during treatment in all males but in only the highest dose group in
females. However, during the recovery period (PND 51 to 60) the weight gain was comparable to the
control group in males and females. Food consumption decreased in all animals in the highest dose
group but in only females in the mid-dose group. Histology showed an absence of mineralisation in
the epiphyseal cartilage in all male animals treated with SEM, but not in the control group. In females,
no mineralisation was found in one out of seven individuals in the control group and in six out of
seven, four out of five and five out of seven rats in the 40, 75 and 140 mg/kg b.w. per day dose groups,
respectively. In the thymus and thyroid, alterations in the histology were found in the two highest dose
groups. In the high- and mid-dose groups, the ratio of the area of endometrium/myometrium of the
uterus decreased. A dose-related significant increase in primary and secondary oocytes with
condensed chromatin was found in the two highest dose groups, and a reduced number of corpora
lutea was found in the highest dose group. Alteration in the adrenals was found in only females in the
mid- and high- dose groups. Increased haematopoieses and the presence of megakaryocytes were
found in animals in the highest dose group. Absence of mineralisation in the epiphyseal cartilage in
males was found at all dose levels. The NOAEL for toxic effects of SEM in juvenile rats would
therefore be lower than 40 mg/kg b.w. per day.
In a similar experiment (same protocol, same dose levels) Maranghi et al. (2010) studied, in particular,
the effects of SEM on endocrine homeostasis. As in the previous study (see above) a dose-dependent
decrease in body weight gain was observed in all treated males (no numerical data reported). Increased
mortality (20 % compared with the control) was observed in male and female rats at 75 and 140 mg/kg
b.w. per day. Food consumption decreased in high-dose males and in females at 75 and 140 mg/kg
b.w. per day. Female rats showed a dose-related delayed timing of vaginal opening, which was
significant in the high-dose group only. In male rats, the timing of preputial separation was shortened
at 75 and 140 mg/kg b.w. per day, and delayed at 140 mg/kg b.w. per day. A dose-dependent decrease
in serum levels of 17β-estradiol (E2), which was significant in the two highest dose groups, was
observed in female rats at the end of the experiment (PND 62). In males, the level of
dihydrotestosterone decreased at all dose levels, but without a clear dose–response relationship. In

Nitrofurans in food
EFSA Journal 2015;13(6):4140 70
hepatic microsomes, aromatase activity significantly increased in high-dose males and in females at
75 and 140 mg/kg b.w. per day, although, in females, no clear dose–response relationship was found.
The authors concluded that SEM administration to peripubertal rats appeared to act as an endocrine
disrupter in both sexes, resulting in the alteration of the onset of puberty and sex steroid serum levels
(see also Section 8.3). No clear NOAEL could be derived from this study.
SEM hydrochloride was tested in rats (Wistar Hannover, 6 weeks old) treated with 0, 250, 500 or
1 000 mg/kg feed for 90 days, with 10 males and 10 females in each group (Takahashi et al., 2009).
These doses correspond to 0, 23, 45 or 90 mg/kg b.w. per day, respectively, using the default factor of
0.09 as recommended by the EFSA SC (2012). No deaths occurred during treatment. Some rats
showed posture and gait abnormalities. Body weight gain was lower in the highest dose group than in
controls in males from week 1 and in females from week 4. Haematology analysis showed decreased
segmented neutrophils and increased lymphocytes in both females and males in the highest dose
group. Some clinical chemistry values were changed in a treatment-related manner. The ratio of
albumin–globulin and total bilirubin increased in the high-dose males and elevated levels of creatinine
and ALT were found in males in the 45 and 90 mg/kg b.w. per day dose groups. Inorganic phosphate
increased in females from the 45 and 90 mg/kg b.w. per day dose groups and ALT and ALP increased
in females from the highest dose group. In both males and females, body weights decreased in the
highest dose group. Several relative organ weights increased in the highest dose group, e.g. brain,
spleen, adrenals, kidneys and testes in males, and brain, heart and kidneys in females. The relative
weights of thymus, heart, liver and lungs decreased in males in the 90 mg/kg b.w. per day dose groups.
Clinical signs were enlargement and deformation of the knee joint in all rats treated with 45 and
90 mg/kg b.w. per day and in 1 out of 10 rats in the 23 mg/kg b.w. per day dose group. The same
effects were found in the wrist joints in the highest dose group. A prominence of the thorax was found
in the two highest dose groups in both females and males. In males from all dose groups, a stiff flexion
of the tail was found. Histological examination of bones showed a dose-dependent deformation of
limbs and osteochondral lesions. Disarrangements, fissures, increased connective tissues, thickening of
bones and deformations of the cartilage were found in both sexes, but were more severe in male rats.
Dose-dependent changes were also found in the thoracic aorta, in which interlaminar spaces had a rod
or globular appearance in treated groups compared with a fibrillar form in the control group. Toxic
effects were found in all dose groups and no NOAEL could be identified in this study.
Nifursol (yellow powder as a 10 % premix in lactose) was given to rats (Sprague–Dawley, 10 of each
sex in each group) through feed at concentrations of 0, 200, 400, 600, 800 or 1 000 mg/kg for
13 weeks (Wood et al., 1984). The concentrations in feed correspond, respectively, to reported average
doses of 0, 13.7, 28.0, 39.7, 53.6 or 67.2 mg/kg b.w. per day for males, and to 0, 14.9, 30.2, 44.0, 61.8
or 78.8 mg/kg b.w. per day for females. Ten additional females and males treated with the highest
dose for 13 weeks were kept for a 4-week recovery period receiving control feed. Clinical signs
observed comprised yellow staining of the beds and of the fur of treated animals, which was
considered to be caused by the colour of the substance. Body weight gain decreased in males and
females in the highest dose group. Food intake in the three highest dose groups was lower in males,
but not in females. Both food intake and weight gain increased slightly during the 4-week recovery.
Haematology tests showed that red blood cell parameters were significantly influenced by treatment.
Haemoglobin levels were slightly lower than the controls in females treated with 61.8 mg/kg b.w. per
day or higher for 13 weeks. Erythrocytes increased in high-dose males after 6 and 13 weeks but
decreased in females treated with 30.2 mg/kg b.w. per day and higher after 6 weeks and with
44.0 mg/kg b.w. per day and higher after 13 weeks. Mean corpuscular haemoglobin concentration
(MCHC) was slightly increased in males treated with 28 mg/kg b.w. per day or higher after 6 weeks
and in all males after 13 weeks, but there was no clear dose–response relationship. MCHC was also
increased in females in the two highest groups after 6 weeks and in females treated with 30.2 mg/kg
b.w. per day or more after 13 weeks. The mean corpuscular volume (MCV) decreased in males treated
with 28.0 mg/kg b.w. per day or higher for 6 weeks and in both males and females treated with
61.8 mg/kg b.w. per day or more for 13 weeks. After 6 weeks packed cell volume (PCV) was slightly
decreased in males at all dose levels, but without a clear dose-response relationship, and in females
from 30.2 mg/kg b.w. per day onwards. At the end of the study (week 13) PCV was significantly and
Nitrofurans in food
EFSA Journal 2015;13(6):4140 71
dose- relatedly decreased in females at a dose of 30.2 mg/kg b.w. per day or higher, and in males in
the two highest dose groups. No significant findings were noted after the 4-week recovery period, for
either red blood cell parameters or lymphocytes. Clinical chemistry analysis showed that globulin
increased in all females, but without a clear dose–response relationship, in week 6 or 13, and in males
in the two highest dose groups in week 6 only. No treatment-related macroscopic findings were
identified. Spleen weight increased in females and males at all dose levels but without a clear dose–
response relationship. After recovery, the spleen weights were close to the weights in the control
group. Based on effects on red blood cell parameters (particularly on MCV in males and PCV in
females at week 13), a NOAEL of about 14 mg/kg b.w. per day was identified for effects in rats
treated with nifursol for 13 weeks.
No repeated-dose toxicity studies were identified for DNSH.
Conclusions
No repeated-dose toxicity studies were identified for furazolidone.
AOZ was tested in a 90-day study with rats and in a 90-day study with dogs. Hepatotoxicity,
decreased body weight gain and anaemia were observed at the lowest tested dose of 1.2 mg/kg b.w.
per day in rats and at 1 mg/kg b.w. per day in dogs.
No repeated-dose toxicity studies were identified for furaltadone and AMOZ.
In studies on repeated-dose toxicity of nitrofurantoin in rats, mice and rabbits, the main toxic effects
of nitrofurantoin were on liver, kidney, testes (resulting in aspermatogenesis) and necrosis of the
ovarian follicles. In a 13-week rat study, a NOAEL of 117 mg/kg b.w. per day was identified, based
on effects on the testes in males and on ovarian follicles in females. In a 13-week mice study, a
NOAEL of 120 mg/kg b.w. per day was identified based on effects on the testes.
No repeated-dose toxicity studies were identified for AHD.
Nitrofurazone was tested in rats, mice, monkeys and dogs. Nitrofurazone caused the same effects as
nitrofurantoin, with the exception of necrosis of the ovarian follicles in female rats and mice. The
lungs were investigated in some studies (e.g. 13-week studies with nitrofurantoin and nitrofurazone in
mice and rats) but no effects were reported. The lowest doses of nitrofurazone that did not cause
effects in mice and rats were 62 and 13.5 mg/kg b.w. per day, respectively. Therefore, a NOAEL of
13.5 mg/kg b.w. per day was established for effects on the testes in rats.
In a 28-days study, SEM caused absence of mineralisation in the epiphyseal cartilage of juvenile rats
at the lowest tested dose of 40 mg/kg b.w. per day. Therefore, no NOAEL could be identified. In a 90-
day study in rats, severe deformation of limbs, osteochondral lesions, altered form of the interlaminar
spaces in the thoracic aorta and decreased body weight gain were observed. Toxic effects were found
in all dose groups, including the lowest dose tested of 23 mg/kg b.w. per day.
In rats, nifursol caused slight changes in red blood cell parameters. From this 13-week study, a
NOAEL of about 14 mg/kg b.w. per day was identified.
No repeated-dose toxicity studies were identified for DNSH.
8.2.3. Immunotoxicity
No description of in vivo immunotoxicity studies or effects were identified in the literature. One study
reported inhibition in vitro by various nitrofurans of mitogenesis in stimulated human peripheral T-
lymphocytes. This was seen at levels above 1–4 µg/mL, together with slight to moderate cytotoxicity
(based on cell survival) (Mercado et al., 1991). The specificity as regards the immune system and the
relevance for the in vivo situation (including dose–response relationship) cannot be assessed. It should

Nitrofurans in food
EFSA Journal 2015;13(6):4140 72
be noted that instances of autoimmune effects associated with liver toxicity caused by nitrofurantoin
have been reported in humans (see Section 8.4.1).
8.2.4. Developmental and reproductive toxicity
8.2.4.1. Studies on spermatogenesis
Miyaji et al. (1964) treated rats (Donryu strain, 6 weeks old, n = 3) by gavage with 42 different
nitrofuran compounds at 100 mg/kg b.w. per day for 7 days, testing for testes toxicity. Nitrofurazone
(chemical form not specified) caused more severe toxicity than furazolidone or furaltadone, shown
by histopathological changes in testes and reduced relative weights of testes. Testicular lesions were
also found in rats treated with nitrofurazone at doses of 0.2 % in the diet for 9 days, corresponding to
240 mg/kg b.w. per day, using the default factor of 0.12 as recommended by the EFSA SC (2012).
Relative testes weights decreased with time of treatment to about 45 % of the controls after 9 days.
Atrophy and degeneration of the seminiferous tubules, with loss of spermatozoa, were found during
the 9-day treatment, but no effects on the Leydig cells were noticed.
The effect of furazolidone (suspension in sodium carboxymethylcellulose) on testes, epididymis and
selected nuclei of the hypothalamus was tested in groups of rats (Wistar, n = 7) treated with 0, 50 or
200 mg/kg b.w. per day by gavage for 5 days (Zimmermann et al., 1993). Testes and epididymis were
analysed by light microscopy and the hypothalamus was analysed by morphometric methods. No
changes in testes and epididymis were found in the low-dose group, but in the high-dose group clear
signs of atrophy of the testes together with decreased weights of the testes and epididymis were found.
The seminiferous tubules were clearly decreased and nearly collapsed. The epithelium of the tubules
was damaged, which meant that early spermatids were absent. Morphometric analysis of the
hypothalamus showed a dose-dependent increased volume of the nucleus of the hypothalamus
connected to sexual centres.
No studies on spermatogenesis for AOZ were identified.
For furaltadone, only one study on spermatogenesis was identified (see above).
No studies on spermatogenesis for AMOZ were identified.
The effect of nitrofurantoin (chemical form not specified) on testes function was tested in white rats
(strain not reported, n = 36 for 10 and 85 mg/kg b.w. per day dose groups and n = 18 for control
group) treated by gavage for 1 month (Yunda et al., 1974). Rats were sacrificed 2, 20 or 48 days after
the last treatment with nitrofurantoin and then testes and epididymis were removed and analysed.
Spermatozoa were prepared and analysed. The spermatogenetic index decreased dose dependently.
The number of tubuli containing spermatozoa, and the concentration and motility of spermatozoa,
decreased dose dependently. In the highest dose group, the percentages of dead and pathological
spermatozoa increased. Regeneration of spermatogenesis was not reached until 48 days after
treatment, as there were still tubuli containing detached spermatogenic epithelium. It was also shown
that cysteine and vitamins C, B1, B6 and niacin, could prevent the toxic effect on spermatogenesis
caused by the highest dose of nitrofurantoin. Nitrofurantoin caused a clear toxic effect on
spermatogenesis in rats at a dose of 10 mg/kg b.w. per day and higher.
No studies on spermatogenesis for AHD were identified.
Singh and Chakravarty (2001) treated male mice (strain Parkes, 12–14 weeks old, five per group) with
nitrofurazone (chemical form not specified) by gavage at 64 mg/kg b.w. per day. The animals were
treated either for 10 days and sacrificed 24 hours after the last administration or for 20 days and
sacrificed 24 hours or 56 days after the last administration. One untreated group and one group treated
with distilled water were included as controls. Body weights and weight of the epididymis were not
affected by treatment. Weights of testes and seminal vesicles decreased in mice sacrificed 24 hours
after the last treatment, and sperm analysis revealed a decreased motility and decreased number of

Nitrofurans in food
EFSA Journal 2015;13(6):4140 73
spermatozoa in cauda epididymis. These effects were more severe after 20 days than after 10 days of
treatment. Histology of mice sacrificed 24 hours after the last administration showed a regressive
change in the seminiferous tubules of the testes. Again, this effect was more severe after longer
treatment (20 versus 10 days). Multinucleated giant cells were found in the seminiferous tubules of
treated rats, indicating germ cell degeneration. In mice sacrificed 56 days after the last administration,
the weights of testes and seminal vesicles, sperm analysis and histology did not differ from the control
groups. Thus, in this study, reversible alterations in male reproductive organs were found in mice
treated orally with 64 mg/kg b.w. per day for 10 or 20 days.
Testicular toxicity was studied in rats (male, Sprague–Dawley, 5 weeks old, 10 rats in each dose
group) treated with nitrofurazone (chemical form not specified) by gavage at doses of 50 mg/kg b.w.
per day for 2 or 4 weeks or 100 mg/kg b.w. per day for 2 weeks (Ito et al., 2000). Control animals
were dosed with 0.5 % methylcellulose for 4 weeks. Clinical signs in the high-dose group were
salivation, decreased locomotor activity and a prone position, and three animals died on day 8 to 14. In
the low-dose group, only one animal died and the others did not show any clinical signs. A dose-
related decrease in body weight gain was found. Macroscopical examination revealed effects on the
testes only and not on other organs. The absolute and relative weights of the testes and epididymis in
the treated rats significantly decreased compared with the control. Histopathology of testes revealed
dose-related severe atrophy of the seminiferous tubules with total absence of spermatids and
degenerated and desquamated spermatocytes. Examination of the epididymis showed reduced
numbers of spermatozoa and increased numbers of degenerated or desquamated cells in the lumen of
the epididymal duct. The effects on the epididymis did not show a dose–response relationship, but
were more severe with longer dosing, i.e. more severe after 4 weeks than after 2 weeks. In this study,
nitrofurazone induced toxicity on the testes and epididymis after oral treatment with 50 and 100 mg/kg
b.w. per day for 2 or 4 weeks.
Nishimura et al. (1995) treated male Sprague–Dawley rats (8 weeks old, n = 10) by gavage with
nitrofurazone (chemical form not specified, suspended in 0.5 % carboxymethyl cellulose) at doses of
12.5, 25 or 50 mg/kg b.w. per day for 6 weeks, including 4 weeks prior to mating with untreated
females during a 2-week period (experiment 1). In addition, groups of 10 male rats (15 weeks old)
received doses of 12.5 or 25 mg/kg b.w. per day by gavage for 11 weeks, including 9 weeks prior to
mating with untreated females during a 2-week period (experiment 2). Males were sacrificed directly
after the mating period and dams were sacrificed on day 14 to 17 of gestation and examined. Mean
testes and epididymis weights decreased at 25 and 50 mg/kg b.w. per day in rats treated for 6 weeks.
When treated for 11 weeks, mean epididymis weight decreased in both dose groups, and mean testis
weight decreased at only 25 mg/kg b.w. per day. Sperm head counts were significantly reduced in the
two highest dose groups of experiment 1 and at 25 mg/kg b.w. per day in experiment 2.
Histopathological examination of the testes found tubular degeneration and interstitial cell hyperplasia
in all animals of the two highest dose groups of experiment 1 and of the highest dose of experiment 2.
Failure of spermiation was found in all dose groups: at 28.4 % in the 12.5 mg/kg b.w. per day dose
group and at 100 % in the other dose groups in experiment 1, and at 50 % (low dose) and at 100 %
(high dose) in experiment 2. None of the dams that were mated with males treated with 50 mg/kg b.w.
per day for 6 or 11 weeks or with 25 mg/kg b.w. per day for 11 weeks became pregnant. Only 28.6 %
of the dams that were mated with males treated for 6 weeks with 25 mg/kg b.w. per day became
pregnant. Pre- and post-implantation losses increased in dams mated with male rats treated for 6 weeks
with 25 mg/kg b.w. per day and for 11 weeks with 12.5 mg/kg b.w. per day. In this study, which
showed clear effects of nitrofurazone on the reproductive performance of male rats, no NOAEL could
be identified.
Male rats (Crj:CD, 8 weeks old) were treated with a single oral dose of 0 (n = 30), 100 (n = 24) or
300 (n = 30) mg nitrofurazone/kg b.w. (Shoda et al., 2001). Three rats for each dose group were
sacrificed at different time points post dosing: after 6, 12 or 24 hours, 2 or 4 days and 1, 2 or 4 weeks,
and also after 8 or 12 weeks for the highest dose group. In the 300 mg/kg b.w. group, the absolute
testis weight significantly decreased from day 4 of treatment to week 8, and the relative weights
decreased up to week 12. No effects on testis weights were found at 100 mg/kg b.w. Histopathology
Nitrofurans in food
EFSA Journal 2015;13(6):4140 74
revealed no changes in testes 6 hours after treatment with 300 mg/kg b.w., but, 12 hours after
treatment, degeneration of spermatocytes and vacuolisation of Sertoli cells were found. These effects
worsened after 24 hours up to 2 weeks post dosing, when atrophy of seminiferous tubules was
observed. Regeneration of seminiferous epithelia started 4 and 8 weeks post dosing, although some
atrophic and abnormal tubules were still present. In the low-dose group, similar changes in the
seminiferous epithelium and vacuolation of Sertoli cells were seen, but the effects were less severe.
The same authors measured hormones in the blood (progesterone, testosterone, prolactin, oestradiol,
follicle-stimulating hormone (FSH) and luteinising hormone) of male rats (Crj:CD, 9 weeks old)
treated orally once with 0 (n = 20) or 300 (n = 22) mg/kg b.w. Animals (five or six in each group)
were necropsied 6, 12, 24 or 48 hours after treatment. Sporadic decreased or increased values of the
hormones were found, and this was not dependent on time after treatment. Thus, no correlation
between the changes seen on degeneration of germ cells and hormone levels could be established in
this study.
Male rats (Chester Beatty Research Institute strain, 11 weeks old, six in each group) were fed
nitrofurazone (chemical form not specified) for 25 days in the diet at concentrations of 1 500 or
5 000 mg/kg, reduced to 3 000 mg/kg after 3 days (Montemurro, 1960). These concentrations
correspond to 180, 600 and 360 mg/kg b.w. per day, respectively, using the default factor of 0.12 as
recommended by the EFSA SC (2012). Toxicity in the highest dose group of 600 mg/kg b.w. per day
led to a decrease of the dose after 3 days. Weights of the animals at sacrifice decreased dose
dependently. Relative testes weights decreased in both treated groups, and relative seminal vesicle
weight increased in the low-dose group. Histologically there was no difference in the seminal vesicles
between the treated animals and the controls. Testicular atrophy was found in all treated rats, but was
more severe in the low-dose group. In the low-dose group, severe degeneration of the spermatogenic
epithelium was also found, but no information was reported for the high-dose group.
Nitrofurazone (0.1 % mixed in crushed pellets) was tested for effects on the spermatogenic, endocrine
and secretory functions in male Sprague–Dawley rats (60 to 88 days old, n = 3 to 5 for the treated
groups and n = 8 for the control group) treated, via the feed, with a dose corresponding to 64 mg/kg
b.w. per day for 0, 2, 4, 6, 10, 14 or 28 days (Hagenäs et al., 1978). Pregnant rats were treated with a
single dose of cobalt-60 (150 rad) to produce germ cell-depleted male rats, i.e. ‘Sertoli cell only’ rats
(SCO rats). Nitrofurazone caused a time-dependent decrease in the weight of testes in normal rats and
a decrease in ventral prostrate in normal and SCO rats treated for 28 days. Significantly increased
levels of FSH were found after 10 and 28 days’ treatment in normal rats, but not in treated SCO rats,
compared with control rats. FSH stimulates androgen-binding protein (ABP) production and it was
found that ABP in normal rats decreased until day 6 of treatment and then increased to a maximum
after 10 days of treatment; moreover, it was still higher than in the controls after 28 days of treatment.
ABP production in SCO rats followed the same pattern as in normal rats, but at a lower level, i.e. at
the same level as the SCO control group. As a consequence, nitrofurazone was lethal for all germ cells
in normal rats except for some undeveloped primary spermatocytes and spermatogonia after 28 days
of treatment. No germ cells exist in the SCO rats, which means that nitrofurazone did not exert its
effect on the Sertoli cells. Testosterone levels in serum were not affected in normal and SCO rats.
Morphological analyses showed that tubules were severely damaged and that mature germ cells were
lacking after 14 and 28 days of treatment. Shorter treatment (2 to 10 days) caused similar effects,
increasing with time. Electron microscopy of testes in normal rats revealed that the shape of Sertoli
cells was changed and that there was a decreasing number of germ cells. Severe abnormalities were
found in surviving spermatids in normal rats treated for 6 and 10 days. Testes from treated SCO rats
showed that Sertoli cells were less affected by treatment with nitrofurazone than in normal rats.
Furthermore, in both normal and SCO rats, the cell junctions of the inter-Sertoli cells were
impermeable for lanthanum, indicating that the blood–testis barrier was not affected by nitrofurazone.
All these tests indicate that nitrofurazone mainly affects germ cells.No studies on spermatogenesis
were identified for SEM, nifursol or DNSH.

Nitrofurans in food
EFSA Journal 2015;13(6):4140 75
Conclusions
Oral administration of furazolidone caused toxic effects on testes and epididymis (200 mg/kg b.w. per
day) and on the hypothalamus (50 and 200 mg/kg b.w. per day) in rats treated for 5 days. Cytotoxic
effects in testes and reduced relative testes weights were observed in rats treated orally with
furazolidone at a dose of 100 mg/kg b.w. per day for 7 days.
No studies on spermatogenesis were identified for AOZ.
Cytotoxic effects in testes and reduced relative testes weights were observed in rats treated orally with
furaltadone at a dose of 100 mg/kg b.w. per day for 7 days.
No studies on spermatogenesis were identified for AMOZ.
For nitrofurantoin, toxic effects on spermatogenesis were found in rats treated orally for 1 month at
doses of 10 or 85 mg/kg b.w. per day.
No studies on spermatogenesis were identified for AHD.
Nitrofurazone caused effects on testes and on epididymis in rats at doses of 12.5 to 360 mg/kg b.w.
per day orally for up to 12 weeks, and in mice at the only dose tested of 64 mg/kg b.w. per day orally
for 10 or 20 days. Cytotoxic effects in testes and reduced relative testes weights were observed in rats
treated orally with nitrofurazone at a dose of 100 mg/kg b.w. per day for 7 days.
No studies on spermatogenesis were identified for SEM, nifursol or DNSH.
Based on the available studies, no NOAEL could be identified for toxic effects on spermatogenesis.
8.2.4.2. Embryotoxicity and teratogenicity
Groups of mice (albino C strain) were treated with furazolidone (chemical form not specified) in the
diet at concentrations of 0 (control, n = 20), 1 000 (days 1 (n = 10), 6 (n = 4) and 10 (n = 3) of
pregnancy) or 2 000 mg/kg (day 1 of pregnancy, n = 5) (Jackson and Robson, 1957). Using the default
factor of 0.2 as recommended by the EFSA SC (2012), these concentrations correspond to doses of 0,
200 or 400 mg/kg b.w. per day, respectively. Furthermore, mice were treated with doses of 0 (n = 4),
750 (day 6–7, n = 4), 1 000 (days 1 (n = 10), 6–7 (n = 5) and 10–11 (n = 6)), 1 250 (days 1 (n = 10)
and 10–11 (n = 3)), 1 500 (day 6–7, n = 3) or 2 000 (day 7, n = 4) mg/kg b.w. per day via gavage in a
suspension of olive oil, at various stages of pregnancy (shown in parentheses after the dose). No
maternal deaths occurred at doses of 750 or 1 000 mg/kg b.w. per day, but some deaths (25 to 33 %)
occurred at the higher doses fed by gavage (1 250, 1 500 and 2 000 mg/kg b.w. per day). Maternal
deaths of 60 % were found in the 400 mg/kg b.w. per day dose group treated via feed. The number of
abortions and fetal deaths was 90 to 100 % when furazolidone was given on day 1 (200, 400, 1 000 or
1 250 mg/kg b.w. per day), day 6 (200 mg/kg b.w. per day) or days 6 and 7 (1 000 or 1 500 mg/kg
b.w. per day) of pregnancy compared with 75 % in the 750 mg/kg b.w. per day dose group fed by
gavage on day 6 to 7 of pregnancy and 25 % in the control group. Treatment on day 10 to 11 did not
result in increased deaths, except for 33 % in the 1 000 mg/kg b.w. per day dose group treated by
gavage. Toxicity in the highest dose group (2 000 mg/kg b.w. per day) treated on day 7 resulted in
vaginal bleeding and abortions within 24 hours. At the lower doses, the effects were the same but
delayed, with a gradual loss in weight and then resorption of fetuses. Body weight of the litters was
lower in all groups treated with furazolidone, but no abnormalities were found.
No embryotoxicity or teratogenicity studies were identified for AOZ, furaltadone or AMOZ.
Mice (ICR/Jcl, 10 to 12 weeks old) were treated s.c. with nitrofurantoin (finely ground and
suspended in 1 % gelatine solution) in doses of 100 mg/kg b.w. per day (n = 17) or 250 mg/kg b.w. per
day (n = 13) on days 9, 10 and 11 of gestation (Nomura et al., 1984). The control group was treated

Nitrofurans in food
EFSA Journal 2015;13(6):4140 76
with a gelatine solution. No effects on fetal deaths and living fetuses were found. Fetus weights
significantly decreased in both males and females treated with 250 mg/kg b.w. per day.
Malformations, such as cleft palate, syndactyly and oligodactyly were found in 10 out of 131 fetuses
treated with 250 mg/kg b.w. per day compared with 1 out of 183 for controls. No malformations were
found at 100 mg/kg b.w. per day. No information about maternotoxicity was reported.
Embryotoxicity was studied in rats (Sprague–Dawley) treated with nitrofurantoin (macrocrystals) by
gavage in a suspension of 0.5 % aqueous methylcellulose (Prytherch et al., 1984). Male rats were
treated with vehicle and divided into three groups (n = 15) or with 10 mg/kg b.w. per day of
nitrofurantoin for 60 days before mating. One male was paired with two females until pregnancy was
verified. After mating, the males were sacrificed for necropsy and histopathology of the testes. No
adverse effects were found and histopathological investigation showed no abnormalities in testes.
Females (96 days old, n = 30/group) were treated with 10, 20 or 30 mg/kg b.w. per day for 14 days
before mating. Females dosed with 0, 20 or 30 mg/kg b.w. per day were mated with control males
from the three vehicle treated groups mentioned above, and females dosed with 10 mg/kg b.w. per day
were mated with males dosed with 10 mg/kg b.w. per day. At day 13 of pregnancy, 10 females/group
were sacrificed and necropsied. The rest of the females were sacrificed 21 days after weaning for
necropsy. No effects on body weights or feed consumption or on clinical signs were found in treated
males and females. In dams of the 10 and 30 mg/kg b.w. per day dose groups that had a successful
pregnancy, duration of gestation, indicators for fertility, gestation and lactation were normal. In the
group treated with 20 mg/kg b.w. per day and sacrificed on day 13 of gestation, an increased number
of resorptions was found. For dams in this dose group sacrificed on day 21 of gestation, decreased
body weight of live pups at birth and at day 4 and decreased viability of pups at day 4 were found, but
no differences in viability of pups between groups were found 21 days after parturition. The only
malformations found were hydrocephalus in one male pup in the 10 mg/kg b.w. per day dose group
and microphthalmia in one male pup in the 20 mg/kg b.w. per day dose group. Furthermore, rats were
bred as described above and females were treated from day 14 of pregnancy until weaning with 10, 20
or 30 mg/kg b.w. per day of nitrofurantoin. Dams were killed at weaning and pups were examined
during weaning on days 4, 14 and 21. No treatment-related effects were found in the dams. The only
effect found was that treated pups were heavier than those in the control group on certain days.
Overall, no dose-related effects were found in these studies in which rats were treated with
nitrofurantoin during and before pregnancy. However, as an increased number of resorptions,
decreased body weights of live pups at birth and at day 4 postnatally, and decreased viability of pups
at day 4 after birth were found in the 20 mg/kg b.w. per day dose group, a NOAEL of 10 mg/kg b.w.
per day for embryotoxic effects in rats treated with nitrofurantoin could be identified.
Pregnant Sprague–Dawley rats were treated orally by gavage with nitrofurantoin macrocrystals in a
0.5 % aqueous methyl cellulose suspension at doses of 0 (n = 18), 10 (n = 19), 20 (n = 17) or
30 (n = 20) mg/kg b.w. per day from day 6 to 15 of pregnancy (Prytherch et al., 1984). On day 20 of
pregnancy, the dams were killed and mothers and fetuses were examined. No maternotoxicity and no
effects on litter size, number of resorptions or fetal weights were found. No major external, visceral or
skeletal malformations were found in the fetuses. Some sporadic minor abnormalities were found in a
non-dose related manner: 2 out of 105 pups had large anterior fontanelles in the low-dose group, 2 out
of 117 pups had missing ribs and short ribs in the high-dose group and 1out of 111 pups had short ribs
in the control group. The rate of occurrence of abnormalities in the treated groups (1.90, 0.0 and
1.71 % in the low-, mid- and high-dose groups, respectively) did not differ from that in the control
group (1.80 %). A NOAEL for teratogenic effects in rats treated with nitrofurantoin of 30 mg/kg b.w.
per day was identified in this study.
Rabbits (New Zealand White) were bred—one male with several females—until pregnancy was
verified (Prytherch et al., 1984). Rabbits were treated by gavage with nitrofurantoin macrocrystals in a
0.5 % aqueous methyl cellulose suspension at doses of 0 (n = 17), 10 (n = 15), 20 (n = 12) and
30 (n = 15) mg/kg b.w. per day from day 6 to 18 of pregnancy. On day 29 of pregnancy, the dams
were killed and mothers and fetuses were examined. No maternotoxic effects were found. There were
no significant differences in litter size, number of resorptions or fetal weight. A non-dose-related
Nitrofurans in food
EFSA Journal 2015;13(6):4140 77
increase in the average number of dead fetuses per dam was found in the treated groups (0.40 (low
dose), 0.42 (mid-dose) and 0.20 (high dose)) compared with the controls (0.06). According to the
authors, these numbers were not significantly different from the controls. External, visceral and
skeletal malformations in the fetuses were not significantly different from those found in the control
group. Only sporadic malformations were found: hydrocephalus in 1 out of 129 fetuses in the control
group and in 1 out of 141 fetuses in the low-dose group, and fusion of the last thoracic and first lumbar
vertebrae and scoliosis in 3 out of 135 fetuses in the high-dose group. A NOAEL for teratogenic
effects of 30 mg/kg b.w. per day was identified in this study when rabbits were treated with
nitrofurantoin.
No embryotoxicity or teratogenicity studies were identified for AHD.
The effects of nitrofurazone on teratogenicity were tested in mice (CD-1) (NTP, 1985). Females were
mated with one male until pregnancy was verified. The doses were selected based on results of two
preliminary toxicity tests where the highest dose, 750 mg/kg feed, caused clear maternotoxicity.
Groups (n = 20 to 26) of mice (CD-1, 8–10 weeks old) were therefore treated with 0, 38, 75, 250 or
500 mg/kg in feed, corresponding to reported mean intakes of 0, 6, 14, 41 or 82 mg/kg b.w. per day,
respectively, from gestation day 6 to 15. No toxic effects were found in dams on weight gain, body
weight, mortality, uterine weight during pregnancy, and absolute and relative liver weight.
Sporadically, clinical signs such as lethargy and piloerection were found in dams in all treated groups
from day 7 to 16 of gestation. At day 14 to 16 of gestation, sporadic hyperactivity, convulsions and
rough coats were found with a tendency, although not significant, for an increase in the highest dose
group. No treatment-related effects on corpora lutea or the number of implantation sites per dam were
found, but in the two lowest and the highest dose group the percentage of pre-implantation loss
decreased. No treatment-related effects on resorptions were found, but a dose-related tendency for an
increase in the percentage of dead fetuses per litter and an increase in the percentage of litters with
dead fetuses was seen, with higher incidences in the two highest dose groups. No treatment-related
effect on the number of non-live implants or adversely affected implants was found, and no effects
were found on the number of live fetuses per live litter or on the sex ratio in litters but the fetal body
weight per live litter was decreased in the highest dose group only. No increase in malformations in
fetuses was found compared to the control group. Nitrofurazone was not teratogenic to mice when
given during organogenesis at doses up to 82 mg/kg b.w. per day. For fetotoxicity a NOAEL of
14 mg/kg b.w. per day was identified from this study.
Nitrofurazone (chemical form not specified) was tested in CD-1 mice (n = 50) treated by gavage with
a dose of 100 mg/kg b.w. per day from day 6 to 13 of gestation (Hardin et al., 1987). The control
group received corn oil. The pups were allowed to live for 3 days. One dam in the treatment group
died during the study. The number of viable litters was reduced in the treatment group (28 out of 35)
compared with the control group (45 out of 45) and birth weight was reduced in pups from treated
dams. The number of live born pups per litter, the percentage survival up to 3 days and weight gain
were not affected by treatment. This was a poorly reported study in which 60 chemicals were tested.
Embryotoxicity and malformations in mice (ICR/Jcl, 10–12 weeks old) treated s.c. with nitrofurazone
were studied (Nomura et al., 1984). Mice were treated s.c. with nitrofurazone (finely ground and
suspended in 1 % gelatine) at doses of 300 mg/kg b.w. once on day 10 of gestation (six mice) or of
100 mg/kg b.w. per day on days 9, 10 and 11 of gestation (16 mice). The control group was treated
with a gelatine solution. Increased fetal deaths were found in the group treated on day 10 with
300 mg/kg b.w. The weights of the fetuses significantly decreased for both dose groups.
Malformations such as oligodactyly, tail anomalies, polydactyly, defective legs and omphalocoele
were found in 1 out of 185 fetuses treated with 100 mg/kg b.w. per day and in 14 out of 66 fetuses
treated with 300 mg/kg b.w. of nitrofurazone, compared with in 1 out of 183 fetuses in the control. No
information about maternotoxicity was mentioned, but the authors reported that the doses were close
to the maximal tolerated dose in mice.

Nitrofurans in food
EFSA Journal 2015;13(6):4140 78
The effects of nitrofurazone on teratogenicity were tested in rabbits (New Zealand White, n = 22 to
27) treated by gavage with nitrofurazone in corn oil at doses of 0, 5, 10, 15 or 20 mg/kg b.w. per day
from day 6 to 19 of pregnancy (NTP, 1987). The highest dose was maternotoxic with deaths in 2 out
of 26 rabbits, decreased weight gain and increased absolute and relative liver weights. Clinical signs
such as lacrimation, glaucoma, weight loss and no faeces occurred sporadically with a tendency to
increase with dose and days of pregnancy. However, no clear treatment-related maternotoxicity was
found at doses of 5, 10 or 15 mg/kg b.w. per day. No differences in the number of corpora lutea per
dam, implantation sites or the percentage of pre-implantation loss per litter were found. No dose-
related trend for the percentage resorptions per litter was found for the three lowest dose groups. In the
highest dose group, embryotoxicity, characterised by a significant increase in the number of
resorptions, the percentage of non-live implants and the percentage of adversely affected implants per
litter, was found. The percentage of male fetuses per litter decreased in the highest group. Major
anatomical malformations, expressed as a percentage of live fetuses per litter, increased in the highest
dose: 14.6 % compared with 2.7 % in the vehicle control. In addition, in the highest dose group, the
percentage of litters with malformations (40 % versus 12.5 % for the control group) and the
percentage of malformed females per litter (17.1 % versus 1.1 %) increased. No increase in
malformations was found in the other treatment groups. Nitrofurazone was not teratogenic to rabbits
when given during organogenesis (day 6 to 19 of pregnancy) at doses that were not maternotoxic.
From this study, a NOAEL of 15 mg/kg b.w. per day was identified.
Rats (Sprague–Dawley) received SEM (aqueous solution) by gavage at doses of 5 (n = 4), 10 (n = 11)
or 100 (n = 9) mg/kg b.w. per day on gestation day 12 to 15, or at doses of 25 (n = 3) or 50 (n = 8)
mg/kg b.w. per day on gestation day 10 to 16 (Steffek et al., 1972). Maternotoxicity was not reported
except that three out of nine rats died from the 100 mg/kg b.w. per day dose group. The only effects
studied were resorptions and cleft palate. Increased resorptions were found in groups treated with
50 mg/kg b.w. per day (38 %) and 100 mg/kg b.w. per day (56 %). Cleft palates were found in 12 out
of 28, 40 out of 42 and 22 out of 22 fetuses of the 25, 50 and 100 mg/kg b.w. per day dose groups,
respectively. No effects on the incidence of cleft palate or resorptions were found at 10 mg/kg b.w. per
day. However, because this was the only parameter investigated, the CONTAM Panel could not
conclude on a NOAEL for teratogenicity in rats treated with SEM.The effect of SEM on levels of
pulmonary surfactants such as phospholipids in new-born rats were investigated (De La Fuente et al.,
1983a). Rats (Wistar), using intraperitoneal (i.p.) infusion, were given 100 mg/kg b.w. SEM (aqueous
solution) or only distilled water (control group) on day 10 of gestation. Rats (control and treated; n = 8
to 16) were sacrificed on day 18 and day 21 of gestation and one group was allowed to deliver pups,
which were studied postnatally on day 1, 3, 7, 15, 22 and 30. Phospholipids were extracted from the
lungs of fetuses and offspring. The ratio of phosphatidylcholine to spingomyelin decreased in treated
fetuses compared with controls. The ratio was also lower in treated offspring on day 1 after birth, but
on day 3 to day 30 the ratio was not significantly different between treated offspring and those in the
control group. Based on these results, the authors concluded that SEM has an effect on the surfactants
of the lung pre-natally and post natally and could therefore have a negative effect on lung development
in offspring from rats treated i.p. with 100 mg/kg b.w. SEM on day 10 of gestation.
De La Fuente et al. (1983b) treated rats (Wistar) i.p. with SEM (dissolved in saline) at doses of 50, 75,
100 or 150 mg/kg b.w. on day 7, 10 or 13 of pregnancy. Control rats received saline only. Rats were
either sacrificed on day 21 of gestation or allowed to deliver normally. The pups were studied for 1
month thereafter. Resorptions increased dose dependently, and fetal deaths occurred in all treated
groups. The number of live fetuses and fetal weights decreased in all groups except the group treated
on day 13 with 50 mg/kg b.w. In all dose groups sacrificed on day 21 of gestation, severe
haemorrhages in the liver, brain and intestines, mostly when dams were treated on day 10 (the
differentiation period), were found. Furthermore, anophthalmia on one side, cleft palate, absence of
testes and hydronephrosis, mostly when animals were treated on day 13 (the development period),
were found in the fetuses. Incomplete ossification of the skull, which was most frequent when dams
were treated during the implantation period (day 7), was one of the most common abnormalities of the
skeleton. Incomplete ossification of sternum and limbs and malformations of the ribs were found in
fetuses from all treated groups. Postnatal mortality increased significantly with the dose (25 to 35 % in
Nitrofurans in food
EFSA Journal 2015;13(6):4140 79
the 50 mg/kg b.w. group, 30 to 43 % in the 75 mg/kg b.w. group, 44 to 63 % in the 100 mg/kg b.w.
group and 45 to 57 % in the 150 mg/kg b.w. group) compared with control rats (< 5 %) during the first
month after delivery.
To test the hypothesis that the teratogenic effect of SEM is caused by the blocking of DNA synthesis,
De La Fuente et al. (1983b) measured DNA, RNA and protein in the liver and lungs of Wistar rats
treated i.p. with 100 mg/kg b.w. on day 10 of pregnancy. DNA, RNA and protein levels decreased in
the lungs of treated rats sacrificed on day 18. When treated rats were sacrificed on day 21, only lung
DNA levels decreased compared with control rats. In the liver, protein levels decreased only at
sacrifice on day 21 compared with controls. Levels of pulmonary DNA and RNA decreased in fetuses
from mothers sacrificed on day 21, but not in offspring. Liver protein levels significantly decreased
compared with controls, but liver DNA and RNA levels decreased in only 30-day-old offspring. The
authors concluded that the results indicate that the teratogenic effect of SEM might be due to effects
on nucleic acids and protein levels in the liver, as alterations in protein levels at the end of pregnancy
can alter gestation.
The effect of SEM hydrochloride on rats (Wistar) during intrauterine and postnatal development was
investigated (de la Fuente del Rey, 1986). Rats (13–15/group) were treated i.p. with 17 mg/kg b.w.
every day during gestation or with doses of 50, 75, 100 or 150 mg/kg b.w. on day 5, 7, 10, 13 or 15 of
gestation. Control animals were treated i.p. with saline. Rats were divided into two groups: group A
(8 to 10 dams per dose group) rats were killed after 21 days of pregnancy and group B (five dams per
dose group) rats were allowed to deliver and the pups were studied for 1 month. High mortality of
dams occurred in the highest dose group, mortality was sporadic in the 100 mg/kg b.w. dose group and
only one dam died in the 50 mg/kg b.w. group. The numbers of litters, implantations, resorptions and
dead fetuses were not affected. The number of live fetuses decreased at all dose levels. Mean fetal
weights decreased in all dose groups on all treatment days except when dams were treated on days 13
and 15 in the low-dose group. The only effect found in the group treated with 17 mg/kg b.w. SEM per
day was a reduced number of implantations and live fetuses per litter. Abnormalities such as internal
hydrocephaly, exencephaly, meningocele, severe haemorrhages in liver and intestines, anophthalmia,
cleft palate, absence of testes and hydronephrosis were found in the groups treated with 50, 75, 100 or
150 mg/kg b.w., but they differed in severity in relation to the different days of treatment. Incomplete
ossification of the skull, minor malformations in the ribs, absence of sternum and incomplete
ossification of limbs were found in all treated groups but not in the control group. Treatment with
SEM during the whole gestation period with 17 mg/kg b.w. per day resulted in similar anomalies,
except that absence of testes and sternum and incomplete ossification of the limbs did not occur in this
group. Postnatal mortality increased in pups from SEM-treated dams on all treatment days and at all
doses tested. Maternotoxicity was not reported, but the malformations were found in pups from
females that did not show any clear signs of toxicity. Thus, embryotoxic and teratogenic effects were
found at all doses, including the lowest dose of 17 mg/kg b.w. per day.
Wiley and Jonega (1978) treated pregnant Golden Syrian hamsters by gavage on day 7 of gestation
with 100, 150 or 200 mg/kg b.w. SEM hydrochloride in aqueous solution. All dams of the two highest
dose groups died, mostly within 48 hours. Examination of the uterus of the dead dams revealed signs
of resorption at all implantation sites. The dams of the 100 mg/kg b.w. group were sacrificed at day
14 of gestation. Mortality, the number of implants and live fetuses, and mean fetal weights were not
different from the control group. Growth retardation (weight of less than 60 % of control pups) was
found in 16.5 % of the pups, and malpositions of limbs in 5.1 % of the offspring were recorded. No
skeletal or visceral abnormalities were found. Maternotoxic effects other than deaths were not
reported.
No embryotoxicity or teratogenicity studies were identified for nifursol or DNSH.
Nitrofurans in food
EFSA Journal 2015;13(6):4140 80
Conclusions
Furazolidone was embryotoxic when given orally to mice at doses of 200 mg/kg b.w. per day or
higher during early pregnancy. No NOAEL could be identified for furazolidone in mice.
No embryotoxicity or teratogenicity studies were identified for AOZ, furaltadone or AMOZ.
Nitrofurantoin was not teratogenic or embryotoxic to mice at s.c. doses of 100 mg/kg b.w., but was at
250 mg/kg b.w. per day on days 9, 10 and 11 of gestation. Rats treated orally with nitrofurantoin at
doses of 10 mg/kg b.w. per day showed no embryo- or fetotoxic effects, but doses of 20 mg/kg b.w.
per day caused effects on resorptions of embryos and led to decreases in body weight and the viability
of pups after birth. No teratogenic effects were observed in rats or rabbits treated orally with
nitrofurantoin during organogenesis with doses of 10 to 30 mg/kg b.w. per day. A NOAEL for
embryotoxicity in rats of 10 mg/kg b.w. per day was identified, and a NOAEL for teratogenicity of
30 mg/kg b.w. per day was identified for both rats and rabbits treated during organogenesis with
nitrofurantoin.
No embryotoxicity or teratogenicity studies were identified for AHD.
Nitrofurazone tested orally in mice was not teratogenic at doses up to 82 mg/kg b.w. per day. In mice
dosed during organogenesis, a NOAEL of 14 mg/kg b.w. for fetotoxicity was identified. Nitrofurazone
was not teratogenic in rabbits treated with doses up to 15 mg/kg b.w. per day, but malformations were
observed at a dose of 20 mg/kg b.w. per day, which was also maternotoxic. A NOAEL of 15 mg/kg
b.w. per day was identified for maternotoxicity in rabbits.
Embryotoxic and teratogenic effects of SEM were found at all doses (17 to 150 mg/kg b.w.) tested i.p.
in rats during pregnancy. No cleft palate or resorptions were observed in rats treated orally with SEM
at a dose of 10 mg/kg b.w. per day. However, as no other effects were studied, a NOAEL cannot be
identified.
No embryotoxicity or teratogenicity studies were identified for nifursol or DNSH.
8.2.4.3. Multigeneration studies
No multigeneration studies were identified for furazolidone, AOZ, furaltadone, AMOZ,
nitrofurantoin or AHD.
Nitrofurazone was tested in a two-generation reproduction toxicity study in CD-1 (ICR) BR Swiss
albino mice following a continuous breeding protocol (George et al., 1996). A dose-ranging study was
performed with mice (11 weeks old, eight mice per sex in each group) treated with nitrofurazone at
concentrations of 0, 100, 200, 400, 600 or 900 mg/kg in the diet for 2 weeks. Animals treated with
doses ≥ 400 mg/kg in the diet showed clinical signs such as hyperactivity, dehydration, inflamed
eyelids and excessive circling. No effects on body weight were seen, but water consumption
significantly decreased in a dose-dependent manner in the highest dose. Thus, doses lower than
900 mg/kg in feed were used in the following tests.
The F0 generation of mice (11 weeks old) were treated with nitrofurazone in the feed at concentrations
of 0 (n = 40 of each sex), 100 (n = 20 of each sex), 375 (n = 19 of each sex) or 750 mg/kg (n = 18 of
each sex), corresponding to 14, 51 or 102 mg/kg b.w. per day, respectively (George et al., 1996). The
mice, females and males separated, were first dosed for 1 week. Thereafter, the F0 mice, living as
breeding pairs (one male and one female), were treated with different doses for 14 weeks. After this
phase, the F0 males were separated from the females and their litters, and all mice were treated for an
additional 6 weeks, during which time gestation and lactation took place. The litters were euthanised
at PND 0. In the highest dose group, fertility was significantly reduced (17 % (3 out of 18 breeding
pairs) compared with 95–100 % for the other groups) and the breeding pairs were infertile when the
third litter should have been produced. In the mid-dose group (51 mg/kg b.w. per day) fertility in the
Nitrofurans in food
EFSA Journal 2015;13(6):4140 81
fifth litter was 47 % compared with 88 % in controls. The live pup weight was reduced in the high-
dose group. In the mid- and high-dose groups, a reduced number of litters per breeding pair, reduced
average litter sizes and a decreased percentage of pups born alive were found. No effects were found
in the low-dose group. The number of dams showing aberration of labour and/or delivery, and/or
inadequate postnatal care, increased dose-dependently by 1 % (control), 3 % (low dose), 14 % (mid-
dose) and 25 % (high dose).
Necropsy of the F0 males at week 27, when animals were 38 weeks of age, showed that liver, kidney
and adrenal weights increased in the two highest dose groups compared with controls. Histopathology
of male mice revealed hepatic centrilobular hypertrophy at the high dose, and the weights of right
corpus, caput epididymis and right testis also decreased in high-dose males. Sperm analysis revealed a
decrease in epididymal sperm concentration at the two highest doses and a reduction in testicular
spermatid counts in all dose groups. Sperm motility decreased significantly in the highest dose group.
Intratesticular testosterone levels increased in the high-dose group only. Histopathology revealed that
the incidence of seminiferous tubule degeneration followed by epididymal hypospermia, as well as
atrophy, showed treatment-related increases. In females of the high-dose group, decreased body
weight and hepatic hypertrophy were found. Altered oestrous cycles were found after examination of
vaginal smears in mice of the high-dose group. Relative ovary weights, including oviducts, decreased
at all doses, but no histopathology was performed.
Fertility of the F1 generation was tested in weanling mice reared at PND 21. The mice were fed a diet
containing 0, 100 or 375 mg/kg nitrofurazone in the feed, corresponding to 0, 15–21 or 61–80 mg/kg
b.w. per day, respectively. In the study, 20 (control), 20 (low dose) and 14 (high dose) mice of each
sex were paired until vaginal plugs were found or 1 week had passed. The F2 generation was delivered
and litter data were collected. Reduced fertility and smaller F2 litters were found in the high-dose
group. Clinical signs such as lethargy, hunched back position and dehydration were found in the high-
dose F1 males and females. Reduced testes weight and epididymal sperm number, and abnormal sperm
morphology were found in F1 males. Borderline nephropathy was noted in both dose groups. In F1
female mice, decreased body weight and liver and ovarian weights were found in the high-dose group,
and altered oestrous cycles were found at both doses (George et al., 1996).
The effects on fertility of nitrofurazone as described above were confirmed in a separate cross-over
mating study carried out by the same authors (George et al., 1996). To evaluate gender-specific
effects, control male and female mice were mated (group 1), high-dose males (102 mg/kg b.w. per
day) were mated with control females (group 2) and control males were mated with high-dose females
(102 mg/kg b.w. per day) (group 3). Mice (23 weeks old) were mated in breeding pairs until a vaginal
plug was detected or 1 week had passed. After delivery (PND 0), all litters were examined and the
pups were sacrificed. A significantly reduced mating efficiency (63 % versus 75 % for control) and
absence of fertility were found in group 2, and a decreased number of live pups per litter (5.4 versus
10.8 for controls) was found in group 3.
The effect of SEM treatment of Wistar rats during gestation, for three successive generations, on
hepatic levels of DNA, RNA and protein was investigated by De La Fuente et al. (1983c). SEM in
saline was injected i.p. in a single dose of 100 mg/kg b.w. during the 10th day of gestation to the adult
females in three successive generations. The different generations were divided into one control group
and one treatment group. Livers were collected from sacrificed animals from 21-day-old fetuses, from
offspring of 1, 7, 15 or 30 days old and from rats pregnant for 21 days and were analysed for levels of
DNA, RNA and protein. A significant decrease of RNA levels was observed for the F2 and F3
generations compared with the F1 generation in 21-day-old fetuses and 1- and 7-day-old offspring.
DNA levels were decreased only in the F3 compared with the F1 generation in 21-day-old fetuses. No
difference in DNA and RNA levels were found for the pregnant rats compared with controls, but if the
generations are compared the levels decreased in F1 and F2 rats compared with P rats. Hepatic protein
levels decreased in the F2 and F3 generations compared with the F1 generation in 21-day-old fetuses.
Hepatic protein in pregnant rats decreased in treated rats compared with P and F1 controls. The authors

Nitrofurans in food
EFSA Journal 2015;13(6):4140 82
suggested that the reduction in nucleic acids and proteins is a possible mechanism for the resorptions
and abnormalities found in rats treated with SEM during pregnancy.
A three-generation reproduction study in rats was conducted with nifursol (3,5-dinitrosalicylic acid,
5-nitrofurfurylidene hydrazide) in rats (Long–Evans) (Jorgenson, 1967). The parent generation
consisted of 60 female and 30 male rats divided evenly into three groups (n = 20 female and
10 males/group) which were treated with nifursol in doses of 0, 400 and 600 mg/kg feed. The doses
correspond to 0, 36 and 54 mg/kg b.w. per day, respectively, using the default factor of 0.09 as
recommended by the EFSA SC (2012). The parent generation of rats was fed the medicated diet from
weaning (3 weeks of age) and was mated at 100 days of age and produced F1A and F1B, of which F1B
was fed the medicated diet and mated at 100 days of age and produced the second generation, F2A and
F2B generation. F2B was fed the medicated diet and mated at 100 days of age to produce the third
generation, F3B, which were necropsied and liver, kidney, gonads and uterus were sampled and
analysed for histology. In total, 20 females and 10 males were included in each F group. The F1A, F2A
and F3A generations were kept until weaning and then weighed and sacrificed. Fertility was not
negatively influenced by treatment with nifursol; instead, a positive effect was found compared with
the control group. The ratio of number of dead pups to number of born pups was not influenced by
treatment. The litter size and body weights of the treated pups were either higher or equal to the
controls. Histology results were not presented, and it was mentioned that no abnormal gross pathology
findings were found. Nifursol did not have any effects on reproduction in rats treated with doses up to
54 mg/kg b.w. per day for the three generations.
No multigeneration studies were identified for DNSH.
Conclusions
No multigeneration studies were identified for furazolidone, AOZ, furaltadone, AMOZ,
nitrofurantoin or AHD.
Reproductive toxicity of nitrofurazone administered to mice was clearly shown as a gradual
disruption of fertility related to the degeneration of the seminiferous tubules at all doses tested (14, 51
and 102 mg/kg b.w. per day). The most sensitive parameters for males were abnormal sperm
morphology and a reduced testicular spermatid concentration. In females, the most sensitive effects
were altered oestrous cycles and reduced relative weights of ovaries and oviducts. Nitrofurazone
caused reduced fertility in F0 males and females and in F1 female mice. The CONTAM Panel
concluded that no NOAEL could be identified and that the available study does not provide a reliable
basis for establishing a lowest observed adverse effect level (LOAEL) for the reproductive effects of
nitrofurazone.
SEM (100 mg/kg b.w. i.p.) decreased hepatic levels of DNA, RNA and protein in the livers of rats
treated for three successive generations. The CONTAM Panel concluded that no NOAEL could be
identified and that the available study does not provide a reliable basis for establishing a LOAEL for
the reproductive effects of SEM.
Nifursol had no effects on reproduction in rats treated with 36 or 54 mg/kg b.w. per day for three
generations.
No multigeneration studies were identified for DNSH.
8.2.5. Neurotoxicity
No neurotoxicity studies were identified for furazolidone, AOZ, furaltadone or AMOZ.
The effect of nitrofurantoin on polyneuropathy, a well-known side effect in humans, was
investigated in rats (Behar et al., 1965). Sabra rats (20 to 21 per group) were treated with
nitrofurantoin (5 % suspension in 0.5 % sodium carboxymethylcellulose) orally in doses of 0, 20, 50

Nitrofurans in food
EFSA Journal 2015;13(6):4140 83
or 100 mg/kg b.w. per day (divided in two doses) for 2, 4, 6 or 8 days. Plasma concentrations of
nitrofurantoin were measured daily and were found to be comparable to levels found in humans
treated therapeutically. Sciatic and brachial nerves were analysed histopathologically and sciatic
nerves were used for examination of functionality by electrophysiological methods, i.e. chronaxie and
conduction velocity. Nerves of rats from all dose groups showed axonal dystrophy, independent of
dose, which increased with time up to 6 days’ treatment. In sciatic nerves, a time- and dose-dependent
decrease in conduction velocity was found compared with control groups, and values for chronaxie
increased after 2 days’ treatment in a time- and dose-dependent manner. This study showed that
nitrofurantoin at doses of 20 to 100 mg/kg b.w. per day orally caused both histopathological and
electrophysiological abnormalities in peripheral nerves in rats.
Nerve damage was measured in rats (Wistar, Shell strain) treated i.p. with nitrofurantoin (Rose et al.,
1982). Two groups of 20–32 rats received doses of 100 or 200 mg/kg b.w. per day for 7 consecutive
days. Examination of the animals occurred 2, 3, 4 or 6 weeks after the start of treatment. In the
200 mg/kg b.w. per day group, 18 out of 20 animals were lethargic, showed hunched hindquarters and
splayed hind legs before they died. In the low-dose group, there were no deaths, although the animals
showed similar clinical signs as in the high-dose group as well as reduced muscle tone. Nitrofurantoin
caused increases in β-glucuronidase 2 and 3 weeks after termination of dosing, in sciatic/posterior
tibial nerves and in trigeminal ganglia, and in β-galactosidase 3 weeks after the end of dosing in
sciatic/posterior tibial nerves compared with control animals. The effect was reversible and returned to
control levels after 6 weeks. The same effects were found in the two surviving animals in the high-
dose group 3 weeks after the end of treatment. These effects indicate that high doses of nitrofurantoin
produce peripheral nerve damage in rats.
No neurotoxicity studies were identified for AHD or nitrofurazone.
The parenteral dose (CD50) of SEM causing convulsions was estimated in different species, e.g. in
humans, 40 mg/kg b.w. (i.v.); in monkeys, 60 mg/kg b.w. (i.p.); in rabbits, 175 mg/kg b.w. (i.p.); in
rats, 150 mg/kg b.w. (i.p.); and in mice, 111.7 (i.v.) and 116.4 mg/kg b.w. (i.p.). SEM, at a single i.p.
dose of 168 mg/kg b.w., was also used as a reference substance for inducing convulsions when testing
the effectiveness of anticonvulsants in mice (Jenney and Pfeiffer, 1958).
The effect of SEM hydrochloride on running fits in mice (ddY strain, 4 to 5 weeks old) and its
localisation of action were investigated (Yamashita and Hirata, 1977). Mice were injected in the
superior colliculus with 2 µL SEM (5 µg/animal or 0.2 mg/kg b.w. for a 25-g mouse), and saline or
distilled water were used as controls. The animals were observed for 1 hour before decapitation.
Approximately 10 minutes after injection, running fits, in most cases were preceded by hyperactivity
and followed by clonic and tonic convulsions. These effects were not observed in the control animals.
The anticonvulsant drug pyridoxine, when injected in the superior colliculus or administered i.p.,
reduced the effects of SEM. In addition, i.p. administration of the anticonvulsant aminooxyacetic acid
before SEM treatment reduced the effect of SEM. It was concluded that the effect of SEM on
behaviours such as running fits is probably caused by effects in the superior colliculus, which is the
centre for visual, auditory and somatosensory inputs.
Yamashita and Hirata (1978) investigated the effect on running fits after intracollicular injection of
SEM (2 µL SEM) in the skull of male mice (ddY strain, 4 to 5 weeks old). Mice were treated with 3,
5, 6, 7, 8, 10 or 20 µg/animal (n = 3 to 5, except for the middle dose, n = 10). Saline or distilled water
were used as controls. The mice were observed for 1 hour before being sacrificed. A dose of
6.4 µg/animal induced running fits in 50 % of the animals. Running fits started at about 10 minutes
after injection and were repeated often. Tonic and clonic convulsions often occurred after the running
fits, and they sometimes caused death of the mice. The mice injected with SEM intracollicularly
showed hypersensitivity to sounds. Pyridoxine and aminooxyacetic acid inhibited the effect on
running fits of SEM, as was also shown in the previous study. This study confirmed the results of the
previous study by Yamashita and Hirata (1977).
Nitrofurans in food
EFSA Journal 2015;13(6):4140 84
Male mice (ddY strain, 4–5 weeks old) were injected with SEM dissolved in 5 µL of water or saline in
the left lateral ventricle (intracerebrally (i.c.)) (Yamashita, 1976). SEM was injected at doses of 0, 30
(n = 10), 35 (n = 5), 40 (n = 5), 50 (n = 10) or 60 (n = 20) µg/mouse. In the 50 and 60 µg/mice groups,
5 out of 10 and 11 out of 20 of the rats died, respectively. The latent period for the first convulsions
decreased with dose: it was 22 minutes in the lowest dose and 13 minutes in the highest dose group.
SEM caused tremors and tonic and clonic convulsions in treated mice. It was also shown that mice fed
a vitamin B6-deficient diet initiated tremors and convulsions at lower doses of SEM than mice fed a
normal diet. Vitamin B6 injected i.c. at the same time that 30 µg/mouse of SEM was injected i.c.
prevented convulsions in the mice. When higher doses of SEM were used and injected i.c. but
pyridoxine (a form of vitamin B6) was injected i.p., the number of convulsions increased. SEM was
also injected in different sites of the brain at a dose of 20 µg/mice. It was concluded that SEM might
act on two sites of the brain, one related to running fits (adjacent to the lateral ventricle) and one
related to convulsions and tremors (midbrain).
The effect of SEM on development and maturity was tested in male juvenile rats (n = 6 to 8) treated
orally with 40 or 75 mg/kg b.w. per day at PND 51 to 60 (Maranghi et al., 2009). An open field test
was performed. Rats treated with SEM were less active, had less locomotor activity and had a
markedly decreased frequency of crossing than the control rats. Wall rearing and grooming increased
in the SEM-treated rats. In addition, a plus maze test was done showing a low level of locomotor
activity and a decreased frequency of stretched attended postures in SEM-treated rats. No NOAEL for
these effects was identified.
No neurotoxicity studies were identified for nifursol or DNSH.
Conclusions
No neurotoxicity studies were identified for furazolidone, AOZ, furaltadone or AMOZ.
Nitrofurantoin caused peripheral nerve damage in rats treated orally (20 to 100 mg/kg b.w. per day)
and i.p. (100 or 200 mg/kg b.w. per day). The CONTAM Panel concluded that these studies cannot
serve as a basis for identifying a NOAEL for neurotoxic effects of nitrofurantoin.
No neurotoxicity studies were identified for AHD or nitrofurazone.
SEM caused less locomotor activity, decreased curiosity and increased grooming when juvenile rats
were treated orally with 40 or 75 mg/kg b.w. per day for 10 days. SEM injections in the brains of mice
caused convulsions and behavioural changes, such as increased running fits, at a dose of 0.2 mg/kg
b.w. The CONTAM Panel concluded that these studies cannot serve as a basis for identifying a
NOAEL for neurotoxic effects of SEM.
No neurotoxicity studies were identified for nifursol or DNSH.
8.2.6. Genotoxicity
Genotoxicity of furazolidone has been extensively tested in a variety of studies. Positive findings
were recorded in bacterial reverse mutation assays with S. Typhimurium TA100, TA98, TA98NR and
TA98/1,8-DNP6 and E. coli strains WP2, WP2s and TC3960, with and without metabolic activation.
In E. coli PQ97 and S. Typhimurium TA1535/pSK1002, furazolidone induced SOS response. It was
positive in the sex-linked recessive lethal test in Drosophila melanogaster, and it induced gene
mutations in mammalian cells in vitro. Positive results were obtained in most of the in vitro
chromosome aberration assays, sister chromatid exchange (SCE) assays and micronucleus assays. In a
human lymphoblastoid cell line (TK6) (Borroto et al., 2005) and in human hepatoma HepG2 cells (Jin
et al., 2011), furazolidone induced DNA strand breaks. In the latter study, it was shown that
furazolidone also induced an increase in ROS and formation of 8-hydroxydeoxyguanosine adducts
indicating involvement of oxidative stress (Jin et al., 2011). In the in vivo bone marrow SCE assay in
mice, furazolidone gave a positive result at doses ≥ 30 mg/kg b.w. (Madrigal-Bujaidar et al., 1997). Of

Nitrofurans in food
EFSA Journal 2015;13(6):4140 85
the two in vivo mouse micronucleus tests with furazolidone, one was negative while another gave
equivocal results. Details and references for these studies are shown in Appendix H, Table H.1.
The metabolite of furazolidone, AOZ, was tested in the reverse mutation assay with S. Typhimurium
strains TA98, TA100, TA1535 and TA1537, and E. coli WP2uvrA. It was positive in TA1535, TA100
and WP2 in the presence of metabolic activation, while in the absence of metabolic activation it was
positive in TA1535 only (NOTOX, 1994f; Hoogenboom et al., 2002) (Appendix H, Table H.2). In
stimulated human lymphocytes, it induced a dose-dependent increase in chromosomal aberrations in
the absence of metabolic activation (NOTOX, 1994d; Hoogenboom et al., 2002). The in vivo
micronucleus assay with AOZ was performed on Swiss mice using single i.p. administration and
sampling after 24 and 48 hours using five animals per dose and sampling time (NOTOX, 1994h).
Owing to the higher susceptibility of males than females to the toxicity of AOZ, males were
administered 32–500 mg/kg b.w. AOZ and females were administered 270–1 500 mg/kg b.w. A
statistically significant increase of micronucleated polychromosome erythrocytes (PCEs) was detected
at only 48 hours of sampling in the males of the highest dose group. Large differences in toxicity and
mortality, as well as in the frequency of micronucleated PCEs, were observed, indicating a possible
non-genotoxic mechanism of action.
Only a few genotoxicity studies of furaltadone and its metabolite AMOZ were available to the
CONTAM Panel. In a bacterial reverse mutation assay with S. Typhimurium TA100 without
metabolic activation, furaltadone was already positive at the lowest tested concentration of
10 ng/plate, whereas the N-oxide metabolite was negative at doses up to 1 000 ng/plate (Hoogenboom
et al., 1994). In the mouse lymphoma assay, furaltadone (concentration range: 10–1 000 µg/mL)
induced a 4- to 18-fold increase in the mutant frequency at the thymidine kinase (TK) locus in the
absence of metabolic activation, and a five- to six-fold increase in the presence of metabolic activation
(RRC NOTOX, 1991a). However, there are no data on its clastogenic activity. In the bacterial reverse
mutation assay with S. Typhimurium TA1538, TA98, TA1535 and TA100 and E. coli WP2uvrA,
AMOZ was negative in the presence and in the absence of metabolic activation (NOTOX, 1994e).
AMOZ was not clastogenic in the in vitro chromosomal aberration assay with and without metabolic
activation (NOTOX, 1994c).
In bacterial genotoxicity and mutagenicity tests, nitrofurantoin induced DNA single strand breaks in
nitroreductase-rich, but not nitroreductase-deficient, E. coli strains. Induction of reverse mutations was
detected in E. coli strains WP2 and WP2uvrA and S. Typhimurium TA100, TA98 and TA97, but not
in TA1535, TA1536 or TA1538. In yeast (Saccharomyces cerevisiae), it induced mitotic gene
conversions in D4-RDII and D7 strains, but not in the D4 strain and non-disjunction. In a diploid
Aspergillus nidulans, nitrofurantoin induced mitotic crossing-over. In Chinese hamster cells,
nitrofurantoin induced resistance to 6-thioguanine only in the presence of metabolic activation.
Nitrofurantoin induced DNA strand breaks in human foreskin fibroblasts and in a human
lymphoblastoid cell line (TK6) in vitro and increased the frequency of SCE and chromosomal
aberrations in isolated human lymphocytes in vitro. In vitro, nitrofurantoin did not induce unscheduled
DNA synthesis (UDS) in human fibroblasts or rat hepatocytes. Details and references for these studies
are shown in Appendix H, Table H.3.
In D. melanogaster, the result of the sex-linked recessive lethal test was negative, but positive results
were observed in the wing spot test (Appendix H, Table H.3).
In vivo, nitrofurantoin was negative in the mouse spot test and in the dominant lethal test in mice
(Appendix H, Table H.3). It also did not induce chromosomal aberrations in male germ cells or
dominant lethal effects in mice, whereas it induced DNA strand breaks in different organs in rats and
mice and SCEs in bone marrow cells of mice (Appendix H, Table H.3).
In an in vivo micronucleus study, nitrofurantoin was administered (5, 10 or 50 mg/kg b.w.) to young
(3-week-old) and adult (8-week-old) BALB/C mice with a single i.p. injection. The blood samples for
the micronucleus analysis were collected 48, 96, 168 and 336 hours after the administration. A

Nitrofurans in food
EFSA Journal 2015;13(6):4140 86
significant increase in micronuclei frequency was observed at all doses of nitrofurantoin, with higher
levels in young animals than in adult animals. The peak level was observed after 48 hours and then
gradually declined. In adult animals, the micronuclei frequency declined to the background level,
whereas in young animals it remained elevated (Fucić et al., 2005). The study indicates that young
animals are more sensitive to the genotoxic effects of nitrofurantoin than adult mice and that the
response in young mice persists for a significantly longer time.
In vivo mutagenicity testing of nitrofurantoin was performed with Big Blue transgenic mice
(Quillardet et al., 2006). The male Big BlueTM
C57BL/6[LIZ] mice received 167 mg/kg b.w. per day
by gavage for 5 consecutive days. The animals were sacrificed 20 days after the last administration.
The frequencies of mutants in the cII gene from the shuttle vector were determined in lung, kidney,
bladder, caecum, colon, intestine, kidney, spleen and stomach. A weak mutagenic response was
observed in all organs; the highest was in kidney of nitrofurantoin-treated mice.
Kijima et al. (2015) investigated in vivo mutgenicity of nitrofurantoin, its constituent compound
5-nitro-2-furaldehyde and its metabolite AHD in F344 gpt delta male rats. The animals were exposed
to the tested compounds by gavage at a carcinogenic or the maximum tolerated dose and sacrificed at
4 or 13 weeks. An increase in gpt mutant frequency was observed in nitrofurantoin and 5-nitro-2-
furaldehyde treated groups, but not in the AHD-treated group. A significant increase of the
8-hydroxydeoxyguanosine level in kidney DNA was observed after 4 weeks in nitrofurantoin treated
rats, but not in 5-nitro-2-furaldehyde or AHD treated rats. In the nitrofurantoin group and to a lesser
extent also in the 5-nitro-2-furaldehyde treated group, the accumulation of hyaline droplets in the
proximal tubules that stained positive for 2u-globulin were observed. It is known that the
accumulation of 2u-globulin causes the proximal tubular cell injury that leads subsequently to
compensatory cell proliferation (Borghoff et al., 2001), which may be a mechanism of non-genotoxic
carcinogenicity of 2u-globulin inducing compounds. A sencond expriment with nitrofurantoin was
performed using female gpt delta rats, in which the effects of 2u-globulin were not involved. The
administration of nitrofurantoin at the same dose used for males caused significant elevations of both
gpt mutation frequency and 8-hydroxydeoxyguanosine levels to the same extent as in males indicating
that 2u-globulin -mediated nephropathy due to nitrofurantoin treatment did not affect susceptibility
to nitrofurantoin-induced genotoxicity.
Nitrofurantoin-induced genotoxic effects have also been studied in human patients treated with
nitrofurantoin. Sardas et al. (1990) found no increase in SCE frequency in the blood of 15 adult
patients with urinary tract infection that were treated daily with oral doses of 10 or 400 mg
nitrofurantoin for 10 days. Slapsyte et al. (2002) determined the frequencies of chromosomal
aberrations and SCE in children that were under long-term prophylactic treatment with nitrofurantoin.
A total of 69 0.2- to 13-year-old children treated with nitrofurantoin at a dose of 5–8 mg/kg b.w. per
day for the first 7 days and 1–2 mg/kg b.w. per day for the rest of the treatment period were included
in the study. Blood sampling was performed before the therapy and after 1, 3, 6 and 12 months.
However, for only 13 patients were blood samples available before the treatment and after 1–
12 months. All patients had also undergone X-ray examination (urethrocystography) prior to the
treatment. The only effect was a higher frequency of chromosomal aberrations due to X-ray
examination. A significant increase in SCE frequency was observed in the group of children from
whom blood samples were available both before and after the treatment only, and a significant
correlation was observed between cumulative dose of nitrofurantoin and SCE frequency in the
lymphocytes of children treated for 1 month. A similar effect was also observed in the group of
children after 12 months of the treatment; however, the correlation was not significant, probably
owing to the small sample size.
The results of the the in vivo mutgenicity study in F344 gpt delta male rats showed that AHD was not
mutagenic (Kijima et al., 2015). No other genotoxicity studies were identified for AHD.
Nitrofurazone induced differential toxicity in E. coli, but not in S. Typhimurium. It induced mutations
in E. coli WP2 and WP2uvrA strains and in S. Typhimurium TA98, TA100 and TA1535 strains in the
Nitrofurans in food
EFSA Journal 2015;13(6):4140 87
presence and absence of metabolic activation, while it was negative in S. Typhimurium strains
TA1536, TA1537 and TA1538. Nitrofurazone induced mutations in Neurospora crassa, but not in A.
nidulans, while in D. melanogaster it did not induce sex-linked recessive lethal mutations. In Chinese
hamster ovary (CHO) cells, it induced HGPRT mutations and chromosomal aberrations in the
presence and absence of metabolic activation. In human, hamster and mouse cells, nitrofurazone
induced DNA strand breaks. It did not induce UDS in human cells. Contradictory results were
obtained on the induction of chromosomal aberrations in mammalian cells. In vivo, nitrofurazone did
not induce chromosomal aberrations in rats, micronuclei in mice or rats or sperm abnormalities in
mice. Details and references for these studies are shown in Appendix H, Table H.4.
Various genotoxicity studies focused on the nitrofurazone marker metabolite SEM (see also Appendix
H, Table H.5). In the S. Typhimurium reversion test with and without metabolic activation (S9 from
Aroclor-induced rat liver and from Aroclor-induced mouse liver and lung), SEM showed weak
mutagenic activity in strain TA1535 only. The mutagenic response was partially and totally depressed
in the presence of liver and lung S9, respectively. With strains TA1537, TA1538, TA98 and TA100,
negative results were obtained, either with or without S9 (De Flora, 1981; De Flora et al., 1984).
Negative results were obtained in a study using a modified test protocol with S. Typhimurium strains
G46, C3076, D3052, TA1535, TA1537, TA1538, TA98 and TA100 and the E. coli strains WP2 and
WP2uvrA, with and without metabolic activation by Aroclor-induced rat liver S9 (no experimental
details given) (McMahon et al., 1979). SEM hydrochloride tested with S. Typhimurium strains
TA1535, TA1537, TA98, TA100 and TA102 at doses ranging from 50 to 5 000 µg/plate with and
without exogenous metabolic activation showed a weak mutagenic response only for the strain
TA1535 at the highest tested concentration and only in the absence of S9 (Herbold, 2003).
SEM has been tested more recently in a series of genotoxicity tests including bacterial reverse
mutation assays with S. Typhimurium strains TA1535, TA1537, TA98 and TA100 and E. coli
WP2uvrA for tk locus mutations with mouse lymphoma cells (L5178Y) and for chromosomal
aberrations with CHO cells (TNO, 2004a, b, c). In the bacterial mutagenicity testing (concentration
range: 62–5 000 µg/plate), strain TA1535 showed a dose-dependent increase of revertant colonies. In
the absence of metabolic activation, a 16-fold increase in the number of revertants compared with the
control was observed, while in the presence of metabolic activation the increase was only two-fold.
Borderline mutagenicity was also observed in strain TA100, but only without metabolic activation
(TNO, 2004a). No mutagenicity was observed in the other bacterial strains (EFSA, 2005). In the in
vitro forward mutation assay at the tk locus with L5178Y cells, SEM (tested at concentrations ranging
from 0.21 to 10.0 mM) was positive in the absence of metabolic activation, while in the presence of
metabolic activation only a borderline increase in mutant colonies was observed at the highest dose
(TNO, 2004b). In the chromosomal aberration assay with CHO cells exposed to SEM for different
periods of time (4, 18 and 32 hours), and with sampling after 18 or 32 hours, the compound did not
significantly increase the number of aberrant cells, neither with nor without metabolic activation
(TNO, 2004c). However, with metabolic activation, an increase in endoreduplicated cells was
observed at the early sampling time (18 hours), indicating alterations in the cell cycle control rather
than genotoxicity. In a study with Chinese hamster V79 cells, SEM hydrochloride was tested at
concentrations ranging from 125 to 1 120 µg/mL. It was cytotoxic at concentrations above 800 µg/mL
after 4 hours’ exposure and at concentrations above 125 µg/mL after 18 hours’ exposure. With
metabolic activation, no cytotoxicity was observed. Chromosomal aberrations were determined at
concentrations of 250–1 120 µg/mL with and without metabolic activation after 4 hours’ exposure and
at concentrations of 125–500 µg/mL in the presence of metabolic activation. No significant increase in
the number of aberrant metaphases was observed (Herbold, 2004). Recently, Vlastos et al. (2010)
investigated the genotoxicity of SEM in vitro with human lymphocytes. SEM was tested at
concentrations of 0.5–20 µg/mL and revealed a slight increase in SCE frequency only at the highest
concentration. No increase in micronuclei frequency was found in vitro with human lymphocytes
tested at concentrations of 0.5–20 µg/mL.
The in vivo micronucleus study with two strains of mice (male BALB/C and CBA) that received a
single i.p. dose of SEM (40, 80 or 120 mg/kg b.w.), followed by blood analyses with the sensitive flow

Nitrofurans in food
EFSA Journal 2015;13(6):4140 88
cytometry determination of micronuclei frequency 42 hours after administration, revealed negative
results in both strains (Abramsson-Zetterberg and Svensson, 2005). In an in vivo study, SEM did not
induce DNA damage (UDS) in liver of female mice that received a single oral dose (100 or
200 mg/kg) with sampling times 4 and 16 hours after the administration (CTL, 2004). However, in a
recent in vivo study with male Wistar rats exposed to SEM (single oral dose of 50, 100 or 150 mg/kg
b.w.) and sacrificed after 24 hours, the analysis of bone marrow polychromatic erythrocytes revealed a
significant increase of slightly more than two-fold in micronuclei frequency at all doses, but with no
dose–response pattern (Vlastos et al., 2010). It should be noted that these doses are relatively high and
similar. The discrepancy between the in vivo genotoxicity studies in mice (Abramsson-Zetterberg and
Svensson, 2005; CTL, 2004) and the rat study (Vlastos et al., 2010) might be the result of the
differences in responses between species and remains to be clarified.
No data on the genotoxicity of nifursol were identified in the open literature. Therefore, EFSA
requested access to the original study reports submitted to SCAN for the risk assessment of nifursol in
2001 and 2003 (see Documentation provided to EFSA). In the bacterial reverse mutations assay with
S. Typhimurium strains TA1535, TA1537, TA1538, TA98 and TA100, nifursol was clearly positive in
the TA100 strain with and without metabolic activation and in the TA98 strain without metabolic
activation. In Chinese ovary cells, nifursol induced a consistent but insignificant increase in
chromosomal aberrations without metabolic activation at the maximal soluble concentrations, whereas
in the isolated rat hepatocytes it did not induce UDS. The results of in vivo chromosomal aberration
and micronucleus assays in bone marrow were negative. An in vivo UDS assay in liver was negative,
whereas in intestinal tissue it was positive at higher concentrations. Irritation of the tissue was
observed at these concentrations and therefore it is not clear whether the increased incorporation of
tritiated thymidine is the consequence of UDS or irritation-induced scheduled DNA synthesis. In the
in vivo transgenic mutation assay with Muta-Mouse, no increase in the frequency of the lacZ vector
was detected in the ileum/jejunum. Other tissues were not analysed. Details and references for these
studies are shown in Appendix H, Table H.6.
No genotoxicity studies were identified for DNSH.
Conclusions
Table 8 summarises the results from the available genotoxicity studies for the nitrofurans and their
marker metabolites considered in this opinion.
Furazolidone has been shown to induce mutations in bacteria and insects. In mammalian cells in
vitro, it caused chromosomal aberrations, SCE and DNA strand breaks. In vivo micronucleus studies
gave negative or equivocal results, while in vivo it induced an increase in SCE frequency. The
CONTAM Panel concluded that these data provide sufficient evidence to show that furazolidone is
genotoxic in vitro. Based on the limited in vivo data, furazolidone may possibly be genotoxic in vivo.
The limited data on the genotoxicity of AOZ indicate that it is genotoxic in vitro and possibly also in
vivo.
The genotoxicity studies of furaltadone indicate that it is a strong bacterial mutagen and induces
mutations in mammalian cells, but no study is available on its clastogenicity. The CONTAM Panel
concluded that it is mutagenic in vitro.
The genotoxicity data on AMOZ indicate that it is not genotoxic in vitro.
Nitrofurantoin induced DNA damage and mutations in different bacterial test systems, as well as in
insects. In mammalian cells in vitro, it induced mutations, DNA damage and chromosomal
aberrations. In vivo, nitrofurantoin has been shown to induce DNA damage in multiple organs,
micronuclei formation in mice and gene mutations in a transgenic mouse mutation assay. The study in
children under long-term prophylactic treatment with nitrofurantoin gave an indication of the possible

Nitrofurans in food
EFSA Journal 2015;13(6):4140 89
induction of SCE in lymphocytes. Based on these data, the CONTAM Panel concludes that
nitrofurantoin is genotoxic in vitro and in vivo.
The only available mutagenicity study for AHD was a negative study with F344 gpt delta rats. Based
on these limited data, it is not possible to draw a conclusion about the genotoxicity of AHD.
Nitrofurazone was genotoxic and mutagenic in bacteria and fungi. In mammalian cells in vitro, it
induced DNA damage, SCE, chromosomal aberrations and mutations, although negative results were
also obtained in some studies. In the in vivo genotoxicity tests in rodents, nitrofurazone was not
genotoxic. Based on these data, the CONTAM Panel concludes that there is sufficient evidence to
consider nitrofurazone as genotoxic in vitro. Owing to the lack of in vivo mutagenicity tests, no
conclusion on the in vivo genotoxicity can be drawn.
The data on in vitro genotoxicity indicate that SEM is mutagenic in bacteria and mammalian cells.
Earlier studies showed that SEM is not clastogenic in vitro or in vivo. Based on these data, the AFC
Panel (EFSA, 2005) concluded that the weak genotoxicity exerted by SEM in vitro is not expressed in
vivo. The study by Vlastos et al. (2010), which was performed after the EFSA evaluation of SEM,
showed the in vivo clastogenic potential of SEM. However, owing to the lack of a dose–response
relationship, the result cannot be considered as clearly positive and remains to be clarified. Based on
the available information, the CONTAM Panel concludes that there is sufficient evidence to conclude
that SEM is genotoxic in vitro, but that no conclusion on genotoxicity in vivo can be drawn.
The data on in vitro genotoxicity indicate that nifursol is mutagenic in bacteria, and the chromosomal
aberration tests in mammalian cells are equivocal. The in vivo clastogenicity studies gave clear
negative results, as did the in vivo mutation assay with transgenic mice. Based on these data, the
CONTAM Panel concludes that nifursol is mutagenic in vitro but not genotoxic in vivo.
No genotoxicity studies were identified for DNSH.

Nitrofurans in food
EFSA Journal 2015;13(6):4140 90
Table 8: Summary of genotoxicity testing results in bacteria and in in vitro and in vivo mammalian test systems
Compound Bacteria Mammalian cells in vitro Rodents in vivo
Evaluation(c)
Mut DSB SCE UDS CA MN Mut DSB UDS SCE CA MN Mut
(b)
Furazolidone P P P N P P P –(a)
– P – N/E – Genotoxic in vitro and possibly also in
vivo
AOZ P – – – – P – – – – – P(d)
– Genotoxic in vitro and possibly also in
vivo
Furaltadone P – – – – – P – – – – – – Mutagenic in vitro
AMOZ N – – – N – – – – – – – – Non genotoxic in vitro
Nitrofurantoin P P P N P/N – P P – P – P/N P Genotoxic in vivo
AHD – – – – – – – – – – – – N Not mutagenic in vivo but no other
genotoxicity data available
Nitrofurazone P P P – P/N – P – – N N N – Genotoxic in vitro
SEM P – (P) – N N P – N – – (P)/N – Genotoxic in vitro
Nifursol P – – N E – – – N/P – N N N Mutagenic in vitro but not genotoxic in
vivo
DNSH – – – – – – – – – – – – – –
CA: chromosomal aberrations; DSB: DNA strand breaks; E: equivocal; MN: micronucleus; Mut: mutations; N: negative result; P: positive result; (P): weak effect; SCE: sister chromatid
exchange; UDS: unscheduled DNA synthesis.
(a): Not tested.
(b): Studies with transgenic rodents.
(c): The results were evaluated in accordance with the EFSA opinion on the strategies for genotoxicity testing (EFSA SC, 2011).
(d): Possible non-genotoxic mechanism of action.

Nitrofurans in food
EFSA Journal 2015;13(6):4140 91
8.2.7. Chronic toxicity and carcinogenicity
The CONTAM Panel identified four carcinogenicity studies on furazolidone that had been submitted
by industry to JECFA for the evaluation of furazolidone (FAO/WHO, 1993a). With the exception of
the study with Fischer 344 rats (see below), the original documents were made available by the data
owner. For the study with Fischer 344 rats, the CONTAM Panel used the JECFA summary
(FAO/WHO, 1993a). In one study that had been submitted by industry to JECFA for the evaluation of
nitrofurazone (FAO/WHO, 1993b), furazolidone was also applied. This study (Siedler and Sierfoss,
1966; see below) was made available to EFSA by the data owner. No carcinogenicity studies on
furazolidone were identified in the public literature.
Groups of Swiss MBR/ICR mice (50/sex/group) were fed diets containing 0, 75, 150 or 300 mg/kg
furazolidone (purity not given), equal to a reported average daily dose of about 0, 12, 24 or 47 mg/kg
b.w. per day, respectively, for 13 months. After the treatment period, the animals were kept on control
diets for an additional 10 months. No substance-related effects were observed on feed consumption
and body weight. Mortality had increased in mid- and high-dose females at the end of the treatment
period of 13 months (8 out of 50 (hereafter in this section ‘8/50’), 4/50, 12/49 and 12/49 for control,
low-, mid- and high-dose groups, respectively). At the end of the study (month 23), mortality had
increased in mid- and high-dose females (33/50, 35/50, 46/49 and 48/49 for control, low-, mid- and
high-dose groups, respectively) and in high-dose males (34/50, 34/50, 36/50 and 48/51 for control,
low-, mid- and high-dose groups, respectively). The incidence of bronchial adenocarcinomas
significantly increased in both sexes (incidences in the control, low-, mid- and high-doses groups were
13/49, 19/48, 26/50 and 37/51 for males, and 15/50, 18/50, 20/47 and 30/48 for females, respectively).
The incidence of lymphosarcomas significantly increased in mid- and high-dose males (1/49, 7/48,
10/50 and 10/50 for the control, low-, mid- and high-dose groups, respectively) (Halliday et al., 1974).
Groups of 35 female Holtzman rats were fed diets containing 0 or 0.1 % furazolidone (purity not
given), corresponding to reported average doses of 0 or 57 mg/kg b.w. per day, respectively, for
45 weeks, followed by a control diet for 8 weeks. At termination (week 53), survival was significantly
reduced by the treatment: 19/35 mice survived in the treatment group, whereas 33/35 survived in the
control group. In the treatment group, the incidence of animals with mammary adenomas was 21/35,
whereas it was 2/35 in the controls, and the incidence of adenocarcinomas was 5/35 in the treatment
group compared with none in the controls (Siedler and Searfoss, 1966).
Groups of Fischer 344 rats (50/sex/group) were fed diets containing 0, 250, 500 or 1 000 mg/kg
furazolidone (purity not given) for 20 months (corresponding to 0, 12.5, 25 or 50 mg/kg b.w. per day,
respectively). The surviving rats were maintained on control diets for at least 4 months or until 90 %
of the rats had died. Extensive histopathological examinations were performed on all moribund and
sacrificed rats. In the mid-dose (males) and high-dose (males and females) groups, the mortality rate
increased after 24 months, with 90 % mortality in the highest dose group. At the end of the treatment
period, body weight gain had significantly decreased at mid- and high-dose animals (no numerical
data reported by JECFA) (FAO/WHO, 1993a). In the high-dose group, the number of erythrocytes
significantly decreased in males and females. Haemoglobin levels and haematocrit decreased in mid-
and high-dose females. The incidence of testicular atrophy increased in mid- and high-dose males and
the incidence of adrenal cortical hyperplasia increased in high-dose males only. Particularly in the
mid- and high-dose groups, increased incidences of dermal fibromas, sebaceous adenomas and thyroid
adenomas were observed in both sexes, and increased incidences of basal cell epitheliomas in males
were also observed. In 2/50 males of the high-dose group, basal cell carcinomas were found. In female
rats, an increased incidence of mammary neoplasms (benign and malignant combined) was observed
at all dose levels, but without a dose–response relationship (11/49, 29/50, 40/50 and 30/50 for control,
low-, mid- and high-dose groups, respectively). Mammary adenocarcinomas were found in only high-
dose females (6/50) (King et al., 1972b; Halliday et al., 1973b).
Groups of Sprague–Dawley rats (35/sex/group) were fed diets containing furazolidone for 2 years. The
actual average dose over the 2 years was reported as 0, 0.7, 3.4 or 10.4 mg/kg b.w. per day for males
Nitrofurans in food
EFSA Journal 2015;13(6):4140 92
and 0, 0.8, 4.3 or 14 mg/kg b.w. per day for females. At the end of the study, survival had decreased in
female rats, particularly in the high-dose group (26/35, 22/35, 23/35 and 15/35 for control, low-, mid-
and high-dose groups, respectively). At termination of the study (day 726), a clear dose-related
reduction in red blood cell parameters (red blood cell count, haematocrit and haemoglobin) was
observed in mid- and high-dose female rats. A similar but smaller effect was seen at earlier sampling
times. In males and females of the high-dose group, a significantly increased incidence of adrenal
cortical hyperplasia was observed. In females, an increase in thyroid atrophy was observed in
1/33 animals of the mid-dose group and 8/35 animals of the high-dose group, but not in the control
and low-dose group. In females, an increased incidence of malignant mammary tumours was observed
(unspecified malignant mammary tumours: 1/34, 3/35, 4/33 and 4/35; adenocarcinomas: 1/34, 2/35,
2/35 and 3/35; carcinosarcomas: 0/34, 1/35, 2/33 and 1/35; for the control, low-, mid- and high-dose
groups, respectively). In addition, the incidence of mammary fibroadenomas increased in treated
animals, but without a clear dose–response relationship. The authors reported that the time of onset of
mammary neoplasms was approximately 2 months earlier in the mid- and high-dose females than in
the other groups (King et al., 1972a; Halliday et al., 1973a).
Sprague–Dawley rats (50/sex) were fed diets containing 0, 250, 500 or 1 000 mg/kg furazolidone
(purity not given) for 18 months (corresponding to 0, 12.5, 25 or 50 mg/kg b.w. per day, respectively,
when applying a default factor of 0.05 (EFSA SC, 2012)). After the treatment period, the animals were
maintained on a control diet. A dose-related increase in mortality was found in both sexes: 4/50,
11/50, 17/50 and 30/50 for males and 9/50, 12/50, 8/50 and 29/50 for females, for control, low-, mid-
and high-dose groups, respectively. High-dose animals were sacrificed at day 666, whereas controls
were sacrificed at day 895. Body weight gain significantly decreased in mid- and high-dose males and
in high-dose females. These effects were accompanied by reduced feed consumption in these dose
groups. A reduction in the number of red blood cells was seen in female rats, particularly in the mid-
and high-dose groups. Histopathological examination showed an increased incidence of hepatic
necrosis in all treated rats, but particularly in high-dose females: incidences were 1/50, 3/49, 2/50 and
5/49 for males and 1/49, 3/50, 3/50 and 12/50 for females of the control, low-, mid- and high-dose
groups, respectively. Female rats in all treated groups showed a dose-related increase in the incidence
of adrenal cortical hyperplasia (16/49, 26/50, 27/50 and 31/50 for control, low-, mid- and high-dose
groups, respectively). In male rats of the mid- and high-dose groups, an increased incidence of
testicular atrophy was found (10/50, 10/49, 33/50 and 49/49 for control, low-, mid- and high-dose
groups, respectively). The incidence of mammary neoplasms (unspecified) increased in all treated
females, but without a dose–response relationship (29/49, 41/50, 45/50 and 40/50 for control, low-,
mid- and high-dose groups, respectively). The combined incidence of mammary adenocarcinoma and
carcinosarcomas in female rats was 1/49, 1/50, 3/50 and 8/50 for control, low-, mid- and high-dose
groups, respectively. In male rats, the incidence of dermal fibroma increased in all treatment groups,
but without a dose–response relationship. Sebaceous gland adenoma (6/49) and adenocarcinomas
(1/49) were found in only high-dose males. In males of the mid- and high-dose groups, the incidence
of neural astrocytomas increased (2/50 and 5/49, respectively), whereas none of these tumours was
found in the control or low-dose group (King et al., 1972b; Halliday et al., 1973b).
No chronic toxicity studies were identified for AOZ.
For furaltadone, only one carcinogenicity study was identified in the scientific literature available in
the public domain. In another study that had been submitted by industry to JECFA for the evaluation
of nitrofurazone (FAO/WHO, 1993b), furaltadone was also applied. This study (Siedler and Sierfoss,
1966; see below) was made available to EFSA by the data owner.
Furaltadone hydrochloride (‘pure’) was administered to a group of 36 weanling female Sprague–
Dawley rats, weighing 40–72 g, in the diet at a concentration of 1 g/kg diet for a period of 46 weeks.
The animals were maintained on a control diet for an additional period of 20 weeks. A group of
26 untreated females served as the control group. Using the reported information on cumulative dose,
duration of administration, the growth of the animals and a conversion for the molecular weight of
furaltadone hydrochloride to furaltadone, the average furaltadone dose was estimated by the

Nitrofurans in food
EFSA Journal 2015;13(6):4140 93
CONTAM Panel to be 54 mg/kg b.w. per day. A significant increase (p < 0.001) in the incidence of
mammary adenocarcinomas (25/32 versus 0/25 in the control) was observed. Based on this
observation, the authors concluded that furaltadone was strongly carcinogenic (Cohen et al., 1973).
Groups of 35 female Holtzman rats were fed diets containing 0 or 0.15 % furaltadone (purity not
given), corresponding to reported average doses of 0 or 85 mg/kg b.w. per day, respectively, for
45 weeks, followed by control diet for 8 weeks. At termination (week 53), survival was reduced;
25/35 versus 33/35 in the control group. In treated animals, the incidence of mammary adenomas was
22/35 versus 2/35 in the controls, and the incidence of adenocarcinomas was 3/35 compared with none
in the controls (Siedler and Searfoss, 1966).
No chronic toxicity studies were identified for AMOZ.
For nitrofurantoin, several carcinogenicity studies were identified in the scientific literature available
in the public domain.
Nitrofurantoin (purity and crystalline form not specified) was administered to groups of 52–53 male
and 54 female BDF1 mice at 0, 750 or 3 000 mg/kg of diet. These dietary concentrations correspond to
doses of 0, 112.5 or 450 mg/kg b.w. per day, respectively, using the default factor of 0.15 as
recommended by the EFSA SC (2012) for a 2-year mice study. At the end of the experiment, survival
in males and females combined was 50.5, 42.5 and 46.2 in control, low-dose and high-dose groups,
respectively. In males, a reduced incidence of hepatic adenomas was observed; 6/53 in controls,
1/52 in low-dose mice and 0/52 in high-dose mice. No increase in the incidence of tumours at any site
was observed (Ito et al., 1983).
Groups of 50 male and 50 female Swiss (Crl:CDR_1(ICR)BR) mice, about 50 days of age, received
nitrofurantoin (pharmaceutical grade macrocrystals) in the diet for 22 months at concentrations
equivalent to an average dose of 0, 50, 100 or 200 mg/kg b.w. per day (0, 44, 84 or 181 mg/kg b.w. per
day for males and 0, 59, 116 or 224 mg/kg b.w. per day for females, respectively). Increased mortality
was observed in high-dose males. Kidney effects such as tubular dilatation and hyperplasia were found
in males and females of the mid- and high-dose groups. In males, the incidence of malignant
lymphomas at all sites were 2/50 (controls), 6/50 (low dose), 4/49 (mid dose) and 10/50 (high dose),
reaching significance at the high dose (p = 0.012) only. However, the authors suggested that the
increase in this ‘common neoplasm’ was not related to treatment (Butler et al., 1990b).
Groups of 50 male and 50 female B6C3F1 mice, 8 to 9 weeks of age, were fed nitrofurantoin
(pharmaceutical grade microcrystalline powder) for 103 weeks at 0, 1 300 or 2 500 mg/kg diet.
Calculated average doses were reported to be 0, 277 or 577 mg/kg b.w. per day for females and 0, 295
or 567 for males, respectively. Mortality at termination of the experiment was reduced in females;
survival rates were 19/50, 37/50 and 37/50 in control, low-dose and high-dose groups, respectively. In
females, ovarian atrophy was seen in treated mice (48/50 in low-dose and 49/50 in high-dose animals),
compared with no such effect in the controls. In high-dose mice, kidney effects (mineralisation of the
renal medulla in females, and dilatation of renal tubules in males) were observed. High-dose males
showed testicular degeneration. In female mice, an increased incidence of malignant lymphomas was
observed: 12/50, 19/50 and 24/50 in control, low-dose and high-dose animals, respectively. Because of
unusually low survival of female mice in the control group (animals started to die in week
65 compared with in about week 85 for both dose groups; mortality at the end of the study was 60 %
for the control group versus about 25 % for treated females), NTP calculated adjusted rates for these
malignant lymphomas: 50.2 % (control), 43.4 % (low dose) and 52.7 % (high dose). These results
indicate that there is no treatment-related increase in malignant lymphomas in female mice. In high-
dose male mice, survival was only slightly higher (about 10 %) than that in the control and low-dose
groups, and no increase in any type of malignant tumours was observed (NTP, 1989).
In a study on ovarian atrophy, three groups of female B6C3F1 mice (n = 20), 5 to 6 weeks of age,
were administered nitrofurantoin (pharmaceutical grade) in the diet at concentrations corresponding to

Nitrofurans in food
EFSA Journal 2015;13(6):4140 94
doses of 0, 350 or 500 mg/kg b.w. per day, respectively, for 64 weeks. At termination, survival was
20 in controls, 19 in low-dose and 18 in high-dose animals. At the end of the study, ovarian atrophy
was found in only treated animals: 0/20 in control, 18/19 in low-dose and 18/18 in high-dose animals.
There was no increase in the incidence of neoplasms of the reproductive system (ovaries, uterus,
vagina), which were the only tissues examined (Stitzel et al., 1989).
A group of 10 pregnant ICR/Jcl mice received three s.c. injections of nitrofurantoin (purity
unspecified) at 75 mg/kg b.w. suspended in a 1 % gelatine solution on days 13, 15 and 17 of gestation.
Groups of 22 gelatine-treated dams and 76 untreated dams served as controls. Offspring were foster-
nursed by untreated dams and were sacrificed 32 weeks after birth. Gross pathological lesions were
examined for tumours. The incidence of papillary adenomas of the lung increased in the offspring of
nitrofurantoin-treated dams (10/78 (12.8 %), p < 0.002) compared with gelatine-treated controls
(5/203 (2.5 %)) and untreated controls (29/478 (5.3 %)) (Nomura et al., 1984).
A group of 36 weanling female Sprague–Dawley rats, weighing 40–72 g, was administered
nitrofurantoin (‘pure’) at 1 870 mg/kg diet for 16 weeks. Because of impaired growth and premature
mortality, the dose was reduced to 100 mg/kg diet for week 16–75. From week 75 to 80, the animals
were kept on a control diet. Using the reported information on the cumulative dose, duration of
administration and growth of the animals, the average dose on a body weight basis was estimated to be
187 mg/kg b.w. per day for the first 16 weeks and about 7 mg/kg b.w. per day for the second period.
The experiment was terminated at week 80. A group of 30 untreated rats served as controls. No
increase in tumour incidence was observed (Cohen et al., 1973).
Two groups of weanling, germ-free female Sprague–Dawley rats (11 control and 12 treated rats),
weighing 85–100 g, were fed nitrofurantoin (extracted from pharmaceutical grade, macrocrystalline
nitrofurantoin) at 0 or 1 880 mg/kg of diet for 104 weeks. Using the default factor of 0.05 as
recommended by the EFSA SC (2012) for a 2-year rat study, this dietary concentration corresponds to
a dose of 94 mg/kg b.w. per day. The growth rate in treated rats was slightly retarded compared with
controls. The median survival time was 96 weeks for controls and 90 weeks for treated animals. The
incidences of mammary fibroadenomas were 2/11 in controls and 9/12 in rats treated with
nitrofurantoin (p < 0.01, Fisher’s exact test). No increase in the incidence of tumours at other sites was
observed (Wang et al., 1984).
Groups of Fischer 344 rats (50/sex/group) were administered nitrofurantoin (pharmaceutical grade
microcrystalline powder) in the diet containing 0, 600 or 1 300 mg/kg (females) and 0, 1 300 or
2 500 mg/kg (males) for 103 weeks. Calculated average doses were reported to be 0, 28 or 62 mg/kg
b.w. per day for females and 0, 59 or 111 mg/kg b.w. per day for males, respectively. Survival at
termination of the experiment did not differ between control and treated animals. Chronic tubular
nephropathy was observed in all treated rats, but the authors judged the severity to be greater in dosed
males. The incidence of microscopic renal tubular adenomas was 3/50 in controls, 11/50 in low-dose
males and 19/50 in high-dose males. In high-dose male rats, testis degeneration and atypical cells of
the epididymis were observed. Renal tubular carcinomas were seen in two high-dose males.
Osteosarcomas were seen in one low-dose male and two high-dose males. Reductions in the
incidences of preputial gland adenomas and carcinomas, and interstitial cell adenomas of the testes
were observed in males. No change in tumour incidence was observed in female rats (NTP, 1989).
Butler et al. (1990a) administered groups of 60 male and female Sprague–Dawley rats nitrofurantoin
(pharmaceutical grade macrocrystals) in the diet for 24 months at concentrations equivalent to an
average dose of 0, 24, 48 or 96 mg/kg b.w. per day. Body weight gain was reduced in high-dose
females and mortality increased in high-dose males. In high-dose males, an increased incidence of
testicular degeneration and epididymal fibrosis was observed. In the same paper (Butler et al., 1990a),
a separate oncogenicity study was reported, in which groups of 50 male and female Sprague–Dawley
rats received nitrofurantoin in the diet for 24 months at concentrations equivalent to 0, 12, 24 or
48 mg/kg b.w. per day. No effects on mortality were found and no increased incidence in neoplasms at
any site was observed.

Nitrofurans in food
EFSA Journal 2015;13(6):4140 95
No chronic toxicity studies were identified for AHD.
Several carcinogenicity studies on nitrofurazone were identified in the scientific literature available
in the public domain. In addition, the CONTAM Panel identified two carcinogenicity studies on
nitrofurazone (Siedler and Searfoss, 1966, 1976) that had been submitted by industry to JECFA for the
evaluation of nitrofurazone (FAO/WHO, 1993b). The original documents were made available to the
CONTAM Panel by the data owner.
Nitrofurazone (99 % pure) was administered in the diet to groups of 50 male and 50 female B6C3F1
mice at concentrations of 0, 150 or 310 mg nitrofurazone/kg, equal to 0, 14 or 29 mg/kg b.w. per day,
respectively, for 2 years. At the end of the experiment, survival was reduced, particularly in male
mice: 31/50 and 27/50 for the low- and high-dose groups, respectively, compared with 39/50 for
controls. In female mice, there was an increased incidence of ovarian atrophy: 7/47 in controls,
44/50 in the low-dose group and 38/50 in the high-dose group. The incidence of ovarian granulosa cell
tumours increased: 4/50 and 9/50 in low- and high-dose females, compared with 1/47 in control
animals. In addition, the incidence of benign mixed tumours of the ovary increased: 17/50 in the low-
dose group and 20/50 in the high-dose group, compared with 0/47 in the controls. In male mice, there
were no increased incidences of any tumour type (NTP, 1988; Kari et al., 1989).
In a study on transplacental carcinogenesis reported by Nomura et al. (1984), a group of 20 pregnant
ICR/Jcl mice received three s.c. injections of nitrofurazone (purity not specified) at 75 mg/kg b.w.
suspended in 1 % gelatine solution on days 13, 15 and 17 of gestation. The offspring were foster-
nursed by untreated dams. Gross pathological lesions were examined for tumours. In contrast to
nitrofurantoin (see above), no increase in lung tumours (papillary adenomas) was observed when the
offspring were examined after 32 weeks. In the same study, new-born mice (n = 17) received one s.c.
injection of 75 mg nitrofurazone/kg b.w. 12 hours after birth and three further injections on days 7, 14
and 21. After 32 weeks, the incidence of papillary adenomas of the lung had increased: 19.7 % in the
treated animals compared with 2.5 % in the controls.
Groups of 35 female Holtzman rats were fed diets containing 0, 0.05 or 0.1 % nitrofurazone (purity
not given), corresponding to reported average doses of 0, 28 or 55 mg/kg b.w. per day, respectively,
for 45 weeks, followed by a control diet for 8 weeks. At termination (week 53), survival was reduced
in the high-dose group (23/35) compared with both the control and the low-dose group (both 33/35),
and the incidence of animals with benign mammary tumours (adenomas or adenofibromas) increased:
10/35 in the low-dose group and 12/35 in the high-dose group, versus 2/35 in the controls (Siedler and
Searfoss, 1966).
Male and female CFE rats (20/group/sex) were fed diets containing nitrofurazone corresponding to a
daily intake of 55 mg/kg b.w. per day for females and 50 mg/kg b.w. per day for males for 45 weeks.
At the end of this period, the animals were maintained on a control diet for a further 7 weeks. There
was no increased incidence of any tumour type in male rats. In females, a significant increase in the
incidence of benign mammary tumours was noted at week 52 (12/20) compared with untreated
controls (0/20) (Siedler and Searfoss, 1967).
In two experiments, nitrofurazone (purity about 97 %) was administered in the diet at a concentration
of 0.1 %, corresponding to 150 mg/kg b.w. per day, to a group of 20 female Holtzman rats for
36 weeks (experiment 1) and 30 female rats for 44.5 weeks (experiment 2). Animals were killed 15–
19 weeks after dosing was completed. At termination, the incidence of mammary fibroadenomas in
rats fed nitrofurazone-containing diets increased (11/18 in experiment 1 and 24/24 in experiment 2)
compared with the controls, for which there was none (Morris et al., 1969).
A group of 30 female weanling Sprague–Dawley rats were administered ‘pure’ nitrofurazone at
100 mg/kg diet for 46 weeks (average daily intake was 8–13 mg/rat). After the dosing period, the
animals were maintained on a control diet for 20 weeks. A control group of 30 rats received a control

Nitrofurans in food
EFSA Journal 2015;13(6):4140 96
diet for 66 weeks. The incidence of mammary fibroadenomas in treated females that lived 22 weeks or
more was 22/29, compared with 2/29 in the control group (Ertürk et al., 1970).
Groups of 50 male and 50 female Fischer 344/N rats, 6 to 7 weeks of age, were administered
nitrofurazone (99 % pure) at 0, 310 or 620 mg/kg diet for 103 weeks. The average amount of
nitrofurazone consumed was 11–12 mg/kg b.w. per day for low-dose and 24–26 mg/kg b.w. per day
for high-dose animals. Surviving animals were killed at week 111. At the end of the experiment,
survival was reduced in high-dose males (20/50) compared with the control (33/50) and low-dose
group (30/50). In male rats, increased incidences of testicular degeneration, characterised by atrophy
of the germinal epithelium and aspermatogenesis, were observed (12/50, 49/50 and 47/50 for control,
low-dose and high-dose groups, respectively). Adenomas of the sebaceous glands were observed in
high-dose males only (4/50). The incidence of mammary fibroadenomas increased without a dose–
response relationship in treated females: 8/49 (control), 36/50 (low dose) and 36/50 (high dose). In one
control and two high-dose females, adenocarcinomas were observed. In males, the incidence of
testicular interstitial cell tumours decreased with dose (45/50 in controls, 30/50 in low-dose group and
28/50 in high-dose group), whereas the incidence of carcinoma of the preputial gland increased with
dose (1/50 in controls, 8/50 in low-dose group and 5/50 in high-dose group), but without a dose–
response relationship. However, the combined incidence of preputial gland adenomas and carcinomas
was not statistically different from the controls. The authors stated that this combined incidence is the
most appropriate value to be used in the evaluation of these neoplasms because the adenomas and
carcinomas are derived from the same cell type, they form a morphological continuum and distinction
between both types of tumours is difficult to make (NTP, 1988; Kari et al., 1989).
In a study by Mori et al. (1960) evaluating the induction of pulmonary tumours, female mice (group
size not given) were fed a diet containing 0.1 % SEM hydrochloride for 7 months (equivalent to
approximately 150 mg/kg b.w. per day). At termination of the study, six of the eight survivors (75 %)
had developed lung tumours (not specified), compared with 1 of the 20 (5 %) control animals.
In a limited study, Toth et al. (1975) tested the effect of SEM on the development of lung and blood
vessel tumours in Swiss mice. SEM dissolved in drinking water at a concentration of 0.0625 % was
given to 50 male and 50 female mice for their lifetime. Groups of 100 male and 100 female mice
served as controls. Using a conversion factor of 0.09 for a chronic drinking water study (EFSA SC,
2012), this corresponds to a dose of 56 mg/kg b.w. per day. The incidence of lung tumours (adenomas
and adenocarcinomas) increased in treated males (30 % compared with 23 % in the controls) and
females (50 % compared with 21 % in the controls). Of these tumours, 20 % were reported to be
adenocarcinomas. The incidence of blood vessel tumours increased in female mice (18 % compared
with 5 % in the controls), but not in males.
Groups of male and female Charles River CD rats (26 per sex) were administered a diet containing 0,
500 or 1 000 mg SEM hydrochloride for an intended period of 104 weeks (Weisburger et al., 1981).
Using a default factor of 0.05, as recommended by the EFSA SC (2012) for a 2-year rat study, the
dietary concentrations correspond to a dose of 0, 25 or 50 mg SEM hydrochloride/kg b.w. per day,
respectively. Mortality in the high dose was so large that treatment was discontinued at week 32 and
the animals were maintained on a control diet. For the low dose, the treatment was stopped at week 78.
Signs of gross toxicity such as protrusion of the sternum, bowing of the legs and stiffness of the joints
were observed. Upon histological examination, osteoporosis was seen in the long bones. No numerical
details for effects in the different dose groups were reported. There was no indication of tumour
induction.
To study the chronic toxicity of SEM hydrochloride, Takahashi et al. (2014) fed groups of Wistar
Hannover GALAS rats a diet containing 0, 10, 50 or 250 mg/kg SEM hydrochloride (purity 99.3 %)
for 52 weeks. The dietary concentrations corresponded to reported average doses of 0, 0.6, 3.5 or
16.7 mg/kg b.w. per day for males and 0, 0.8, 4.5 or 21.8 mg/kg b.w. per day for females, respectively.
In addition, four groups of Wistar Hannover GALAS rats (50/sex/group) were fed a similar diet for
104 weeks, corresponding to reported average doses of 0, 0.6, 3.2 or 14.8 mg/kg b.w. per day for

Nitrofurans in food
EFSA Journal 2015;13(6):4140 97
males and 0, 0.8, 3.8 or 19.4 mg/kg b.w. per day for females, respectively, to investigate the
carcinogenicity of SEM hydrochloride. No effect on survival was found in the 1-year study, but
mortality increased in mid- and high-dose males (8/50, 9/50, 17/50 and 15/50 for control, low-, mid-
and high-dose groups, respectively) and in mid- and high-dose females (7/50, 10/50, 17/50 and 13/50
for control, low-, mid- and high-dose groups, respectively). In the 1-year study, haematological
parameters and organ weights were not affected by treatment, but chlorine and glucose levels in serum
significantly increased in high-dose males and females. Upon histopathological examination, effects
on bones (disarrangement of chondrocytes) and joints (degeneration of articular cartilage) were found
in mid- and high-dose males and females, and males appeared to be more sensitive than females. In
mid- and high-dose males, the incidence of disarrangement of chondrocytes accompanied with an
increase in connective tissue in the tibia and sternum was 5/10 and 10/10 and in vertebrae was 2/10
and 8/10, respectively. These effects were not observed in the controls or low-dose animals. In
addition, the observed degeneration of the articular cartilage of the knee joints found in both males and
females was more prominent in males (2/10 and 10/10 for mid- and high-dose groups, respectively,
versus 0/10 in both the controls and low-dose group). These effects on bones were also found in the
2-year study at comparable incidences. In this study, no effect on the incidence of any type of tumour,
including lung tumours, was observed for male and female rats. Based on the effects on bones, a
NOAEL of 0.6 mg/kg b.w. per day can be derived.
The CONTAM Panel identified two carcinogenicity studies for nifursol that had been submitted to
SCAN for its evaluation as a feed additive (SCAN, 2001, 2003). The original documents were made
available by the data owner. No carcinogenicity studies on nifursol were identified in the public
literature.
Groups of Simonsen Long–Evans rats (40 per sex) were fed nifursol at dietary concentrations of 0,
400, 600, 800 or 1 000 mg/kg for 2 years and 3 months (Rude, 1970c). Using the default factor of 0.05
as recommended by the EFSA SC (2012) for a 2-year rat study, these dietary concentrations
correspond to 0, 20, 30, 40 or 50 mg/kg b.w. per day, respectively. The study was terminated when
mortality reached 30 %: 117 weeks for males and 118 weeks for females. Survival at the end of the
study was reduced in males of the two highest dose groups (70 and 75 % versus 92.5 % in the
controls). No statistically significant differences in body weight gain or food intake were reported
between controls and treated groups, and no treatment-related effects were seen following
haematological or urine analysis. However, no clinical chemistry parameters were measured in this
study. No increase in organ weights was observed, but liver weights showed a statistically significant
decrease in a dose-related manner at 30 mg/kg b.w. per day and higher in males. No dose-related
effect on liver weight was found in females. Histopathological examination did not reveal any
treatment-related effect. Some common benign neoplasms, such as interstitial cell adenoma in males,
mammary fibroadenomas in females and subcutaneous fibroma in both males and females, were
found, but differences did not show a dose–response relationship and were not statistically significant.
Dawe (1988), presenting a separate statistical analysis of the neoplastic changes observed in this study,
confirmed a positive trend for renal tubular adenoma in male rats (0/25, 1/20, 1/20, 1/25 and 3/25 for
control, 20, 30, 40 and 50 mg/kg b.w. per day, respectively), but concluded that the difference between
the control and the high-dose group was not significant (Fisher exact probability test, p > 0.1). The
incidence of mammary adenocarcinoma in female rats was not increased. Therefore, the authors
concluded that nifursol had no carcinogenic effect when given to rats in their feed for a period of
2 years and 3 months. The CONTAM Panel concluded that the study design was too limited to derive
a NOAEL for non-neoplastic effects.
Five groups of four male and four female Beagle dogs were fed diets containing 0, 400, 600, 800 or
1 000 mg/kg nifursol for 2 years. Using the default factor of 0.25 for a chronic dog study, these dietary
concentrations correspond to 0, 10, 15, 25 or 50 mg/kg b.w. per day, respectively. Tissue from animals
with gross pathology and liver tissues from all dogs were examined microscopically. Liver effects
such as mononuclear cell infiltration, dark pigmented Kupffer cells and periportal infiltration were
found in males in a dose-related manner at 15 mg/kg b.w. per day and higher. Similar effects were
seen in all female dogs (including controls), but without a dose–response relationship. Abnormalities

Nitrofurans in food
EFSA Journal 2015;13(6):4140 98
of the gall-bladder (e.g. dilatation and amorphous material in the lumen) were found in high-dose
males and in females of the two highest dose groups. The authors stated that the liver lesions were
difficult to evaluate owing to infection with heart worm (Dirofilaria immitis) in a number of the dogs.
No neoplasms were observed in this study.
No chronic toxicity studies were identified for DNSH.
Conclusions
Furazolidone induced malignant tumours in mice and rats. These included mammary tumours in rats,
bronchial adenocarcinomas in male and female mice and neural astrocytomas in male rats. Based on
the increased incidence of these malignant tumours, the CONTAM Panel concluded that furazolidone
is carcinogenic. JECFA (FAO/WHO, 1993a) concluded that furazolidone is a genotoxic carcinogen.
Although the AOZ side-chain, which may be released from the parent compound and from bound
residues, may play a role in tumour formation, no experimental information is available on AOZ.
Furaltadone induced malignant mammary tumours in female rats. No studies in mice were identified.
Although the CONTAM Panel noted the limitations of the two available studies (small number of
animals, only female rats tested, only one dose level and short dosing period of 46 weeks), it
concluded that furaltadone is carcinogenic to rats. In addition, IARC (1987) concluded that there was
sufficient evidence for its carcinogenicity in experimental animals and classified furaltadone in Group
2B (possibly carcinogenic to humans).
No chronic toxicity studies were identified for AMOZ.
Nitrofurantoin was tested for its carcinogenicity in several studies in mice and rats and was found to
induce predominantly an increase in benign tumours (e.g. ovarian tubular adenomas, mammary
fibroadenomas). In one mice study, an increase in malignant lymphomas in males was observed, but
the authors concluded that the increase of this common tumour in mice was not treatment related.
Adjusted rates for the incidence of malignant lymphomas in male B6C3F1 mice as reported in the
NTP study (NTP, 1989) did not show any difference between control and treated mice. In male rats, a
few malignant tumours were found (renal tubular carcinomas in two high-dose males and
osteosarcomas in one low-dose male and two high-dose males). Based on these observations, the
CONTAM Panel concluded that there is limited evidence that nitrofurantoin is carcinogenic in rats.
IARC (1990a) concluded that two of the four studies in mice, including the transplacental study, were
inadequate for the evaluation. In one study, the incidence of ovarian tubular adenomas and benign
mixed tumours increased in female mice, and in another study there was an increase in malignant
lymphomas in male mice. In one rat study, an increase in mammary fibroadenomas was observed.
IARC (1990a) concluded that there was limited evidence for the carcinogenicity of nitrofurantoin in
experimental animals, and classified it in Group 3 (not classifiable as regards its carcinogenicity in
humans).
No chronic toxicity studies were identified for AHD.
Nitrofurazone increased the incidence primarily of benign tumours in mice and rats following oral
administration. In mice, an increase in the incidence of granulosa cell tumours and benign mixed
tumours of the ovary was observed and, in rats, an increase in mammary fibroadenomas was observed.
In male rats, a non-dose-related increase in carcinomas of the preputial gland was observed, but the
combined incidence of preputial gland adenomas and carcinomas, which was considered to be the
most appropriate parameter for this type of tumour, was not affected. The CONTAM Panel concluded
that there is no evidence for the carcinogenicity of nitrofurazone in mice, and that there is equivocal
evidence for its carcinogenicity in rats. Non-neoplastic effects were observed at the lowest dose
(14 mg/kg b.w. per day) tested in mice (reduced survival in males and ovarian atrophy) and the lowest
dose (11–12 mg/kg b.w. per day) tested in rats (testis degeneration), precluding the derivation of a
NOAEL. JECFA (FAO/WHO, 1993b) concluded that the data suggest that nitrofurazone is a
Nitrofurans in food
EFSA Journal 2015;13(6):4140 99
secondary carcinogen, and that effects on steroidogenesis may be involved in the process of tumour
formation. IARC concluded that there is limited evidence for the carcinogenicity of nitrofurazone in
experimental animals and inadequate evidence for its carcinogenicity in humans. In its overall
evaluation, IARC placed nitrofurazone in Group 3 (not classifiable as regards its carcinogenicity in
humans) (IARC, 1990b).
SEM was reported to increase the incidence of lung tumours in two limited studies in mice. In one
study, the lung tumours were not specified; in the other study, an increase in malignant lung tumours
is indicated, particularly in female animals. In the two available rat studies, including a recent and
well-conducted study, no increase in tumour incidence was found. Recognising the shortcomings of
most of these studies, the CONTAM Panel concluded that there is limited evidence that SEM is
carcinogenic in mice, but not in rats. In addition, IARC (1987) evaluated SEM and concluded that
there was inadequate evidence for carcinogenicity of SEM in humans and inadequate or limited
evidence (lung tumours in mice) in experimental animals, and classified it as Group 3 (not classifiable
as regards its carcinogenicity in humans). The AFC Panel (EFSA, 2005) noted that SEM had been
shown to be carcinogenic in mice but not in rats and concluded that SEM is a weak non-genotoxic
carcinogen for which a threshold mechanism can be assumed. Based on the effects on bones observed
in male rats, a NOAEL of 0.6 mg/kg per day can be derived.
Based on the available information on nifursol, the CONTAM Panel concluded that there is no clear
indication of carcinogenic activity of nifursol. Because the available information was too limited, the
CONTAM Panel was not able to derive a NOAEL for nifursol.
No chronic toxicity studies were identified for DNSH.
8.3. Modes of action
Nitrofurans have been used as antibacterial agents and to some extent still are. They are rapidly
metabolised. The reduction of the nitro-group, the primary biotransformation route, initially results in
the formation of a radical nitroanion. The oxidation of this radical by oxygen back to the parent
compound results in the formation of superoxide and other radical oxygen species. This may lead to
oxidative stress and may be responsible for some of the adverse effects observed at higher levels of the
drugs, including some of the adverse effects in genotoxicity tests. Furazolidone (Jin et al., 2011), but
also AOZ and AMOZ (Zolla et al., 2005) and SEM (Hirakawa et al., 2003) caused DNA damage and
DNA fragmentation in in vitro systems by the production of ROS, which could be ameliorated by
addition of catalase or superoxide dismutase. These oxygen radicals can be detoxified by GSH
resulting in the formation of the oxidised form, GSSG, and potentially increased synthesis and even
depletion of GSH levels in the cell (Hoogenboom et al., 1992b). Antioxidants such as vitamin E and
selenium may also protect against damage (Boyd et al., 1979; Peterson et al., 1982), whereas
polyunsaturated fatty acids, for example, may exaggerate the effects (Boyd et al., 1979).
Further reduction of the nitro-group is thought to lead to a number of other highly reactive metabolites
such as the hydroxylamine and acrylonitrile derivatives. In vitro studies revealed that the latter can
bind to compounds containing thiol groups such as GSH or mercaptoethanol, forming a rather unstable
adduct (Vroomen et al., 1987b, 1990). Incubation of the GSH adduct with proteins results in a switch
of the nitrofuran adduct to the protein. Incubation of that protein with GSH results in the reversed
reaction. This process is called a retro-Michael reaction. However, it is unclear to what extent the
binding of the acrylonitrile derivative to proteins is responsible for the protein adducts observed both
in vitro and in vivo, i.e. the adducts initially detected in vivo and in vitro by the use of radiolabelled
drugs (Vroomen et al., 1986, 1987c; Hoogenboom et al., 1991c). Incubation of such adducts in pig
liver or pig hepatocytes with mercaptoethanol did not result in the exchange of the nitrofuran part. It
might be that the acrylonitrile derivative can also bind to other non-thiol amino acids, thereby forming
more stable adducts.

Nitrofurans in food
EFSA Journal 2015;13(6):4140 100
The formation of protein adducts may be involved in certain adverse effects of nitrofurans such as the
irreversible inhibition of the pyruvate dehydrogenase complex, which is responsible for the conversion
of pyruvate into acetyl-CoA, which is essential in the case of nerve cells (Paul et al., 1952, 1953,
1956). In pig hepatocytes, this resulted in the accumulation of lactate in the culture medium, an effect
from which the cells only slowly recovered (Hoogenboom et al., 1991a). In human patients treated
with furazolidone, increased levels of pyruvate and lactate were observed in plasma (Paul and Paul,
1964). This inhibition is likely to be the cause of the polyneuritis observed in patients treated with the
drugs. It is unclear if other enzymes are affected by the formation of adducts, although reduced
activity of GSH reductase has also been reported (Murakami et al., 1989).
The reactive intermediates of nitrofurans may also be able to form DNA adducts and are most likely
responsible for mutagenic effects observed in bacterial tests at rather low levels (see Section 8.2.6). A
similar mechanism may cause the genotoxic effects observed in mammalian cells, although oxidative
stress may also play a role. Hiraku et al. (2004) reported that nitrofurazone could be metabolised by
CYP to produce short-lived nitro-radicals and cause formation of 8-oxodG DNA adducts in isolated
calf thymus DNA, as well as in exposed human promyelocytic leukaemia cells HL-60. Recently Jin et
al. (2011), in an in vitro study with metabolically active human hepatoma cells (HepG2), showed that
exposure to furazolidone induced increased formation of intracellular ROS and formation of
8-hydroxydeoxyguanosine, associated with damage to nuclear and mitochondrial DNA and cell cycle
arrest. In vivo in F344 gpt delta rats nitrofurantoin at carcinogenic dose induced an increase in
mutation frequency and eleveated elevels of 8-oxodG DNA adducts in the kidney (Kijima et al. 2015).
The predominant mutations were G-base substitutions and considering that 8- oxodG causes G:C-T:A
transversion mutations (Cheng et al., 1992), oxidative DNA damage including 8- oxodG formation
might contribute to guanine base substitution mutations observed in the gpt gene following
nitrofurantoin exposure. In rats and mice, most nitrofurans have been shown to be carcinogenic (see
Section 8.2.7). As a result, a number of these drugs are classified as genotoxic carcinogens.
The nitrofurans discussed in this opinion consist of a nitrofuran ring connected to a side-chain via an
azomethine (C=N) bond. Under acid conditions, this bond is rather labile and this can result in the
release of the free side-chain. Using the weakness of the azomethine bond at low pH, a method was
developed for the detection of protein adducts (bound residues) based on the release of the side-chain
from the proteins, subsequent derivatisation with NBA and detection by LC-UV and later LC-MS
(Hoogenboom et al., 1991c). Using this method, it was confirmed that these protein-bound residues
should be regarded as drug-like adducts and are not the result of incorporation of small radiolabelled
fragments of the parent compound into amino acids and proteins. Although levels decrease over time,
these adducts can be detected in treated animals for many months (see Section 8.1). As shown by Liu
et al. (2010a), this gradual degradation of bound residues allows the detection of the AOZ side-chain
in urine for many weeks.
The free side-chains all contain an H2N-N part and are as such hydrazines, which in general are
suspected carcinogens. Release of these side-chains may occur in the stomach and they may be
regarded as metabolites. However, detection of the free side-chains requires a special analytical
procedure and has rarely been studied. Free AOZ was detected in the blood of pigs treated with AOZ,
but also with furazolidone, the latter confirming that the release and absorption of free side-chains in
the stomach is feasible (Hoogenboom et al., 2002). This study indicated that a substantial part, but not
all, of the furazolidone was hydrolysed to AOZ. Furthermore, AOZ levels in plasma decreased only
slowly and were similar in the hepatic portal vein and mesenteric artery, indicating slow degradation
and excretion. It was also shown that free AOZ could be detected in the blood of rats fed with meat
from furazolidone-treated pigs. This implied that consumers could be exposed to free AOZ, requiring
more information on its properties.
Early studies hypothesised that AOZ, released in the stomach, actually plays an important role in the
neurotoxic effects of furazolidone (Palm et al., 1967; Stern et al., 1967). In particular, the inhibition of
MAO, an enzyme involved in detoxification of amines such as tryptamine, could play a role. Initially
it was hypothesised that ring cleavage of AOZ would result in the formation of HEH and that HEH

Nitrofurans in food
EFSA Journal 2015;13(6):4140 101
was responsible for the inhibition. In vitro studies revealed that both AOZ and HEH could irreversibly
inhibit MAO activity (Hoogenboom et al., 1991b), but there is no proof for the conversion of AOZ
into HEH. In this study, nitrofurans were found to be able to inhibit MAO in cultured pig hepatocytes
but in a more reversible way.
Incubation of pig hepatocytes with AOZ resulted in the formation of protein-bound metabolites,
initially detected by the use of a radiolabelled compound (Hoogenboom et al., 2002). This formation
could be inhibited by both dimethyl sulphoxide and 4-chlorobenzenesulphonamide (a known inhibitor
of amidohydrolases), a strong indication that AOZ is metabolised into a reactive metabolite. Both
compounds also reduced the MAO inhibition by AOZ in pig hepatocytes, suggesting that the binding
of this reactive metabolite is also responsible for this effect. Remarkably, AOZ could be released from
these protein adducts under acid conditions and detected after derivatisation with NBA. This could
explain the observation that AOZ can be released from tissues of rats fed with meat containing bound
residues of furazolidone (McCracken et al., 1997). Furthermore, it was shown that AOZ is a
mutagenic compound in bacteria and causes genotoxic effects in mammalian cells (Hoogenboom et
al., 2002), potentially because of the formation of DNA adducts. As AOZ is likely to also be a
metabolite of furazolidone in rats and mice, it cannot be excluded that it plays an important role in the
carcinogenic effects observed with the drug.
An important question is to what extent other nitrofurans differ from furazolidone, owing to the
presence of different side-chains. It is clear from both in vitro and in vivo studies that furaltadone,
nitrofurantoin, nitrofurazone and nifursol are also able to form protein adducts from which the side-
chain can be released under acid conditions (see Sections 8.1.4 and 8.1.5). However, only for
furazolidone was it shown that the side-chain was actually released from the parent compound or the
protein-bound residues and can as such be considered as a metabolite. For the other compounds, no
studies were found that investigated this.
The limited studies in rats show a similar potency for furaltadone for inducing mammary
adenocarcinomas as for furazolidone (see Section 8.2.7). Furaltadone was also positive in
mutagenicity tests with bacteria and mammalian cells (see Section 8.2.6). However, contrary to the
finding for AOZ, AMOZ tested negative in the Salmonella/microsome test (NOTOX, 1994e) and was
also not clastogenic in the in vitro chromosomal aberration assay with peripheral human lymphocytes
both with and without metabolic activation (NOTOX, 1994c). When tested on pig hepatocytes, AMOZ
showed an inhibition of MAO activity, but at much higher concentrations than AOZ (Hoogenboom et
al., 1994).
Nitrofurazone showed induction of benign tumours in animals but apparently no malignant tumours.
There is limited evidence for the induction of lung tumours in mice by SEM, an effect not observed
with nitrofurazone, although an increased incidence of papillary adenomas was reported (see Section
8.2.7). SEM showed clear mutagenic effects in bacteria and is genotoxic in some but not all tests with
mammalian cells (see Section 8.2.6). Furthermore, SEM caused increased formation of micronuclei in
the bone marrow of treated rats (Vlastos et al., 2010), although a clear dose–response curve was
lacking.
The CONTAM Panel noted that the observed effects in rats and mice also point to other mechanisms
that are not genotoxic but may, for example, lead to the formation of mammary tumours, such as a
disturbance of hormonal balance. For nitrofurazone, for example, the long-term treatment resulted in
an increased incidence of ovarian atrophy, benign mixed ovary tumours and ovarian granulosa cell
tumours in female mice, and increased incidence of benign mammary tumours in rats. In male rats, an
increased incidence of testicular degeneration was observed. In the case of furazolidone, an increased
incidence of mammary adenomas was observed, in addition to the carcinomas. Treatment of male rats
also resulted in testicular atrophy. In some of these studies, an increased incidence of adrenal cortical
hyperplasia was also described, possibly resulting in a hormonal imbalance and causing some of the
effects that seem to be related to this. Also in vitro studies provided information on an endocrine
mediated mode of action. Maranghi et al. (2010) found that SEM showed weak anti-estrogenic effects
Nitrofurans in food
EFSA Journal 2015;13(6):4140 102
since it inhibited a number of estrogen receptor mediated activities such as the activation of hERα in
transfected yeast cells, proliferation of MCF7 cells, and induction of ALP activity in an endometrial
cell-line. Together with observations in juvenile rats (see Section 8.2.2) these findings brought the
authors to the conclusion that SEM could act as an endocrine disruptor, possibly by intereference with
estradiol (E2) signalling. However an opposite effect was found for nitrofurazone, which stimulated
the proliferation of E2-dependent MCF-7 cells (Hiraku et al., 2004).
8.4. Observations in humans
8.4.1. Human pharmacological and toxicological data
In order to describe the human pharmacological and toxicological data, reviews and studies with a
large number of patients (n ≥ 50) were used, preferably those studies that provided an incidence of the
adverse reactions observed. Studies reporting single or few, incidental cases have not been described.
Altamirano and Bondani (1989) have reviewed the adverse reactions to furazolidone that were
reported in the literature between 1955 and 1989. The study included 10 443 patients treated with
furazolidone of which 46 % were children, ranging in age from a few months to 15 years, and 15 %
were adults. The ages of the remaining patients (39 %) were not specified. Adverse reactions to the
drug were experienced by 8.3 % of the patients. These reactions were grouped as follows:
gastrointestinal, neurological, systemic, dermatological and haematological reactions and adverse
reactions on vital organs such as the heart, lung, liver and kidney. The most common side effects of
furazolidone were gastrointestinal reactions: nausea and/or vomiting and abdominal pain. The overall
frequency of the gastrointestinal reactions was 8 %. These reactions were observed for therapeutic
doses of 5 to 7 mg/kg b.w. per day, although some patients received higher doses. Gastrointestinal
reactions diminished if the drug was given with food. The frequency of neurological reactions to
furazolidone was 1.3 %, among which the most common side effects were headache (0.72 %), vertigo
(0.30 %) and giddiness (0.23 %). The frequency of systemic reactions was 0.56 % and fever was the
most commonly observed side effect (0.34 %). Adverse dermatological reactions were observed in
0.54 % of the patients and skin eruptions were most common (0.38 %). Haematological side effects
were found in 0.36 % of the reports and most of the adverse reactions were transient. In four reports
(0.04 %), furazolidone was associated with haemolytic anaemia observed in patients deficient in
G6PD. The incidence of adverse reactions on vital organs such as the heart, lung, liver and kidney
were 0.11, 0.11, 0.06 and 0.06 %, respectively. Other adverse reactions have been reported, of which
two are related to concomitant use of other substances. Patients who consume alcohol while taking
furazolidone can develop disulfiram-like reactions. These symptoms disappeared within 24 hours after
ingestion of alcohol ceased. If furazolidone is used at a dose larger than that recommended or for
longer than 5 days, patients should be informed about the possibility of adverse reactions, such as a
hypertensive crisis, caused by MAO-inhibitor drugs and foods containing tyramine. In the reports
reviewed (n = 10 443), no deaths have been associated with adverse reactions to furazolidone. The
authors concluded that most of the adverse reactions reported were mild and in only rare cases was
discontinuation of the treatment necessary.
Rogers et al. (1956) reviewed laboratory and clinical data related to the use of furazolidone in animals
and humans. The clinical use of furazolidone for the treatment of trichomonal vaginitis and the
occurrence of adverse reactions in four study groups was reported. Furazolidone was administered in
vaginal suppositories containing 0.25 % furazolidone and/or a water-soluble insufflation powder
containing 0.1 % furazolidone for oral intake. Side effects of the treatments in the four study groups
were briefly reported. Only one woman (n = 124) had to discontinue treatment because of local
irritation. In the other patients, no systemic or local adverse drug reactions (sensitisation) were
observed.
Furazolidone is used for the treatment of stomach infections caused by Helicobacter pylori in some
developing countries in Asia and South America (see also Section 1.3.1). Zullo et al. (2012) reviewed
data regarding the eradication and safety of furazolidone therapies for H. pylori infections. A total of
Nitrofurans in food
EFSA Journal 2015;13(6):4140 103
31 studies met the inclusion criteria identified in the paper and reported data of patients enrolled from
1997 to 2011. Six different furazolidone-based drug combinations have been used (including
combinations with other antibiotics and bismuth salts). Furazolidone was administered twice daily at
two doses, 100 or 200 mg furazolidone per dose, for 7 or 14 days. The severity of the side effects was
graded as: (1) absent, (2) mild, (3) moderate (frequently interfering with daily activities), (4) marked
(impeding daily activity) and (5) severe (causing treatment interruption). Side effects (grade 2 to 5)
were reported by 805 (32.2 %) of 2 420 patients, who reported one or more symptoms. Severe side
effects (grade 5) were reported by 3.8 % of all patients. The incidence of the side effects and severe
side effects was significantly higher following the 200 mg bis in die (b.i.d., twice daily) regimen than
following the 100 mg b.i.d. treatment. Similarly, the incidence of side effects and severe side effects
was higher following the 14-day regimen than following the 7-day regimen. The six most reported
symptoms (out of a total of 1 337 reported) were nausea (15.3 %), dizziness (13.8 %), taste
disturbance (9.5 %), fatigue (9.3 %), anorexia (7.0 %) and abdominal pain (6.6 %). However, the exact
composition of the six different furazolidone-based drug combinations was not reported and it is not
clear how or if the side effects of the concomitant drugs could be ruled out.
Young (1961) described in a brief paper the side effects related to the i.v. administration of
furaltadone to 54 patients suffering from miscellaneous bacterial infections. Ages of patients ranged
between 6 and 71 years. Single daily doses ranged from 600 to 1 500 mg for 1 to 4 consecutive days.
Multiple daily doses ranged from 200 to 400 mg per dose and were injected between one and four
times per day for 1 to 7 consecutive days. The highest daily dose in the multiple dose regimen was
900 mg. Adverse reactions were observed in 5 out of 54 patients. Nausea was observed in two
patients. Each of the following side effects was observed in one patient: vomiting, chills and fever
after each dose, minor skin rash during therapy and urticaria during and after the last dose.
Böttiger and Westerholm (1977) have reviewed adverse drug reactions for a sulphonamide
combination (sulphamethizole + sulphamethoxypyridazine) versus nitrofurantoin reported to the
Swedish Adverse Drug Reactions Committee from 1966 to 1975. For the treatment of urinary tract
infections, nitrofurantoin was given orally: 50 mg per tablet four times daily. The number of patients
experiencing adverse reactions to nitrofurantoin during these 10 years was 781. Eight of these patients
died (1.0 %), three of them because of interstitial pneumonia. The following adverse drug reactions
were recorded: pulmonary reactions (46.4 %), fever (23.4 %), skin reactions (19.3 %), liver damage
(4.6 %), blood/bone marrow reactions (2.0 %), neuropathy (2.0 %) and miscellaneous reactions
(2.2 %). Remarkably, pulmonary reactions were extremely rare in the treated Swedish children. This
might be because the dose in children was adjusted by many Swedish physicians to 1 mg/kg b.w. per
day. The commonly used dose in adults, 50 mg four times a day, roughly corresponds to 3 mg/kg b.w.
per day. Strikingly, in this review, no gastrointestinal reactions were reported. In a follow-up study
from Holmberg et al. (1980), which reviewed reports of adverse reactions to nitrofurantoin received by
the Swedish Adverse Drug Reaction Committee from 1966 to 1976, it was mentioned that only a few
cases of gastrointestinal disturbances were reported.
Brumfitt and Hamilton-Miller (1998) reviewed the efficacy and safety profile of nitrofurantoin used
for long-term prophylaxis (1 year) to prevent recurrent urinary tract infections. Between 1975 and
1992, case records were collected from 219 female patients, ranging from 9 to 89 years of age. Three
dose regimens and two drug formulations were used: group A (43 patients) received 50 mg
microcrystalline nitrofurantoin twice a day, group B (110 patients) received 100 mg macrocrystalline
nitrofurantoin once daily and group C (66 patients) received 50 mg macrocrystalline nitrofurantoin.
Patients were advised to take the medication with a snack or with milk. Side effects were observed in
37 % of all patients. Nausea was the most common adverse reaction observed for both crystalline
forms. However, the incidence of nausea caused by the microcrystalline form (50 mg b.i.d.) was
higher (46.5 % of group A) than the incidence of nausea observed for the macrocrystalline form used
in two different dose regimens (13.6 % of group B and 12.1 % of group C). For all adverse reactions,
there was a clear trend, with the lowest incidence with 50 mg of the macrocrystalline form, the
intermediate incidence with 100 mg of the macrocrystalline form and the highest incidence with
50 mg twice daily of the microcrystalline form. The number of patients reporting adverse events

Nitrofurans in food
EFSA Journal 2015;13(6):4140 104
relating to the gastrointestinal tract, the genito-urinary tract, the skin or other reactions were 52, 13, 11
and 16, respectively. Older patients were not more likely to experience an adverse reaction than
younger ones (the difference observed was not significant). It should be noted that the effective daily
dose for prophylaxis is about one-quarter of that used therapeutically.
D’Arcy (1985) has analysed information retrieved from a database that was set up and maintained by
the major manufacturer of nitrofurantoin (at that time), Norwich Eaton Pharmaceuticals, Inc.,
Norwich, New York. This database contains reported side effects available from the literature, clinical
studies and reports from practitioners and regulatory authorities worldwide from 1953 to 1984. Dosage
regimens of nitrofurantoin treatments have not been given. The total number of patients worldwide
suffering from side effects registered in this database is 3 383. The author has calculated the incidence
of adverse reactions using 121 430 000 courses of therapy as the denominator. Consequently, the
overall incidence for all adverse reactions is 0.003 %. Therefore, this approach presents a very low
occurrence rate for the selected side effects. The author mentions that anorexia, nausea and vomiting
are the most common side effects of nitrofurantoin therapy, but these reactions are not further
discussed in this paper and, consequently, these side effects are not taken into account for the
calculation of the overall incidence. D’Arcy has calculated incidences for pulmonary, hepatic,
neurological and haematological reactions. Incidences were very low and, of the courses of therapy,
ranged from 0.001 % for pulmonary reactions to 0.0003 % for hepatic reactions. D’Arcy seperated
pulmonary reactions into four categories: acute, subacute, chronic and miscellaneous pulmonary
reactions. The overall fraction of patients, registered in the Norwich Eaton database, suffering from
pulmonary reactions was 0.51 (1 724 out of 3 383 patients). Pulmonary reactions constituting a high
proportion of the overall side effects was also observed in Swedish patients (Böttiger and Westerholm,
1977; Holmberg et al., 1980; Holmberg and Boman, 1981). Nitrofurantoin has been associated with
acute hepatocellular and cholestatic injury and is less common with chronic active hepatitis. A typical
neurological reaction observed during nitrofurantoin treatment was peripheral neuropathy. Referring
to Holmberg et al. (1980), 2 % of all cases reported to the Swedish Adverse Drug Reaction Committee
during 1966 to 1976 were attributed to polyneuropathy. A well-documented adverse reaction of
nitrofurantoin is haemolytic anaemia observed in patients with G6PD deficiency.
Gleckman et al. (1979) reviewed the literature on adverse reactions to nitrofurantoin and categorised
these side effects into gastrointestinal disturbances, skin eruptions, haematological disorders,
neurological defects, hepatotoxicity, pulmonary complications and miscellaneous abnormalities.
Incidences of the side effects were not mentioned. Anorexia, nausea and vomiting are the most
common side effects, followed by skin eruptions, consisting of macular, maculopapular or urticarial
lesions. These authors also mention the well-known adverse reaction haemolytic anaemia in patients
with G6PD deficiency. With respect to the neurological reactions, they focus on peripheral neuropathy
and mention that this side effect has also been observed for other nitrofurans such as nitrofurazone and
furaltadone. Although acute and chronic hepatotoxicity has been observed, these are rare events during
nitrofurantoin therapy. It is stated that nitrofurantoin-induced pulmonary reactions have been observed
in hundreds of patients, but an incidence is not given. The pulmonary reactions have been classified
arbitrarily into acute, subacute and chronic side effects.
Karpman and Kurzrock (2004) reviewed adverse reactions of nitrofurantoin versus those of
trimethoprim and sulphamethoxazole in children. In 2004, the authors could find only two articles that
specifically dealt with adverse reactions to nitrofurantoin in children (Coraggio et al., 1989; Uhari et
al., 1996 - see Section 8.4.2). From a few other publications addressing adverse reactions in adults and
children, incidences in children could be obtained. The general adverse reactions found in adults also
apply to children: gastrointestinal, cutaneous/allergic, pulmonary, hepatic, haematological and
neurological reactions. Karpman and Kurzrock quoted incidences and incidence rates for
gastrointestinal and allergic side effects, but it is not mentioned how these were calculated. The
incidence rate of nausea and vomiting was reported to be 4.4 cases per 100 person-years in children
younger than 16 years (Uhari et al., 1996). An incidence of 3.2 % was mentioned for allergic reactions
in children younger than 15 years. With respect to pulmonary reactions, the authors referred to a report
from the national monitoring centre for adverse drug reactions in Sweden (Holmberg and Boman,

Nitrofurans in food
EFSA Journal 2015;13(6):4140 105
1981). In a 10-year period, 447 cases of pulmonary reactions were reported and only three cases
(0.7 %) involved children. All were classified as mild acute reactions which subsided after the therapy
was stopped. An epidemiological study in Finland evaluated 921 children who received long-term
nitrofurantoin prophylaxis and found no adverse pulmonary reactions over a 10-year period (Uhari et
al., 1996). Incidences of hepatotoxicity were not given, but, although hepatic reactions are rare in
children, they can be fatal. Nitrofurantoin is contraindicated in the first few months of life because of
the inability of the immature liver to handle oxidative stress. This has been illustrated by a fatal
incident of haemolytic anaemia in a new-born child after maternal treatment with nitrofurantoin at the
end of pregnancy. Peripheral neuropathy is the most common neurological adverse reaction in children
and it has also been described in an evaluation of the reporting system of the US Food and Drug
Administration for adverse drug reactions (Coraggio et al., 1989).
Rascher and Neubert (2012) studied the efficacy and safety of the prophylaxis of recurrent urinary
tract infections in children in Germany, where long-term prophylaxis with nitrofurantoin is allowed to
start at the age of 3 months and may be continued for a maximum period of 6 months. The
prophylactic dose varies from 1 to 2 mg/kg b.w. per day. The use of nitrofurantoin in Germany from
1982 to 2009 led to 222 registered events. Six of these events (2.7 %) were observed in children aged
between 4 and 9 years. A causal connection with nitrofurantoin therapy could be established for two
events: lung fibrosis in a 9-year-old girl and hepatitis in an 8-year-old girl. No increase in adverse
reactions in children could be observed during this 27-year period.
Stricker et al. (1988) reviewed hepatic injuries associated with the use of nitrofurantoin and nifurtoinol
(hydroxymethyl-nitrofurantoin) that had been reported since 1963 to the Netherlands Centre for
Monitoring of Adverse Reactions to Drugs. In this period of 25 years, 50 cases were associated with
nitrofurantoin and, in 38 cases, a causal relationship was considered to be likely. Criteria for the
probability of this causality were given. In all cases, the daily dose ranged from 100 to 400 mg.
Clinical, biochemical and histopathological findings were reported. Acute hepatic injury was observed
in 25 cases, whereas 13 cases presented a chronic type of reaction. Based on the estimated sales
figures in the Netherlands (1977 to 1986), the authors estimated an incidence of symptomatic
nitrofurantoin-induced hepatic injury of approximately 0.020 to 0.035 %. The authors state that the
mechanism of nitrofurantoin-induced hepatic injury seemed to be immunoallergic. This suggestion
was also addressed by Björnsson et al. (2010) who investigated drug-induced autoimmune hepatitis
among patients of the Mayo Clinic in the USA. Over a period of 10 years (1997–2007), 1 536 patients
were diagnosed with autoimmune hepatitis (AIH) and, after applying new exclusion criteria, a total of
261 well-characterised AIH cases were identified. Out of these 261 patients, 11 cases (4.2 %) were
related to the use of nitrofurantoin. Besides various clinical and biochemical findings, 8 out of
11 nitrofurantoin patients had abnormalities on hepatic imaging (liver atrophy), a finding seen in only
8 out of 33 of a random sample of the rest of the AIH group.
Nitrofurazone is still used topically for wounds, burns and skin infections. Glascock et al. (1969)
reviewed the literature from 1945 to 1965, inclusive, on the topical use of nitrofurazone. The
concentrations in the various formulations varied from 0.02 to 1.0 %. During this 20-year period, more
than 1 000 reports were published, but only 136 studies provided both the number of patients treated
and the number of those who showed allergic reactions. These studies comprised a total of
15 162 treated patients, of which 176 patients (1.2 %) had allergic reactions to the formulation
containing nitrofurazone. No distinction was made for allergic reactions that could be attributed to the
constituents of the vehicles (e.g. polyethylene glycols) used in the nitrofurazone formulations. Bajaj
and Gupta (1986) studied the incidence of contact hypersensitivity to 15 antibacterial agents applied
topically. This study includes data gathered from January 1980 to December 1983 and is composed of
390 patients suspected of contact dermatitis to topical antibacterial agents. Patch tests were carried out
with various commercially available drugs. In the case of nitrofurazone, 390 patients were tested with
patches containing 0.2 % nitrofurazone (formulation not known). From this group, 93 patients were
tested with both ointment and powder containing nitrofurazone (concentration unknown, probably
0.2 %). Out of these 390 patients, 141 patients (36.2 %) showed hypersensitive reactions. Out of the
93 patients tested with two formulations, 30 patients (32.2 %) gave positive reactions to ointment and

Nitrofurans in food
EFSA Journal 2015;13(6):4140 106
32 patients (34.4 %) gave positive reactions to powder, both within 48 hours. Among the 15 bacterial
agents tested, nitrofurazone was the most common sensitiser. The authors stated that the role of the
vehicle (bases and preservatives) could not be tested, but, in the case of nitrofurazone, the two
different formulations did not show a significant difference in sensitisation.
No reviews of nifursol were identified because nifursol has not been used in human medicine (see
Section 1.3.1).
In conclusion, furazolidone and nitrofurantoin have the following adverse reactions in common:
gastrointestinal, neurological, systemic, dermatological and haematological reactions and adverse
reactions on vital organs such as the heart, lung, liver and kidney. The most common side effects of
furazolidone and nitrofurantoin were gastrointestinal reactions: nausea and/or vomiting and abdominal
pain. In contrast to nitrofurantoin, no deaths have been associated with adverse reactions to
furazolidone. In the case of nitrofurantoin, severe pulmonary side effects were, on rare occasions,
fatal. Both drugs have been associated with haemolytic anaemia, observed in patients deficient in
G6PD. Because nitrofurantoin has a long history of therapeutic use, much more information on
adverse reactions is available than for the other nitrofurans. The topical use of nitrofurazone may lead
to allergic reactions.
8.4.2. Epidemiological data on nitrofurans
Only a limited number of epidemiological studies on nitrofurans have been published and these relate
primarily to nitrofurantoin.
Selby et al. (1989) used pharmacy records for a cohort of 143 574 patients in California, USA, for the
period 1969–1973 to test the association of 215 drugs with subsequent incidence of cancers at 56 sites
in the human body over a period of up to 15 years. In total, 1 305 patients used systemic
nitrofurantoin and three cases of cancers of the nervous system were recorded; 0.6 cases would be
expected for this group. In addition, 317 patients used topical nitrofurazone and no associations with
cancers were recorded for this group.
In Finland, a study was undertaken to compile data on adverse reactions to long-term antimicrobial
therapy for recurrent urinary tract infections in children (Uhari et al., 1996). From 16 409 children
(< 16 years of age) who had received long-term antimicrobial therapy during the period 1976–1985, a
sample of 1 607 girls and 218 boys were included in the study. In the study group, 5 066 (girls) and
607 (boys) treatments were received and the mean duration of each course of treatment was 316 days.
Adverse reactions were recorded in 10.4 % of the courses of treatment and 8.2 % of the courses of
treatment were discontinued. Common adverse reactions to nitrofurantoin were nausea and vomiting
at a rate of 4.4 (95 % confidence interval 3.4–5.4) per 100 person-years. Children of less than 2 years
of age had adverse reactions to nitrofurantoin more often than those receiving treatment with
sulphonamides, while the reverse occurred for children aged 2–15 years. Most adverse reactions
occurred during the first 6 months of treatment and no serious life-threatening adverse reactions were
observed. The conclusion from the study was that nitrofurantoin, and sulphonamides, are safe drugs
for long-term preventative therapy.
A prospective study was undertaken in the USA (Chalasani et al., 2008) to investigate, inter alia, the
causative relationship of prescription medications with drug-induced liver injury. In total, 300 patients
(2 years of age or older) were included in the study; 93 % were adults (≥ 18 years), 18 % were older
than 65 years and 60 % were female. A single prescription medication was implicated in 217 cases
(73 %) and one of the more common implicated agents was nitrofurantoin (n = 13); the other most
common implicated agents were amoxicillin/clavulanate (n = 23), isoniazid (n = 13) and
trimethoprim/sulphamethoxazole (n = 13). Of the 26 patients who died or had a liver transplant within
6 months following recognition of drug-induced liver injury, nitrofurantoin was the implicated agent
in two patients, with a final causality score of ‘very likely’.
Nitrofurans in food
EFSA Journal 2015;13(6):4140 107
In the Netherlands, a study was undertaken to establish if women treated with nitrofurantoin for
urinary tract infections and renal impairment were at a higher risk of ineffectiveness of treatment
and/or serious adverse effects than women without renal impairment (Geerts et al., 2013). A cohort of
21 317 women treated with nitrofurantoin and a cohort of 7 926 women treated with trimethoprim
were included in the study. Ineffectiveness of treatment was defined as use of another antimicrobial
within 1 month of the start of treatment with nitrofurantoin and the definition of a serious adverse
event was one leading to hospitalisation within 90 days. The incidence density for ineffectiveness of
treatment was not higher for nitrofurantoin-treated women (5.4 per 1 000 person-days) than for
trimethoprim-treated women (6.3 per 1 000 person-days), and moderate renal impairment (estimated
glomerular filtration rate of 30–49 mL/min/1.73 m2) was not associated with ineffectiveness of
treatment. The incidence density for serious adverse events was 0.02 per 1 000 person-days for
nitrofurantoin treatment, compared with 0.01 per 1 000 person-days for trimethoprim treatment and, in
patients with renal impairment (< 50 mL/min/1.73 m2), the risk of pulmonary adverse events
significantly increased for nitrofurantoin treatment; no such event was reported for trimethoprim-
treated patients.
Two studies are reported on the effect of nitrofurantoin treatment during pregnancy for urinary tract
infections on the teratogenic risk to the fetus. In the first study, in Hungary, the outcome for three
groups of pregnant women was studied (Czeizel et al., 2001). In total, 1 079 (2.8 %) of 38 151 women
who had new-born infants without any congenital abnormalities (population control group),
774 (3.4 %) of 22 865 women who had new-born infants or fetuses with congenital abnormalities and
23 (2.8 %) of 812 women who had new-born infants or fetuses with Down’s syndrome (patient
controls) had been treated with nitrofurantoin. Although the incidence (3.4 %) of nitrofuran treatment
was higher for the group of women who had new-born infants or fetuses with congenital abnormalities
than for the control groups (2.8 %), when biases are excluded, no increased teratogenic potential was
found for nitrofurantoin treatment. This study concluded that treatment with nitrofurantoin during
pregnancy does not present a detectable teratogenic risk to the fetus.
In the second study, in Norway, the outcome in terms of (1) an increased rate of malformations
following first-trimester exposure to nitrofurantoin and (2) an increased rate of negative pregnancy
outcomes following exposure to nitrofurantoin during the last 30 days of pregnancy was studied
(Nordeng et al., 2013). The incidence of malformations was 31 (2.3 %) of 1 334 women who had been
dispensed nitrofurantoin during the first trimester, compared with 162 (2.8 %) of 5 800 women in the
disease control group, i.e. women who had been dispensed pivmecillinam during the first trimester,
giving an odds ratio of 0.79 (95 % confidence interval 0.51–1.23). The incidence of neonatal jaundice
was 103 (10.8 %) of 959 women who had been dispensed nitrofurantoin during the last 30 days of
pregnancy, compared with 10 336 (8.1 %) of 127 507 unexposed women, giving an odds ratio of
1.31 (95 % confidence interval 1.02–1.70). This study concluded that the teratogenic potential of
nitrofurantoin is low, but use in late pregnancy may increase the risk of neonatal jaundice.
In conclusion, positive associations of nitrofurantoin, given at therapeutic doses, were reported in
individual studies with adult cancers of the nervous system, with drug-induced liver injury and with
increased risk of pulmonary adverse events in patients with renal impairment. A study of long-term
therapy with nitrofurantoin for recurrent urinary tract infections in children found no association with
life-threatening adverse reactions. Two studies reported that treatment of women with nitrofurantoin
during pregnancy does not give rise to an increased teratogenic risk for the fetus, although one study
found that treatment with nitrofurantoin during the last 30 days of pregnancy may increase the risk of
neonatal jaundice.
8.5. Considerations of critical effects, dose–response modelling and possibilities for
derivation of a health-based guidance value
Nitrofurans have a short half-life due to extensive metabolism and, therefore, they do not occur
generally as residues in foods of animal origin. Reactive metabolites are formed that are able to bind
covalently to tissue macromolecules and, when such animal tissues are consumed as food, the side-
Nitrofurans in food
EFSA Journal 2015;13(6):4140 108
chains may be released from these metabolites under the acidic conditions of the human stomach,
namely AOZ, AMOZ, AHD, SEM and DNSH in the case of furazolidone, furaltadone, nitrofurantoin,
nitrofurazone and nifursol, respectively. Owing to the long half-lives of bound metabolites, these
releasable side-chains are also used as marker metabolites. At least in the case of furazolidone, it was
shown that AOZ can also be released in the stomach of pigs treated with furazolidone, and that AOZ
itself is able to form protein-bound adducts in pig tissues which can be hydrolysed to give free AOZ
again in the stomach of the consumer. This was shown in studies with isolated pig hepatocytes
incubated with AOZ. This metabolic pathway also offers an explanation for the fact that AOZ could
be released from tissues of rats that were fed with protein-bound residues of furazolidone (see Section
8.1.5).
As only few, if any, toxicity studies were available for the nitrofuran marker metabolites, the
CONTAM Panel, in addition to the evaluation of the toxicological information for the five nitrofuran
marker metabolites, also evaluated the toxicological information for the parent compounds. For all
five nitrofurans considered in this opinion, studies on their carcinogenic effects were available. A
description of the relevant benign and malignant tumours can be found in Section 8.2.7. For the hazard
characterisation of the carcinogenic effects, the CONTAM Panel focused on the evaluation of the
malignant tumours only.
8.5.1. Furazolidone and AOZ
Several studies reported that furazolidone is carcinogenic in experimental animals (see Section 8.2.7).
Furazolidone induced bronchial adenocarcinomas in male and female mice, malignant mammary
tumours in female rats, neural astrocytomas in male rats and sebaceous adenocarcinomas in male and
female rats. There is no information on the carcinogenicity in humans. Furazolidone induced
mutations in bacterial test systems and caused SCE and DNA strand breaks in mammalian cells in
vitro. In vivo, micronucleus studies gave negative or equivocal results, but an increase in SCE
frequency was observed. Based on these data, the CONTAM Panel concluded that furazolidone is
genotoxic in vitro and may possibly be genotoxic in vivo, and considered furazolidone to be a
substance which is genotoxic and carcinogenic. Therefore, the CONTAM Panel concluded that the
derivation of a health-based guidance value (HBGV) is not appropriate, and decided to apply an MOE
approach for its risk characterisation.
The CONTAM Panel considered the tumour data from four carcinogenicity studies to be suitable for
dose–response modelling:
1. Halliday et al. (1974)—bronchial adenocarcinomas observed in male and female Swiss
MBR/ICR mice;
2. King et al. (1972a) and Halliday et al. (1973a)—malignant mammary tumours
(adenocarcinomas and carcinosarcomas) observed in female Sprague–Dawley rats;
3. King et al. (1972b) and Halliday et al. (1973b)—mammary adenocarcinomas observed in
female Fischer 344 rats;
4. King et al. (1972b) and Halliday et al. (1973b)—malignant mammary tumours
(adenocarcinomas and carcinosarcomas) in female and neural astrocytomas observed in male
Sprague–Dawley rats.
The study by Siedler and Searfoss (1966) described in Section 8.2.7 was not suitable for dose–
response modelling, as only one dose was included.
Table I.9 (Appendix I Section I.1) shows the benchmark dose (BMD) results for the four considered
tumour types (bronchial adenocarcinomas, malignant mammary tumours, mammary adenocarcinomas
and neural astrocytomas) and details are shown in Appendix I, Section I.1. The CONTAM Panel noted
that, in all four carcinogenicity studies, there was considerable mortality before the end of the studies.
When animals died before the end of the study without having developed tumours, it remains

Nitrofurans in food
EFSA Journal 2015;13(6):4140 109
unknown if they would have developed tumours had they not died. This creates an additional
uncertainty for the dose–response relationship which cannot be accounted for in the statistical analysis
(with the information available). Therefore, the benchmark dose lower (BMDL) and upper (BMDU)
confidence limits should be considered as indicative. From the results, the CONTAM Panel selected
the lowest BMDL10 value (lower 95 % confidence limit or a benchmark response of 10 % extra risk)
of 3.5 mg/kg b.w. per day as a reference point for the carcinogenic effects of furazolidone.
For AOZ, the marker metabolite of furazolidone, there is no information on its carcinogenicity, but the
limited data indicate that it is genotoxic in vitro and possibly in vivo. Because of its genotoxicity, the
CONTAM Panel concluded that the derivation of an HBGV for AOZ is not appropriate. The
CONTAM Panel assumed that the carcinogenicity of furazolidone could be caused by AOZ and,
therefore, the BMDL10 value of 3.5 mg/kg b.w. per day for furazolidone can be used for AOZ.
Because the residues of furazolidone are expressed as its marker metabolite AOZ, and the molecular
weights of furazolidone and AOZ differ, the CONTAM Panel concluded that the reference point to be
used in the risk characterisation of the carcinogenic effects of residues of furazolidone, expressed as
AOZ, is 102 / 225 × 3.5 = 1.6 mg/kg b.w. per day.
For non-neoplastic effects of furazolidone, only limited information is available from long-
term/carcinogenicity studies, such as effects on red blood cell parameters and increases in adrenal
cortex and thyroid atrophy. For the most sensitive effect—a reduction in the number of red blood cells,
observed at the end of the chronic study in Sprague–Dawley rats (Halliday et al., 1973a)—the
CONTAM Panel performed BMD analysis because this approach is a scientifically more advanced
method to the NOAEL approach for deriving a reference point, as it makes extended use of available
dose–response data and it quantifies the uncertainties in the dose–response data, resulting, overall, in a
more consistent reference point (EFSA, 2009). For the reduction in the number of red blood cells, a
BMDL05 of 0.1 mg/kg b.w. per day has been derived (see Appendix I, Section I.2). This value can be
applied as reference point for the non-neoplastic effects of furazolidone.
There is only limited information on the toxicity of AOZ (see Section 8.2.2). In two 90-day studies in
rats and dogs, effects on red blood cell parameters and the spleen were found for rats at a dose of
6 mg/kg b.w. per day and for dogs at the lowest tested dose of 1 mg/kg b.w. per day (NOTOX, 1995b;
Brinck et al., 1995). In addition, in male and female dogs, dose-related effects on enzymes in blood
(ALP, AST) and bilirubin were found (Brinck et al., 1995). BMD analysis was performed on the
effects on the red blood cell count and serum levels of ALP, AST and bilirubin in dogs (see Appendix
I, Section I.3). For the effect on red blood cells in dogs, a BMDL05 of 0.04 mg/kg b.w. per day was
derived. For the other effects, the lowest BMDL05 was 0.02 mg/kg b.w. per day for the effect of AOZ
on ALP.
Because the residues of furazolidone are expressed as its marker metabolite AOZ, the CONTAM
Panel concluded that the BMDL05 of 0.02 mg/kg b.w. per day for AOZ can be used as a reference
point in the risk characterisation of the non-neoplastic effects of residues of furazolidone, expressed as
AOZ.
8.5.2. Furaltadone and AMOZ
For furaltadone, there are two limited studies (using only one dose level) showing that it induces
malignant mammary tumours in rats (see Section 8.2.7). With regard to its genotoxicity, it is a strong
bacterial mutagen and it induces mutations in mammalian cells in vitro (see Section 8.2.6). Although
the information is limited, the CONTAM Panel concluded that furaltadone is considered to be a
genotoxic carcinogen, for which the derivation of an HBGV is inappropriate, and therefore decided to
apply an MOE approach for its risk characterisation.
Two chronic studies were available on the carcinogenicity of furaltadone, and both used only one dose
level. In the study of Cohen et al. (1973), female Sprague–Dawley rats received an oral dose of
54 mg/kg b.w. per day in the diet. In this study, a rather high incidence of malignant mammary

Nitrofurans in food
EFSA Journal 2015;13(6):4140 110
tumours (25 out of 32) was observed. In the other study, in which a single dose of 85 mg/kg b.w. per
day was administered to female Holtzman rats in the diet, the incidence of malignant mammary
tumours was much lower: 3 out of 35. To be prudent, the CONTAM Panel used the Cohen study to
estimate a BMDL10. To circumvent the problem of the single dose in the Cohen data, a dose–response
analysis for the tumour data was performed, assuming that the shape parameter of the fitted model was
the same as for furazolidone. This resulted in a rather wide BMD confidence interval of 0.03 to
40 mg/kg b.w. per day (see Appendix I, Section I.4), indicating a large uncertainty in the BMD
estimate. Given the large difference between the BMDL and the BMDU, the CONTAM Panel
considered that the available data do not provide a suitable basis for deriving a reference point for the
carcinogenic effects of furaltadone.
Comparing the confidence interval for furaltadone with that for furazolidone (25–86 mg/kg b.w. per
day), the CONTAM Panel noted that, although they overlap to some extent, the interval for
furaltadone reflects a lower dose range. This indicates that furaltadone may be more potent than
furazolidone. This, however, contradicts the study by Siedler and Searfoss (1966) on Holtzman rats in
which both compounds were studied. A slightly higher but equimolar dose of furaltadone, i.e.
85 mg/kg b.w. per day (0.26 mmol/kg b.w. per day), compared with 57 mg/kg b.w. per day
(0.25 mmol/kg b.w. per day) of furazolidone induced a similar, low incidence of mammary
adenocarcinomas (furaltadone, 3 out of 35; furazolidone, 5 out of 35). Recognising the limitations of
the available data, the CONTAM Panel concluded that there are no clear indications that furaltadone is
more potent than furazolidone with respect to the induction of mammary adenocarcinomas.
For AMOZ, the marker metabolite of furaltadone, no information on carcinogenicity was identified,
but the limited data that are available on its mutagenicity/genotoxicity indicate that it is non-genotoxic
in vitro. The CONTAM Panel could not conclude on the carcinogenicity of AMOZ.
There is no information on non-neoplastic effects of furaltadone or AMOZ that could be used for the
derivation of a reference point for the risk characterisation.
8.5.3. Nitrofurantoin and AHD
In several long-term studies in mice and rats (see Section 8.2.7), nitrofurantoin induced
predominantly benign tumours (e.g. ovarian tubular adenomas, mammary fibroadenomas). In one
study, a few malignant tumours were observed in male rats (renal tubular carcinomas in two high-dose
males, and osteosarcomas in one low-dose male and two high-dose males). Based on these
observations, the CONTAM Panel concluded that the evidence that nitrofurantoin is carcinogenic in
experimental animals is limited. In vitro, nitrofurantoin induced mutations, DNA damage and
chromosomal aberrations. In vivo, it has been shown to induce DNA damage in multiple organs,
micronuclei formation in mice and gene mutations in a transgenic mouse mutation assay. In humans
(children), there are indications that long-term prophylactic treatment might induce SCEs in
lymphocytes. The CONTAM Panel concluded that nitrofurantoin is genotoxic in vivo. Although there
is only limited evidence for the carcinogenicity of nitrofurantoin, the CONTAM Panel concluded that,
to be prudent, the compound should be considered a substance which is genotoxic and carcinogenic,
for which the derivation of an HBGV is not appropriate. It therefore decided to apply an MOE
approach for risk characterisation of nitrofurantoin.
Based on the low incidence of osteosarcomas observed in male rats (NTP, 1989), the CONTAM Panel
derived a BMDL10 of 61 mg/kg b.w. per day as a reference point for the carcinogenic effect of
nitrofurantoin (see Appendix I, Section I.5). The CONTAM Panel recognised that this can be
considered a conservative approach because, owing to the very low incidence of the osteosarcomas,
the BMDU10 is infinite.
For AHD, the marker metabolite of nitrofurantoin, there is no information on carcinogenicity and
limited information on genotoxicity. The CONTAM Panel considered that AHD may play a role in the
Nitrofurans in food
EFSA Journal 2015;13(6):4140 111
carcinogenicity of nitrofurantoin and therefore the BMDL10 value of 61 mg/kg b.w. per day for
nitrofurantoin can be used for the risk characterisation of the carcinogenic effects of AHD.
Because the residues of nitrofurantoin are expressed as its marker metabolite AHD, and the molecular
weights of nitrofurantoin and AHD differ, the CONTAM Panel concluded that the reference point to
be used in the risk characterisation of the carcinogenic risks of residues of nitrofurantoin, expressed as
AHD, is 115/238 × 61 = 29.5 mg/kg b.w. per day.
Regarding the non-neoplastic effects of nitrofurantoin, the testes and in particular spermatogenesis
were considered to be the most sensitive targets, with large effects (up to two-fold) seen at the lowest
tested oral dose of 10 mg/kg b.w. per day (see Section 8.2.4.1). A BMD analyses was performed for
the effect of nitrofurantoin on spermatogenic index, number of tubuli containing spermatozoa, time of
motility of spermatozoa and concentration of spermatozoa as reported by Yunda et al. (1974).
However, as there were only three dose groups (including controls), the estimated BMD confidence
intervals were unstable, i.e. depended on the chosen start values of the parameters, and the CONTAM
Panel concluded that (with current statistical methodology) no reliable BMD confidence intervals
could be derived. Instead, the CONTAM Panel selected the lowest dose tested of 10 mg/kg b.w. per
day at which effects on spermatogenesis were observed as a reference point for the non-neoplastic
effects of nitrofurantoin, noting that the effects at this dose are substantial.
For AHD, the marker metabolite of nitrofurantoin, there is no information on non-neoplastic effects.
The CONTAM Panel assumes that the non-neoplastic effects of nitrofurantoin may be caused by AHD
and therefore the lowest dose tested of 10 mg/kg b.w. per day at which effects on spermatogenesis
were observed for nitrofurantoin can be used for AHD.
Because the residues of nitrofurantoin are expressed as its marker metabolite AHD, and the molecular
weights of nitrofurantoin and AHD differ, the CONTAM Panel concluded that the reference point to
be used in the risk characterisation of the non-neoplastic effects of residues of nitrofurantoin,
expressed as AHD, is 115 / 238 × 10 = 4.8 mg/kg b.w. per day.
8.5.4. Nitrofurazone and SEM
Following long-term oral administration to mice and rats, nitrofurazone increased the incidence of
benign tumours such as granulosa cell adenomas and benign mixed tumours of the ovary in mice and
mammary fibroadenomas in rats. In one study with rats, a non-dose-related increase in carcinomas of
the preputial gland was observed, but the combined incidence of preputial gland adenomas and
carcinomas, which was considered to be the most appropriate parameter for this type of tumour, was
not affected (see Section 8.2.7). Based on this observation, the CONTAM Panel concluded that there
is no evidence of the carcinogenicity of nitrofurazone in mice, and that evidence for the
carcinogenicity of nitrofurazone in rats is equivocal. Nitrofurazone was genotoxic in vitro but no
conclusion on the in vivo genotoxicity can be drawn. Therefore, no clear conclusion on the
genotoxicity and carcinogenicity of nitrofurazone can be drawn. In addition, the available information
is not suitable to derive a reliable reference point for the possible carcinogenicity of nitrofurazone in
rats.
SEM, the marker metabolite of nitrofurazone, increased the incidence of lung tumours in two limited
studies in mice, using only one dose level. In one study, the lung tumours were not specified; in the
other study, an increase in malignant lung tumours in female mice was indicated in only a semi-
quantitative way. In the two available rat studies, no increase in tumour incidence was found (see
Section 8.2.7). Recognising the shortcomings of most of these studies, the CONTAM Panel concluded
that there is limited evidence that SEM is carcinogenic in mice, and that there is no evidence in rats.
The Panel noted that this is contrary to the response of nitrofurazone. SEM is mutagenic in bacteria
and in mammalian cells in vitro, and showed clastogenic potential in vivo, but without a dose–
response relationship. The CONTAM Panel concluded that SEM is genotoxic in vitro, but that no

Nitrofurans in food
EFSA Journal 2015;13(6):4140 112
conclusion on its genotoxicity in vivo can be drawn. The available information is too limited to
conclude on a reference point for carcinogenicity of SEM in mice.
Because of the limitations in the database, the CONTAM Panel cannot derive a reference point that
can be used in the risk assessment of the carcinogenic effects of residues of nitrofurazone, expressed
as its marker metabolite SEM.
In repeated-dose toxicity studies (see Section 8.2.2) with nitrofurazone, the main toxic effects were on
reproductive organs. Based on effects on the testes in rats, a NOAEL of 13.5 mg/kg b.w. per day was
identified in a 13-week study. In studies on spermatogenesis (see Section 8.2.4.1), effects on the testes
and the epididymis were seen, but the most sensitive endpoint was massive spermiation failure
observed in rats at the lowest tested dose of 12.5 mg/kg b.w. per day administered orally for up to
12 weeks. In addition, reproductive toxicity studies (see Section 8.2.4.3) in mice confirmed that the
testis is the target organ, as disruption of fertility (related to degeneration of the seminiferous tubules),
abnormal sperm morphology and a reduced testicular spermatid concentration were seen at the lowest
tested dose of 14 mg/kg b.w. per day. Testes degeneration was also observed in chronic toxicity
studies (see Section 8.2.7) in nearly all dosed rats (49 out of 50 and 47 out of 50 for doses of 11 and
24 mg/kg b.w. per day, respectively, versus 12 out of 50 in the controls). For a number of endpoints
(testis and epididymis weight and testicular and epididymal sperm number), BMD analysis was
performed, and the lowest BMDL05 value of 4.6 mg/kg b.w. per day was obtained for the decrease in
epididymis weight in rats (see Appendix I, Section I.6). The CONTAM Panel noted that this BMDL05
value is not much lower than dose levels at which strong effects were seen in rats, i.e. massive
spermiation failure at 12.5 mg/kg b.w. per day and testis degeneration at 11 mg/kg b.w. per day, but
the data for both of these endpoints were not suitable for a BMD analysis.
In a 90-day study in which rats were orally administered SEM, a number of severe effects such as
deformation of limbs and osteochondral lesions were observed in all dose groups, including the lowest
dose of 23 mg/kg b.w. per day (see Section 8.2.2). In a chronic study with rats, disarrangement of
chondrocytes in bones and degeneration of the articular cartilage in knee joints were observed, with a
NOAEL of 0.6 mg/kg b.w. per day (see Section 8.2.7). In a teratogenicity study, an increase in cleft
palate was seen at the lowest tested dose of 10 mg/kg b.w. (see Section 8.2.4.2). Upon BMD analysis
(see Appendix I, Section I.7), a lowest BMDL10 for effects on bones was derived of 1.0 mg/kg b.w.
per day.
The CONTAM Panel noted that, in contrast to nitrofurazone, the available data for SEM do not
indicate an effect on the testes, but concluded that the BMDL10 of 1.0 mg/kg b.w. per day for SEM
could be used as a reference point for the risk characterisation of the non-neoplastic effects of residues
of nitrofurazone, expressed as its marker metabolite SEM.
8.5.5. Nifursol and DNSH
Based on the limited available information on nifursol, the CONTAM Panel concluded that there is no
clear indication that the compound is carcinogenic. In vitro, nifursol is mutagenic in bacteria and
induces chromosomal aberrations, but in vivo clastogenicity studies and an in vivo mutation assay with
transgenic mice gave clear negative results. Based on these data, the CONTAM Panel concludes that
nifursol is genotoxic in vitro, but not in vivo. However, the available toxicological information is too
limited to derive an HBGV and the CONTAM Panel decided to apply an MOE approach for the risk
characterisation of nifursol. For several endpoints, i.e. effects on red blood cell parameters and on
spleen weight observed in a 13-week rat study (see Section 8.2.2), and effects on liver weight
observed in a chronic study with rats (see Section 8.2.7), a BMD analysis was carried out (see
Appendix I, Section I.8). A lowest BMDL05 of 11 mg/kg b.w. per day was derived for effects on liver
weight. The CONTAM Panel concluded that this value could be used as a reference point for the non-
neoplastic effect of nifursol.

Nitrofurans in food
EFSA Journal 2015;13(6):4140 113
For DNSH, the marker metabolite of nifursol, there is no information on its toxicity, carcinogenicity
or mutagenicity/genotoxicity. Because the residues of nifursol are expressed as its marker metabolite
DNSH, and the molecular weights of nifursol and DNSH differ, the CONTAM Panel concluded that
the reference point to be used in the risk characterisation of residues of nifursol, expressed as DNSH,
is 242/365 × 11 = 7.3 mg/kg b.w. per day.
9. Risk characterisation
The CONTAM Panel considered the nitrofurans furazolidone, furaltadone, nitrofurantoin,
nitrofurazone and nifursol in this scientific opinion. Nitrofurans have short half-lives and, therefore,
they do not occur generally as residues in foods of animal origin. Reactive metabolites are formed that
are able to bind covalently to tissue macromolecules and, when such animal tissues are consumed as
food, the side-chains may be released, namely AOZ, AMOZ, AHD, SEM and DNSH. Owing to the
long half-lives of bound metabolites, these releasable side-chains are also used as marker metabolites.
At least in the case of furazolidone, it was shown that AOZ can also be released in the stomach of pigs
treated with furazolidone, and that AOZ itself is able to form protein-bound adducts in pig tissues
which can be hydrolysed to give free AOZ again in the stomach of the consumer (see Section 8.1.5).
The CONTAM Panel considered the application of a read-across approach between the nitrofuran
marker metabolites, but because of the different critical effects observed, the CONTAM Panel
characterised the risk for each of the marker metabolites separately. As nitrofuran marker metabolites
are hydrazines, which are excluded from the threshold of toxicological concern approach, such an
approach was not applied for the risk characterisation.
Only limited occurrence data on nitrofurans and their marker metabolites in food were available for
this opinion (see Section 5.2). The CONTAM Panel concluded that these data are too limited to carry
out a reliable human dietary exposure assessment. Therefore, the CONTAM Panel cannot characterise
the risk of actual exposure to nitrofuran marker metabolites.
9.1. Evaluation whether a reference point for action of 1 µg/kg for nitrofuran metabolites as
defined in the legislation in food of animal origin is adequate to protect public health
To evaluate whether or not an RPA of 1 µg/kg for nitrofuran metabolites, as defined in the legislation
(Commission Decision 2002/657/EC and Commission Decision 2005/34/EC), in foods of animal
origin is adequate to protect public health, the CONTAM Panel considered the exposure to nitrofuran
marker metabolites resulting from illicit nitrofuran use. Such exposure is covered by exposure scenario
1A, in which foods of animal origin (excluding milk and dairy products) are contaminated with one
nitrofuran marker metabolite at a concentration equal to the RPA level of 1 µg/kg. These are mainly
meat and meat products, fish and fish products, eggs and egg products and honey.
Based on scenario 1A, the median chronic dietary exposure for AOZ, AMOZ, AHD, SEM or DNSH
across dietary surveys for the average consumer would be 5.5 and 2.6 ng/kg b.w. per day for toddlers
(the highest exposed population group) and adults, respectively. The minimum and maximum chronic
dietary exposures across dietary surveys for the average consumer would be 3.3 and 8.0 ng/kg b.w. per
day, respectively, for toddlers and 1.9 and 4.3 ng/kg b.w. per day, respectively, for adults (see Table
5).
When comparing the median chronic dietary exposure to the furazolidone marker metabolite AOZ,
based on scenario 1A, across dietary surveys for the average consumer with the BMDL10 for
carcinogenicity of furazolidone, expressed as AOZ (1.6 mg AOZ/kg b.w. per day), the MOE would be
about 2.9 × 10⁵ for toddlers and 6.2 × 10
5 for adults. For the minimum and maximum chronic dietary
exposures across dietary surveys for the average consumer, the MOEs for toddlers would be about
4.8 × 10⁵ and 2.0 × 10
5, respectively, and for adults would be about 8.4 × 10
5 and 3.7 × 10
5,
respectively (Table 9).

Nitrofurans in food
EFSA Journal 2015;13(6):4140 114
For substances that are both genotoxic and carcinogenic, the EFSA Scientific Committee proposed
that an MOE of 10 000 or higher, if based on the BMDL10 from an animal carcinogenicity study,
would be of low concern from a public health point of view (EFSA, 2005). Considering that the
calculated MOEs for carcinogenicity would be of the order of 105, they are of low concern.
Furthermore, they are considered sufficiently large to cover the additional uncertainty regarding the
carcinogenicity data and the BMDL10, and the uncertainty related to the assumption that the
carcinogenicity of furazolidone is caused by its metabolite AOZ.
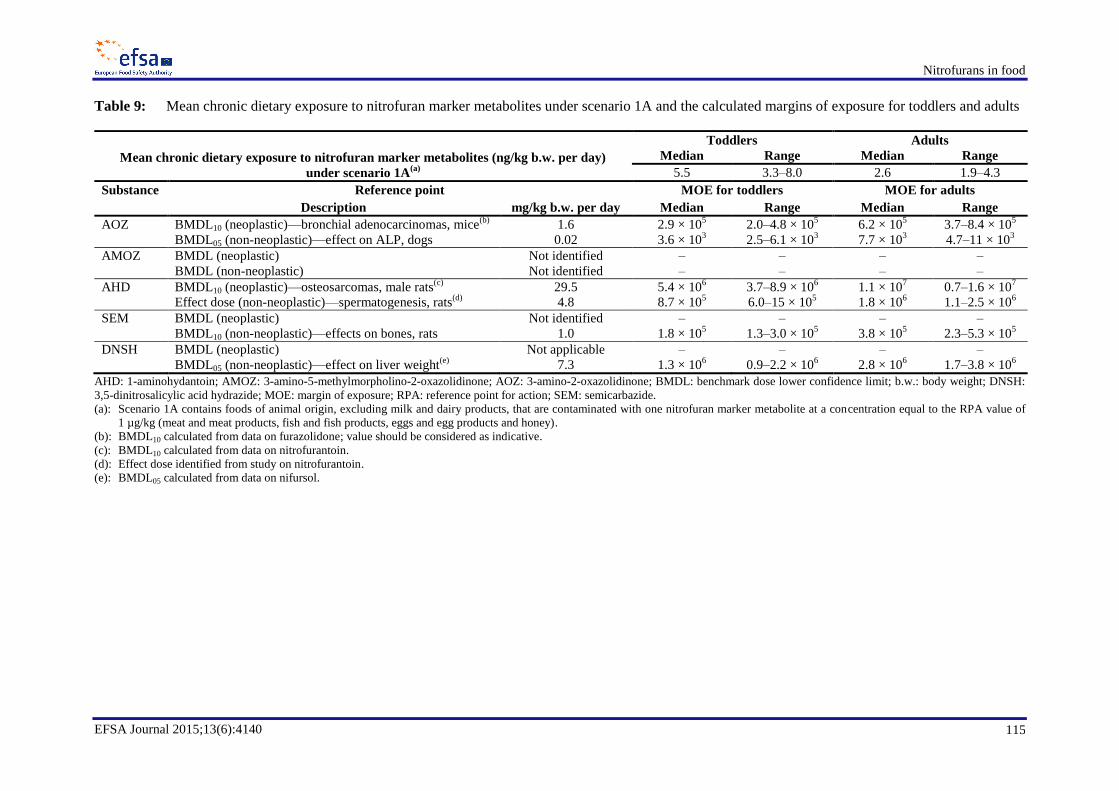
Nitrofurans in food
EFSA Journal 2015;13(6):4140 115
Table 9: Mean chronic dietary exposure to nitrofuran marker metabolites under scenario 1A and the calculated margins of exposure for toddlers and adults
Mean chronic dietary exposure to nitrofuran marker metabolites (ng/kg b.w. per day)
under scenario 1A(a)
Toddlers Adults
Median Range Median Range
5.5 3.3–8.0 2.6 1.9–4.3
Substance Reference point MOE for toddlers MOE for adults
Description mg/kg b.w. per day Median Range Median Range
AOZ BMDL10 (neoplastic)—bronchial adenocarcinomas, mice(b)
1.6 2.9 × 10⁵ 2.0–4.8 × 10
5 6.2 × 10
5 3.7–8.4 × 10
5
BMDL05 (non-neoplastic)—effect on ALP, dogs 0.02 3.6 × 10³ 2.5–6.1 × 10
3 7.7 × 10
3 4.7–11 × 10
3
AMOZ BMDL (neoplastic) Not identified – – – –
BMDL (non-neoplastic) Not identified – – – –
AHD BMDL10 (neoplastic)—osteosarcomas, male rats(c)
29.5 5.4 × 10⁶ 3.7–8.9 × 10
6 1.1 × 10
7 0.7–1.6 × 10
7
Effect dose (non-neoplastic)—spermatogenesis, rats(d)
4.8 8.7 × 10⁵ 6.0–15 × 10
5 1.8 × 10
6 1.1–2.5 × 10
6
SEM BMDL (neoplastic) Not identified – – – –
BMDL10 (non-neoplastic)—effects on bones, rats 1.0 1.8 × 10⁵ 1.3–3.0 × 10
5 3.8 × 10
5 2.3–5.3 × 10
5
DNSH BMDL (neoplastic) Not applicable – – – –
BMDL05 (non-neoplastic)—effect on liver weight(e)
7.3 1.3 × 10⁶ 0.9–2.2 × 10
6 2.8 × 10
6 1.7–3.8 × 10
6
AHD: 1-aminohydantoin; AMOZ: 3-amino-5-methylmorpholino-2-oxazolidinone; AOZ: 3-amino-2-oxazolidinone; BMDL: benchmark dose lower confidence limit; b.w.: body weight; DNSH:
3,5-dinitrosalicylic acid hydrazide; MOE: margin of exposure; RPA: reference point for action; SEM: semicarbazide.
(a): Scenario 1A contains foods of animal origin, excluding milk and dairy products, that are contaminated with one nitrofuran marker metabolite at a concentration equal to the RPA value of
1 µg/kg (meat and meat products, fish and fish products, eggs and egg products and honey).
(b): BMDL10 calculated from data on furazolidone; value should be considered as indicative.
(c): BMDL10 calculated from data on nitrofurantoin.
(d): Effect dose identified from study on nitrofurantoin.
(e): BMDL05 calculated from data on nifursol.

Nitrofurans in food
EFSA Journal 2015;13(6):4140 116
For non-neoplastic effects, the CONTAM Panel identified a BMDL05 of 0.02 mg/kg b.w. per day for
the effect on ALP caused by AOZ. When comparing this BMDL05 with the median chronic dietary
exposure to AOZ, based on scenario 1A, across dietary surveys for the average consumer, the MOE
would be about 3.6 × 10³ for toddlers and 7.7 × 10
3 for adults. For the minimum and maximum
chronic dietary exposures across dietary surveys for the average consumer, the MOEs for toddlers
would be about 6.1 × 10³ and 2.5 × 10
3, respectively, and for adults would be about 1.1 × 10
4 and
4.7 × 10³, respectively (Table 9).
The CONTAM Panel noted that MOEs of 100 are often considered of low concern for threshold
effects (FAO/WHO, 2009). Considering that the calculated MOEs for the effect on ALP would be of
the order of 103 or higher, they are considered sufficiently large and do not indicate a health concern
for non-neoplastic effects.
The CONTAM Panel concluded that it is unlikely that exposure to food contaminated with AOZ at or
below 1 μg/kg represents a health concern.
The CONTAM Panel could not conclude on the carcinogenicity of the furaltadone marker metabolite
AMOZ. Given that there are no clear indications that furaltadone is more potent than furazolidone
with respect to the induction of mammary adenocarcinomas, the CONTAM Panel concluded that the
cancer risk from AMOZ, if any, would not be greater than that from AOZ and hence does not indicate
a health concern.
The CONTAM Panel could not identify a reference point for non-neoplastic effects for AMOZ and
therefore the risk could not be assessed.
When comparing the median chronic dietary exposure to the nitrofurantoin marker metabolite AHD,
based on scenario 1A, across dietary surveys for the average consumer with the BMDL10 for
carcinogenicity of nitrofurantoin, expressed as AHD (29.5 mg AHD/kg b.w. per day), the MOE would
be about 5.4 × 10⁶ for toddlers and 1.1 × 10
7 for adults. For the minimum and maximum chronic
dietary exposures across dietary surveys for the average consumer, the MOEs for toddlers would be
about 8.9 × 10⁶ and 3.7 × 10
6, respectively, and for adults would be about 1.6 × 10
7 and 6.9 × 10
6,
respectively (Table 9).
Considering that the calculated MOEs for carcinogenicity would be of the order of 106 and higher,
they are considered sufficiently large to cover the uncertainty related to the assumption that the
carcinogenicity of nitrofurantoin is caused by its metabolite AHD.
When comparing the median chronic dietary exposure to the nitrofurantoin marker metabolite AHD,
based on scenario 1A, across dietary surveys for the average consumer with the effect dose38
on
spermatogenesis of nitrofurantoin, expressed as AHD (4.8 mg AHD/kg b.w. per day), the MOE would
be about 8.7 × 10⁵ for toddlers and 1.8 × 10
6 for adults. For the minimum and maximum chronic
dietary exposures across dietary surveys for the average consumer, the MOEs for toddlers would be
about 1.5 × 10⁶ and 6.0 × 10
5, respectively, and for adults would be about 2.5 × 10
6 and 1.1 × 10
6,
respectively (Table 9).
The calculated MOEs for effects on spermatogenesis of AHD are not based on a NOAEL or a BMDL
but on an effect level at which the effects are substantial. However, as the MOEs are of the order of
105 or higher, they are considered to be sufficiently large and do not indicate a health concern for non-
neoplastic effects of AHD.
The CONTAM Panel concluded that it is unlikely that exposure to food contaminated with AHD at or
below 1 μg/kg represents a health concern.
38 Lowest dose tested at which effects on spermatogenesis were observed.

Nitrofurans in food
EFSA Journal 2015;13(6):4140 117
SEM is carcinogenic in mice, but not in rats. However, the available information is too limited to
conclude on a reference point for carcinogenicity in mice and the cancer risk cannot be assessed.
For non-neoplastic effects, the CONTAM Panel identified a BMDL10 of 1.0 mg/kg b.w. per day for
the effect on bones caused by SEM. When comparing this BMDL10 with the median chronic dietary
exposure to SEM, based on scenario 1A, across dietary surveys for the average consumer, the MOE
would be about 1.8 × 10⁵ for toddlers and 3.8 × 10
5 for adults. For the minimum and maximum
chronic dietary exposures across dietary surveys for the average consumer, the MOEs for toddlers
would be about 3.0 × 10⁵ and 1.3 × 10
5, respectively, and for adults would be about 5.3 × 10
5 and
2.3 × 10⁵, respectively (Table 9).
Considering that the calculated MOEs for the effect of SEM on bones would be of the order of 105,
they are considered sufficiently large and do not indicate a health concern for non-neoplastic effects.
No information regarding the carcinogenicity is available for the nifursol marker metabolite DNSH.
Based on the limited available information on nifursol, the CONTAM Panel concluded that there is no
clear indication that nifursol is carcinogenic.
For non-neoplastic effects, the CONTAM Panel identified a BMDL05 for the effects of nifursol on
liver weight, expressed as DNSH (7.3 mg DNSH/kg b.w. per day). When comparing this BMDL05
with the median chronic dietary exposure to DNSH, based on scenario 1A, across dietary surveys for
the average consumer, the MOE would be about 1.3 × 10⁶ for toddlers and 2.8 × 10
6 for adults. For the
minimum and maximum chronic dietary exposures across dietary surveys for the average consumer,
the MOEs for toddlers would be about 2.2 × 10⁶ and 9.1 × 10
5, respectively, and for adults would be
about 3.8 × 10⁶ and 1.7 × 10
6, respectively (Table 9).
Considering that the calculated MOEs for the effect of DNSH on liver weight would be of the order of
105 or higher, they are considered sufficiently large and do not indicate a health concern for non-
neoplastic effects.
Overall, the CONTAM Panel concludes that the presence of AOZ, AHD and DNSH in food at or
below a level of 1 µg/kg is unlikely to be a health concern. Owing to the lack of appropriate data, the
CONTAM Panel cannot assess the cancer risk or the risk of non-neoplastic effects of AMOZ. The
presence of SEM in food at or below a level of 1 µg/kg is unlikely to be a health concern for non-
neoplastic effects but, owing to the lack of appropriate data, the cancer risk of SEM cannot be
assessed.
9.2. Assessment of the appropriateness of applying the reference point for action that is
considered adequate to protect public health to other commodities than food of animal
origin
No occurrence of AOZ, AMOZ, AHD or DNSH has been reported in foods of non-animal origin.
Therefore, the CONTAM Panel considered that this term of reference does not apply to these
substances.
Only SEM is reported to occur in foods of non-animal origin owing to its occurrence in the food
additive carrageenan, which is used in a large variety of foods of both non-animal and animal origin.
Because the available information on SEM is too limited to conclude on a reference point for
carcinogenicity, the risk characterisation focuses on non-neoplastic effects only.
To address this term of reference, the CONTAM Panel decided to use exposure scenario 2A, in which
foods of non-animal origin for which carrageenan is authorised as an additive are contaminated with
SEM at a concentration in the final food product equal to the RPA level of 1 µg/kg.
Based on scenario 2A, the median chronic dietary exposure for SEM across dietary surveys for the
average consumer would be 14 and 5.7 ng/kg b.w. per day for toddlers (the highest exposed

Nitrofurans in food
EFSA Journal 2015;13(6):4140 118
population group) and adults, respectively. The minimum and maximum chronic dietary exposures
across dietary surveys for the average consumer would be 4.6 and 41 ng/kg b.w. per day, respectively,
for toddlers and 3.3 and 13 ng/kg b.w. per day, respectively, for adults (see Table 7).
As the exposure to SEM from dairy products in which carrageenan is used is not covered by scenario
1A or scenario 2A, the CONTAM Panel considered scenario 2C, in which foods of animal origin
(including only those milk and dairy products for which carrageenan is authorised as an additive) and
foods of non-animal origin (for which carrageenan is authorised as an additive) are contaminated with
SEM at a concentration equal to the RPA level of 1 µg/kg.
Based on scenario 2C, the median chronic dietary exposure for SEM across dietary surveys for the
average consumer would be 29 and 9.6 ng/kg b.w. per day for toddlers (the highest exposed
population group) and adults, respectively. The minimum and maximum chronic dietary exposures
across dietary surveys for the average consumer would be 17 and 55 ng/kg b.w. per day, respectively,
for toddlers and 6.4 and 16 ng/kg b.w. per day, respectively, for adults (see Table 7).
For non-neoplastic effects, the CONTAM Panel identified a BMDL10 of 1.0 mg/kg b.w. per day for
the effect on bones caused by SEM. When comparing this BMDL10 with the median chronic dietary
exposure to SEM, based on scenario 2A, across dietary surveys for the average consumer, the MOE
would be about 7.1 × 10⁴ for toddlers and 1.8 × 10
5 for adults. For the minimum and maximum
chronic dietary exposures across dietary surveys for the average consumer, the MOEs for toddlers
would be about 2.2 × 10⁵ and 2.4 × 10
4, respectively, and for adults would be about 3.0 × 10
5 and
7.4 × 10⁴, respectively (Table 10).
When comparing the BMDL10 of 1.0 mg/kg b.w. per day with the median chronic dietary exposure to
SEM, based on scenario 2C, across dietary surveys for the average consumer, the MOE would be
about 3.4 × 10⁴ for toddlers and 1.0 × 10
5 for adults. For the minimum and maximum chronic dietary
exposures across dietary surveys for the average consumer, the MOEs for toddlers would be about
5.9 × 10⁴ and 1.8 × 10
4, respectively, and for adults would be about 1.6 × 10
5 and 6.3 × 10
4,
respectively (Table 11).
The calculated MOEs for the effect of SEM on bones would be of the order of 104 or higher. These
MOEs are considered to be sufficiently large and, therefore, the CONTAM Panel concludes that the
presence of SEM in food at or below a level of 1 μg/kg is unlikely to be a health concern for non-
neoplastic effects. Owing to the lack of appropriate data, the CONTAM Panel cannot assess the cancer
risk of SEM.
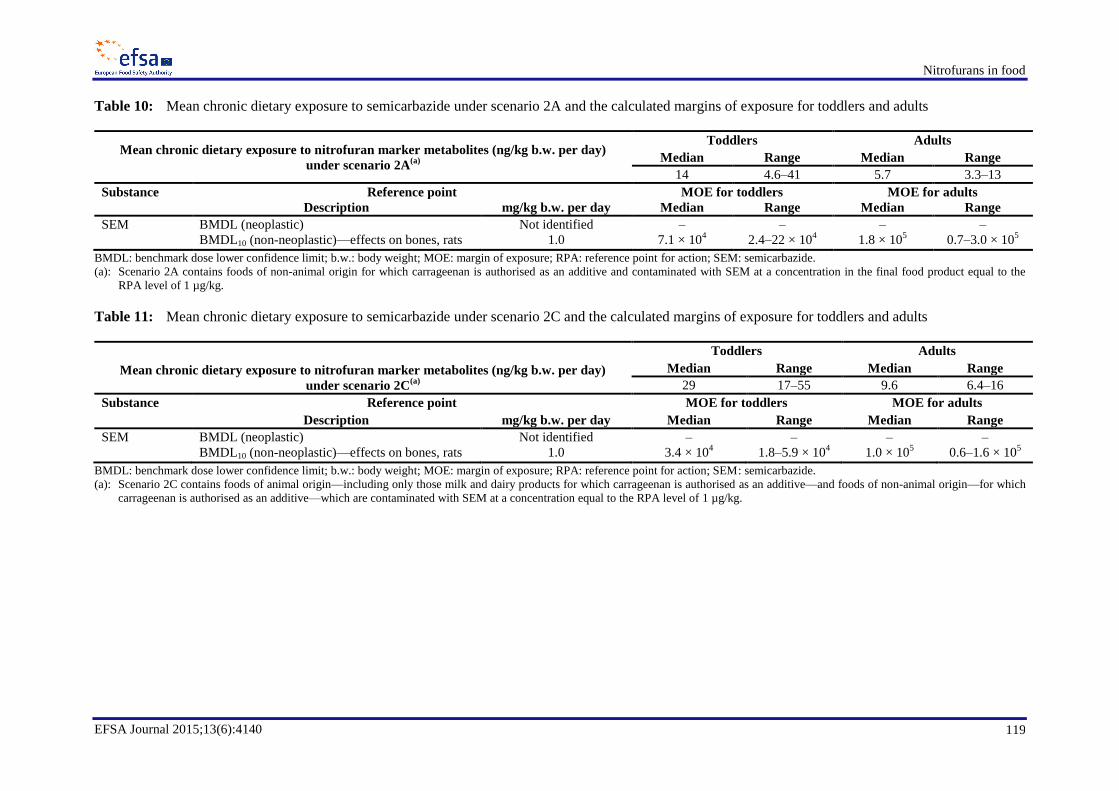
Nitrofurans in food
EFSA Journal 2015;13(6):4140 119
Table 10: Mean chronic dietary exposure to semicarbazide under scenario 2A and the calculated margins of exposure for toddlers and adults
Mean chronic dietary exposure to nitrofuran marker metabolites (ng/kg b.w. per day)
under scenario 2A(a)
Toddlers Adults
Median Range Median Range
14 4.6–41 5.7 3.3–13
Substance Reference point MOE for toddlers MOE for adults Description mg/kg b.w. per day Median Range Median Range
SEM BMDL (neoplastic) Not identified – – – – BMDL10 (non-neoplastic)—effects on bones, rats 1.0 7.1 × 10
4 2.4–22 × 10
4 1.8 × 10
5 0.7–3.0 × 10
5
BMDL: benchmark dose lower confidence limit; b.w.: body weight; MOE: margin of exposure; RPA: reference point for action; SEM: semicarbazide.
(a): Scenario 2A contains foods of non-animal origin for which carrageenan is authorised as an additive and contaminated with SEM at a concentration in the final food product equal to the
RPA level of 1 µg/kg.
Table 11: Mean chronic dietary exposure to semicarbazide under scenario 2C and the calculated margins of exposure for toddlers and adults
Mean chronic dietary exposure to nitrofuran marker metabolites (ng/kg b.w. per day)
under scenario 2C(a)
Toddlers Adults
Median Range Median Range
29 17–55 9.6 6.4–16
Substance Reference point MOE for toddlers MOE for adults
Description mg/kg b.w. per day Median Range Median Range
SEM BMDL (neoplastic) Not identified – – – – BMDL10 (non-neoplastic)—effects on bones, rats 1.0 3.4 × 10
4 1.8–5.9 × 10
4 1.0 × 10
5 0.6–1.6 × 10
5
BMDL: benchmark dose lower confidence limit; b.w.: body weight; MOE: margin of exposure; RPA: reference point for action; SEM: semicarbazide.
(a): Scenario 2C contains foods of animal origin—including only those milk and dairy products for which carrageenan is authorised as an additive—and foods of non-animal origin—for which
carrageenan is authorised as an additive—which are contaminated with SEM at a concentration equal to the RPA level of 1 µg/kg.

Nitrofurans in food
EFSA Journal 2015;13(6):4140 120
10. Uncertainty analysis
The CONTAM Panel concluded that the available occurrence data on the prohibited substances
nitrofurans and their marker metabolites in food were too limited and therefore preclude a reliable
human dietary exposure assessment and consequently a detailed evaluation of the inherent uncertainties.
Therefore, the CONTAM Panel performed different scenarios by calculating the hypothetical human
dietary exposure considering the RPA of 1.0 µg/kg as a maximum occurrence value in meat and meat
products, fish and fish products, eggs and egg products and honey consumed as such or as part of
composite dishes. This is in agreement with the request to evaluate if the RPA is low enough to protect
human health. These scenarios represent highly unlikely situations in which all considered foods of
animal origin are contaminated with one nitrofuran marker metabolite. This introduces substantial
uncertainty in the estimations of potential human exposure. SEM not only is a marker metabolite of
nitrofurazone, but can also originate from several other sources. Except for carrageenan, which is
authorised for use as a food additive in a variety of food products, these other sources have been
eliminated owing to changes in legislation or are covered by potential occurrence in foods of animal
origin, as considered in scenario 1A. Therefore, the CONTAM Panel, in addition to the scenarios which
cover foods of animal origin only, calculated the potential chronic dietary exposure to SEM taking into
consideration those food categories which may contain carrageenan as an additional potential source of
contamination, considered in scenarios 2A and 2C. Depending on the assumed concentration of SEM in
carrageenan or the final food, these estimations introduce a substantial uncertainty in the exposure
estimations.
In humans, there is potential for additional non-dietary exposure to certain nitrofurans from licensed
medicines via oral or topical administration; however, the extent of this additional exposure is not
known.
For some nitrofurans, and especially marker metabolites, few, if any, toxicity studies were available. In
most cases, the CONTAM Panel used data from toxicity studies on parent compounds to derive
reference points for the marker metabolites. Metabolites of the parent compounds, other than the marker
metabolites, may also be responsible for toxic effects observed in toxicity studies on parent compounds.
The Panel assumes equal potency and equal bioavailability of the nitrofurans and their marker
metabolites. The BMDL for carcinogenic effects of furazolidone in rats was potentially underestimated
because of the increased mortality at higher doses. There were some indications that furaltadone has a
higher potency than furazolidone in inducing mammary tumours in rats, but data were too limited to
draw a conclusion.
The CONTAM Panel assumed that the carcinogenicity of furazolidone could be caused by AOZ,
because of its genotoxic effects in vitro and in vivo. However, in view of the similar carcinogenic
potencies of furaltadone and furazolidone, the apparent lack of genotoxicity of AMOZ may cast some
doubt on the role of AOZ in the carcinogenicity of furazolidone. For the genotoxicity of several marker
metabolites, results from in vitro studies only are available and, therefore, there is uncertainty regarding
the genotoxicity in vivo.
Overall, the CONTAM Panel considered that the impact of the uncertainties on the risk assessment of
human exposure to nitrofurans and their metabolites through the consumption of food is substantial. The
approach taken is more likely to overestimate than underestimate the risk.

Nitrofurans in food
EFSA Journal 2015;13(6):4140 121
CONCLUSIONS AND RECOMMENDATIONS
CONCLUSIONS
General
Nitrofurans are synthetic broad spectrum antimicrobial agents. The nitrofurans considered in
this opinion are furazolidone, furaltadone, nitrofurantoin, nitrofurazone and nifursol.
Nitrofurans share a nitrofuran ring which is coupled to a side-chain via an azomethine bond.
The side-chains differ for the various drugs, being 3-amino-2-oxazolidinone (AOZ) for
furazolidone, 3-amino-5-methylmorpholino-2-oxazolidinone (AMOZ) for furaltadone,
1-aminohydantoin (AHD) for nitrofurantoin, semicarbazide (SEM) for nitrofurazone, and
3,5-dinitrosalicylic acid hydrazide (DNSH) for nifursol.
In veterinary medicine, nitrofurans are no longer authorised for use in food-producing animals
in the EU. In human medicine, furazolidone, nitrofurantoin and nitrofurazone are still used.
Nitrofurans have short half-lives in animals and, therefore, they do not occur generally as
residues in foods of animal origin. Reactive metabolites are formed that are able to bind
covalently to tissue macromolecules, such as proteins and DNA. When animal tissues are
consumed as food, the side-chains may be released, namely AOZ, AMOZ, AHD, SEM and
DNSH.
Methods of analysis
Because of the short half-lives of the parent nitrofurans, analytical methods have been
developed to test for the presence of covalently bound metabolites which have relatively long
half-lives.
The side-chains of the covalently bound residues are used as marker metabolites.
Generally, both screening and confirmatory methods for the nitrofuran marker metabolites
AOZ, AMOZ, AHD, SEM and DNSH in foods of animal origin use acid hydrolysis and
nitrobenzaldehyde derivatisation of the released marker metabolites.
Screening for the resulting nitrophenyl derivatives is generally undertaken by enzyme-linked
immunosorbent assays or biosensor methods, providing sufficient analytical sensitivity to meet
the current minimum required performance limit (MRPL) of 1 µg/kg.
Confirmatory methods are based on liquid chromatography–tandem mass spectrometry
(LC-MS/MS) and also adequately meet the MRPL of 1 µg/kg.
Appropriateness of using marker metabolites of nitrofurans
Nitrofuran parent compounds can only be detected in animal tissues and products for a short
period after treatment of the animals and, therefore, monitoring of nitrofuran residues in
livestock based on the identification of the parent compounds is not appropriate.
Metabolites binding covalently to proteins and persisting for several weeks in edible tissues,
from which the side-chains AOZ, AMOZ, AHD, SEM and DNSH may be released, serve as
excellent marker metabolites for the illicit use of nitrofurans in food-producing animals.
As other nitrofuran metabolites that persist at higher concentrations have not been identified, the
marker metabolites AOZ, AMOZ, AHD, SEM and DNSH are appropriate for the reference
point for action (RPA) for foods of animal origin.

Nitrofurans in food
EFSA Journal 2015;13(6):4140 122
Occurrence/exposure
Illicit treatment of food producing animals with nitrofurans may result initially in levels of
marker metabolites at the mg/kg level in edible products.
Data on occurrence of nitrofuran metabolites (AOZ, AMOZ, AHD and SEM) in food, reported
by Member States from the National Residue Monitoring Plans, have been extracted for the
period 2002 to 2013; there were 214 non-compliant targeted samples reported for nitrofurans
over that 12 year period. The categories in which nitrofurans were reported in decreasing level
of incidence were poultry, bovines, sheep/goats, pigs, farmed game, honey, rabbit, aquaculture,
horses and wild game.
Data were extracted also from the Rapid Alert System for Food and Feed (RASFF) database for
the years 2002 to 2014; there were 808 notification events reported for nitrofuran metabolites
(AOZ, AMOZ, AHD and SEM), of which 416 were for crustaceans and products thereof and
150 were for poultry meat and poultry meat products.
In the last decade, the number of non-compliant samples has decreased, as indicated by the
national residue monitoring plans and the RASFF notifications. Most of the non-compliant
samples concern AOZ and SEM in poultry, bovine, sheep and goats, and crustaceans.
The EFSA Panel on Contaminants in the Food Chain (CONTAM Panel) concluded that data
extracted from the European Commission database and the RASFF database were too limited to
carry out a reliable human dietary exposure assessment.
The CONTAM Panel calculated the hypothetical human dietary exposure considering the
occurrence of one nitrofuran marker metabolite at an occurrence value equal to the RPA of
1 µg/kg, for two scenarios (1A and 1B). These scenarios represent worst-case situations, in
which all considered foods covered by each scenario are contaminated with one nitrofuran
marker metabolite at the level of the RPA, a highly unlikely situation.
Exposure scenario 1A represents the occurrence of nitrofuran marker metabolites owing to
illicit nitrofuran use. In this scenario, foods of animal origin, excluding milk and dairy products,
are considered to contain one nitrofuran marker metabolite at the concentration level of 1 µg/kg.
The mean chronic dietary exposure across dietary surveys would range from 1.9 to 4.3 ng/kg
b.w. per day for adults and would be the highest for toddlers (3.3 to 8.0 ng/kg body weight
(b.w.) per day).
Besides arising from nitrofurazone use, SEM may occur in food from other sources, including
use of the food additive carrageenan. The CONTAM Panel considered scenarios (2A-2D)
covering the different sources.
Exposure scenario 2C covers all potential dietary exposure to SEM. This scenario includes
foods of animal origin (including only those milk and dairy products for which carrageenan is
authorised as an additive) and foods of non-animal origin for which carrageenan is authorised as
an additive. These foods are considered to be contaminated with SEM at a concentration equal
to the RPA level of 1 µg/kg. The mean chronic dietary exposure to SEM across dietary surveys
would range from 6.4 to 16 ng/kg b.w. per day for adults and would be the highest for toddlers
(17 to 55 ng/kg b.w. per day).
Hazard identification and characterisation
Toxicokinetics
Reduction of the nitro-group seems to be the most important metabolic pathway potentially
leading to reactive intermediates that are capable of binding to proteins and to DNA. Various
other metabolites may be formed in this pathway, including the open-chain cyano-metabolite.
Apart from the marker metabolites, very few metabolites have been detected as residues in
tissues of treated animals.
Nitrofurans in food
EFSA Journal 2015;13(6):4140 123
Nitroreduction and subsequent redox cycling results in the generation of reactive species
(including oxygen species) that might be responsible for some of the adverse effects.
Thiol-containing compounds such as glutathione play a role in detoxification of some nitrofuran
metabolites, but glutathione adducts have been detected in vitro only and seem to be rather
unstable owing to a retro-Michael reaction (exchange with other thiol group-containing
compounds).
Based on studies with radiolabelled nitrofurans, high levels (mg/kg range) of metabolites are
present in tissues shortly after the last treatment. A proportion of the metabolites cannot be
extracted from the tissues with organic solvents and are assumed to be protein-bound. Levels of
these residues decrease gradually but are still detectable after 45 days in muscle, kidney and
liver of treated pigs and probably for much longer. The decrease of residues in liver and kidney
is faster than in muscle tissue.
As has been shown in different animal species, the side-chains can be released from a
proportion of the residues after acid treatment (leading to cleavage of the azomethine bond).
Feeding of rats with protein-bound residues of radiolabelled furazolidone showed that some of
the radiolabel was excreted in urine and so must have been absorbed in the gastrointestinal tract.
The radiolabel was also detected in tissues of rats and was partly non-extractable. AOZ could be
released by acid treatment from these non-extractable residues in rat tissues.
Free AOZ was detected in plasma of pigs treated with furazolidone, showing that release of
AOZ from furazolidone occurs in these animals, suggesting that acid hydrolysis in the stomach
may be an important metabolic pathway for nitrofurans.
Free AOZ was detected in the blood of rats fed with meat containing only protein-bound
residues of furazolidone, showing that AOZ can also be released from these residues, probably
in the stomach at low pH.
Toxicity studies
Acute toxicity studies in laboratory animals showed that for furazolidone, nitrofurantoin and
nitrofurazone the lung is an important target for toxicity, leading to decreased respiratory
function and death. Signs of neurotoxicity such as hyperirritability, tremors and convulsions
were also found.
Furazolidone and AOZ
For AOZ, hepatotoxicity, decreased body weight gain and anaemia were observed in repeated-
dose toxicity studies at the lowest tested dose of 0.9 mg/kg b.w. per day in rats and at 1 mg/kg
b.w. per day in dogs.
Furazolidone in mice was embryotoxic at the lowest dose tested of 200 mg/kg b.w. per day and
caused decreased body weight and viability of pups after birth, but no malformations were
found.
Furazolidone and its marker metabolite AOZ are genotoxic in vitro and possibly also in vivo. As
AOZ can be released from bound residues of furazolidone metabolites, these bound residues
should be considered genotoxic.
Furazolidone induced malignant mammary tumours in rats, bronchial adenocarcinomas in male
and female mice and neural astrocytomas in male rats. The CONTAM Panel concluded that
furazolidone is carcinogenic in mice and rats. No information on the carcinogenicity of AOZ,
the marker metabolite of furazolidone, was identified, but it is presumed that AOZ may play a
role in tumour formation.
Nitrofurans in food
EFSA Journal 2015;13(6):4140 124
Furaltadone and AMOZ
Furaltadone is a bacterial and mammalian cell mutagen in vitro. The marker metabolite AMOZ
is not genotoxic in vitro.
Furaltadone induced malignant mammary tumours in female rats. The CONTAM Panel
concluded that furaltadone is carcinogenic in rats. There is no information on the chronic
toxicity or the carcinogenicity of AMOZ.
Nitrofurantoin and AHD
Nitrofurantoin caused toxic effects in liver, kidney and testes, necrosis of the ovarian follicles,
decreased weight gain and neurotoxicity in repeated-dose toxicity studies, with a NOAEL of
about 120 mg/kg b.w. per day in rats and mice.
Furazolidone, furaltadone, nitrofurantoin and nitrofurazone caused toxic effects on the testes in
rats and mice, but no NOAEL could be identified. Effects were observed at the lowest dose
tested of 10 mg/kg b.w. per day for nitrofurantoin.
Nitrofurantoin was embryotoxic in mice and rats and caused decreased body weight and
viability of pups after birth. A NOAEL of 10 mg/kg b.w. per day was identified for
embryotoxicity in rats. Malformations were found in offspring of rats and rabbits, with a
NOAEL of 30 mg/kg b.w. per day.
Nitrofurantoin caused peripheral nerve damage in rats treated orally at the lowest dose tested of
20 mg/kg b.w. per day.
In vitro, nitrofurantoin induces mutations, chromosomal aberrations and DNA damage. In vivo,
it induces DNA damage in multiple organs, micronuclei formation in mice and gene mutations
in a transgenic mouse mutation assay. For AHD, the only in vivo mutagenicity study which is
available shows a negative result.
Nitrofurantoin induced an increase mainly in benign tumours in mice and rats, but in male rats a
few malignant tumours were found. Based on these observations, the CONTAM Panel
concluded that there is limited evidence that nitrofurantoin is carcinogenic in rats. No
information on the chronic toxicity or the carcinogenicity of AHD was identified.
Nitrofurazone and SEM
Nitrofurazone caused toxic effects in liver, kidney and testes, decreased weight gain and
neurotoxicity in repeated-dose toxicity studies. The NOAEL for effects on the testes in rats was
13.5 mg/kg b.w per day. SEM caused severe deformation of limbs and osteochondral lesions at
the lowest tested dose of 23 mg/kg b.w. per day in rats.
Nitrofurazone was not teratogenic in mice and rabbits at doses that were not maternotoxic. For
fetotoxicity/maternotoxicity an overall NOAEL of 14 mg/kg b.w. per day was identified.
For SEM, in a study looking at the incidence of cleft palate and resorptions only, an effect was
found when rats were treated orally with SEM at 25 mg/kg b.w. per day or higher, but not when
treated at 10 mg/kg b.w. per day.
Nitrofurazone showed reproductive toxicity in mice at the lowest dose tested (14 mg/kg b.w. per
day).
SEM caused neurobehavioural effects in juvenile rats when treated orally at the lowest dose
tested of 40 mg/kg b.w. per day for 10 days.
Nitrofurazone and its marker metabolite SEM are genotoxic in vitro. In vivo tests gave negative
results with nitrofurazone, whereas no conclusion can be drawn on the in vivo genotoxicity of
SEM.

Nitrofurans in food
EFSA Journal 2015;13(6):4140 125
Nitrofurazone increased the incidence of mainly benign tumours in mice and rats following oral
administration. In male rats, a non-dose-related increase in carcinomas of the preputial gland
was observed. The CONTAM Panel concluded that there is no evidence for the carcinogenicity
of nitrofurazone in mice, and that evidence for its carcinogenicity in rats is equivocal. Non-
neoplastic effects of nitrofurazone were observed in a chronic toxicity study at the lowest dose
tested of 14 mg/kg b.w. per day in mice (ovarian atrophy in females and reduced survival in
males) and the lowest dose tested of about 11 mg/kg b.w. per day in rats (testes degeneration).
SEM increased the incidence of malignant lung tumours, particularly in female mice. In rats, no
increase in tumour incidence was found. The CONTAM Panel concluded that there is limited
evidence that SEM is carcinogenic in mice, but not in rats. Based on effects on bones observed
in a chronic toxicity study in male rats, a NOAEL of 0.6 mg/kg per day was derived for non-
neoplastic effects of SEM.
Nifursol and DNSH
From a 13-week study in which nifursol caused slight changes in red blood cell parameters, a
NOAEL of about 14 mg/kg b.w. per day was identified.
Nifursol did not have any effects on reproduction in rats treated for three generations at doses of
54 mg/kg b.w. per day or lower.
Nifursol is genotoxic in vitro, whereas in vivo it induced neither chromosomal aberrations nor
mutations.
For nifursol the available chronic toxicity studies in rats and dogs did not show clear indication
for carcinogenicity. The toxicological information was too limited to derive a NOAEL for non-
neoplastic effects of nifursol. No information on the chronic toxicity or the carcinogenicity of
DNSH was identified.
Mode of action
Reduction of the nitro-group seems to be the key metabolic pathway leading to reactive
intermediates, including reactive oxygen species. Reactive metabolites are capable of binding to
proteins and to DNA, being thereby responsible for most of the adverse effects resulting from
exposure to nitrofurans.
With the exception of AOZ, no information was identified regarding the mode of action of the
nitrofuran marker metabolites.
AOZ plays a role in the inhibition of monoamine-oxidase in animals treated with furazolidone.
This may result in an increased susceptibility to neurotoxic effects of certain biogenic amines
such as tyramine.
Protein binding of reactive nitrofuran metabolites may play a role in the irreversible inhibition
of the pyruvate dehydrogenase complex, another potential mechanism underlying neurotoxic
effects of nitrofurans, such as polyneuritis.
Human data
The oral administration of furazolidone and nitrofurantoin in humans may lead to a range of
adverse reactions, particularly nausea, vomiting and abdominal pain. Both drugs have also been
associated with haemolytic anaemia observed in patients deficient in glucose-6-phosphate
dehydrogenase.
The topical use of nitrofurazone may lead to allergic reactions.
Epidemiological studies are reported only for patients treated with nitrofurantoin, and
associations were found for cancers of the nervous system in adults, for drug-induced liver
injury and for increased risk of pulmonary adverse events in patients with renal impairment.
Nitrofurans in food
EFSA Journal 2015;13(6):4140 126
Considerations for derivation of a health-based guidance value
Because furazolidone is genotoxic and carcinogenic, the derivation of an health-based guidance
value (HBGV) is not appropriate. A BMDL10 value for bronchial adenocarcinomas in mice of
3.5 mg/kg b.w. per day (1.6 mg/kg b.w. per day, expressed as AOZ) was selected as a reference
point for carcinogenic effects.
Non-neoplastic effects of furazolidone and AOZ were found on red blood cell parameters and
enzymes in blood. The lowest BMDL was estimated for the effect of AOZ on ALP (BMDL05 of
0.02 mg/kg b.w. per day). The CONTAM Panel concluded that this value can be used as a
reference point for the risk characterisation for non-neoplastic effects.
Furaltadone is genotoxic and carcinogenic and therefore the derivation of an HBGV is not
appropriate. The CONTAM Panel concluded that the available data do not provide a suitable
basis for deriving a reference point. For AMOZ, there is no information on its carcinogenicity,
and the limited available data indicate that it is non-genotoxic in vitro. Therefore, the CONTAM
Panel concluded that the risk of its carcinogenicity cannot be assessed.
There is no information on non-neoplastic effects of furaltadone or AMOZ that could be used
for the derivation of a reference point.
Nitrofurantoin is genotoxic in vivo. Based on the limited evidence for its carcinogenicity, the
CONTAM Panel concluded that the compound should be considered genotoxic and
carcinogenic. Thus, the derivation of an HBGV for nitrofurantoin is not appropriate. A BMDL10
value for osteosarcomas in male rats of 61 mg/kg b.w. per day (29.5 mg/kg b.w. per day,
expressed as AHD) was selected as a reference point for carcinogenic effects.
For non-neoplastic effects, the most sensitive endpoint for nitrofurantoin is impaired
spermatogenesis, but the available data did not allow for a BMD analysis or the derivation of a
NOAEL. Effects were observed at the lowest dose tested of 10 mg/kg b.w. per day (4.8 mg/kg
b.w. per day, expressed as AHD) and this was selected as a reference point for non-neoplastic
effects. The CONTAM Panel noted that the effects at this dose are substantial.
Nitrofurazone is genotoxic in vitro but no conclusion could be drawn on its genotoxicity in vivo
and carcinogenicity. For SEM, which is genotoxic in vitro, the CONTAM Panel concluded that
it is carcinogenic in mice, but the available information was not suitable to derive a reference
point.
Non-neoplastic effects of nitrofurazone were found on the testes and the epididymis in rats,
while, for SEM, effects on bone development were observed. The lowest BMDL was estimated
for the effect of SEM on bone development (BMDL10 of 1.0 mg/kg b.w.). The CONTAM Panel
concluded that this value can be used as a reference point for the risk characterisation for non-
neoplastic effects.
For nifursol, there is no clear indication that it is carcinogenic; it is genotoxic in vitro but not in
vivo. For DNSH, there is no information on its mutagenicity/genotoxicity or carcinogenicity.
For non-neoplastic effects, a BMDL05 value for the effect on liver weight of 11 mg/kg b.w. per
day (7.3 mg/kg b.w. per day, expressed as DNSH) was selected as a reference point.
Risk characterisation
As different critical effects are observed for the different marker metabolites, the CONTAM
Panel characterised the risk for each marker metabolite separately.
For the actual exposure to nitrofuran marker metabolites, no reliable human dietary exposure
assessment could be carried out and, therefore, the CONTAM Panel could not characterise the
risk.
Nitrofurans in food
EFSA Journal 2015;13(6):4140 127
Evaluation whether a reference point for action of 1 µg/kg for nitrofuran metabolites as defined in the
legislation in food of animal origin is adequate to protect public health.
For AOZ, considering exposure scenario 1A, median chronic dietary exposure across dietary
surveys for the average consumer would result in a margin of exposure (MOE) for
carcinogenicity of about 2.9 × 10⁵ for toddlers and 6.2 × 10
5 for adults, and an MOE for non-
neoplastic effects of about 3.6 × 10³ for toddlers and 7.7 × 10
3 for adults. The CONTAM Panel
considered that, for AOZ, these MOEs for carcinogenicity and non-neoplastic effects are
sufficiently large and do not indicate a health concern.
The CONTAM Panel could not conclude on the carcinogenicity of the furaltadone marker
metabolite AMOZ. Given that there are no clear indications that furaltadone is more potent than
furazolidone with respect to the induction of mammary adenocarcinomas, the CONTAM Panel
concluded that the cancer risk of AMOZ, if any, would not be greater than that from AOZ and
hence does not indicate a health concern. The CONTAM Panel could not identify a reference
point for non-neoplastic effects for AMOZ.
For AHD, considering exposure scenario 1A, median chronic dietary exposure across dietary
surveys for the average consumer would result in an MOE for carcinogenicity of about 5.4 × 10⁶
for toddlers and 1.1 × 10⁷ for adults and an MOE for non-neoplastic effects of about 8.7 × 10
5
for toddlers and 1.8 × 10⁶ for adults. The CONTAM Panel considered that, for AHD, these
MOEs for carcinogenicity and non-neoplastic effects are sufficiently large and do not indicate a
health concern.
For SEM, the cancer risk could not be assessed. Considering exposure scenario 1A, median
chronic dietary exposure across dietary surveys for the average consumer would result in an
MOE for non-neoplastic effects of about 1.8 × 10⁵ for toddlers and 3.8 × 10
5 for adults. The
CONTAM Panel considered that, for SEM, these MOEs for non-neoplastic effects are
sufficiently large and do not indicate a health concern.
For DNSH, considering exposure scenario 1A, median chronic dietary exposure across dietary
surveys for the average consumer would result in an MOE for non-neoplastic effects of about
1.3 × 10⁶ for toddlers and 2.8 × 10
6 for adults. The CONTAM Panel considered that, for DNSH,
these MOEs for non-neoplastic effects are sufficiently large and do not indicate a health
concern.
Assessment of the appropriateness of applying the reference point for action that is considered adequate
to protect public health to other commodities than food of animal origin.
AOZ, AMOZ, AHD and DNSH have not been reported to occur in foods of non-animal origin.
Only SEM is reported to occur in foods of non-animal origin owing to its potential presence in
the food additive carrageenan, which is used in a large variety of foods. The food additive
carrageenan may also be used in foods of animal origin.
For SEM, the cancer risk could not be assessed. Considering exposure scenario 2C, median
chronic dietary exposure across dietary surveys for the average consumer would result in an
MOE for non-neoplastic effects of about 3.4 × 10⁴ for toddlers and 1.0 × 10
5 for adults. The
CONTAM Panel considered that, for SEM, these MOEs for non-neoplastic effects are
sufficiently large and do not indicate a health concern.
RECOMMENDATIONS
There is a need for a carcinogenicity study on SEM conducted in accordance with the current
guidelines. There is also a need for information on the mechanisms underlying the genotoxic
and carcinogenic effects of SEM.

Nitrofurans in food
EFSA Journal 2015;13(6):4140 128
DOCUMENTATION PROVIDED TO EFSA
1. Original study reports submitted to WHO for the risk assessment of furazolidone by the Joint
FAO/WHO Expert Committee on Food Additives (JECFA) in 1992 that were made available by
the data owner.
Halliday RP, Sutton ML, Sigler FW and Levin RA, 1973a. Chronic toxicopathological safety study
(two years) of NF-180 in rats. Unpublished final report project no 475.09-C d.d.
9 November 1973. Pathological and Toxicology Section, Norwich Pharmacal Company,
Norwich, New York, NY, USA, not published.
Halliday RP, Sutton ML and Sigler FW, 1973b. Tumorgenesis evaluation (lifetime) of NF-180 in
Sprague-Dawley and Fischer 344 rats. Unpublished interim report no 2 project no 475.09D
d.d. 9 November 1973. Part I: Sprague-Dawley evaluation. Pathological and Toxicology
Section, Norwich Pharmacal Company, Norwich, New York, NY, USA, not published.
Halliday RP, Sutton ML and Sigler FW, 1974. Tumorgenesis evaluation (twenty-three months) of
furazolidone (NF-180) in mice. Unpublished final report project no 475.09E d.d. 31 January
1974. Pathological and Toxicology Section, Research and Development Department,
Norwich Pharmacal Company, Norwich, New York, NY, USA, not published.
King CD, Sutton ML and Levin RA 1972a. Chronic toxicopathological safety study (two years) of
NF-180 in rats. Unpublished status report no 1 project no 475.09c d.d. 18 October 1972.
Pathological and Toxicology Section, Research and Development Department, Norwich
Pharmacal Company, Norwich, New York, NY, USA, not published.
King CD, Sutton ML, Wong LCK and Laughlin PJ, 1972b. Tumorgenesis evaluation (two years) of
NF-180 in Spraque-Dawley and Fischer 344 rats. Unpublished status report no 1 project no
475.09D d.d. 18 0ctober 1972. Pathological and Toxicology Section, Research and
Development Department, Norwich Pharmacal Company, Norwich, New York, NY, USA,
not published.
Mitchell JM, Trimmer JE, Areia D and Wessel JL, 1990a. Acute oral toxicity study of furazolidone
in rats. Unpublished report d.d. 5 July 1991 from project no 5884-90. Bio/Dynamics Inc.,
East Millstone, NJ, USA, not published.
Mitchell JM, Trimmer JE, Areia D and Wessel JL, 1990b. Acute oral toxicity study of furazolidone
in mice. Unpublished report d.d. 5 July 1991 from project no. 5885-90. Bio/Dynamics Inc.,
East Millstone, NJ, USA, not published.
Siedler AJ and Searfoss W, 1966. Effects of long-term feeding of various nitrofurans to rats.
Unpublished report problem no 440.07 d.d. 13 October 1966. Division of Chemotherapy,
Research and Development Department, Norwich Pharmacal Company, Norwich, New
York, NY, USA. Submitted to WHO by SmithKline Beecham Animal Health, West
Chester, PA, USA, not published.
Siedler AJ and Searfoss W, 1967. Effects of long-term feeding of various nitrofurans to rats.
Unpublished report problem no 440.07 d.d. 4 January 1976. Division of Chemotherapy,
Research and Developmental Department, Norwich Pharmacal Company, Norwich, New
York, NY, USA. Submitted to WHO by SmithKline Beecham Animal Health, West
Chester, PA, USA, not published.
2. Letter from Marinalg International received on 11 February 2015 in reply to EFSA’s request for
updated information on the formation and occurrence of semicarbazide in seaweeds used as a food
additive.
Nitrofurans in food
EFSA Journal 2015;13(6):4140 129
3. Original study report submitted to EFSA for the risk assessment of semicarbazide in food by the
AFC Panel in 2005, which was made available by the data owner.
CTL (Central Toxicology Laboratory), 2004. Semicarbazide: in vivo mouse liver unscheduled DNA
synthesis assay. CTL study no SM1207, not published.
4. Original study reports submitted to EFSA for the risk assessment of semicarbazide in food by the
AFC Panel in 2005, which was made available by the data owner.
Herbold B, 2003. Semicarbazide hydrochloride—Salmonella/microsome test plate incorporation
method. Bayer HealthCare Study no T 5072934, not published.
Herbold B, 2004. Semicarbazide hydrochloride. In vitro chromosome aberration test with Chinese
hamster V79 cells. Bayer HealthCare Study no AT01020, not published.
5. Original study reports submitted to the European Commission for the risk assessment of nifursol by
the SCAN in 2001 and 2003, which were made available by the data owner.
Allen JA and Proudlock RJ, 1987. Micronucleus test on nifursol. Company report, HRC Report No
PDR 455/878, Huntingdon Research Centre, Huntingdon, UK, not published.
Allen JA, Proudlock RJ and Birt DM, 1987. Analysis of metaphase chromosomes obtained from
bone marrow of rats treated with nifursol. Company report, HRC Report No PDR
458/87564, Huntingdon Research Centre, Huntingdon, UK, not published.
Ballantyne M, 2003. Nifursol®: evaluation of the possible induction of lacZ- mutations in tissues of
treated MutaTMMice, not published.
Benford DJ, 1987a. Nifursol: unscheduled DNA synthesis in hepatocytes and intestinal cells
following oral exposure of rats. Report No 10/87/TX, Robens Institute, University of
Surrey, Guildford, UK, not published.
Benford DJ, 1987b. Intestinal irritation by nifursol. Report No 18/87/TX, Robens Institute,
University of Surrey, Guildford, UK, not published.
Brüll LP, 2003. Determination of Nifursol® and metabolites in turkey skin, muscle, kidney and liver
using LC-TIS/MS/MS: depletion study sample analysis, not published.
Cavagnaro J and Cortina T, 1985a. In vitro chromosomal aberrations in Chinese hamster ovary cells
with nifursol. Company report, Hazleton Report No 186-110, not published.
Cavagnaro J and Cortina T, 1985b. In vitro chromosomal aberrations in Chinese hamster ovary cells
with nifursol (repeat test). Company report, Hazleton Report No 186-110, not published.
Cavagnaro J and McCarrol NE, 1985. Salmonella typhimurium/mammalian microsome plate
incorporation assay with compound nifursol. Company report, Hazleton Report No 186-
107, not published.
Cavagnaro J and Sernau RC, 1985. Final report: unscheduled DNA synthesis rat hepatocyte assay.
Company report, Hazleton Report No 186–109, not published.
Connelly J, 1988. Investigation of binding of nifursol to rat tissue DNA in vivo. Report No
11/87/TX, Robens Institute, University of Surrey, Guildford, UK, not published.

Nitrofurans in food
EFSA Journal 2015;13(6):4140 130
Dawes RLF, 1988. Nifursol—analysis of benign tumours. Company report, Internal Document No
56645/86/88, Duphar B.V., Weesp, Netherlands, not published.
George GM, Frahm LJ and McDonnell JP, 1973. Depletion of nifursol residues in turkey tissue
from birds medicated with 75 ppm nifursol. Report No TR-37473. Pharmaceutical
Development and Analysis Department, Salsbury Laboratories, Charles City, IA, USA, not
published.
Green SI, 1980. Mutagenicity testing of nifursol using Ames’ test system as performed by M+E
consultants, 35 Dean Hill, Plymouth PL9 9AF, dated Jan 1980. Company report, Wickham
Laboratories, Wickham, UK, not published.
Jorgenson TA, 1967. Three generation reproduction study in rats. Company report, Project No 145,
Test No RRT-35-67. Salsbury Laboratories, Research Division, Charles City, IA, not
published.
Kan CA, 2003. A Nifursol® depletion study in turkeys, not published.
Lozano JA and Morrison JL, undated. The metabolism of nifursol (3,5-dinitrosalicylic acid 5-
nitrofurfurylidene hydrazine) in the turkey and rat. Company report, Salsbury Laboratories,
Research Division, Charles City, IA, USA, not published.
Rude TA, 1970b. Pathology associated with a chronic oral toxicity test of nifursol given
continuously in the feed of dogs for two years. Company report, Project No 145, Test No
DCT-3567. Salsbury Laboratories, Research Division, Charles City, IA, USA, not
published.
Rude TA, 1970c. Rat chronic toxicity: chronic oral toxicity study of nifursol given continuously in
the feed of rats for two years and 3 months (27 months). Company report, Project No 145,
Test No RCT-3567. Salsbury Laboratories, Research Division, Charles City, IA, USA, not
published.
van Kolfschoten, 1988. Review of the genotoxic potential of nifursol. Company report, Internal
Document No 56645/74/88, Duphar B.V., Weesp, Netherlands, not published.
Wood JD, Coleman M, Heywood R, Street AE, Gopinath C, Jolly DW, Gibson WA and Anderson
A, 1984. Nifursol toxicity to rats by continuous dietary administration for 13 weeks
followed by a 4-week withdrawal period (final report). Company report, HRC Report No
SLY 3/84961, Huntingdon Research Centre, Huntingdon, UK, not published.
6. Original study reports submitted to EMA for the risk assessment of furazolidone by the Committee
for Veterinary Medicinal Products (CVMP) in 1995, which were made available by the data owner.
Brinck P, Damm Jørgensen K and Skydsgaard M, 1995. 3-amino-oxazolidinone-2, 3-month oral
(dietary) toxicity study in the dog, not published.
de Groot AJL and van Zeeland AA, 1994. Evaluation of the formation of DNA adducts by 3-amino-
oxazolidinone-2 in male mouse liver (in vivo assay), not published.
NOTOX, 1994a. Assessment of acute oral toxicity with 3-amino-5(4-morphomethyl)-2-
oxazolidinon in the rat. NOTOX project 107696, not published.
NOTOX, 1994b. Assessment of acute oral toxicity with 3-amino-oxazolidinone-2 in the rat.
NOTOX project 107663 22/04/1994, not published.

Nitrofurans in food
EFSA Journal 2015;13(6):4140 131
NOTOX, 1994c. Evaluation of the ability of 3-amino-5(4-morphomethyl)-2-oxazolidinon to induce
chromosome aberrations in cultured peripheral human lymphocytes (with independent
repeat) NOTOX project 107685, not published.
NOTOX, 1994d. Evaluation of the ability of 3-amino-oxazolidinone-2 to induce chromosome
aberrations in cultured peripheral human lymphocytes (with independent repeat) NOTOX
project 107652, not published.
NOTOX, 1994e. Evaluation of the mutagenic activity of 3-amino-5(4-morphomethyl)-2-
oxazolidinon in the Ames Salmonella/microsome test and the Escherichia coli/microsome
test (with independent repeat). NOTOX project 107674, not published.
NOTOX, 1994f. Evaluation of the mutagenic activity of 3-amino-oxazolidinone-2 in the Ames
Salmonella/microsome test and the Escherichia coli/microsome test (with independent
repeat) NOTOX project 107641, not published.
NOTOX, 1994g. Micronucleus test in bone marrow cells of the mouse with 3-amino-oxazolidinone-
2. Notox project 127057, not published.
NOTOX, 1994h. Micronucleus test in bone marrow cells of the mouse with 3-amino-oxazolidinone-
2. Notox project 130196, not published.
NOTOX, 1995a. 14-day dietary dose range finding study with 3-amino-oxazolidinone-2 in the rat.
Notox project 129307, not published.
NOTOX, 1995b. 90-day dietary toxicity study with 3-amino-oxazolidinone-2 in the rat. NOTOX
project 129757, not published.
RCC NOTOX B.V., 1990a. Evaluation of the mutagenic activity of furaltadone hydrochloride in an
in vitro mammalian cell gene mutation test with L5178Y mouse lymphoma cells (with
independent repeat) RCC NOTOX project 059039, not published.
RCC NOTOX B.V., 1990b. Evaluation of the mutagenic activity of furazolidone in an in vitro
mammalian cell gene mutation test with L5178Y mouse lymphoma cells (with independent
repeat) RCC NOTOX project 059028, not published.
7. Data on usage levels of carrageenan (E407). Submitted to EFSA by nine data providers.

Nitrofurans in food
EFSA Journal 2015;13(6):4140 132
REFERENCES
Abraham RT, Knapp JE, Minnigh MB, Wong LK, Zemaitis MA and Alvin JD, 1984. Reductive
metabolism of furazolidone by Escherichia coli and rat liver in vitro. Drug Metabolism and
Disposition, 12, 732–741.
Abramsson-Zetterberg L and Svensson K, 2005. Semicarbazide is not genotoxic in the flow cytometry-
based micronucleus assay in vivo. Toxicology Letters, 155, 211–217.
Adkison KK, Vaidya SS, Lee DY, Koo SH, Li L, Mehta AA, Gross AS, Polli JW, Lou Y and Lee EJ,
2008. The ABCG2 C421A polymorphism does not affect oral nitrofurantoin pharmacokinetics in
healthy Chinese male subjects. British Journal of Clinical Pharmacology, 66, 233–239.
Akao M, Kuroda K, Kanisawa M and Miyaki K, 1971. Influence of some nitrofurans on carcinogenesis
in rats fed 4-(dimethylamino) azobenzene. GANN Japanese Journal of Cancer Research, 62, 479–
484.
Akinshina LP, Tanirbergenov TB, Bobrinev EV and Zolotareva GN, 1992. Genotoxicity of 5-nitrofuran
derived medicines in 2 bacterial short-term assays. Genetika, 28, 89–98.
Altamirano A and Bondani A, 1989. Adverse reactions to furazolidone and other drugs. A comparative
review. Scandinavian Journal of Gastroenterology 169 (Suppl.), 70–80.
An H, Henry M, Cain T, Tran B, Paek HC and Farley D, 2012. Determination of total nitrofuran
metabolites in shrimp muscle using liquid chromatography/tandem mass spectrometry in the
atmospheric pressure chemical ionization mode. Journal of AOAC International, 95, 1222–1233.
Anderson D and Phillips BJ, 1985. Nitrofurazone–genotoxicity studies in mammalian cels in vitro and
in vivo. Food and Chemical Toxicology, 23, 1091–1098.
Aperia AC and Liebow AA, 1964. Implications of urine PO2 for renal medullary blood flow. American
Journal of Physiology, 206, 499–504.
Aracena P, Lazo-Hernandez C, Molina-Berrios A, Sepulveda DR, Reinoso C, Larrain JI, Navarro J and
Letelier ME, 2014. Microsomal oxidative stress induced by NADPH is inhibited by nitrofurantoin
redox biotranformation. Free Radical Research, 48, 129–136.
Ardsoongnearn C, Boonbanlu O, Kittijaruwattana S and Suntornsuk L, 2014. Liquid chromatography
and ion trap mass spectrometry for simultaneous and multiclass analysis of antimicrobial residues in
feed water. Journal of Chromatography B, 945, 31–38.
Ask K, Décologne N, Asare N, Holme JA, Artur Y, Pelczar H and Camus P, 2004. Distribution of
nitroreductive activity toward nilutamide in rat. Toxicology and Applied Pharmacology, 201, 1–9.
Aufrère MB, Hoener BA and Vore M, 1978. Reductive metabolism of nitrofurantoin in the rat. Drug
Metabolism and Disposition, 6, 403–411.
Babile R, Queinnec G, Berland HM and Darre R, 1978. Chromosome structure of pig lymphocytes and
food additives. Comptes Rendus des Seances de la Société de Biologie et de ses Filiales, 172, 546–
553.
Bajaj AK and Gupta SC, 1986. Contact Hypersensitivity to Topical Antibacterial Agents. International
Journal of Dermatology, 25, 103–105.
Barbosa J, Ferreira ML, Ramos F and da Silveira MIN, 2007a. Determination of the furaltadone
metabolite 5-methylmorpholino-3-amino-2-oxazolidinone (AMOZ) using liquid chromatography
coupled to electrospray tandem mass spectrometry during the nitrofuran crisis in Portugal.
Accreditation and Quality Assurance, 12, 543–551.
Barbosa J, Moura S, Barbosa R, Ramos F and da Silveira MIN, 2007b. Determination of nitrofurans in
animal feeds by liquid chromatography-UV photodiode array detection and liquid chromatography-
ionspray tandem mass spectrometry. Analytica Chimica Acta, 586, 359–365.

Nitrofurans in food
EFSA Journal 2015;13(6):4140 133
Barbosa J, Freitas A, Moura S, Mour o L, Noronha da Silveira MI and Ramos F, 2011. Detection,
accumulation, distribution, and depletion of furaltadone and nifursol residues in poultry muscle,
liver, and gizzard. Journal of Agricultural and Food Chemistry, 59, 11927–11934.
Barbosa , Freitas A, Mour o L, Noronha da Silveira MI and Ramos F, 2012. Determination of
furaltadone and nifursol residues in poultry eggs by liquid chromatography–electrospray ionization
tandem mass spectrometry. Journal of Agricultural and Food Chemistry, 60, 4227–4234.
Barragán Hernández EÁ, Herrera Montalvo LA, Ocampo Camberos L and Sumano López H, 2011.
Genotoxicidad de la furazolidona y la forma libre de su metabolito 3-amino-2-oxazolidona, mediante
la prueba de micronúcleos en linfocitos humanos. Veterinaria México, 42, 289–298.
Becalski A, Lau BP-Y, Lewis D and Seaman SW, 2004. Semicarbazide formation in azodicarbonamide-
treated flour: a model study. Journal of Agricultural and Food Chemistry, 52, 5730–5734.
Behar A, Rachmilewitz E, Rahamimoff R and Denman M, 1965. Experimental nitrofurantoin
polyneuropathy in rats. Early histological and electro physiological alterations in peripheral nerves.
Archives of Neurology, 13, 160–163.
Bellomonte G, Filesi C, Macri A, Mosca M and Sanzini E, 1993. High performance liquid
chromatographic determination of nitrofurans and free chloramphenicol in poultry muscle, liver and
eggs. Italian Journal of Food Science, 5, 247–253.
Bertenyi KK and Lambert IB, 1996. The mutational specificity of furazolidone in the lacI gene of
Escherichia coli. Mutation Research, 357, 199–208.
BgVV (Bundesinstitut fuer gesundheitlichen Verbraucherschutz und Veterinaermedizin), 2002.
Gesundheitliche Bewertung von Nitrofuranen in Lebensmitteln. Stellungnahme des BgVV, 1–3.
Bignami M, Morpurgo G, Pagliani R, Carere A, Conti G and Di Giuseppe G, 1974. Non-disjunction and
crossing-over induced by pharmaceutical drugs in Aspergillus nidulans. Mutation
Research/Fundamental and Molecular Mechanisms of Mutagenesis, 26, 159–170.
Björnsson E, Talwalkar J, Treeprasertsuk S, Kamath PS, Takahashi N, Sanderson S, Neuhauser M and
Lindor K, 2010. Drug-induced autoimmune hepatitis: clinical characteristics and prognosis.
Hepatology, 51, 2040–2048.
Bock C, Stachel C and Gowik P, 2007. Validation of a confirmatory method for the determination of
residues of four nitrofurans in egg by liquid chromatography-tandem mass spectrometry with the
software InterVal. Analytica Chimica Acta, 586, 348–358.
Boelsterli UA, Ho HK, Zhou S and Leow KY, 2006. Bioactivation and hepatotoxicity of nitroaromatic
drugs. Current Drug Metabolism, 7, 715–727.
Borghoff SJ, Prescott JS, Janszen DB, Wong BA and Everitt JI, 2001. Alpha 2u-Globulin nephropathy,
renal cell proliferation, and dosimetry of inhaled tert-butyl alcohol in male and female F-344 rats.
Toxicological Sciences, 61, 176–186.
Borroto JIG, Machado GP, Creus A and Marcos R, 2005. Comparative genotoxic evaluation of 2-
furylethylenes and 5-nitrofurans by using the comet assay in TK6 cells. Mutagenesis 20, 193–197.
Borsa M, Bulletti GM and Zoni G, 1976. Nitrofurantoin: dimensions of crystals and biologic
availability. Bollettino chimico farmaceutico, 115, 483–488
Botsoglou NA and Fletouris DJ (eds), 2001. Drug residues in foods: pharmacology, food safety, and
analysis. CRC Press, Taylor & Francis Group, London, 1149 pp.
Böttiger LE and Westerholm B, 1977. Adverse drug reactions during treatment of urinary tract
infections. European Journal of Clinical Pharmacology, 11, 439–442.
Boyd MR, Stiko AW and Sasame HA, 1979. Metabolic activation of nitrofurantoin–possible
implications for carcinogenesis. Biochemical Pharmacology, 28, 601–606.

Nitrofurans in food
EFSA Journal 2015;13(6):4140 134
Brander GC, Pugh DM, Bywater RJ and Jenkins WL, 1991. Veterinary applied pharmacology and
therapeutics. Baillière Tindall, London, 624 pp.
Brayfield A (ed.), 2014. Martindale: The complete drug reference. 38th Edition. Pharmaceutical Press,
London, UK, 4688 pp.
Brumfitt W and Hamilton-Miller JM, 1998. Efficacy and safety profile of long-term nitrofurantoin in
urinary infections: 18 years’ experience. Journal of Antimicrobial Chemotherapy, 42, 363–371.
Butler WH, Graham TC and Sutton ML, 1990a. Chronic toxicity and oncogenicity studies of
macrodantin in Sprague-Dawley rats. Food and Chemical Toxicology, 28, 269–277.
Butler WH, Graham TC and Sutton ML, 1990b. Oncogenicity study of macrodantin in Swiss mice.
Food and Chemical Toxicology, 28, 49–54.
Buzard JA and Conklin JD, 1964. Placental transfer of nitrofurantoin and furaltadone. American Journal
of Physiology, 206, 189–192.
Buzard JA, Conklin JD, O’Keefe E and Paul MF, 1961. Studies on the absorption, distribution and
elemination of nitrofurantoin in the rat. Journal of Pharmacology and Experimental Therapeutics,
131, 38–43.
Buzard JA, Paul MF and Vrablic DM, 1956. Colorimetric determination of nitrofurazone,
nitrofurantoin, and furazolidone in plasma. Antibiotics and Chemotherapy, 6, 702–707.
Calafatti SA, Ortiz RA, Deguer M, Martinez M and Pedrazzoli J Jr, 2001. Effect of acid secretion
blockade by omeprazole on the relative bioavailability of orally administered furazolidone in healthy
volunteers. British Journal of Clinical Pharmacology, 52, 205–209.
Callen DF, 1981. Comparison of the genetic activity of AF-2 and nitrofurantoin in log and stationary
phase cells of saccharomyces cerevisiae. Environmental Mutagenesis, 3, 651–658.
Carlsson Forslund L, 2014. Risk evaluation of nitrofurans in animal food products. Degree project in
biology, Biology Education Centre, Uppsala University, and the Swedish National Food Agency,
109 pp.
Chadfield MS and Hinton MH, 2003. Evaluation of treatment and prophylaxis with nitrofurans and
comparison with alternative antimicrobial agents in experimental Salmonella enterica Serovar
enteritidis infection in chicks. Veterinary Research Communications, 27, 257–273.
Chadseesuwan U, Puthong S, Gajanandana O, Palaga T and Komolpis K, 2013. Development of an
enzyme-linked immunosorbent assay for 1-aminohydantoin detection. Journal of AOAC
International, 96, 680–686.
Chalasani N, Fontana RJ, Bonkovsky HL, Watkins PB, Davern T, Serrano J, Yang H and Rochon J,
2008. Causes, clinical features, and outcomes from a prospective study of drug-induced liver injury
in the United States. Gastroenterology, 135, 1924–1934.
Chang C, Peng D-P, Wu J-E, Wang Y-L and Yuan Z-H, 2008. Development of an indirect competitive
ELISA for the detection of furazolidone marker residue in animal edible tissues. Journal of
Agricultural and Food Chemistry, 56, 1525–1531.
Chatterjee SN, Banerjee SK, Pal AK and Basak J, 1983. DNA damage, prophage induction and
mutation by furazolidone. Chemico-Biological Interactions, 45, 315–326.
Cheng CC, Hsieh KH, Lei YC, Tai YT, Chang TH, Sheu SY, Li WR and Kuo TF, 2009. Development
and residue screening of the furazolidone metabolite, 3-amino-2-oxazolidinone (AOZ), in cultured
fish by an enzyme-linked immunosorbent assay. Journal of Agricultural and Food Chemistry, 57,
5687–5692.
Cheng KC, Cahill DS, Kasai H, NishimuraS and Loeb LA, 1992. 8-hydroxyguanine, an abundant form
of oxidative DNA damage, causes G-> T and A -> C substitutions. Journal of Biological chemistry,
267, 166–172.
Nitrofurans in food
EFSA Journal 2015;13(6):4140 135
Chu P-S and Lopez MI 2005 Liquid chromatography-tandem mass spectrometry for the determination
of protein-bound residues in shrimp dosed with nitrofurans. Journal of Agricultural and Food
Chemistry, 53, 8934–8939.
Chu P-S, Lopez MI, Abraham A, El Said KR and Plakas SM, 2008. Residue depletion of nitrofuran
drugs and their tissue-bound metabolites in channel catfish (Ictalurus punctatus) after oral dosing.
Journal of Agricultural and Food Chemistry, 56, 8030–8034.
Chu P-S and Lopez MI, 2007. Determination of nitrofuran residues in milk of dairy cows using liquid
chromatography-tandem mass spectrometry. Journal of Agricultural and Food Chemistry, 55, 2129–
2135.
Chumanee S, Sutthivaiyakit S and Sutthivaiyakit P, 2009. New reagent for trace determination of
protein-bound metabolites of nitrofurans in shrimp using liquid chromatography with diode array
detector. Journal of Agricultural and Food Chemistry, 57, 1752–1759.
Cohen MM and Sagi M, 1979. The effect of nitrofurans on mitosis, chromosome breakage and sister-
chromatid exchanges in human peripheral lymphocytes. Mutation Research, 59, 139–142.
Cohen SM, Ertűrk F, Van Esch AM, Crovetti A and Bryan GT, 1973. Carcinogenicity of 5-nitrofurans,
5-nitroimidazoles, 4-nitrobenzenes and related compounds. Journal of the National Cancer Institute,
51, 403–417.
Conklin JD and Hailey FJ, 1969. Urinary drug excretion in man during oral dosage of different
nitrofurantoin formulations. Clinical Pharmacology and Therapeutics, 10, 534-539.
Conneely A, Nugent A, O’Keeffe M, Mulder PPJ, van Rhijn JA, Kovacsics L, Fodor A, McCracken RJ
and Kennedy DG, 2003. Isolation of bound residues of nitrofuran drugs from tissue by solid-phase
extraction with determination by liquid chromatography with UV and tandem mass spectrometric
detection. Analytica Chimica Acta, 483, 91–98.
Cooper KM and Kennedy DG, 2005. Nitrofuran antibiotic metabolites detected at parts per million
concentrations in retina of pigs—a new matrix for enhanced monitoring of nitrofuran abuse. Analyst,
130, 466–468.
Cooper KM and Kennedy DG, 2007. Stability studies of the metabolites of nitrofuran antibiotics during
storage and cooking. Food Additives and Contaminants, 24, 935–942.
Cooper KM, Elliott CT and Kennedy DG, 2004. Detection of 3-amino-2-oxazolidinone (AOZ), a tissue-
bound metabolite of the nitrofuran furazolidone, in prawn tissue by enzyme immunoassay. Food
Additives and Contaminants, 21, 841–848.
Cooper K, Mulder PJ, Van Rhijn J, Kovacsics L, McCracken R, Young P and Kennedy D, 2005.
Depletion of four nitrofuran antibiotics and their tissue-bound metabolites in porcine tissues and
determination using LC-MS/MS and HPLC-UV. Food Additives and Contaminants, 22, 406–414.
Cooper KM, Le J, Kane C and Kennedy DG, 2008a. Kinetics of semicarbazide and nitrofurazone in
chicken eggs and egg powders. Food Additives and Contaminants, 25, 684–692.
Cooper KM, McCracken RJ, Buurman M and Kennedy DG, 2008b. Residues of nitrofuran antibiotic
parent compounds and metabolites in eyes of broiler chickens. Food Additives and Contaminants,
25, 548–556.
Cooper KM, Samsonova JV, Plumpton L, Elliott CT and Kennedy DG, 2007. Enzyime immunoassay
for semicarbazide – The nitrufuran metabolite and food contaminant. Analytica Chimica Acta, 592,
64–71.
Coraggio MJ, Gross TP and Roscelli JD, 1989. Nitrofurantoin toxicity in children. Pediatric Infectious
Disease Journal, 8, 163–166.
Crews C, 2014. Potential natural sources of semicarbazide in honey. Journal of Apicultural Research,
53, 129–140.

Nitrofurans in food
EFSA Journal 2015;13(6):4140 136
Cunha BA, 1988. Nitrofurantoin—current concepts. Urology, 32, 67–71.
Czeizel AE, Rockenbauer M, Sorensen HT and Olsen J, 2001. Nitrofurantoin and congenital
abnormalities. European Journal of Obstetrics, Gynecology, and Reproductive Biology, 95, 119–126.
Dalvie DK, Kalgutkar AS, Khojasteh-Bakht SC, Obach RS and O’Donnell JP, 2002. Biotransformation
reactions of five-membered aromatic heterocyclic rings. Chemical Research in Toxicology, 15, 269–
99.
D’Arcy PF, 1985. Nitrofurantoin. Drug Intelligence and Clinical Pharmacy, 19, 540–547.
De Angelis I, Rossi L, Pedersen JZ, Vignoli AL, Vincentini O, Hoogenboom LA, Polman TH,
Stammati A and Zucco F, 1999. Metabolism of furazolidone: alternative pathways and modes of
toxicity in different cell lines. Xenobiotica, 29, 1157–1169.
De Flora S, 1979. Metabolic activation and deactivation of mutagens and carcinogens. Italian Journal of
Biochemistry, 28, 81–103.
De Flora S, 1981. Study of 106 organic and inorganic compounds in the Salmonella/microsome test.
Carcinogenesis, 2, 283–298.
De Flora S, Zanacchi P, Camoirano A, Bennicelli C and Badolati GS, 1984. Genotoxic activity and
potency of 135 compounds in the Ames reversion test and in a bacterial DNA-repair test. Mutation
Research, 133, 161–198.
De la Calle MB and Anklam E, 2005. Semicarbazide: occurrence in food products and state-of-the-art in
analytical methods used for its determination. Analytical and Bioanalytical chemistry, 382, 968–977.
De la Calle MB and Szilagyi S, 2006. Determination of semicarbazide in fresh egg and whole egg
powder by liquid chromatography/tandem mass spectrometry: interlaboratory validation study.
Journal of AOAC International, 89, 1664–1671.
de la Fuente del Rey M, 1986. Teratogenic effect of semicarbazide in Wistar rats. Biology of the
Neonate, 49, 150–157.
de la Fuente M, Hernanz A and Alia M, 1983a. Effect of semicarbazide on the surfactant phospholipid
percentages during fetal and postnatal lung development in rat. Comparative Biochemistry and
Physiology C, 74, 115–118.
de la Fuente M, Hernanz A and Alia M, 1983b. Effect of semicarbazide on the perinatal development of
the rat: changes in DNA, RNA and protein content. Methods and Findings in Experimental and
Clinical Pharmacology, 5, 287–297.
de la Fuente M, Hernanz A and Alia M, 1983c. Effects of semicarbazide on DNA, RNA and protein
hepatic levels on four subsequent generations of Wistar rats. Comparative Biochemistry and
Physiology C, 74, 447–450.
Degroodt JM, De Bukanski BW, De Groof J, Beernaert H and Srebrnk S, 1992. Chloramphenicol and
nitrofuran residue analysis by HPLC and photodiode array detection in meat and fish. Journal of
Liquid Chromatography, 15, 2355–2371.
Diblikova I, Cooper KM, Kennedy DG and Franek M, 2005. Monoclonal antibody-based ELISA for the
quantification of nitrofuran metabolite 3-amino-2-oxazolidinone in tissues using a simplified sample
preparation. Analytica Chimica Acta, 540, 285–292.
Dimitrieska-Stojkovic E, Arsova G, Hajrulai-Musliu Z, Stojanovska-Dimzoska B, Uzunov R, Todorovic
A and Stojkovic G, 2012. In-house validation and quality control of commercial enzyme-linked
immunosorbnet assays for screening of nitrofuran metabolites in food of animal origin. Macedonian
Veterinary Review, 35, 13–21.
Dodd MC, 1946. The chemotherapeutic properties of 5-nitro-2-furaldehyde semicarbazone (furacin).
Journal of Pharmacology and Experimental Therapeutics, 86, 311–323.

Nitrofurans in food
EFSA Journal 2015;13(6):4140 137
Douny C, Widart J, De Pauw E, Silvestre F, Kestemont P, Tu HT, Phuong NT, Maghuin-Rogister G and
Scippo M-L, 2013. Development of an analytical method to detect metabolites of nitrofurans:
application to the study of furazolidone elimination in Vietnamese black tiger shrimp (Penaeus
monodon). Aquaculture, 376, 54–58.
Du NN, Chen MM, Sheng LQ, Chen SS, Xu HJ, Liu ZD, Song CF and Qiao R, 2014. Determination of
nitrofuran metabolites in shrimp by high performance liquid chromatography with fluorescence
detection and liquid chromatography-tandem mass spectrometry using a new derivatization reagent.
Journal of Chromatography A, 31, 90–96.
Edder P, Vargas S, Ortelli D and Corvi C, 2003. Analysis of nitrofuran metabolites in food by high-
performance liquid chromatography with tandem mass spectrometry detection. Clinical Chemistry
and Laboratory Medicine, 41, 1608–1614.
EFSA (European Food Safety Authority), 2005. Opinion of the Scientific Panel on Food Additives,
Flavourings, Processing Aids and Materials in Contact with Food on a request from the Commission
related to semicarbazide in food. The EFSA Journal 2005, 219, 1–36.
EFSA (European Food Safety Authority), 2009. Guidance of the Scientific Committee on a request
from EFSA on the use of the benchmark dose approach in risk assessment. The EFSA Journal 2009,
1150, 1–72.
EFSA (European Food Safety Authority), 2011a. Evaluation of the FoodEx, the food classification
system applied to the development of the EFSA Comprehensive European Food Consumption
Database. EFSA Journal 2011;9(3):1970, 22 pp. doi:10.9203/j.efsa.2011.1970
EFSA (European Food Safety Authority), 2011b. Use of the EFSA Comprehensive European Food
Consumption Database in exposure assessment. EFSA Journal 2011;9(3):2097, 34 pp.
doi:10.2903/j.efsa.2011.2097
EFSA CONTAM Panel (EFSA Panel on Contaminants in the Food Chain), 2013. Guidance on
methodological principles and scientific methods to be taken into account when establishing
Reference Points for Action (RPAs) for non-allowed pharmacologically active substances present in
food of animal origin. EFSA Journal, 2013;11(4):3195, 24 pp. doi:10.2903/j.efsa.2013.3195
EFSA SC (EFSA Scientific Committee), 2011. Scientific opinion on genotoxicity testing strategies
applicable to food and feed safety assessment. EFSA Journal 2011;9(9):2379, 69 pp.
doi:10.2903/j.efsa.2011.2379
EFSA SC (EFSA Scientific Committee), 2012. Guidance on selected default values to be used by the
EFSA Scientific Committee, Scientific Panels and Units in the absence of actual measured data.
EFSA Journal 2012;10(3):2579, 32 pp. doi:10.2903/j.efsa.2012.2579
EMA (European Agency for the Evaluation of Medicinal Products), 1996. Committee for Veterinary
Medicinal Products: Nitrofurans. Summary Report, Veterinary Medicines Evaluation Unit, 1–2.
EMA (European Agency for the Evaluation of Medicinal Products), 1997. Committee for Veterinary
Medicinal Products: Furazolidone. Summary Report, Veterinary Medicines Evaluation Unit, 1–3.
Epstein SS, Arnold E, Andrea J, Bass W and Bishop Y, 1972. Detection of chemical mutagens by the
dominant lethal assay in the mouse. Toxicology and Applied Pharmacology, 23, 288–325.
Ertürk E, Morr JE, Cohen SM, Price JM and Bryan GT, 1970. Transplantable rat mammary tumors
induced by 5-nitro-2-furaldehyde semicarbazone and by formic acid 2-[4-(5-nitro-2-furyl)–2-
thiazolyl] hydrazide. Cancer Research, 30, 1409–1412.
FAO (Food and Agriculture Organization of the United Nations), 2005. Fishery Information Data and
Statistics Unit. FISHSTAT+Databases and Statistics. Rome, Italy, Food and Agriculture
Organization of the United Nations.

Nitrofurans in food
EFSA Journal 2015;13(6):4140 138
FAO/WHO (Food and Agriculture Organization of the United Nations/World Health Organization),
1993a. Toxicological evaluation of certain veterinary drug residues in food. Furazolidone. WHO
Food Additives Series, 31.
FAO/WHO (Food and Agriculture Organization of the United Nations/World Health Organization),
1993b. Toxicological evaluation of certain veterinary drug residues in food. Nitrofural
(nitrofurazone). WHO Food Additives Series, 31.
FAO/WHO (Food and Agriculture Organization of the United Nations/World Health Organization),
1993c. Evaluation of certain veterinary drug residues in food. Fortieth report of the Joint FAO/WHO
Expert Committee on Food Additives. Furazolidone. WHO Technical Report Series, 832, 32–37.
FAO/WHO (Food and Agriculture Organization of the United Nations/World Health Organization),
1993d. Evaluation of certain veterinary drug residues in food. Fortieth report of the Joint FAO/WHO
Expert Committee on Food Additives. Nitrofural (nitrofurazone). WHO Technical Report Series,
832, 37–40.
FAO/WHO (Food and Agriculture Organization of the United Nations/World Health Organization),
1993e. Residues of some veterinary drugs in animals and foods. Furazolidone. FAO Food and
Nutrition paper, 41/5, 87–103.
FAO/WHO (Food and Agriculture Organization of the United Nations/World Health Organization),
1993f. Residues of some veterinary drugs in animals and foods. Nitrofurazone. FAO Food and
Nutrition paper, 41/5, 105–112.
FAO/WHO (Food and Agriculture Organization of the United Nations/World Health Organization),
2009. Principles and methods for the risk assessment of chemicals in food. Environmental Health
Criteria 240.
Fau D, Berson A, Eugene D, Fromenty B, Fisch C and Pessayre D, 1992. Mechanism for the
hepatotoxicity of the antiandrogen, nilutamide. Evidence suggesting that redox cycling of this
nitroaromatic drug leads to oxidative stress in isolated hepatocytes. Journal of Pharmacology and
Experimental Therapeutics, 263, 69–77.
Finzi JK, Donato JL, Sucupira M and De Nucci G, 2005. Determination of nitrofuran metabolites in
poultry muscle and eggs by liquid chromatography-tandem mass spectrometry. Journal of
Chromatography B, 824, 30–35.
Fonatsch C, 1977. Effect of nitrofurantoin on meiosis of the male mouse. Human Genetics, 39, 345–
351.
Franek M, Diblikova I, Vass M, Kotkova L, Stastny K, Frgalova K and Hruska K, 2006. Validation of a
monoclonal antibody-based ELISA for the quantification of the furazolidone metabolite (AOZ) in
eggs using various sample preparation. Veterinarni Medicina, 51, 248–257.
FSA (Food Standards Agency), 2002. Results of the Department of Agriculture and Rural Development
testing programme for nitrofuran in chicken sampled from cold stores. FSA, London, UK.
FSANZ (Food Standards Australia New Zealand), 2004. Nitrofurans in prawns. A toxicological review
and risk assessment. Technical Report Series No 31. Available at: http://www.foodstandards.gov.au/
publications/documents/31_Nitrofurans%20in%20prawns_edit.pdf
Fucić A, Marković D, Ferencić Z, Mildner B, azbec AM and Spoljar B, 2005. Comparison of genomic
damage caused by 5-nitrofurantoin in young and adult mice using the in vivo micronucleus assay.
Environmental and Molecular Mutagenesis, 46, 59–63.
Gao N, Ni YC, Thornton-Manning JR, Fu PP and Heflich RH, 1989. Mutagenicity of nitrofurantoin and
furazolidone in Chinese hamster ovary cell strains. Mutation Research, 225, 181–187.
Geerts AF, Eppenga WL, Heerdink R, Derijks HJ, Wensing MJ, Egberts TC and De Smet PA, 2013.
Ineffectiveness and adverse events of nitrofurantoin in women with urinary tract infection and renal
impairment in primary care. European Journal of Clinical Pharmacology, 69, 1701–1707.
Nitrofurans in food
EFSA Journal 2015;13(6):4140 139
George JD, Fail PA, Grizzle TB and Heindel JJ, 1996. Nitrofurazone: reproductive assessment by
continuous breeding in Swiss mice. Fundamental and Applied Toxicology, 34, 56–66.
Gerk PM, Kuhn RJ, Desai NS and McNamara PJ, 2001. Active transport of nitrofurantoin into human
milk. Pharmacotherapy, 21, 669–675.
Gerk PM, Moscow JA and McNamara PJ, 2003. Basolateral active uptake of nitrofurantoin in the CIT3
cell culture model of lactation. Drug Metabolism and Disposition, 31, 691–693.
Glascock HW Jr, MacLeod PF, Davis JB, Cuddihy RV and Anzlowar BR, 1969. Is nitrofurazone a
primary irritant or a potent sensitizer? A review of the literature, 1945–1965, and cases reported to
the medical director. Review of Allergy, 23, 52–58.
Gleckman R, Alvarez S and Joubert DW, 1979. Drug therapy reviews: nitrofurantoin. American Journal
of Hospital Pharmacy, 36, 342–351.
Goldenthal EI, 1971. A compilation of LD50 values in newborn and adult animals. Toxicology and
Applied Pharmacology, 18, 185–207.
Goodman DR, Hakkinen PJ, Nemenzo JH and Vore M, 1977. Mutagenic evaluation of nitrofuran
derivatives in Salmonella typhimurium, by the micronucleus test, and by in vivo cytogenetics.
Mutation Research/Fundamental and Molecular Mechanisms of Mutagenesis, 48, 295–305.
Gottschall DW and Wang R, 1995. Depletion and bioavailability of [14
C]furazolidone residues in swine
tissues. Journal of Agricultural and Food Chemistry, 43, 2520–2525.
Grave K, Engelstad M, Søli NE and Håstein T, 1990. Utilization of antibacterial drugs in salmonid
farming in Norway during 1980–1988. Aquaculture, 86, 347–358.
Grave K, Markestad A and Bangen M, 1996. Comparison in prescribing patterns of antibacterial drugs
in salmonid farming in Norway during the periods 1980–1988 and 1989–1994. Journal of Veterinary
Pharmacology and Therapeutics, 19, 184–191.
Green MHL, Rogers AM, Muriel WJ, Ward AC and McCalla DR, 1977. Use of a simplified fluctuation
test to detect and characterize mutagenesis by nitrofurans. Mutation Research, 44, 139–143.
Guinebault PR, Broquaire M and Theboult JJ, 1981. Comptes-redus proceedings. Technique et
Documentation. Proceedings of the First European Congress of Biopharmacy and Pharmacokinetics,
Paris, France, 151–158.
Guo JJ, Chou HN and Chiu Liao I, 2003. Disposition of 3-(4-cyano-2-oxobutylidene amino)-2-
oxazolidone, a cyano-metabolite of furazolidone, in furazolidone-treated grouper. Food Additives
and Contaminants, 20, 229–236.
Hagenäs L, Ploen L and Ritzen EM, 1978. The effect of nitrofurazone on the endocrine, secretory and
spermatogenic functions of the rat testis. Andrologia, 10, 107–126.
Hardin BD, Schuler RL, Burg JR, Booth GM, Hazelden KP, MacKenzie KM, Piccirillo VJ and Smith
KN, 1987. Evaluation of 60 chemicals in a preliminary developmental toxicity test. Teratogenesis,
Carcinogenesis, and Mutagenesis, 7, 29–48.
Heaton LH and Post G, 1968. Tissue residue and oral safety of furazolidone in four species of trout. The
Progressive Fish-Culturist, 30, 208–215.
Hirakawa K, Midorikawa K, Oikawa S, Kawanishi S, 2003. Carcinogenic semicarbazide induces
sequence-specific DNA damage through the generation of reactive oxygen species and the
derived organic radicals. Mutation Research 536 (2003) 91–101.
Hiraku Y, Sekine A, Nabeshi H, Midorikawa K, Murata M, Kumagai Y and Kawanishi S, 2004.
Mechanism of carcinogenesis induced by a veterinary antimicrobial drug, nitrofurazone, via
oxidative DNA damage and cell proliferation. Cancer Letters, 215, 141-150.
Hoener B and Patterson SE, 1981. Nitrofurantoin disposition. Clinical Pharmacology and Therapeutics,
29, 808–816.

Nitrofurans in food
EFSA Journal 2015;13(6):4140 140
Hoener BA, 1988. Nitrofurazone: kinetics and oxidative stress in the singlepass isolated perfused rat
liver. Biochemical Pharmacology, 37, 1629–1636.
Hoenicke K, Gatermann R, Hartig L, Mandix M and Otte S, 2004. Formation of semicarbazide (SEM)
in food by hypochlorite treatment: is SEM a specific marker for nitrofurazone abuse? Food Additives
and Contaminants, 21, 526–537.
Holmberg L and Boman G, 1981. Pulmonary reactions to nitrofurantoin. 447 cases reported to the
Swedish Adverse Drug Reaction Committee 1966–1976. European Journal of Respiratory Diseases,
62, 180–189.
Holmberg L, Boman G, Bottiger LE, Eriksson B, Spross R and Wessling A, 1980. Adverse reactions to
nitrofurantoin. Analysis of 921 reports. American Journal of Medicine, 69, 733–738.
Hoogenboom LAP and Polman THG, 1993. Simultaneous detection of protein bound residues of the
nitrofuran drugs furazolidone, furaltadone, nitrofurazone and nitrofurantoin. Proceedings of the
Residues of Veterinary Drugs in Food: EuroResidue II Conference, Utrecht, Netherlands, 376–381.
Hoogenboom LA, Oorsprong MB, van Vliet T and Kuiper HA, 1991a. The use of pig hepatocytes for
cytotoxicity studies of veterinary drugs: a comparative study with furazolidone and other nitrofurans.
Toxicology In Vitro, 5, 31–38.
Hoogenboom LA, Tomassini O, Oorsprong MB and Kuiper HA, 1991b. Use of pig hepatocytes to study
the inhibition of monoamine oxidase by furazolidone. Food and Chemical Toxicology, 29, 185–191.
Hoogenboom LA, van Kammen M, Berghmans MC, Koeman JH and Kuiper HA, 1991c. The use of pig
hepatocytes to study the nature of protein-bound metabolites of furazolidone: a new analytical
method for their detection. Food and Chemical Toxicology, 29, 321–328.
Hoogenboom LA, Berghmans MC, Polman TH, Parker R and Shaw IC, 1992a. Depletion of protein-
bound furazolidone metabolites containing the 3-amino-2-oxazolidinone side-chain from liver,
kidney and muscle tissues from pigs. Food Additives and Contaminants, 9, 623–630.
Hoogenboom LA, van Kammen M, Huveneers-Oorsprong MB and Kuiper HA, 1992b. Study on the
role of glutathione in the biotransformation and toxicity of furazolidone using pig hepatocytes.
Toxicology In Vitro, 6, 227–237.
Hoogenboom LA, Polman TH, Lommen A, Huveneers MB and van Rhijn J, 1994. Biotransformation of
furaltadone by pig hepatocytes and Salmonella typhimurium TA 100 bacteria, and the formation of
protein-bound metabolites. Xenobiotica, 24, 713–727.
Hoogenboom LA, van Bruchem GD, Sonne K, Enninga IC, van Rhijn JA, Heskamp H, Huveneers-
Oorsprong MB, van der Hoeven JC and Kuiper HA, 2002. Absorption of a mutagenic metabolite
released from protein-bound residues of furazolidone. Environmental Toxicology and Pharmacology,
11, 273–287.
Horne E, Cadogan A, O’Keeffe M and Hoogenboom LA, 1996. Analysis of protein-bound metabolites
of furazolidone and furaltadone in pig liver by high-performance liquid chromatography and liquid
chromatography-mass spectrometry. Analyst, 121, 1463–1468.
Hossain M, Ahmed S, Rahman M, Kamaruzzaman B, Jalal K and Amin S, 2013. Method development
and validation of nitrofuran metabolites in shrimp by liquid chromatographic mass spectrometric
system. Journal of Biological Sciences, 13.
Hu XZ, Xu Y and Yediler A, 2007. Determinations of residual furazolidone and its metabolite, 3-
amino-2-oxazolidinone (AOZ), in fish feeds by HPLC-UV and LC-MS/MS, respectively. Journal of
Agricultural and Food Chemistry, 55, 1144–1149.
Huber WG, 1982. Nitrofuran derivatives. In: Veterinary Pharmacology and Therapeutics. Eds Booth
NH and McDonald LE. Iowa State University Press, Ames, IA, USA, 767.

Nitrofurans in food
EFSA Journal 2015;13(6):4140 141
Hunt RH, Xiao SD, Megraud F, Leon-Barua R, Bazzoli F, van der Merwe S, Vaz Coelho LG, Fock M,
Fedail S, Cohen H, Malfertheiner P, Vakil N, Hamid S, Goh KL, Wong BC, Krabshuis J and Le
Mair A, 2011. Helicobacter pylori in developing countries. World Gastroenterology Organisation
Global Guideline. Journal of Gastrointestinal and Liver Diseases, 20, 299-304.
Hurtaud-Pessel D, Verdon E, Blot J and Sanders P, 2006. Proficiency study for the determination of
nitrofuran metabolites in shrimps. Food Additives and Contaminants, 23, 569–578.
Huybrechts I, Sioen I, Boon PE, Ruprich J, Lafay L, Turrini A, Amiano P, Hirvonen T, De Neve M,
Arcella D, Moschandreas J, Westerlund A, Ribas-Barba L, Hilbig A, Papoutsou S, Christensen T,
Oltarzewski M, Virtanen S, Rehurkova I, Azpiri M, Sette S, Kersting M, Walkiewicz A, Serra-
Majem L, Volatier JL, Trolle E, Tornaritis M, Busk L, Kafatos A, Fabiansson S, De Henauw S and
Van Klaveren JD, 2011. Dietary exposure assessments for children in Europe (the EXPOCHI
project): rationale, methods and design. Archives of Public Health, 69, 4. doi:10.1186/0778-7367-
1169-1184
IARC (International Agency for Research on Cancer), 1974. IARC Monographs on the Evaluation of
Carcinogenic Risk of Chemicals to Man. Vol 7. 5-(Morpholinomethyl)-3-[(5-
nitrofurfurylidene)amino]-2-oxazolidinone. IARC Press, Lyon, France, 161–169.
IARC (International Agency for Research on Cancer), 1976. IARC Monographs on the Evaluation of
Cercinogenic Risk of Chemicals to Man. Some carbamates, thiocarbamates and carbazides. IARC
Press, Lyon, France, 12.
IARC (International Agency for Research on Cancer), 1983. IARC Monograph on the Evaluation of
Carcinogenic Risk of Chemicals to Humans. Vol. 31. Furazolidone. IARC Press, Lyon, France. 141–
151.
IARC (International Agency for Research on Cancer), 1987. IARC Monographs on the Evaluation of
Carcinogenic Risk to Humans. Overall evaluations of carcinogenicity: an updating of IARC
monographs volumes 1 to 42, supplement 7. 449 pp.
IARC (International Agency for Research on Cancer), 1990a. IARC Monographs on the Evaluation of
Carcinogenic Risks to Humans. Vol 50. Nitrofurantoin. IARC Press, Lyon, France, 211–231.
IARC (International Agency for Research on Cancer), 1990b. IARC Monographs on the Evaluation of
Carcinogenic Risks to Humans. Vol. 50. Nitrofural (nitrofurazone). IARC Press, Lyon, France. 195–
209.
Ito A NM, Naito Y and Watanabe H, 1983. Tumorigenicity test of N-(5-nitro-2-furfurylidene)–1-
aminohydantoin by dietary administration in BDF1 mice. Hiroshima Journal of Medicine, 32, 99–
102.
Ito K, Ishida K, Takeuchi A, Nii A, Okamiya H and Doi K, 2002. Nitrofurazone induces non-
regenerative hepatocyte proliferation in rats. Experimental and Toxicologic Pathology, 53, 421–426.
Ito K, Sasaki S, Yoshida K, Nii A, Okamiya H and Sakai T, 2000. Collaborative work to evalutae
toxicity on male reproductive organs by repeated dose studies in rats 20) testicular toxicity of
nitrofurazone after 2 and 4 weeks. Journal of Toxicological Sciences, 25, 195–201.
Jackson D and Robson JM, 1957. The action of furazolidone on pregnancy. Journal of Endocrinology,
15, 355–359.
Jenney EH and Pfeiffer CC, 1958. The convulsant effect of hydrazides and the antidotal effect of
anticonvulsants and metabolites. Journal of Pharmacology and Experimental Therapeutics, 122, 110–
123.
Jester EL, Abraham A, Wang Y, El Said KR and Plakas SM, 2014. Performance evaluation of
commercial ELISA kits for screening of furazolidone and furaltadone residues in fish. Food
Chemistry, 145, 593–598.

Nitrofurans in food
EFSA Journal 2015;13(6):4140 142
Jia Q, Yu S, Cheng N, Wu L, Jia J, Xue X and Cao W, 2014. Stability of nitrofuran residues during
honey processing and nitrofuran removal by macroporous adsorption resins. Food Chemistry, 162,
110–116.
Jin X, Tang S, Chen Q, Zou J, Zhang T, Liu F, Zhang S, Sun C and Xiao X, 2011. Furazolidone induced
oxidative DNA damage via up-regulating ROS that caused cell cycle arrest in human hepatoma G2
cells. Toxicology Letters, 201, 205–212.
Jonen HG, Oesch F and Platt KL, 1980. 4-Hydroxylation of nitrofurantoin in the rat. A 3-
methylcholanthrene-inducible pathway of a relatively nontoxic compound. Drug Metabolism and
Disposition, 8, 446–451.
Kahlson G and Rosengren E, 1959. Prevention of foetal development by enzyme inhibition. Nature,
184, 1238–1239.
Kari FW, Huff JE, Leininger J, Haseman JK and Eustis SL, 1989. Toxicity and carcinogenicity of
nitrofurazone in F344/N rats and B6C3F1 mice. Food and Chemical Toxicology, 27, 129–137.
Karpman E and Kurzrock EA, 2004. Adverse reactions of nitrofurantoin, trimethoprim and
sulfamethoxazole in children. Journal of Urology, 172, 448–453.
Kaufmann A, Butcher P, Maden K and Widmer M, 2004. LC-MS-MS method for determining nifursol
and other nitrofuran residues in meat. Mitteilungen aus Lebensmitteluntersuchung und Hygiene, 95,
135–146.
Kedderis GL and Miwa GT, 1988. The metabolic activation of nitroheterocyclic therapeutic agents.
Drug Metabolism Review, 19, 33–62.
Kennedy DG, Young PB and McCraken RJ, 2003. Analysis of veterinary drug residues in food: the
nitrofuran issue. Mitteilungen aus Lebensmitteluntersuchung und Hygiene, 94, 510–526.
Khong SP, Gremaud E, Richoz J, Delatour T, Guy PA, Stadler RH and Mottier P, 2004. Analysis of
matrix-bound nitrofuran residues in worldwide-originated honeys by isotope dilution high-
performance liquid chromatography-tandem mass spectrometry. Journal of Agricultural and Food
Chemistry, 52, 5309–5315.
Kijima A, Ishii Y, Takasu S, Matsushita K, Kuroda K, Hibi D, Suzuki Y, Nohmi T and Umemura T,
2015. Chemical structure-related mechanisms underlying in vivo genotoxicity induced by
nitrofurantoin and its constituent moieties in gpt delta rats. Toxicology, 331, 125-135.
Klee S, Baumung I, Kluge K, Ungemach FR, Horne E, O’Keeffe M, De Angelis I, Vignoli AL, Zucco F
and Stammati A, 1999. A contribution to safety assessment of veterinary drug residues: in vitro/ex
vivo studies on the intestinal toxicity and transport of covalently bound residues. Xenobiotica, 29,
641–654.
Kramers PG, 1982. Studies on the induction of sex-linked recessive lethal mutations in Drosophila
melanogaster by nitroheterocyclic compounds. Mutation Research, 101, 209–236.
Krantz JC Jr and Evans WE Jr, 1945. A contribution to the pharmacology of 5-nitro-2-furaldehyde
semicarbazone. Journal of Pharmacology and Experimental Therapeutics, 85, 324–331.
Krongpong L, Futami K, Katagiri T, Endo M and Maita M, 2008. Application of ELISA-based kit for
detecting AOZ and determining its clearance in eel tissues. Fisheries Science, 74, 1055–1061.
Law FC and Meng J, 1996. Binding of 14
C-furazolidone metabolites to the muscular and hepatic
proteins of trout. Food Additives and Contaminants, 13, 199–209.
Lax D and Kukolich SG, 1992. Generation of furazolidone radical anion and its inhibition by
glutathione. Biochemical Medicine and Metabolic Biology, 48, 56–63.
Leitner A, Zöllner P and Lindner W, 2001. Determination of the metabolites of nitrofuran antibiotics in
animal tissue by high-performance liquid chromatography–tandem mass spectrometry. Journal of
Chromatography A, 939, 49–58.
Nitrofurans in food
EFSA Journal 2015;13(6):4140 143
Levin RM, Lavkar RM, Monson FC, Witowski BA, Wein AJ, Hanno PM and Ruggieri MR, 1988.
Effect of chronic nitrofurantoin on the rabbit urinary bladder. Journal of Urology, 139, 400–404.
Li J, Liu JX and Wang JP, 2009. Multidetermination of four nitrofurans in animal feeds by a sensitive
and simple enzyme-linked immunosorbent assay. Journal of Agricultural and Food Chemistry, 57,
2181–2185.
Li J, Liu J, Zhang H-C, Li H and Wang J-P, 2010. Broad specificity indirect competitive immunoassay
for determination of nitrofurans in animal feeds. Analytica Chimica Acta, 678, 1–6.
Li Y, Han J, Wang Y, Ma J, Yan Y and Cao L, 2013. Optimization of extraction and determination of
chloramphenicol in livestock meat samples using aqueous two-phase system of n-propanol and
potassium citrate coupled with HPLC. Journal of the Brazilian Chemical Society, 24, 669–674.
Liao IC, Guo JJ and Su M, 2000. The use of chemicals in aquaculture in Taiwan, Province of China. In:
Use of chemicals in aquaculture in Asia. Eds Arthur JR, Lavilla-Pitogo CR Subasinghe RP.
Proceedings of the Meeting on the Use of Chemicals in Aquaculture in Asia, Tigbauan, Iloilo,
Philippines, 193–205.
Liu W, Kou J, Jiang X, Zhang Z and Qi H, 2012a. Determination of nitrofurans in feeds based on silver
nanoparticle-catalyzed chemiluminescence. Journal of Luminescence, 132, 1048–1054.
Liu Y, Huang L, Wang Y, Yang B, Ishan A, Fang K, Peng D, Liu Z, Dai M and Yuan Z, 2010a. Tissue
depletion and concentration correlations between edible tissues and biological fluids of 3-amino-2-
oxazolidinone in pigs fed with a furazolidone-medicated feed. Journal of Agricultural and Food
Chemistry, 58, 6774–6779.
Liu Y, Peng D, Huang L, Wang Y, Chang C, Ihsan A, Tao Y, Yang B and Yuan Z, 2010b. Application
of a modified enzyme-linked immunosorbent assay for 3-amino-2-oxazolidinone residue in aquatic
animals. Analytica Chimica Acta, 664, 151–157.
Liu YC, Jiang W, Chen YJ, Xiao Y, Shi JL, Qiao YB, Zhang HJ, Li T and Wang Q, 2013. A novel
chemiluminescent ELISA for detecting furaltadone metabolite, 3-amino-5-morpholinomethyl-2-
oxazolidone (AMOZ) in fish, egg, honey and shrimp samples. Journal of Immunological Methods,
395, 29–36.
Liu Y-T, Ai X-H, Suo W-W, Yu S-M and Yang Q-H, 2012b. Tissue distribution and elimination rules
of the metabolite (AOZ) of furazolidone residues in Ietalurus punetaus. Freshwater Fisheries, 42,
38–44.
Lopez MI, Feldlaufer MF, Williams AD and Chu PS, 2007. Determination and confirmation of
nitrofuran residues in honey using LC-MS/MS. Journal of Agricultural and Food Chemistry, 55,
1103–1108.
Lu C, McCalla DR and Bryant DW, 1979. Action of nitrofurans on E. coli: mutation and induction and
repair of daughter-strand gaps in DNA. Mutation Research, 67, 133–144.
Luo PJ, Jiang WX, Beier RC, Shen JZ, Jiang HY, Miao H, Zhao YF, Chen X and Wu YN, 2012.
Development of an enzyme-linked immunosorbent assay for determination of the furaltadone
etabolite, 3-amino-5-morpholinomethyl-2-oxazolidinone (AMOZ) in animal tissues. Biomedical and
Environmental Sciences, 25, 449–457.
Madrigal-Bujaidar E, Ibanez JC, Cassani M and Chamorro G, 1997. Effect of furazolidone on sister-
chromatid exchanges, cell proliferation kinetics, and mitotic index in vivo and in vitro. Journal of
Toxicology and Environmental Health, 51, 89–96.
Mandell GL and Sande MA, 1985. Antimicrobial agents. In: The Pharmacological Basis of
Therapeutics, ed 7. Eds Gilman AG, Goodman LS, Rall TW and Murad F. MacMillan Publishing
Co, New York, USA, 1095–1114.
Männistö P, 1978. The effect of crystal size, gastric content and emptying rate on the absorption of
nitrofurantoin in healthy human volunteers. Int J Clin Pharmacol Biopharm, 16, 223–228.

Nitrofurans in food
EFSA Journal 2015;13(6):4140 144
Maranghi F, Tassinari R, Lagatta V, Moracci G, Macri C, Eusepi A, Di Virgilio A, Scattoni ML and
Calamandrei G, 2009. Effects of food contaminant semicarbazide following oral administration in
juvenile Sprague-Dawley rats. Food and Chemical Toxicology, 47, 472–479.
Maranghi F, Tassinari R, Marcoccia D, Altieri I, Catone T, De Angelis G, Testai E, Mastrangelo S,
Evandri MG, Bolle P and Lorenzetti S, 2010. The food contaminant semicarbazide acts as an
endocrine disrupter: Evidence from an integrated in vivo/in vitro approach. Chemico-Biological
Interactions, 183, 40–48
Matsuoka A, Hayashi M and Ishidate M, 1979. Chromosomal aberration tests on 29 chemicals
combined with S9 mix in vitro. Mutation Research, 66, 277–290.
McCalla DR, Reuvers A and Kaiser C, 1971. Breakage of bacterial DNA by nitrofuran derivatives.
Cancer Research, 31, 2184–2188.
McCalla DR and Voutsinos D, 1974. On the mutagenicity of nitrofurans. Mutation Research, 26, 3–16.
McCalla DR, Voutsinos D and Olive PL, 1975. Mutagen screening with bacteria: niridazole and
nitrofurans. Mutation Research, 31, 31–37.
McCracken RJ and Kennedy DG, 1997. The bioavailability of residues of the furazolidone metabolite 3-
amino-2-oxazolidinone in porcine tissues and the effect of cooking upon residue concentrations.
Food Additives and Contaminants, 14, 507–513.
McCracken RJ and Kennedy DG, 2007. Detection, accumulation and distribution of nitrofuran residues
in egg yolk, albumen and shell. Food Additives and Contaminants, 24, 26–33.
McCracken RJ, Blanchflower WJ, Rowan C, McCoy MA and Kennedy DG, 1995. Determination of
furazolidone in porcine tissue using thermospray liquid chromatography-mass spectrometry and a
study of the pharmacokinetics and stability of its residues. Analyst, 120, 2347–2351.
McCracken RJ, McCoy MA and Kennedy DG, 1997. The prevalence and possible causes of bound and
extractable residues of the furazolidone metabolite 3-amino-2-oxazolidinone in porcine tissues. Food
Additives and Contaminants, 14, 287–294.
McCracken RJ, Spence DE, Floyd SD and Kennedy DG, 2001. Evaluation of the residues of
furazolidone and its metabolite, 3-amino-2-oxazolidinone (AOZ), in eggs. Food Additives and
Contaminants, 18, 954–959.
McCracken RJ, Van Rhijn JA and Kennedy DG, 2005a. The occurrence of nitrofuran metabolites in the
tissues of chickens exposed to very low dietary concentrations of the nitrofurans. Food Additives and
Contaminants, 22, 567–572.
McCracken RJ, Van Rhijn JA and Kennedy DG, 2005b. Transfer of nitrofuran residues from parent
broiler breeder chickens to broiler progeny. British Poultry Science, 46, 287–292.
McCracken R, Hanna B, Ennis D, Cantley L, Faulkner D and Kennedy DG, 2013. The occurrence of
semicarbazide in the meat and shell of Bangladeshi fresh-water shrimp. Food Chemistry, 136, 1562–
1567.
McMahon RE, Cline JC and Thompson CZ, 1979. Assay of 855 test chemicals in ten tester strains using
a new modification of the Ames test for bacterial mutagens. Cancer Research, 39, 682–693.
Mercado C, Molina F, Navas J, Quinones C and Eylar EH, 1991. Inhibition of T cell mitogenesis by
nitrofurans. Biochemical Pharmacology, 41, 503–508.
Merino G, Jonker JW, Wagenaar E, van Herwaarden AE and Schinkel AH, 2005. The breast cancer
resistance protein (BCRP/ABCG2) affects pharmacokinetics, hepatobiliary excretion, and milk
secretion of the antibiotic nitrofurantoin. Molecular Pharmacology, 67, 1758–1764.
Merino G, Perez M, Real R, Egido E, Prieto JG and Alvarez AI, 2010. In vivo inhibition of
BCRP/ABCG2 mediated transport of nitrofurantoin by the isoflavones genistein and daidzein: a
comparative study in Bcrp1 (-/-) mice. Pharmaceutical Research, 27, 2098–2105.

Nitrofurans in food
EFSA Journal 2015;13(6):4140 145
Miller C, Folkes LK, Mottley C, Wardman P and Mason RP, 2002. Revisiting the interaction of the
radical anion metabolite of nitrofurantoin with glutathione. Archives of Biochemistry and
Biophysics, 397, 113–118.
Miyaji T, 1971. Acute and chronic toxicity of furylfuramide in rats and mice. Tohoku Journal of
Experimental Medicine, 103, 331–369.
Miyaji T, Miyamoto M and Ueda Y, 1964. Inhibition of spermatogenesis and atrophy of the testis
caused by nitrofuran compounds. Acta Pathologica Japonica, 14, 261–273.
Montemurro DG, 1960. The effect of nitrofurazone on the testes and accessory sex organs of normal
rats and rats bearing the Walker carcinoma 256. British Journal of Cancer, 14, 319–326.
Moreno SN, Mason RP and Docampo R, 1984. Reduction of nifurtimox and nitrofurantoin to free
radical metabolites by rat liver mitochondria. Evidence of an outer membrane-located nitroreductase.
Journal of Biological Chemistry, 259, 6298–6305.
Mori K, Yasuno A and Matsumoto K, 1960. Induction of pulmonary tumors in mice with isonicotinic
acid hydrazid. GANN Japanese Journal of Cancer Research, 51, 83–90.
Morris JE, Price JM, Lalich JJ and Stein RJ, 1969. The carcinogenic activity of some 5-nitrofuran
derivatives in the rat. Cancer Research, 29, 2145–2156.
Mottier P, Khong S-P, Gremaud E, Richoz J, Delatour T, Goldmann T and Guy PA, 2005. Quantitative
determination of four nitrofuran metabolites in meat by isotope dilution liquid chromatography–
electrospray ionisation–tandem mass spectrometry. Journal of Chromatography A, 1067, 85–91.
Muaksang K, 2009. Development of reference methods and reference materials for trace level antibiotic
residues in food using IDMS. PhD thesis, University of New South Wales, Sydney, Australia.
303 pp.
Mulder P, Zuidema T, Keestra N, Kooij P, Elbers I and Van Rhijn J, 2005. Determination of nifursol
metabolites in poultry muscle and liver tissue. Development and validation of a confirmatory
method. Analyst, 130, 763–771.
Murakami E, Ishii J, Muneta S, Hiwada K and Kokubu T, 1989. Blood pressure elevation caused by
inhibition of brain glutathione reductase. Journal of Hypertension, 7(Suppl.), S24–S25.
Nesterenko I VE, Filippova K, Komarov A, Panin AN, 2012. Development of a direct competitive
ELISA for the detection of furazolidone metabolite in foodstuff of animal origin. Journal of
Veterinary Pharmacology and Therapeutics, 35, 91.
Ni YC, Heflich RH, Kadlubar FF and Fu PP, 1987. Mutagenicity of nitrofurans in Salmonella
typhimurium TA98, TA98NR and TA98/1,8-DNP6. Mutation Research, 192, 15–22.
NIOSH (National Institute for Occupational Safety and Health), 1983. Registry of toxic effects of
chemical substances, Vol. 2, as cited by NTP, 1989.
Nishimura T, Aze Y and Ozeki Y, 1995. Effects of nitrofurazone on spermatogenesis and reproductive
toxicity in male rats—part of a collaborative work to determine optimal administration period and
endpoints. Journal of Toxicological Sciences, 20, 341–349.
Nomura T, Kimura S, Kanzaki T, Tanaka H, Shibata K, Nakajima H, Isa Y, Kurokawa N, Hatanaka T,
Kinuta M, Masada K and Sakamote Y, 1984. Induction of tumors and malformations in mice after
prenatal treatment with some antibiotic drugs. Medical Journal of Osaka University, 35, 13–17.
Nordeng H, Lupattelli A, Romoren M and Koren G, 2013. Neonatal outcomes after gestational exposure
to nitrofurantoin. Obstetrics and Gynecology, 121, 306–313.
Nouws JF and Laurensen J, 1990. Postmortal degradation of furazolidone and furaltadone in edible
tissues of calves. Veterinary Quarterly, 12, 56–59.

Nitrofurans in food
EFSA Journal 2015;13(6):4140 146
NTP (National Toxicology Program), 1985. Teratologic evaluation of nitrofurazone (CAS No 59-87-0)
administered to CD-1 mice on gestational days 6 through 15. National Toxicology Program/Research
Triangle Institute Report NTP-85–335.
NTP (National Toxicology Program), 1987. Teratologic evaluation of nitrofurazone (CAS No 59-87-0)
administered to New Zealand white rabbits on gestational days 6 through 19. National Toxicology
Program/National Institute of Environmental Health Sciences Report NTP-87–200.
NTP (National Toxicology Program), 1988. Toxicological and carcinogenesis studies of nitrofurazone
in F344/N rats and B6C3F1 Mice. National Toxicology Program Technical Report Series No 337.
NTP (National Toxicology Program), 1989. Toxicological and carcinogenesis studies of nitrofurantoin
in F344/N rats and B6C3F1 Mice. National Toxicology Program Technical Report Series No 341.
Nuñez-Vergara LJ, Sturm JC, Olea-Azar C, Navarrete-Encina P, Bollo S and Squella JA, 2000.
Electrochemical, UV-visible and EPR studies on nitrofurantoin: nitro radical anion generation and its
interactions with glutathione. Free Radical Research, 32, 399–409.
O’Keeffe M, Conneely A, Cooper KM, Kennedy DG, Kovacsics L, Fodor A, Mulder PPJ, van Rhijn JA
and Trigueros G, 2004. Nitrofuran antibiotic residues in pork: The FoodBRAND retail survey.
Analytica Chimica Acta, 520, 125–131.
O’Mahony J, Moloney M, McConnell RI, el Benchikh O, Lowry P, Furey A and Danaher M, 2011.
Simultaneous detection of four nitrofuran metabolites in honey using a multiplexing biochip
screening assay. Biosensors and Bioelectronics, 26, 4076–4081.
Obaseiki-Ebor EE and Akerele JO, 1986. Nitrofuran mutagenicity: induction of frameshift mutations.
Mutation Research Letters, 175, 149–152.
Okura T, Ibe M, Umegaki K, Shinozuka K and Yamada S, 2010. Effects of dietary ingredients on
function and expression of P-glycoprotein in human intestinal epithelial cells. Biological &
Pharmaceutical Bulletin, 33, 255–259.
Olive PL and McCalla DR, 1975. Damage to mammalian cell DNA by nitrofurans. Cancer Research,
35, 781–784.
Ong TM, 1977. Mutagenic activities of nitrofurans in Neurospora crassa. Mutation Research, 56, 13–
20.
Oo CY, Paxton EW and McNamara PJ, 2001. Active transport of nitrofurantoin into rat milk. Advances
in Experimental Medicine and Biology, 501, 547–552.
Paik SG, 1985. Micronucleus induction in mouse bone marrow cells of some nitrofuran 5
nitroimidazole and nitrothiazole derivatives used as trichomonacides in Korea. Environmental
Mutagens and Carcinogens, 5, 61–72.
Pal AK, Rahman MS and Chatterjee SN, 1992. On the induction of umu gene expression in Salmonella
typhimurium strain TA1535/pSK1002 by some nitrofurans. Mutation Research, 280, 67–71.
Palaniyappan V, Nagalingam AK, Ranganathan HP, Kandhikuppam KB, Kothandam HP and Vasu S,
2013. Microwave-assisted derivatisation and LC-MS/MS determination of nitrofuran metabolites in
farm-raised prawns (Penaeus monodon). Food Additives and Contaminants, 30, 1739–1744.
Palm D, Magnus U, Grobecker H and Jonsson J, 1967. Hemmung der Monoaminoxydase durch
bakteriostatisch wirksame Nitrofuran-Derivate. Naunyn-Schmiedebergs Archiv für Pharmakologie
und Experimentelle Pathologie, 256, 281–300.
Park YH, Hwang SY, Hong MK and Kwon KH, 2012. Use of antimicrobial agents in aquaculture.
Revue scientifique et technique—International Office of Epizootics, 31, 189–197.

Nitrofurans in food
EFSA Journal 2015;13(6):4140 147
Parodi S, Pala M, Russo P, Balbi C, Abelmoschi ML, Taningher M, Zunino A, Ottaggio L, de Ferrari
M, Carbone A and Santi L, 1983. Alkaline DNA fragmentation, DNA disentanglement evaluated
viscosimetrically and sister chromatid exchanges, after treatment in vivo with nitrofurantoin.
Chemico-Biological Interactions, 45, 77–94.
Paul HE, Ells VR, Kopko F and Bender RC, 1960a. Metabolic Degradation of the Nitrofurans. Journal
of Medicinal and Pharmaceutical Chemistry, 2, 563-584.
Paul HE and Paul MF, 1964. The nitrofurans chemotherapeutic properties. Vol 2, Part 1. Eds Schnitzer
RJ and Hawking F. Academic Press, New York, NY, USA, 307–370.
Paul HE, Paul MF and Kopko F, 1952. Effect of furacin (5-nitro-2-furaldehyde semicarbazone) on the
in vitro metabolism of mammalian tissues. Proceedings of the Society for Experimental Biology and
Medicine, 79, 555–558.
Paul HE, Paul MF, Kopko F, Bender RC and Everett G, 1953. Carbohydrate metabolism studies on the
testis of rats fed certain nitrofurans. Endocrinology, 53, 585–592.
Paul MF, Bryson MJ and Harrington C, 1956. Effect of furacin on pyruvate metabolism. Journal of
Biological Chemistry, 219, 463–471.
Paul MF, Paul HE, Bender RC, Kopko F, Harrington CM, Ells VR and Buzard JA, 1960b. Studies on
the distribution and excretion of certain nitrofurans. Antibiotica et Chemotherapia, 10, 287–302.
Pereira AS, Donato JL and De Nucci G, 2004. Implications of the use of semicarbazide as a metabolic
target of nitrofurazone contamination in coated products. Food Additives and Contaminants, 21, 63–
69.
Pérez M, Real R, Mendoza G, Merino G, Prieto JG and Alvarez AI, 2009. Milk secretion of
nitrofurantoin, as a specific BCRP/ABCG2 substrate, in assaf sheep: modulation by isoflavones.
Journal of Veterinary Pharmacology and Therapeutics, 32, 498–502.
Perry JE and Leblanc AL, 1967. Transfer of nitrofurantoin across the human placenta. Texas Reports on
Biology and Medicine, 25, 265–269.
Peterson FJ, Mason RP, Hovsepian J, Holtzman JL, 1979. Oxygen-sensitive and -insensitive
nitroreduction by Escherichia coli and rat hepatic microsomes. Journal of Biological Chemistry
1979, 254:4009–4014.
Peterson FJ, Combs GF, Holtzman JL and Mason RP, 1982. Effect of selenium and Vitamin E
deficiency on nitrofurantoin toxicity in the chick. Journal of Nutrition, 112, 1741–1746.
Pietruszka K, Olejinik M and Sell B, 2007. Development and validation of a liquid chromatography
method for the determination of nitrofurans in water. Bulletin of the Veterinary Institute in Pulawy,
51, 267–270.
Pimpitak U, Putong S, Komolpis K, Petsom A and Palaga T, 2009. Development of a monoclonal
antibody-based enzyme-linked immunosorbent assay for detection of the furaltadone metabolite,
AMOZ, in fortified shrimp samples. Food Chemistry, 116, 785–791.
Plakas SM, el Said KR and Stehly GR, 1994. Furazolidone disposition after intravascular and oral
dosing in the channel catfish. Xenobiotica, 24, 1095–1105.
Points J, Thorburn Burns D and Walker MJ, 2015. Forensic issues in the analysis of trace nitrofuran
veterinary residues in food of animal origin. Food Control, 50, 92–103.
Polnaszek CF, Peterson FJ, Holtzman JL and Mason RP, 1984. No detectable reaction of the anion
radical metabolite of nitrofurans with reduced glutathione or macro-molecules. Chemico-Biological
Interactions, 51, 263–271.
Prytherch JP, Sutton ML and Denine EP, 1984. General reproduction, perinatal-postnatal, and
teratology studies of nitrofurantoin macrocrystals in rats and rabbits. Journal of Toxicology and
Environmental Health, 13, 811–823.

Nitrofurans in food
EFSA Journal 2015;13(6):4140 148
Quillardet P, Arrault X, Michel V and Touati E, 2006. Organ-targeted mutagenicity of nitrofurantoin in
Big Blue transgenic mice. Mutagenesis, 21, 305–311.
Radovnikovic A, Moloney M, Byrne P and Danaher M, 2011. Detection of banned nitrofuran
metabolites in animal plasma samples using UHPLC–MS/MS. Journal of Chromatography B, 879,
159–166.
Radovnikovic A, Conroy ER, Gibney M, O’Mahony J and Danaher M, 2013. Residue analyses and
exposure assessment of the Irish population to nitrofuran metabolites from different food
commodities in 2009–2010. Food Additives and Contaminants, 30, 1858–1869.
Rao DN and Mason RP, 1987. Generation of nitro radical anions of some 5-nitrofurans, 2- and 5-
nitroimidazoles by norepinephrine, dopamine, and serotonin. A possible mechanism for
neurotoxicity caused by nitroheterocyclic drugs. Journal of Biological Chemistry, 262, 11731–
11736.
Rascher W and Neubert A, 2012. Reinfektionsprophylaxe rezidivierender Harnwegsinfektionen.
Monatsschrift Kinderheilkunde, 160, 171–173.
RIVM (Rijksinstituut voor Volksgezondheid en Milieu), 2003. Advies inzake residuen van furazolidon
in garnalen. Project V/320105/01/AA. RIVM, Bilthoven, Netherlands.
Robertson EL, 1982. Antiprotozoan drugs. In: Veterinary pharmacology and therapeutics. Eds Booth
NH and McDonald L.E., Iowa State University Press, Ames, IA, USA, 874.
Rodziewicz L, 2008. Determination of nitrofuran metabolites in milk by liquid chromatography–
electrospray ionization tandem mass spectrometry. Journal of Chromatography B, 864, 156–160.
Rodziewicz L and Zawadzka I, 2008. Rapid determination of chloramphenicol residues in milk powder
by liquid chromatography–elektrospray ionization tandem mass spectrometry. Talanta, 75, 846–850.
Rodziewicz L and Zawadzka I, 2013. Development and validation of a new method for determining
nitrofuran metabolites in bovine urine using liquid chromatography - tandem mass spectrometry.
Roczniki Panstwowego Zakladu Higieny, 64, 285–291.
Rogers GS, Belloff GB, Paul MF, Yurchenco JA and Gever G, 1956. Furazolidone, a new antimicrobial
nitrofuran; a review of laboratory and clinical data. Antibiotics and Chemotherapy, 6, 231–241.
Rose GP, Dewar AJ and Stratford IJ, 1982. A biochemical neurotoxicity study relating the neurotoxic
potential of metronidazole and nitrofurantoin with misonidazole. International Journal of Radiation
Oncology, Biology, Physics, 8, 781–785.
Rosenberg HA and Bates TR, 1976. The influence of food on nitrofurantoin bioavailability. Clinical
Pharmacology and Therapeutics, 20, 227–232.
Rosenkranz HS and Speck WT, 1976. Activation of nitrofurantoin to a mutagen by rat liver
nitroreductase. Biochemical Pharmacology, 25, 1555–1556.
Rossi L, De Angelis I, Pedersen JZ, Marchese E, Stammati A, Rotilio G and Zucco F, 1996. N-[5-nitro-
2-furfurylidene]-3-amino-2-oxazolidinone activation by the human intestinal cell line Caco-2
monitored through noninvasive electron spin resonance spectroscopy. Molecular Pharmacology, 49,
547–555.
Rowland IR, Mallett AK, Wise A and Bailey E, 1983. Effect of dietary carrageenan and pectin on the
reduction of nitro-compounds by the rat caecal microflora. Xenobiotica, 13, 251–256.
Ryad LA, Attala E, El-Sawi SA and El-Gohary AA, 2013. Analysis of nitrofuran metabolic residues in
tissues by liquid chromatography–tandem mass spectrometry. Journal of Applied Sciences Research,
9, 4567–4573.
Ryan A, Kaplan E, Laurieri N, Lowe E and Sim E, 2011. Activation of nitrofurazone by azoreductases:
multiple activities in one enzyme. Scientific Reports, 1, 63.

Nitrofurans in food
EFSA Journal 2015;13(6):4140 149
Saari L and Peltonen K, 2004. Novel source of semicarbazide: levels of semicarbazide in cooked
crayfish samples determined by LC/MS/MS. Food Additives and Contaminants, 21, 825–832.
Sachs J, Geer T, Noell P and Kunin CM, 1968. Effect of renal function on urinary recovery of orally
administered nitrofurantoin. New England Journal of Medicine, 278, 1032–1035.
Sanders P, 2003. Note on analysis of nitrofurans residue semi-carbazide confirmation. Afssa (Agence
Francaise de Securité Sanitaire des Aliments) and CRL (Central Reference Laboratory). Available at:
http://crl.fougeres.anses.fr/publicdoc/noteCRL281103.pdf
Sapkota A, Sapkota AR, Kucharski M, Burke J, McKenzie S, Walker P and Lawrence R, 2008.
Aquaculture practices and potential human health risks: current knowledge and future priorities.
Environment International, 34, 1215–1226.
Sardas S, Metin A, Gok S, Karakaya AE and Aykol N, 1990. Sister chromatid exchanges in peripheral
lymphocytes of urinary tract infection treated with nitrofurantoin. International Urology and
Nephrology, 22, 513–517.
SCAN (Scientific Committee on Animal Nutrition), 1977. Report of the Scientific Committee on
Animal Nutrition on the Use of Nitrofurans in Feedingstuffs, 9–10.
SCAN (Scientific Committee on Animal Nutrition), 1982. Report of the Scientific Committee on
Animal Nutrition on the Use of Nifursol in Feedingstuffs for Turkeys, 46–50.
SCAN (Scientific Committee on Animal Nutrition), 2001. Opinion of the Scientific Committee on
Animal Nutrition on the safety of use of nifursol in feedingstuffs for turkeys. Directorate C—
Scientific Opinions. C2—Management of scientific committees; scientific co-operation and
networks. Available at: http://ec.europa.eu/food/fs/sc/scan/out69_en.pdf
SCAN (Scientific Committee on Animal Nutrition), 2003. Update of the Opinion of the Scientific
Committee on Animal Nutrition on the Safety of Product Nifursol. European Commission,
Directorate General for Health and Consumer Protection. Directorate C—Scientific Opinions. C2—
Management of scientific committees; science co-operation and networks.
Selby JV, Friedman GD and Fireman BH, 1989. Screening prescription drugs for possible
carcinogenicity: eleven to fifteen years of follow-up. Cancer Research, 49, 5736–5747.
Setnikar I, Magistretti MJ, Veronese M, 1976. Mutagenicity studies on nifurpipone and nitrofurantoin.
Proceedings of the European Society of Toxicology, 17, 405–412.
Shen Y-D, Xu Z-L, Zhang S-W, Wang H, Yang J-Y, Lei H-T, Xiao Z-L and Sun Y-M, 2012.
Development of a monoclonal antibody-based competitive indirect enzyme-linked immunosorbent
assay for furaltadone metabolite AMOZ in fish and shrimp samples. Journal of Agricultural and
Food Chemistry, 60, 10991–10997.
Sheng L-Q, Chen M-M, Chen S-S, Du N-N, Liu Z-D, Song C-F and Qiao R, 2013. High-performance
liquid chromatography with fluorescence detection for the determination of nitrofuran metabolites in
pork muscle. Food Additives and Contaminants: Part A, 30, 2114–2122.
Sheu SY, Tai YT, Li WR, Lei YC, Hsieh KH, Lin CY, Cheng CC, Chang TH and Kuo TF, 2012.
Development of a competitive ELISA for the detection of a furaltadone marker residue, 3-amino-5-
morpholinomethyl-2-oxazolidinone (AMOZ), in cultured fish samples. Journal of Veterinary
Medical Science, 74, 1439–1446.
Shoda T, Yasuhara K, Moriyasu M, Takahashi T, Uneyama C, Hirose M and Mitsumori K, 2001.
Testicular toxicity of nitrofurazone causing germ cell apoptosis in rats. Archives of Toxicology, 75,
297–305.
Shu J, He L, Ding H, Wang L, Guo H, Gao Y, Dzakah EE and Zeng Z, 2014. Synthesis of furaltadone
metabolite, 3-amino-5-morpholinomethyl-2-oxazolidone (AMOZ) and novel haptens for the
development of a sensitive enzyme-linked immunosorbent assay (ELISA). Analytical Methods, 6,
2306–2313.

Nitrofurans in food
EFSA Journal 2015;13(6):4140 150
Siebert D, Bayer U and Marquardt H, 1979. The application of mitotic gene conversion in
Saccharomyces cerevisiae in a pattern of four assays, in vitro and in vivo, for mutagenicity testing.
Mutation Research, 67, 145–156.
Simion G, Damiescu L and Trif A, 2012. Monitoring of the nitrofurans residues in honey bees from
Timis County in the period 2007–2009. Journal of Agroalimentary Processes and Technologies, 18,
100–102.
Singh SK and Chakravarty S, 2001. Effect of nitrofurazone on the reproductive organs in adult male
mice. Asian Journal of Andrology, 3, 39–44.
Slapsyte G, Jankauskiene A, Mierauskiene J and Lazutka JR, 2002. Cytogenetic analysis of peripheral
blood lymphocytes of children treated with nitrofurantoin for recurrent urinary tract infection.
Mutagenesis, 17, 31–35.
Slob W and Setzer RW, 2014. Shape and steepness of toxicological dose-response relationships of
continuous endpoints. Critical Reviews in Toxicology, 44, 270-297.
Smith CG, Grady JE and Northam JI, 1963. Relationship between cytotoxicity in vitro and whole
animal toxicity. Cancer Chemotherapy Reports, 30, 9–12.
Smith DJ, Paulson GD and Larsen GL, 1998. Distribution of radiocarbon after intramammary,
intrauterine, or ocular treatment of lactating cows with carbon-14 nitrofurazone. Journal of Dairy
Science, 81, 979–988.
Śniegocki T, Posyniak A and Żmudzki , 2008. Determination of nitrofuran metabolite residues in eggs
by liquid chromatography-mass spectrometry. Bulletin of the Veterinary Institute in Pulawy, 52,
421–425.
Song J, Yang H, Wang Y, Si W and Deng A, 2012. Direct detection of 3-amino-5-methylmorpholino-2-
oxazolidinone (AMOZ) in food samples without derivatisation step by a sensitive and specific
monoclonal antibody based ELISA. Food Chemistry, 135, 1330–1336.
Stadler RH, Mottier P, Guy P, Gremaud E, Varga N, Lalljie S, Whitaker R, Kintscher J, Dudler V and
Read WA, 2004. Semicarbazide is a minor thermal decomposition product of azodicarbonamide
used in the gaskets of certain food jars. Analyst, 129, 276–281.
Stastny K, Frgalova K, Hera A, Vass M and Franek M, 2009. In-house validation of liquid
chromatography tandem mass spectrometry for determination of semicarbazide in eggs and stability
of analyte in matrix. Journal of Chromatography A, 13, 8187–8191.
Steffek AJ, Verrusio AC and Watkins CA, 1972. Cleft palate in rodents after maternal treatment with
various lathyrogenic agents. Teratology, 5, 33–38.
Stern IJ, Hollifield RD, Wilk S and Buzard JA, 1967. The anti-monoamine oxidase effects of
furazolidone. Journal of Pharmacology and Experimental Therapeutics, 156, 492–499.
Stitzel KA, McConnell RF and Dierckman TA, 1989. Effects of nitrofurantoin on the primary and
secondary reproductive organs of female B6C3F1 mice. Toxicologic Pathology, 17, 774–781.
Streeter AJ, Krueger TR and Hoener BA, 1988. Oxidative metabolites of 5-nitrofurans. Pharmacology,
36, 283–288.
Stricker BH, Blok AP, Claas FH, Van Parys GE and Desmet VJ, 1988. Hepatic injury associated with
the use of nitrofurans: a clinicopathological study of 52 reported cases. Hepatology, 8, 599-606.
Swaminathan S and Lower LM Jr, 1978. Biotransformation and excretion of nitrofurans. In:
Nitrofurans: chemistry, metabolism, mutagenesis and carcinogenesis. Volume 4 Carcinogenesis—A
comprehensive survey. Ed. Bryan GT. Raven Press, New York, NY, USA, 59–97.
Szilagyi S and de la Calle B, 2006. Development and validation of an analytical method for the
determination of semicarbazide in fresh egg and in egg powder based on the use of liquid
chromatography tandem mass spectrometry. Analytica Chimica Acta, 572, 113–120.

Nitrofurans in food
EFSA Journal 2015;13(6):4140 151
Takahashi M, Yoshida M, Inoue K, Morikawa T and Nishikawa A, 2009. A ninety-day toxicity study of
semicarbazide hydrochloride in Wistar Hannover GALAS rats. Food and Chemical Toxicology, 47,
2490–2498.
Takahashi M, Yoshida M, Inoue K, Morikawa T, Nishikawa A and Ogawa K, 2014. Chronic toxicity
and carcinogenicity of semicarbazide hydrochloride in Wistar Hannover GALAS rats. Food and
Chemical Toxicology, 73, 84–94.
Tang Y, Xu J, Wang W, Xiang J and Yang H, 2011a. A sensitive immunochromatographic assay using
colloidal gold–antibody probe for the rapid detection of semicarbazide in meat specimens. European
Food Research and Technology, 232, 9–16.
Tang Y, Xu X, Liu X, Huang X, Chen Y, Wang W and Xiang J, 2011b. Development of a Lateral Flow
Immunoassay (LFA) strip for the rapid detection of 1-aminohydantoin in meat samples. Journal of
Food Science, 76, T138–T143.
Tao Y, Chen D, Wei H, Yuanhu P, Liu Z, Huang L, Wang Y, Xie S and Yuan Z, 2012. Development of
an accelerated solvent extraction, ultrasonic derivatisation LC-MS/MS method for the determination
of the marker residues of nitrofurans in freshwater fish. Food Additives and Contaminants: Part A,
29, 736–745.
Tatsumi K, Ou T, Yoshimura H and Tsukamoto H, 1971. Metabolism of drugs. 73. The metabolic fate
of nitrofuran derivatives. 1. Studies on the absorption and excretion. Chemical and Pharmaceutical
Bulletin, 19, 330–334.
Tatsumi K, Nakabeppu H, Takahashi Y and Kitamura S, 1984. Metabolism in vivo of furazolidone:
evidence for formation of an open-chain carboxylic acid and alpha-ketoglutaric acid from the
nitrofuran in rats. Archives of Biochemistry and Biophysics, 234, 112–116.
Thongsrisomboon P, Liawruangrath B, Liawruangrath S and Satienperakul S, 2010. Determination of
nitrofurans residues in animal feeds by flow injection chemiluminescence procedure. Food
Chemistry, 123, 834–839.
Tin-Chuen Y, Sudlow G, Koch RL and Goldman P, 1983. Reduction of nitroheterocyclic compounds by
mammalian tissues in vivo. Biochemical Pharmacology, 32, 2249–2253.
Tittlemier SA, Van de Riet J, Burns G, Potter R, Murphy C, Rourke W, Pearce H, Cao XL, Dabekai
RW and Dufresne G, 2007. Analysis of veterinary drug residues in fish and shrimp composites
collected during the Canadian Total Diet Study, 1993–2004. Food Additives and Contaminants, 24,
14–20.
TNO (Nederlandse Organisatie voor Toegepast Natuurwetenschappelijk Onderzoek/Netherlands
Organisation for Applied Scientific Research), 2004a. Bacterial reverse mutation test with
semicarbazide. TNO Report no V5005/11, 6 February 2004. 22 pp. Available at:
http://www.efsa.europa.eu/de/home/doc/study2_afc_doc4_en1.pdf
TNO (Nederlandse Organisatie voor Toegepast Natuurwetenschappelijk Onderzoek/Netherlands
Organisation for Applied Scientific Research), 2004b. Gene mutation test at the TK locus of L5178Y
cells with semicarbazide. TNO Report no V5003/09, 22 January 2004. Available at:
http://www.efsa.europa.eu/de/scdocs/doc/219.pdf
TNO (Nederlandse Organisatie voor Toegepast Natuurwetenschappelijk Onderzoek/Netherlands
Organisation for Applied Scientific Research), 2004c. Chromosomal aberration test with
semicarbazide in Chinese hamster Ovary (CHO) cells. TNO Report no V 5002/09, 9 February 2004.
Available at: http://www.efsa.europa.eu/de/home/doc/study1_afc_doc3_en_firstpart1.pdf
Tonomura A and Sasaki MS, 1973. Chromosome aberrations and DNA repair synthesis in cultured
human cells exposed to nitrofurans. Japanese Journal of Genetics, 48, 291–294.
Toth B, Shimizu H and Erickson J, 1975. Carbamylhydrazine hydrochloride as a lung and blood vessel
tumour inducer in Swiss mice. European Journal of Cancer, 11, 17–22.

Nitrofurans in food
EFSA Journal 2015;13(6):4140 152
Tribalat L, Paisse O, Dessalces G and Grenier-Loustalot MF, 2006. Advantages of LC-MS-MS
compared to LC-MS for the determination of nitrofuran residues in honey. Analytical and
Bioanalytical Chemistry, 386, 2161–2168.
Tsai C-W, Hsu C-H and Wang W-H, 2009. Determination of nitrofuran residues in tilapia tissue by
enzyme-linked immunosorbent assay and confirmation by liquid chromatography tandem mass
spectrometric detection. Journal of the Chinese Chemical Society, 56, 581–588.
Tsai C-W, Tang C-H and Wang W-H, 2010. Quantitative determination of four nitrofurans and
corresponding metabolites in the fish muscle by liquid chromatography-electrospray ionization-
tandem mass spectrometry. Journal of Food and Drug Analysis, 18, 98–106.
Uhari M, Nuutinen M and Turtinen J, 1996. Adverse reactions in children during long-term
antimicrobial therapy. Pediatric Infectious Diseases Journal, 15, 404–408.
Vahl M, 2005. Analysis of nifursol residues in turkey and chicken meat using liquid chromatography-
tandem mass spectrometry. Food Additives and Contaminants, 22, 120–127.
Valera-Tarifa NM, Plaza-Bolaños P, Romero-González R, Martínez-Vidal JL and Garrido-Frenich A,
2013. Determination of nitrofuran metabolites in seafood by ultra high performance liquid
chromatography coupled to triple quadrupole tandem mass spectrometry. Journal of Food
Composition and Analysis, 30, 86–93.
Van Poucke C, Detavernier C, Wille M, Kwakman J, Sorgeloos P and Van Peteghem C, 2011.
Investigation into the possible natural occurence of semicarbazide in Macrobrachium rosenbergii
prawns. Journal of Agricultural and Food Chemistry, 59, 2107–2112.
Vass M, Diblikova I, Cernoch I and Franek M, 2008a. ELISA for semicarbazide and its application for
screening in food contamination. Analytica Chimica Acta, 608, 86–94.
Vass M, Diblikova I, Kok E, Stastny K, Frgalova K, Hruska K and Franek M, 2008b. In-house
validation of an ELISA method for screening of semicarbazide in eggs. Food Additives and
Contamants Part A, 25, 930–936.
Vass M, Hruska K and Franek M, 2008c. Nitrofuran antibiotics: a review on the application, prohibition
and residual analysis. Veterinarni Medicina, 53, 469–500.
Verdon E, Couedor P and Sanders P, 2007. Multi-residue monitoring for the simultaneous
determination of five nitrofurans (furazolidone, furaltadone, nitrofurazone, nitrofurantoin, nifursol)
in poultry muscle tissue through the detection of their five major metabolites (AOZ, AMOZ, SEM,
AHD, DNSAH) by liquid chromatography coupled to electrospray tandem mass spectrometry—in-
house validation in line with Commission Decision 657/2002/EC. Analytica Chimica Acta, 586,
336–347.
Vinas P, Campillo N, Carrasco L and Hernandez-Cordoba M, 2007. Analysis of nitrofuran residues in
animal feed using liquid chromatography and photodiode-array detection. Chromatographia, 65, 85–
89.
Vlastos D, Moshou H and Epeoglou K, 2010. Evaluation of genotoxic effects of semicarbazide on
cultured human lymphocytes and rat bone marrow. Food and Chemical Toxicology, 48, 209–214.
Vroomen LHM, Berghmans MCJ, Van Leeuwen P, Van Der Struijs TDB, De Vries PHU and Kuiper
HA, 1986. Kinetics of 14C-furazolidone in piglets upon oral administration during 10 days and its
interaction with tissue macro-molecules. Food Additives and Contaminants, 3, 331–346.
Vroomen LH, Berghmans MC, Hekman P, Hoogenboom LA and Kuiper HA, 1987a. The elimination of
furazolidone and its open-chain cyano-derivative from adult swine. Xenobiotica, 17, 1427–1435.
Vroomen LH, Groten JP, van Muiswinkel K, van Velduizen A and van Bladeren PJ, 1987b.
Identification of a reactive intermediate of furazolidone formed by swine liver microsomes.
Chemico-Biological Interactions, 64, 167–179.

Nitrofurans in food
EFSA Journal 2015;13(6):4140 153
Vroomen LH, van Ommen B and van Bladeren PJ, 1987c. Quantitative studies of the metabolism of
furazolidone by rat liver microsomes. Toxicology In Vitro, 1, 97–104.
Vroomen LH, Berghmans MC, Groten JP, Koeman JH and van Bladeren PJ, 1988. Reversible
interaction of a reactive intermediate derived from furazolidone with glutathione and protein.
Toxicology and Applied Pharmacology, 95, 53–60.
Vroomen LH, Berghmans MC, van Bladeren PJ, Groten JP, Wissink CJ and Kuiper HA, 1990. In vivo
and in vitro metabolic studies of furazolidone: a risk evaluation. Drug Metabolism Review, 22, 663–
676.
Wang CY and Lee LH, 1976. Mutagenic activity of carcinogenic and noncarcinogenic nitrofurans and
of urine of rats fed these compounds. Chemico-Biological Interactions, 15, 69–75.
Wang CY, Croft WA and Bryan GT, 1984. Tumor production in germ-free rats fed 5-nitrofurans.
Cancer Letters, 21, 303–308.
Wang J and Zhang L, 2006. Simultaneous determination and identification of furazolidone, furaltadone,
nitrofurazone, and nitrovin in feeds by HPLC and LC-MS. Journal of Liquid Chromatography and
Related Technologies, 29, 377–390.
Wang L, Leggas M, Goswami M, Empey PE and McNamara PJ, 2008. N-(4-[2-(1,2,3,4-tetrahydro-6,7-
dimethoxy-2-isoquinolinyl)ethyl]-phenyl)–9,10-dihydro-5-methoxy-9-oxo-4-acridine carboxamide
(GF120918) as a chemical ATP-binding cassette transporter family G member 2 (Abcg2) knockout
model to study nitrofurantoin transfer into milk. Drug Metabolism and Disposition, 36, 2591–2596.
Wang X and Morris ME, 2007. Effects of the flavonoid chrysin on nitrofurantoin pharmacokinetics in
rats: potential involvement of ABCG2. Drug Metabolism and Disposition, 35, 268–274.
Wang Y, Jester EL, El Said KR, Abraham A, Hooe-Rollman J and Plakas SM, 2010. Cyano metabolite
as a biomarker of nitrofurazone in channel catfish. Journal of Agricultural and Food Chemistry, 58,
313–316.
Watari N, Funaki T, Aizawa K and Kaneniwa N, 1983. Nonlinear assessment of nitrofurantoin
bioavailability in rabbits. Journal of Pharmacokinetics and Pharmacodynamics, 11, 529–545.
Weisburger EK, Ulland BM, Nam J, Gart JJ and Weisburger JH, 1981. Carcinogenicity tests of certain
environmental and industrial chemicals. Journal of the National Cancer Institute, 67, 75–88.
Wenxiao J, Pengjie L, Xia W, Xia C, Yunfeng Z, Wei S, Xiaoping W, Yongning W and Jianzhong S,
2012. Development of an enzyme-linked immunosorbent assay for the detection of nitrofurantoin
metabolite, 1-amino-hydantoin, in animal tissues. Food Control, 23, 20–25.
White AH, 1989. Absorption, distribution, metabolism, and excretion of furazolidone. A review of the
literature. Scandinavian Journal of Gastroenterology, 169(Suppl.), 4–10.
Wiley MJ and Joneja MG, 1978. Neural tube lesions in the offspring of hamsters given single oral doses
of lathyrogens early in gestation. Acta Anatomica, 100, 347–353.
Xia X, Li X, Zhang S, Ding S, Jiang H, Li J and Shen J, 2008. Simultaneous determination of 5-
nitroimidazoles and nitrofurans in pork by high-performance liquid chromatography–tandem mass
spectrometry. Journal of Chromatography A, 1208, 101–108.
Xu W, Zhu X, Wang X, Deng L and Zhang G, 2006. Residues of enrofloxacin, furazolidone and their
metabolites in Nile tilapia (Oreochromis niloticus). Aquaculture, 254, 1–8.
Xu ZL, Zhang SW, Sun YM, Shen YD, Lei HT, Jiang YM, Eremin SA, Yang JY and Wang H, 2013.
Monoclonal antibody-based fluorescence polarization immunoassay for high throughput screening of
furaltadone and its metabolite AMOZ in animal feeds and tissues. Combinatorial Chemistry and
High Throughput Screening, 16, 494–502.
Nitrofurans in food
EFSA Journal 2015;13(6):4140 154
Yahagi T, Matsushima T, Nagao M, Seino Y, Sugimura T and Bryan GT, 1976. Mutagenicities of
nitrofuran derivatives on a bacterial tester strain with an R factor plasmid. Mutation Research, 40, 9–
14.
Yahagi T, Nagao M, Hara K, Matsushima T, Sugimura T and Bryan GT, 1974. Relationships between
the carcinogenic and mutagenic or DNA-modifying effects of nitrofuran derivatives, including 2-(2-
furyl)-3-(5-nitro-2-furyl)acrylamide, a food additive. Cancer Research, 34, 2266–2273.
Yamashita J, 1976. Convulsive seizure induced by intracerebral injection of semicarbazide (an anti-
vitamin B6) in the mouse. Journal of Nutritional Science and Vitaminology, 22, 1–6.
Yamashita J and Hirata Y, 1977. Running fit induced by injection of semicarbazide into the superior
colliculus of the mouse. Journal of Nutritional Science and Vitaminology, 23, 467–470.
Yamashita J and Hirata Y, 1978. Running fits induced by direct administration of semicarabazide into
the superior colliculus of the mouse. Neuroscience Letters, 8, 89–92.
Yang W-Y, Dong J-X, Shen Y-D, Yang J-Y, Wang H, Xu Z-L, Yang X-X and Sun Y-M, 2012. Indirect
competitive chemiluminescence enzyme immunoassay for furaltadone metabolite in Metapenaeus
Ensis. Chinese Journal of Analytical Chemistry, 40, 1816–1821.
Yeung T-C and Goldman P, 1981. Inhibition of monoamine oxidase by furazolidone in germgree rats.
Biochemical Pharmacology, 30, 2496–2497.
Yibar A, Centinkaya F and Soyutemiz GE, 2012. Nitrofuran metabolite 3-amino-2-oxazolidinone
residues in chicken liver: a screening study. Asian Journal of Animal and Veterinary Advances, 7,
346–350.
Yibar A, Okutan B and Guezel S, 2013. Effects of boiling on nitrofuran AOZ residues in commercial
eggs. Kafkas Universitesi Veteriner Fakultesi Dergisi, 19, 1023–1028.
Young RE, 1961. Intravenous furaltadone; bacteriologic, toxicologic and clinical studies. Ohio
Medicine, 57, 416–417.
Yunda IF, Melnik AM and Kushniruk YI, 1974. Experimental study of the gonadotoxic effect of
nitrofurans and its prevention. International Urology and Nephrology, 6, 125–135.
Zenser TV, Mattammal MB, Palmier MO and Davis BB, 1981. Microsomal nitroreductase activity of
rabbit kidney and bladder: implications in 5-nitrofuran-induced toxicity. Journal of Pharmacology
and Experimental Therapeutics, 219, 735–740.
Zhang Y, Wang H, Unadkat JD and Mao Q, 2007. Breast cancer resistance protein 1 limits fetal
distribution of nitrofurantoin in the pregnant mouse. Drug Metabolism and Disposition, 35, 2154–
2158.
Zhao Y, Zhang F and Liu Y, 2011. Determination of residues of nitrofuran metabolites in Litopenaeus
vannamei by UPLC-MS/MS. South China Fisheries Science, 4, 008.
Zimmermann H, Gutte G, Kern M, Golbs S and Ludewig T, 1993. Basic reproductive toxicological
studies of the effect of furazolidone on the hypothalamo-hypophyseo-gonadal axis of male rats.
Deutsche Tierarztliche Wochenschrifte, 100, 91–94.
Zolla L and Timperio AM, 2005. Involvement of active oxygen species in protein and oligonucleotide
degradation induced by nitrofurans. Biochemistry and Cell Biology, 83, 166-175.
Zuidema T, Mulder PPJ, Van Rhijn JA, Keestra NGM, Hoogenboom LA, Schat B and Kennedy DG,
2005. Metabolism and depletion of nifursol in broilers. Analytica Chimica Acta, 529, 339–346.
Zullo A, Ierardi E, Hassan C and De Francesco V, 2012. Furazolidone-based therapies for Helicobacter
pylori infection: a pooled-data analysis. Saudi Journal of Gastroenterology, 18, 11–17.
Nitrofurans in food
EFSA Journal 2015;13(6):4140 155
APPENDICES
Appendix A. Sources of semicarbazide in food, other than those arising from nitruforazone use,
and resulting exposures
A.1. Sources
In addition to arising from nitrofurazone use (see Section 1), SEM may occur in food from different
sources, which are summarised below.
A.1.1. Azodicarbonamide use in foamed plastic gaskets
SEM is a minor thermal decomposition product of azodicarbonamide (Stadler et al., 2004), which is a
blowing agent used in sealing gaskets for metal lids on glass bottles and jars (EFSA, 2005). Owing to
the migration of SEM from the gasket into the food, SEM occurrence has been reported in packaged
food such as baby food. The AFC Panel reported on the occurrence of SEM in baby foods and other
miscellaneous foods. Data from five Member States (Finland, Germany, Ireland, Spain and the
Netherlands) and industry were reported. The average concentrations in baby food were similar for the
different data providers (range of mean concentrations across data providers 7–16 µg/kg) and the
overall average concentration was 13 µg/kg (n = 385; concentration range 0.1–140 µg/kg). For ready-
to-eat infant milk, an average concentration of 9 µg/kg was reported (n = 7; concentration range 5–
14 µg/kg). For other miscellaneous foods (e.g. fruit, vegetables, jams, pickles, sauces and fish), lower
levels were reported with an average concentration of 1 µg/kg (n = 121; concentration range < 0.03–
10 µg/kg) (EFSA, 2005).
The use of azodicarbonamide in food contact materials has been prohibited in the EU since August
2005 (Commission Directive 2004/1/EC39
).
A.1.2. Azodicarbonamide use as flour additive
Azodicarbonamide can be used as a flour additive to improve the physical properties of flours,
particularly those low in gluten (de la Calle and Anklam, 2005). Pereira et al. (2004) estimated that the
use of azodicarbonamide-treated flour for breaded chicken products can result in SEM concentrations
in the breaded chicken between 0.2 and 5 µg/kg.
The use of azodicarbonamide as a flour additive is not permitted in the EU, not being included in the
Community list of food additives approved for use in foods (Annex II of Regulation (EC) No
1333/200840
).
A.1.3. Hypochlorite treatment
High levels of SEM (up to 400 µg/kg) have been found in carrageenan41
(Hoenicke et al., 2004).
Carrageenan is prepared from red seaweed, and SEM has been detected in the raw material and was
reported by the authors to occur naturally. In addition, Hoenicke et al. (2004) showed that bleaching of
carrageenan with a sodium hypochlorite solution, containing 0.05–0.1 % active chlorine used for the
production of processed Euchema seaweed (PES; a semi-refined carrageenan) results in additional
formation of SEM. Based on data submitted by Marinalg, the industry association for producers of
agar, alginates, carrageenan and PES, the AFC Panel reported a mean SEM concentration of 65 µg/kg
in PES (n = 25; range 9–380 µg/kg (EFSA, 2005). Marinalg indicated on 11 February 2015 that there
39 Commission Directive 2004/1/EC of 6 January 2004 amending Directive 2002/72/EC as regards the suspension of the use
of azodicarbonamide as blowing agent. OJ L 7, 13.1.2004, p. 45–46. 40 Regulation (EC) No 1333/2008 of the European Parliament and of the Council of 16 December 2008 on food additives. OJ
L 354, 31.12.2008, p. 16–33. 41 Carrageenan (food additive E 407) is used as a thickening, gelling and suspending agent in food, for example in ice cream,
pudding, yoghurt, fruit jellies, chocolate milk and different meat products.

Nitrofurans in food
EFSA Journal 2015;13(6):4140 156
have been no processing changes in the production of carrageenan or PES, since the submission of the
data used by the AFC Panel, that would impact the accuracy of the submitted data earlier.
SEM has also been detected in egg powder. Contamination occurred during the extraction of lysozyme
from egg albumin due to the use of bleach solution to sanitise the carrageenan column used for the
extraction of lysozyme. However, another possible cause of SEM in egg powder could be the heat
treatment (EFSA, 2005).
Hoenicke et al. (2004) studied the formation of SEM in foods treated with hypochlorite solution. SEM
was formed in chicken, egg white powder, carrageenan, locust bean gum, gelatine and starch, after
overnight treatment with a hypochlorite solution containing 1 % active chlorine. The increase in SEM
formation following hypochlorite treatment was in the range of the method variability for shrimps,
milk, soybean flakes and red seaweed. Treatment with a hypochlorite solution containing 0.015 %
active chlorine resulted in only a little formation of SEM in carrageenan and starch.
The AFC Panel evaluated the occurrence of SEM in food due to the use of chlorinated water as a
processing aid.42
Given that the concentrations used by the food industry are 100- to 1 000-fold lower
than the concentration of 0.015 % active chlorine that gave barely any detectable SEM formation in
the tests performed by Hoenicke et al. (2004), given that the chlorine wash will be for a far shorter
period than the overnight conditions used in the laboratory tests, and given that the processes also
generally incorporate a final rinse with chilled water with just 0.0002 to 0.0004 % free chlorine, the
AFC Panel concluded that the use of chlorinated water as a processing aid is highly unlikely to give
any detectable residues of SEM in the washed food.
The AFC Panel also considered disinfection of equipment and surfaces with disinfecting agents such
as sodium hypochlorite and concluded that, with effective rinsing, no subsequent formation of SEM is
to be expected (EFSA, 2005).
A.1.4. Natural occurrence
Natural occurrence of SEM has been reported in shrimps/prawns, seaweed, crayfish and honey, mostly
at a concentration below the MRPL of 1 µg/kg, but concentrations up to 12 µg/kg in crayfish have
been reported (Hoenicke et al., 2004; Saari and Peltonen, 2004; Van Poucke et al., 2011; Crews, 2014;
McCracken et al., 2013)
A.2. Exposure
In 2005, the AFC Panel estimated the exposure to the different sources of SEM described above
(EFSA, 2005).
For a 9-month old infant of 8.8 kg b.w. eating exclusively food and drink from glass jars and bottles
containing SEM, the AFC Panel estimated that the exposure to SEM would be 0.35 µg/kg b.w. per day
for an average consumer (of the category ‘consumers only’) and 0.69 µg/kg b.w. per day for a high
consumer (95th percentile). For an infant (4.5 kg b.w.) consuming only pre-packaged infant milk in
glass bottles with metal lids, the intake was estimated to be 1.4 µg/kg b.w. per day. For adults, the
exposure is considerably lower. Assuming the consumption of 1 kg of food contaminated with SEM at
an average concentration of 1 µg/kg, the exposure for an adult (60 kg b.w.) would be 0.02 µg/kg b.w.
per day. However, given that the use of azodicarbonamide in food contact materials is prohibited in
the EU, the European population should no longer be exposed via this route.
42 Chlorinated water may be used as a processing aid to wash foods, e.g. fruit and vegetables, provided that it meets the
definition of a processing aid, i.e. it does not perform a function such as preservation in the final product and leaves no
harmful residues (Directive 89/107/EEC). It is a reasonably widespread practice to wash certain ready-to-eat foods using
water with a chlorine content up to 0.0001 % (EFSA, 2005).

Nitrofurans in food
EFSA Journal 2015;13(6):4140 157
The dietary exposure from breaded meat products imported into the EU was estimated to be
1 µg/person considering the consumption of 200 g of product containing 5 µg/kg SEM. This exposure
corresponds to 17 ng/kg b.w. per day for a 60 kg b.w. person. No dietary exposure from imported
bread and bakery ware was estimated, as the import of these products into the EU is probably very
low.
For a high consumer of egg products, the exposure to SEM was estimated to be 8 ng/kg b.w. per day
for a 60 kg b.w. person.
The exposure could be up to 5 ng/kg b.w. per day from the use of carrageenan, assuming that
consumption was up to the full ADI for carrageenan (75 mg/kg b.w. per day) and that all consumed
carrageenan contained SEM at 65 µg/kg.
In addition, the AFC Panel noted that SEM may be formed at low levels during drying of some foods,
it may be present at very low background levels naturally or it may also derive from as yet
unidentified sources.
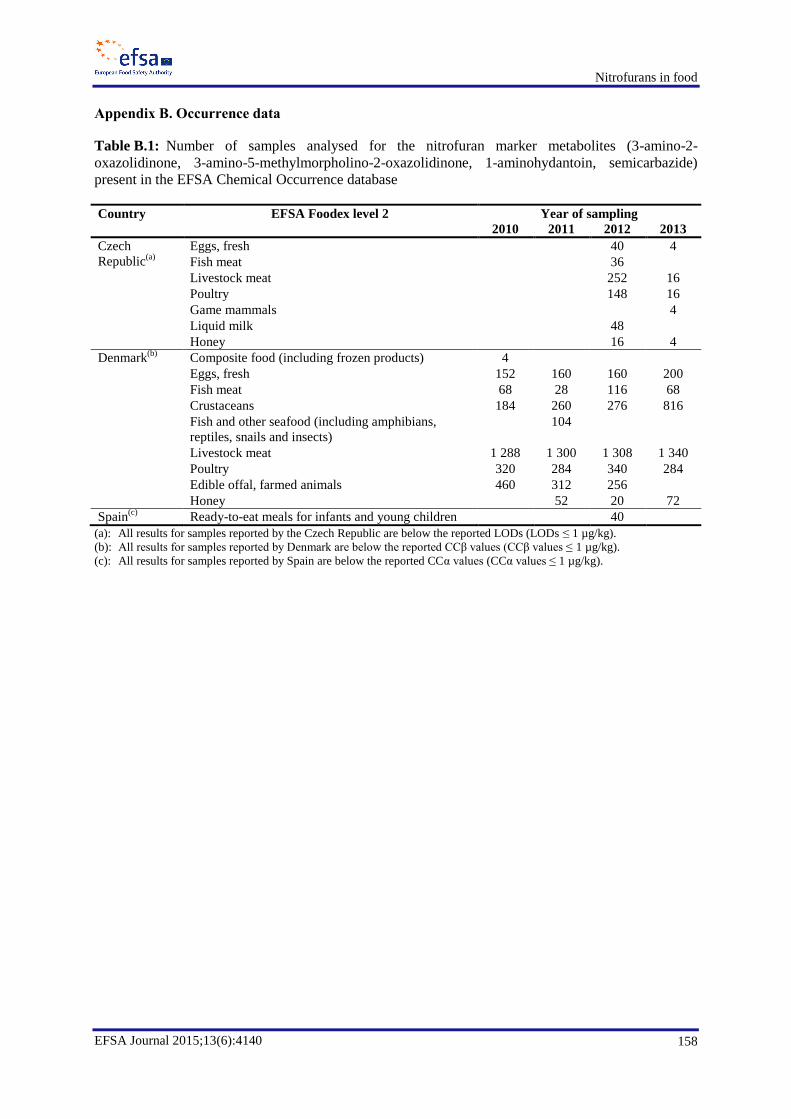
Nitrofurans in food
EFSA Journal 2015;13(6):4140 158
Appendix B. Occurrence data
Table B.1: Number of samples analysed for the nitrofuran marker metabolites (3-amino-2-
oxazolidinone, 3-amino-5-methylmorpholino-2-oxazolidinone, 1-aminohydantoin, semicarbazide)
present in the EFSA Chemical Occurrence database
Country EFSA Foodex level 2 Year of sampling
2010 2011 2012 2013
Czech
Republic(a)
Eggs, fresh 40 4
Fish meat 36
Livestock meat 252 16
Poultry 148 16
Game mammals 4
Liquid milk 48
Honey 16 4
Denmark(b)
Composite food (including frozen products) 4
Eggs, fresh 152 160 160 200
Fish meat 68 28 116 68
Crustaceans 184 260 276 816
Fish and other seafood (including amphibians,
reptiles, snails and insects)
104
Livestock meat 1 288 1 300 1 308 1 340
Poultry 320 284 340 284
Edible offal, farmed animals 460 312 256
Honey 52 20 72
Spain(c)
Ready-to-eat meals for infants and young children 40
(a): All results for samples reported by the Czech Republic are below the reported LODs (LODs ≤ 1 µg/kg).
(b): All results for samples reported by Denmark are below the reported CCβ values (CCβ values ≤ 1 µg/kg).
(c): All results for samples reported by Spain are below the reported CCα values (CCα values ≤ 1 µg/kg).
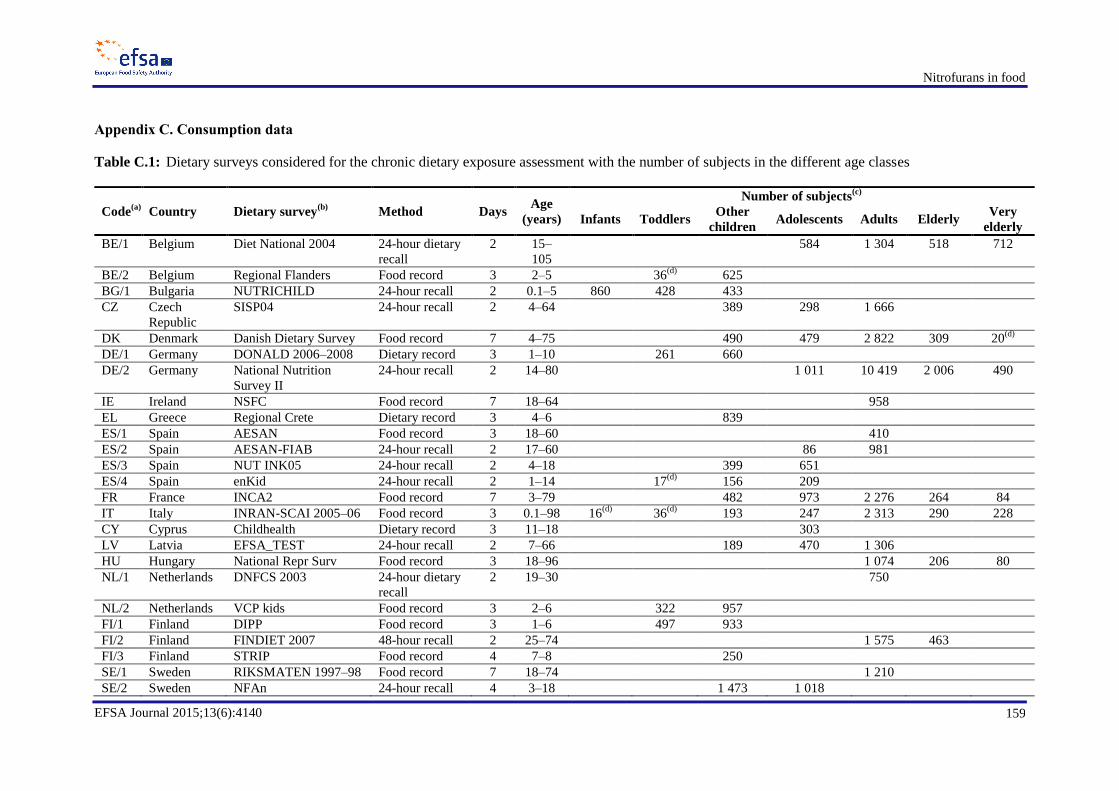
Nitrofurans in food
EFSA Journal 2015;13(6):4140 159
Appendix C. Consumption data
Table C.1: Dietary surveys considered for the chronic dietary exposure assessment with the number of subjects in the different age classes
Code(a)
Country Dietary survey(b)
Method Days Age
(years)
Number of subjects(c)
Infants Toddlers Other
children Adolescents Adults Elderly
Very
elderly
BE/1 Belgium Diet National 2004 24-hour dietary
recall
2 15–
105
584 1 304 518 712
BE/2 Belgium Regional Flanders Food record 3 2–5 36(d)
625
BG/1 Bulgaria NUTRICHILD 24-hour recall 2 0.1–5 860 428 433
CZ Czech
Republic
SISP04 24-hour recall 2 4–64 389 298 1 666
DK Denmark Danish Dietary Survey Food record 7 4–75 490 479 2 822 309 20(d)
DE/1 Germany DONALD 2006–2008 Dietary record 3 1–10 261 660
DE/2 Germany National Nutrition
Survey II
24-hour recall 2 14–80 1 011 10 419 2 006 490
IE Ireland NSFC Food record 7 18–64 958
EL Greece Regional Crete Dietary record 3 4–6 839
ES/1 Spain AESAN Food record 3 18–60 410
ES/2 Spain AESAN-FIAB 24-hour recall 2 17–60 86 981
ES/3 Spain NUT INK05 24-hour recall 2 4–18 399 651
ES/4 Spain enKid 24-hour recall 2 1–14 17(d)
156 209
FR France INCA2 Food record 7 3–79 482 973 2 276 264 84
IT Italy INRAN-SCAI 2005–06 Food record 3 0.1–98 16(d)
36(d)
193 247 2 313 290 228
CY Cyprus Childhealth Dietary record 3 11–18 303
LV Latvia EFSA_TEST 24-hour recall 2 7–66 189 470 1 306
HU Hungary National Repr Surv Food record 3 18–96 1 074 206 80
NL/1 Netherlands DNFCS 2003 24-hour dietary
recall
2 19–30 750
NL/2 Netherlands VCP kids Food record 3 2–6 322 957
FI/1 Finland DIPP Food record 3 1–6 497 933
FI/2 Finland FINDIET 2007 48-hour recall 2 25–74 1 575 463
FI/3 Finland STRIP Food record 4 7–8 250
SE/1 Sweden RIKSMATEN 1997–98 Food record 7 18–74 1 210
SE/2 Sweden NFAn 24-hour recall 4 3–18 1 473 1 018

Nitrofurans in food
EFSA Journal 2015;13(6):4140 160
Code(a)
Country Dietary survey(b)
Method Days Age
(years)
Number of subjects(c)
Infants Toddlers Other
children Adolescents Adults Elderly
Very
elderly
UK United
Kingdom
NDNS Food record 7 19–64 1 724
(a): Abbreviations to be used consistently in all tables on exposure assessment.
(b): More information on the dietary surveys is given in the EFSA guidance ‘Use of the EFSA Comprehensive European Food Consumption Database in Exposure Assessment’ (EFSA, 2011b).
(c): Number of available subjects for chronic exposure assessment in each age class.
(d): 95th percentiles calculated over a number of observations fewer than 60. These require cautious interpretation, as the results may not be statistically robust (EFSA, 2011b).

Nitrofurans in food
EFSA Journal 2015;13(6):4140 161
Appendix D. Dietary exposure for scenario 1B
Table D.1: Summary statistics for the hypothetical chronic dietary exposure (ng/kg b.w. per day) to
nitrofuran marker metabolites estimated by age class for scenario 1B.
Age class Number of surveys Scenario 1B
(a)
Minimum Median Maximum
Mean dietary exposure
Infants 2 20.2 –(b) 82
Toddlers 7 24.6 36 44
Other children 15 9.5 23 39
Adolescents 12 4.8 9.4 14
Adults 15 4.4 6.8 10
Elderly 7 4.1 5.1 7.8
Very elderly 6 4.1 5.3 7.8
95th percentile dietary exposure(c)
Infants 1 –(d)
–(d)
–(d)
Toddlers 4 53 57 103
Other children 15 18 40 67
Adolescents 12 11 18 27
Adults 15 9.5 13 17
Elderly 7 8.3 9.4 16
Very elderly 5 8.3 9.5 11
The minimum, median and maximum of the mean and 95th percentile exposure values across dietary surveys in European
countries are shown.
In order to avoid the impression of too high precision, the numbers for all exposure estimates are rounded to two figures.
b.w.: body weight; RPA: reference point for action.
(a): Scenario 1B contains foods of animal origin, including milk and dairy products, that are contaminated with one
nitrofuran marker metabolite at a concentration equal to the RPA value of 1 µg/kg.
(b): Not calculated; estimates available from only two dietary surveys.
(c): The 95th percentile estimates obtained from dietary surveys/age classes with fewer than 60 observations may not be
statistically robust (EFSA, 2011b) and therefore are not included in this table.
(d): Estimates available from only one dietary survey: 73 ng/kg b.w. per day.
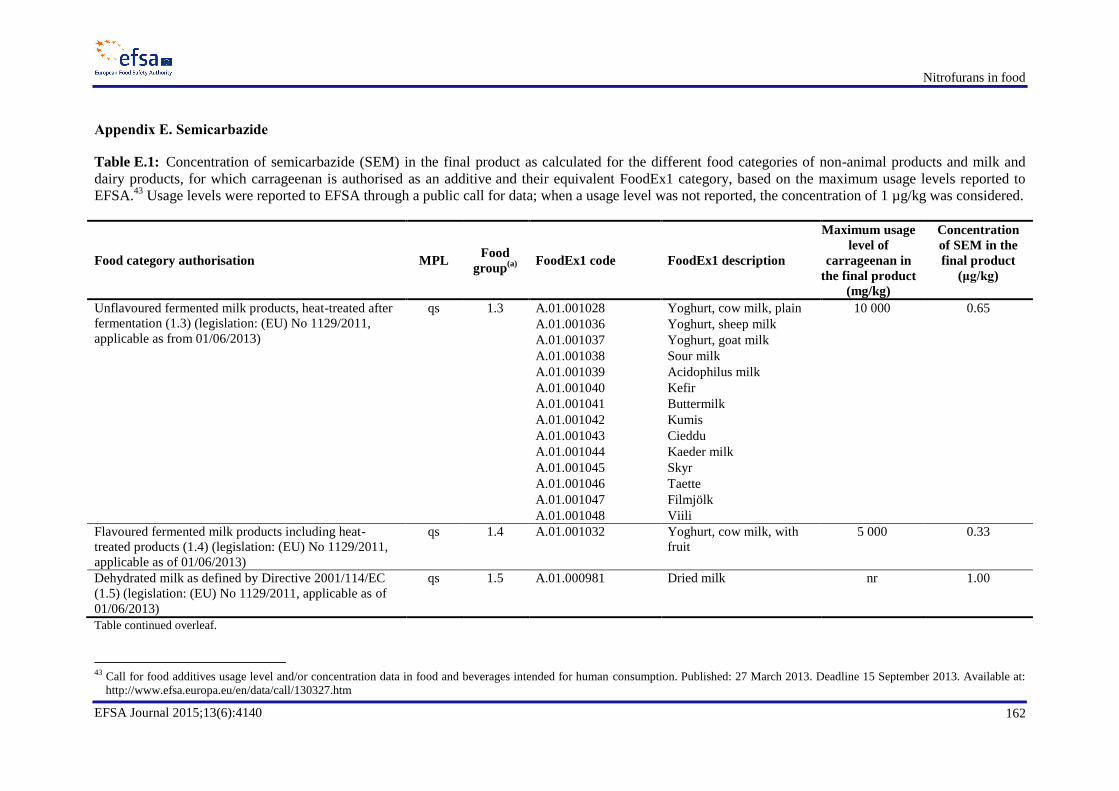
Nitrofurans in food
EFSA Journal 2015;13(6):4140 162
Appendix E. Semicarbazide
Table E.1: Concentration of semicarbazide (SEM) in the final product as calculated for the different food categories of non-animal products and milk and
dairy products, for which carrageenan is authorised as an additive and their equivalent FoodEx1 category, based on the maximum usage levels reported to
EFSA.43
Usage levels were reported to EFSA through a public call for data; when a usage level was not reported, the concentration of 1 µg/kg was considered.
Food category authorisation MPL Food
group(a) FoodEx1 code FoodEx1 description
Maximum usage
level of
carrageenan in
the final product
(mg/kg)
Concentration
of SEM in the
final product
(μg/kg)
Unflavoured fermented milk products, heat-treated after
fermentation (1.3) (legislation: (EU) No 1129/2011,
applicable as from 01/06/2013)
qs
1.3 A.01.001028 Yoghurt, cow milk, plain 10 000 0.65
A.01.001036 Yoghurt, sheep milk
A.01.001037 Yoghurt, goat milk
A.01.001038 Sour milk
A.01.001039 Acidophilus milk
A.01.001040 Kefir
A.01.001041 Buttermilk
A.01.001042 Kumis
A.01.001043 Cieddu
A.01.001044 Kaeder milk
A.01.001045 Skyr
A.01.001046 Taette
A.01.001047 Filmjölk
A.01.001048 Viili
Flavoured fermented milk products including heat-
treated products (1.4) (legislation: (EU) No 1129/2011,
applicable as of 01/06/2013)
qs 1.4 A.01.001032 Yoghurt, cow milk, with
fruit
5 000 0.33
Dehydrated milk as defined by Directive 2001/114/EC
(1.5) (legislation: (EU) No 1129/2011, applicable as of
01/06/2013)
qs 1.5 A.01.000981 Dried milk nr 1.00
Table continued overleaf.
43 Call for food additives usage level and/or concentration data in food and beverages intended for human consumption. Published: 27 March 2013. Deadline 15 September 2013. Available at:
http://www.efsa.europa.eu/en/data/call/130327.htm
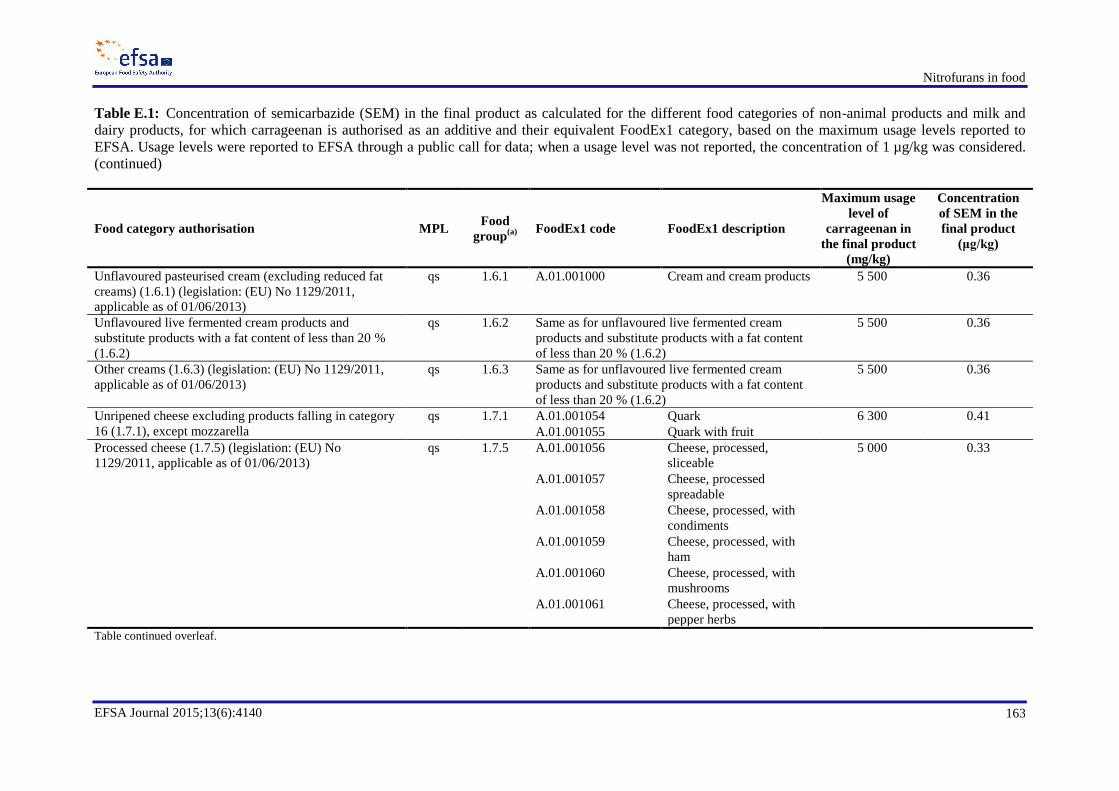
Nitrofurans in food
EFSA Journal 2015;13(6):4140 163
Table E.1: Concentration of semicarbazide (SEM) in the final product as calculated for the different food categories of non-animal products and milk and
dairy products, for which carrageenan is authorised as an additive and their equivalent FoodEx1 category, based on the maximum usage levels reported to
EFSA. Usage levels were reported to EFSA through a public call for data; when a usage level was not reported, the concentration of 1 µg/kg was considered.
(continued)
Food category authorisation MPL Food
group(a) FoodEx1 code FoodEx1 description
Maximum usage
level of
carrageenan in
the final product
(mg/kg)
Concentration
of SEM in the
final product
(μg/kg)
Unflavoured pasteurised cream (excluding reduced fat
creams) (1.6.1) (legislation: (EU) No 1129/2011,
applicable as of 01/06/2013)
qs 1.6.1 A.01.001000 Cream and cream products 5 500 0.36
Unflavoured live fermented cream products and
substitute products with a fat content of less than 20 %
(1.6.2)
qs 1.6.2 Same as for unflavoured live fermented cream
products and substitute products with a fat content
of less than 20 % (1.6.2)
5 500 0.36
Other creams (1.6.3) (legislation: (EU) No 1129/2011,
applicable as of 01/06/2013)
qs 1.6.3 Same as for unflavoured live fermented cream
products and substitute products with a fat content
of less than 20 % (1.6.2)
5 500 0.36
Unripened cheese excluding products falling in category
16 (1.7.1), except mozzarella
qs 1.7.1 A.01.001054 Quark 6 300 0.41
A.01.001055 Quark with fruit
Processed cheese (1.7.5) (legislation: (EU) No
1129/2011, applicable as of 01/06/2013)
qs 1.7.5 A.01.001056 Cheese, processed,
sliceable
5 000 0.33
A.01.001057 Cheese, processed
spreadable
A.01.001058 Cheese, processed, with
condiments
A.01.001059 Cheese, processed, with
ham
A.01.001060 Cheese, processed, with
mushrooms
A.01.001061 Cheese, processed, with
pepper herbs
Table continued overleaf.
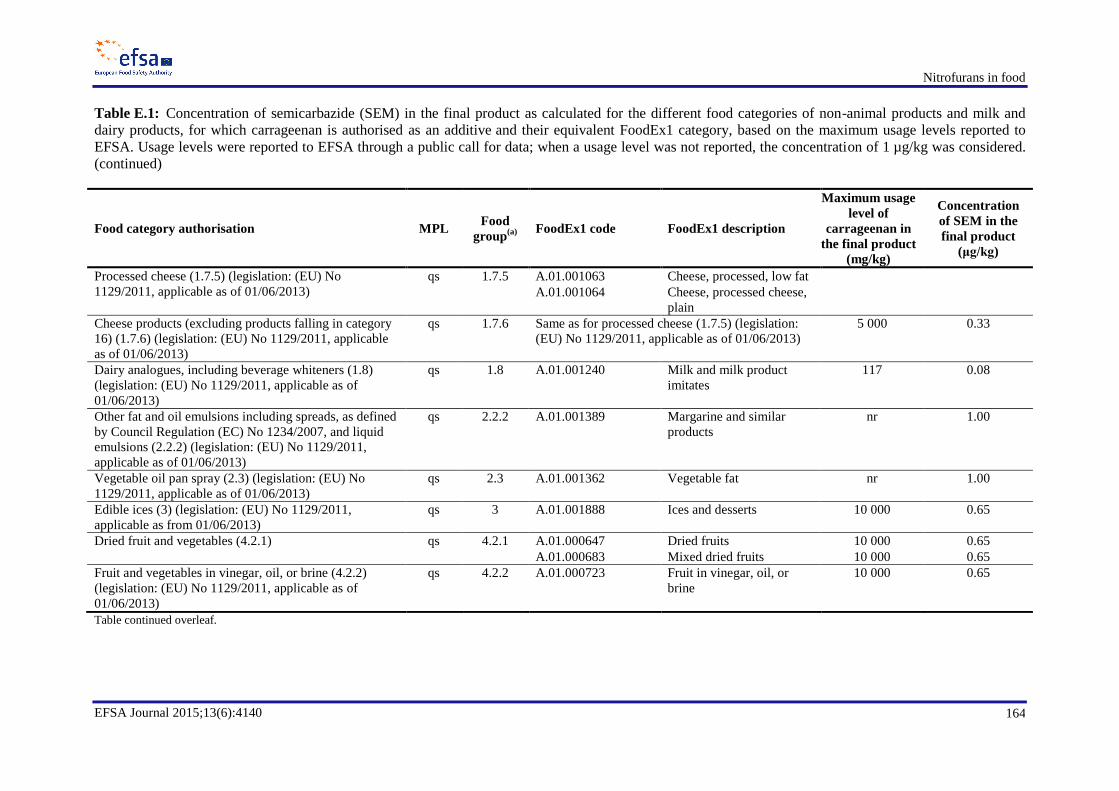
Nitrofurans in food
EFSA Journal 2015;13(6):4140 164
Table E.1: Concentration of semicarbazide (SEM) in the final product as calculated for the different food categories of non-animal products and milk and
dairy products, for which carrageenan is authorised as an additive and their equivalent FoodEx1 category, based on the maximum usage levels reported to
EFSA. Usage levels were reported to EFSA through a public call for data; when a usage level was not reported, the concentration of 1 µg/kg was considered.
(continued)
Food category authorisation MPL Food
group(a) FoodEx1 code FoodEx1 description
Maximum usage
level of
carrageenan in
the final product
(mg/kg)
Concentration
of SEM in the
final product
(μg/kg)
Processed cheese (1.7.5) (legislation: (EU) No
1129/2011, applicable as of 01/06/2013)
qs 1.7.5 A.01.001063 Cheese, processed, low fat
A.01.001064 Cheese, processed cheese,
plain
Cheese products (excluding products falling in category
16) (1.7.6) (legislation: (EU) No 1129/2011, applicable
as of 01/06/2013)
qs 1.7.6 Same as for processed cheese (1.7.5) (legislation:
(EU) No 1129/2011, applicable as of 01/06/2013)
5 000 0.33
Dairy analogues, including beverage whiteners (1.8)
(legislation: (EU) No 1129/2011, applicable as of
01/06/2013)
qs 1.8 A.01.001240 Milk and milk product
imitates
117 0.08
Other fat and oil emulsions including spreads, as defined
by Council Regulation (EC) No 1234/2007, and liquid
emulsions (2.2.2) (legislation: (EU) No 1129/2011,
applicable as of 01/06/2013)
qs 2.2.2 A.01.001389 Margarine and similar
products
nr 1.00
Vegetable oil pan spray (2.3) (legislation: (EU) No
1129/2011, applicable as of 01/06/2013)
qs 2.3 A.01.001362 Vegetable fat nr 1.00
Edible ices (3) (legislation: (EU) No 1129/2011,
applicable as from 01/06/2013)
qs 3 A.01.001888 Ices and desserts 10 000 0.65
Dried fruit and vegetables (4.2.1) qs 4.2.1 A.01.000647 Dried fruits 10 000 0.65
A.01.000683 Mixed dried fruits 10 000 0.65
Fruit and vegetables in vinegar, oil, or brine (4.2.2)
(legislation: (EU) No 1129/2011, applicable as of
01/06/2013)
qs 4.2.2 A.01.000723 Fruit in vinegar, oil, or
brine
10 000 0.65
Table continued overleaf.

Nitrofurans in food
EFSA Journal 2015;13(6):4140 165
Table E.1: Concentration of semicarbazide (SEM) in the final product as calculated for the different food categories of non-animal products and milk and
dairy products, for which carrageenan is authorised as an additive and their equivalent FoodEx1 category, based on the maximum usage levels reported to
EFSA. Usage levels were reported to EFSA through a public call for data; when a usage level was not reported, the concentration of 1 µg/kg was considered.
(continued)
Food category authorisation MPL Food
group(a) FoodEx1 code FoodEx1 description
Maximum usage
level of
carrageenan in
the final product
(mg/kg)
Concentration
of SEM in the
final product
(μg/kg)
Fruit and vegetable preparations excluding compote
(4.2.4.1) (legislation: (EU) No 1129/2011, applicable as
of 01/06/2013)
qs 4.2.4.1 A.01.000684 Fruit salad 10 000 0.65
A.01.000685 Fruit chips
A.01.000686 Fruit, purée
A.01.000687 Fruit cocktail
A.01.000714 Candied fruits
A.01.000724 Fermented fruit products
A.01.000725 Fruit fillings for pastries
A.01.000726 Fruit, chocolate coated
A.01.000449 Coconut milk (Cocos
nucifera)
300 0.02
Jam, jellies and marmalades and sweetened chestnut
purée, as defined by Directive 2001/113/EC (4.2.5.2)
(legislation: (EC) No 1333/2008, applicable as of
16/12/2008)
10 000 4.2.5.2 A.01.000657 Jam, marmalade and other
fruit spreads
10 000 0.65
Other similar fruit or vegetable spreads (4.2.5.3)
(legislation: (EU) No 1129/2011, applicable as of
01/06/2013)
10 000 4.2.5.3 Covered under jam, marmalade and other fruit
spreads
10 000 0.65
Nut butters and nut spreads (4.2.5.4) (legislation: (EU)
No 1129/2011, applicable as of 01/06/2013)
qs 4.2.5.4 Covered under vegetable fats
Processed potato products (4.2.6) (legislation: (EU) No
1129/2011, applicable as of 01/06/2013)
qs 4.2.6 A.01.000471 French fries 8 000 0.52
A.01.000477 Potato croquettes
A.01.001879 Potato crisps
Table continued overleaf.

Nitrofurans in food
EFSA Journal 2015;13(6):4140 166
Table E.1: Concentration of semicarbazide (SEM) in the final product as calculated for the different food categories of non-animal products and milk and
dairy products, for which carrageenan is authorised as an additive and their equivalent FoodEx1 category, based on the maximum usage levels reported to
EFSA. Usage levels were reported to EFSA through a public call for data; when a usage level was not reported, the concentration of 1 µg/kg was considered.
(continued)
Food category authorisation MPL Food
group(a) FoodEx1 code FoodEx1 description
Maximum usage
level of
carrageenan in
the final product
(mg/kg)
Concentration
of SEM in the
final product
(μg/kg)
Cocoa and chocolate products, as covered by Directive
2000/36/EC (5.1) ,only energy-reduced or with no added
sugars
qs 5.1 A.01.001295 Chocolate (Cocoa)
products
1 913 0.12
A.01.000421 Cocoa beverage-
preparation, powder
18 000 1.17
A.01.001532 Hot chocolate 288 0.02
Other confectionery including breath refreshening
microsweets (5.2) not be used in jelly mini-cups,
defined, for
the purpose of this Regulation, as jelly confectionery of
a firm consistency, contained in semi rigid
mini-cups or mini-capsules, intended to be ingested in a
single bite by exerting pressure on the mini-cups
or mini-capsule to project the confectionery into the
mouth
qs 5.2 A.01.001311 Candies, with sugar 980 0.06
A.01.001312 Candies, sugar free
A.01.001314 Caramel, hard
A.01.001315 Caramel, soft
A.01.001316 Toffee
A.01.001317 Fudge
A.01.001318 Dragée, sugar coated
A.01.001321 Liquorice candies
A.01.001322 Gum drops
A.01.001323 Jelly candies
Chewing gum (5.3) (legislation: (EU) No 1129/2011,
applicable as of 01/06/2013)
qs 5.3 A.01.001326 Chewing gum with added
sugar
15 000 0.98
A.01.001327 Chewing gum without
added sugar
Decorations, coatings and fillings, except fruit-based
fillings covered by category 4.2.4 (5.4) (legislation:
(EU) No 1129/2011, applicable as of 01/06/2013)
qs 5.4 A.01.001310 Confectionery (non-
chocolate)
6 500 0.42
Starches (6.2.2) (legislation: (EU) No 1129/2011,
applicable as of 01/06/2013)
qs 6.2.2 Not considered, as the codes covering starches in
the FoodEx1 classification are milling products and
not part of recipes
Table continued overleaf.
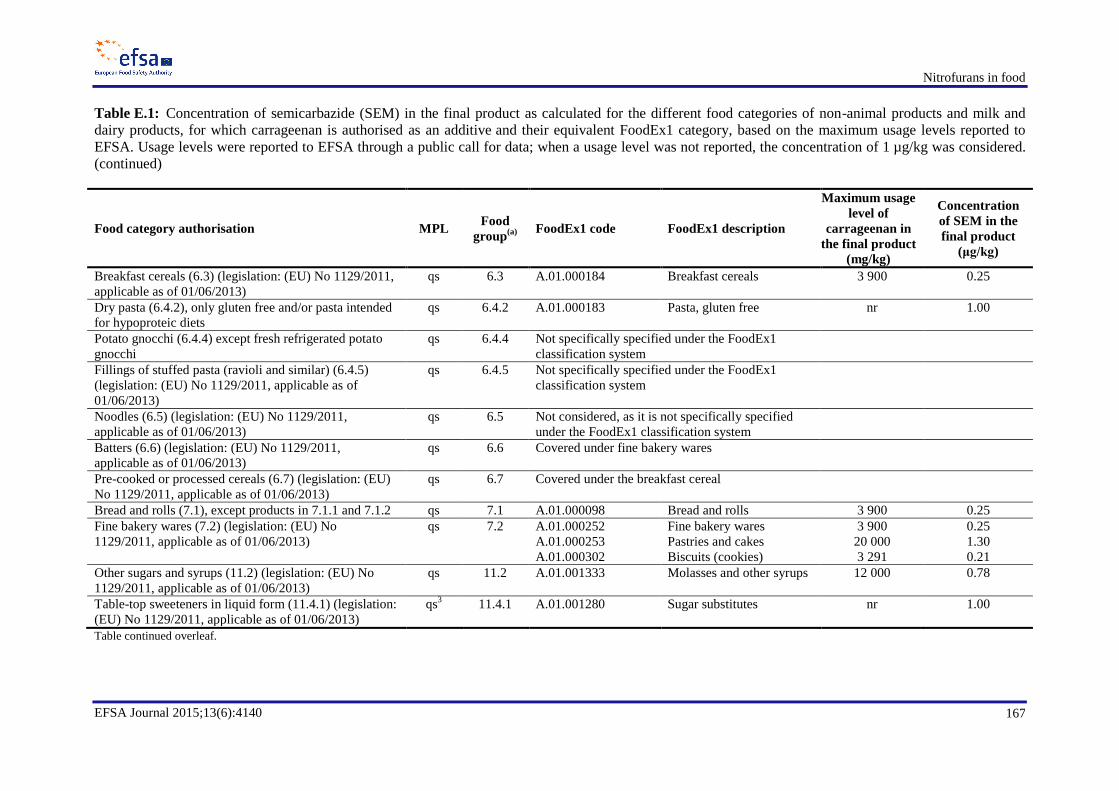
Nitrofurans in food
EFSA Journal 2015;13(6):4140 167
Table E.1: Concentration of semicarbazide (SEM) in the final product as calculated for the different food categories of non-animal products and milk and
dairy products, for which carrageenan is authorised as an additive and their equivalent FoodEx1 category, based on the maximum usage levels reported to
EFSA. Usage levels were reported to EFSA through a public call for data; when a usage level was not reported, the concentration of 1 µg/kg was considered.
(continued)
Food category authorisation MPL Food
group(a) FoodEx1 code FoodEx1 description
Maximum usage
level of
carrageenan in
the final product
(mg/kg)
Concentration
of SEM in the
final product
(μg/kg)
Breakfast cereals (6.3) (legislation: (EU) No 1129/2011,
applicable as of 01/06/2013)
qs 6.3 A.01.000184 Breakfast cereals 3 900 0.25
Dry pasta (6.4.2), only gluten free and/or pasta intended
for hypoproteic diets
qs 6.4.2 A.01.000183 Pasta, gluten free nr 1.00
Potato gnocchi (6.4.4) except fresh refrigerated potato
gnocchi
qs 6.4.4 Not specifically specified under the FoodEx1
classification system
Fillings of stuffed pasta (ravioli and similar) (6.4.5)
(legislation: (EU) No 1129/2011, applicable as of
01/06/2013)
qs 6.4.5 Not specifically specified under the FoodEx1
classification system
Noodles (6.5) (legislation: (EU) No 1129/2011,
applicable as of 01/06/2013)
qs 6.5 Not considered, as it is not specifically specified
under the FoodEx1 classification system
Batters (6.6) (legislation: (EU) No 1129/2011,
applicable as of 01/06/2013)
qs 6.6 Covered under fine bakery wares
Pre-cooked or processed cereals (6.7) (legislation: (EU)
No 1129/2011, applicable as of 01/06/2013)
qs 6.7 Covered under the breakfast cereal
Bread and rolls (7.1), except products in 7.1.1 and 7.1.2 qs 7.1 A.01.000098 Bread and rolls 3 900 0.25
Fine bakery wares (7.2) (legislation: (EU) No
1129/2011, applicable as of 01/06/2013)
qs 7.2 A.01.000252 Fine bakery wares 3 900 0.25
A.01.000253 Pastries and cakes 20 000 1.30
A.01.000302 Biscuits (cookies) 3 291 0.21
Other sugars and syrups (11.2) (legislation: (EU) No
1129/2011, applicable as of 01/06/2013)
qs 11.2 A.01.001333 Molasses and other syrups 12 000 0.78
Table-top sweeteners in liquid form (11.4.1) (legislation:
(EU) No 1129/2011, applicable as of 01/06/2013)
qs3 11.4.1 A.01.001280 Sugar substitutes nr 1.00
Table continued overleaf.

Nitrofurans in food
EFSA Journal 2015;13(6):4140 168
Table E.1: Concentration of semicarbazide (SEM) in the final product as calculated for the different food categories of non-animal products and milk and
dairy products, for which carrageenan is authorised as an additive and their equivalent FoodEx1 category, based on the maximum usage levels reported to
EFSA. Usage levels were reported to EFSA through a public call for data; when a usage level was not reported, the concentration of 1 µg/kg was considered.
(continued)
Food category authorisation MPL Food
group(a) FoodEx1 code FoodEx1 description
Maximum usage
level of
carrageenan in
the final product
(mg/kg)
Concentration
of SEM in the
final product
(μg/kg)
Table-top sweeteners in powder form (11.4.2)
(legislation: (EU) No 1129/2011, applicable as of
01/06/2013)
qs3 11.4.2 Covered by sugar substitutes
Salt substitutes (12.1.2) (legislation: (EU) No
1129/2011, applicable as of 01/06/2013)
qs 12.1.2 Not specifically specified under the FoodEx1
classification system
Seasonings and condiments (12.2.2) (legislation: (EU)
No 1129/2011, applicable as of 01/06/2013)
qs 12.2.2 A.01.001649 Condiment 3 300 0.21
Vinegars (12.3) (legislation: (EU) No 1129/2011,
applicable as of 01/06/2013)
qs 12.3 Covered by
condiments
Mustard (12.4) (legislation: (EU) No 1129/2011,
applicable as of 01/06/2013)
qs 12.4 Covered by
condiments
Soups and broths (12.5) (legislation: (EU) No
1129/2011, applicable as of 01/06/2013)
qs 12.5 A.01.001856 Ready-to-eat soups 109 0.01
Sauces (12.6) (legislation: (EU) No 1129/2011,
applicable as of 01/06/2013)
qs 12.6 A.01.001684 Savoury sauces 9 900 0.64
Salads and savoury-based sandwich spreads (12.7)
(legislation: (EU) No 1129/2011, applicable as of
01/06/2013)
qs 12.7 A.01.001665 Dressing 5 000 0.33
Yeast and yeast products (12.8) (legislation: (EU) No
1129/2011, applicable as of 01/06/2013)
qs 12.8 Not specifically specified under the FoodEx1
classification system
Protein products, excluding products covered in category
1.8 (12.9) (legislation: (EU) No 1129/2011, applicable
as of 01/06/2013)
qs 12.9 Not specifically specified under the FoodEx1
classification system
Follow-on formulae, as defined by Directive
2006/141/EC (13.1.2)
300 13.1.2 A.01.001722 Follow-on formulae 300 0.00
Table continued overleaf.

Nitrofurans in food
EFSA Journal 2015;13(6):4140 169
Table E.1: Concentration of semicarbazide (SEM) in the final product as calculated for the different food categories of non-animal products and milk and
dairy products, for which carrageenan is authorised as an additive and their equivalent FoodEx1 category, based on the maximum usage levels reported to
EFSA. Usage levels were reported to EFSA through a public call for data; when a usage level was not reported, the concentration of 1 µg/kg was considered.
(continued)
Food category authorisation MPL Food
group(a) FoodEx1 code FoodEx1 description
Maximum usage
level of
carrageenan in
the final product
(mg/kg)
Concentration
of SEM in the
final product
(μg/kg)
Other foods for young children (13.1.4) 300 13.1.4 A.01.001728 Cereal-based food for
infants and young children
300 0.00
A.01.001733 Ready-to-eat meals for
infants and young children
A.01.001739 Yoghurt, cheese and milk-
based desserts for infants
and young children
A.01.001743 Fruit juice and herbal tea
for infants and young
children
Dietary foods for special medical purposes, as defined in
Directive 1999/21/EC (excluding products from food
category (13.1.5) (13.2) (legislation: (EU) No
1129/2011, applicable as of 01/06/2013)
qs 13.2 A.01.001784 Medical food (are
specially formulated and
intended for the dietary
management of a disease
that has distinctive
nutritional needs that
cannot be met by normal
diet alone; intended to be
used under medical
supervision)
8 000 0.52
Dietary foods for weight control diets intended to
replace total daily food intake or an individual meal (the
whole or part of the total daily diet) (13.3) (legislation:
(EU) No 1129/2011, applicable as of 01/06/2013)
qs 13.3 A.01.001749 Food for weight reduction 5 000 0.33
Table continued overleaf.

Nitrofurans in food
EFSA Journal 2015;13(6):4140 170
Table E.1: Concentration of semicarbazide (SEM) in the final product as calculated for the different food categories of non-animal products and milk and
dairy products, for which carrageenan is authorised as an additive and their equivalent FoodEx1 category, based on the maximum usage levels reported to
EFSA. Usage levels were reported to EFSA through a public call for data; when a usage level was not reported, the concentration of 1 µg/kg was considered.
(continued)
Food category authorisation MPL Food
group(a) FoodEx1 code FoodEx1 description
Maximum usage
level of
carrageenan in
the final product
(mg/kg)
Concentration
of SEM in the
final product
(μg/kg)
Foods suitable for people intolerant to gluten, as defined
by Regulation (EC) No 41/2009 (13.4), including dry
pasta
qs 13.4 Covered under bread and rolls
Fruit juices, as defined by Directive 2001/112/EC, and
vegetable juices (14.1.2), only vegetables juices
qs 14.1.2 A.01.001394 Fruit and vegetable juices 450 0.03
Fruit nectars, as defined by Directive 2001/112/EC, and
vegetable nectars and similar products (14.1.3), only
vegetable nectars
qs 14.1.3 Covered under fruit and vegetable juices
Flavoured drinks (14.1.4) (legislation: (EU) No
1129/2011, applicable as of 01/06/2013)
qs 14.1.4 A.01.001471 Soft drinks 450 0.03
Other (14.1.5.2), excluding unflavoured leaf tea,
including flavoured instant coffee
qs 14.1.5.2 A.01.000963 Milk-based beverages 500 0.03
A.01.001527 Iced coffee 250 0.02
Cider and perry (14.2.3) (legislation: (EU) No
1129/2011, applicable as of 01/06/2013)
qs 14.2.3 A.01.001549 Wine-like drinks (e.g.
cider, perry)
20 0.00
Fruit wine and made wine (14.2.4) (legislation: (EU) No
1129/2011, applicable as of 01/06/2013)
qs 14.2.4 Covered by wine-like drinks 20 0.00
Mead (14.2.5) (legislation: (EU) No 1129/2011,
applicable as of 01/06/2013)
qs 14.2.5 Covered under wine-like drinks 20 0.00
Spirit drinks, as defined in Regulation (EC) No
110/2008 (14.2.6) ,except whisky or whiskey
qs 14.2.6 A.01.001561 Spirits 20 0.00
Aromatised wines (14.2.7.1) (legislation: (EU) No
1129/2011, applicable as of 01/06/2013)
qs 14.2.7.1 Covered under wine-like drinks 20 0.00
Table continued overleaf.

Nitrofurans in food
EFSA Journal 2015;13(6):4140 171
Table E.1: Concentration of semicarbazide (SEM) in the final product as calculated for the different food categories of non-animal products and milk and
dairy products, for which carrageenan is authorised as an additive and their equivalent FoodEx1 category, based on the maximum usage levels reported to
EFSA. Usage levels were reported to EFSA through a public call for data; when a usage level was not reported, the concentration of 1 µg/kg was considered.
(continued)
Food category authorisation MPL Food
group(a) FoodEx1 code FoodEx1 description
Maximum usage
level of
carrageenan in
the final product
(mg/kg)
Concentration
of SEM in the
final product
(μg/kg)
Aromatised wine-based drinks (14.2.7.2) (legislation:
(EU) No 1129/2011, applicable as of 01/06/2013)
qs 14.2.7.2 Covered under wine-like drinks 20 0.00
Aromatised wine-product cocktails (14.2.7.3)
(legislation: (EU) No 1129/2011, applicable as of
01/06/2013)
qs 14.2.7.3 A.01.001569 Alcoholic mixed drinks 20 0.00
Other alcoholic drinks, including mixtures of alcoholic
drinks with non-alcoholic drinks and spirits with less
than 15 % of alcohol (14.2.8)
qs 14.2.8 Covered under alcoholic mixed drinks
Potato-, cereal-, flour- or starch-based snacks (15.1)
(legislation: (EU) No 1129/2011, applicable as of
01/06/2013)
qs 15.1 A.01.001878 Snack food 8 000 0.52
Processed nuts (15.2) (legislation: (EU) No 1129/2011,
applicable as of 01/06/2013)
qs 15.2 Covered under snack food
Desserts, excluding products covered in categories 1, 3
and 4 (16) (legislation: (EU) No 1129/2011, applicable
as of 01/06/2013)
qs 16 Covered under ices and desserts 10 000 0.65
Food supplements supplied in a solid form, including
capsules and tablets and similar forms, excluding
chewable forms (17.1)
qs 17.1 A.01.001752 Dietary supplements 50 488 3.28
Food supplements supplied in a liquid form (17.2)
(legislation: (EU) No 1129/2011, applicable as of
01/06/2013)
qs 17.2 Covered under dietary supplements 50 488 3.28
Table continued overleaf.
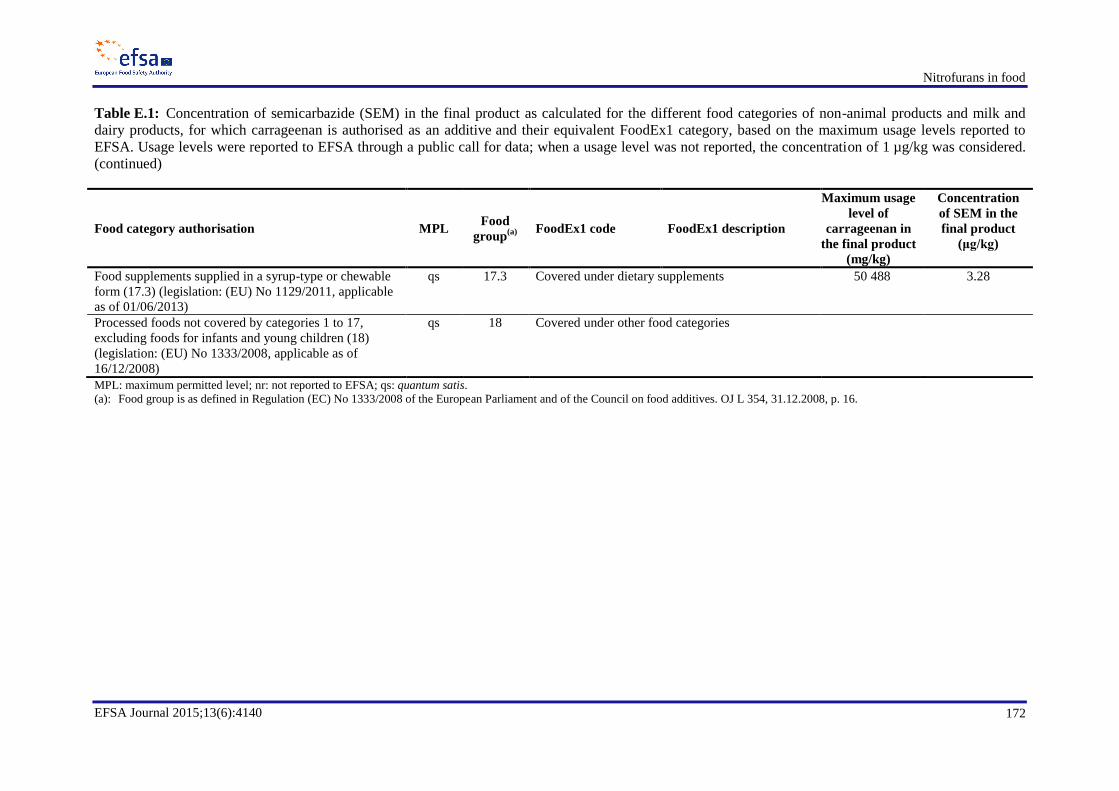
Nitrofurans in food
EFSA Journal 2015;13(6):4140 172
Table E.1: Concentration of semicarbazide (SEM) in the final product as calculated for the different food categories of non-animal products and milk and
dairy products, for which carrageenan is authorised as an additive and their equivalent FoodEx1 category, based on the maximum usage levels reported to
EFSA. Usage levels were reported to EFSA through a public call for data; when a usage level was not reported, the concentration of 1 µg/kg was considered.
(continued)
Food category authorisation MPL Food
group(a) FoodEx1 code FoodEx1 description
Maximum usage
level of
carrageenan in
the final product
(mg/kg)
Concentration
of SEM in the
final product
(μg/kg)
Food supplements supplied in a syrup-type or chewable
form (17.3) (legislation: (EU) No 1129/2011, applicable
as of 01/06/2013)
qs 17.3 Covered under dietary supplements 50 488 3.28
Processed foods not covered by categories 1 to 17,
excluding foods for infants and young children (18)
(legislation: (EU) No 1333/2008, applicable as of
16/12/2008)
qs 18 Covered under other food categories
MPL: maximum permitted level; nr: not reported to EFSA; qs: quantum satis.
(a): Food group is as defined in Regulation (EC) No 1333/2008 of the European Parliament and of the Council on food additives. OJ L 354, 31.12.2008, p. 16.

Nitrofurans in food
EFSA Journal 2015;13(6):4140 173
Appendix F. Dietary exposure for scenarios 2B and 2D
Table F.1: Summary statistics for the hypothetical chronic dietary exposure (ng/kg b.w. per day) to nitrofuran marker metabolites estimated by age class for
scenarios 2B and 2D.
Age class Number of surveys Scenario 2B
(a) Scenario 2D
(b)
Minimum Median Maximum Minimum Median Maximum
Mean dietary exposure
Infants 2 10 –(c)
11 7.7 –(c)
12
Toddlers 7 10 21 47 7.7 13 21
Other children 15 16 24 35 8.5 11 18
Adolescents 12 11 14 18 4.4 6.8 8.2
Adults 15 6.0 8.9 15 3.7 5.0 6.3
Elderly 7 4.4 6.7 9.1 3.4 4.0 4.9
Very elderly 6 5.2 6.5 9.2 3.2 4.3 4.7
95th percentile dietary exposure(d)
Infants 1 –(e)
–(e)
–(e)
–(f)
–(f)
–(f)
Toddlers 4 35 42 64 15 25 39
Other children 15 32 42 68 14 19 32
Adolescents 12 19 26 35 8.2 12 16
Adults 15 11 17 28 6.5 8.7 10.2
Elderly 7 8.8 11 17 5.6 7.1 8.3
Very elderly 5 8.5 11 17 5.4 8.0 8.4
The minimum, median and maximum of the mean and 95th percentile exposure values across dietary surveys in European countries are shown
To avoid the impression of too high precision, the numbers for all exposure estimates are rounded to two figures.
b.w.: body weight; SEM: semicarbazide; RPA: reference point for action.
(a): Scenario 2B contains foods of animal origin, excluding milk and dairy products, and foods of non-animal origin, for which carrageenan is authorised as an additive, contaminated with SEM
at a concentration equal to the RPA level of 1 µg/kg.
(b): Scenario 2D contains foods of animal origin, excluding milk and dairy products, contaminated with SEM at a concentration equal to the RPA level of 1 µg/kg, and foods of non-animal
origin and milk and dairy products, for which carrageenan is authorised as an additive, contaminated with SEM at concentrations calculated from maximum usage levels of carrageenan and
actual concentrations of SEM in carrageenan.
(c): Not calculated; estimates available only from two dietary surveys.
(d): The 95th percentile estimates obtained from dietary surveys/age classes with fewer than 60 observations may not be statistically robust (EFSA, 2011b) and therefore were not included in
this table.
(e): Estimates available from only one dietary survey: 29 ng/kg b.w. per day.
(f): Estimates available from only one dietary survey: 48 ng/kg b.w. per day.

Nitrofurans in food
EFSA Journal 2015;13(6):4140 174
Appendix G. Acute toxicity
Table G.1: Medium lethal doses (LD50) for furazolidone, 3-amino-2-oxazolidinone (AOZ), 3-amino-5-methylmorpholino-2-oxazolidinone (AMOZ),
nitrofurantoin, nitrofurazone and semicarbazide (SEM)
Animal species (age) Route of
administration LD50 (mg/kg b.w.) Comment Reference
Furazolidone
Rat (adult) Oral 1 508 Yellow powder in mixture with 1 %
methylcellulose
Mitchell et al. (1990a)
Mouse (adult) Oral 1 110 Yellow powder in mixture with 1 %
methylcellulose
Mitchell et al. (1990b)
AOZ
Rat Oral 2 739 Colourless crystals in distilled water NOTOX (1994b)
AMOZ
Rat Oral > 2 000 Colourless crystals NOTOX (1994a)
Nitrofurantoin
Rat (60 days) Oral 1 493 Nitrofurantoin sodium Goldenthal (1971)
Rat (1 day) Oral 89 Nitrofurantoin sodium Goldenthal (1971)
Rat (male) Oral 604 5–15 % acacia in water Preti (1970), as cited by NTP (1989 )
Rat (male) i.p. 112 5–15 % acacia in water Preti (1970), as cited by NTP (1989 )
Rat (50 days) s.c. 178 Nitrofurantoin sodium Goldenthal (1971
Rat (1 day) s.c. 152 Nitrofurantoin sodium Goldenthal (1971
Rat (adult) s.c. 35 Macrocrystals, vitamin E deficient diet Boyd et al. (1979)
Rat (adult) s.c. 400 Macrocrystals Boyd et al. (1979)
Mice oral 360 Chemical form not specified NIOSH (1983), as cited by NTP (1989)
Mice i.p. 150 Chemical form not specified NIOSH (1983), as cited by NTP (1989)
Chicken Oral 148 Macrocrystals Peterson et al. (1982)
Chicken Oral 53 Macrocrystals, selenium and vitamin E
deficient diet
Peterson et al. (1982)
Nitrofurazone
Rat Oral 590 Crystals in acacia solution Krantz and Evans (1945)
Rat Oral 590 Crystals Miyaji (1971)
Rat Oral 800 Chemical form not specified Anderson (1983), as cited by FAO/WHO,
(1989b)
Mice Oral 380 Macrocrystals Krantz and Evans (1945)
Mice Oral 640 Macrocrystals Miyaji (1971)
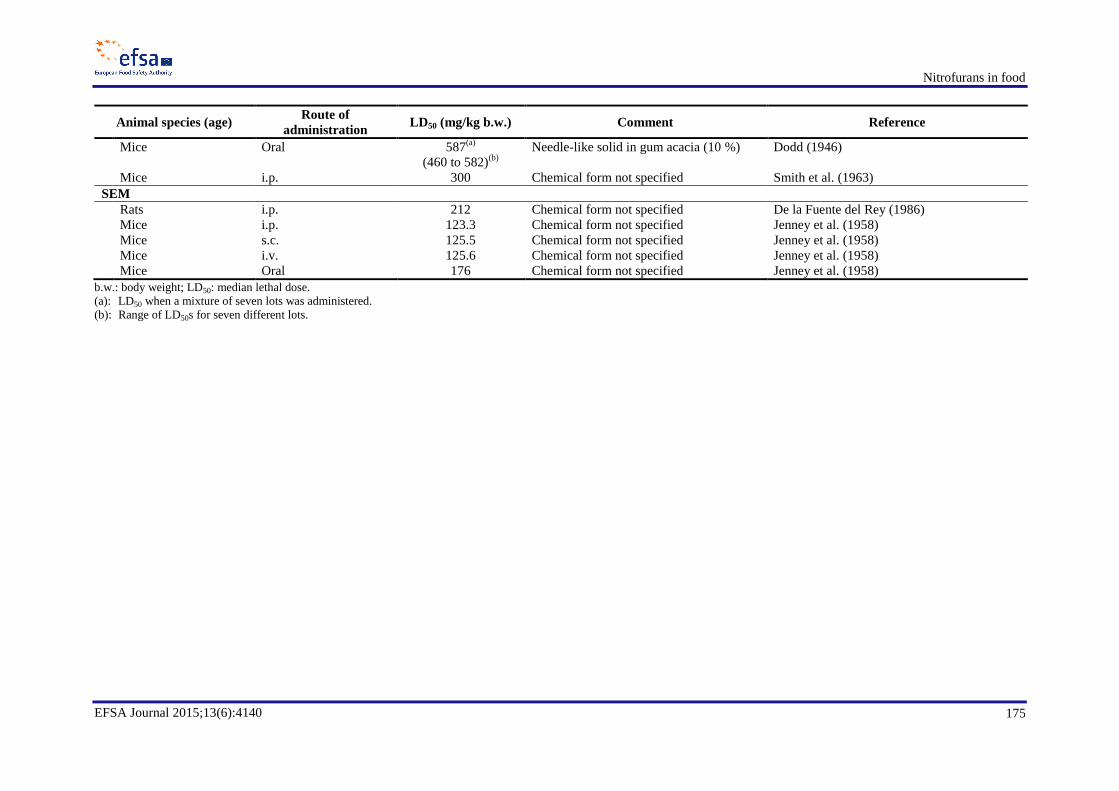
Nitrofurans in food
EFSA Journal 2015;13(6):4140 175
Animal species (age) Route of
administration LD50 (mg/kg b.w.) Comment Reference
Mice Oral 587(a)
(460 to 582)(b)
Needle-like solid in gum acacia (10 %) Dodd (1946)
Mice i.p. 300 Chemical form not specified Smith et al. (1963)
SEM
Rats i.p. 212 Chemical form not specified De la Fuente del Rey (1986)
Mice i.p. 123.3 Chemical form not specified Jenney et al. (1958)
Mice s.c. 125.5 Chemical form not specified Jenney et al. (1958)
Mice i.v. 125.6 Chemical form not specified Jenney et al. (1958)
Mice Oral 176 Chemical form not specified Jenney et al. (1958)
b.w.: body weight; LD50: median lethal dose.
(a): LD50 when a mixture of seven lots was administered.
(b): Range of LD50s for seven different lots.

Nitrofurans in food
EFSA Journal 2015;13(6):4140 176
Appendix H. In vitro and in vivo genotoxicity studies
Table H.1: In vitro and in vivo genotoxicity studies of furazolidone
Test organism/system Method Concentration/
Treatment
Metabolic
activation Outcome Reference
Vibrio cholera Forward mutation assay Up to 12 µg/mL – S9 mix Dose-dependent streptomycin resistance
forward mutation
Chatterjee et al.
(1983)
Escherichia coli PQ37 SOS Chromotest 0.05–25 nM/mL – S9 mix Dose-dependent induction of SOS response Akinshina et al.
(1992)
Salmonella enterica subsp.
enterica serovar
Typhimurium
TA1535/pSK1002
SOS/umu assay Up to 12 µg/mL – S9 mix Dose-dependent increase in the SOS response Pal et al. (1992)
E coli WP2; WP2s Reverse mutation assay 5–10 mM – S9 mix Dose-dependent induction of revertants Akinshina et al.
(1992)
E. coli strain TC3960
(ΔuvrB, pKM101)
Mutations in lacI gene 10 µM – S9 mix Induced mutation frequency 30 times over the
spontaneous frequency. Predominantly base
pair substitutions
Bertenyi and
Lambert (1996)
S. Typhimurium TA 100,
TA98
Reverse mutation assay 0.01–10 µg/plate
± S9 mix Furazolidone caused dose-dependent
induction of revertants (tested only in TA100)
Vroomen et al.
(1987a)
S. Typhimurium TA 98,
TA 98NR, TA 98/1,8-
DNP6
Reverse mutation assay 0.1–2.5 µg/plate ± S9 mix The highest dose was toxic in all strains.
Positive in all strains with and without S9 mix
Ni et al. (1987)
Drosophila melanogaster Sex-linked recessive
lethal test
0.18, 0.44 or 0.5 mM in
DMSO
± S9 mix Positive Kramers (1982)
CHO cells Gene mutation assay up to 125 µg/mL/5 hours ± S9 mix Positive. Toxic > 100 µg/mL Gao et al. (1989)
Isolated human
lymphocytes
In vitro chromosomal
aberration assay and
UDS
0.5–100 µM – S9 mix Negative. No data on toxicity Tonomura and
Sasaki (1973)
Isolated human
lymphocytes
In vitro chromosomal
aberration and SCE assay
0.2–20.0 µg/mL – S9 mix Significant increase in SCE at 0.2 and
2 µg/mL, and chromosome breaks at 2 µg/mL.
At 20 µg/mL the cells did not enter metaphase
Cohen and Sagi
(1979)
Isolated human
lymphocytes
SCE 2–10 µg/mL – S9 mix Significant increase in SCE frequency at
concentrations ≥ 4 µg/mL
Madrigal-Bujaidar
et al. (1997)
Bovine and porcine In vitro chromosomal 0.05–500 mg/L – S9 mix Positive. No toxicity was observed Queinnec et al.
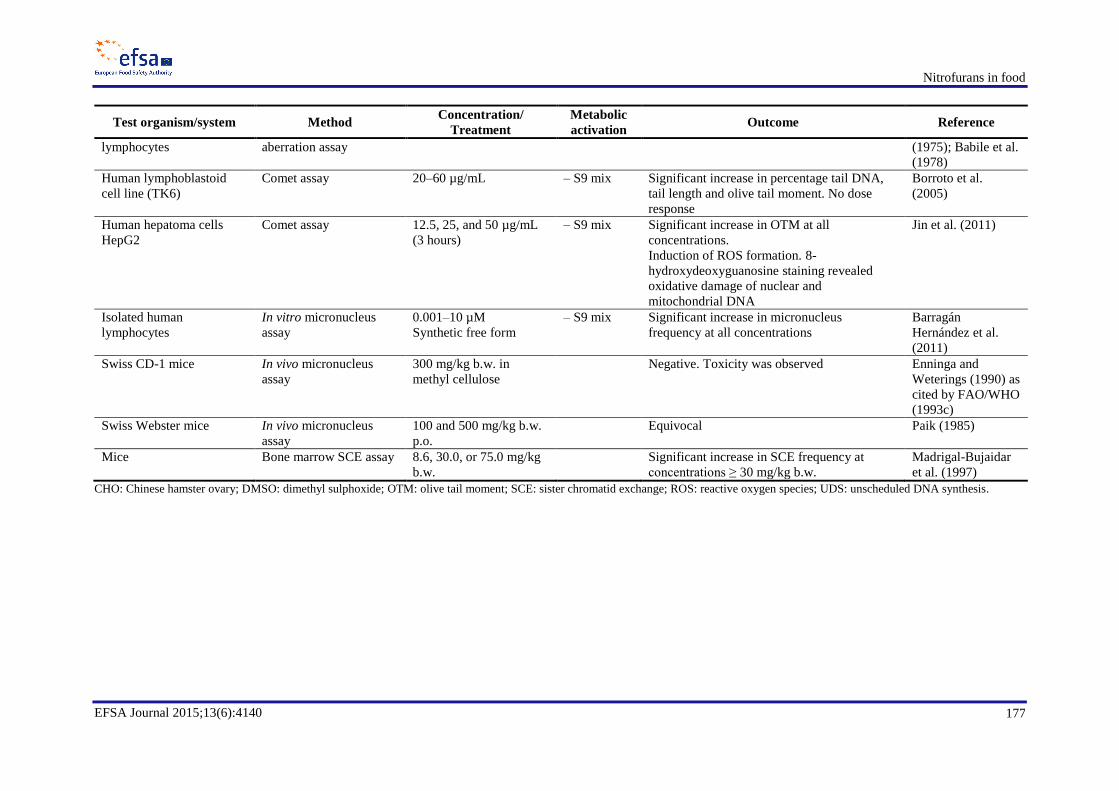
Nitrofurans in food
EFSA Journal 2015;13(6):4140 177
Test organism/system Method Concentration/
Treatment
Metabolic
activation Outcome Reference
lymphocytes aberration assay (1975); Babile et al.
(1978)
Human lymphoblastoid
cell line (TK6)
Comet assay 20–60 µg/mL – S9 mix Significant increase in percentage tail DNA,
tail length and olive tail moment. No dose
response
Borroto et al.
(2005)
Human hepatoma cells
HepG2
Comet assay
12.5, 25, and 50 µg/mL
(3 hours)
– S9 mix Significant increase in OTM at all
concentrations.
Induction of ROS formation. 8-
hydroxydeoxyguanosine staining revealed
oxidative damage of nuclear and
mitochondrial DNA
Jin et al. (2011)
Isolated human
lymphocytes
In vitro micronucleus
assay
0.001–10 µM
Synthetic free form
– S9 mix Significant increase in micronucleus
frequency at all concentrations
Barragán
Hernández et al.
(2011)
Swiss CD-1 mice In vivo micronucleus
assay
300 mg/kg b.w. in
methyl cellulose
Negative. Toxicity was observed Enninga and
Weterings (1990) as
cited by FAO/WHO
(1993c)
Swiss Webster mice In vivo micronucleus
assay
100 and 500 mg/kg b.w.
p.o.
Equivocal Paik (1985)
Mice Bone marrow SCE assay 8.6, 30.0, or 75.0 mg/kg
b.w.
Significant increase in SCE frequency at
concentrations ≥ 30 mg/kg b.w.
Madrigal-Bujaidar
et al. (1997)
CHO: Chinese hamster ovary; DMSO: dimethyl sulphoxide; OTM: olive tail moment; SCE: sister chromatid exchange; ROS: reactive oxygen species; UDS: unscheduled DNA synthesis.

Nitrofurans in food
EFSA Journal 2015;13(6):4140 178
Table H.2: In vitro and in vivo genotoxicity studies of the furazolidone metabolite 3-amino-2-oxazolidinone (AOZ)
Test organism/system Method Concentration/
treatment
Metabolic
activation Outcome Reference
DNA adduct formation in
mice liver in vivo
Electrochemical
detection of 7-
methylguanine and O6-
methylguanine
32, 125, 500 mg/kg b.w.
4 hours
An increase in the frequency of 7-
methyguanine, but no O6-methylguanine
deGroot and van
Zeeland (1994)
Salmonella Typhimurium
TA1537, TA98, TA1535,
TA100; Escherichia coli
WP2uvrA
Reverse mutation assay 100–5 000 µg/plate ± S9 mix In the absence of S9 mix, AOZ was positive in
TA1535. In the presence of S9 mix, it was
positive in TA1535, TA100 and WP2uvrA
(GLP)
NOTOX (1994f)
S. Typhimurium TA98,
TA100, TA1535, TA1537
Reverse mutation assay 0.1–5 mg/plate ± S9 mix Positive in TA1535 and TA100 in the
presence of metabolic activation. In the
absenceof metabolic activation, weak response
only in TA1535
Hoogenboom et al.
(2002)
Isolated human lymphocytes In vitro micronucleus
assay
0.0001–0.01 µM – S9 mix AOZ induced significant increase in
micronucleus frequency at 0.01 µM
Barragán Hernández
et al. (2011)
Isolated human lymphocytes In vitro chromosomal
aberration assay
1 000, 3 330,
5 000 µg/mL fixed after
24 hours, 5000 µg/mL
fixed after 48 hours
± S9 mix Dose-dependent induction of chromosomal
aberrations only in the absence of S9 mix
(GLP)
NOTOX (1994d)
Isolated human lymphocytes In vitro chromosomal
aberration assay
0.33–5 mg/mL ± S9 mix Dose-dependent induction of chromosomal
aberrations only in the absence of S9 mix
Hoogenboom et al.
(2002)
Swiss mice (OF-1 SPF-
quality; 7 weeks old)
In vivo micronucleus
assay
Male 500, 1 000 mg/kg
b.w.; female 1 000,
2 000 mg/kg b.w.; single
i.p. administration
sampling at 24 and 48
hours
Positive. High mortality was observed at the
higher doses. At lower doses statistically
significant increase of micronucelated PCE
was detected only at 24-hour sampling. The
animals treated with the lower dose were
lethargic (GLP)
NOTOX (1994g)
Swiss mice (OF-1, SPF-
quality; 7 weeks old)
In vivo micronucleus
assay
Male: 32–500 mg/kg
b.w.; female 250–
1 500 mg/kg b.w.; single
i.p. administration,
sampling at 24 and 48
hours
Positive: Statistically significant increase in
micronucelated PCE was detected only at 48-
hour sampling in the highest dose group
males. Large differences in toxicity and
mortality were observed indicating possible
non-genotoxic mechanism (GLP)
NOTOX (1994h)
b.w.: body weight; GLP: good laboratory practice; PCE: polychromosome erythrocyte.

Nitrofurans in food
EFSA Journal 2015;13(6):4140 179
Table H.3: In vitro and in vivo genotoxicity studies of nitrofurantoin
Test organism/system Method Concentration/
Treatment
Metabolic
activation Outcome Reference
Escherichia coli B/r and nrf
270
Single DNA strand
breaks
50 µg/mL – S9 mix Positive in B/r strain, negative in nrf270 strain
that lacks nitrofurazone reductase activity
McCalla et al.
(1971)
E. coli B/r rec+, RecA and
RecB; Salmonella
Typhimurium TA1978,
TA1538
DNA repair test 0.5 µM – S9 mix Positive in E. coli and in S. Typhiumurium Yahagi et al. (1974)
E. coli WP2; S.
Typhimurium TA1535,
TA1536, TA1537, TA1538
Reverse mutation assay
0.003–0.3 µM – S9 mix Positive in E. coli; negative in S.
Typhimurium
Yahagi et al.( 1974)
S. Typhimurium TA100,
TA100FR
Reverse mutation assay 0.3, 3 µg/plate.
Urine of rats fed with
feed containing 0.5 %
nitrofurantoin
– S9 mix Positive. Urine positive Wang and Lee
(1976)
E. coli WP2, WP2uvrA Reverse mutation assay 10, 100 µg/plate ± S9 mix Positive. The WPuvrA strain was more
sensitive than the wild-type WP2
McCalla and
Voutsinos (1974) ;
Setnikar et al.
(1976); Lu et al.
(1979)
E. coli WP2, EE97
(WP2pkM101);
S. Typhimurium TA97,
Reverse mutation assay
(fluctuation assay)
Below MIC: WP2 0.2;
0.4 µg/mL; EE97 0.1,
0.2 µg/mL; TA97: 0.32;
0.64 µg/mL
– S9 mix Positive in all strains below the MIC Obaseiki-Ebor and
Akerele (1986)
S. Typhimurium TA98,
TA100, TA1535, TA1538
Reverse mutation assay 0.025–5 µg/plate ± S9 mix Positive in TA98 and TA100. Negative in
TA1535 and TA1538
Goodman et al.
(1977); DeFlora,
(1979)
S. Typhimurium TA100,
TA100FRI
Reverse mutation assay 2 and 10 µg/plate ± S9 mix Positive in TA100, negative in nitroreductase
deficient strain TA100FRI
Rosenkranz and
Speck (1976)
S. Typhimurium TA98,
TA100; TA1535, TA1537,
TA1538
Reverse mutation assay No information ± S9 mix Positive in TA100 and TA98 (potency 775
revertants/nmol); negative in TA1535,
TA1537 and TA1538
DeFlora et al. (1984)
Table continued overleaf.
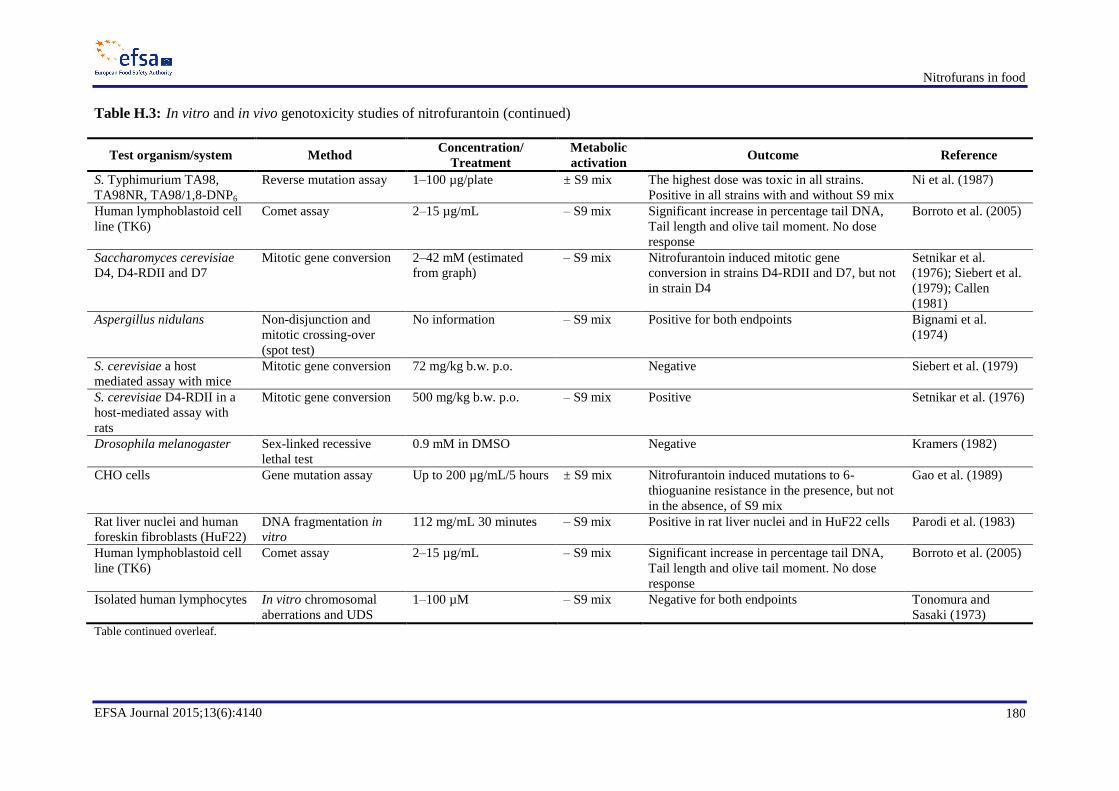
Nitrofurans in food
EFSA Journal 2015;13(6):4140 180
Table H.3: In vitro and in vivo genotoxicity studies of nitrofurantoin (continued)
Test organism/system Method Concentration/
Treatment
Metabolic
activation Outcome Reference
S. Typhimurium TA98,
TA98NR, TA98/1,8-DNP6
Reverse mutation assay 1–100 µg/plate ± S9 mix The highest dose was toxic in all strains.
Positive in all strains with and without S9 mix
Ni et al. (1987)
Human lymphoblastoid cell
line (TK6)
Comet assay 2–15 µg/mL – S9 mix Significant increase in percentage tail DNA,
Tail length and olive tail moment. No dose
response
Borroto et al. (2005)
Saccharomyces cerevisiae
D4, D4-RDII and D7
Mitotic gene conversion 2–42 mM (estimated
from graph)
– S9 mix Nitrofurantoin induced mitotic gene
conversion in strains D4-RDII and D7, but not
in strain D4
Setnikar et al.
(1976); Siebert et al.
(1979); Callen
(1981)
Aspergillus nidulans Non-disjunction and
mitotic crossing-over
(spot test)
No information – S9 mix Positive for both endpoints Bignami et al.
(1974)
S. cerevisiae a host
mediated assay with mice
Mitotic gene conversion 72 mg/kg b.w. p.o. Negative Siebert et al. (1979)
S. cerevisiae D4-RDII in a
host-mediated assay with
rats
Mitotic gene conversion 500 mg/kg b.w. p.o. – S9 mix Positive Setnikar et al. (1976)
Drosophila melanogaster Sex-linked recessive
lethal test
0.9 mM in DMSO Negative Kramers (1982)
CHO cells Gene mutation assay Up to 200 µg/mL/5 hours ± S9 mix Nitrofurantoin induced mutations to 6-
thioguanine resistance in the presence, but not
in the absence, of S9 mix
Gao et al. (1989)
Rat liver nuclei and human
foreskin fibroblasts (HuF22)
DNA fragmentation in
vitro
112 mg/mL 30 minutes – S9 mix Positive in rat liver nuclei and in HuF22 cells Parodi et al. (1983)
Human lymphoblastoid cell
line (TK6)
Comet assay 2–15 µg/mL – S9 mix Significant increase in percentage tail DNA,
Tail length and olive tail moment. No dose
response
Borroto et al. (2005)
Isolated human lymphocytes In vitro chromosomal
aberrations and UDS
1–100 µM – S9 mix Negative for both endpoints Tonomura and
Sasaki (1973)
Table continued overleaf.

Nitrofurans in food
EFSA Journal 2015;13(6):4140 181
Table H.3: In vitro and in vivo genotoxicity studies of nitrofurantoin (continued)
Test organism/system Method Concentration/
Treatment
Metabolic
activation Outcome Reference
Isolated human lymphocytes In vitro chromosomal
aberrations and SCE
5, 20, 40 µM 24 hours – S9 mix A significant increase of chromatide-type
chromosomal aberrations and SCE at 20 and
40 µM
Slapsyte et al. (2002)
NMRI mice In vivo chromosomal
aberration in
spermatocytes
8 or 40 mg/kg b.w. i.p.
for 5 days
Negative Fonatsch (1977)
Mice Dominant lethal test 16 and 80 mg/kg b.w. i.p. Negative Epstein et al. (1972)
Sprague–Dawley rats In vivo micronucleus
assay
50, 100, 200 mg/kg b.w.
i.p.—half dosed 30 hours
and half 6 hours before
sacrifice
Negative. No evidence that the compound
reached target tissue is given. Positive control
thiethylenemelamine gave positive response
Goodman et al.
(1977)
Sprague–Dawley rats, Swiss
mice
In vivo DNA
fragmentation
14–112 mg/kg b.w. i.p.
Sacrificed between 6 and
168 hours after
administration
DNA fragmentation in liver, spleen, kidney,
lung, bone marrow. In kidney also at
14 mg/kg b.w.
Parodi et al. (1983)
Swiss mice In vivo bone marrow
SCE
32, 64 mg/kg b.w. i.p.
Sampling 24 and 72
hours after
administration
Dose-dependent increase in SCE frequency Parodi et al. (1983)
BALB/C mice (3 and 8
weeks old)
In vivo micronucleus
assay
5, 10, 50 mg/kg b.w.;
single i.p. injection
before and 48, 96, 168
and 336 hours after
administration
Significant increase in the frequency of
micronucleus at all doses. In old but not young
animals the micronucleus frequency dropped
to the frequency before administration
Fucić et al. (2005)
Male Big BlueTM
C57BL/6[LIZ] mice
Transgenic mouse
mutation assay
167 mg/kg b.w.; p.o five
consecutive days/20 days
after last administration
Frequency of cII gene mutations from the
shuttle vector was determined in different
organs. More than 1.5-fold mutant frequency
increase only in kidney
Quillardet et al.
(2006)
Table continued overleaf.
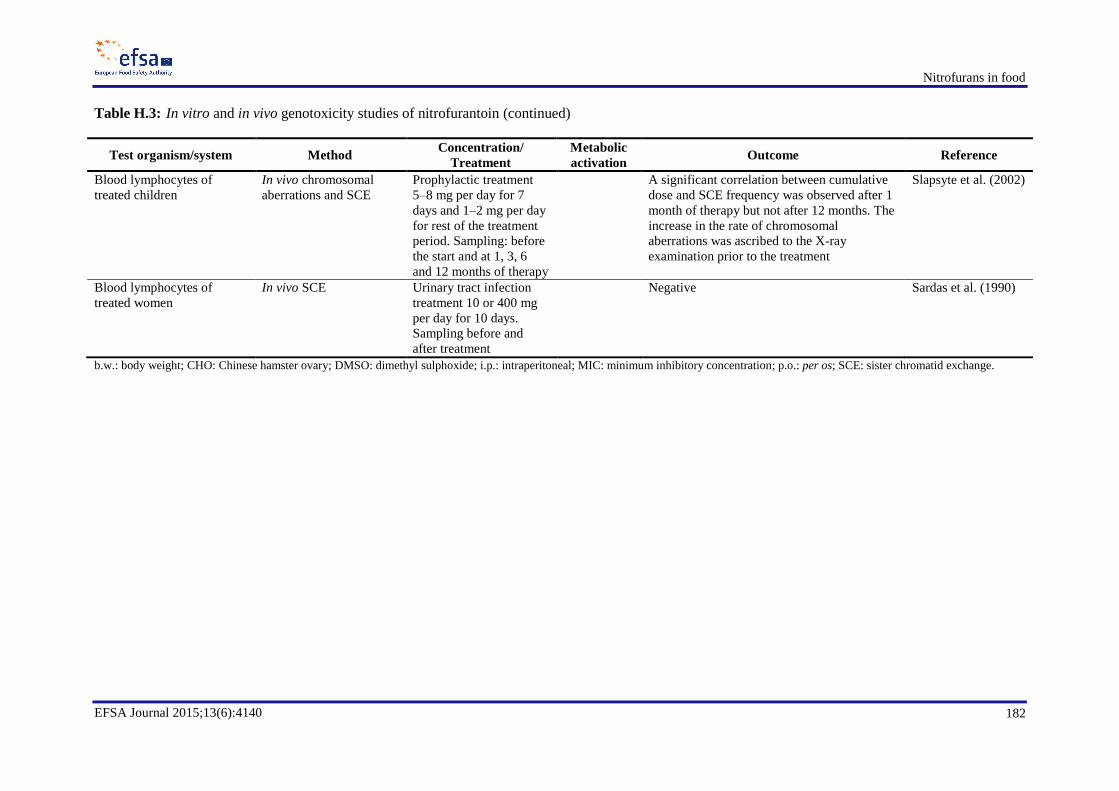
Nitrofurans in food
EFSA Journal 2015;13(6):4140 182
Table H.3: In vitro and in vivo genotoxicity studies of nitrofurantoin (continued)
Test organism/system Method Concentration/
Treatment
Metabolic
activation Outcome Reference
Blood lymphocytes of
treated children
In vivo chromosomal
aberrations and SCE
Prophylactic treatment
5–8 mg per day for 7
days and 1–2 mg per day
for rest of the treatment
period. Sampling: before
the start and at 1, 3, 6
and 12 months of therapy
A significant correlation between cumulative
dose and SCE frequency was observed after 1
month of therapy but not after 12 months. The
increase in the rate of chromosomal
aberrations was ascribed to the X-ray
examination prior to the treatment
Slapsyte et al. (2002)
Blood lymphocytes of
treated women
In vivo SCE Urinary tract infection
treatment 10 or 400 mg
per day for 10 days.
Sampling before and
after treatment
Negative Sardas et al. (1990)
b.w.: body weight; CHO: Chinese hamster ovary; DMSO: dimethyl sulphoxide; i.p.: intraperitoneal; MIC: minimum inhibitory concentration; p.o.: per os; SCE: sister chromatid exchange.
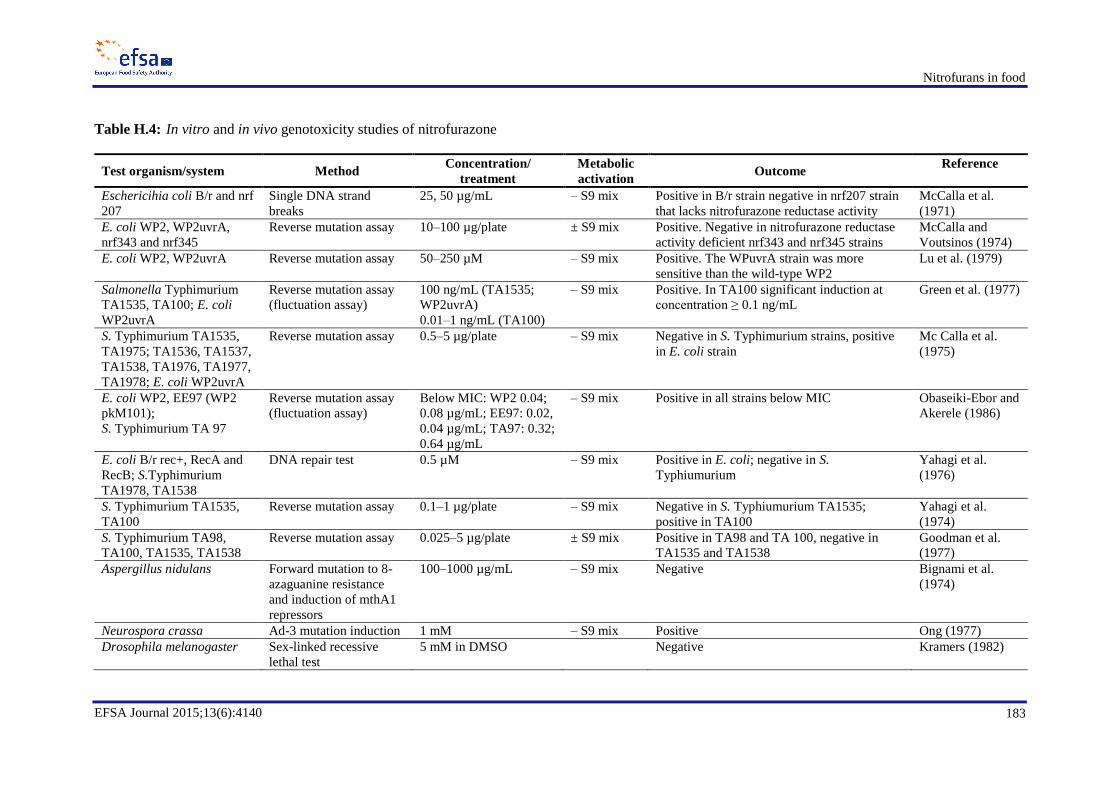
Nitrofurans in food
EFSA Journal 2015;13(6):4140 183
Table H.4: In vitro and in vivo genotoxicity studies of nitrofurazone
Test organism/system Method Concentration/
treatment
Metabolic
activation Outcome
Reference
Eschericihia coli B/r and nrf
207
Single DNA strand
breaks
25, 50 µg/mL – S9 mix Positive in B/r strain negative in nrf207 strain
that lacks nitrofurazone reductase activity
McCalla et al.
(1971)
E. coli WP2, WP2uvrA,
nrf343 and nrf345
Reverse mutation assay 10–100 µg/plate ± S9 mix Positive. Negative in nitrofurazone reductase
activity deficient nrf343 and nrf345 strains
McCalla and
Voutsinos (1974)
E. coli WP2, WP2uvrA Reverse mutation assay 50–250 µM – S9 mix Positive. The WPuvrA strain was more
sensitive than the wild-type WP2
Lu et al. (1979)
Salmonella Typhimurium
TA1535, TA100; E. coli
WP2uvrA
Reverse mutation assay
(fluctuation assay)
100 ng/mL (TA1535;
WP2uvrA)
0.01–1 ng/mL (TA100)
– S9 mix Positive. In TA100 significant induction at
concentration ≥ 0.1 ng/mL
Green et al. (1977)
S. Typhimurium TA1535,
TA1975; TA1536, TA1537,
TA1538, TA1976, TA1977,
TA1978; E. coli WP2uvrA
Reverse mutation assay 0.5–5 µg/plate – S9 mix Negative in S. Typhimurium strains, positive
in E. coli strain
Mc Calla et al.
(1975)
E. coli WP2, EE97 (WP2
pkM101);
S. Typhimurium TA 97
Reverse mutation assay
(fluctuation assay)
Below MIC: WP2 0.04;
0.08 µg/mL; EE97: 0.02,
0.04 µg/mL; TA97: 0.32;
0.64 µg/mL
– S9 mix Positive in all strains below MIC Obaseiki-Ebor and
Akerele (1986)
E. coli B/r rec+, RecA and
RecB; S.Typhimurium
TA1978, TA1538
DNA repair test 0.5 µM – S9 mix Positive in E. coli; negative in S.
Typhiumurium
Yahagi et al.
(1976)
S. Typhimurium TA1535,
TA100
Reverse mutation assay 0.1–1 µg/plate – S9 mix Negative in S. Typhiumurium TA1535;
positive in TA100
Yahagi et al.
(1974)
S. Typhimurium TA98,
TA100, TA1535, TA1538
Reverse mutation assay 0.025–5 µg/plate ± S9 mix Positive in TA98 and TA 100, negative in
TA1535 and TA1538
Goodman et al.
(1977)
Aspergillus nidulans Forward mutation to 8-
azaguanine resistance
and induction of mthA1
repressors
100–1000 µg/mL – S9 mix Negative Bignami et al.
(1974)
Neurospora crassa Ad-3 mutation induction 1 mM – S9 mix Positive Ong (1977)
Drosophila melanogaster Sex-linked recessive
lethal test
5 mM in DMSO Negative Kramers (1982)

Nitrofurans in food
EFSA Journal 2015;13(6):4140 184
Test organism/system Method Concentration/
treatment
Metabolic
activation Outcome
Reference
Mouse L929, Hamster
BHK-21, human KB cells
DNA strand breaks 125–500 µM 90 minutes – S9 mix Positive Olive and McCalla
(1975)
Human lymphoblastoid cell
line (TK6)
Comet assay 5–30 µg/mL – S9 mix Significant increase in percentage tail DNA,
tail length and olive tail moment. No dose
response
Borroto et al.
(2005)
Chinese hamster lung cells
(CHL)
Chromosomal
aberrations
0.1 mg/mL ± S9 mix Negative without metabolic activation,
positive with metabolic activation
Matsuoka et al.
(1979)
Isolated human lymphocytes In vitro chromosomal
aberrations and UDS
1–100 µM – S9 mix Negative for both endpoints Tonomura and
Sasaki (1973)
CHO cells Chromosomal
aberrations, HGPRT
mutations
25–200 µg/mL for
2 hours
± S9 mix Positive for chromosomal aberrations. Weak
mutagenic response without dose response
Anderson and
Philips (1985)
Male Wistar rats Chromosomal
aberrations in bone
marrow
Single dosage 40, 120,
400 mg/kg b.w. sampling
after 6, 24, 48 hours: five
daily doses of 15, 45 or
150 mg/kg b.w. sampling
6 hours after the last
dosage
Negative. Mitotic index was decreased at
400 mg/kg b.w. The positive control EMS
gave positive response in both treatment
schedules
Anderson and
Philips (1985)
Sprague–Dawley rats In vivo micronucleus
assay; chromosomal
aberrations
15, 30, 60 mg/kg b.w.
i.p.—half dosed 30 hours
and half 6 hours before
sacrifice
Negative. No evidence that the compound
reached target tissue is given. Positive control
thiethylenemelamine gave positive response
Goodman et al.
(1977)
b.w.: body weight; CHL: Chinese hamster lung; CHO: Chinese hamster ovary; DMSO: dimethyl sulphoxide; EMS: ethyl methanesulphonate; i.p.: intraperintoneal; MIC: minimum inhibitory
concentration; UDS: unscheduled DNA synthesis.

Nitrofurans in food
EFSA Journal 2015;13(6):4140 185
Table H.5: In vitro and in vivo genotoxicity studies of semicarbazide
Test organism/system Method Concentration/
treatment
Metabolic
activation Outcome Reference
Salmonella Typhimurium
G46, C3076, D3052,
TA1535, TA1537, TA1538,
TA98, TA100; Eschericihia
coli WP2, WP2uvrA
Reverse mutation
assay—modified
protocol
No data ± S9 mix Negative McMahon et al.
(1979)
S. Typhimurium TA1535,
TA1537, TA1538, TA98,
TA100
Reverse mutation assay No data ± S9 mix Positive only in TA1535; the activity
decreased in the presence of metabolic
activation
DeFlora et al.
(1981); DeFlora
et al. (1984)
S. Typhimurium TA1535,
TA1537, TA98, TA100 and
TA102
Reverse mutation assay 50–7 000 µg/plate ± S9 mix Positive only in TA1535 at doses
≥ 5000 µg/plate only in the absence of
metabolic activation (GLP)
Herbold (2003)
S. Typhimurium TA1535,
TA1537, TA98 and TA100,
and E. coli WP2uvrA
Reverse mutation assay 62–5 000 µg/plate ± S9 mix Dose-dependent increase of revenants in
TA1535. Higher activity without metabolic
activation. Borderline activity in TA100
without metabolic activation
TNO (2004a)
L5178Y cells In vitro forward mutation
assay at tk locus
0.21–10.0 mM ± S9 mix Positive without metabolic activation. With
metabolic activation slight increase of mutant
colonies at the highest concentration
TNO (2004b)
CHO cells In vitro chromosomal
aberration
75–1 115 µg/mL, 4, 18, 32
hours exposure; sampling
after 18 and 32 hours
± S9 mix Negative for chromosomal aberration. With
metabolic activation after 18 hours increase in
endoreduplicated cells
TNO (2004c)
Chinese hamster V79 cells In vitro chromosomal
aberration
125–1 120 µg/mL
sampling after 4 and 18
hours
± S9 mix Negative (GLP) Herbold (2004)
Isolated human lymphocytes In vitro micronucleus
and SCE assays
0.5–20 µg/mL – S9 mix No significant increase in micronucleus and
SCE frequency over the control
Vlastos et al.
(2010)
Male mice Balb/C and CBA In vivo micronucleus
(flow-cytometry
determination)
Single i.p. dose 40, 80 or
120 mg/kg b.w.; blood
sampling after 42 hours
Negative: no increase in micronucleus
frequency, no suppression of the percentage
PCE. The positive control, colchicine, gave a
positive response
Abramsson-
Zetterberg and
Svensson (2005)
Female CD-1 mice In vivo UDS in liver Single p.o. dose 100 or
200 mg/kg b.w.; sampling
Negative. Positive controls induced marked
increase in UDS compared with vehicle
CTL (2004)
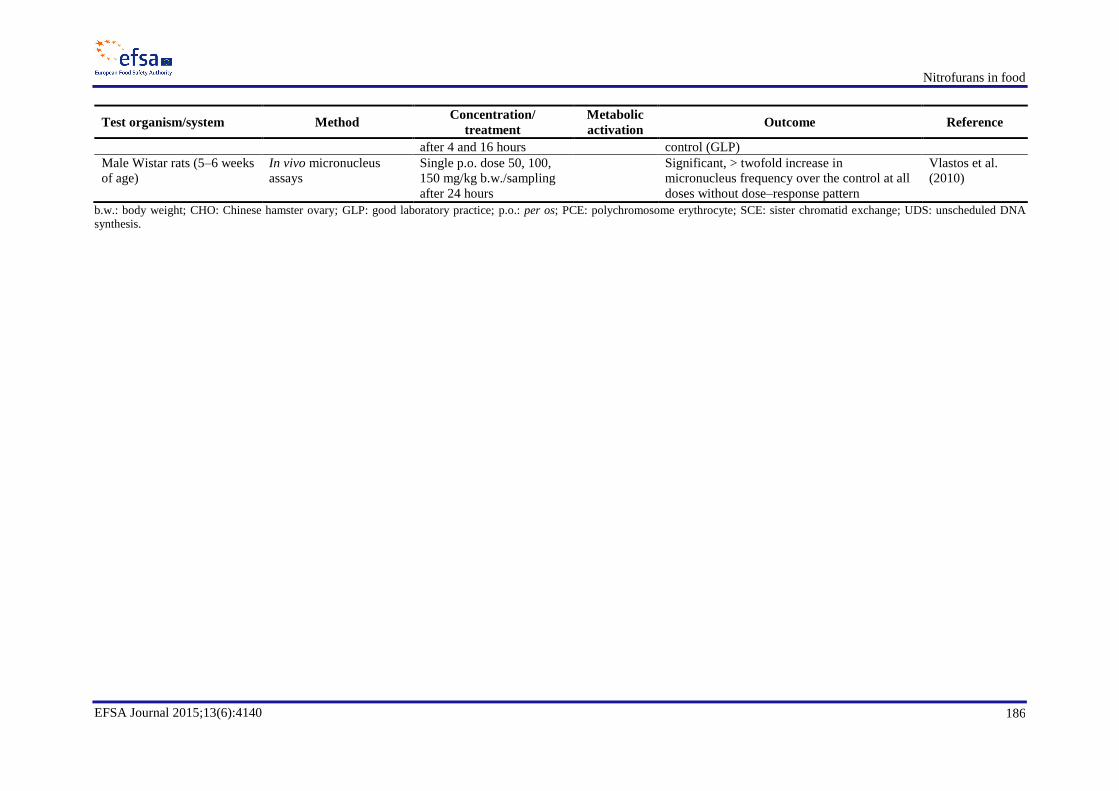
Nitrofurans in food
EFSA Journal 2015;13(6):4140 186
Test organism/system Method Concentration/
treatment
Metabolic
activation Outcome Reference
after 4 and 16 hours control (GLP)
Male Wistar rats (5–6 weeks
of age)
In vivo micronucleus
assays
Single p.o. dose 50, 100,
150 mg/kg b.w./sampling
after 24 hours
Significant, > twofold increase in
micronucleus frequency over the control at all
doses without dose–response pattern
Vlastos et al.
(2010)
b.w.: body weight; CHO: Chinese hamster ovary; GLP: good laboratory practice; p.o.: per os; PCE: polychromosome erythrocyte; SCE: sister chromatid exchange; UDS: unscheduled DNA
synthesis.
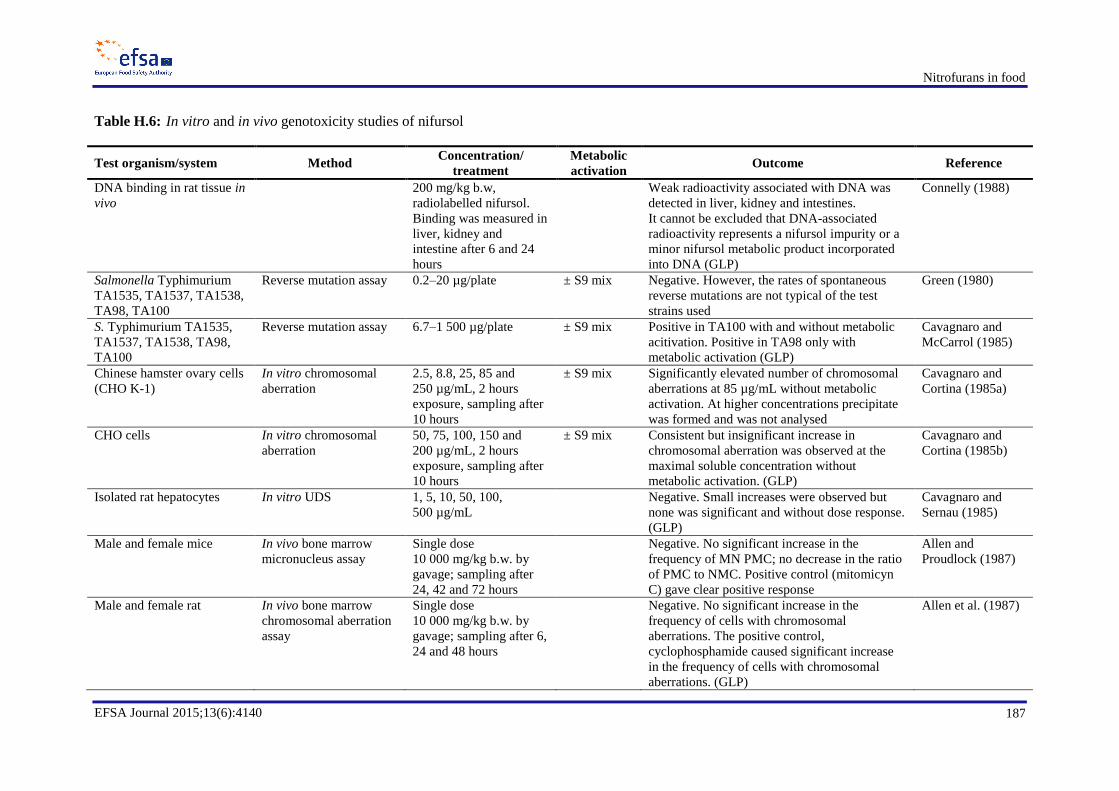
Nitrofurans in food
EFSA Journal 2015;13(6):4140 187
Table H.6: In vitro and in vivo genotoxicity studies of nifursol
Test organism/system Method Concentration/
treatment
Metabolic
activation Outcome Reference
DNA binding in rat tissue in
vivo
200 mg/kg b.w,
radiolabelled nifursol.
Binding was measured in
liver, kidney and
intestine after 6 and 24
hours
Weak radioactivity associated with DNA was
detected in liver, kidney and intestines.
It cannot be excluded that DNA-associated
radioactivity represents a nifursol impurity or a
minor nifursol metabolic product incorporated
into DNA (GLP)
Connelly (1988)
Salmonella Typhimurium
TA1535, TA1537, TA1538,
TA98, TA100
Reverse mutation assay 0.2–20 µg/plate ± S9 mix Negative. However, the rates of spontaneous
reverse mutations are not typical of the test
strains used
Green (1980)
S. Typhimurium TA1535,
TA1537, TA1538, TA98,
TA100
Reverse mutation assay 6.7–1 500 µg/plate ± S9 mix Positive in TA100 with and without metabolic
acitivation. Positive in TA98 only with
metabolic activation (GLP)
Cavagnaro and
McCarrol (1985)
Chinese hamster ovary cells
(CHO K-1)
In vitro chromosomal
aberration
2.5, 8.8, 25, 85 and
250 µg/mL, 2 hours
exposure, sampling after
10 hours
± S9 mix Significantly elevated number of chromosomal
aberrations at 85 µg/mL without metabolic
activation. At higher concentrations precipitate
was formed and was not analysed
Cavagnaro and
Cortina (1985a)
CHO cells In vitro chromosomal
aberration
50, 75, 100, 150 and
200 µg/mL, 2 hours
exposure, sampling after
10 hours
± S9 mix Consistent but insignificant increase in
chromosomal aberration was observed at the
maximal soluble concentration without
metabolic activation. (GLP)
Cavagnaro and
Cortina (1985b)
Isolated rat hepatocytes In vitro UDS 1, 5, 10, 50, 100,
500 µg/mL
Negative. Small increases were observed but
none was significant and without dose response.
(GLP)
Cavagnaro and
Sernau (1985)
Male and female mice In vivo bone marrow
micronucleus assay
Single dose
10 000 mg/kg b.w. by
gavage; sampling after
24, 42 and 72 hours
Negative. No significant increase in the
frequency of MN PMC; no decrease in the ratio
of PMC to NMC. Positive control (mitomicyn
C) gave clear positive response
Allen and
Proudlock (1987)
Male and female rat In vivo bone marrow
chromosomal aberration
assay
Single dose
10 000 mg/kg b.w. by
gavage; sampling after 6,
24 and 48 hours
Negative. No significant increase in the
frequency of cells with chromosomal
aberrations. The positive control,
cyclophosphamide caused significant increase
in the frequency of cells with chromosomal
aberrations. (GLP)
Allen et al. (1987)

Nitrofurans in food
EFSA Journal 2015;13(6):4140 188
Test organism/system Method Concentration/
treatment
Metabolic
activation Outcome Reference
Male Wistar rats In vivo UDS in liver and
intestinal cells
Single dose 100, 300 or
1 000 mg/kg b.w. by
gavage; sampling after 2
and 12 hours
Negative in liver cells.
In intestinal cells UDS was induced at 300 or
1 000 mg/kg b.w. after 12 hours. Statistically
significant only in the 300 mg/kg b.w. group.
Irritation of intestinal tissue was observed.
(GLP)
Benford (1987a)
Male Wistar rats In vivo UDS in intestinal
and gut cells
Single dose 100, 300 or
1 000 mg/kg b.w. by
gavage; sampling after 2
and 12 hours
Increased incorporation of tritiated thymidine at
300 or 1 000 mg/kg b.w. after 12 hours.
Statistically significant only in the 300 mg/kg
b.w. group. Irritation of intestinal tissue was
observed (GLP)
Benford (1987b)
Muta-Mice Transgenic mouse
mutation assay
550 or 850 mg kg b.w.
for 28 days p.o.,
necropsy at day 31
Frequency of lacZgene mutations from the
shuttle vector was determined in the
ileum/jejunum. No increase was observed
(GLP)
Ballantyne (2003)
b.w.: body weight; CHO: Chinese hamster ovary; GLP: good laboratory practices; NMC : normochromatic micronucleated erythrocytes; PMC : polychromatic micronucleated erythrocytes; p.o.:
per os; UDS: unscheduled DNA synthesis.

Nitrofurans in food
EFSA Journal 2015;13(6):4140 189
Appendix I. Benchmark dose analyses
The results of the BMD analyses are reported in general as follows:
Quantal endpoints. The dataset analysed and the results of the analyses using five quantal dose–
response models (log-logistic, log-probit, Weibull, gamma, logistic) are tabulated. For each model, the
log-likelihood values, whether the model was accepted or not (according to goodness-of-fit test,
p ≥ 0.05), and the BMD confidence interval (BMDL, BMDU) for the accepted models are reported.
The (maximum likelihood estimates of the) BMD values are reported for the endpoints that were used
in the risk characterisation (i.e. Tables I.2 (for furazolidone) and I.20 (for SEM)), except for
nitrofurantoin (see Section I.5). An overall BMD confidence interval is reported based on the lowest
BMDL and highest BMDU from the five models. Finally, a figure shows the dose–response data,
together with one of the fitted models (the log-logistic in each case). The BMD analysis for the effect
of furaltadone on mammary tumours is reported in a concise way because the analysis was not used in
the risk assessment due to the large difference between the BMDL and BMDU.
Continuous endpoints. The dataset analysed is tabulated. The results of the fitted (four-parameter)
exponential and Hill model are shown in figures for all endpoints and in tables for the endpoints used
for the risk characterisation. The legends of the figures provide details, including parameter estimates,
and the established BMDL, BMD and BMDU. An overall BMD confidence interval is reported based
on the lowest BMDL and highest BMDU from the two models.
Note that these overall BMD confidence intervals reflect intervals with a greater confidence than the
90 % level related to the confidence intervals for the individual models (due to the extreme values
calculated for the different models used), in particular in the case of quantal data where five models
were used.
A benchmark response (BMR) of 10 % was used for quantal data and 5 % for continuous data as
recommended by the EFSA Scientific Committee (EFSA, 2009).
Uncertainty in BMD calculations may be reflected by the width of the confidence interval (BMDL to
BMDU), or by the BMDU/BMDL ratio. Therefore, BMDL and BMDU values are reported for all the
BMD analyses shown and BMD values are only reported for those endpoints that were used in the risk
characterisation.
Accounting for the uncertainty in the BMD calculation in each of these analyses, the CONTAM Panel
noted that for the endpoints used to characterise the risk, the BMDU/BMDL ratio (from the overall
cofindence interval (CI)) did not exceed one order of magnitude. The BMD analyses for
osteosarcomas caused by nitrofurantoin, resulted in a BMDU of infinity (see Section I.5) and,
therefore, no BMDU/BMDL ratio was calculated.
I.1. Furazolidone: carcinogenicity endpoints
The CONTAM Panel considered the tumour data from four carcinogenicity studies suitable for dose–
response modelling:
1. Halliday et al. (1974): bronchial adenocarcinomas observed in male and female Swiss
MBR/ICR mice;
2. King et al. (1972a); Halliday et al. (1973a): malignant mammary tumours (adenocarcinomas
and carcinosarcomas) observed in female Sprague–Dawley rats;
3. King et al. (1972b); Halliday et al. (1973b): mammary adenocarcinomas observed in Fischer
344 rats;

Nitrofurans in food
EFSA Journal 2015;13(6):4140 190
4. King et al. (1972b); Halliday et al. (1973b): malignant mammary tumours (adenocarcinomas
and carcinosarcomas) in female and neural astrocytomas observed in male Sprague–Dawley
rats.
The BMDL and BMDU that are derived from these four studies should be considered to be indicative,
because all four studies had mortality before the end of the study. The animals that died prematurely
without tumours might have developed tumours (in response to the dose) had they not died. This
results in additional uncertainty in the estimated dose–response relationship, which is not covered by
the reported BMD confidence intervals.
I.1.1. Bronchial adenocarcinomas in mice
The data for bronchial adenocarcinomas in mice from Halliday et al. (1974) are given in Table I.1. The
data from both male and female animals were combined. The dose–response analysis revealed no
significant differences between both genders, thus the results hold equally for both males and females.
Table I.1: Dose–response data for bronchial adenocarcinomas from Halliday et al. (1974 )
Dose
(mg/kg b.w. per day) Number of animals
Number of animals with bronchial
adenocarcinomas Sex
0 49 13 M
12 48 19 M
24 50 26 M
47 50 37 M
0 50 15 F
12 50 18 F
24 47 20 F
47 48 30 F
b.w.: body weight; F: female; M, male.
As Table I.2 shows, the lowest BMDL10 was 3.5 mg/kg b.w. per day and the highest BMDU10 was
22 mg/kg b.w. per day, resulting in an overall BMD confidence interval of 3.5–22 mg/kg b.w.
The results in Table I.2 were re-calculated by the BMDS software, resulting in the same values for the
BMDL10. (Note: the BMDS software does not provide for combining dose–response data from
different subgroups differing in one or more model parameters, but in this case the two subgroups
were assumed to have identical dose–response curves.)
The data for both genders were also analysed separately. The overall BMD10 confidence interval for
males was 1.2–21 mg/kg b.w. per day and for females 2.0–48 mg/kg b.w. per day. These values are in
line with the results reported by Carlsson Forslund (2014).
Table I.2: Benchmark dose analysis(a)
for bronchial adenocarcinoma
Model Number of
parameters
Log-
likelihood Accepted
BMDL10
(mg/kg b.w.
per day)
BMD10(b)
(mg/kg b.w. per
day)
BMDU10(b)
(mg/kg b.w. per
day)
Null 1 –270.06 -
Full 8 –250.86 -
Two.stage 3 –252.2 Yes 5.23 9.86 19.4
Log.logist 3 –252.27 Yes 4.49 11.4 22.2
Weibull 3 –252.22 Yes 3.75 10.5 21.9
Log.prob 3 –252.32 Yes 4.96 11.7 22.4
Gamma 3 –252.23 Yes 3.47 10.7 22
Logistic 2 –252.2 Yes 7.8 9.24 11.5
b.w.: body weight.
(a): Covariate: sex; BMR: 0.1 extra risk; constraint: no; p-value goodness of fit: 0.05.
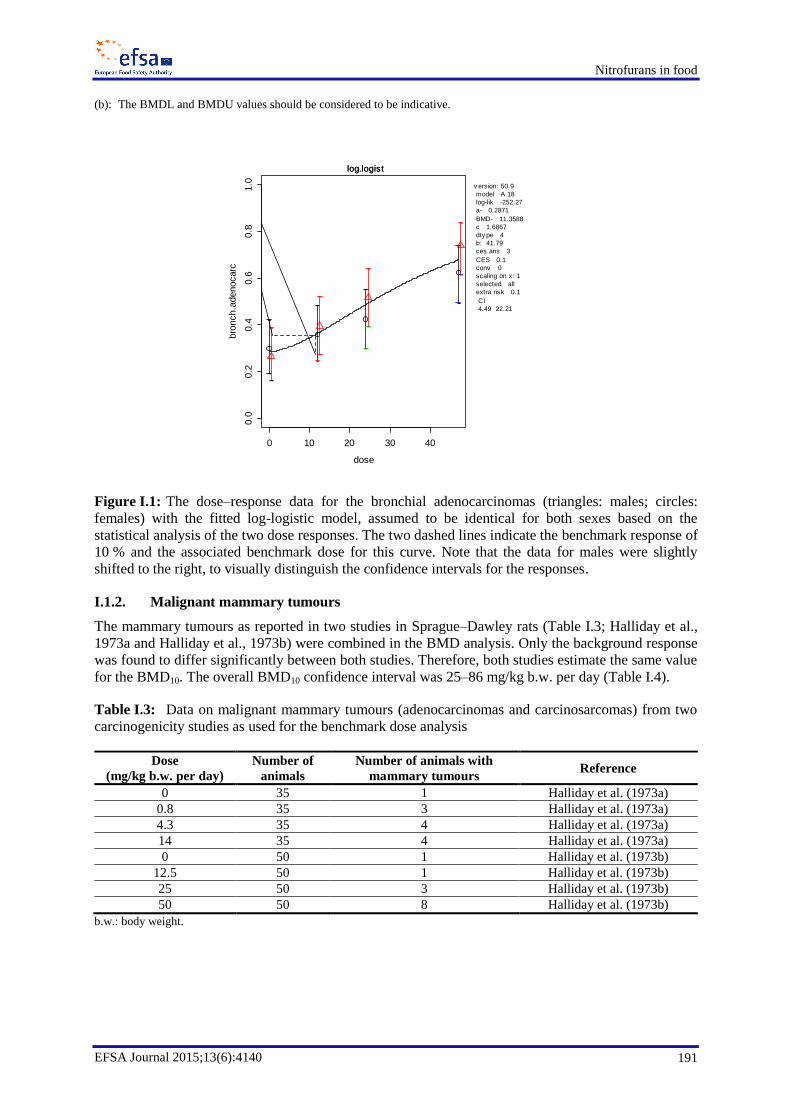
Nitrofurans in food
EFSA Journal 2015;13(6):4140 191
(b): The BMDL and BMDU values should be considered to be indicative.
Figure I.1: The dose–response data for the bronchial adenocarcinomas (triangles: males; circles:
females) with the fitted log-logistic model, assumed to be identical for both sexes based on the
statistical analysis of the two dose responses. The two dashed lines indicate the benchmark response of
10 % and the associated benchmark dose for this curve. Note that the data for males were slightly
shifted to the right, to visually distinguish the confidence intervals for the responses.
I.1.2. Malignant mammary tumours
The mammary tumours as reported in two studies in Sprague–Dawley rats (Table I.3; Halliday et al.,
1973a and Halliday et al., 1973b) were combined in the BMD analysis. Only the background response
was found to differ significantly between both studies. Therefore, both studies estimate the same value
for the BMD10. The overall BMD10 confidence interval was 25–86 mg/kg b.w. per day (Table I.4).
Table I.3: Data on malignant mammary tumours (adenocarcinomas and carcinosarcomas) from two
carcinogenicity studies as used for the benchmark dose analysis
Dose
(mg/kg b.w. per day)
Number of
animals
Number of animals with
mammary tumours Reference
0 35 1 Halliday et al. (1973a)
0.8 35 3 Halliday et al. (1973a)
4.3 35 4 Halliday et al. (1973a)
14 35 4 Halliday et al. (1973a)
0 50 1 Halliday et al. (1973b)
12.5 50 1 Halliday et al. (1973b)
25 50 3 Halliday et al. (1973b)
50 50 8 Halliday et al. (1973b)
b.w.: body weight.
0 10 20 30 40
0.0
0.2
0.4
0.6
0.8
1.0
dose
bro
nch.a
denocarc
--
-
-
-
-
-
-
-
-
-
-
-
-
-
-
log.logist log.logist
v ersion: 50.9
model A 18
log-lik -252.27
a- 0.2871
BMD- 11.3588
c 1.6867
dty pe 4
b: 41.79
ces.ans 3
CES 0.1
conv 0
scaling on x: 1
selected all
extra risk 0.1
CI
4.49 22.21
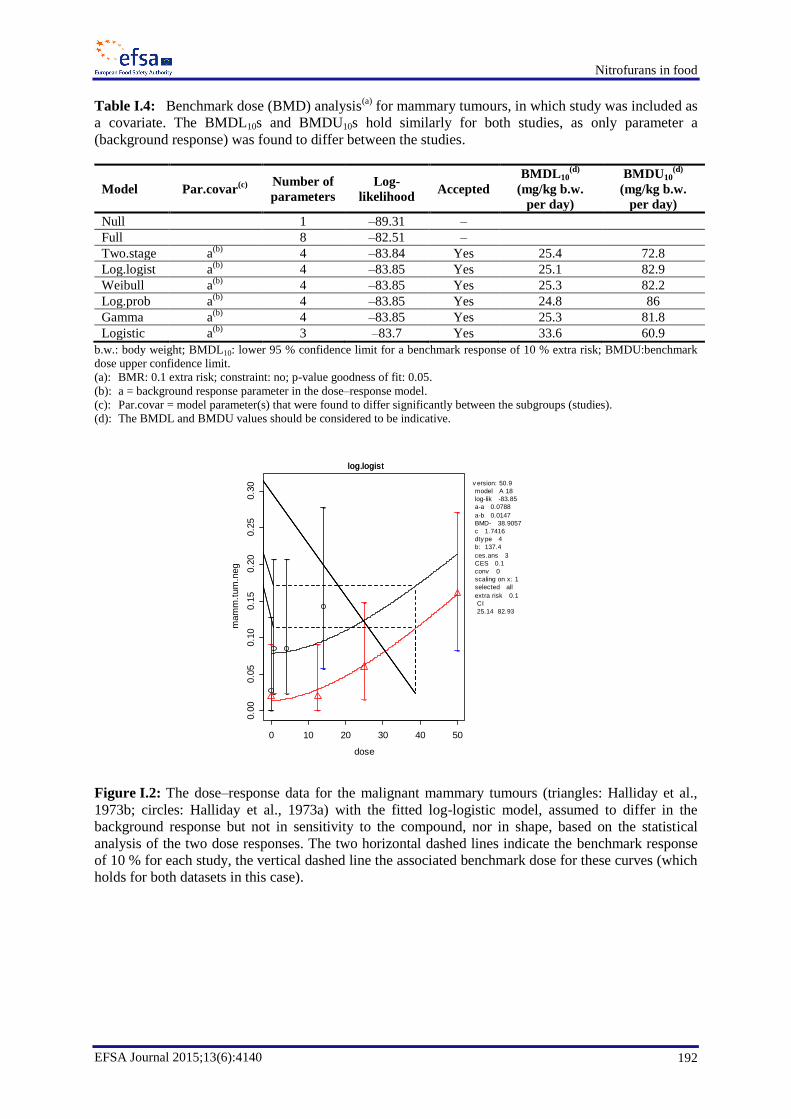
Nitrofurans in food
EFSA Journal 2015;13(6):4140 192
Table I.4: Benchmark dose (BMD) analysis(a)
for mammary tumours, in which study was included as
a covariate. The BMDL10s and BMDU10s hold similarly for both studies, as only parameter a
(background response) was found to differ between the studies.
Model Par.covar(c)
Number of
parameters
Log-
likelihood Accepted
BMDL10(d)
(mg/kg b.w.
per day)
BMDU10(d)
(mg/kg b.w.
per day)
Null 1 –89.31 –
Full 8 –82.51 –
Two.stage a(b)
4 –83.84 Yes 25.4 72.8
Log.logist a(b)
4 –83.85 Yes 25.1 82.9
Weibull a(b)
4 –83.85 Yes 25.3 82.2
Log.prob a(b)
4 –83.85 Yes 24.8 86
Gamma a(b)
4 –83.85 Yes 25.3 81.8
Logistic a(b)
3 –83.7 Yes 33.6 60.9
b.w.: body weight; BMDL10: lower 95 % confidence limit for a benchmark response of 10 % extra risk; BMDU:benchmark
dose upper confidence limit.
(a): BMR: 0.1 extra risk; constraint: no; p-value goodness of fit: 0.05.
(b): a = background response parameter in the dose–response model.
(c): Par.covar = model parameter(s) that were found to differ significantly between the subgroups (studies).
(d): The BMDL and BMDU values should be considered to be indicative.
Figure I.2: The dose–response data for the malignant mammary tumours (triangles: Halliday et al.,
1973b; circles: Halliday et al., 1973a) with the fitted log-logistic model, assumed to differ in the
background response but not in sensitivity to the compound, nor in shape, based on the statistical
analysis of the two dose responses. The two horizontal dashed lines indicate the benchmark response
of 10 % for each study, the vertical dashed line the associated benchmark dose for these curves (which
holds for both datasets in this case).
0 10 20 30 40 50
0.0
00.0
50.1
00.1
50.2
00.2
50.3
0
dose
mam
m.t
um
.neg
-
- -
-
-
- -
-
- --
-- -
-
-
log.logist log.logist
v ersion: 50.9
model A 18
log-lik -83.85
a-a 0.0788
a-b 0.0147
BMD- 38.9057
c 1.7416
dty pe 4
b: 137.4
ces.ans 3
CES 0.1
conv 0
scaling on x: 1
selected all
extra risk 0.1
CI
25.14 82.93

Nitrofurans in food
EFSA Journal 2015;13(6):4140 193
I.1.3. Mammary adenocarcinomas
Mammary adenocarcinomas were reported in both studies with Sprague–Dawley rats, as well as in the
study with Fisher 344 rats (Table I.5; Halliday et al., 1973a; Halliday et al., 1973b). The data from
these three studies were combined (for females only). No significant differences in dose–response
among studies were found other than in the background response. The overall BMD10 confidence
interval was 37–60 mg/kg b.w. per day (Table I.6).
Table I.5: Data on mammary adenocarcinomas from three carcinogenicity studies as used for the
benchmark dose analysis
Dose
(mg/kg b.w.
per day)
Number
of female
animals
Number of female animals
with mammary
adenocarcinoma
Rat strain Reference
0 34 1 Sprague–Dawley Halliday et al. (1973a)
0.8 35 2 Sprague–Dawley Halliday et al. (1973a)
4.3 33 2 Sprague–Dawley Halliday et al. (1973a)
14 35 3 Sprague–Dawley Halliday et al. (1973a)
0 49 1 Sprague–Dawley Halliday et al. (1973b)
12.5 50 0 Sprague–Dawley Halliday et al. (1973b)
25 50 3 Sprague–Dawley Halliday et al. (1973b)
50 50 8 Sprague–Dawley Halliday et al. (1973b)
0 49 0 Fischer 344 Halliday et al. (1973b)
12.5 50 0 Fischer 344 Halliday et al. (1973b)
25 50 0 Fischer 344 Halliday et al. (1973b)
50 50 6 Fischer 344 Halliday et al. (1973b)
b.w.: body weight.
Table I.6: Benchmark dose (BMD)(a)
results for mammary adenocarcinomas, in which study was
included as a covariate. The BMDLs and BMDUs hold similarly for both studies, as only parameter a
(background response) was found to differ between the studies.
Model Par.covar(b)
No.par Log-
likelihood Accepted
BMDL10(d)
(mg/kg
b.w. per
day)
BMDU10(d)
(mg/kg
b.w. per
day)
Sens.subgr
Null 1 –103.99 –
Full 12 –86.52 –
Two.stage a(c)
5 –90.34 Yes 37.4 60.3 –
Log.logist a(c)
5 –89.24 Yes 39.4 54.3 –
Weibull a(c)
5 –89.26 Yes 40 54.4 –
Log.prob a(c)
5 –89.23 Yes 38.1 55.3 –
Gamma a(c)
5 –89.23 Yes 39 54.6 –
Logistic a(c)
4 –88.69 Yes 43.4 53 –
b.w.: body weight; BMDL10: lower 95 % confidence limit for a benchmark response of 10 % extra risk; BMDU:benchmark
dose upper confidence limit.
(a): BMR: 0.1 extra risk; covariate: study; constraint: no; p-value goodness of fit: 0.05.
(b): Par.covar = model parameter(s) that were found to differ significantly between the subgroups (studies).
(c): a = background response parameter in the dose–response model.
(d): The BMDL and BMDU values should be considered to be indicative.
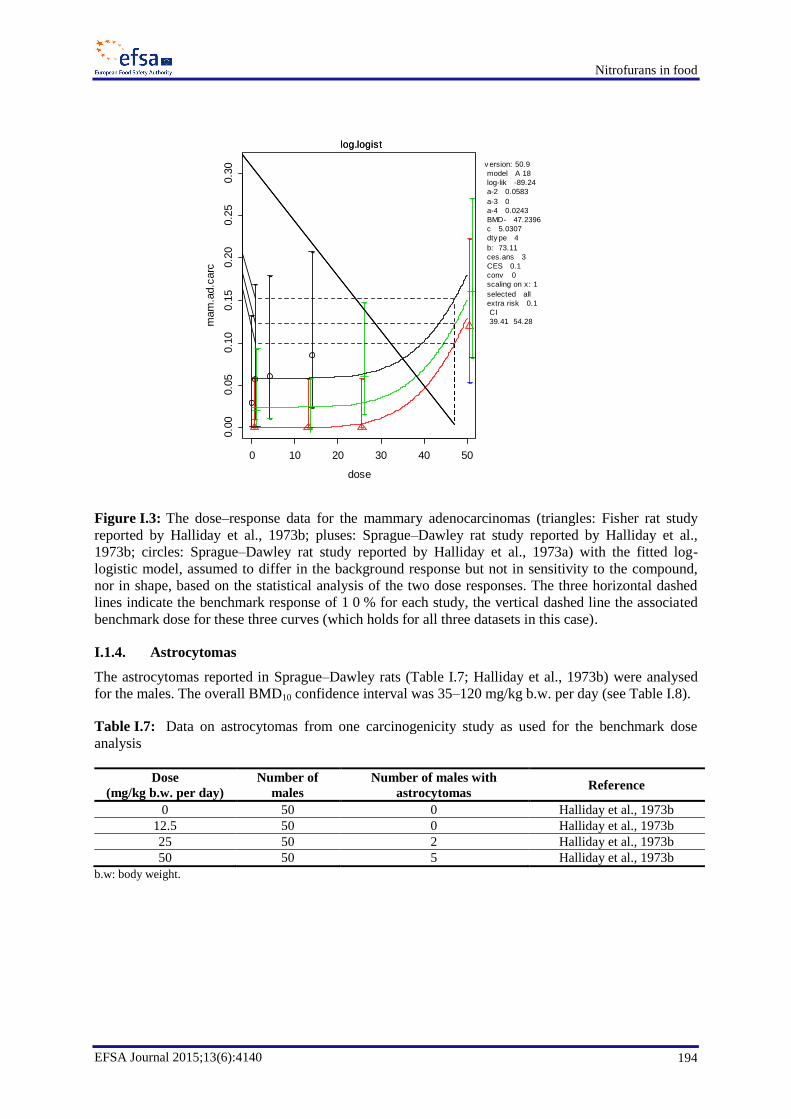
Nitrofurans in food
EFSA Journal 2015;13(6):4140 194
Figure I.3: The dose–response data for the mammary adenocarcinomas (triangles: Fisher rat study
reported by Halliday et al., 1973b; pluses: Sprague–Dawley rat study reported by Halliday et al.,
1973b; circles: Sprague–Dawley rat study reported by Halliday et al., 1973a) with the fitted log-
logistic model, assumed to differ in the background response but not in sensitivity to the compound,
nor in shape, based on the statistical analysis of the two dose responses. The three horizontal dashed
lines indicate the benchmark response of 1 0 % for each study, the vertical dashed line the associated
benchmark dose for these three curves (which holds for all three datasets in this case).
I.1.4. Astrocytomas
The astrocytomas reported in Sprague–Dawley rats (Table I.7; Halliday et al., 1973b) were analysed
for the males. The overall BMD10 confidence interval was 35–120 mg/kg b.w. per day (see Table I.8).
Table I.7: Data on astrocytomas from one carcinogenicity study as used for the benchmark dose
analysis
Dose
(mg/kg b.w. per day)
Number of
males
Number of males with
astrocytomas Reference
0 50 0 Halliday et al., 1973b
12.5 50 0 Halliday et al., 1973b
25 50 2 Halliday et al., 1973b
50 50 5 Halliday et al., 1973b
b.w: body weight.
0 10 20 30 40 50
0.0
00.0
50.1
00.1
50.2
00.2
50.3
0
dose
mam
.ad.c
arc
-- -
-
-
--
-
- - -
-- - -
-
- --
--
-
-
-
log.logist log.logist
v ersion: 50.9
model A 18
log-lik -89.24
a-2 0.0583
a-3 0
a-4 0.0243
BMD- 47.2396
c 5.0307
dty pe 4
b: 73.11
ces.ans 3
CES 0.1
conv 0
scaling on x: 1
selected all
extra risk 0.1
CI
39.41 54.28
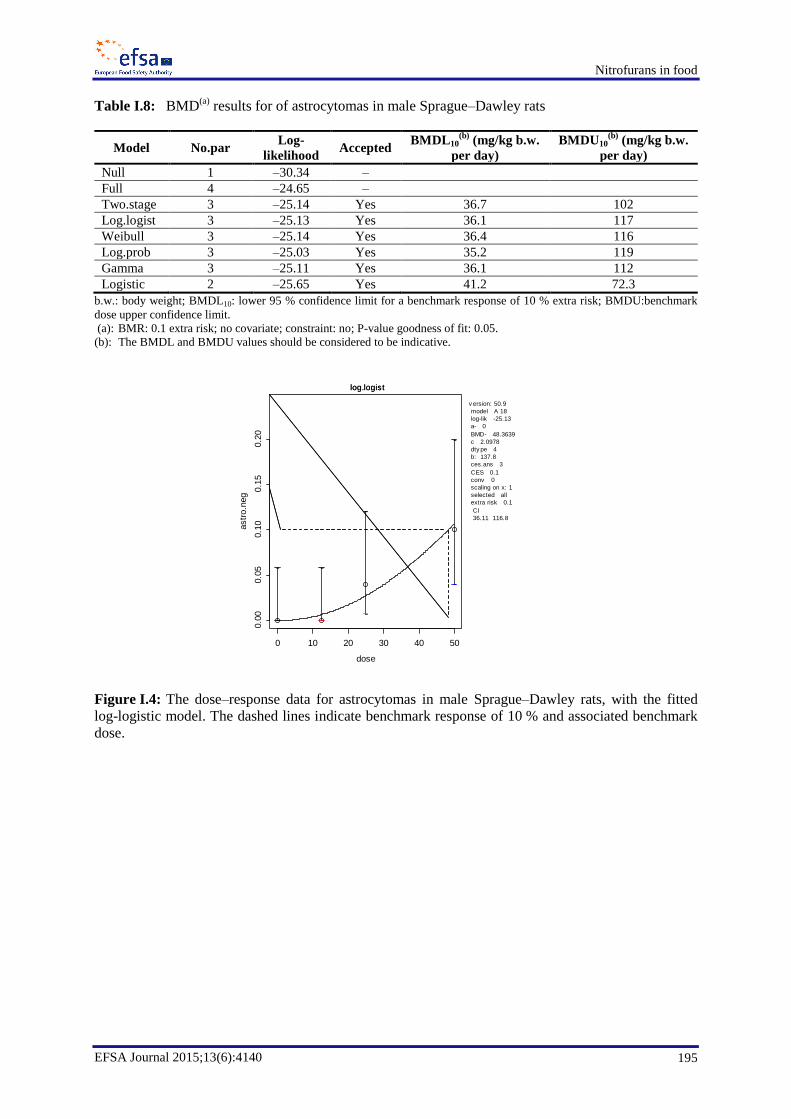
Nitrofurans in food
EFSA Journal 2015;13(6):4140 195
Table I.8: BMD(a)
results for of astrocytomas in male Sprague–Dawley rats
Model No.par Log-
likelihood Accepted
BMDL10(b)
(mg/kg b.w.
per day)
BMDU10(b)
(mg/kg b.w.
per day)
Null 1 –30.34 –
Full 4 –24.65 –
Two.stage 3 –25.14 Yes 36.7 102
Log.logist 3 –25.13 Yes 36.1 117
Weibull 3 –25.14 Yes 36.4 116
Log.prob 3 –25.03 Yes 35.2 119
Gamma 3 –25.11 Yes 36.1 112
Logistic 2 –25.65 Yes 41.2 72.3
b.w.: body weight; BMDL10: lower 95 % confidence limit for a benchmark response of 10 % extra risk; BMDU:benchmark
dose upper confidence limit.
(a): BMR: 0.1 extra risk; no covariate; constraint: no; P-value goodness of fit: 0.05.
(b): The BMDL and BMDU values should be considered to be indicative.
Figure I.4: The dose–response data for astrocytomas in male Sprague–Dawley rats, with the fitted
log-logistic model. The dashed lines indicate benchmark response of 10 % and associated benchmark
dose.
0 10 20 30 40 50
0.0
00.0
50.1
00.1
50.2
0
dose
astr
o.n
eg
- --
-
- -
-
-
log.logist log.logist
v ersion: 50.9
model A 18
log-lik -25.13
a- 0
BMD- 48.3639
c 2.0978
dty pe 4
b: 137.8
ces.ans 3
CES 0.1
conv 0
scaling on x: 1
selected all
extra risk 0.1
CI
36.11 116.8
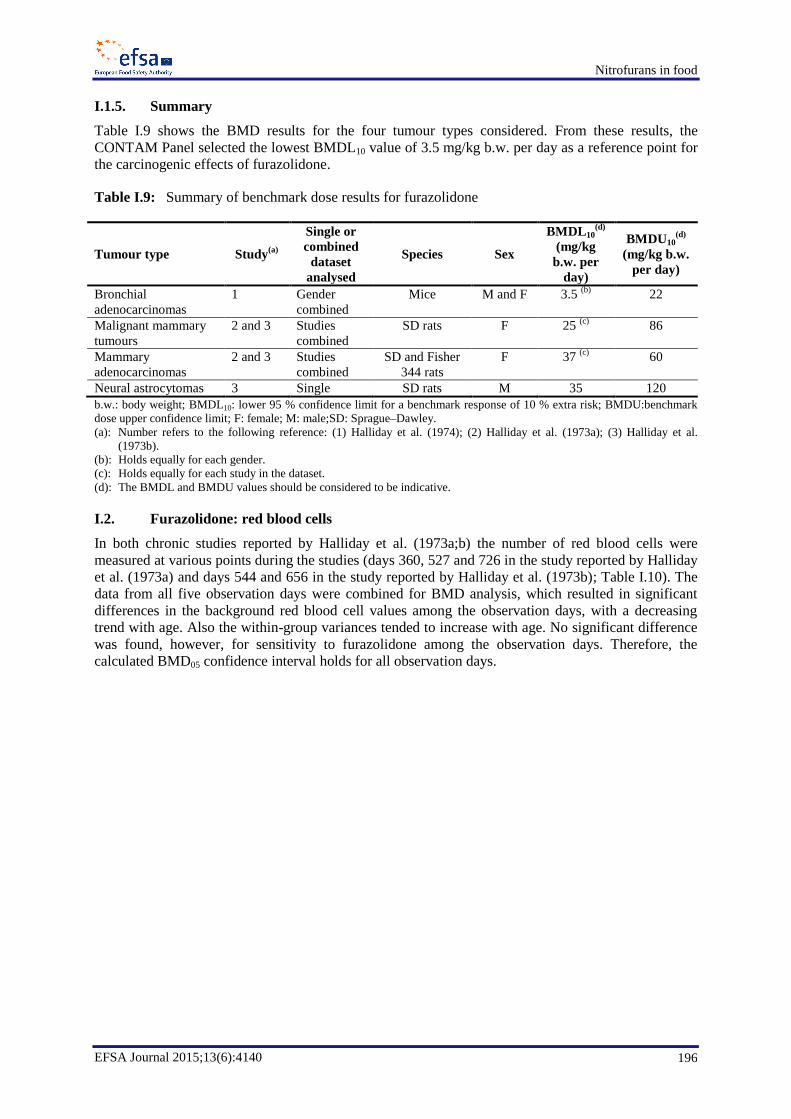
Nitrofurans in food
EFSA Journal 2015;13(6):4140 196
I.1.5. Summary
Table I.9 shows the BMD results for the four tumour types considered. From these results, the
CONTAM Panel selected the lowest BMDL10 value of 3.5 mg/kg b.w. per day as a reference point for
the carcinogenic effects of furazolidone.
Table I.9: Summary of benchmark dose results for furazolidone
Tumour type Study(a)
Single or
combined
dataset
analysed
Species Sex
BMDL10(d)
(mg/kg
b.w. per
day)
BMDU10(d)
(mg/kg b.w.
per day)
Bronchial
adenocarcinomas
1 Gender
combined
Mice M and F 3.5 (b)
22
Malignant mammary
tumours
2 and 3 Studies
combined
SD rats F 25 (c)
86
Mammary
adenocarcinomas
2 and 3 Studies
combined
SD and Fisher
344 rats
F 37 (c)
60
Neural astrocytomas 3 Single SD rats M 35 120
b.w.: body weight; BMDL10: lower 95 % confidence limit for a benchmark response of 10 % extra risk; BMDU:benchmark
dose upper confidence limit; F: female; M: male;SD: Sprague–Dawley.
(a): Number refers to the following reference: (1) Halliday et al. (1974); (2) Halliday et al. (1973a); (3) Halliday et al.
(1973b).
(b): Holds equally for each gender.
(c): Holds equally for each study in the dataset.
(d): The BMDL and BMDU values should be considered to be indicative.
I.2. Furazolidone: red blood cells
In both chronic studies reported by Halliday et al. (1973a;b) the number of red blood cells were
measured at various points during the studies (days 360, 527 and 726 in the study reported by Halliday
et al. (1973a) and days 544 and 656 in the study reported by Halliday et al. (1973b); Table I.10). The
data from all five observation days were combined for BMD analysis, which resulted in significant
differences in the background red blood cell values among the observation days, with a decreasing
trend with age. Also the within-group variances tended to increase with age. No significant difference
was found, however, for sensitivity to furazolidone among the observation days. Therefore, the
calculated BMD05 confidence interval holds for all observation days.

Nitrofurans in food
EFSA Journal 2015;13(6):4140 197
Table I.10: Data on number of red blood cells in female Sprague-Dawley rats as used for the
benchmark dose analysis
Day Dose (mg/kg b.w.
per day)
Number of
animals RBC ± SD Reference
360 0 15 6.88 ± 0.43 Halliday et al. (1973a)
0.8 15 6.59 ± 0.36 Halliday et al. (1973a)
4.3 14 6.24 ± 0.59 Halliday et al. (1973a)
14 15 6.17 ± 0.50 Halliday et al. (1973a)
527 0 15 6.96 ± 0.58 Halliday et al. (1973a)
0.8 13 6.62 ± 0.53 Halliday et al. (1973a)
4.3 10 6.55 ± 0.69 Halliday et al. (1973a)
14 14 6.38 ± 0.67 Halliday et al. (1973a)
726 0 9 6.3 ± 1.5 Halliday et al. (1973a)
0.8 7 6.0 ±0.5 Halliday et al. (1973a)
4.3 6 4.9 ± 1.6 Halliday et al. (1973a)
14 7 4.8 ±1.1 Halliday et al. (1973a)
544 0 17 6.27 ± 0.61 Halliday et al. (1973b)
12.5 17 5.87 ± 0.88 Halliday et al. (1973b)
25 18 5.70 ± 1.33 Halliday et al. (1973b)
50 15 5.28 ± 0.66 Halliday et al. (1973b)
656 0 15 6.12 ± 0.72 Halliday et al. (1973b)
12.5 15 5.83 ± 1.21 Halliday et al. (1973b)
25 15 4.86 ± 1.49 Halliday et al. (1973b)
50 6 5.13 ± 1.27 Halliday et al. (1973b)
b.w.: body weight; RBC: number of red blood cells; SD: standard deviation.
The overall confidence interval for the BMD05 was 0.10–4.88 mg/kg (see Figure I.5).
Figure I.5: Dose–response data and fitted model for red blood cells measured on various observation
days (indicated by different marks and colours) in the two chronic studies on furazolidone. The
background red blood cell levels for the various observation days are indicated in the right-hand side
legend as parameter a followed by day number. The BMDs, BMDLs and BMDUs are shown in the
legends on the right side of the figures (see CED, CEDL and CEDU). Note that the benchmark
response is 5 %, indicated as CES (critical effect size) in the legend.
-0.5 0.0 0.5 1.0 1.5
4.0
4.5
5.0
5.5
6.0
6.5
7.0
Exponential model
log10-Dose
Response
m5-av v ersion: 50.9
loglik 156.56
v ar-360 0.00526
v ar-527 0.00815
v ar-544 0.0245
v ar-656 0.0508
v ar-726 0.0532
a-360 6.84
a-527 7
a-544 6.34
a-656 5.92
a-726 5.7
CED- 1.24
c- 1.05e-06
d- 0.334
CES -0.05
conv : 1
scaling f actor on x : 1
dty pe : 10
selected : all
remov ed:
none
cov ariate: day
CEDL 0.1018
CEDU 4.88
-0.5 0.0 0.5 1.0 1.5
4.0
4.5
5.0
5.5
6.0
6.5
7.0
Hill model
log10-Dose
Response
m5-av v ersion: 50.9
loglik 156.53
v ar-360 0.00526
v ar-527 0.00815
v ar-544 0.0245
v ar-656 0.0508
v ar-726 0.0532
a-360 6.84
a-527 7
a-544 6.34
a-656 5.92
a-726 5.7
CED- 1.24
c- 1.05e-06
d- 0.348
CES -0.05
conv : 1
scaling f actor on x : 1
dty pe : 10
selected : all
remov ed:
none
cov ariate: day
CEDL 0.1046
CEDU 4.878

Nitrofurans in food
EFSA Journal 2015;13(6):4140 198
I .3. 3-amino-2-oxazolidinone: non-neoplastic lesions
Brinck et al. (1995) reported the effects of AOZ on four blood parameters (red blood cell count and
levels of ALP, AST and bilirubin) in dogs (see Table I.11), all of which were subjected to a BMD
analysis.
Table I.11: Dose–response data for the effect of 3-amino-2-oxazolidinone on four blood parameters in
dogs as used for the benchmark dose analysis
Dose (mg/kg b.w. per day)
Number
of
animals
RBC ± SD
(1012
/L)
ALP ± SD
(µkat/L)
AST ± SD
(µkat/L)
Biliburine ± SD
(µmol/L) Sex
0 3 5.59 ± 0.53 1.62 ± 0.19 0.46 ± 0.08 1.6 ± 0.1 M
1 3 5.23 ± 0.06 3.08 ± 0.39 0.57 ± 0.08 2.2 ± 0.26 M
3 3 5.08 ± 0.18 5.8 ± 0.51 0.88 ± 0.12 4.43 ± 1.15 M
6 3 4.59 ± 0.09 8.29 ± 4.56 1.35 ± 0.27 6.1 ± 0.44 M
0 3 6.37 ± 0.45 1.33 ± 0.11 0.6 ± 0.13 1.77 ± 0.15 F
1 3 5.64 ± 0.44 2.36 ± 0.41 0.64 ± 0.07 1.97 ± 0.21 F
3 3 5.07 ± 0.39 4.38 ± 0.59 0.81 ± 0.03 4.2 ± 0.79 F
6 3 4.82 ± 0.22 6.39 ± 0.7 1.17 ± 0.36 6.93 ± 2.69 F
ALP: alkaline phosphatase; b.w.: body weight; F: female; M: male; RBC: red blood cell count; SD: standard deviation.
I.3.1. Effect on red blood cell count in dogs (Brinck et al., 1995)
A significant difference in red blood cell count between males and females was found, but not in the
sensitivity to AOZ. Therefore, the BMD05 confidence interval holds similarly for both sexes. The
overall BMD05 confidence interval is 0.04–1.2 mg/kg b.w. per day (see Figure I.6).
Figure I.6: Dose–response data for the effect of 3-amino-2-oxazolidinone (AOZ) on the number of
red blood cells in dogs with fitted exponential and Hill model. The background red blood cell levels
differ significantly among sexes, but not the sensitivity for AOZ. The BMDs, BMDLs and BMDUs
are shown in the legends on the right side of the figures (see CED, CEDL and CEDU). Note that the
benchmark response is 5 %, indicated as CES (critical effect size) in the legend.
-0.6 -0.4 -0.2 0.0 0.2 0.4 0.6 0.8
4.5
5.0
5.5
6.0
6.5
7.0
Exponential model
log10-Dose
Response
m5-a
v ersion: 50.9
loglik 35.32
v ar- 0.00309
a-f emales 6.13
a-males 5.76
CED- 0.342
c- 1.05e-06
d- 0.53
b: 0.09056
CES -0.05
conv : 1
scaling f actor on x : 1
dty pe : 10
selected : all
remov ed:
none
cov ariate: sex
CEDL 0.03997
CEDU 1.185
-0.6 -0.4 -0.2 0.0 0.2 0.4 0.6 0.8
4.5
5.0
5.5
6.0
6.5
7.0
Hill model
log10-Dose
Response
m5-a
v ersion: 50.9
loglik 35.31
v ar- 0.00309
a-f emales 6.13
a-males 5.76
CED- 0.363
c- 1.05e-06
d- 0.573
b: 61.6
CES -0.05
conv : 1
scaling f actor on x : 1
dty pe : 10
selected : all
remov ed:
none
cov ariate: sex
CEDL 0.0466
CEDU 1.204

Nitrofurans in food
EFSA Journal 2015;13(6):4140 199
I.3.2. Effect on serum alkaline phosphatase level in dogs (Brinck et al., 1995)
For ALP, both sexes differ significantly in sensitivity to AOZ. The overall BMD05 confidence interval
in males is 0.02–0.18 mg/kg b.w. per day and in females 0.03–0.29 mg/kg b.w. per day (see Figure I.7,
Table I.12).
Figure I.7: Dose–response data for the effect of 3-amino-2-oxazolidinone (AOZ) on alkaline
phosphatase levels in dogs with fitted exponential and Hill model. Sensitivity to AOZ differs
significantly among sexes. The BMDs, BMDLs and BMDUs for males and females are shown in the
legends on the right side of the figures (see CED, CEDL and CEDU). Note that the benchmark
response is 5 %, indicated as CES (critical effect size) in the legend.
-0.6 -0.4 -0.2 0.0 0.2 0.4 0.6 0.8
24
68
10
Exponential model
log10-dose
ALP
m5-bv v ersion: 50.9
loglik 10.02
v ar-f emales 0.0114
v ar-males 0.0568
a- 1.37
CED-f emales 0.113
CED-males 0.0683
c- 5.64
d- 1.24
b: 0.1624
b: 0.3042
CES 0.05
conv : 1
scaling f actor on x : 1
dty pe : 10
selected : all
remov ed:
none
f act1: sex
cov ariate: sex
CEDL-f emales 0.03397
CEDU-f emales 0.2344
CEDL-males 0.022
CEDU-males 0.1462
-0.6 -0.4 -0.2 0.0 0.2 0.4 0.6 0.8
24
68
10
Hill model
log10-dose
ALP
m5-bv v ersion: 50.9
loglik 9.98
v ar-f emales 0.0114
v ar-males 0.057
a- 1.37
CED-f emales 0.131
CED-males 0.0804
c- 7.04
d- 1.35
b: 4.532
b: 2.776
CES 0.05
conv : 1
scaling f actor on x : 1
dty pe : 10
selected : all
remov ed:
none
f act1: sex
cov ariate: sex
CEDL-f emales 0.03304
CEDU-f emales 0.285
CEDL-males 0.02159
CEDU-males 0.1791

Nitrofurans in food
EFSA Journal 2015;13(6):4140 200
Table I.12: Benchmark dose results for the effect of 3-amino-2-oxazolidinone on alkaline phosphatase
levels in dogs
Analysis with exponential models
Model Converged npar Loglik
Full 1 9 7.76
Full-v 1 10 10.9
m1-v 1 3 –22.89
m2-v 1 4 –3.38
m2-av 1 5 –1.55
m2-bv 1 5 –2.67
m2-abv 1 6 –1.51
m3-v 1 5 5.41
m4-v 1 5 6.69
m5-v 1 6 6.93
m5-vab 1 8 10.66
m5-bv 1 7 10.02
m5-v 1 6 6.93
m5-bv 1 7 10.02
Analysis with Hill models
Model Converged npar Loglik
full-v 1 10 10.9
m1-v 1 3 –22.89
m2-v 1 4 –8.76
m2-av 1 5 –7.54
m2-bv 1 5 –8.52
m2-abv 1 6 –7.49
m3-v 1 5 3.95
m4-v 1 5 6.66
m5-v 1 6 6.93
m5-vab 1 8 10.63
m5-bv 1 7 9.98
m5-v 1 6 6.93
m5-bv 1 7 9.98
I.3.3. Effect on serum aspartate aminotransferase level in dogs (Brinck et al., 1995)
For AST, males and females were found to differ significantly in sensitivity to AOZ, although the
difference was not large. The overall BMD05 confidence interval for males is 0.08–0.9 mg/kg b.w. per
day and 0.18–1.6 mg/kg b.w. per day for females (see Figure I.8).

Nitrofurans in food
EFSA Journal 2015;13(6):4140 201
Figure I.8: Dose response data for the effect of 3-amino-2-oxazolidinone on aspartate
aminotransferase in dogs with fitted exponential and Hill model. Males and females differed
significantly in both a (background response) and b (sensitivity). The BMDs, BMDLs and BMDUs for
males and females are shown in the legends on the right side of the figures (see CED, CEDL and
CEDU). Note that the benchmark response is 5 %, indicated as CES (critical effect size) in the legend.
I.3.4. Effect on serum bilirubin levels in dogs (Brinck et al., 1995)
For bilirubin, males and females were not found to differ significantly in dose response. The overall
BMD05 confidence interval is 0.20–0.97 mg/kg b.w. per day (Figure I.9).
Figure I.9: Dose–response data for the effect of 3-amino-2-oxazolidinone on bilirubin in dogs with
fitted exponential and Hill model. Males and females did not differ significantly in a (background
response) or b (sensitivity). The BMDs, BMDLs and BMDUs for males and females are shown in the
legends on the right side of the figures (see CED, CEDL and CEDU). Note that the benchmark
response is 5 %, indicated as CES (critical effect size) in the legend. Regarding the CED note the
scaling factor of 6.
-0.6 -0.4 -0.2 0.0 0.2 0.4 0.6 0.8
0.4
0.6
0.8
1.0
1.2
1.4
1.6
Exponential model
log10-dose
AS
AT
m5-ab v ersion: 60.0
loglik 12.08
v ar- 0.0214
a-f emales 0.584
a-males 0.455
CED-f emales 0.626
CED-males 0.309
c- 4.7
d- 1.34
b: 0.02547
b: 0.06567
CES 0.05
conv : 1
scaling f actor on x : 1
dty pe : 10
selected : all
remov ed:
none
cov ariate: sex
CEDL-f emales 0.1818
CEDU-f emales 1.648
CEDL-males 0.07925
CEDU-males 0.853
-0.6 -0.4 -0.2 0.0 0.2 0.4 0.6 0.8
0.4
0.6
0.8
1.0
1.2
1.4
1.6
Hill model
log10-dose
AS
AT
m5-ab v ersion: 50.9
loglik 12.08
v ar- 0.0214
a-f emales 0.584
a-males 0.455
CED-f emales 0.626
CED-males 0.309
c- 4.7
d- 1.34
b: 0.02547
b: 0.06567
CES 0.05
conv : 1
scaling f actor on x : 1
dty pe : 10
selected : all
remov ed:
none
cov ariate: sex
CEDL-f emales 0.1818
CEDU-f emales 1.648
CEDL-males 0.07925
CEDU-males 0.853
-1.4 -1.2 -1.0 -0.8 -0.6 -0.4 -0.2 0.0
12
34
56
78
Exponential model
log10-dose/6
bilib
uri
ne
m5-
v ersion: 60.0
loglik 10.14
v ar- 0.0252
a- 1.68
CED- 0.0753
c- 3.9
d- 1.98
b: 2.889
CES 0.05
conv : 1
scaling f actor on x : 6
dty pe : 10
selected : all
remov ed:
none
cov ariate: sex
CEDL 0.1932
CEDU 0.9662
-1.4 -1.2 -1.0 -0.8 -0.6 -0.4 -0.2 0.0
12
34
56
78
Hill model
log10-dose/6
bilib
uri
ne
m5-
v ersion: 60.0
loglik 10.14
v ar- 0.0252
a- 1.68
CED- 0.079
c- 4.6
d- 2.13
b: 0.5839
CES 0.05
conv : 1
scaling f actor on x : 6
dty pe : 10
selected : all
remov ed:
none
cov ariate: sex
CEDL 0.1977
CEDU 0.9686

Nitrofurans in food
EFSA Journal 2015;13(6):4140 202
I.3.5. Summary
Table I.13 shows the BMD results for the effect of AOZ on the four blood parameters considered.
From these results, the CONTAM Panel selected the lowest BMDL05 value of 0.02 mg/kg b.w. per day
for the effect of AOZ on ALP.
Table I.13: Summary of benchmark dose results for non-neoplastic lesions caused by 3-amino-2-
oxazolidinone in dogs
Target Sex BMDL05 (mg/kg b.w.
per day)
BMDU05 (mg/kg b.w.
per day)
Red blood cell count M and F 0.04(a)
1.2
Serum alkaline phosphatase level M 0.02 0.18
Serum alkaline phosphatase level F 0.03 0.29
Serum aspartate aminotransferase level M 0.08 0.9
Serum aspartate aminotransferase level F 0.18 1.6
Serum bilirubin levels in dogs M and F 0.2(a)
0.97
b.w.: body weight; BMDL10: lower 95 % confidence limit for a benchmark response of 10 % extra risk; BMDU: benchmark
dose upper confidence limit F: female M: male.
(a): Holds equally for each gender.
I.4. Furaltadone: mammary tumours
There is a chronic study on furaltadone (Cohen et al., 1973), but this study included only a single dose
(other than the control). The average furaltadone dose was estimated to be 54 mg/kg b.w. per day, and
a significant increase in the incidence of mammary adenocarcinoma (25/32 versus 0/25 in the control)
was observed. Such data do not allow for a quantitative estimate of the potency, and therefore we
combined the Cohen data with the data from the studies on furazolidone (see analysis above). In the
analysis of the combined datasets, it was assumed that the shape parameter of the fitted model is the
same among the two chemicals. This assumption is supported by the empirical finding that the shape
parameter of fitted dose–response models in different carcinogens tends to be similar (Slob and Setzer,
2014). With this assumption, a finite BMD confidence interval may result, although the data for
furaltadone include only one dose and a control.

Nitrofurans in food
EFSA Journal 2015;13(6):4140 203
Figure I.10: The Cohen data for furaltadone (black circles) combined with the data for
furazolidone (red triangles and green crosses). Note that this is only the best fit, and many more curves
can describe these data (see Figure I.11).
In this analysis the background response (parameter a) is assumed to depend on study (hence three
values), while the potency parameter b depends on compound (hence two values). The shape
parameter c is assumed to be the same for the three datasets.
Figure I.11 shows the range of curves that are compatible with the combined dataset, assuming that the
shape parameter is constant for all three subgroups. The black curves relate to the Cohen dataset. The
wide variety of plausible curves results in a wide overall BMD10 confidence interval for furaltadone:
0.03–40 mg/kg. This large confidence interval is in this case because the observed response in the
single dose in the Cohen study happens to be close to 100 %. Had the response been more
intermediate, the confidence interval would have been smaller.
This analysis indicates that furaltadone is most probably more potent than furazolidone, as is also clear
from just observing the confidence intervals around the observed responses (see Figure I.10).
However, it is uncertain to what extent furaltadone is more potent.
-0.5 0.0 0.5 1.0 1.5
0.0
0.2
0.4
0.6
0.8
1.0
log10-dose
mam
m.t
um
-
-
-
-
- - --
-
- -
-
- - -
-- --
-
log-logistic in terms of BMD log-logistic in terms of BMD
v ersion: 50.9
model A 18
log-lik -100.66
a-a 0.0788
a-b 0.0147
a-c 0
BMD-f uralt 7.3626
BMD-f urazo 38.9057
c 1.7416
dty pe 4
b: 26
b: 137.4
ces.ans 3
CES 0.1
conv 1
scaling on x: 1
selected all
f act1: study
f act2: chem
extra risk 0.1
CI
0.01308 39.58
25.14 82.93
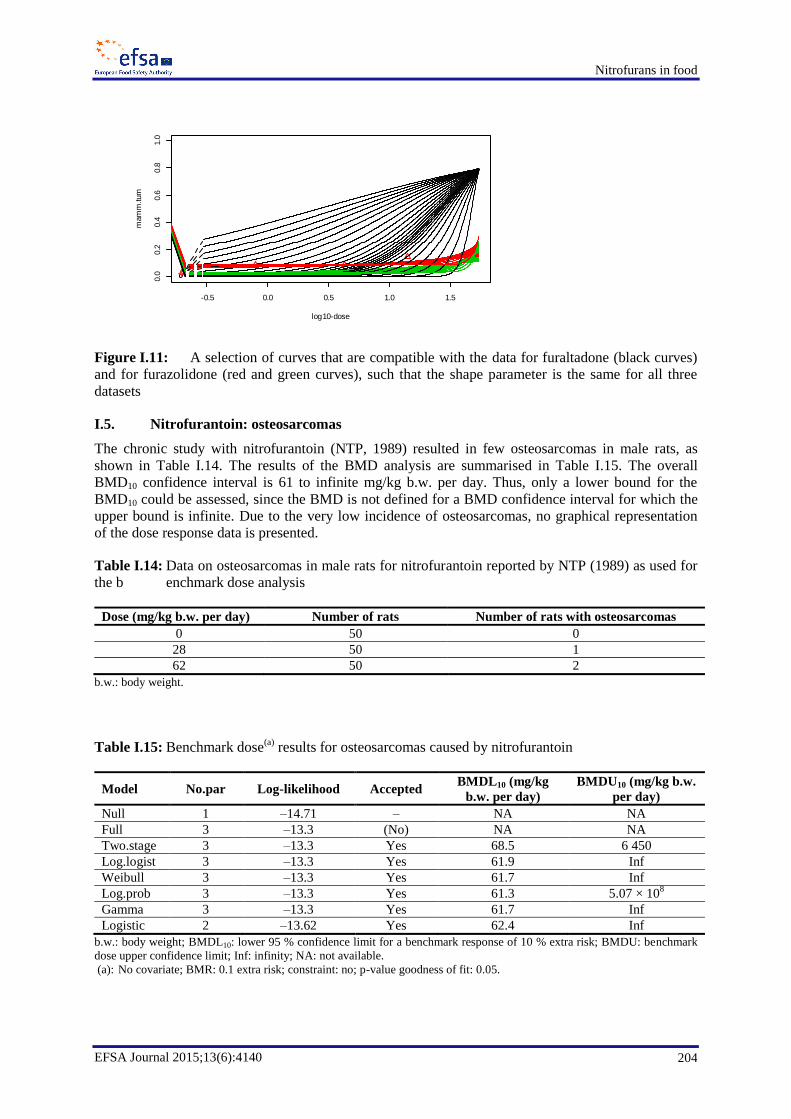
Nitrofurans in food
EFSA Journal 2015;13(6):4140 204
-0.5 0.0 0.5 1.0 1.5
0.0
0.2
0.4
0.6
0.8
1.0
log10-dose
mam
m.tum
Figure I.11: A selection of curves that are compatible with the data for furaltadone (black curves)
and for furazolidone (red and green curves), such that the shape parameter is the same for all three
datasets
I.5. Nitrofurantoin: osteosarcomas
The chronic study with nitrofurantoin (NTP, 1989) resulted in few osteosarcomas in male rats, as
shown in Table I.14. The results of the BMD analysis are summarised in Table I.15. The overall
BMD10 confidence interval is 61 to infinite mg/kg b.w. per day. Thus, only a lower bound for the
BMD10 could be assessed, since the BMD is not defined for a BMD confidence interval for which the
upper bound is infinite. Due to the very low incidence of osteosarcomas, no graphical representation
of the dose response data is presented.
Table I.14: Data on osteosarcomas in male rats for nitrofurantoin reported by NTP (1989) as used for
the b enchmark dose analysis
Dose (mg/kg b.w. per day) Number of rats Number of rats with osteosarcomas
0 50 0
28 50 1
62 50 2
b.w.: body weight.
Table I.15: Benchmark dose(a)
results for osteosarcomas caused by nitrofurantoin
Model No.par Log-likelihood Accepted BMDL10 (mg/kg
b.w. per day)
BMDU10 (mg/kg b.w.
per day)
Null 1 –14.71 – NA NA
Full 3 –13.3 (No) NA NA
Two.stage 3 –13.3 Yes 68.5 6 450
Log.logist 3 –13.3 Yes 61.9 Inf
Weibull 3 –13.3 Yes 61.7 Inf
Log.prob 3 –13.3 Yes 61.3 5.07 × 10⁸
Gamma 3 –13.3 Yes 61.7 Inf
Logistic 2 –13.62 Yes 62.4 Inf
b.w.: body weight; BMDL10: lower 95 % confidence limit for a benchmark response of 10 % extra risk; BMDU: benchmark
dose upper confidence limit; Inf: infinity; NA: not available.
(a): No covariate; BMR: 0.1 extra risk; constraint: no; p-value goodness of fit: 0.05.

Nitrofurans in food
EFSA Journal 2015;13(6):4140 205
I.6. Nitrofurazone: non-neoplastic effects
For nitrofurazone, both a rat and a mouse study is available in which testes-related effects were found
(Nishimura et al., 1995; George et al., 1996); see Table I.16 and I.17.
Table I.16: Dose–response data for the effect of nitrofurazone on testis and epididymis weight in rats
(Nishimura et al., 1995)
Dose (mg/kg b.w. per day) Number of rats Testis weight ± SD Epididymis weight ± SD
0 10 3.69 ± 0.34 1.2 ± 0.1
12.5 10 3.87 ± 0.22 1.18 ± 0.18
25 10 2.01 ± 0.42 0.84 ± 0.93
50 10 1.45 ± 0.17 0.74 ± 0.6
b.w.: body weight; SD: standard deviation.
Table I.17: Dose–response data for the effect of nitrofurazone on epididymal sperm number and
testicular spermatid number in mice (George et al., 1996)
Dose (mg/kg
b.w. per day)
Number
of mice
Epididymal sperm
number ± standard error of the
mean
Testicular spermatid
number ± standard error of the
mean
0 40 933 ± 50 9.6 ± 0.4
14 20 817 ± 91 8.1 ± 0.4
51 20 716 ± 50 7.7 ± 0.4
102 20 15 ± 14 1.2 ± 0.3
b.w.: body weight.
I.6.1. Effect on testes weight
The overall BMD05 confidence interval for testis weight in rats is 12–19 mg/kg b.w. per day (Figure
I.12).
Figure I.12: Dose-response data for the effect of nitrofurazone on testis weights in rats with fitted
exponential and Hill model. The BMDs, BMDLs and BMDUs for males and females are shown in the
legends on the right side of the figures (see CED, CEDL and CEDU). Note that the benchmark
response is 5 %, indicated as CES (critical effect size) in the legend.
0.6 0.8 1.0 1.2 1.4 1.6
1.5
2.0
2.5
3.0
3.5
4.0
Exponential model
log10-dose
testis.w
eig
ht
m5-
v ersion: 60.0
loglik 26.4
v ar- 0.0156
a- 3.77
CED- 18.8
c- 0.382
d- 10
b: 1.557e-14
CES -0.05
conv : 1
scaling f actor on x : 1
dty pe : 10
selected : all
remov ed:
none
CEDL 14.89
CEDU 19.20.6 0.8 1.0 1.2 1.4 1.6
1.5
2.0
2.5
3.0
3.5
4.0
Hill model
log10-dose
testis.w
eig
ht
m5-
v ersion: 60.0
loglik 26.38
v ar- 0.0157
a- 3.77
CED- 17.3
c- 0.382
d- 10
b: 22.11
CES -0.05
conv : 1
scaling f actor on x : 1
dty pe : 10
selected : all
remov ed:
none
CEDL 12.23
CEDU 17.96

Nitrofurans in food
EFSA Journal 2015;13(6):4140 206
I.6.2. Effect on epididymis weight
The overall BMD05 confidence interval for epididymis weight in rats is 4.6–20 mg/kg b.w. per day
(Figure I.13).
Figure I.13: Dose–response data for the effect of nitrofurazone on epididymis weights in rats with
fitted exponential and Hill model. The BMDs, BMDLs and BMDUs for males and females are shown
in the legends on the right side of the figures (see CED, CEDL and CEDU). Note that the benchmark
response is 5 %, indicated as CES (critical effect size) in the legend.
I.6.3. Effect on epididymal sperm number
The overall BMD05 confidence interval for epididymal sperm number in mice is 25–92 mg/kg b.w. per
day (Figure I.14).
Figure I.14: Dose–response data for the effect of nitrofurazone on epididymal sperm number in
mice with fitted exponential and Hill model. The BMDs, BMDLs and BMDUs for males and females
0.6 0.8 1.0 1.2 1.4 1.6
0.4
0.6
0.8
1.0
1.2
1.4
1.6
Exponential model
log10-dose
ep
idid
.we
igh
t
m5-
v ersion: 60.0
loglik -32.71
v ar- 0.3
a- 1.2
CED- 13.6
c- 0.476
d- 8.59
b: 1.805e-11
CES -0.05
conv : 0
scaling f actor on x : 1
dty pe : 10
selected : all
remov ed:
none
CEDL 6.732
CEDU 19.940.6 0.8 1.0 1.2 1.4 1.6
0.4
0.6
0.8
1.0
1.2
1.4
1.6
Hill model
log10-dose
ep
idid
.we
igh
t
m5-
v ersion: 60.0
loglik -32.72
v ar- 0.301
a- 1.2
CED- 12.9
c- 0.47
d- 10
b: 16.18
CES -0.05
conv : 1
scaling f actor on x : 1
dty pe : 10
selected : all
remov ed:
none
CEDL 4.557
CEDU 18.82
0.5 1.0 1.5 2.0
0200
400
600
800
1000
Exponential model
log10-dose
ep
id.s
pe
rm.n
r
m5-
v ersion: 60.0
loglik -121.16
v ar- 0.661
a- 830
CED- 38.7
c- 0.000461
d- 4.84
b: 1.058e-09
CES -0.05
conv : 1
scaling f actor on x : 1
dty pe : 10
selected : all
remov ed:
none
CEDL 24.65
CEDU 91.830.5 1.0 1.5 2.0
0200
400
600
800
1000
Hill model
log10-dose
ep
id.s
pe
rm.n
r
m5-
v ersion: 60.0
loglik -121.16
v ar- 0.661
a- 832
CED- 44
c- 1.05e-06
d- 10
b: 59.05
CES -0.05
conv : 1
scaling f actor on x : 1
dty pe : 10
selected : all
remov ed:
none
CEDL 37.44
CEDU 45.54

Nitrofurans in food
EFSA Journal 2015;13(6):4140 207
are shown in the legends on the right side of the figures (see CED, CEDL and CEDU). Note that the
benchmark response is 5 %, indicated as CES (critical effect size) in the legend.
I.6.4. Effect on testicular spermatid number
The overall BMD05 confidence interval for testicular spermatid number in mice is 24–82 mg/kg b.w.
per day (Figure I.15).
Figure I.15: Dose–response data for the effect of nitrofurazone on testicular spermatid number in
mice with fitted exponential and Hill model. The BMDs, BMDLs and BMDUs for males and females
are shown in the legends on the right side of the figures (see CED, CEDL and CEDU). Note that the
benchmark response is 5 %, indicated as CES (critical effect size) in the legend.
I.6.5. Summary
Table I.18 shows the BMD results for the effect of nitrofurazone on the testis. From these results, the
CONTAM Panel noted the lowest BMDL05 value of 4.6 mg/kg b.w. per day for the effect of
nitrofurazone on epididymis weight in rats.
Table I.18: Summary of benchmark dose results for non-neoplastic lesions caused by nitrofurazone
Target Species BMDL05 (mg/kg b.w. per day) BMDU05 (mg/kg b.w. per day)
Testis weight rat 12 19
Epididymis weight rat 4.6 20
Epididymal sperm number mice 25 92
Testicular spermatid number mice 24 82
b.w.: body weight; BMDL10: lower 95 % confidence limit for a benchmark response of 10 % extra risk; BMDU: benchmark
dose upper confidence limit.
I.7. Semicarbazide: non-neoplastic effects
I.7.1. Disarrangement of epiphyseal chondrocytes tibia
Takahashi et al. (2014) reported the effects of semicarbazide on disarrangement of epiphyseal
chondrocytes tibia in Wistar Hannover GALAS rats (see Table I.19). The results of the BMD analysis
are shown in Table I.20. The overall BMD10 confidence interval is 1.0–3.8 mg/kg b.w. per day. Figure
I.16 shows the data with the fitted log-logistic model.
0.5 1.0 1.5 2.0
24
68
10
Exponential model
log10-dose
test.sp
erm
.nr
m5-
v ersion: 60.0
loglik -62.09
v ar- 0.203
a- 8.81
CED- 37.9
c- 1.05e-06
d- 3.88
b: 3.856e-08
CES -0.05
conv : 1
scaling f actor on x : 1
dty pe : 10
selected : all
remov ed:
none
CEDL 24.16
CEDU 82.340.5 1.0 1.5 2.0
24
68
10
Hill model
log10-dose
test.sp
erm
.nr
m5-
v ersion: 60.0
loglik -62.1
v ar- 0.203
a- 8.8
CED- 41.6
c- 1.05e-06
d- 5.85
b: 68.8
CES -0.05
conv : 1
scaling f actor on x : 1
dty pe : 10
selected : all
remov ed:
none
CEDL 32.38
CEDU 70.48

Nitrofurans in food
EFSA Journal 2015;13(6):4140 208
Table I.19: Dose–response data for disarrangement of epiphyseal chondrocytes tibia in rats
(Takahashi et al., 2014)
Dose
(mg/kg b.w. per day)
Number of
rats
Number of rats with disarrangement of epiphyseal
chondrocytes tibia Sex
0 10 0 M
0.6 10 0 M
3.5 10 5 M
16.7 10 10 M
0 10 0 F
0.8 10 0 F
4.5 10 2 F
21.8 10 10 F
b.w.: body weight; F: female; M: male.
Table I.20: Benchmark dose(a)
results for disarrangement of epiphyseal chondrocytes tibia
(semicarbazide)
Model Par.covar No.par Log-
likelihood Accepted
BMDL10
(mg/kg
b.w. per
day)
BMD10
(mg/kg
b.w. per
day)
BMDU10
(mg/kg
b.w. per
day)
Sens.subgr
Null 1 –51.15 -
Full 8 –12.36 -
Two.stage – 3 –14.35 Yes 1.55 2.05 2.81 –
Log.logist – 3 –14.82 Yes 1.34 2.33 3.23 –
Weibull – 3 –14.34 Yes 1.03 1.99 3.09 –
Log.prob – 3 –14.52 Yes 1.31 2.28 3.19 –
Gamma – 3 –14.33 Yes 1.09 2.11 3.12 –
Logistic b 3 –11.94 Yes 1.61 3.17 3.78 m
b.w.: body weight; BMDL10: lower 95 % confidence limit for a benchmark response of 10 % extra risk; BMDU: benchmark
dose upper confidence limit.
(a): Covariate: sex; BMR: 0.1 extra risk; constraint: no; p-value goodness of fit: 0.05.
Figure I.16: Dose–response data for disarrangement of epiphyseal chondrocytes tibia with fitted
log-logistic model. No significant differences in dose response were found between males (red
triangles) and females (black circles)
-0.5 0.0 0.5 1.0
0.0
0.2
0.4
0.6
0.8
1.0
log10-dose
chondro
c.t
ibia
- --
-
- -
-
-
- -
-
-
- -
-
-
log.logist log.logist
v ersion: 60.0
model A 18
log-lik -14.82
a- 0
BMD- 2.3307
c 3.0351
dty pe 4
b: 4.807
ces.ans 3
CES 0.1
conv 0
scaling on x: 1
selected all
extra risk 0.1
CI
1.339 3.232
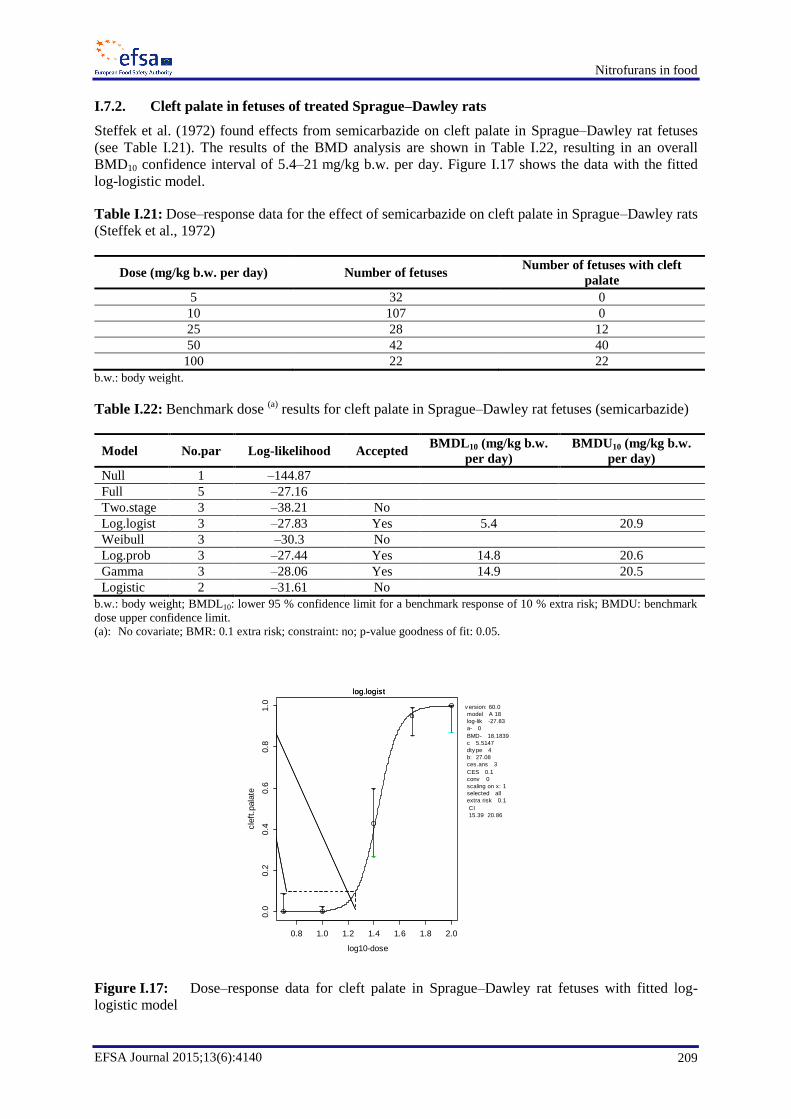
Nitrofurans in food
EFSA Journal 2015;13(6):4140 209
I.7.2. Cleft palate in fetuses of treated Sprague–Dawley rats
Steffek et al. (1972) found effects from semicarbazide on cleft palate in Sprague–Dawley rat fetuses
(see Table I.21). The results of the BMD analysis are shown in Table I.22, resulting in an overall
BMD10 confidence interval of 5.4–21 mg/kg b.w. per day. Figure I.17 shows the data with the fitted
log-logistic model.
Table I.21: Dose–response data for the effect of semicarbazide on cleft palate in Sprague–Dawley rats
(Steffek et al., 1972)
Dose (mg/kg b.w. per day) Number of fetuses Number of fetuses with cleft
palate
5 32 0
10 107 0
25 28 12
50 42 40
100 22 22
b.w.: body weight.
Table I.22: Benchmark dose (a)
results for cleft palate in Sprague–Dawley rat fetuses (semicarbazide)
Model No.par Log-likelihood Accepted BMDL10 (mg/kg b.w.
per day)
BMDU10 (mg/kg b.w.
per day)
Null 1 –144.87
Full 5 –27.16
Two.stage 3 –38.21 No
Log.logist 3 –27.83 Yes 5.4 20.9
Weibull 3 –30.3 No
Log.prob 3 –27.44 Yes 14.8 20.6
Gamma 3 –28.06 Yes 14.9 20.5
Logistic 2 –31.61 No
b.w.: body weight; BMDL10: lower 95 % confidence limit for a benchmark response of 10 % extra risk; BMDU: benchmark
dose upper confidence limit.
(a): No covariate; BMR: 0.1 extra risk; constraint: no; p-value goodness of fit: 0.05.
Figure I.17: Dose–response data for cleft palate in Sprague–Dawley rat fetuses with fitted log-
logistic model
0.8 1.0 1.2 1.4 1.6 1.8 2.0
0.0
0.2
0.4
0.6
0.8
1.0
log10-dose
cle
ft.p
ala
te
- -
-
- -
-
-
-
- -
log.logist log.logist
v ersion: 60.0
model A 18
log-lik -27.83
a- 0
BMD- 18.1839
c 5.5147
dty pe 4
b: 27.08
ces.ans 3
CES 0.1
conv 0
scaling on x: 1
selected all
extra risk 0.1
CI
15.39 20.86

Nitrofurans in food
EFSA Journal 2015;13(6):4140 210
I.7.3. Summary
Table I.23 shows the BMD results for the effect of SEM on the non-neoplastic effects considered.
From these results, the CONTAM Panel selected the lowest BMDL10 value of 1.0 mg/kg b.w. per day
for the effect of SEM on disarrangement of epiphyseal chondrocytes tibia.
Table I.23: Summary of benchmark dose results for non-neoplastic effects caused by
semicarbazide in rats
Target BMDL10 (mg/kg b.w. per
day)
BMDU10 (mg/kg b.w. per
day)
Disarrangement of epiphyseal chondrocytes tibia 1.0(a)
3.8
Cleft palate 5.4 21
b.w.: body weight; BMDL10: lower 95 % confidence limit for a benchmark response of 10 % extra risk; BMDU: benchmark
dose upper confidence limit.
(a): Holds equally for each gender.
I.8. Nifursol: non-neoplastic effects
I.8.1. Non-neoplastic effects reported by Wood et al. (1984)
Wood et al. (1984) reported the effects of nifursol on packed cell volume (PCV), mean corpuscular
volume (MCV) and spleen weight in a 13-week study in rats (see Table I.24). The endpoints MCV and
PCV in both sexes, and spleen weight in females were selected for BMD analysis.
Table I.24: Dose-response data for the effect of nifursol on packed cell volume, mean corpuscular
volume and spleen weight in Sprague–Dawley rats (Wood et al., 1984)
Dose (mg/kg
b.w. per day)
Number of
animals Sex
MCV(a)
(fL)
PCV(a)
(%)
Spleen weight
(g)
0 10 M 68 ± 3.1 56 ± 1.9 n.m.
13.7 10 M 68 ± 2.6 55 ± 1.5 n.m.
28.0 10 M 67 ± 2.5 54 ± 1.2 n.m.
39.7 10 M 66 ± 3.4 55 ± 1.2 n.m.
53.6 10 M 63 ± 2.0 55 ± 2.5 n.m.
67.2 20 M 62 ± 2.5 53 ± 1.7 n.m.
0 10 F 70 ± 2.2 54 ± 1.8 0.53 ± 0.067
14.9 10 F 69 ± 2.3 53 ± 1.6 0.58 ± 0.067
30.2 10 F 69 ± 1.9 51 ± 2.0 0.62 ± 0.079
44.0 10 F 69 ± 4.0 50 ± 2.0 0.62 ± 0.079
61.8 10 F 67 ± 2.1 49 ± 2.8 0.59 ± 0.088
78.8 20 (b)
F 67 ± 2.4 49 ± 1.6 0.65 ± 0.097
b.w.: body weight; BMDL10: lower 95 % confidence limit for a benchmark response of 10 % extra risk; BMDU: benchmark
dose upper confidence limit; F: female; fL: femtolitre; M: male; MCV: mean corpuscular volume; n.m.: not modelled; PCV:
packed cell volume.
(a): Data from week 13.
(b): For spleen weight only, 10 animals in high-dose group.
Males were found to be significantly more sensitive regarding MCV, while females were more
sensitive regarding PCV (Figure I.18 and I.19).
The overall BMD05 confidence intervals are:
MCV: 28–47 mg/kg b.w. per day (males);
PCV: 18–39 mg/kg (females).

Nitrofurans in food
EFSA Journal 2015;13(6):4140 211
The dose–response analysis of spleen weight showed a significant trend, but the responses at all (five)
non-zero doses were very similar (see Figure I.20), i.e. despite the large number of doses, there is very
little dose–response information below the maximum response. As a result, the lower bound of the
BMD is not determined by these data. It might also by hypothesised that the control group in this
dataset was an outlier, while there is in reality no dose-related response. The latter is supported by
another dataset on spleen weights in which the maximum response was found to be much larger.
Figure I.18: Dose–response data for the effect of nifursol on mean corpuscular volume with fitted
exponential and Hill model for males (triangles) and females (circles). The BMDs, BMDLs and
BMDUs for males and females are shown in the legends on the right side of the figures (see CED,
CEDL and CEDU). Note that the benchmark response is 5 %, indicated as CES (critical effect size) in
the legend.
Figure I.19: Dose–response data for the effect of nifursol on packed cell volume with fitted
exponential and Hill model for males (triangles) and females (circles). The BMDs, BMDLs and
BMDUs for males and females are shown in the legends on the right side of the figures (see CED,
CEDL and CEDU). Note that the benchmark response is 5 %, indicated as CES (critical effect size) in
the legend.
0.6 0.8 1.0 1.2 1.4 1.6 1.8
62
64
66
68
70
72
Exponential model
log10-dose
mn
.MC
V
m5-b
v ersion: 60.0
loglik 238.74
v ar- 0.00149
a- 69.1
CED-f 111
CED-m 38.3
c- 1.05e-06
d- 1.4
CES -0.05
CEDL-f 77.67
CEDU-f 224.4
CEDL-m 28.16
CEDU-m 47.28
b: 7.183e-05
b: 0.0003165
conv : 1
scaling f actor on x : 1
dty pe : 10
selected : all
remov ed: none
cov ariate: sex
0.6 0.8 1.0 1.2 1.4 1.6 1.8
62
64
66
68
70
72
Hill model
log10-dose
mn
.MC
V
m5-b
v ersion: 60.0
loglik 238.77
v ar- 0.00149
a- 69.1
CED-f 110
CED-m 38.4
c- 1.05e-06
d- 1.45
CES -0.05
CEDL-f 77.67
CEDU-f 219
CEDL-m 28.26
CEDU-m 47.24
b: 841.7
b: 292.9
conv : 1
scaling f actor on x : 1
dty pe : 10
selected : all
remov ed: none
cov ariate: sex
0.6 0.8 1.0 1.2 1.4 1.6 1.8
48
50
52
54
56
Exponential model
log10-dose
mn
.PC
V
m5-ab
v ersion: 60.0
loglik 251.47
v ar- 0.00122
a-f 54.1
a-m 55.5
CED-f 27.3
CED-m 82.4
c- 0.9
d- 1.69
CES -0.05
CEDL-f 17.95
CEDU-f 38.66
CEDL-m 58.84
CEDU-m 133.4
b: 0.002615
b: 0.0004041
conv : 1
scaling f actor on x : 1
dty pe : 10
selected : all
remov ed: none
cov ariate: sex
0.6 0.8 1.0 1.2 1.4 1.6 1.8
48
50
52
54
56
Hill model
log10-dose
mn
.PC
V
m5-ab
v ersion: 60.0
loglik 251.41
v ar- 0.00122
a-f 53.9
a-m 55.3
CED-f 28
CED-m 83.6
c- 0.899
d- 2.59
CES -0.05
CEDL-f 18.01
CEDU-f 39.33
CEDL-m 60.22
CEDU-m 131.8
b: 28.21
b: 84.13
conv : 1
scaling f actor on x : 1
dty pe : 10
selected : all
remov ed: none
cov ariate: sex

Nitrofurans in food
EFSA Journal 2015;13(6):4140 212
Figure I.20: Dose–response data for the effect of nifursol on spleen weights with fitted exponential
and Hill model for females. The BMDs, BMDLs and BMDUs for males and females are shown in the
legends on the right side of the figures (see CED, CEDL and CEDU). Note that the benchmark
response is 5 %, indicated as CES (critical effect size) in the legend.
I.8.2. Effect of nifursol on liver weight (Rude et al., 1970c)
Liver weights in male Simonsen Long–Evans rats, reported by Rude et al. (1970c) showed a clear
dose-related decrease in a 2-year rat study (Table I.25, with an overall BMD05 confidence interval of
11–26 mg/kg b.w. per day (Figure I.21, Table I.26).
Table I.25: Dose–response data for the effect of nifursol on liver weight in male Simonsen Long–
Evans rats (Rude et al., 1970c)
Dose (mg/kg b.w. per day) Number of animals Liver weight ± SD (g)
0 37 15.1 ± 1.73
17.0 35 15.1 ± 1.9
25.9 36 13.3 ± 1.8
35.0 28 13.5 ± 1.7
43.5 39 12.3 ± 1.55
b.w.: body weight; SD: standard deviation.
Figure I.21: Dose–response data for the effect of nifursol on liver weights with fitted exponential
and Hill model for males. The BMDs, BMDLs and BMDUs for males and females are shown in the
legends on the right side of the figures (see CED, CEDL and CEDU). Note that the benchmark
response is 5 %, indicated as CES (critical effect size) in the legend.
0.6 0.8 1.0 1.2 1.4 1.6 1.8
0.5
00.5
50.6
00.6
50.7
0Exponential model
log10-dose
mn
.sp
lee
n.w
eig
ht
m5-
v ersion: 60.0
loglik 37.84
v ar- 0.0166
a- 0.526
CED- 12.1
c- 1.17
d- 4.16
CES 0.05
CEDL 0
CEDU 28.02
b: 1.13e-05
conv : 1
scaling f actor on x : 1
dty pe : 10
selected : all
remov ed: none
0.6 0.8 1.0 1.2 1.4 1.6 1.8
0.5
00.5
50.6
00.6
50.7
0
Hill model
log10-dose
mn
.sp
lee
n.w
eig
ht
m5-
v ersion: 60.0
loglik 37.84
v ar- 0.0166
a- 0.526
CED- 13.3
c- 1.17
d- 10
CES 0.05
CEDL 0
CEDU 25.73
b: 14.47
conv : 1
scaling f actor on x : 1
dty pe : 10
selected : all
remov ed: none
0.6 0.8 1.0 1.2 1.4 1.6
12
13
14
15
Exponential model
log10-dose
mn
.liv
er.
we
igh
t
m5-
v ersion: 60.0
loglik 113.2
v ar- 0.0161
a- 15.1
CED- 18.4
c- 1.05e-06
d- 1.65
CES -0.05
CEDL 11.29
CEDU 26.1
b: 0.000425
conv : 1
scaling f actor on x : 1
dty pe : 10
selected : all
remov ed: none
0.6 0.8 1.0 1.2 1.4 1.6
12
13
14
15
Hill model
log10-dose
mn
.liv
er.
we
igh
t
m5-
v ersion: 60.0
loglik 113.25
v ar- 0.016
a- 15.1
CED- 18.5
c- 1.05e-06
d- 1.75
CES -0.05
CEDL 11.57
CEDU 26.02
b: 99.44
conv : 1
scaling f actor on x : 1
dty pe : 10
selected : all
remov ed: none

Nitrofurans in food
EFSA Journal 2015;13(6):4140 213
Table I.26: Benchmark dose results for the effect of nifursol on liver weight in male rats
Analysis with exponential models
Model Converged npar Loglik
Full 1 6 117.92
m1- 1 2 85.94
m2- 1 3 111.36
m3- 1 4 113.2
m4- 1 4 111.36
m5- 1 5 113.42
Analysis with Hill models
Model Converged npar Loglik
Full NA 6 117.92
m1- 1 2 85.94
m2- 1 3 110.87
m3- 1 4 113.25
m4- 1 4 110.87
m5- 1 5 113.8
I.8.3. Summary
Table I.27 shows the BMD results for the effect of nifursol on the non-neoplastic effects considered.
From these results, the CONTAM Panel selected the lowest BMDL05 value of 11 mg/kg b.w. per day
for the effect of nifursol on liver weight.
Table I.27: Summary of benchmark dose results for non-neoplastic effects caused by nifursol in rats
Target Sex BMDL05 (mg/kg
b.w. per day)
BMDU05 (mg/kg
b.w. per day)
Mean corpuscular volume M 28 47
F 78 224
Packed cell volume M 59 133
F 18 39
Liver weight M 11 26
b.w.: body weight; BMDL05: lower 95% confidence limit for a benchmark response of 5 % extra risk; F: female; M: male.
Nitrofurans in food
EFSA Journal 2015;13(6):4140 214
ABBREVIATIONS
ABP Androgen-binding protein
ADI Acceptable daily intake
AFC Panel EFSA Scientific Panel on Food Additives, Flavourings, Processing Aids and
Materials in Contact with Food
AHD 1-aminohydantoin
AIH Autoimmune hepatitis
ALP alkaline phosphatase
ALT Alanine aminotransferase
AMOZ 3-amino-5-methylmorpholino-2-oxazolidinone
AOZ 3-amino-2-oxazolidinone
APCI Atmospheric pressure chemical ionisation
AST Aspartate aminotransferase
BCRP/ABCG2 Breast cancer resistance protein
BgVV Federal Institute for Consumer Health Protection and Veterinary Medicine
b.i.d. bis in die (twice daily)
BMD Benchmark dose
BMDL Benchmark dose lower confidence limit
BMDL10 Lower 95 % confidence limit for a benchmark response of 10 % extra risk
BMDU Benchmark dose upper confidence limit
BMR Benchmark response
BrdU Bromodeoxyuridine
b.w. Body weight
CAS Chemical Abstracts Service
CCα Decision limit
CCβ Detection capability
CD50 Median convulsant dose
CED Critical effect dose
CEDL Critcal effect dose lower confidence limit
CEDU Critcal effect dose upper confidence limit
CES Critical effect size
CHL Chinese hamster lung
CHO Chinese hamster ovary
CI Confidence interval
Cmax maximum serum concentration
CONTAM Panel EFSA Scientific Panel on Contaminants in the Food Chain
CPAHD 1([(2-carboxyphenyl) methylene]-amine)-hydantoin
CPSEM [(2-carboxyphenyl) methylene]-semicarbazide
CVMP Committee for Veterinary Medicinal Products
CYP Cytochrome P450
DAD Diode-array detection
DMSO Dimethyl sulphoxide
DNSH 3,5-dinitrosalicylic acid hydrazide
d.w. Dry weight

Nitrofurans in food
EFSA Journal 2015;13(6):4140 215
EC European Commission
EEA European Economic Area (EEA
ELISA Enzyme-linked immunosorbent assays
EMA European Medicines Agency
EMEA European Agency for the Evaluation of Medicinal Products
ESI Electrospray ionisation
EU European Union
F Female
FAD Flavine adenine dinucleotide
FAO Food and Agriculture Organization
FAPAS Food Analysis Performance Assessment Scheme
fL Femtolitre
FL Fluorescence detection
FMN Flavine mononucleotide
FSA Food Standards Agency
FSANZ Food Standards Australia New Zealand
FSH Follicle-stimulating hormone
G6PD Glucose-6-phosphate dehydrogenase
GGT Gamma-glutamyl transferase
GSH Glutathione
GSSG Glutathione-disulphide
HBGV Health-based guidance value
HEH 2-hydroxy-ethylhydrazine
HPLC High-performance liquid chromatography
IARC International Agency for Research on Cancer
i.c. Intracerebral
i.p. Intraperitoneal
IRMM Institute for Reference Materials and Measurements
i.v. Intravenous
JECFA Joint FAO/WHO Expert Committee on Food Additives
LC-MS Liquid chromatography–mass spectrometry
LC-MS/MS Liquid chromatography–tandem mass spectrometry
LD50 Median lethal dose
LOAEL Lowest-observed-adverse-effect level
LOD Limit of detection
Log Kow Octanol/water partition coefficient
LOQ Limit of quantification
M Male
MAO Monoamine oxidase
MCHC Mean corpuscular haemoglobin concentration
MCV Mean corpuscular volume
mm Marker metabolite
MN Micronucleus
MOE Margin of exposure
Nitrofurans in food
EFSA Journal 2015;13(6):4140 216
MPL Maximum permitted level
MRL Maximum residue limit
MRPL Minimum required performance limit
NADPH Nicotinamide adenine dinucleotide phosphate
NA Not applicable
NAT N-acetyltransferases
NBA 2-nitrobenzaldehyde
ND Not detectable
n.m. Not modelled
NMC Normochromatic micronucleated erythrocytes
NOAEL No-observed-adverse-effect level
NOEL No-observed-effect level
NPAHD 1([(2-nitrophenyl) methylene]-amine)-hydantoin
NPAMOZ 3([(2-nitrophenyl) methylene]-amine)-5-methylmorpholino-2-oxazolidinone
NPAOZ 3([(2-nitrophenyl) methylene]-amine)-2-oxazolidinone
NPDNSH 3[(2-nitrophenyl) methylene]-5-dinitrosalicylic acid hydrazide
NPSEM [(2-nitrophenyl) methylene]-semicarbazide
NR nitroreductase
nr Not reported
OTM Olive tail moment
p.o. per os (orally)
PCE Polychromosome erythrocyte
PCV Packed cell volume
PES Processed Euchema seaweed
PMC Polychromatic micronucleated
PND Postnatal day
qs quantum satis
RASFF Rapid Alert System for Food and Feed
RIVM National Institute for Public health and Environment (Rijksinstituut voor
Volksgezondheid en Milieu)
ROS Reactive oxygen species
RPA Reference point for action
s.c. subcutaneous
SCAN Scientific Committee on Animal Nutrition
SCE Sister chromatid exchange
SCO Sertoli cell only
SEM Semicarbazide
SPE Solid phase extraction
TK Thymidine kinase
Tmax Time to peak concentration
UDS Unscheduled DNA synthesis
UHPLC Ultra-high-performance liquid chromatography
UK United Kingdom
USA United States of America

Nitrofurans in food
EFSA Journal 2015;13(6):4140 217
USDA United States Department of Agriculture
UV Ultraviolet
VMP Veterinary medicinal product
VSD Virtual safe dose
WHO World Health Organization