scientific evidence for predicting 25 years of global cooling: ice core isotope data, decadal sea...
TRANSCRIPT

Scientific evidence for predicting 25 years of global cooling: Ice core isotope data, decadal sea surface temperature changes, glacial fluctuations, solar variations, and historic measurements— the past is the key to the future
Don J EasterbrookDept of Geology, Western Wash Univ.Bellingham, WA

IPCC, NASA PredictionsIPCC, NASA PredictionsGlobal warming isn’t a prediction. It is happening“If Canada proceeds, and we do nothing, it will be game over for the climate. ….concentrations of carbon …..would reach levels higher than in the Pliocene era, more than 2.5 million years ago, when sea level was at least 50 feet higher. …assure that the disintegration of the ice sheets would accelerate out of control. Sea levels would rise and destroy coastal cities. Global temperatures would become intolerable. Twenty to 50 percent of the planet’s species would be driven to extinction. Civilization would be at risk..Over the next several decades, the …region from North Dakota to Texas will develop semi-permanent drought, with rain,… occurring in extreme events with heavy flooding. Economic losses would be incalculable. .the Midwest would be a dust bowl. California’s Central Valley could no longer be irrigated. Food prices would rise to unprecedented levels. If this sounds apocalyptic, it is. (James Hansen, NY Times editiorial, 2012)

OR . . . . . .OR . . . . . . ““Global warming is over“ Global warming is over“ (Easterbrook, 2000, (Easterbrook, 2000,
2010)2010)
““The current warm cycle should end in the The current warm cycle should end in the next few years, and global warming should next few years, and global warming should abate, rather than increase, in the coming abate, rather than increase, in the coming decades.” decades.” (Easterbrook, 2000) (Easterbrook, 2000)
““The current warm cycle should end soon The current warm cycle should end soon and global temperatures should and global temperatures should cool.”cool.”(Easterbrook, 2000)(Easterbrook, 2000)
WARMING OR COOLING?WARMING OR COOLING?
What is happening now—warming or What is happening now—warming or cooling?cooling?
How have climates changed in the past? How have climates changed in the past?
What is the basis for predicting future What is the basis for predicting future climate?climate?
What is in store for the next 25 years?What is in store for the next 25 years?
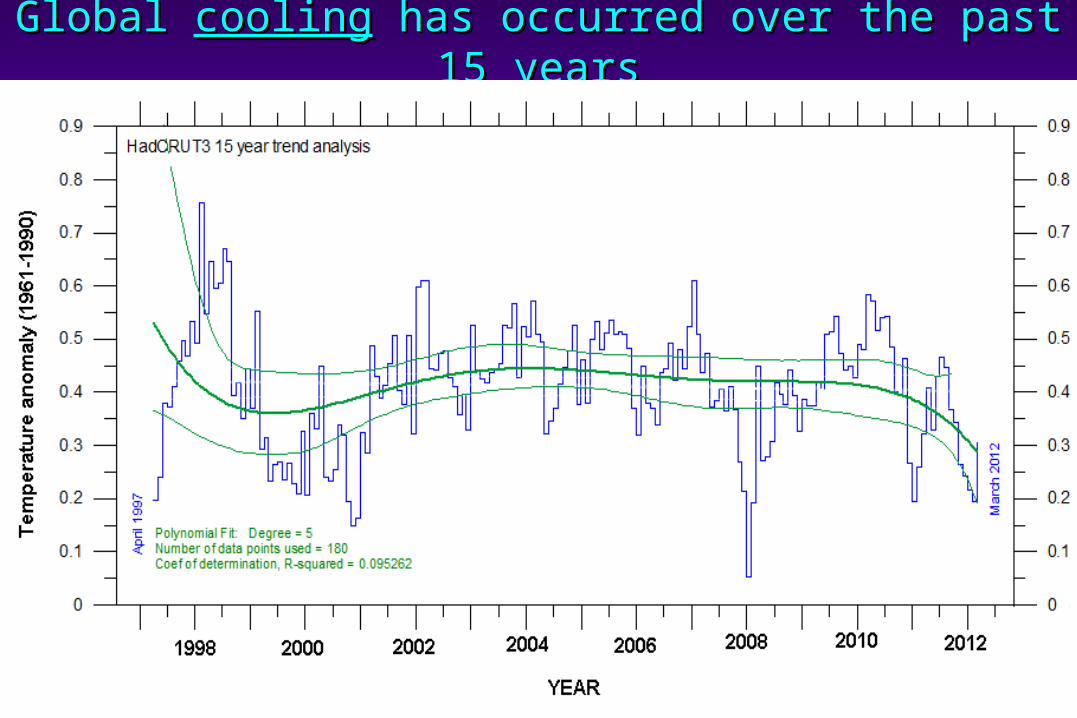
Global Global coolingcooling has occurred over the past 15 has occurred over the past 15 yearsyears

Global Global cooling cooling is realis real

Cooling temperature trendCooling temperature trend

Winters in the US have been much cooler than usual during the past decade

How do you predict climate?How do you predict climate?
1. Computer models
2. Real physical evidence to establish cyclical patterns
In order to predict where we are heading, we need to know where we’ve been.
The past is the key to the future
(Cartoons by Josh)

Historic temperature Historic temperature measurementsmeasurements
Oxygen isotope ratios Oxygen isotope ratios in deep ice coresin deep ice cores..
Advance and retreat of Advance and retreat of glaciers. glaciers.
Measurement of ocean Measurement of ocean temperaturestemperatures
Measuring climatic warming/cooling in the geologic past
Data in this presentation may be found in this volume
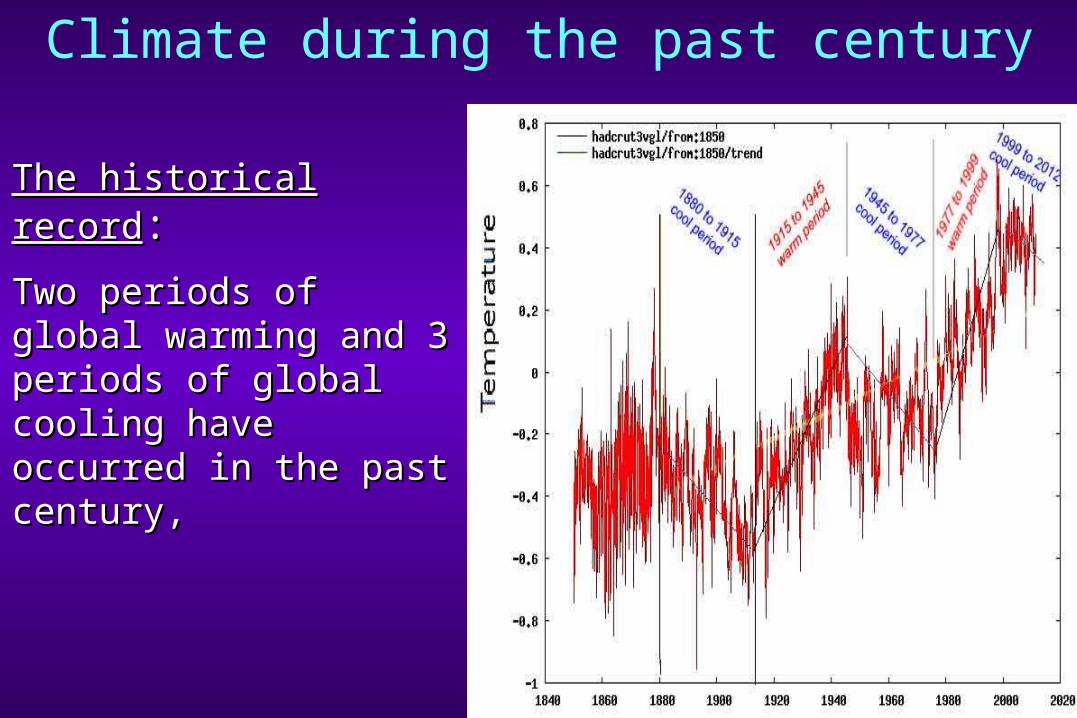
The historical recordThe historical record::
Two periods of global Two periods of global warming and 3 warming and 3 periods of global periods of global cooling have occurred cooling have occurred in the past century, in the past century,
Climate during the past century

The ratio of 18O to 16O depends on the temperature at the time snow crystals formed in the atmosphere. The oxygen isotopic composition of a sample is expressed as a departure of the 18O/16O ratio from a standard.
δ18O = (18O/16O)sample ‒ (18O/16O) _________________________________ x 103
(18O/16O)standard
where δ18O is the of ratio 18O/16O expressed as per mil (0/00)
The GISP2 isotope data reflects Greenland temperatures but excellent correlation with global glacier fluctuations makes it a good proxy for global temperatures.
Climate during the past 10,000 yearsThe Greenland GISP2 ice core

40 periods of warming and cooling in the past 500 years shown by isotope data from Greenland ice cores with an average span of 27 years

Warm/cool periods over the past 5,000 Warm/cool periods over the past 5,000 yearsyears

The Medieval Warm The Medieval Warm Period and Little Ice Period and Little Ice Age were global Age were global climate eventsclimate events
~3,000 publications ~3,000 publications including many booksincluding many books (Loehle, 2007)
Mann et al. (1998)

Almost every alpine glacier in the world shows Little Ice Almost every alpine glacier in the world shows Little Ice Age expansion of ice following the Medieval Warmer Age expansion of ice following the Medieval Warmer
Period Period

About 90% of the past 10,00 years were warmer than now
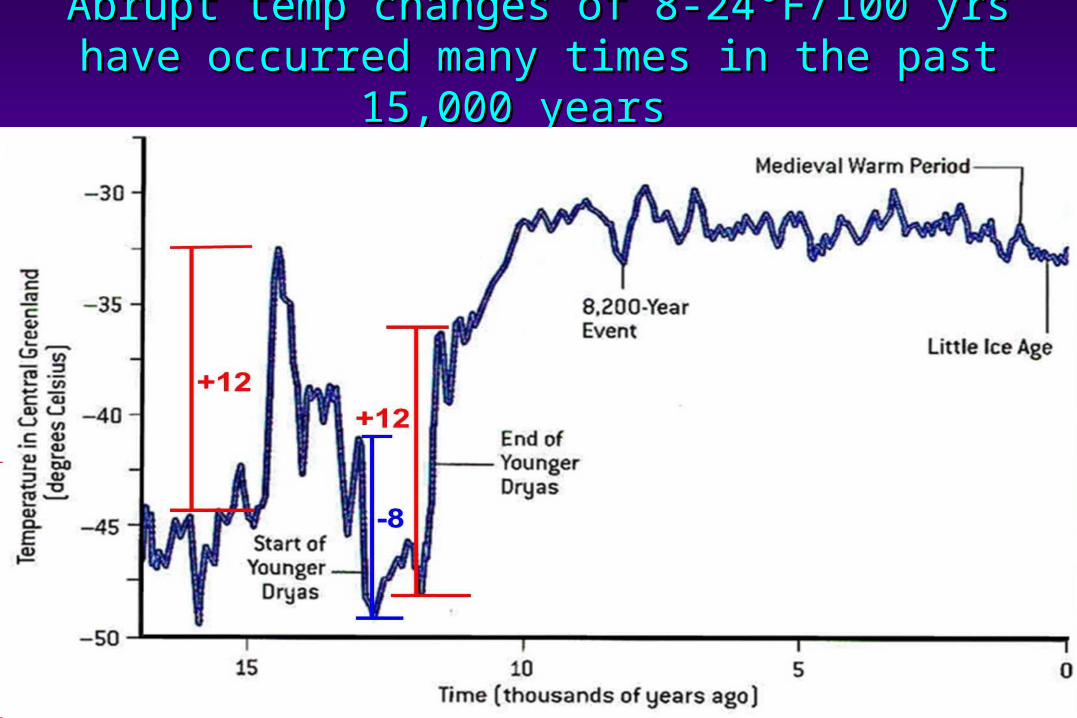
Abrupt temp changes of 8-24°F/100 yrs have Abrupt temp changes of 8-24°F/100 yrs have occurred many times in the past 15,000 years occurred many times in the past 15,000 years

Abrupt, intense Abrupt, intense periods of periods of global warming global warming 10-15,000years 10-15,000years agoago

1. Global warming has occurred many times in the last 25,000 years, all caused by natural, recurring processes.
2. The magnitude and intensity of global warming during the past century is insignificant compared to the magnitude and intensity of the profound natural climate reversals over the past 25,000 years,
Global warming/cooling in past 25,000 years

1. Global warming has occurred many times in the last 25,000 years, caused by natural, recurring processes.
2. The magnitude and intensity of global warming during the past century are insignificant compared to the magnitude and intensity of the profound natural climate reversals over the past 15,000 years.
3. Period of global warming and cooling show a regular, systematic pattern.
4. These intense periods of global warming occurred long before any possible effect of atmospheric CO2.
Conclusions about global warming from the past few centuries to 25,000 years ago

What causes the systematic pattern of What causes the systematic pattern of global warming and cooling?global warming and cooling?
Relationship Relationship of climate of climate change and change and sea surface sea surface temperaturetemperature—the PDO —the PDO and AMOand AMO
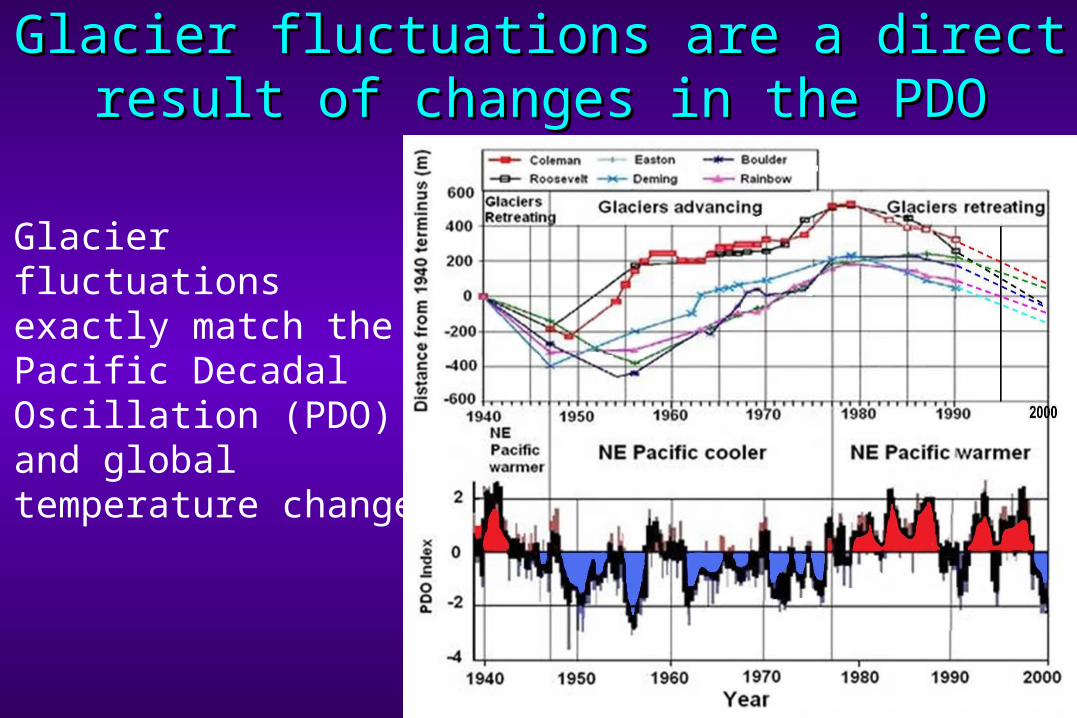
Glacier fluctuations are a direct result Glacier fluctuations are a direct result of changes in the PDOof changes in the PDO
Glacier fluctuations exactly match the Pacific Decadal Oscillation (PDO) and global temperature changes

The PDO shows up The PDO shows up as sea surface as sea surface temperature temperature
changeschanges

GLACIER FLUCTUATIONS
CLIMATE CHANGES
PDO-AMO MODE CHANGES
WHAT DRIVES PDO-AMO MODES?

PDO COLD MODE (1945-77) PDO WARM MODE (1977-98

Sea surface temperaturesSea surface temperatures
1997
2007
2001
1999

March, March, 20092009
May 2012
Cold PDO has been firmly entrenched since 1999

Good correlation between North Atlantic SST and temperatures of European rural areas
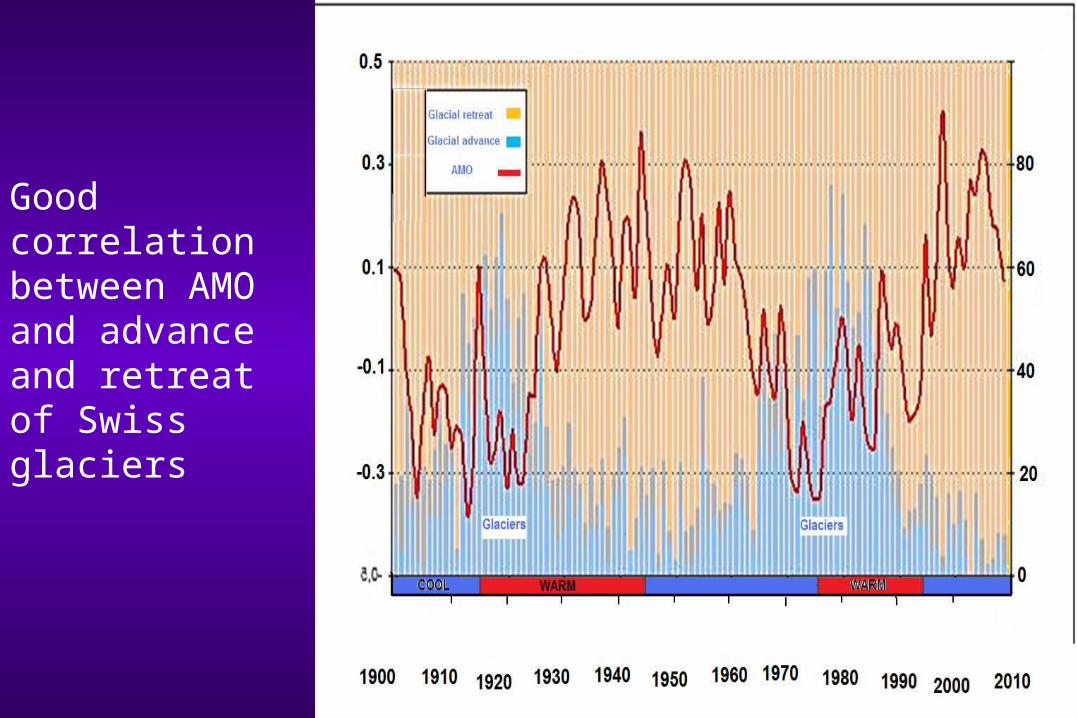
Good correlation between AMO and advance and retreat of Swiss glaciers

Good correlation of PDO + AMO and Arctic mean temperatures

Setting up Setting up of the PDO of the PDO cold phase cold phase
assures assures global global
cooling for cooling for the next the next ~25-30 ~25-30 yearsyears..
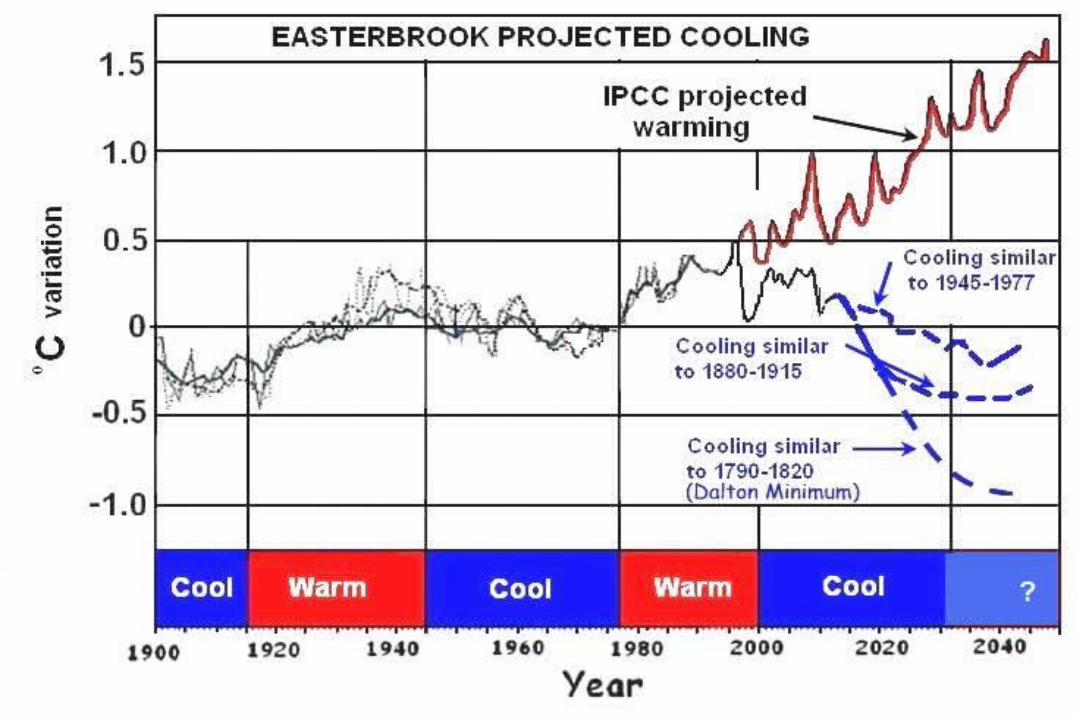
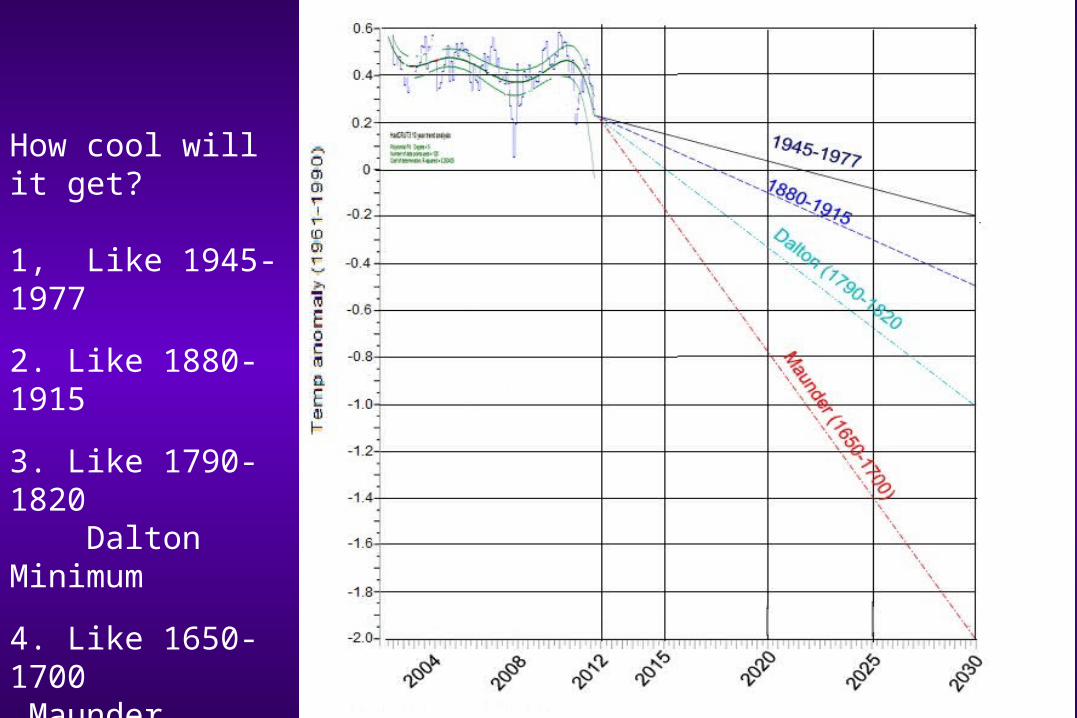
How cool will it get?
1, Like 1945-1977
2. Like 1880-1915
3. Like 1790-1820 Dalton Minimum
4. Like 1650-1700 Maunder Minimum

Role of the Role of the sun in driving sun in driving global climate global climate
changeschanges


Maunder Solar Minimum Maunder Solar Minimum

Napoleon’s army of Napoleon’s army of 400,000 reduced 400,000 reduced to 40,000, largely to 40,000, largely by the harshness by the harshness of the 1812 of the 1812 Russian winter Russian winter during the Dalton during the Dalton MinimumMinimum
Dalton Solar Minimum (1790-1820)

Global cooling occurs during times of Global cooling occurs during times of few sunspots and low solar irradiancefew sunspots and low solar irradiance

Correlation of sunspot numbers and climateCorrelation of sunspot numbers and climate
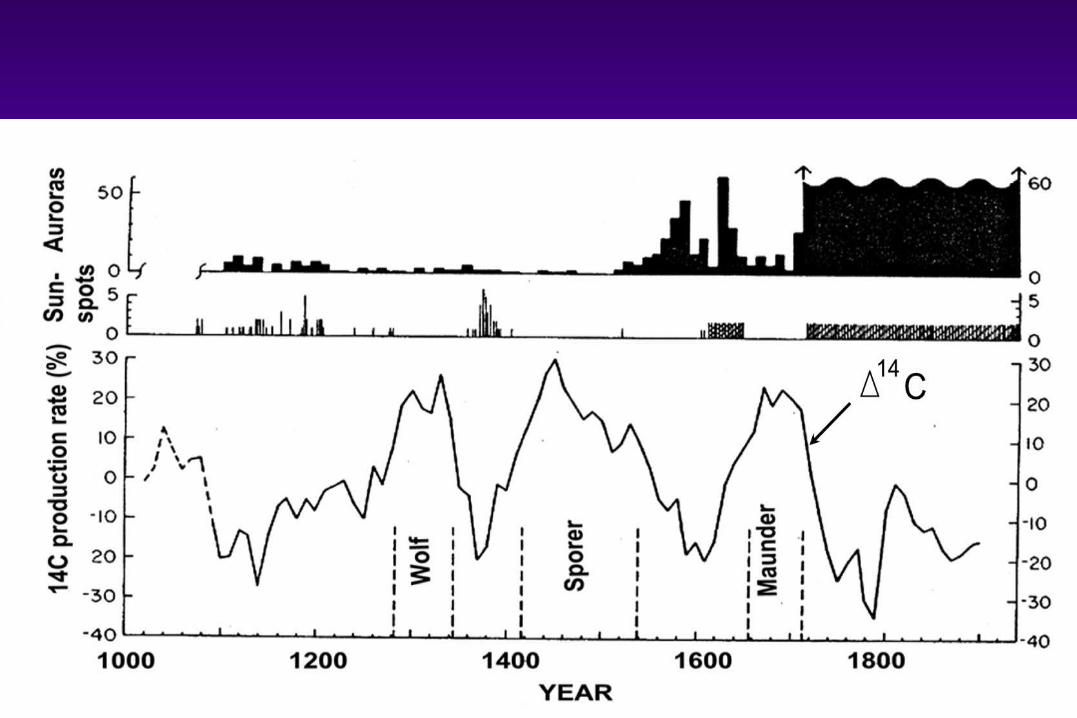

Correlation Correlation between between
solar activity solar activity and climateand climate
Change in Change in production production
rate of rate of radiocarbon radiocarbon
and and temperature temperature

Svensmark, CERN experiments Svensmark, CERN experiments
Variations in the sun’s magnetic field Variations in the sun’s magnetic field affects cosmic radiation received by the affects cosmic radiation received by the Earth. Earth.
Cosmic rays produce ions that act as Cosmic rays produce ions that act as seeds of condensation (clouds).seeds of condensation (clouds).
Increased cloudiness results in climatic Increased cloudiness results in climatic coolingcooling..


Cloud cover and cosmic raysCloud cover and cosmic rays

CONCLUSIONSCONCLUSIONS
Many periods of natural warming and cooling have occurred in the Many periods of natural warming and cooling have occurred in the past past 15,000 years, long before CO15,000 years, long before CO22 could have caused them. could have caused them.
More than 40 periods of global warming/cooling have occurred in the More than 40 periods of global warming/cooling have occurred in the past 500 past 500 years, none of which could have been caused by COyears, none of which could have been caused by CO22..
Many periods of far more intense warming have occurred from natural Many periods of far more intense warming have occurred from natural causes causes in the past 15,000 years, some as great as 20°F in 40 in the past 15,000 years, some as great as 20°F in 40 years.years.
Almost all of the past 10,000 years has been warmer than present. Almost all of the past 10,000 years has been warmer than present.
The Medieval Warm Period and Little Ice Age did occur—the ‘hockey The Medieval Warm Period and Little Ice Age did occur—the ‘hockey stick’ is stick’ is a bad joke.a bad joke.
The climate has been warming gradually since the Little Ice Age began The climate has been warming gradually since the Little Ice Age began about about 500 years ago. 500 years ago.
Recurring patterns of cyclic global climate change form a reliable Recurring patterns of cyclic global climate change form a reliable basis for basis for predicting future climate changes—the past is the key to predicting future climate changes—the past is the key to the future.the future.
Computer models have failed badly in predicting temperatures.Computer models have failed badly in predicting temperatures.

Climate changes result from changes in the PDO and AMO.Climate changes result from changes in the PDO and AMO.
The PDO flipped from cool to warm in 1977 and climate warmed; The PDO flipped from cool to warm in 1977 and climate warmed; the PDO flipped from warm to cool in 1999 and climate cooled.the PDO flipped from warm to cool in 1999 and climate cooled.
Changes in ocean temperatures correlate well with solar changes.Changes in ocean temperatures correlate well with solar changes.
Changes in the solar magnetic field affect incidence of cosmic rays Changes in the solar magnetic field affect incidence of cosmic rays on Earth. Changes in cosmic ray intensity affects cloudiness, on Earth. Changes in cosmic ray intensity affects cloudiness, which affects global temperatures. which affects global temperatures.
The sun is now in a solar minimum and seems to be heading for the The sun is now in a solar minimum and seems to be heading for the Dalton Minimum (1790-1820), during which global Dalton Minimum (1790-1820), during which global temperatures temperatures declined sharply.declined sharply.
The 1977-1998 global warming period is over and we are now in a The 1977-1998 global warming period is over and we are now in a period of global cooling that will last several decades, similar to period of global cooling that will last several decades, similar to continuing natural cycles dating back thousands of years. continuing natural cycles dating back thousands of years.

Global cooling is realGlobal cooling is real
Not only is the prediction of cooling in the Not only is the prediction of cooling in the decades ahead based on solid scientific decades ahead based on solid scientific data, but the data indicate it is a virtual data, but the data indicate it is a virtual certainty. certainty.
Cooling in the coming decades is assured Cooling in the coming decades is assured but the question remains—how cool will it but the question remains—how cool will it be? be?

By 2040, (in 28 yrs), By 2040, (in 28 yrs), the population will the population will be twice what it is be twice what it is today.today.
By 2080 (in 68 yrs), By 2080 (in 68 yrs), the population will the population will be 4 times what it I be 4 times what it I now.now.
Global cooling, will Global cooling, will reduce food reduce food production and the production and the demand for energy demand for energy will increase will increase dramaticallydramatically

Dogma is an impediment to the free exercise of thought. It paralyses the intelligence.
Conclusions based upon preconceived ideas are valueless. It is only the open mind that really thinks. Patricia Wentworth, 1949
For data and information go to: Bing.com or Google.com and enter Don Easterbrook global warming