scientific events in 2013
TRANSCRIPT


ACTA TECHNICA CORVINIENSIS – BULLETIN of ENGINEERING ISSN: 2067‐3809 [CD‐Rom, online] copyright © UNIVERSITY POLITEHNICA TIMISOARA, FACULTY OF ENGINEERING HUNEDOARA, 5, REVOLUTIEI, 331128, HUNEDOARA, ROMANIA http://acta.fih.upt.ro
UNIVERSITY "POLITEHNICA" TIMISOARA
FACULTY OF ENGINEERING – HUNEDOARA
5, Revolutiei, 331128 – Hunedoara,
ROMANIA

© copyright FACULTY of ENGINEERING ‐ HUNEDOARA, ROMANIA 3
Aims & Scope
General Aims: ACTA TECHNICA CORVINIENSIS – BULLETIN OF ENGINEERING is an international and interdisciplinary journal which reports on scientific and technical contributions. Every year, in four online issues (fascicules 1 - 4), ACTA TECHNICA CORVINIENSIS – Bulletin of Engineering [e-ISSN: 2067-3809] publishes a series of reviews covering the most exciting and developing areas of engineering. Each issue contains papers reviewed by international researchers who are experts in their fields. The result is a journal that gives the scientists and engineers the opportunity to keep informed of all the current developments in their own, and related, areas of research, ensuring the new ideas across an increasingly the interdisciplinary field. ACTA TECHNICA CORVINIENSIS – BULLETIN OF ENGINEERING publishes invited review papers covering the full spectrum of engineering. The reviews, both experimental and theoretical, provide general background information as well as a critical assessment on topics in a state of flux. We are primarily interested in those contributions which bring new insights, and papers will be selected on the basis of the importance of the new knowledge they provide. Topical reviews in materials science and engineering, each including: � surveys of work accomplished to date � current trends in research and applications � future prospects. As an open-access journal ACTA TECHNICA CORVINIENSIS – Bulletin of Engineering will serve the whole engineering research community, offering a stimulating combination of the following: � Research Papers - concise, high impact original research articles, � Scientific Papers - concise, high impact original theoretical articles, � Perspectives - commissioned commentaries highlighting the impact and wider implications of research appearing in
the journal. ACTA TECHNICA CORVINIENSIS – BULLETIN OF ENGINEERING encourages the submission of comments on papers published particularly in our journal. The journal publishes articles focused on topics of current interest within the scope of the journal and coordinated by invited guest editors. Interested authors are invited to contact one of the Editors for further details. ACTA TECHNICA CORVINIENSIS – Bulletin of Engineering has been published since 2008, as an online supplement of the ANNALS OF FACULTY ENGINEERING HUNEDOARA – INTERNATIONAL JOURNAL OF ENGINEERING. Now, the ACTA TECHNICA CORVINIENSIS – Bulletin of Engineering is a free-access, online, international and multidisciplinary publication of the Faculty of Engineering Hunedoara. ACTA TECHNICA CORVINIENSIS – BULLETIN OF ENGINEERING exchange similar publications with similar institutions of our country and from abroad. Audience & Coverage: Scientists and engineers with an interest in the respective interfaces of engineering fields, technology and materials, information processes, research in various industrial applications. It publishes articles of interest to researchers and engineers and to other scientists involved with materials phenomena and computational modeling. ACTA TECHNICA CORVINIENSIS – Bulletin of Engineering is a good opportunity for the researchers to exchange information and to present the results of their research activity. Scientists and engineers with an interest in the respective interfaces of engineering fields, technology and materials, information processes, research in various industrial applications are the target and audience of ACTA TECHNICA CORVINIENSIS – Bulletin of Engineering. It publishes articles of interest to researchers and engineers and to other scientists involved with materials phenomena and computational modeling. The journal's coverage will reflect the increasingly interdisciplinary nature of engineering, recognizing wide-ranging contributions to the development of methods, tools and evaluation strategies relevant to the field. Numerical modeling or simulation, as well as theoretical and experimental approaches to engineering will form the core of ACTA TECHNICA CORVINIENSIS – Bulletin of Engineering's content, however approaches from a range of environmental science and economics are strongly encouraged. ACTA TECHNICA CORVINIENSIS – Bulletin of Engineering appear in four issues per year and is open to the reviews, papers, short communications and breakings news inserted as Scientific Events, in the field of engineering. Mission: ACTA TECHNICA CORVINIENSIS – Bulletin of Engineering is an international and interdisciplinary journal which reports on scientific and technical contributions. The ACTA TECHNICA CORVINIENSIS – Bulletin of Engineering advances the understanding of both the fundamentals of engineering science and its application to the solution of challenges and problems in engineering and management, dedicated to the publication of high quality papers on all aspects of the engineering sciences and the management.

ACTA TECHNICA CORVINIENSIS – Bulletin of Engineering
2013. Fascicule 2 [April–June] 4
You are invited to contribute review or research papers as well as opinion in the fields of science and technology including engineering. We accept contributions (full papers) in the fields of applied sciences and technology including all branches of engineering and management. Submission of a paper implies that the work described has not been published previously (except in the form of an abstract or as part of a published lecture or academic thesis) that it is not under consideration for publication elsewhere. It is not accepted to submit materials which in any way violate copyrights of third persons or law rights. An author is fully responsible ethically and legally for breaking given conditions or misleading the Editor or the Publisher. The Editor reserves the right to return papers that do not conform to the instructions for paper preparation and template as well as papers that do not fit the scope of the journal, prior to refereeing. The Editor reserves the right not to accept the paper for print in the case of a negative review made by reviewers and also in the case of not paying the required fees if such will be fixed and in the case time of waiting for the publication of the paper would extend the period fixed by the Editor as a result of too big number of papers waiting for print. The decision of the Editor in that matter is irrevocable and their aim is care about the high content-related level of that journal. The mission of the ACTA TECHNICA CORVINIENSIS – Bulletin of Engineering is to disseminate academic knowledge across the scientific realms and to provide applied research knowledge to the appropriate stakeholders. We are keen to receive original contributions from researchers representing any Science related field. We strongly believe that the open access model will spur research across the world especially as researchers gain unrestricted access to high quality research articles. Being an Open Access Publisher, Academic Journals does not receive payment for subscription as the journals are freely accessible over the internet. General Topics: ENGINEERING � MECHANICAL ENGINEERING � METALLURGICAL ENGINEERING � AGRICULTURAL ENGINEERING � CONTROL ENGINEERING � ELECTRICAL ENGINEERING � CIVIL ENGINEERING � BIOMEDICAL ENGINEERING � TRANSPORT ENGINEERING � NANOENGINEERING CHEMISTRY � GENERAL CHEMISTRY � ANALYTICAL CHEMISTRY � INORGANIC CHEMISTRY � MATERIALS SCIENCE & METALLOGRAPHY � POLYMER CHEMISTRY � SPECTROSCOPY � THERMO-CHEMISTRY
ECONOMICS � AGRICULTURAL ECONOMICS � DEVELOPMENT ECONOMICS � ENVIRONMENTAL ECONOMICS � INDUSTRIAL ORGANIZATION � MATHEMATICAL ECONOMICS � MONETARY ECONOMICS � RESOURCE ECONOMICS � TRANSPORT ECONOMICS � GENERAL MANAGEMENT � MANAGERIAL ECONOMICS � LOGISTICS AGRICULTURE � AGRICULTURAL & BIOLOGICAL ENGINEERING � FOOD SCIENCE & ENGINEERING � HORTICULTURE COMPUTER & INFORMATION SCIENCES � COMPUTER SCIENCE � INFORMATION SCIENCE
EARTH SCIENCES � GEODESY � GEOLOGY � HYDROLOGY � SEISMOLOGY � SOIL SCIENCE ENVIRONMENTAL � ENVIRONMENTAL CHEMISTRY � ENVIRONMENTAL SCIENCE & ECOLOGY � ENVIRONMENTAL SOIL SCIENCE � ENVIRONMENTAL HEALTH BIOMECHANICS & BIOTECHNOLOGY � BIOMECHANICS � BIOTECHNOLOGY � BIOMATERIALS MATHEMATICS � APPLIED MATHEMATICS � MODELING & OPTIMIZATION � FOUNDATIONS & METHODS
Invitation: We are looking forward to a fruitful collaboration and we welcome you to publish in our ACTA TECHNICA CORVINIENSIS – Bulletin of Engineering. You are invited to contribute review or research papers as well as opinion in the fields of science and technology including engineering. We accept contributions (full papers) in the fields of applied sciences and technology including all branches of engineering and management. Submission of a paper implies that the work described has not been published previously (except in the form of an abstract or as part of a published lecture or academic thesis) that it is not under consideration for publication elsewhere. It is not accepted to submit materials which in any way violate copyrights of third persons or law rights. An author is fully responsible ethically and legally for breaking given conditions or misleading the Editor or the Publisher. 5th Anniversary Celebration: We are very pleased to inform that our journal ACTA TECHNICA CORVINIENSIS - Bulletin of Engineering completed its five years of publication successfully [2008-2012, Tome I-V]. In a very short period it has acquired global presence and scholars from all over the world have taken it with great enthusiasm. We are extremely grateful and heartily acknowledge the kind of support and encouragement from all contributors and all collaborators!
ACTA TECHNICA CORVINIENSIS – BULLETIN of ENGINEERING
ISSN: 2067-3809 [CD-Rom, online]
copyright © UNIVERSITY POLITEHNICA TIMISOARA, FACULTY OF ENGINEERING HUNEDOARA,
5, REVOLUTIEI, 331128, HUNEDOARA, ROMANIA http://acta.fih.upt.ro

© copyright FACULTY of ENGINEERING ‐ HUNEDOARA, ROMANIA 5
Editorial & Advisory Board
Manager & Chairman ROMANIA
Imre KISS University Politehnica TIMISOARA, Faculty of Engineering HUNEDOARA Department of Engineering & Management
Advisory Board & Steering Committee ROMANIA
Teodor HEPUT University Politehnica TIMISOARA, Faculty of Engineering HUNEDOARA Department of Engineering & Management - HUNEDOARA
HUNGARY
Imre DEKÁNY University of SZEGED, Department of Colloid Chemistry, president of Hungarian Regional Academy Of Sciences – branch of SZEGED
ROMANIA
Francisc WEBER University Politehnica TIMISOARA, Faculty of Engineering HUNEDOARA General Association of Romanian Engineers (AGIR) – branch HUNEDOARA
ROMANIA
Ioan ILCA University Politehnica TIMISOARA, Faculty of Engineering HUNEDOARA Academy of Technical Sciences (ASTR) – branch TIMIŞOARA
HUNGARY
Imre J. RUDAS Óbuda University of BUDAPEST, Department of Structural Engineering – BUDAPEST
HUNGARY
Béla ILLÉS University of MISKOLC, Faculty of Mechanical Engineering and Information Science – MISKOLC
SLOVAKIA
Štefan NIZNIK Technical University of KOŠICE, Faculty of Metallurgy, Department of Materials Science – KOŠICE
SLOVAKIA
Karol VELIŠEK Slovak University of Technology BRATISLAVA, Faculty Materials Science & Technology – TRNAVA
SLOVAKIA
Miroslav BADIDA Technical University of KOŠICE, Faculty of Mechanical Engineering – KOŠICE
SLOVAKIA
Ervin LUMNITZER Technical University of KOŠICE, Faculty of Mechanical Engineering – KOŠICE
SERBIA
Siniša KUZMANOVIC University of NOVI SAD, Faculty of Technical Sciences – NOVI SAD
SERBIA
Mirjana VOJINOVIĆ MILORADOV University of NOVI SAD, Faculty of Technical Sciences – NOVI SAD
CROATIA
Gordana BARIC University of ZAGREB, Faculty of Mechanical Engineering and Naval Architecture – ZAGREB
SERBIA
Zoran ANIŠIC University of NOVI SAD, Faculty of Technical Sciences – NOVI SAD
POLAND
Stanisław LEGUTKO Institute of Mechanical Technology, Polytechnic University – POZNAN
PORTUGAL
João Paulo DAVIM University of AVEIRO, Department of Mechanical Engineering – AVEIRO
POLAND
Andrzej WYCISLIK Silesian University of Technology - KATOWICE, Faculty Materials Science & Metallurgy – KATOWICE
BULGARIA
Kliment Blagoev HADJOV University of Chemical Technology and Metallurgy, Department of Applied Mechanics – SOFIA
HUNGARY
Imre TIMÁR University of Pannonia, Department of Silicate and Materials Engineering – VESZPRÉM
BULGARIA
Nikolay MIHAILOV Anghel Kanchev University of ROUSSE, Faculty of Electrical and Electronic Engineering – ROUSSE
ITALY
Alessandro GASPARETTO University of UDINE, Faculty of Engineering – UDINE
ARGENTINA
Gregorio PERICHINSKY University of BUENOS AIRES, Faculty of Engineering – BUENOS AIRES

ACTA TECHNICA CORVINIENSIS – Bulletin of Engineering
2013. Fascicule 2 [April–June] 6
Review process & Editorial Policy
ACTA TECHNICA CORVINIENSIS – Bulletin of Engineering is dedicated to publishing material of the highest engineering interest, and to this end we have assembled a distinguished Editorial Board and Scientific Committee of academics, professors and researchers. ACTA TECHNICA CORVINIENSIS – Bulletin of Engineering publishes invited review papers covering the full spectrum of engineering. The reviews, both experimental and theoretical, provide general background information as well as a critical assessment on topics in a state of flux. We are primarily interested in those contributions which bring new insights, and papers will be selected on the basis of the importance of the new knowledge they provide. The editorial policy of ACTA TECHNICA CORVINIENSIS – Bulletin of Engineering is to serve its readership in two ways. Firstly, it provides a critical overview of the current issues in a well-defined area of immediate interest to materials scientists. Secondly, each review contains an extensive list of references thus providing an invaluable pointer to the primary research literature available on the topic. This policy is implemented by the Editorial Board which consists of outstanding scientists in their respective disciplines. The Board identifies the topics of interest and subsequently invites qualified authors. In order to ensure speedy publication, each material will be report to authors, separately, thought Report of the Scientific Committee. For an overview of recent dispatched issues, see the ACTA TECHNICA CORVINIENSIS – Bulletin of Engineering issues. ACTA TECHNICA CORVINIENSIS – Bulletin of Engineering encourages the submission of comments on papers published particularly in our journal. The journal publishes articles focused on topics of current interest within the scope of the journal and coordinated by invited guest editors. Interested authors are invited to contact one of the Editors for further details. The members of the Editorial Board may serve as reviewers. The reports of the referees and the Decision of the Editors regarding the publication will be sent to the corresponding authors. The evaluated paper may be recommended for: � Acceptance without any changes – in that case the authors will be asked to send the paper electronically in the
required .doc format according to authors' instructions; � Acceptance with minor changes – if the authors follow the conditions imposed by referees the paper will be sent in the
required .doc format; � Acceptance with major changes – if the authors follow completely the conditions imposed by referees the paper will
be sent in the required .doc format; � Rejection – in that case the reasons for rejection will be transmitted to authors along with some suggestions for future
improvements (if that will be considered necessary). The manuscript accepted for publication will be published in the next issue of ACTA TECHNICA CORVINIENSIS – Bulletin of Engineering after the acceptance date. All rights are reserved by ACTA TECHNICA CORVINIENSIS – Bulletin of Engineering. The publication, reproduction or dissemination of the published paper is permitted only be written consent of one of the Managing Editors. ACTA TECHNICA CORVINIENSIS – Bulletin of Engineering accept for publication unpublished manuscripts on the understanding that the same manuscript is not under simultaneous consideration of other journals. Publication of a part of the data as the abstract of conference proceedings is exempted. All the authors and the corresponding author in particular take the responsibility to ensure that the text of the article does not contain portions copied from any other published material which amounts to plagiarism. We also request the authors to familiarize themselves with the good publication ethics principles before finalizing their manuscripts. Manuscripts submitted (original articles, technical notes, brief communications and case studies) will be subject to peer review by the members of the Editorial Board or by qualified outside reviewers. Only papers of high scientific quality will be accepted for publication. Manuscripts are accepted for review only when they report unpublished work that is not being considered for publication elsewhere.
ACTA TECHNICA CORVINIENSIS – BULLETIN of ENGINEERING
ISSN: 2067-3809 [CD-Rom, online]
copyright © UNIVERSITY POLITEHNICA TIMISOARA, FACULTY OF ENGINEERING HUNEDOARA,
5, REVOLUTIEI, 331128, HUNEDOARA, ROMANIA http://acta.fih.upt.ro

© copyright FACULTY of ENGINEERING ‐ HUNEDOARA, ROMANIA 7
Regional Associate Editors & Collaborators
Editors from ROMANIA Vasile ALEXA University Politehnica TIMIŞOARA, Faculty of Engineering – HUNEDOARA Sorin Aurel RAŢIU University Politehnica TIMIŞOARA, Faculty of Engineering – HUNEDOARA Vasile George CIOATĂ University Politehnica TIMIŞOARA, Faculty of Engineering – HUNEDOARA Dan Ludovic LEMLE University Politehnica TIMIŞOARA, Faculty of Engineering – HUNEDOARA Simona DZIŢAC University of ORADEA, Faculty of Energy Engineering – ORADEA Valentin VLĂDUŢ National Institute of Research - Development for Machines and Installations (INMA) – BUCUREŞTI Sorin Tiberiu BUNGESCU Banat’s University TIMIŞOARA – Department of Agricultural Machines – TIMIŞOARA Mirela SOHACIU University Politehnica BUCUREŞTI, Faculty of Materials Science and Engineering – BUCUREŞTI Endre IANOSI University Politehnica TIMIŞOARA, Faculty of Mechanical Engineering – TIMIŞOARA Regional Editors from HUNGARY Tamás HARTVÁNYI Széchenyi István University in GYŐR, Department of Logistics & Forwarding – GYŐR György KOVÁCS University of MISKOLC, Faculty of Mechanical Engineering and Information Science – MISKOLC Zsolt Csaba JOHANYÁK College of KECSKEMÉT, Faculty of Mechanical Engineering and Automation – KECSKEMÉT Péter TELEK University of MISKOLC, Faculty of Mechanical Engineering and Information Science – MISKOLC József SÁROSI University of SZEGED, Faculty of Engineering – SZEGED Gergely DEZSŐ College of NYÍREGYHÁZA, Engineering and Agriculture Faculty – NYÍREGYHÁZA Sándor BESZÉDES University of SZEGED, Faculty of Engineering – SZEGED Krisztián LAMÁR Óbuda University BUDAPEST, Kálmán Kandó Faculty of Electrical Engineering – BUDAPEST Péter FÖLDESI Széchenyi István University in GYŐR, Department of Logistics & Forwarding – GYŐR Regional Editors from CROATIA Gordana BARIC University of ZAGREB, Faculty of Mechanical Engineering and Naval Architecture – ZAGREB Goran DUKIC University of ZAGREB, Faculty of Mechanical Engineering and Naval Architecture – ZAGREB Regional Editor from BOSNIA & HERZEGOVINA Sabahudin JASAREVIC University of ZENICA, Faculty of Mechanical Engineering – ZENICA Šefket GOLETIĆ University of Zenica, Faculty of Mechanical Engineering - ZENICA Regional Editors from MALAYSIA Abdelnaser OMRAN School of Housing, Building and Planning, Universiti Sains Malaysia – PULAU PINANG Regional Editor from TUNISIA Mohamed Najeh LAKHOUA Institute of Applied Science and Technology of Mateur – MATEUR

ACTA TECHNICA CORVINIENSIS – Bulletin of Engineering
2013. Fascicule 2 [April–June] 8
Regional Editors from SERBIA Zoran ANIŠIC University of NOVI SAD, Faculty of Technical Sciences – NOVI SAD Milan RACKOV University of NOVI SAD, Faculty of Technical Sciences – NOVI SAD Maša BUKUROV University of NOVI SAD, Faculty of Technical Sciences – NOVI SAD Siniša BIKIC University of NOVI SAD, Faculty of Technical Sciences – NOVI SAD Slobodan TAŠIN University of NOVI SAD, Faculty of Technical Sciences – NOVI SAD Milan BANIC University of NIŠ, Mechanical Engineering Faculty – NIŠ Maja TURK-SEKULIC University of NOVI SAD, Faculty of Technical Sciences – NOVI SAD Ana LANGOVIC MILICEVIC Graduate School of Business Studies, Megatrend University – BELGRAD Igor FÜRSTNER SUBOTICA Tech, College of Applied Sciences – SUBOTICA Imre NEMEDI SUBOTICA Tech, College of Applied Sciences – SUBOTICA Eleonora DESNICA University of Novi Sad, Technical Faculty “M. Pupin” - Zrenjanin Regional Editors from BULGARIA Krasimir Ivanov TUJAROV "Angel Kanchev " University of ROUSSE, Faculty of Agricultural Mechanization – ROUSSE Vania GARBEVA Technical University SOFIA – branch PLOVDIV, Department of Control Systems – PLOVDIV Angel ZUMBILEV Technical University of SOFIA, Department of Material Science and Technology – PLOVDIV Regional Editors from SLOVAKIA Peter KOŠTÁL Slovak University of Technology – BRATISLAVA, Faculty Materials Science & Technology – TRNAVA Tibor KRENICKÝ Technical University of KOŠICE, Faculty of Manufacturing Technologies – PREŠOV Marian FLIMEL Technical University of KOŠICE, Faculty of Manufacturing Technologies – PREŠOV Jozef DOBRANSKY Technical University of KOŠICE, Faculty of Manufacturing Technologies – PREŠOV Beata HRICOVÁ Technical University of KOŠICE, Faculty of Mechanical Engineering – KOŠICE Ján KMEC Technical University of KOŠICE, Faculty of Mechanical Engineering – KOŠICE Pavol RAFAJDUS University of ŽILINA, Faculty of Electrical Engineering – ŽILINA Peter KRIŽAN Slovak University of Technology in BRATISLAVA, Faculty of Mechanical Engineering - BRATISLAVA Regional Editor from CYPRUS Louca CHARALAMBOS Americanos College – NICOSIA
The Editor and editorial board members do not receive any remuneration. These positions are voluntary. We are very pleased to inform that our journal ACTA TECHNICA CORVINIENSIS – BULLETIN of ENGINEERING is going to complete its five years of publication successfully. In a very short period it has acquired global presence and scholars from all over the world have taken it with great enthusiasm. We are extremely grateful and heartily acknowledge the kind of support and encouragement from you. ACTA TECHNICA CORVINIENSIS – BULLETIN of ENGINEERING is seeking qualified researchers as members of the editorial team. Like our other journals, ACTA TECHNICA CORVINIENSIS – BULLETIN of ENGINEERING will serve as a great resource for researchers and students across the globe. We ask you to support this initiative by joining our editorial team. If you are interested in serving as a member of the editorial team, kindly send us your resume to [email protected].
ACTA TECHNICA CORVINIENSIS – BULLETIN of ENGINEERING
ISSN: 2067-3809 [CD-Rom, online]
copyright © UNIVERSITY POLITEHNICA TIMISOARA, FACULTY OF ENGINEERING HUNEDOARA, 5, REVOLUTIEI, 331128, HUNEDOARA, ROMANIA
http://acta.fih.upt.ro

© copyright FACULTY of ENGINEERING ‐ HUNEDOARA, ROMANIA 9
Scientific Committee Members & Reviewers
Members from SLOVAKIA Štefan NIZNIK Technical University of KOŠICE, Faculty of Metallurgy, Department of Materials Science – KOŠICE Karol VELIŠEK Slovak University of Technology BRATISLAVA, Faculty Materials Science & Technology – TRNAVA Peter KOŠTÁL Slovak University of Technology – BRATISLAVA, Faculty Materials Science & Technology – TRNAVA Juraj ŠPALEK University of ZILINA, Faculty of Electrical Engineering – ZILINA Vladimir MODRAK Technical University of KOSICE, Faculty of Manufacturing Technologies – PRESOV Michal HAVRILA Technical University of KOSICE, Faculty of Manufacturing Technologies – PRESOV Jozef NOVAK-MARČINCIN Technical University of KOSICE, Faculty of Manufacturing Technologies – PRESOV Ľubomir ŠOOŠ Slovak University of Technology in BRATISLAVA, Faculty of Mechanical Engineering – BRATISLAVA Miroslav BADIDA Technical University of KOŠICE, Faculty of Mechanical Engineering – KOŠICE Ervin LUMNITZER Technical University of KOŠICE, Faculty of Mechanical Engineering – KOŠICE Tibor KVAČKAJ Technical University KOŠICE, Faculty of Metallurgy – KOŠICE Ľudovít KOLLÁTH Slovak University of Technology in BRATISLAVA, Manufacturing Systems Institute – BRATISLAVA Ladislav GULAN Slovak University of Technology, Institute of Transport Technology & Designing – BRATISLAVA Dušan HUSKA Slovak Agricultural University, Faculty of European studies & Regional Development – NITRA Miroslav VEREŠ Slovak University of Technology in BRATISLAVA, Faculty of Mechanical Engineering – BRATISLAVA Milan SAGA University of ŽILINA, Faculty of Mechanical Engineering – ŽILINA Imrich KISS Institute of Economic & Environmental Security, University of Security Management – KOŠICE Otakav BOKŮVKA University of ŽILINA, Faculty of Mechanical Engineering – ŽILINA Michal CEHLÁR Technical University KOSICE, Faculty of Mining, Ecology, Process Control & Geotechnologies – KOSICE Pavel NEČAS Armed Forces Academy of General Milan Rastislav Stefanik – LIPTOVSKÝ MIKULÁŠ Milan DADO University of ŽILINA, Faculty of Electrical Engineering – ŽILINA Jozef PILC University of ŽILINA, Faculty of Mechanical Engineering - ŽILINA Members from ITALY Alessandro GASPARETTO University of UDINE, Faculty of Engineering – UDINE Alessandro RUGGIERO University of SALERNO, Department of Mechanical Engineering – SALERNO Adolfo SENATORE University of SALERNO, Department of Mechanical Engineering – SALERNO

ACTA TECHNICA CORVINIENSIS – Bulletin of Engineering
2013. Fascicule 2 [April–June] 10
Members from HUNGARY Imre DEKÁNY University of SZEGED, Department of Colloid Chemistry – SZEGED Béla ILLÉS University of MISKOLC, Faculty of Mechanical Engineering and Information Science – MISKOLC Imre J. RUDAS Óbuda University of BUDAPEST, Department of Structural Engineering – BUDAPEST Tamás KISS University of SZEGED, Department of Inorganic and Analytical Chemistry – SZEGED Cecilia HODÚR University of SZEGED, College Faculty of Food Engineering – SZEGED Arpád FERENCZ College of KECSKEMÉT, Faculty of Horticulture, Department of Economics – KECSKEMÉT Imre TIMÁR University of Pannonia, Department of Silicate and Materials Engineering – VESZPRÉM Gyula MESTER University of SZEGED, Department of Informatics – SZEGED Ádám DÖBRÖCZÖNI University of MISKOLC, Faculty of Mechanical Engineering and Information Science – MISKOLC György SZEIDL University of MISKOLC, Faculty of Mechanical Engineering and Information Science – MISKOLC István PÁCZELT University of MISKOLC, Department of Mechanics – MISKOLC József GÁL University of SZEGED, Faculty of Engineering – SZEGED Lajos BORBÁS BUDAPEST University of Technology and Economics, Department of Vehicle Parts and Drives – BUDAPEST János NÉMETH University of MISKOLC, Faculty of Mechanical Engineering and Information Science – MISKOLC György KAPTAY University of MISKOLC, Faculty of Materials Science and Engineering – MISKOLC István J. JÓRI BUDAPEST University of Technology & Economics, Machine & Product Design – BUDAPEST Miklós TISZA University of MISKOLC, Department of Mechanical Engineering – MISKOLC István BIRÓ University of SZEGED, Faculty of Engineering – SZEGED Gyula VARGA University of MISKOLC, Faculty of Mechanical Engineering & Information Science – MISKOLC Márta NÓTÁRI College of KECSKEMÉT, Faculty of Horticulture, Department of Economics – KECSKEMÉT Members from MACEDONIA Valentina GECEVSKA University "St. Cyril and Methodius" SKOPJE, Faculty of Mechanical Engineering – SKOPJE Zoran PANDILOV University "St. Cyril and Methodius" SKOPJE, Faculty of Mechanical Engineering – SKOPJE Radmil POLENAKOVIK University "St. Cyril and Methodius" SKOPJE, Faculty of Mechanical Engineering – SKOPJE Aleksandra BUŽAROVSKA-POPOVA University "St. Cyril and Methodius" SKOPJE, Faculty of Technology and Metallurgy – SKOPJE Robert MINOVSKI University "St. Cyril and Methodius" SKOPJE, Faculty of Mechanical Engineering – SKOPJE Members from POLAND Leszek A. DOBRZANSKI Institute of Engineering Materials and Biomaterials, Silesian University of Technology – GLIWICE Stanisław LEGUTKO Institute of Mechanical Technology, Polytechnic University – POZNAN Andrzej WYCISLIK Silesian University of Technology - KATOWICE, Faculty Materials Science & Metallurgy– KATOWICE Władysław GĄSIOR Institute of Metallurgy and Materials Science, Polish Academy of Sciences – KRAKÓW Antoni ŚWIĆ LUBLIN University of Technology, Institute of Technological Systems of Information – LUBLIN Marian Marek JANCZAREK LUBLIN University of Technology, Institute of Technological Systems of Information – LUBLIN Michał WIECZOROWSKI Poznan University of Technology, Institute of Mechanical Technology – POZNAN Members from SPAIN Patricio FRANCO Universidad Politécnica of CARTAGENA, Ingeniería de Materiales y Fabricación – CARTAGENA Luis Norberto LOPEZ De LACALLE University of Basque Country, Faculty of Engineering – BILBAO Aitzol Lamikiz MENTXAKA University of Basque Country, Faculty of Engineering – BILBAO

ACTA TECHNICA CORVINIENSIS – Bulletin of Engineering
2013. Fascicule 2 [April–June] 11
Members from SERBIA Sinisa KUZMANOVIC University of NOVI SAD, Faculty of Technical Sciences – NOVI SAD Mirjana VOJINOVIĆ MILORADOV University of NOVI SAD, Faculty of Technical Sciences – NOVI SAD Vladimir KATIC University of NOVI SAD, Faculty of Technical Sciences – NOVI SAD Miroslav PLANČAK University of NOVI SAD, Faculty of Technical Sciences – NOVI SAD Milosav GEORGIJEVIC University of NOVI SAD, Faculty of Engineering – NOVI SAD Vojislav MILTENOVIC University of NIŠ, Mechanical Engineering Faculty – NIŠ Aleksandar RODIĆ Robotics Laboratory, “Mihajlo Pupin” Institute – BELGRADE Draginja PERIČIN University of NOVI SAD, Faculty of Technology, Department of Biochemistry – NOVI SAD Pavel KOVAC University of NOVI SAD, Faculty of Technical Science – NOVI SAD Milan PAVLOVIC University of NOVI SAD, Technical Faculty “Mihajlo Pupin” – ZRENJANIN Zoran ANIŠIC University of NOVI SAD, Faculty of Technical Sciences – NOVI SAD Damir KAKAS University of NOVI SAD, Faculty of Technical Sciences – NOVI SAD Jelena KIURSKI University of NOVI SAD, Faculty of Technical Sciences – NOVI SAD Erne KIŠ University of NOVI SAD, Faculty of Technology – NOVI SAD Ana LANGOVIC MILICEVIC Graduate School of Business Studies, Megatrend University – BELGRAD Zlatko LANGOVIC Graduate School of Business Studies, Megatrend University – BELGRAD Natasa CVETKOVIC Graduate School of Business Studies, Megatrend University – BELGRAD Radomir SLAVKOVIĆ Department of Mehatronics, University of KRAGUJEVAC, Technical Faculty – CACAK Zvonimir JUGOVIĆ Department of Mehatronics, University of KRAGUJEVAC, Technical Faculty – CACAK Milica GVOZDENOVIĆ University of BELGRADE, Faculty of Technology and Metallurgy – BELGRAD Branimir JUGOVIĆ Institute of Technical Science, Serbian Academy of Science and Arts – BELGRAD Miomir JOVANOVIC University of NIŠ, Faculty of Mechanical Engineering – NIŠ Vidosav MAJSTOROVIC University of BELGRADE, Mechanical Engineering Faculty – BELGRAD Dragan ŠEŠLIJA University of NOVI SAD, Faculty of Technical Science – NOVI SAD Duško LETIĆ University of NOVI SAD, Technical Faculty “Mihajlo Pupin” – ZRENJANIN Lidija MANČIĆ Institute of Technical Sciences of Serbian Academy of Sciences and Arts (SASA) - BELGRAD Members from BULGARIA Nikolay MIHAILOV Anghel Kanchev University of ROUSSE, Faculty of Electrical and Electronic Engineering – ROUSSE Krassimir GEORGIEV Institute of Mechanics, Bulgarian Academy of Sciences – SOFIA Hristo BELOEV Anghel Kanchev University of ROUSSE, Faculty of Electrical and Electronic Engineering – ROUSSE Velizara IVANOVA PENCHEVA Anghel Kanchev University, Faculty of Electrical and Electronic Engineering – ROUSSE Kliment Blagoev HADJOV University of Chemical Technology and Metallurgy, Department of Applied Mechanics – SOFIA Ognyan ALIPIEV University of ROUSSE, Department Theory of Mechanisms and Machines – ROUSSE Gencho POPOV Anghel Kanchev University of ROUSSE, Faculty of Agricultural Mechanization – ROUSSE Petar RUSSEV Anghel Kanchev University of ROUSSE, Faculty of Agricultural Mechanization – ROUSSE Ivan KOLEV Anghel Kanchev University of ROUSSE, Department of Machine Tools & Manufacturing – ROUSSE Ivanka ZHELEVA Anghel Kanchev University of ROUSSE, Department of Termotechnics & Manufacturing – ROUSSE

ACTA TECHNICA CORVINIENSIS – Bulletin of Engineering
2013. Fascicule 2 [April–June] 12
Members from ROMANIA Teodor HEPUŢ University Politehnica TIMIŞOARA, Faculty of Engineering – HUNEDOARA Stefan MAKSAY University Politehnica TIMIŞOARA, Faculty of Engineering – HUNEDOARA Francisc WEBER University Politehnica TIMIŞOARA, Faculty of Engineering – HUNEDOARA Carmen ALIC University Politehnica TIMIŞOARA, Faculty of Engineering – HUNEDOARA Ioan MĂRGINEAN University Politehnica BUCUREŞTI, Faculty of Materials Science and Engineering – BUCUREŞTI Iulian RIPOŞAN University Politehnica BUCUREŞTI, Faculty of Materials Science and Engineering – BUCUREŞTI Victor BUDĂU University Politehnica TIMIŞOARA, Faculty of Mechanical Engineering – TIMIŞOARA Mircea BEJAN Tehnical University of CLUJ-NAPOCA, Faculty of Mechanical Engineering – CLUJ-NAPOCA Ioan VIDA-SIMITI Technical University of CLUJ-NAPOCA, Faculty of Materials Science & Engineering – CLUJ-NAPOCA Caius PĂNOIU University Politehnica TIMIŞOARA, Faculty of Engineering – HUNEDOARA Vasile MIREA University Politehnica BUCUREŞTI, Faculty of Materials Science and Engineering – BUCUREŞTI Csaba GYENGE Technical University of CLUJ-NAPOCA, Machine Building Faculty – CLUJ-NAPOCA Adalbert KOVÁCS University Politehnica TIMIŞOARA, Department of Mathematics – TIMISOARA Manuela PĂNOIU University Politehnica TIMIŞOARA, Faculty of Engineering – HUNEDOARA Sorin DEACONU University Politehnica TIMIŞOARA, Faculty of Engineering – HUNEDOARA Tibor BEDŐ University Transilvania of BRAŞOV, Faculty of Material Science and Engineering – BRAŞOV Gallia BUTNARU Faculty of Horticulture, Banatul Agricultural Sciences & Veterinary Medicine University – TIMIŞOARA Laurenţiu POPPER University of ORADEA, Faculty of Energy Engineering – ORADEA Sava IANICI “Eftimie Murgu” University of REŞIŢA, Faculty of Engineering – REŞIŢA Ioan MILOŞAN Transilvania University of BRAŞOV, Faculty of Materials Science and Engineering – BRAŞOV Liviu MIHON University Politehnica TIMIŞOARA, Faculty of Mechanical Engineering – TIMIŞOARA Members from PORTUGAL João Paulo DAVIM University of AVEIRO, Department of Mechanical Engineering – AVEIRO Paulo BÁRTOLO Polytechnique Institute – LEIRIA, School of Technology and Management – LEIRIA Valdemar FERNANDES University of COIMBRA, Department of Mechanical Engineering – COIMBRA J. Norberto PIRES University of COIMBRA, Department of Mechanical Engineering – COIMBRA A. M. GONÇALVES-COELHO The New University of LISBON, Faculty of Science and Technology – CAPARICA Members from FRANCE Bernard GRUZZA Universite Blaise Pascal, Institut des Sciences de L'Ingenieur (CUST) – CLERMONT-FERRAND Abdelhamid BOUCHAIR Universite Blaise Pascal, Institut des Sciences de L'Ingenieur (CUST) – CLERMONT-FERRAND Khalil EL KHAMLICHI DRISSI Universite Blaise Pascal, Institut des Sciences de L'Ingenieur (CUST) – CLERMONT-FERRAND Mohamed GUEDDA Université de Picardie Jules Verne, Unité de Formation et de Recherche des Sciences – AMIENS Ahmed RACHID Université de Picardie Jules Verne, Unité de Formation et de Recherche des Sciences – AMIENS Yves DELMAS University of REIMS, Technological Institute of CHALONS-CHARLEVILLE – REIMS Member from FINLAND Antti Samuli KORHONEN HELSINKI University of Technology, Department of Materials Science & Engineering – HELSINKI Heikki MARTIKKA CEO Himtech Oy Engineering – JOUTSENO Pentti KARJALAINEN University of OULU, Department of Mechanical Engineering, Centre for Advanced Steels Research – OULU

ACTA TECHNICA CORVINIENSIS – Bulletin of Engineering
2013. Fascicule 2 [April–June] 13
Members from CROATIA Drazan KOZAK Josip Juraj Strossmayer University of OSIJEK, Mechanical Engineering Faculty – SLAVONKI BROD Milan KLJAJIN Josip Juraj Strossmayer University of OSIJEK, Mechanical Engineering Faculty – SLAVONKI BROD Predrag COSIC University of ZAGREB, Faculty of Mechanical Engineering and Naval Architecture – ZAGREB Miroslav CAR University of ZAGREB, Faculty of Mechanical Engineering and Naval Architecture – ZAGREB Gordana BARIC University of ZAGREB, Faculty of Mechanical Engineering and Naval Architecture – ZAGREB Antun STOIĆ Josip Juraj Strossmayer University of OSIJEK, Mechanical Engineering Faculty – SLAVONKI BROD Goran DUKIC University of ZAGREB, Faculty of Mechanical Engineering and Naval Architecture – ZAGREB Ivo ALFIREVIĆ University of ZAGREB, Faculty of Mechanical Engineering and Naval Architecture – ZAGREB Members from ARGENTINA Gregorio PERICHINSKY University of BUENOS AIRES, Faculty of Engineering – BUENOS AIRES Atilio GALLITELLI Institute of Technology, Centro de desarrollo en Gestión Tecnológica Y Operación – BUENOS AIRES Carlos F. MOSQUERA University of BUENOS AIRES, School of Engineering, Laser Laboratory – BUENOS AIRES Jorge Antonio SIKORA National University of MAR DEL PLATA, Engineering Department – MAR DEL PLATA Elizabeth Myriam Jimenez REY University of BUENOS AIRES, Faculty of Engineering, Department of Computer Science – BUENOS AIRES Arturo Carlos SERVETTO University of BUENOS AIRES, Faculty of Engineering, Department of Computer Science – BUENOS AIRES Members from INDIA Sugata SANYAL Tata Consultancy Services - MUMBAI Bijoy BANDYOPADHYAY University of CALCUTTA, Department of Radio Physics & Electronics – CALCUTTA Natesh KAPILAN Nagarjuna College of Engineering & Technology, Mechanical Engineering Department – DEVANAHALLI Siby ABRAHAM University of MUMBAI, Guru Nanak Khalsa College – MUMBAI Tirumala Seshadri SEKHAR Dr. Sammuel George Institute of Engineering & Technology – MARKAPURAM Nabendu CHAKI Department Computer Science & Engineering, University of Calcutta – KOLKATA Amit CHAUDHRY University Institute of Engineering and Technology, Panjab University – CHANDIGARH Anjan KUMAR KUNDU University of CALCUTTA, Institute of Radiophysics & Electronics – KOLKATA K. Ananth KRISHNAN Tata Consultancy Services - CHENNAI Members from CZECH REPUBLIC Vladimir ZEMAN Department of Mechanics, Faculty of Applied Sciences, University of West Bohemia – PILSEN Imrich LUKOVICS Department of Production Engineering, Faculty of Technology, Tomas Bata University – ZLÍN Jan VIMMR Department of Mechanics, Faculty of Applied Sciences, University of West Bohemia – PILSEN Ivo SCHINDLER Technical University of OSTRAVA, Faculty of Metallurgy and Materials Engineering – OSTRAVA Pavel DRABEK University of West Bohemia in PILSEN, Faculty of Electrical Engineering – PILSEN Jan KRET Technical University of OSTRAVA, Faculty of Metallurgy and Materials Engineering – OSTRAVA Miroslav PISKA University of Technology in BRNO, Faculty of Engineering Technology – BRNO Jan MÁDL Czech Technical University in PRAGUE, Faculty of Mechanical Engineering – PRAHA Members from CUBA Norge I. COELLO MACHADO Universidad Central “Marta Abreu” LAS VILLAS, Faculty of Mechanical Engineering – SANTA CLARA José Roberto Marty DELGADO Universidad Central “Marta Abreu” LAS VILLAS, Faculty of Mechanical Engineering – SANTA CLARA Member from USA David HUI University of NEW ORLEANS, Department of Mechanical Engineering – NEW ORLEANS

ACTA TECHNICA CORVINIENSIS – Bulletin of Engineering
2013. Fascicule 2 [April–June] 14
Members from BOSNIA & HERZEGOVINA Tihomir LATINOVIC University in BANJA LUKA, Faculty of Mechanical Engineering – BANJA LUKA Safet BRDAREVIĆ University of ZENICA, Faculty of Mechanical Engineering – ZENICA Sabahudin JASAREVIC University of ZENICA, Faculty of Mechanical Engineering – ZENICA Ranko ANTUNOVIC University of EAST SARAJEVO, Faculty of Mechanical Engineering - East SARAJEVO Šefket GOLETIĆ University of ZENICA, Faculty of Mechanical Engineering - ZENICA Members from BRAZIL Alexandro Mendes ABRÃO Universidade Federal de MINAS GERAIS, Escola de Engenharia – BELO HORIZONTE Márcio Bacci da SILVA Universidade Federal de UBERLÂNDIA, Engenharia Mecânica – UBERLÂNDIA Sergio Tonini BUTTON Universidade Estadual de CAMPINAS, Faculdade de Engenharia Mecânica – CAMPINAS Leonardo Roberto da SILVA Centro Federal de Educação Tecnológica de MINAS GERAIS (CEFET) – BELO HORIZONTE Juan Campos RUBIO Metal Cutting & Automation Laboratory, Universidade Federal de MINAS GERAIS – BELO HORIZONTE Members from MOROCCO Saad BAKKALI Abdelmalek Essaâdi University, Faculty of Sciences and Techniques – TANGIER Mahacine AMRANI Abdelmalek Essaâdi University, Faculty of Sciences and Techniques – TANGIER Members from GREECE Nicolaos VAXEVANIDIS University of THESSALY, Department of Mechanical & Industrial Engineering – VOLOS Vassilis MOUSTAKIS Technical University of Crete – CHANIA Members from ISRAEL Abraham TAL University TEL-AVIV, Space and Remote Sensing Division ICTAF – TEL-AVIV Amnon EINAV University TEL-AVIV, Space and Remote Sensing Division ICTAF – TEL-AVIV Members from UKRAINE Sergiy G. DZHURA DONETSK National Technical University – DONETSK Alexander N. MIKHAILOV Department Technology of Mechanical Engineering, DONETSK National Technical University - DONETSK Members from SLOVENIA Janez GRUM University of LJUBLJANA, Faculty of Mechanical Engineering – LJUBLJANA Štefan BOJNEC University of Primorska, Faculty of Management - KOPER Members from AUSTRIA Branko KATALINIC VIENNA University of Technology, Institute of Production Engineering – VIENNA Viktorio MALISA Technikum WIEN, University of Applied Sciences – VIENNA Members from GERMANY Erich HAHNE University of STUTTGART, Institute of Thermodynamics and Heat Transfer – STUTTGART Keil REINER Technical University DRESDEN, Faculty Transportation & Traffic Sciences Friedrich List – DRESDEN Member from SWEEDEN Ingvar L. SVENSSON JÖNKÖPING University, School of Engineering Mechanical Engineering – JÖNKÖPING Member from TURKEY Ali Naci CELIK Abant Izzet Baysal University, Faculty of Engineering and Architecture - BOLU Member from IRAQ Ala’a DARWISH University of Technology – BAGHDAD Member from IRAN Habibola LATIFIZADEH SHIRAZ University of Technology, Faculty of Basic Science – SHIRAN
The Scientific Committee members and Reviewers do not receive any remuneration. These positions are voluntary. We are extremely grateful and heartily acknowledge the kind of support and encouragement from all contributors and all collaborators!

© copyright FACULTY of ENGINEERING ‐ HUNEDOARA, ROMANIA 15
CONTENT of FASCICULE 2 / 2013
[APRIL–JUNE]
1. Juraj HUDÁK, Miroslav TOMÁŠ – SLOVAKIA CREATION FORGING DIES’ FUNCTIONAL SURFACE USING PRESENT CAD/CAM SYSTEM
21
Abstract: Differences in shape of parts produced by forming in a large extent follow from used shape of incoming raw product. Contribution deals with methods for creating functional surfaces of forming dies using CAD systems and focuses to bulk forming processes – die forging. The source for functional surfaces design of forging die is solid model of forged piece with defined mould joint, chamfers and radii. Next are presented two methods of forging dies creating according to CAD systems possibilities – mould cavity mode and assembly mode (Merge-Cut Out command). Both method are presented step by step and there are compared their advantages from the user’s view. 2. M. RAMU, Raja V. PRABHU – INDIA
METAMODEL BASED ANALYSIS AND ITS APPLICATIONS: A REVIEW 25
Abstract: Engineering analysis using computer based simulation is used extensively to predict the performance of a system. Such engineering analyses rely on running expensive and complex computer codes. Approximation methods are widely used to reduce the computational burden of engineering analysis. Statistical techniques such as design of experiments and Response Surface Methodology (RSM) are widely used to construct approximate models of these costly analysis codes which minimize the computational expense of running computer analyze. These models referred as metamodels, are then used in place of the actual analysis codes to reduce the computational burden of engineering analyses. Use of metamodels in the design and analysis of computer experiments has progressed remarkably in the past three decades. This paper reviews the state of the art of constructing metamodels and its evolutions over the past three decades. 3. Traian MAZILU – ROMANIA
USING THE GREEN’S FUNCTION METHOD TO ANALYSE THE RESPONSE OF AN INFINITE WIRE ON VISCO-ELASTIC SUPPORT UNDER MOVING LOAD
35 Abstract: The paper herein deals with the response of an infinite wire on viscoelastic support under moving harmonic load in order to point out the basic features of the overhead contact wire system (catenary). To this end, the Green’s function method is applied. The wire response under a stationary harmonic load is similar to the one of the system with a single degree of freedom, excepting the phase resonance. When the harmonic load moves at sub-critical velocities, the resonance frequency decreases and the wire response becomes higher. At the over-critical velocities, the elastic waves do not propagate in front of the harmonic load. 4. Abdelmajid Sadiki LAMARI, Anass El FATTOUH, Salah Eddine El QOUATLI,
Rachida NAJIH, Abdelilah CHTAINI – MAROCCO ELECTROCHEMICAL DETECTION OF ASCORBIC ACID USING A POLYMER MODIFIED CARBON PASTE ELECTRODE
39
Abstract: Ascorbic acid (Vitamin C) is a water soluble organic compound that participates in many biological processes. This paper reports the synthesis of polymer modified carbon paste electrode and its application for the electrochemical detection of ascorbic acid (AA). The cyclic voltammetry results obtained corrobate with square wave voltammetry. The influence of variables such the concentration of ascorbic acid adsorbed onto polymer, and the pH of solution were tested. The capacity of prepared electrode (P-CPE) for selective detection of AA was confirmed in a sufficient amount of ascorbic acid. The observed linear range for the determination of AA concentration was from 0.2 mM to 9 mM. The detection limit was estimated to be 5. 48 mM. 5. Miroslav GOMBÁR - SLOVAKIA
INSTALATION OF HIGH PRESSURE WATER PUMP FOR A WATER JET TECHNOLOGY – HIGH PRESSURE WATER PUMP IN NON-CONVENTIONAL TECHNOLOGIES
43
Abstract: The technology water jet is complex hydrodynamic process at ultrahigh pressures, which can be characterized at present days as the area of jet technologies. The process alone requires the most effective and economical utilisation of energy of water jet. It directly is connected with the most convenient determination of production – technology parameters of jet fluid, according to respect of basic physical properties of fluid as a cutting medium and the respect of hydrodynamic rule.

ACTA TECHNICA CORVINIENSIS – Bulletin of Engineering
2013. Fascicule 2 [April–June] 16
6. J.R. MARTY-DELGADO, Y. BERNAL-AGUILAR, M. RAMOS-DÍAZ - CUBA CONTROL OF CYLINDRICAL DEEP DRAWING USING GENETIC ALGORITHM
47
Abstract: The main purpose of this work is to develop an intellectualized control technique on the deep drawing of cylindrical cup made of 3003 ASTM aluminum using genetic algorithm. These control methods are employed in order to investigate the most significant parameters in sheet metal forming process such as drawing force, with a view of optimizing these parameters. The genetic algorithm is used for the optimization purpose to minimize the force of the deep drawing process. The results show that these combinations of control system can cover a wide range of both materials and influential forming parameters automatically. The results further confirm that the developed system is effective and valid alternative for quick responsible control system with high flexibility. 7. M. B. I. REAZ – MALAYSIA
ARTIFICIAL INTELLIGENCE TECHNIQUES FOR ADVANCED SMART HOME IMPLEMENTATION 51
Abstract: Smart-home concept has been around for many years and played a very important part in the design and implementation of future houses. Early research focus on the control of home appliances but current trends are moving into a creation of self-thinking home. In the recent years many research projects were performed utilizing artificial intelligence tools and techniques. This article highlights research projects employing multi-agent system, action prediction, artificial neural network, fuzzy logic and reinforcement learning. It is found that the combination of tools and techniques are crucial for successful implementation. This article provides platform for future relative studies between different algorithms, architectures and serves as a reference point for developing more cutting edge smart home technologies. 8. Katarína TEPLICKÁ, Jaroslava KÁDÁROVÁ - SLOVAKIA
COMPARISON OF CALCULATION METHODS IN THE FORMATION OF PRODUCT PRICING 59
Abstract: Creation of calculated price of products in small production firms is very different. Today is custom manufacturing very extended and therefore is creation of calculated price important. In praxis we will use some methods of calculation. Very often are used traditional methods by percentage but in small firms doing not use these methods correctly. Small manufacturers do not create calculated price on the ground of using modern instruments for creation of price and calculated price does not include all costs for custom manufacturing. In this article we point out that the creation of price is very important for small manufacturers because the price of product affects their business. Calculated price that it does not include all costs of product, it can reduce profit or it can bring insolvency in the firm. We can create the calculated price of competitive price, of customer price, of actual costs of order. We solved problem of calculated price of product in custom manufacturing of furniture because this firm has a big problem with liquidity and it can not to pay its debts. We will evaluate calculated price in custom manufacturing of furniture and we will evaluate influence of this calculated price on product and impact on expenses and profit. 9. Maria Mikela CHATZIMICHAILIDOU, Stefanos KATSAVOUNIS,
Chris CHATZOPOULOS - GREECE Dusko LUKAC – GERMANY MASS CUSTOMIZATION AS A PROJECT PORTFOLIO FOR PROJECT – ORIENTED ORGANIZATIONS
63 Abstract: The idea of combining Mass Customization to the Project Management area stems from their common characteristic of uniqueness. Project Management aims to meet the organization objectives by manipulating production phases and limited resources. Being a temporary endeavour, with a defined beginning and end, it undertakes to meet unique goals and objectives, to bring about beneficial change or added value. On the other hand, Mass Customization serves the newly emerged requirements of customized and personalized products. To this extent, we are going to consider and examine Mass Customization as a strategic goal of a Project-oriented Organization, which runs collateral projects, in order to achieve its final purposes. For such a kind of organization, different customized products are considered as multiple projects of a portfolio. Together with the limited resources, an integrated environment is composed where priorities and hierarchical rules produce alternative configurations, which coexist. The paper proposes a dynamic framework, to assist decision makers in project coordination processes with realistic parameters. 10. Saša RANĐELOVIĆ, Dragan MIŠIĆ, Miroslav TRAJANOVIĆ,
Nikola VITKOVIĆ, Marko VESELINOVIĆ – SERBIA CUSTOMIZATION OF ORTHOPEDIC INTERNAL FIXATOR
71
Abstract: Customization and adjustment of medical devices and elements for external and internal fixation is a major challenge in modern orthopedic surgery. As a result a large number of minor and serious illnesses and injuries, congenital disorders, or more often emerging with a large number of anatomical requirements, impose the various technical requirements to be met with one, two or more orthopedic element. Modern lifestyle and pace of today's man activities carries great dangers and risks. At a given moment and inception health condition, expert team will usually need to react very fast, high quality and tested to achieve the desired effect. Since this is a human health or the disruption and damage to his bones and joint system, orthopedic devices and components shall as far as possible be adapted to meet the technical requirements and standards set. 11. Grzegorz BUDZIK, Jacek BERNACZEK, Bogdan KOZIK, Mariusz SOBOLAK,
Tomasz DZIUBEK, Bartłomiej SOBOLEWSKI, Mirosław GRZELKA – POLAND DESIGN DEVELOPMENT, PROTOTYPE MANUFACTURING USING FDM TECHNIQUES AND ACCURACY ANALYSIS OF AERONAUTICAL DUAL-POWER PATH GEAR UNIT
75 Abstract: The paper presents a complex process calculations and design development, FDM model manufacturing and accuracy analysis of a demonstrative prototype of a dual-power path gear unit to be applied in aeronautical systems of drive transmission. The process of making a demonstrator of a dual-power path gear unit by means of 3D-CAD modeling and Rapid Prototyping has been described here. The first stage of the designing process of a gear unit is always defining basic parameters of gear work (among others; power, rotational speed, transmission ratio) depending on the unit’s predestination. On the basis of the above, the calculation of main constructional parameters is carried out. Subsequently, it is possible to make 3D-CAD models of toothed wheels and the remaining parts of the gear unit. In case of designing demonstrative prototypes, it is important to take into consideration the assumptions of modeling similarity

ACTA TECHNICA CORVINIENSIS – Bulletin of Engineering
2013. Fascicule 2 [April–June] 17
to a real gear unit. 3D-CAD systems are often equipped with modules for analyzing geometrical parameters and cooperation of individual parts of the unit for example the area of contact. A detailed analysis of cooperation of gear parts of the unit allows for detecting models’ faults early and for deleting them. After making 3D-CAD models one can approach to creating a prototype by means of Rapid Prototyping methods. It is necessary to prepare the numerical data essential as a subsequent stage of the process of making the demonstrator. On that basis the individual parts of the gear unit are made in an incremental process. The accuracy of creating a physical prototype depends mainly on the accuracy of a 3D-CAD/3D-RP model prepared in a process of processing numerical data. A demonstrator described in the paper has been made by means of FDM method. The prototype allowed for analyzing constructional solutions of gear units on a physical model and for preparing assumptions for introductory stand tests. In case of measurement of gear wheels using modern technologies based on numerical machines, measurement process is based on processing of numerical data obtained by measurement using coordinate measuring machines. In this paper is present the opportunity to automate the measurement process of gears, using coordinated optical CMM Baty Venture machine. 12. A.G. VIJAYA KUMAR, Y. RAJASEKHARA GOUD, S.V.K. VARMA, K. RAGHUNATH – INDIA
THERMAL DIFFUSION AND RADIATION EFFECTS ON UNSTEADY MHD FLOW THROUGH POROUS MEDIUM WITH VARIABLE TEMPERATURE AND MASS DIFFUSION IN THE PRESENCE OF HEAT SOURCE/SINK
79 Abstract: The objective of the present study is to investigate thermal diffusion and radiation effects on unsteady MHD flow past an impulsively started infinite vertical plate with variable temperature and mass diffusion in the presence of heat source or sink through porous medium. The fluid considered here is a gray, absorbing/ emitting radiation but a non-scattering medium. At time t>0, the plate is given an impulsive motion with a velocity u=u0 in the vertical upward direction against to the gravitational field. And at the same time, the plate temperature and concentration levels near the plate raised linearly with time t. The dimensionless governing equations involved in the present analysis are solved using the Laplace transform technique. The velocity, temperature, concentration, Skin-friction, the rate or heat transfer and the rate of mass transfer are studied through graphs and tables in terms of different physical parameters entering into the problem. 13. Luba BICEJOVA, Martina NOVAKOVA, Juliana LITECKA - SLOVAKIA
MODIFICATIONS OF THE WATER JET SPLITTING 87
Abstract: Water jet cutting technology represents a high-performance cutting and shape dividing of all materials. The factors that influence the properties of machined surface can be summarized as factors of liquid hydrodynamic properties, technical factors influencing hydro-erosive process and technological factors influencing hydro-erosive surface of the cutting. Technology of the water jet cutting present progressive approach with unique possibilities that enables shape cutting and dividing of various hard-to-process materials without producing the heat-affected zone of cutting edge within the workpiece. The paper is focused on practical aspects of the AWJ technology setup alternatives; particularly on those which are connected with splitting of the high pressure jet. 14. Fazdliel Aswad IBRAHIM, Mohd Wira Mohd SHAFIEI,
Abdelnaser OMRAN, Ilias SAID – MALAYSIA RATING SYSTEMS IN HOUSING DESIGN AND DEVELOPMENT
91 Abstract: Green or sustainable design approach in all industries and sectors has become a demand of the global world. The negative impacts of the industries such climate change; global warming, ozone depletion and inefficient resource consumption have received a great concern and awareness among the public, politicians and academicians. Thus, a lot of efforts have been implemented either in terms of theories or practices in order to reduce the negative impacts of the industries. In the building sector, the sustainable building rating systems (SBRS) and certification systems has been designed and adopted in the building sector which intended to foster more sustainable building design, construction and operations by promoting and making possible a better integration of environmental concerns with cost and other traditional decision criteria. However, most of the internationally devised rating systems and certification system have been tailored to suit the building sector of the country where they were developed. Despite the different rating system adopted for the building sector in different country, these rating systems shared the common elements. Therefore, the aim of this paper is to explore the elements used in SBRS and the classification of certification system. This paper will start with the historic of sustainable development and green design, subsequently followed with the discussion on the SBRS adopted which focused only for Asian region and lastly, discussion on the unique elements of SBRS. 15. Ala’a M. DARWISH, Wameedh G. ABDUL-HUSSEIN, Zeena T. JALEEL – IRAQ
ELIMINATING HALF OF THE CONSTRUCTIONAL DEFLECTIONS OF SIMPLY SUPPORTED STEEL BRIDGES BY USING TEMPORARY CONTINUITY
97
Abstract: When it is required to cast a bridge over a valley, a river or a busy highway, it is difficult to use the required shoring for the concrete casting molds. In such cases, the heavy weight of fresh concrete will be directly subjected to the bridge girders. This situation will apply severe stresses to the bare supporting - normally long span - girders, leading to an un-favorite and uncorrectable permanent deflection. In this research, a simple test was done to simulate the mentioned critical case. It was found that; by constructing temporary joints for both ends of the steel girders of a simply supported bridge panel with its adjacent panels will apply reversal moments to the original panel. By reducing mid span moments due to the weight of fresh concrete of the deck slab during construction, a noticeable reduction–up to Fifty percent–of the expected mid span constructional deflection can be eliminated. 16. Fathollah OMMI, Ehsan MOVAHEDNEJAD, Kouros NEKOFAR - IRAN
COMPARING PERFORMANCE CHARACTERISTICS OF A GASOLINE AND CNG ENGINES AND INCREASING VOLUME EFFICIENCY AND POWER USING DESIGNED TURBOCHARGER
101 Abstract: In recent years, the utilization of cleaner alternative fuels such as natural gas, methanol reformed gas (MRG), and hydrogen, is much more common, as a solution for environmental problems including global warming effect and for the shortage of crude oil reserve in the world. Power reduction is one of the important problems of converting gasoline engine to CNG and using the turbocharger can be a solution for increasing the engine power. In this paper, a model of a 4–cylinder multi-point fuel injection engine was prepared using a one dimensional fluid dynamics code for

ACTA TECHNICA CORVINIENSIS – Bulletin of Engineering
2013. Fascicule 2 [April–June] 18
both gasoline fuel and CNG. The accuracy of the model was verified using experimental results of the engine testing showing good agreement between the model and the real engine. As a result, predictions are obtained that provide a detailed picture of engine performance condition with different fuel. In addition, two different turbochargers has been added to intake system and the engine performance characteristics like efficiency, net power and fuel consumption compared to CNG and gasoline engines without turbocharger. As a result, according to engine results and compressor characteristics a turbocharger was select for the based CNG engine. 17. István BÍRÓ – HUNGARY
SIMPLE NUMERICAL METHOD FOR 2-DOF PLANAR KINETICAL PROBLEMS 109
Abstract: The motion analysis is an important field in the education of mechanical engineers. Kinematical and kinetical analysis of rigid bodies linked to each other by different constraints (mechanical systems) leads to integration of second order differential equations. In this way the kinematical functions of parts of mechanical systems can be determined. The degrees of freedom of the mechanical system increase as a result of the application of elastic parts in it. Numerical methods can be applied to solve such problems. A simple numerical method will be demonstrated by author by the aid of several examples. Some parts of results obtained by using the numerical method were checked by analytical way. The published method can be used in the technical higher education 18. Jan KMEC - SLOVAKIA
SAFE WORKING CONDITIONS FOR THE WATER JET TECHNOLOGY 113
Abstract: Water-jet cutting technology provides new possibility to shape cutting and various material cold cutting without heat influence of material on cutting edge. However, the power of the water jet overcomes expectation of a people that are not familiar with the technology. Work safety with water-jet in various production technologies must make provision for not only safety work with water-jet technology, but also safety work with all devices, which are on that workplace situated and also material manipulation. So, the paper is focused on some of the safety aspects at the water-jet workplaces. 19. G. ADEDOKUN, J.A. OLADOSU, T. K. AJIBOYE – NIGERIA
SMALL HYDRO POWER POTENTIAL CAPACITY ESTIMATION FOR PROVISION OF RURAL ELECTRICITY IN NIGERIA
117
Abstract: Nigeria’s electricity demand increases due to growth in industrialization and socioeconomic weight. Regrettably, power industry of the country has not been able to satisfy the need of their customers. Therefore, if the country is to meet its energy demand alternative sources of power generation are very essential. Opportunities abound in hydropower scheme development as a viable energy source of electricity which will curtail and minimize greenhouse gases and emissions into environment. Meanwhile, there are small rivers all over the country with potential sites suitable for small hydropower scheme, development of which will ensure the supply of electricity to remote communities. This can be used as a substitute for commercial fuels, which effect reduce cost of fuelling and raise the earning potential of the rural communities. 20. Cristina HORA, Simona DZIŢAC, Călin SECUI, Gabriel BENDEA – ROMANIA
RELIABILITY ANALYSIS OF SPHERICAL VALVE (VS) FROM HPP REMEŢI USING MONTE CARLO SIMULATION
121 Abstract: In every hydro energetic arrangement, the water approaches, in differently construction elements and trough them, are equipped with valves. These valves assure the normal functioning of equipments, respectively there operatively insulation in case of failures or repairs. Also, the reliability level of hydro mechanical equipments can have a major impact on the operational reliability of HPP (Hydro Power Plants). In consequence, there are justified the concerns regarding the predictive reliability of them. In this paper, these studies of hydro-mechanical equipments reliability are made using the Monte Carlo simulation. 21. József CSANÁDI, Cecilia HODÚR, József FENYVESSY – HUNGARY
THE PROBLEM OF THE DETERMINATION OF WATER AND COW MILK ADULTERATING GOAT MILK
125
Abstract: The demonstrability of the adulteration of goat milk with added water and cow milk was investigated by measurement of the freezing point of the milk. Milk samples collected from a Saanen goat flock were mixed with water in the ranges 0-90% and 1-10% and with cow milk in the ranges 0-90%. The freezing points of the samples were determined by a standard cryoscopic method. Our results suggested that the freezing point prescribed as a reference value by the Codex Alimentarius Hungaricus and the EU directives for fresh and unadulterated goat milk (-0.52 °C) is too liberal, and this opens the door for the adulteration of goat milk. Only extraneous water in excess of 6% could be detected reliably in goat milk and therefore the measured freezing points at lower extraneous water contents appear falsely as good results. Accordingly, revision of the reference freezing point value of goat milk seems reasonable. Similarly, demonstrated that the adulteration of goat milk with cow milk can not be proved by measurement of the freezing point unless the goat milk contains cow milk in excess of 50%. 22. Mohammed Ali I. AL-HASHIMI, Manar M. AL-SAFAR – IRAQ
REMOVAL OF CADMIUM FROM SYNTHETIC WATER BY USING AGRICULTURAL WASTES 131
Abstract: Heavy metals are among the most toxic contaminants of surface water. The main sources of toxic metals are industrial wastes from processes such as electroplating, metal finishing, chemical manufacturing, and nuclear fuel processing. Since most of heavy metals are non degradable into nontoxic metals end products, these concentration must be reduced to acceptable levels before discharged them into environment. The goal of this research Examine the ability of different media to reduce the concentration of cadmium ions in aqueous solution. The application of low-cost adsorbents obtained from plant wastes as a replacement for costly conventional methods of removing cadmium ions from waste water has been reviewed. Langmuir and Freundlich adsorption isotherms were applicable to the absorption process and their constants were evaluated. The single component adsorption of heavy metal ions named Cadmium (II) onto powdered activated carbon (PAC), karab, rice husks and corncobs from water aqueous solution has been investigated in batch. The multiple correlations simulated the experimental data of the batch tests, and regression equations were found for (PAC), karab, rice husks and corncobs with correlation coefficient for each media: 0.984,

ACTA TECHNICA CORVINIENSIS – Bulletin of Engineering
2013. Fascicule 2 [April–June] 19
0.946, 0.951, 0.932, respectively. In batch tests the effects of pH of solution, dosage adsorbent, contact time, initial concentration, mixing (stirring) speed and particle size diameter were studied. The optimum values of pH of solution was 5.5, for dosage adsorbent was 1g sorbent/100ml of Cd(II), for contact time was 30min, for initial concentration was 125 mg/L and for mixing (stirring) speed was 100 rpm. In continuous fixed bed tests, the effects of flow rate, and bed height of Cd (II) uptake onto rice husks studied. Different flow rates were used (1,3,5,7) L/hr. Different bed height (10, 20 and 30) cm was used. The removal of Cd (II) increased as the bed height increased and decreased as the flow increased. 23. H. LAIB, H. KOURA, A. CHAGHI - ALGERIA
AN ADVANCED CONTROL APPROACH FOR MODULAR ACTIVE POWER FILTERING 139
Abstract: In this paper, a new modular active power filtering approach is proposed to eliminate harmonic currents and compensate reactive power. The method for identifying reference currents is based on FMVs “multi-variable filter”. This method uses two (FMVs) having the advantage of extracting harmonic directly from the αβ axis, the first FMV (FMV Current) extracts the fundamental and individual harmonic component of the distorted line current signal and injects equal-but- opposite of each harmonic current into the line using a voltage source inverter VSI dedicated to that specific harmonic and the second FMV (FMV Voltage) estimates the fundamental component of the line voltage. Moreover the dc-side voltage is controlled by a fuzzy logic controller. The new approach has been illustrated in order to find the best way to reduce network harmonic currents and reactive power compensating of the connected load. All of the studies have been carried out through detail digital dynamic simulation using the MATLAB/Simulink Power System Toolbox. 24. Naqib DANESHJO, Baryalai TAHZIB, Cristian STRATYINSKI, Andreas KOHLA – SLOVAKIA
METHODS FOR SECURING OF RELIABILITY IN REPRODUCTION PROCESS 145
Abstract: Reproduction process of the products creates three main stages introduced be-low. If we should take into consideration also safety then all reproduction process should be finished through safe ecological liquidation of the product that has be-come a waste. From this point of view it is very important to realize that every product before or late will become the waste. 25. Szilárd SZÉLPÁL, Marietta ÁBEL – HUNGARY
Oriane POSER – FRANCE ENZYME RECOVERY BY MEMBRANE SEPARATION METHOD FROM WASTE PRODUCTS OF THE FOOD INDUSTRY
149
Abstract: Recycling waste products of food industry become more and more important: one side because of the environmental matter the other side because of the economic reasons. The most preferred basic material for second generation bio-fuels is the waste products, food industrial waste products such as sugar chip, straw or bagasse. The cost of the process depends on the cost of the hydrolysis of cellulose/lignocelluloses i.e. the cost of the enzymes. These enzymes are very expensive that’s why it’s so important to find a good enzyme recovery method. In our research programme the membrane separation was used for enzyme recovery. Different ultra-filtration membranes such as a polyether-sulfone membrane with a cut-off value of 5 kDa, (PES5) and thin-film membrane with a cut-off value of 4 kDa (TF4) was used for separation the hydrolyzatethe aim of our work was to determine the optimal conditions for the enzymes separation, the value of the fluxes and the resistances values and the investigate the effect of the ultrasound on the membrane separation. We found that the fluxes are enhanced and the fouling resistance is decreased due to the ultrasound application and we also found that the gel layer resistance is increased during the processing. SCIENTIFIC EVENTS IN 2013 155
* THE 7th INTERNATIONAL WORKING CONFERENCE TOTAL QUALITY MANAGEMENT − ADVANCED AND INTELLIGENT APPROACHES − TQM 2013 with 3rd SPECIAL CONFERENCE “MANUFUTURE IN SERBIA 2013” 4 − 7 June, 2013, Belgrade, SERBIA
* THE 5th INTERNATIONAL CONFERENCE ON GEARS WITH EXHIBITION − GEARS 2013 7 − 9 October, 2013 Technical University of Munich (TUM), Garching (near Munich), GERMANY
* THE 11th INTERNATIONAL CONFERENCE ON ACCOMPLISHMENTS IN ELECTRICAL AND MECHANICAL ENGINEERING − DEMI 2013 University of Banja Luka, Faculty of Mechanical Engineering 26 − 28 May 2013, Banja Luka, BOSNIA & HERZEGOVINA
* THE 6th INTERNATIONAL CONFERENCE FOR ENTREPRENEURSHIP, INNOVATION AND REGIONAL DEVELOPMENT − ICEIRD 2013 Program Theme: Regional Economic Resilience through Innovation and Enterprise 20 − 21 June, 2013, Istanbul, TURKEY
* THE 8th RESEARCH/EXPERT CONFERENCE WITH INTERNATIONAL PARTICIPATION − QUALITY 2013, 6 − 8 June, 2013, Neum, BOSNIA & HERZEGOVINA
* THE 7th INTERNATIONAL SCIENTIFIC-PROFESSIONAL CONFERENCE − SB 2013 Program Theme: Contemporary Production Processes, Equipment and Materials for Welded Constructions and Products 23 − 25 October, 2013, Slavonski Brod, CROATIA
* THE 13th INTERNATIONAL MULTIDISCIPLINARY SCIENTIFIC GEOCONFERENCE & EXPO − SGEM 2013 − SURVEYING − GEOLOGY & MINING − ECOLOGY − MANAGEMENT Program Theme: Modern Management of Mine Producing, Geology and Environmental Protection 16 − 22 June, 2013, Albena Resort, BULGARIA
* THE 7th INTERNATIONAL CONFERENCE ON PHYSICAL AND NUMERICAL SIMULATION OF MATERIALS PROCESSING − ICPNS ’13 16 − 19 June, 2013, Oulu, FINLAND

ACTA TECHNICA CORVINIENSIS – Bulletin of Engineering
2013. Fascicule 2 [April–June] 20
* THE 3rd INTERNATIONAL CONFERENCE ON ENVIRONMENT AND INDUSTRIAL INNOVATION − ICEII 2013 19 − 20 May, 2013, Copenhagen, DENMARK
* THE 2nd INTERNATIONAL CONFERENCE “MECHANICAL ENGINEERING IN THE XXI CENTURY” Mechanical Engineering Faculty of the University of Niš 20 − 21 June, 2013, Niš, SERBIA
* FEDERATED CONFERENCE ON COMPUTER SCIENCE AND INFORMATION SYSTEMS − FedCSIS 2013 8 − 11 September, 2013, Kraków, POLAND
* INTERNATIONAL CONFERENCE ON ENERGY EFFICIENCY AND AGRICULTURAL ENGINEERING 17 – 18 May, 2013, Ruse, BULGARIA
* EDUCATION, RESEARCH, INNOVATION − ERIN 2013 15 - 17 May 2013, Častá –Papiernička, SLOVAKIA
* INTERNATIONAL CONFERENCE ON MATHEMATICAL MODELING IN PHYSICAL SCIENCES - IC-MSQUARE 2013 1- 5 September, 2013, Prague, CZECH REPUBLIC
* 14th INTERNATIONAL WORKSHOP ON RESEARCH AND EDUCATION IN MECHATRONICS - REM 2013 6 - 7 June, 2013, Vienna, AUSTRIA
* IV. CENTRAL EUROPEAN CONFERENCE ON LOGISTICS – CECOL 2013 5 – 7 November, 2013, Magdeburg, GERMANY
GENERAL GUIDELINES FOR PREPARING THE MANUSCRIPTS 161 INDEXES & DATABASES 163
ACTA TECHNICA CORVINIENSIS – Bulletin of Engineering, Fascicule 2/2013 [April-June/2013] includes scientific papers presented in the sections of Conference on: � THE INTERNATIONAL CONFERENCE MANAGEMENT OF TECHNOLOGY – STEP TO SUSTAINABLE PRODUCTION –
MOTSP 2012, organized in Zadar, CROATIA (14 – 16 June 2012), hosted by the Faculty of Mechanical Engineering and Naval Architecture and Faculty of Graphical Arts both from the University of Zagreb, CROATIA, Faculty of Management, University of Primorska, Koper and Faculty of Mechanical Engineering, University of Maribor, SLOVENIA, Faculty of Mechanical Engineering, Ss. Cyril and Methodius University, Skopje, MACEDONIA, and Politecnico di Torino, ITALY. The new current identification number of paper is #11, in the content list.
� THE 5th INTERNATIONAL CONFERENCE ON MASS CUSTOMIZATION AND PERSONALIZATION IN CENTRAL EUROPE (MCP-CE 2012), organized in Novi Sad, SERBIA (19 – 21 September 2012), by the University of Novi Sad, Faculty of Technical Sciences, Department of Industrial Engineering Management and Center for Product Development and Management. The new current identification numbers of papers are # 9 – 10, in the content list.
Also, ACTA TECHNICA CORVINIENSIS – Bulletin of Engineering, Fascicule 2/2013 [April-June/2013] includes, also, original papers submitted to the Editorial Board, directly by authors or by the regional collaborators of the Journal [papers # 1 – 8 and # 12 - 25].
ACTA TECHNICA CORVINIENSIS – BULLETIN of ENGINEERING
ISSN: 2067-3809 [CD-Rom, online]
copyright © UNIVERSITY POLITEHNICA TIMISOARA, FACULTY OF ENGINEERING HUNEDOARA,
5, REVOLUTIEI, 331128, HUNEDOARA, ROMANIA http://acta.fih.upt.ro

© copyright FACULTY of ENGINEERING ‐ HUNEDOARA, ROMANIA 21
1. Juraj HUDÁK, 2. Miroslav TOMÁŠ
CREATION FORGING DIES’ FUNCTIONAL SURFACE USING PRESENT CAD/CAM SYSTEM 1-2. TECHNICAL UNIVERSITY IN KOŠICE, DEPARTMENT OF TECHNOLOGIES AND MATERIALS, MÄSIARSKA 74, 040 01 KOŠICE, SLOVAKIA
ABSTRACT: Contribution deals with methods for creating functional surfaces of forming dies using CAD systems and focuses to bulk forming processes – die forging. The source for functional surfaces design of forging die is solid model of forged piece with defined mould joint, chamfers and radii. Next are presented two methods of forging dies creating according to CAD systems possibilities – mould cavity mode and assembly mode (Merge-Cut Out command). Both method are presented step by step and there are compared their advantages from the user’s view. KEYWORDS: CAD, functional surface, forging die, mould cavity mode, Merge-Cut Out
INTRODUCTION The forming technology represents shape-changing technological operation by which a forming die acts to a material to produce solid or hollow bodies from solid or flat raw products – forgings, pressings, stampings etc. Parts produced by forming processes represent simple or complicated in shape parts and its design uses complicated in shape surfaces too. The significant forming die characteristic is a singularity - each part’s shape could be realized by different technological procedures, hence by the different concepts in design of forming dies. Parts produced by forming are made at a single movement of complicated in shape forming dies within a very short production time. [1] Differences in shape of parts produced by forming in a large extent follow from used shape of incoming raw product. Cold forming (stamping) operations process flat raw products (sheets) and there is no significant change in thickness but relevant change in shape by plastic deformation. Hot (bulk) forming operations process bars, rods and sheets by large volume plastic deformation and redistribution of raw product volumes and sections. This shape difference of parts produced by cold and hot forming operations needs to be taken into consideration by die designer in CAD design of forming die functional surfaces and in the choice of techniques by which forming dies surfaces will be created as well. [2] SURFACES USED IN CAD/CAM SYSTEMS The CAD and CAD/CAM software packages focused to 3D modelling and design show a significant role in design of forming dies at present. Its improving led to modelling techniques evolution as well. Complicated mathematic description of functional surfaces was implemented into CAD and CAD/CAM software packages and it allows designing complex
free form surfaces with a high degree of geometric constraint applied that are typical for outer and inner car’s body components. [3] There are used two types of surfaces in CAD/CAM systems primarily at present: [3,4,5,6,7]. 1. Regular (or canonical) surfaces - include
revolved surfaces, such as cylinders, cones, spheres, and tori, and extruded surfaces (linear in one direction). These surfaces are usually created using REVOLVE and EXTRUDE commands and both closed section (or sketch) and path of extrusion or axis of revolution are necessary to define. As the primary surfaces are created, other commands can be applied to create rounds, chamfers, ribs, drafts etc. The main attribute of these surfaces is exact definition of sketch described by dimensions of lines, radii, arcs, polygons, etc.
2. Freeform surfaces – represents more complex shapes of surfaces. They do not have rigid radial dimensions, unlike regular surfaces such as planes, cylinders and conic surfaces. Most systems use non-uniform rational B-spline (NURBS) mathematics to describe the surface forms. The forms of freeform surfaces (and curves) are not stored or defined in CAD software in terms of polynomial equations, but by their poles, degree, and number of patches (segments with spline curves). CAD software packages use two basic methods for the creation of freeform surfaces: � the first begins with construction curves
(splines) from which the 3D surface is then swept (section along guide rail), or meshed (lofted) through.
� the second method is direct creation of the surface with manipulation of the surface poles/control points.
From these initially created surfaces, other surfaces are constructed using either derived methods such as

ACTA TECHNICA CORVINIENSIS – Bulletin of Engineering
2013. Fascicule 2 [April–June] 22
offset or angled extensions from surfaces; or via bridging and blending between groups of surfaces. CREATION OF FORGING DIE CAVITY In forming dies design with computer aid is commonly used principle of die functional surfaces creation based on solid or surface model from which functional surface of die is derived. It is useful to note die functional surface is negative to part surface. This procedure is typical for cavity creation of moulds and forging dies as well as functional surfaces of stamping dies in automotive industry. The main advantage of mentioned is derivation of die surface directly from part surface and elimination of faults at die model creation from 2D drawing. Next are presented two methods for creation of forging die cavity as its functional surface using CAD/CAM software Pro/Engineer: the first one is based on Pro/MOLD module (mould cavity mode) and the second one is based on merging positioned models by Cut Out operation (assembly mode). [8,9] Forged part Part produced by forging and machined to desired dimensions is shown in Figure 1. The part is created by flanged head and shaft. Flange is symmetrical with shaped noses and threaded holes. Shaft is created by two cylindrical diameters with G-neck at flange to shaft transition and relive for snap-ring at the end. The flange is relieved with sphere cut.
Figure 1. Final part Figure 2. Forging shape Considering technological design of part, required accuracy of dimensions and surface quality given by 2D drawing was proposed machining allowances, dividing plane, bevels and radii of sharp edges. Final shape of forging is shown at Figure 2. Due to complex shape of forging it isn’t possible to make it at single forging operation. Technological process of forging was proposed according to required calculations at which dimensions of raw product, operation steps, outflow groove and forces were calculated. Intermediate operations aren’t considered here, only final forging operation. Creation of forging die functional surfaces in Pro/MOLD CAD/CAM software Pro/Engineer ver. Wildfire 5.0 was used to create forging die cavity. The software Pro/Engineer continues after rebranding at present as Creo 2.0 software package with preserved all functionalities of key properties and modular structure as well. Pro/MOLD represents one of optional modules of software package for cavities creation of casting moulds, injection moulds for plastics and forging dies as well as its components (runners, inserts, sand cores, etc.). After module starts and file creation working area and icons are shown in right toolbar. Based on the process
controlled approach to cavity creation icons are aligned in sequence of commands from up to down. When dies cavity are created designer uses commands step by step in order of icons. The basic step at cavity creation using “mould cavity mode” is reference part creation. The reference part is then used in software module to create die cavity. The part created in basic module of software is loaded to Pro/MOLD module as REFERENCE MODEL. The reference model is one way associated (all changes in part model are respected to reference model, but changes in reference model aren’t respected to part model).
Figure 3. Flowchart at die cavity creation in module Pro/MOLD (mold cavity mode)
Figure 4. Models of upper and lower forging die
created as mould cavity mode Figure 3 shows other steps to die cavity creation by “mould cavity mode” method. The second step defines Shrinkage of reference model due to forging temperature. Shrinkage can be applied in two ways: to whole part according to its coordinate system or separately to each dimension. Workpiece around reference model is defined in the third step. The workpiece represents outer shape of die created.

ACTA TECHNICA CORVINIENSIS – Bulletin of Engineering
2013. Fascicule 2 [April–June] 23
Depending on reference model and workpiece position are then defined dividing planes and each volumes of created die. The workpiece is then divided by dividing planes and volumes onto required number of die parts that are extracted from workpiece to separate parts. These parts then create upper and lower part of dies for forging. Final shape of upper and lower part of dies and names of each features are shown in Figure 4. Creation of forging die functional surfaces in Assembly mode The way of die cavity creation in assembly mode requires 3D models (solid or surface) of forging and workpieces of upper and lower die parts. The basic step is positioning of forging and workpieces models in assembly mode of software package Pro/Engineer relative to parting surface position.
Figure 5. Models of upper/lower forging dies
created as assembly mode
Figure 6. Flowchart at die cavity creation
by Cut Out Component Operation (assembly mode) Figure 5 shows 3D models of lower die workpiece and forging. 3D model of forging is necessary to scale according to shrinkage percentage (command Edit → Scale Model). Forging and lower die workpiece position need to be fully constrained using standard assembly commands (Mate, Align, Insert, ...). Cavity in lower die is then created by command Edit → Component Operations → Cut Out with selection of part to perform Cut Out process to at first (lower die
workpiece) and selection of reference parts for Cut Out process at second (3D model of forging with shrinkage applied). Created cavity is then negative to forging 3D model in lower die workpiece – Figure 5. The upper die part is then created by positioning 3D model of forging with shrinkage applied and upper die workpiece and application of command mentioned. Note, when complicated forging parts are processed, closed cavities may occur in lower or upper die workpieces that need to be remodelled (cut out) in part mode. Figure 6 shows steps to die cavity creation by “assembly mode” method. Comparison of methods for die cavity creation Figure 7 and Figure 8 shows and compare process tree at both methods for die cavity creation. In the case of die cavity creation by mold cavity mode process tree represents complicated structure with items adding by command sequence according to flowchart in Figure 3. The base is reference model, indicated by “_ref” and scaled by shrinkage percentage that is used as core for creation of die cavity. Then workpiece is defined and added to process tree. Next silhouette curve is added and used for parting surface creation - Skirt surface in process tree. The very important is splitting workpiece volume to upper and lower dies and volumes extraction by which are added 3D models of upper and lower dies.
Figure 7. Process tree at cavity creation
by “mold cavity mode” method
a)
b) Figure 8. Process trees at cavity creation
by “assembly mode” method a) process tree in assembly mode
b) process tree in part mode for lower die

ACTA TECHNICA CORVINIENSIS – Bulletin of Engineering
2013. Fascicule 2 [April–June] 24
There are two process trees at creation of die cavity by assembly mode: the first process tree is in assembly mode where die workpiece and forging model are positioned and merged by Cut Out operation and the second process tree is in part mode where die workpiece modelling is finished. The cavity is created in assembly mode and process tree is very simple when compared to previous method. After material removing by command Edit → Component Operations → Cut Out die cavity is created in die workpiece and it is added in process tree in part mode after lower die part opening (item Cut Out id). Following operations on lower or upper die are realized in part mode after its opening. The main advantage of die cavity creation in mold cavity mode is automatic creation of parting surfaces and splitting of workpiece volumes to desired die volumes (upper and lower). This mode could be called technologically oriented approach to die cavity creation. When dies cavity is created in assembly mode, designer must realize each operation step by step manually including positioning of workpiece and forging and creating parting surface by using standard methods and commands allowed in assembly mode. CONCLUSIONS Forming dies design is realized mainly in 3D space at present. CAD, resp. CAD/CAM software packages offers die designers powerful tools for creation complicated shapes of parts as well as complicated shapes of functional surfaces of forming dies. The contribution was focused to procedures used for cavity creation at forging dies design process. The main advantage of presented procedures is the associativity that offers automatic transfer of changes realised in 3D model of part, resp. forging to all modules of software that had been used, without any data transformation through neutral file formats. Substantial reduction of design-technology cycle is then reached, possible mistakes at data transformation are reduced and designer’s work efficiency is increased as well. Acknowledgement This work was financially supported by the Scientific Grant Agency of Slovak republic under the scientific Grant VEGA No. 1/0500/12 “Research of Quality Improvement when Milling Formed Surfaces by Advanced Coated Tools”. REFERENCES [1.] Pollák, L. (2004), Forming dies for stamping –
products of mechanical engineering industry. Proc. TOOLS 2004, pp. 142-145., ISBN 8022720437
[2.] Spišák, E., Evin, E. and Hudák, J. (1992), Forming technology. Košice: TU, 1992. pp.167, ISBN 80-7099-173-9
[3.] Várady, T. and Pratt, M. J. (1984), Design techniques for the definition of solid objects with free-form geometry. In: Computer Aided Geometric Design 1, Elsevier Science Publishers B.V. 1984, pp. 207-225
[4.] Pernot, J.P., Falcidieno, B., Giannini, F. and Léon, J. C. (2008), Incorporating free-form features in aesthetic and engineering product design: State-of-the-art report. Computers in Industry, 59 (2008), pp. 626–637
[5.] Pernot, J.P., Falcidieno, B., Giannini, F., Léon, J. C. (2005), Fully free-form deformation features for aesthetic shape design. In: Journal of Engineering Design, Vol. 16, No. 2, April 2005, pp. 115–133, ISSN 0954-4828
[6.] Fontana, M., Giannini, F. and Meirana, M. (2000), Free form features for aesthetic design. In: International Journal of Shape Modelling, Vol. 6, No. 2 (2000), pp.273-302
[7.] Kuric, I., Košturiak, J., Janáč, A., Peterka, J. and Marcinčin, J. N. (2002), Computer Aided systemes in mechanical engineering. EDIS, Žilina, 2002, 351 p., ISBN 80-7100-948-2
[8.] Kráľ, J., Ižol, P., Tomáš, M. and Kaščák, Ľ. (2011), Pre-production using CAx technologies. Košice: TU, SjF - 2011. - 182 p. - ISBN 978-80-553-0707-7
[9.] Pro/ENGINEER Wildfire 5.0 Help Center: To Merge Using Component Operations.
ACTA TECHNICA CORVINIENSIS – BULLETIN of ENGINEERING
ISSN: 2067‐3809 [CD‐Rom, online]
copyright © UNIVERSITY POLITEHNICA TIMISOARA, FACULTY OF ENGINEERING HUNEDOARA,
5, REVOLUTIEI, 331128, HUNEDOARA, ROMANIA http://acta.fih.upt.ro

© copyright FACULTY of ENGINEERING ‐ HUNEDOARA, ROMANIA 25
1. M. RAMU, 2. Raja V. PRABHU
METAMODEL BASED ANALYSIS AND ITS APPLICATIONS: A REVIEW
1-2. MECHANICAL ENGINEERING DEPARTMENT, PSG COLLEGE OF TECHNOLOGY, COIMBATORE-641004, INDIA
ABSTRACT: Engineering analysis using computer based simulation is used extensively to predict the performance of a system. Such engineering analyses rely on running expensive and complex computer codes. Approximation methods are widely used to reduce the computational burden of engineering analysis. Statistical techniques such as design of experiments and Response Surface Methodology (RSM) are widely used to construct approximate models of these costly analysis codes which minimize the computational expense of running computer analyze. These models referred as metamodels, are then used in place of the actual analysis codes to reduce the computational burden of engineering analyses. Use of metamodels in the design and analysis of computer experiments has progressed remarkably in the past three decades. This paper reviews the state of the art of constructing metamodels and its evolutions over the past three decades. KEYWORDS: Metamodel, Experimental design, Approximation methods, Response surface, Kriging, Reliability based design
INTRODUCTION Engineers use finite element analysis packages to evaluate the performance of a structure, computational fluid dynamics packages to predict the flow characteristics of a fluid media in or over a domain and Monte Carlo Simulation (MCS) to estimate the reliability of a product. Also traditional engineering design optimization which is the process of identifying the right combination of product parameters is often done manually, time consuming and involves a step by step approach. Approximation methods are widely used to reduce the computational burden of engineering analyses. The use of long running computer simulations in design leads to a fundamental problem when trying to compare and contrast various competing options. It is also not possible to analyze all of the combinations of variables that one would wish. Metamodels, also referred as surrogate models, are a cheaper alternative to costly analysis tools and can significantly reduce the computational time involved. The basic approach is to construct a mathematical approximation of the expensive simulation code, which is then used in place of the original code to facilitate analysis such as design optimization, reliability analysis, etc. A variety of approximation methods exists (e.g. response surface, kriging model, radial basis function, neural network, regression splines), and recently Simpson et al. [1] presented a general overview of how this area has been developed over the past two decades. Wang et al. [2] offers an overall picture of the current research and development in metamodel based design
optimization. Simpson et al. [3] also reviews on metamodel based design optimization including several experimental design methods, RSM, Taguchi methods, neural networks, and kriging. Recommendations for the appropriate use of statistical approximation techniques were also given in the paper. A panel discussion on approximation methods in multidisciplinary analysis and optimization was held at the 9th AIAA/ISSMO Symposium on Multidisciplinary Analysis & Optimization in Atlanta during 2002. The objective of the panel was to discuss the available approximation methods and identify the future research directions [4]. Forrester et al. [5] reviews a range of surrogate modeling methods, their use in optimization strategies and noted the pros and cons of each method. They have also provided some general thoughts on the suitability of each method for various types of problems. Many review papers have been reported since three decades in the application of metamodel in design optimization. It also seems that more and more methods are being developed, the gap between research community and design engineers keeps widening. This review is expected to provide the current research and development of metamodel based analysis. Moreover, it is organized in a way to provide the researcher’s the application of metamodels in design optimization and reliability based design. Though efforts have been made to collect as much relevant literatures as possible, it is not the intent of the review to be exhaustive on this intensive topic.

ACTA TECHNICA CORVINIENSIS – Bulletin of Engineering
2013. Fascicule 2 [April–June] 26
ROLE OF METAMODELING Detailed research has been carried out in using metamodeling techniques in design optimization. This research includes experimental design methods, metamodel types, model fitting techniques, application of metamodels in design optimization and reliability based design. Through literatures it has become clear that metamodeling provides a decision support role for all design engineers. The supporting functions that metamodels can provide are listed here with reference to the literatures [6]: a) Model approximation-models which replace the
computationally expensive codes, b) Design space exploration-understanding the design
problem in the whole design space by using metamodels,
c) Optimization – e.g., global optimization, multi-objective optimization, multidisciplinary optimization, probabilistic optimization and so on. Metamodels are integrated to the above optimization problems to reduce the computational burden.
d) Reliability based design- Reliability assessment is the prime function for Reliability based design. Metamodels are used to approximate the expensive constraint functions, or the limit state function.
Figure 1 illustrates the support afforded by metamodels.
Figure 1. Support provided by metamodels
The evolution of metamodel based analysis is summarized in figure 2, which shows the number of publications related to metamodels over the past three decades. This data was obtained using the ‘Scirus scientific research tool’ where we searched for occurrences of the word: “metamodels”(during May 2011). Figure 3 illustrates the number of publications reporting the use of metamodels in design optimization and reliability analysis applications. For each application, the search was made with the following words: metamodels AND design optimization or metamodels AND reliability analysis.
Figure 2. No. of publications, from 1980 - 2011
Figure 3. Metamodels in design optimization and
reliability analysis METAMODELING Metamodeling involves (a) Selection of experimental design for generating data, (b) Selection of model to represent the data, and (c) fitting the observed data using the model. There are several options for each of these steps, as shown in figure 2. For example, response surface methodology usually employs central composite designs, polynomials and regression analysis. Experimental designs
An experimental design (or Design of experiments) is an organized method to determine the relationship between the different factors affecting the output of a process. As indicated in Figure 4, there are several experimental design methods. Design of Experiments includes the design of all information-gathering exercises where variation is present, usually under the full control of the experimenter. Often the experimenter is interested in the effect of some process or intervention on some objects. Design of experiments is a discipline that has very broad application.
Figures 4. Types of Metamodelling Techniques
Classical design and analysis of physical experiments accounts the random variation by spreading the sample design points in the design space and by taking replicate design points. Commonly used classical designs are factorial or fractional factorial, Central Composite Design(CCD), Box-Behnken design, Plackett-Burman design. Also classical designs spread the sample points around the boundaries and leave a few at the center of the design space. Sacks, et al. [7] stated that as computer experiments involve mostly systematic error rather than random error, a good experimental design tends to fill the design space. They also stated that to classical designs, e.g. CCD can be inefficient or even inappropriate for deterministic computer codes. Jin, et al. [8] also confirms that experimental designs for deterministic

ACTA TECHNICA CORVINIENSIS – Bulletin of Engineering
2013. Fascicule 2 [April–June] 27
computer analysis should be space filling. Koehler and Owen [8] described several space filling designs like maximum entropy design, mean squared-error designs, minimax and maximin designs, Latin Hybercube designs, orthogonal arrays and scrambled nets. The most common space filling designs available in the literatures are Latin Hypercube [9-31], orthogonal arrays [18, 32-41], Hammersley sequences[42-50] and uniform designs[51,52]. The code for generating various designs is available at http://lib.stat.cmu.edu/designs. Consequently, many researchers advocate the use of “space filling” designs when sampling deterministic computer analyses to treat all regions of the design space equally. A comparison of these designs is in Ref. [53]. Fasihul et al. [14] investigates the effect of experimental design on the development of neural network simulation metamodel. The experimental design approaches used are CCD, a modified Latin Hybercube design, and designs supplemented with domain knowledge. The neural network developed from modified Latin Hybercube design supplemented with domain knowledge produces the best performance. In another paper, Fei et al. [54] seven sampling techniques were used to evaluate the accuracy of neural network model. Two benchmark problems; an antenna model and an aircraft model was used and the result showed that the uniform design is the best sampling technique for metamodel building. Isabel et al. [55] proposes a sequential design that improves the accuracy of the nonlinear simulation metamodels. The paper also stresses that a careful choice of an experimental design can lead to better metamodels, with the same simulation effort. Model types The next step after the selection of experimental design is to perform the necessary computer runs and to choose an approximating model. Many model types are available of which RSM that uses polynomial functions and neural network are the well known approaches. RSM, the most well-established metamodeling technique, is a popular and an easy method for approximation. It is quite suitable and effective in engineering design applications due to its simplicity when the number of design variables is small and the response is not highly nonlinear. RSM are often in form of low order polynomials. Among these common models, the quadratic polynomial response function is the most popular. Fasihul et al. [14] investigates the effect of experimental design on the development of neural network simulation metamodel. Many literatures have been reported work using neural networks [37,40,54,75,78,84,88,91,94,95,100]. Other types of models includes Radial Basic Functions (RBF), kriging and Multivariate Adaptive Regression Splines (MARS).Radial Basis Function (RBF) is a kind of neural network metamodeling technique that is different from RSM because RBF interpolates data and the approximate response surface goes through all the data points. It is considered that this method is excellent to fit and interpolate the response of a deterministic process of computer simulation codes.
Also, when the number of design variables increases and the response is highly nonlinear, the RSM becomes less attractive because the number of design points increases correspondingly. In this case, RBF would be one of the alternative options of metamodeling techniques. Kriging (design and analysis of computer experiments), an interpolative model is becoming popular in recent years. Kriging was originally developed by the South African mining engineer called Krige and later on the model was developed by Sacks et al. [7,56]. A recent review on kriging metamodeling is available in Jack et al. [57]. Despite the several approximation methods, the comparative studies among these approaches are limited. Giunta, et al. [58] compared the polynomial and interpolating (kriging) models through test problems involving one, five and ten variables. Some researchers like Jin, et al.,[8], Simpson et al. [1, 59] and Forrester et al.[5] have compared the metamodeling methods and their progress in the past two decades. Application to Design optimization Wang et al. [60] uses the metamodel generated using RSM and kriging to optimize a cylindrical tube impacting a rigid wall which involves nonlinearity, buckling, and dynamics. In the same paper another problem of topologic optimization of initial blank shape was also performed. Jouhaud et al. [61] applied the metamodel based shape optimization method in case of the multidisciplinary shape optimization of a 2D NACA subsonic airfoil. Sakata et al. [62] solved a problem on layout optimization of a beam structure for eigen value maximization. Stinstra et al. [63] applied the metamodel based optimization method to the design of two parts of the TV tube: furnace profile and shadow mask. Dellino et al. [64] uses the kriging metamodel in multi-objective engineering design optimization of a injection system for compressed natural gas engines. Sakata et al. [31] investigates the applicability of kriging to minimize the thermoelastic deformation by the piezoelectric effect of a composite structure. They use an optimization method to determine the optimum applied electric potential to minimize the thermoelastic deformation. Raza et al. [22] combines the Reynolds-averaged Naveir stokes analysis with kriging method in the shape optimization of a wire-wrapped fuel assembly in a liquid metal reactor. The optimization problem in this case is stated as the maximization of the objective function, which is defined as a linear combination of heat transfer and friction related functions with a weighting factor. Two design variables are selected and design points are chosen using Latin Hypercube Sampling. Sakata et al.[65] created a metamodel for layout optimization of beam reinforcement and the response surface for the reinforcement effect of inserted additional elements was estimated. Gano et al. [66] used kriging model for the sizing problem of an internal combustion engine and for a control-augmented structural design problem. In the former case, the geometry for a flat head internal combustion chamber is sought to provide maximum specific power satisfying a number of constraints such as fuel

ACTA TECHNICA CORVINIENSIS – Bulletin of Engineering
2013. Fascicule 2 [April–June] 28
economy, packaging and knock limitations. The objective of the control-augmented structure design problem is to minimize the total weight of the structure. This minimization problem is subjected to certain constraints like, static stresses, lateral and rotational displacements, natural frequencies and dynamic lateral and rotational displacements. Meunier et al. [67] used kriging to model the behavior of shape memory alloy(SMA)s that are nonlinear functions of several variables, thus, permitting design optimization. Trochu et al. [68] uses dual kriging to model the hysteretic material laws of SMA. This model was interfaced with a nonlinear finite element program to analyze the SMA devices. Finally, two industrial examples: a SMA spring-disk developed for electrical contacts and a SMA medical dent was analyzed for design optimization. Application to reliability based design Malur et al. [69] presented an iterative procedure to develop a response surface that is locally a good approximation to the actual limit state surface in the region of maximum joint probability density and can be used for structural reliability analysis. He also suggests that the response surface method can be used effectively for reliability analysis of certain structural systems where behavioral models to describe their various limit states cannot be developed in closed form. Das et al. [70] have proposed an improved RSM in which the function has constant, linear, and selected quadratic terms. Improvement in the performance of response surface function was made by including or removing some of the second order terms. In this way an appropriate incomplete second order response surface was obtained. Similar work has been carried by the same authors [71] and has used a stiffened plate under combined load for the reliability study. Tandjiria et al. [72] have applied RSM for the reliability analysis of laterally loaded piles. The reliability results calculated using MCS and RSM agreed well with only slight differences in the failure probability due to the assumptions made. Pendola et al. [73] presented a probabilistic methodology for nonlinear fracture analysis of general cracked structures. Two methods are studied for the coupling of finite element analysis with reliability software. An example of a cracked pipe was presented to illustrate the proposed methodology. The results also showed that the methodology was able to give accurate probabilistic characterization of the J-integral in elastic–plastic fracture mechanics without obvious time consumption. Guan et al. [74] highlights the possible effects on the response surface model due to the variation in the experimental design points. Hurtado et al. [75] summarized the applicability of different kinds of neural networks for the probabilistic analysis of structures. The comparison was made between multi-layer preceptors and radial basis functions classifiers and over four examples. The paper also indicates some recommended ways of employing neural networks. Soares et al. [76] described a formulation to compute the reliability of reinforced concrete structures, in which physical and
geometrical non-linearities are taken into account. The non-linear model adopted allows the representation of the mechanical behavior of concrete structures at the failure stage, which is governed by possible large displacement effects, softening behavior of concrete and tension stiffening effects. The failure surface is obtained by fitting the internal force ultimate state of the structure using a quadratic polynomial. Assessing the reliability of a complex structure requires a deal between reliability algorithms and numerical methods used to model the mechanical behavior. The RSM represents a convenient way to achieve this purpose. The interest of such a method is that the user is allowed to choose and check the computed mechanical experiments. Nevertheless, this choice in an optimal way turns out to be not always an easy task. Gayton et al. [77] proposed a response surface method named CQ2RS (Complete Quadratic Response Surface with Re-Sampling) allowing to take into account the knowledge of the engineer on one hand and to reduce the cost of the reliability analysis using a statistical formulation of the RSM problem on the other hand. Some academic and industrial examples were presented to illustrate the efficiency of the method. The MCS, the First-Order Reliability Method (FORM) and the Second-Order Reliability Method (SORM) are the three common reliability analysis methods used for structural safety evaluation. The MCS requires calculations of several performance functions while FORM and SORM demands partial derivatives of the performance function with respect to the design variables. Such calculations are time consuming. In order to address these issues, Deng et al. [84] presented three Artificial Neural Network(ANN) based reliability analysis methods, i.e. ANN-based MCS, ANN-based First Order Reliability Method and ANN-based Second Order Reliability Method. Examples were given in this work to illustrate the procedure of this method. Gomes et al. [78] in their work presented the RSM and ANN techniques and compared these techniques using FORM, Direct MCS and MCS with adaptive importance sampling technique. Problems with simple limit state functions and closed form solutions of the failure probability are solved in order to highlight the advantages and disadvantages using these techniques. It is observed that in problems where the computational cost of structural evaluations is high, these two techniques may turn feasible the evaluation of the structural reliability through simulation techniques. The problem of response surface modeling of limit surface within two hyper spheres of prescribed radii is considered in Gupta et al. [79]. The relevance of this problem in structural reliability analysis involving performance functions with multiple design points that make significant contributions to failure probability is discussed. The paper also proposes global measures of sensitivity of failure probability with respect to the basic random variables. The performance of the proposed improvements is examined by comparing the simulation based results with results from the proposed procedure with reference to two specific structural reliability

ACTA TECHNICA CORVINIENSIS – Bulletin of Engineering
2013. Fascicule 2 [April–June] 29
analysis problems. A probabilistic design system for reliability based design optimization problems called ADAPRES_NET was presented by Kaymaz et al. [80]. ADAPRES_NET includes two main features, one of which is the use of an adaptive response surface method by which the response functions, the other distributed computing environment by which the computational applications are distributed on a network. The proposed system was presented with a connecting rod example and evaluation of the probabilistic constraints was also compared with that of the classical reliability methods, and the results indicated the benefits of using this technique. Qu et al. [81] proposed a probabilistic sufficiency factor approach that combines safety factor and probability of failure. The approach provides a measure of safety that can be used more readily than the probability of failure to estimate the safety level. The paper presents the use of probabilistic sufficiency factor with a design response surface approximation, which fits it as a function of design variables. It is also shown that the design response surface approximation for the probabilistic sufficiency factor is more accurate than that for the probability of failure or for the safety index. Rais-Rohani et al. [82] discussed the development and application of global and local response surface techniques for the solution of reliability based optimization problems. A thin walled composite circular cylinder under axial buckling instability was used as a demonstrative example. The two techniques adopted are found to produce similar results in terms of accuracy, with the sequential local RS technique having a considerably better computational efficiency. Youn et al. [83] integrated the hybrid mean method with response surface method for reliability based design optimization of vehicle side impact problem. The design objective is to enhance side impact crash performance while minimizing the vehicle weight. Kaymax [85] investigates the use of the kriging method for structural reliability problems by comparing it with the most common RSM. The effects of the kriging parameters are also examined on the basis of the reliability index computation and fitting behavior. Some advantages and disadvantages of the kriging model are reported based on the results obtained from the application of the kriging method to the examples from literature. In continuation of his earlier work Kaymaz et al. [85, 86] uses a weighted regression method in place of normal regression in his proposed ADAPRES system. Examples are given in this paper to demonstrate the benefit of the proposed method for both numerical and implicit performance functions. Leira et al. [87] has investigated the application of response surface for reliability analysis of marine structures subjected to multiple environmental loads. The structural fatigue damage and long term response are expressed in terms of these environmental parameters based on application of polynomial response surfaces. Schueremans et al. [88] propose a technique to increase the efficiency of simulation based reliability algorithms. The low order polynomial response surfaces are extended using neural networks and
splines. The reliability framework was presented, compared with traditional RSM and commented extensively. The overall behavior of the technique was addressed referring to several benchmark examples. Wong et al. [89] presented a case study to investigate the cause for the divergence of the solution of the reliability analysis. An adaptive design approach was proposed to overcome this problem and several suggestions are made to improve the robustness of the RSM. Three numerical examples have been chosen to demonstrate the proposed method, which was verified by MCS. Deng [90] proposed three RBF network methods to compute the implicit performance function and then to combine them with conventional MCS, FORM and SORM and propose three RBF reliability analysis methods: RBF based MCS, RBF based FORM and RBF based SORM. The presented methodology is convenient for problems with highly non-linear performance functions or with large number of random variables. The author in his first paper, Deng et al. [84], used NN instead of RBF. Similar work has been carried out by Elhewy et al. [91] and paper shows that the ANN-based RSM is more efficient and accurate than the conventional RSM. In Babu et al. [92] the concept of RSM was used to generate the approximate polynomial functions for ultimate bearing capacity and settlement of a shallow foundation resting on a cohesive frictional soil for a range of expected variation of input soil parameters. Considering the variations in the input soil parameters, reliability analysis is performed using these response surface models to obtain an acceptable value of the allowable bearing pressure. Bucher et al. [93] presented an overview of approximation techniques like RSM, moving least square regression, RBF and NN and demonstrates their potential in structural reliability analysis. Cheng et al. [94] developed a new class of ANN based Genetic Algorithm (GA) for reliability analysis of structures. The method involves the selection of training datasets by uniform design method, approximation of the limit state function by ANN and estimation of failure probability using the GA. Three example problems illustrated the benefits of integrating uniform design method, ANN and GA and indicated that the proposed method provide accurate and computational efficient estimates of probability of failure. Similar work has been carried out by Cheng et al. [95] in which FORM is used for estimating failure probability. Hao et al. [96] has studied the reliability based optimization of composite structures by combining RSM and finite element method. Jansson et al. [97] evaluated the use of linear and quadratic approximating response surfaces as metamodels in the reliability assessment of a sheet metal forming process using the MCS technique. The studies showed that linear metamodels can be used to identify the important variables and to give an estimate of the probabilistic response. And quadratic surfaces are required for more accurate analysis. Lee et al. [98] proposed constraint boundary sampling to build metamodel that can predict optimum point accurately while

ACTA TECHNICA CORVINIENSIS – Bulletin of Engineering
2013. Fascicule 2 [April–June] 30
satisfy constraints. This technique is applied to the design of double-deck car body and was compared with conventional space-filling sampling. Fong et al. [99] developed a response surface as a surrogate for the thermal-hydraulic code for the selection of an ultimate heat sink for a passive secondary auxiliary cooling system. The reliability of the chosen design during the bounding transient, a station blackout was calculated. The uncertainty introduced by the use of the response surface itself was explored. Moller et al. [100] addressed an approach to performance based design in the context of earthquake engineering. The objective is the optimization of the total structural cost, under constraints related to minimum target reliabilities specified for the different limit states or performance requirements. The approach uses a neural network representation of the responses. Moller et al. [101] presented a comparison between three methods for the implementation of response surfaces: a global approximation of the deterministic database, local interpolation of that database, or using artificial neural networks. The comparison uses, an example, a 5 storey reinforced concrete building. The results showed good agreement between the methods and the paper discussed their corresponding advantages and limitations. RECOMMENDATIONS, GUIDELINES AND CHALLENGES In this paper, we have discussed the concept of metamodeling and survey the advancements in the metamodel based analysis within design optimization and reliability based design application in the past thirty years. Most metamodeling applications are based on low order polynomials using CCD and least square regression (RSM technique). The main limitation of the RSM is the use of single low order polynomial to represent the function. Many systems cannot be described well using a single low order polynomial. In order to accurately define the real system, use of more piecewise low order polynomials or Splines can be made. These piecewise continuous polynomials allow more complex system behavior to be redefined in small areas. Neural Networks (NN) is also another perspective to the above criteria. The weighting function which is the basis of the network, are very flexible and can adapt to any kind system behavior. Therefore, NN has no limits on shape, dimension and type of function. Kriging, an interpolation method capable of handling deterministic data which is extremely flexible due to the wide range of correlation functions may be chosen. However, the method is more complex than RSM. The opinion on the appropriate experimental design for computer analyses vary; the only consensus reached thus far is that design for non-random, deterministic computer experiments should be space filling designs [3]. Though intensive research on metamodeling has been carried out some research challenges remain to be overcome. It was recognized that when the number of design variables is large, the total computation expense for metamodel based analysis makes the approaches less attractive or even infeasible. For eg, if CCD and a second order polynomial function are
used for metamodeling, the minimum number of sample points required is 1n22 n ++ , where n is the number of design variables. There seems to be a lack of research on large-scale problems. New metamodeling techniques for large-scale problems, or simple yet robust strategies to decompose a large scale problem, are needed. In summary, the following conclusions can be made: � Space filling designs are the best experimental
design than classical designs � If the problem involves more number of design
variables, neural networks and radial basis functions may be the best choice despite computationally expensive to create
� If the problem to be modeled is highly nonlinear and with the number of design variables less than 50, then kriging may be the best
� Application with few variables and the behavior is smooth with less nonlinearity, and then response surface methodology may be used.
REFERENCES [1.] Simpson.T.W, Toropov.V, Balabanov. V, Viana
FAC, Design and analysis of computer experiments in multidisciplinary design optimization: a review of how we have come—or not.In:12th AIAA/ISSMO multi disciplinary analysis and optimization conference, Victoria, British Colombia, 10–12 September, 2008.
[2.] Wang, G. G. and Shan, S., "Review of Metamodeling Techniques in Support of Engineering Design Optimization," ASME Journal of Mechanical Design, Vol. 129, No. 4, 2007, pp. 370-380.
[3.] Simpson, T.W.; Peplinski, J.; Koch, P.N.; Allen, J.K., 2001, Metamodels for computer-based engineering design: Survey and recommendations. Engineering with Computers 17(2), 129–150
[4.] Simpson, T. W., Booker, A. J., Ghosh, D., Giunta, A. A., Koch, P. N. and Yang, R. J., 2004, "Approximation Methods in Multidisciplinary Analysis and Optimization: A Panel Discussion," Structural and Multidisciplinary Optimization, 27, 302-313.
[5.] Forrester. A.I.J., Keane. A.J., 2009, “Recent advances in surrogate-based optimization”, Progress in Aerospace Sciences, Vol. 45, 50–79.
[6.] Ullman, D. G., 2002, "Toward the Ideal Mechanical Engineering Design Support System," Research in Engineering Design, 13, 55-64.
[7.] Sacks, J., Welch, W. J., Mitchell, T. J. and Wynn, H. P., 1989, "Design and Analysis of Computer Experiments," Statistical Science, 4(4), 409-435.
[8.] Jin, R., Chen, W. and Simpson, T. W., 2001, "Comparative Studies of Metamodeling Techniques Under Multiple Modeling Criteria," Structural and Multidisciplinary Optimization, 23(1), 1-13.
[9.] Tang, 1994, "A Theorem for Selecting OA-Based Latin Hypercubes Using a Distance Criterion," Communications in Statistics, Theory and Methods, Vol. 23, No. 7, pp. 2047-2058.

ACTA TECHNICA CORVINIENSIS – Bulletin of Engineering
2013. Fascicule 2 [April–June] 31
[10.] Park, J.-S., 1994, "Optimal Latin-Hypercube Designs for Computer Experiments," Journal of Statistical Planning and Inference, Vol. 39, No. 1, pp. 95-111.
[11.] ZHAO Min, CUI Wei-cheng, 2007, “Application of the optimal Latin Hypercube design and radial basis function network to collaborative optimization”, Journal of Marine Science and Application, Vol.6, No.3, pp. 24-32.
[12.] Stein, M. Stein, 1987, Large sample properties of simulations using Latin Hypercube sampling, Technometrics, Vol. 29, No. 2, pp. 143–151.
[13.] M. Vořechovský and D. Novák, “Efficient random fields simulation for stochastic FEM analyses”, Computional fluid and solid mechanics, 2007, pp 2383-2386.
[14.] Fasihul M. Alam, Ken R. McNaught and Trevor J. Ringrose, 2004, A comparison of experimental designs in the development of a neural network simulation metamodel, Simulation Modelling Practice and Theory, Volume 12, Issues 7-8, pp. 559-578.
[15.] Jack P.C. Kleijnen, 2005, An overview of the design and analysis of simulation experiments for sensitivity analysis, European Journal of Operational Research, Vol.164 pp. 287–300.
[16.] Benjamin Wilson, David Cappelleri, Timothy W. Simpson, and Mary Frecker, 2001, “Efficient Pareto Frontier Exploration using Surrogate Approximations”, Optimization and Engineering, Vol.2, pp.31–50.
[17.] F. Jurecka, M. Ganser and K.-U. Bletzinger, 2006, Update scheme for sequential spatial correlation approximations in robust design optimization, Computers and Structures Vol. 85, pp. 606–614
[18.] H. Fang, M. Rais-Rohani, Z. Liu and M.F. Horstemeyer, 2005, A comparative study of metamodeling methods for multiobjective crashworthiness optimization, Computers & Structures Vol. 83, No. 25-26, pp. 2121-2136.
[19.] Feng Pan, Ping Zhu and Yu Zhang, 2010, Metamodel-based lightweight design of B-pillar with TWB structure via support vector regression, Computers and Structures, Vol.88, pp.36–44
[20.] Z. Qian, C. Seepersad, R. Joseph, J. Allen and C. F. J. Wu, 2006, Building surrogate models with detailed and approximate simulations, ASME Journal of Mechanical Design, 128, 668-677
[21.] M.-L. Bouazizi, S.Ghanmi, N.Bouhaddi, 2009, Multi-objective optimization in dynamics of the structures with nonlinear behavior: Contributions of the metamodels, Finite Elements in Analysis and Design, Vol.45, pp. 612-623.
[22.] Wasim Raza, Kwang-Yong Kim, Shape optimization of wire-wrapped fuel assembly using Kriging metamodeling technique, Nuclear Engineering and Design, vol.238 (2008) 1332–1341
[23.] R. Rikards, H. Abramovich, K. Kalnins, J. Auzins, 2006, Surrogate modeling in design
optimization of stiffened composite shells, Composite Structures, Vol.73, pp.244-251.
[24.] N. Jansson, W.D. Wakeman, J.-A.E. Manson, 2007,Optimization of hybrid thermoplastic composite structures using surrogate models and genetic algorithms, Composite Structures, Vol.80, pp.21–31.
[25.] Jay D. Martin, Timothy W. Simpson, 2002, Use of adaptive metamodeling for design optimization, 9th AIAA/ISSMO Symposium on Multidisciplinary Analysis and Optimization, Georgia, AIAA 2002-5631.
[26.] Patrick N. Koch, Brett Wujek, Oleg Golovidov, Timothy W. Simpson, 2002, Facilitating probabilistic multidisciplinary design optimization using kriging approximation models, 9th AIAA/ISSMO Symposium on Multidisciplinary Analysis and Optimization, Georgia, AIAA 2002- 5415.
[27.] Kwang-Yong Kim, Dong-Yoon Shin, Optimization of a staggered dimpled surface in a cooling channel using Kriging model, 2008, International Journal of Thermal Sciences, Vol. 47, pp.1464–1472.
[28.] Jay D. Martin, Timothy W. Simpson, 2004, On the use of kriging models to approximate deterministic computer models, International Design Engineering Technical Conferences and Computers and Information in Engineering Conference, Utah USA, DETC2004/DAC-57300.
[29.] Jay D. Martin, Timothy W. Simpson, 2005, Use of kriging models to approximate deterministic computer models, AIAA JOURNAL, Vol. 43, No. 4, pp.853-863.
[30.] William E. Biles, Jack P. C. Kleijnen, Wim C. M. van Beers, Inneke van Nieuwenhuyse, 2007, Kriging metamodeling in constrained simulation optimization: an explorative study, Proceedings of the 2007 Winter Simulation Conference, pp.355-362.
[31.] S. Sakata, F. Ashida, M. Zako, 2007, On applying Kriging-based approximate optimization to inaccurate data, Computational Methods in Applied Mechanical Engineering, Vol.196, pp.2055–2069.
[32.] N. Logothetis and A. Haigh, Characterizing and optimizing multi-response processes by the Taguchi method. Quality and Reliability Engineering International 4 (1988), pp. 159–169.
[33.] Genichi Taguchi, Subir Chowdhury, Shin Taguchi, Robust Engineering, 1999, McGraw Hill.
[34.] Sung H. Park, Robust design and analysis for quality engineering, 1996, Chapman & Hall.
[35.] Bhadra, S., and Ganguli, R., “Aeroelastic Optimization of a Helicopter Rotor Using Orthogonal Array Based Metamodels” AIAA Journal, Vol. 44, No. 9, 2006, pp. 1941-1951.
[36.] Hedayat, A. S., Sloane, N. J. A. and Stufken, J., 1999, Orthogonal Arrays: Theory and Applications, Springer, New York.
[37.] Mateen-ud-Din Qazi, and He Linshu, 2006, Nearly-orthogonal sampling and neural network

ACTA TECHNICA CORVINIENSIS – Bulletin of Engineering
2013. Fascicule 2 [April–June] 32
metamodel driven conceptual design of multistage space launch vehicle, Computer-Aided Design, Vol.38, No.6, pp.595-607.
[38.] Nestor V. Queipo, Raphael T. Haftka, Wei Shyy, Tushar Goel, Rajkumar Vaidyanathan, and P. Kevin Tucker, Surrogate-based analysis and optimization, 2005, Progress in Aerospace Sciences, Vol.41, No.1, pp 1-28.
[39.] Tushar Goel, Rajkumar Vaidyanathan, Raphael T. Haftka, Wei Shyy, Nestor V. Queipo, and Kevin Tucker, Response surface approximation of Pareto optimal front in multi-objective optimization, Computer Methods in Applied Mechanics and Engineering Vol.196, Issues 4-6, 1, pp. 879-893.
[40.] Taho Yanga, Huan-Chang Lin and Meng-Lun Chen, 2006, Metamodeling approach in solving the machine parameters optimization problem using neural network and genetic algorithms: A case study, Robotics and Computer-Integrated Manufacturing, Vol.22, pp.322–331.
[41.] Hong-Seok Park and Xuan-Phuong Dang, 2010, Structural optimization based on CAD_CAE integration and metamodeling techniques, Computer-Aided Design, Vol. 42, pp. 889-902..
[42.] Renyou Wang, Urmila Diwekar, and Catherine E. Gre´ goire Padro, 2004, “Efficient Sampling Techniques for Uncertainties in Risk Analysis”, Environmental Progress, Vol.23, No.2, pp141-157.
[43.] Ricardo A. Mitchell, 1990, “Error estimates arising from certain pseudorandom sequences in a quasi-random search method”, Mathematics of computation, Vol.55, No. 191, pp 289-297.
[44.] G. Lee, J. MOU and Y. Shen,1997, Sampling strategy design for dimensional measurement of geometric features using coordinate measuring machine, International Journal of Machine Tools and Manufacture, Vol.37, No. 7, pp.917-934.
[45.] R. Raghunandan, P. Venkateswara Rao, 2008, Selection of sampling points for accurate evaluation of flatness error using coordinate measuring machine, journal of materials processing technology, Vol.202, pp.240-245.
[46.] Weon-Seok Kim, Shivakumar Raman, 2000, On the selection of flatness measurement points in coordinate measuring machine inspection, International Journal of Machine Tools & Manufacture, Vol.40, pp.427–443.
[47.] Jose M. Ponce-Ortega, Vicente Rico-Ramirez, Salvador Hernandez-Castro, Urmila M. Diwekar, 2004, Improving convergence of the stochastic decomposition algorithm by using an efficient sampling technique, Computers and Chemical Engineering, Vol.28, pp.767–773.
[48.] Hongzhe Dai, Wei Wang, 2009, Application of low-discrepancy sampling method in structural reliability analysis, Structural Safety, Vol. 31, pp.55–64.
[49.] Y. Shastri, U. Diwekar, 2006, An efficient algorithm for large scale stochastic nonlinear
programming problems, Computers and Chemical Engineering, Vol.30, pp.864–877.
[50.] Yingying Chen, Karlene A. Hoo, 2010, Uncertainty propagation for effective reduced-order model generation, Computers and Chemical Engineering, In-press.
[51.] Fang, K. T., 1980, "Experimental Design By Uniform Distribution," Acta Mathematice Applicatae Sinica, Vol. 3. pp. 363-372.
[52.] Fang, K.-T., Lin, D. K. J., Winker, P. and Zhang, Y., 2000, "Uniform Design: Theory and Application," Technometrics, Vol. 42, pp. 237-248.
[53.] Simpson, T. W., Lin, D. K. J. and Chen, W., 2001, "Sampling Strategies for Computer Experiments: Design and Analysis," International Journal of Reliability and Application, 2(3), 209-240.
[54.] Fei Qingguo and Zhang Lingmi, 2004, Application of experimental design techniques to structural simulation meta-model building using neural network, Earthquake Engineering and Engineering Vibration, Vol.3, No.2, pp.293-298.
[55.] M. Isabel Reis dos Santos, Pedro M. Reis dos Santos, 2008, Sequential experimental designs for nonlinear regression metamodels in simulation, Simulation Modelling Practice and Theory, Vol.16, pp.1365–1378.
[56.] Sacks, J., Schiller, S. B and Welch, W. J., 1989, "Designs for Computer Experiments," Technometrics, 31(1), 41-47.
[57.] Jack P.C. Kleijnen, 2009, Kriging metamodeling in simulation: A review, European Journal of Operational Research, Vol.192, pp.707–716.
[58.] Giunta, A. A. and Watson, L. T., 1998, "A Comparison of Approximation Modeling Techniques: Polynomial Versus Interpolating Models," in: Proceedings of the 7th AIAA/USAF/NASA/ISSMO Symposium on Multidisciplinary Analysis & Optimization, Vol. 1, American Institute of Aeronautics and Astronautics, Inc., St. Louis, MO, September 2-4, AIAA-98-4758.
[59.] Simpson, T.W. and Mauery, T.M, Korte, J.J. and Mistree F., 1998, "Comparison of Response Surface and Kriging Models for Multidisciplinary Design Optimization," in: Proceedings of the 7th AIAA/USAF/NASA/ISSMO Symposium on Multidisciplinary Analysis & Optimization, Vol. 1, American Institute of Aeronautics and Astronautics, Inc., St. Louis, MO, September 2-4, AIAA-98-4755.
[60.] Wang Hu, Li Enying, G.Y. Li, Z.H. Zhong, 2008, Development of metamodeling based optimization system for high nonlinear engineering problems, Advances in Engineering Software, Vol. 39, pp.629-645.
[61.] J.C. Jouhaud, P. Sagaut, M. Montagnac, J. Laurenceau, 2007, A surrogate-model based multidisciplinary shape optimization method with application to a 2D subsonic airfoil, Computers & Fluids, Vol. 36, pp.520-529.

ACTA TECHNICA CORVINIENSIS – Bulletin of Engineering
2013. Fascicule 2 [April–June] 33
[62.] S. Sakata, F. Ashida, M. Zako, 2004, An efficient algorithm for Kriging approximation and optimization with large-scale sampling data, Comput. Methods Appl. Mech. Engrg, Vol. 193, pp. 385-404.
[63.] Erwin Stinstra, Dick den Hertog, 2008, Robust optimization using computer experiments, European Journal of Operational Research, Vol. 191, pp.816-837.
[64.] G. Dellino, P. Lino, C. Meloni, A. Rizzo, 2009, Kriging metamodel management in the design optimization of a CNG injection system, Mathematics and Computers in Simulation, Vol. 79, pp. 2345–2360.
[65.] S. Sakata, F. Ashida, M. Zako, 2003, Structural optimization using Kriging approximation, Comput. Methods Appl. Mech. Engrg., Vol. 192, pp. 923–939.
[66.] Shawn E. Gano, John E. Renaud, Jay D. Martin,Timothy W. Simpson, 2006, Update strategies for kriging models used in variable fidelity optimization, Struct Multidisc Optim, Vol.32, pp. 287–298.
[67.] M.A.Meunier, F.Trochu and P.Charbonnier, 1996, Modeling of thermo-mechanical fatigue behavior in shape memory alloys using dual kriging, Materials & Design, Vol.17, No.3, pp.133-139.
[68.] F. Trochu, P. Terriault, 1998, Nonlinear modelling of hysteretic material laws by dual kriging and application, Comput. Methods Appl. Mech. Engrg., Vol.151, pp. 545-558.
[69.] Malur R. Rajashekhar and Bruce R. Ellingwood, 1993, A new look at the response surface approach for reliability analysis, J. Structural Safety, Vol. 12, pp. 205-220
[70.] P.K. Das, Y. Zheng 2000, Cumulative formation of response surface and its use in reliability analysis, Probabilistic Engineering Mechanics, Vol. 15, pp. 309-315.
[71.] Y. Zheng, P.K. Das, 2000, Improved response surface method and its application to stiffened plate reliability analysis, Engineering structures, Vol. 22, pp. 544-551.
[72.] Vipman Tandjiria, Cee Ing The, Bak Kong Low, 2000, Reliability analysis of laterally loaded piles using response surface methods, Structural safety, Vol. 22, pp. 335-355.
[73.] M. Pendola, A. Mohamed, M. Lemaire, P. Hornet, 2000, Combination of finite element and reliability methods in nonlinear fracture mechanics, Reliability Engineering and System Safety, Vol. 70, pp. 15–27.
[74.] X.L. Guan, R.E. Melchers, 2001, Effect of response surface parameter variation on structural reliability estimates, Structural Safety, Vol. 23, pp. 429-444.
[75.] Jorge E. Hurtado, Diego A. Alvarez, 2001, Neural-network-based reliability analysis: a comparative study, Comput. Methods Appl. Mech. Engrg., Vol. 191, pp. 113-132.
[76.] R.C.Soares, A. Mohamed, W.S. Venturini, M. Lemaire, 2002, Reliability analysis of non-linear reinforced concrete frames using the
response surface method, Reliability Engineering and System Safety, Vol. 75, pp. 1-16.
[77.] N. Gaytona, J.M. Bourinet, M. Lemaire, 2003, CQ2RS: A new statistical approach to the response surface method for reliability analysis, Structural Safety, Vol. 25, pp. 99–121.
[78.] Herbert Martins Gomes, Armando Miguel Awruch, 2004, Comparison of response surface and neural network with other methods for structural reliability analysis, Structural safety, Vol. 26, pp. 49-67.
[79.] Sayan Gupta and C.S. Manohar, 2004, An improved response surface method for the determination of failure probability and importance measures, Structural Safety, Vol. 26, pp. 123–139.
[80.] I. Kaymaz and C.A.McMahon, 2004, A probabilistic design system for reliability-based design optimization, Structural multidisciplinary optimization, Vol.28, pp. 416-426.
[81.] X. Qu and R.T. Haftka, 2004, Reliability-based design optimization using probabilistic sufficiency factor, Structural multidisciplinary optimization, Vol.27, pp. 314-325.
[82.] M. Rais-Rohani, M.N. Singh, 2004, Comparison of global and local response surface techniques in reliability based optimization of composite structures, Structural multidisciplinary optimization, Vol. 26, pp. 333-345.
[83.] B.D. Youn, K.K. Choi, R.-J. Yang and L. Gu, 2004, Reliability-based design optimization for crashworthiness of vehicle side impact, Structural multidisciplinary optimization, Vol.26, pp.272–283.
[84.] Jian Deng, Desheng Gu, Xibing Li, Zhong Qi Yue, 2005, Structural reliability analysis for implicit performance functions using artificial neural network, Structural Safety, Vol. 27, pp. 25–48.
[85.] Irfan Kaymaz, 2005, Application of kriging method to structural reliability problems, Structural Safety, Vol.27, pp. 133-151.
[86.] Irfan Kaymaz and Chris A. McMahon, 2005, A response surface method based on weighted regression for structural reliability analysis, Probabilistic Engineering Mechanics, Vol. 20, pp. 11–17.
[87.] Bernt J. Leira, Tore Holmas, Kjell Herfjord, 2005, Application of response surfaces for reliability analysis of marine structures, Reliability Engineering and System Safety, Vol. 90, pp. 131–139.
[88.] Luc Schueremans, Dionys Van Gemert, 2005, Benefit of splines and neural networks in simulation based structural reliability analysis, Structural Safety, Vol. 27, pp. 246–261.
[89.] S.M. Wong, R.E. Hobbs, and C. Onof, 2005, An adaptive response surface method for reliability analysis of structures with multiple loading sequences, Structural Safety, Vol. 27, pp. 287–308.

ACTA TECHNICA CORVINIENSIS – Bulletin of Engineering
2013. Fascicule 2 [April–June] 34
[90.] Jian Deng, 2006, Structural reliability analysis for implicit performance functions using radial basis function network, International journal of solids and structures, Vol. 43, pp. 3255-3291.
[91.] A. Hosni Elhewy, E. Mesbahi, Y. Pu, 2006, Reliability analysis of structures using neural network method, Probabilistic Engineering Mechanics, Vol.21, pp.44–53.
[92.] G.L. Sivakumar Babu, Amit Srivastava, 2007, Reliability analysis of allowable pressure on shallow foundation using response surface method, Computers and Geotechnics, Vol.34, pp. 187-194.
[93.] Christian Bucher and Thomas Most, 2008, A comparison of approximate response functions in structural reliability analysis, Probabilistic Engineering Mechanics, Vol. 23, pp. 154-163.
[94.] Jin Cheng, Q.S. Li, 2008, Reliability analysis of structures using artificial neural network based genetic algorithms, Comput. Methods Appl. Mech. Engrg., Vol. 197, pp.3742-3750.
[95.] Jin Cheng, Q.S. Li, Ru-cheng Xiao, 2008, A new artificial neural network-based response surface method for structural reliability analysis, Probabilistic Engineering Mechanics, Vol. 23, pp. 51-63.
[96.] Wu Hao, Yan Ying, Liu Yujia, 2008, Reliability Based Optimization of Composite Laminates for Frequency Constraint, Chinese Journal of Aeronautics, Vol.21, pp.320-327.
[97.] T. Jansson, L. Nilssona, R. Moshfegh, 2008, Reliability analysis of a sheet metal forming process using Monte Carlo analysis and metamodels, Journal of Materials Processing Technology, Vol.202, pp.255-268
[98.] Lee, T.H, Jung, J.J, 2008, A sampling technique enhancing accuracy and efficiency of metamodel-based RBDO: Constraint boundary sampling, Computers and Structures, Vol.86, pp. 1463–1476.
[99.] Christopher J. Fong, George E. Apostolakis, Dustin R. Langewisch, Pavel Hejzlar, Neil E. Todreas, Michael J. Driscoll, 2009, Reliability analysis of a passive cooling system using a response surface with an application to the flexible conversion ratio reactor, Nuclear engineering and design, Vol. 239, pp. 2660-2671.
[100.] Oscar Möller, Ricardo O. Foschi, Laura M. Quiroz, Marcelo Rubinstein, 2009, Structural optimization for performance-based design in earthquake engineering: Applications of neural networks, Structural safety, Vol. 31, pp. 490-499.
[101.] Oscar Möller, Ricardo O. Foschi, Marcelo Rubinstein, Laura Quiroz, 2009, Seismic structural reliability using different nonlinear dynamic response surface approximations, Structural safety, Vol. 31, pp. 432-442.
ACTA TECHNICA CORVINIENSIS – BULLETIN of ENGINEERING
ISSN: 2067-3809 [CD-Rom, online]
copyright © UNIVERSITY POLITEHNICA TIMISOARA, FACULTY OF ENGINEERING HUNEDOARA,
5, REVOLUTIEI, 331128, HUNEDOARA, ROMANIA http://acta.fih.upt.ro

© copyright FACULTY of ENGINEERING ‐ HUNEDOARA, ROMANIA 35
1. Traian MAZILU
USING THE GREEN’S FUNCTION METHOD TO ANALYSE THE RESPONSE OF AN INFINITE WIRE ON VISCO-ELASTIC SUPPORT UNDER MOVING LOAD
1. DEPARTMENT OF RAILWAY VEHICLES, UNIVERSITY POLITEHNICA OF BUCHAREST, ROMANIA
ABSTRACT: The paper herein deals with the response of an infinite wire on viscoelastic support under moving harmonic load in order to point out the basic features of the overhead contact wire system (catenary). To this end, the Green’s function method is applied. The wire response under a stationary harmonic load is similar to the one of the system with a single degree of freedom, excepting the phase resonance. When the harmonic load moves at sub-critical velocities, the resonance frequency decreases and the wire response becomes higher. At the over-critical velocities, the elastic waves do not propagate in front of the harmonic load. KEYWORDS: catenary, wire, moving load, Green’s function, receptance
INTRODUCTION For the high speed trains, the pantograph-catenary system is critical for the stable current collection. Indeed, when the train velocity increases, the variation in contact force at the pantograph-catenary interface also increases and many undesirable effects occur: loss of contact, arcing and wear [1, 2]. The pantograph-catenary interaction has been intensively studied in the last 40 years once the trains speed has much increased [3–5]. From mechanical view point, the interaction between a moving pantograph and catenary is a part of the field of the classical ‘moving load problem’ [6]. In fact, such problems deal with the vibration of a moving sub-system on an elastic structure. Prior to solve this question, it is interesting to highlight the structure’s response to a moving load [7, 8]. Many theoretical models of the catenary take into consideration an infinite uniform wire on viscoelastic support (Winkler support). This model is simpler because the influence of the elasticity variation due to the supports and hangers is neglected. The results derived from this model are basic and they can be used for a comparison, as did A. Metrikine [7] in order to highlight the non-linear effect brought about by the hangers. In this paper, the response of an infinite wire on viscoelastic support due to a harmonic moving load is analyzed using the Green’s functions method. This method has been successfully applied by the author to investigate the response of both ballasted and slab track under moving loads [9, 10]. THE MECHANICAL MODEL It considers the case a simple catenary system (Figure 1), consisting of the equidistant supporters (1), the cable arms (2), the messenger wire (3), the hangers
(4) and the wire (5). Both messenger and contact wires are stressed. Further, the simplest model of catenary will be considered, namely an infinite wire on a continuous elastic support (fig 2). The catenary wire has the linear mass m and it is tensed by the force T. The elastic support contains elastic and of damping elements with linear characteristics, uniformly distributed along the catenary. A harmonic force of amplitude P and angular frequency � acts upon the wire and moves at a constant speed V.
Figure 1. Simple catenary system: 1. supporter; 2. steady
arm; 3. messenger wire; 4. hanger; 5. contact wire.
Figure 2. Mechanical model of the catenary system

ACTA TECHNICA CORVINIENSIS – Bulletin of Engineering
2013. Fascicule 2 [April–June] 36
The wire movement is reported to the fixed system Oxz. Also, a moving system attaches against the force O1x1z with
1xVtx += (1) The wire motion equation reported to the fixed referential is
)(cos2
2
2
2
VtxtPxwTkw
twa
twm −δω=
∂∂
−+∂∂
+∂∂ , (2)
where k is the elastic constant, and a – the damping constant of the continuous elastic support. Also, the boundary conditions have to be considered
0lim =∞→−
wVtx
. (3)
Actually, the steady state behaviour is interesting and due to that, the change of variable (1) is recommended, where the motion is reported to the moving referential. Practically, the following relations will be applied
n
n
n
n
xx 1∂∂
→∂∂ ,
n
n
n
xV
tt ⎟⎟⎠
⎞⎜⎜⎝
⎛∂∂
−∂∂
→∂∂
1
. (4)
The equation of motion (2) and the boundary conditions (3) become
2)(1
2
12
1
22
txwmV
xwaV
xwTmV +
∂∂∂
−∂∂
−∂∂
−
)(cos 12
2
xtPtwm
twakw δω=
∂∂
+∂∂
++ (5)
0lim1
=→∞
wx
. (6)
Considering the steady state harmonic behaviour, the complex variables
texwtxw ω= i11 )(),( , tt ePeePtP ωω == ii0i)( (7)
have to verify the following equation
ddi)2(
dd)(
12
1
22
xwmaV
xwTmV +ω+−−
)()i( 12 xPwamk δ=ω+ω−+ (8)
and the boundary conditions 0lim
1
=∞→
wx
. (9)
To solve the problem defined by the equation (8) and the boundary conditions (9), the Green’s functions method may be applied [11]. In fact, the solution is given as
)0,(d)(),()( 111 xGPPxGxw =ξξδξ= ∫∞
∞−
, (10)
where G(x1, ξ) is the Green’s function. This function represents the wire response in the x1 section of the moving reference frame, due to a unit harmonic force applied in the � section of the same moving reference frame. It has to be observed the fact that the wire response is defined by the Green’s function and this function is the receptance. The Green’s function can be built as a linear combination of the eigenfunctions of the differential operator of the equation (8). To find this function, the starting point is the homogenous equation
ddi)2(
dd)(
12
1
22 +ω+−−
xwmaV
xwTmV
0)i( 2 =ω+ω−+ wamk (11)
and its solution 1)( 1
xAexw λ= . (12) Then, the characteristic equation is obtained
0ii)2()( 222 =ω+ω−+λω+−λ− amkmaVTmV (13) After some calculations, this equation takes the following form
0i2)i(2)( 022
00222 =ωζω+ω−ω+λω+ζω−λ− VcV (14)
where
mTc
mk
mka
==ω=ζ ,,2
20 (15)
The solutions of the characteristic equation represent the eigenvalues
2,10
2,1 μ⋅ω
=λc
(16)
where 1
i2)1(1)i(2
222
2,1 −αΩζ+ζ−α−Ω−±Ω+ζα
=μ (17)
with cV
=α , 0ω
ω=Ω . (18)
There are two cases, the so-called sub-critical and overcritical cases. 1. The sub-critical case (α < 1) – the force velocity is smaller than the velocity of the elastic wave in the contact wire; the critical velocity has value of c. In this case, the eigenvalues real parts have opposite signs
,0Re 1 <λ .0Re 2 >λ (19) In fact, the Green’s function G(x1, ξ) has two forms satisfying the boundary conditions
12),( 1xeAxG λ−− =ξ for ξ<<∞− 1x (20)
11),( 1xeAxG λ++ =ξ for ∞<<ξ 1x ,
where −A and +A depend on the ξ variable. These functions will be calculated using both continuity and jump conditions. The Green’s function has to be continuous in x1 = ξ
ξλ+ξλ− = eAeA 12 . (21) Its derivation in respect to x1 has a jump in x1 = ξ
111),0(),0(
211 −α
=∂
ξ−ξ∂−
∂ξ+ξ∂ −+
TxG
xG (22)
respectively
111
22121
−α=λ−λ ξλ−ξλ+
TeAeA . (23)
Upon solving the equations (21) and (23), it is obtained
)1)((1
221
2
−αμ−μ=
ξμ−
−Tk
ekT
A , )1)((
12
21
1
−αμ−μ=
ξμ−
+Tk
ekT
A (24)
and then, the Green’s function
)1)((1),( 2
21
)(
1
12
−αμ−μ=ξ
ξ−μ
−
xTk
ekT
xG for ξ<<∞− 1x (25)

ACTA TECHNICA CORVINIENSIS – Bulletin of Engineering
2013. Fascicule 2 [April–June] 37
)1)((1),( 2
21
)(
1
11
−αμ−μ=ξ
ξ−μ
+
xTk
ekT
xG for ∞<<ξ 1x .
2. The overcritical case (α>1) represents the situation when the harmonic force travels at a higher speed than the wave propagation speed through the contact wire. In this case, the real part of both eigenvalues has positive sign
0Re 2,1 >λ . (26) The Green’s function takes the following forms
1211211 ),( xx eAeAxG λλ− +=ξ for ξ<<∞− 1x (27)
0),( 1 =ξ+ xG for ∞<<ξ 1x , where A1 and A2 depend also on ξ. The continuity condition of the function and the one of the derivate jump lead to the following equations
02121 =+ ξλξλ eAeA (28)
111
2221121
−α−=λ+λ ξλξλ
TeAeA .
Solving the equations (28), it obtains
)1)((1
221
2,1
2,1
−αμ−μ=
ξμ−Tk
ekT
A m . (29)
Finally, the Green’s function can be written as
)1)((1),( 2
21
)()(
1
1112
−αμ−μ−
=ξξ−μξ−μ
−
xTkx
Tk
eekT
xG (30)
for ξ<<∞− 1x
0),( 1 =ξ+ xG for ∞<<ξ 1x . The latter can be also written as
)()1)((
1),( 1221
)()(
1
1112
xHeekT
xGx
Tkx
Tk
−ξ−αμ−μ
−=ξ
ξ−μξ−μ
(31)
where H(.) is Heaviside’s unit step function. Equation (31) shows the fact that in front of the moving harmonic load the wire is not perturbed by the elastic waves. NUMERICAL APPLICATION Further on, using the above method based on the Green’s function, the results of the numerical simulation derived from a particular wire on viscoelastic support are presented. The following data have been considered [7]: m=1.1 kg/m, T=15 kN, k=0.4 kN/m2 and a=0.5 Ns/m2. In fact, the natural frequency of the wire on viscoelastic support is 3 Hz, the damping degree - 0,012 and the wave propagation speed – 117 m/s. Figure 3 shows the wire receptance at the point of the stationary unit harmonic force (α = 0) versus the relative angular frequency (Ω = ω/ω0). Three values of the damping degree are considered. As it can be observed, the wire response has a peak similar to the one of a system with single degree of freedom. However, the phase resonance occurs for the π/4 value instead of π/2. Increasing the damping, the receptance becomes lower around the resonance frequency. Figure 4 shows the influence of the speed of the moving harmonic load on the receptance of the wire at the point of the unit harmonic force. Only the
reference value of the damping degree is taken into account (ζ = 0,012). Actually, only the range of the sub-critical speeds is considered in this simulation. It can be seen that by increasing the speed of moving harmonic load, the resonance frequency of the wire decreases. In addition, the receptance of the wire increases around resonance.
Figure 3. Wire response due to a stationary harmonic force:
(a) receptance modulus; (b) recepance phase.
Figure 4. Influence of the speed on the wire response
Figure 5. Cross receptance of the wire

ACTA TECHNICA CORVINIENSIS – Bulletin of Engineering
2013. Fascicule 2 [April–June] 38
Figure 5 presents the cross-receptance of the wire for both sub-critical (α = 0.6) and overcritical velocities (α = 1.2). The angular frequency of the moving harmonic load corresponds to Ω = 0.8. At sub-critical velocity, the elastic waves of the wire are propagating waves, meanwhile at the overcritical velocity, the wire experiences standing waves behind moving load. CONCLUSIONS In this paper the dynamic behaviour of an infinite wire on visco-elastic support due to a moving harmonic load is studied. To this end, the Green’s functions method has been applied. There are two cases, the sub-critical one, when the force velocity is lower than the critical velocity (the elastic wave velocity) and the over-critical one, when the velocity of the force is higher than the critical velocity. The wire response under a stationary harmonic load is similar to the one of the system with a single degree of freedom, excepting the phase resonance. When the harmonic load moves at sub-critical velocities, the resonance frequency decreases and the wire response becomes higher. Also, the propagating waves travel at both ends of the wire. At the overcritical velocities, the wire has only standing waves behind moving harmonic load. Further research will extend the application of this method (Green’s functions method) to the case of the pantograph-catenary interaction. REFERENCES [1.] G. Poetsch et al. 1997, Pantograph – catenary
dynamics and control, Vehicle System Dynamics 28 159-195.
[2.] G. Bucca, A. Collina, 2009, A procedure for the wear prediction of collector strip and contact wire in pantograph–catenary system, Wear 266, 46–59.
[3.] T. X. Wu, M. J. Brennan 1998, Basic Analytical Study of Pantograph-catenary System Dynamics, Vehicle System Dynamics, 30 443-456.
[4.] J.-W. Kim et al. 2007, State sensitivity analysis of the pantograph system for a high-speed rail vehicle considering span length and static uplift force, Journal of Sound and Vibration 303, 405-427.
[5.] O. Lopez-Garcia, A. Carnicero, J.L. Marono, 2007. Influence of stiffness and contact modelling on catenary–pantograph system dynamics, Journal of Sound and Vibration 303, 405-427.
[6.] L. Fryba, 1972, Vibration of Solids and Structures under Moving Loads, Noordhoff International, Groningen.
[7.] A. V. Metrikine, 2004, Steady state response of an infinite string on a non-linear visco-elastic foundation to moving point loads, Journal of Sound and Vibration 272, 1033-1046.
[8.] A.V. Metrikine, A. L. Bosch, 2006, Dynamic response of a two-level catenary to a moving load, Journal of Sound and Vibration 292, 676-693.
[9.] T. Mazilu, 2010, Application of Green’s functions in analysis of the response of an infinite homogenous structure to moving load, U.P.B. Scientific Bulletin, Series A, 72, 139-152.
[10.] T. Mazilu, 2010, New method for calculating response of a periodic structure due to moving loads, Proceedings of the Romanian Academy, Series A 11, 340-346.
[11.] T. Mazilu, 2008, Wheel – Rail Vibrations (in Romanian), Matrixrom, Bucharest.
ACTA TECHNICA CORVINIENSIS – BULLETIN of ENGINEERING
ISSN: 2067-3809 [CD-Rom, online]
copyright © UNIVERSITY POLITEHNICA TIMISOARA, FACULTY OF ENGINEERING HUNEDOARA,
5, REVOLUTIEI, 331128, HUNEDOARA, ROMANIA http://acta.fih.upt.ro

© copyright FACULTY of ENGINEERING ‐ HUNEDOARA, ROMANIA 39
1. Abdelmajid Sadiki LAMARI, 2. Anass El FATTOUH, 3. Salah Eddine El QOUATLI, 4 Rachida NAJIH, 5. Abdelilah CHTAINI
ELECTROCHEMICAL DETECTION OF ASCORBIC ACID USING A POLYMER MODIFIED CARBON PASTE ELECTRODE
1-5. EQUIPE D’ELECTROCHIMIE MOLECULAIRE ET MATERIAUX INORGANIQUES, FACULTE DES SCIENCES ET TECHNIQUES DE BENI MELLAL, UNIVERSITE SULTAN MOLUAY SLIMANE, BP : 523, BENI MELLAL, MAROCCO
ABSTRACT: Ascorbic acid (Vitamin C) is a water soluble organic compound that participates in many biological processes. This paper reports the synthesis of polymer modified carbon paste electrode and its application for the electrochemical detection of ascorbic acid (AA). The cyclic voltammetry results obtained corrobate with square wave voltammetry. The influence of variables such the concentration of ascorbic acid adsorbed onto polymer, and the pH of solution were tested. The capacity of prepared electrode (P-CPE) for selective detection of AA was confirmed in a sufficient amount of ascorbic acid. The observed linear range for the determination of AA concentration was from 0.2 mM to 9 mM. The detection limit was estimated to be 5. 48 mM. KEYWORDS: Ascorbic acid; Carbon paste electrode; Cyclic voltammetry; Electrochemical detection
INTRODUCTION Ascorbic acid AA (vitamin C) is a water soluble organic compound involved in many biological processes. AA is used in large scale as an antioxidant in food, animal feed, beverages, pharmaceutical formulations and cosmetic applications. It is also important in helping to produce collagen, a protein needed in the development and maintenance of bones, cartilage, joint limings, skin, teeth, gums and blood vessels [1 – 3]. Due to the above importance of AA, its determination in their solution is more important. Many analytical techniques including sensors and biosensors [4 – 6] have been suggested for a detection of ascorbic acid in very varied types of samples. Other methods, based on the most commontly employed physico-chemical methods for identification of AA such high performance liquid chromatography [7-9] or capillary electrophoresis [10-13]. Investigations aimed at the development of modern analytical techniques for AA determination are directed towards increasing their sensitivity, specificity, simplicity and rapidity [14-15]. Electrochemical detection is an attractive alternative method for detection of electroactive species, because of its inherent advantages of simplicity, ease of miniaturization, high sensitivity and relatively low cost. In this paper, we describe the electrochemical analysis of ascorbic acid on a polymer modified carbon paste electrode. The electrochemical characterization of adsorbed electroactive AA was evaluated using cyclic voltammetric and square wave voltammetric (SWV) analysis.
EXPERIMENTAL. Reagents and instrumentation All chemicals were of analytical grade and used without further purification. Na2SO4, KOH, eugenol and ascorbic acid were purcharged form Fluka. Carbon powder (Carbone, Lorraine, ref. 9900, French) was used for the preparation of electrode. All solutions were prepared with doubly distilled water. Preparation of CPE Substrates of commercial stainless steel metal 1 x 1 x 0.1 cm3 in size were grinded, and cleaned in pure acetone and distilled water. An anodic oxidation system was composed of anode and cathode plates of steel, electrolyte of carbon solution contained in glass chamber and an extended range direct current (DC) power supply system. Substrates of stainless steel metal were fixed on the anode using steel wire and immersed in H2SO4 solution for 5 min to dissolve the air-formed oxide film on the surface. Then, they were immersed in electrolyte of carbon gel contained glass chamber, and subjected to anodic oxidation by applying DC for 72h at room temperature. The anodic oxidation was processed at 25 V. Apparatus Voltammetric experiments were investigated with a potentiostat (model PGSTAT 100,Eco Chemie B.V., The Netherlands), equipped with a three electrode system mounted on cell. Working electrode was polymer modified carbon paste electrode, the counter electrode was a platinum plate and SCE served as reference. The pH-meter (Radiometer Copenhagen, PHM210, Tacussel, French) was used for adjusting pH values.

ACTA TECHNICA CORVINIENSIS – Bulletin of Engineering
2013. Fascicule 2 [April–June] 40
RESULTS AND DISCUSSION. Electrochemical polymerization of eugenol Figure 1 shows the consecutive cyclic voltammograms (CVs) of graphite carbon electrode in 0.1 M KOH solution containing 4 mM eugenol. On the first anodic scan an oxidation peak was observed at -0.2 V which corresponds to the oxidation of primary hydroxyldthe group of monomers [16]. This peak disappears from the second cycle, this behavior indicates the rapid deposition of a non-conductive polymer to the electrode surface. However, when the potential scan is extended towards positive values is observed a second peak at about 0.5 V. Authors [17], in a study of the same molecule on a glass electrode, attributed the first peak in the deposition of a polymer on the electrode surface, the second peak is probably due to the phenomenon degradation / restriction of this polymer. Figure 3 shows the SEM images of eugenol polymer coated electrode which indicated that thin film layer was covered the surface.
Figure 1. Cyclic voltammograms of the eugenol film
on GC electrode from the electrolyte 0.1 M KOH solution containing 4 mM eugenol monomers.
Scan rate = 0.1 V/s. a- 1 st cycle, b- 20 th cycle
Figure 2. Cyclic voltammograms of the eugenol film
on GC electrode from the electrolyte 0.1 M KOH solution containing 4 mM eugenol monomers.
Scan rate = 0.1 V/s, first cycle Upon scan reversal a cathodic wave there are two reduction peaks, at – 0.4 v and 0.5 V, based on the results of El Qouatli and al [16], the major reversible couple (Ia / Ic) Fig. 2, followed by a irreversible peak IIa can be attributed to the following steps:
where P indicates the polymeric structure in which a groups 2-methoxy-phenol are stationary, the second peak IIIc is probably associated to the transition of trihydroxybenzene derivative formed during the polymerization from 4-allyl-1 ,2-quinone according to the reaction:
Figure 3. SEM image of eugenol polymer film
modified electrode Electrochemical detection of ascorbic acid The determination of AA concentration using eugenol polymer modified electrode was performed with cyclic and square wave voltammetry. Figure 4 shows the cyclic voltammogram of ascorbic acid in 0.1M Na2SO4 solution. One peak was observed during the negative scan, attributed to reduction of eugenol polymer. According to the literature [18], the absence of defined peak of ascorbic acid can be explained by the interaction between eugenol polymer film and AA. The formation of a complex of ascorbate concentration with the oxidized active site of polymer is expected followed by spontaneous of the resulting complex. [19-20]. The square wave voltammetric determination of a series of standards solutions of ascorbic acid was performed under the optimized working conditions. The results show that reduction peak current have a linear relationship with a concentration of AA in the range from 3 mM to 9 mM (Figures 5 and 6). The linear correlation coefficient is 0.9917. According to Miller and Miller [21] the standard deviation of the mean current (S.D.) measured for seven voltammograms of the blank solution in pure electrolytes was calculated from:

ACTA TECHNICA CORVINIENSIS – Bulletin of Engineering
2013. Fascicule 2 [April–June] 41
2j
n
0jj )I(i
2)(n1SD −−
= ∑=
where ij is the experimental value of the experiment number j and Ij is the corresponding recalculated value, at the same concentration using the regression line equation. The calculated S.D. was used in the determination of the detection limit (DL, 3 x S.D./slope) and the quantification limit (QL, 10 x S.D./slope). From these values, the detection and quantification limits were 12.4 x 10⁻⁸M and 9.6 x 10⁻⁶ M. The linear regression analysis gave
Y = 0.2 X – 0.437.
Figure 4. CVs of eugenol polymer/GC modified electrode
in pH 6.0, O.1M Na2SO4, [AA] = (a) 0 M, (b) 3mM, scan rate 100 mV/s
Figure 5. Square voltammograms at
eugenol polymer/GC modified electrode for different concentrations of ascorbic acid
Figure 6. Calibration curve for AA in Na2SO4
Effect of pH The effect of varying pH on the current response of eugenol polymer/GC modified electrode at constant ascorbic acid concentration (3 mM) is shown in Figures 7 and 8.
Figure 7. Effect of pH on SWV peak of 3 mM AA
in Na2SO4 0.1M
Figure 8. Square wave voltammograms of 3 mM AA
in 0.1 M Na2SO4 at different pH values
As can be seen, the peak current gradually increases with the increase of pH and reach a maximum value when the pH is 6.0. Further increase in the solution pH yields a gradual decrease in the AA peak current. As a result, a solution with pH 6.0 was used in the subsequent experiments. The peak current seem to be affected by the concentration of H+, suggesting that the oxidation of the AA includes some proton transfer processes. The current decreases significantly in higher pH value. CONCLUSIONS It was demonstrated here that eugenol polymer/GC modified electrode exhibits higher electrocatalytic activity towards ascorbic acid oxidation. The anodic peak of AA is not well defined but the cyclic voltammograms in negative wave gave significantly increased peak currents and a fast electron transfer process to AA. The obtained results revealed that determination of AA can be easily performed using the eugenol polymer film. The proposed methodology was successfully applied in quantifying ascorbic acid in electrolyte solution with very satisfactory recovery percentages values for the application of the analytic methods proposed. The sensitivity signal is proportional to the concentration value of AA.

ACTA TECHNICA CORVINIENSIS – Bulletin of Engineering
2013. Fascicule 2 [April–June] 42
REFERENCES [1.] Velisek, J.; Cejpek, K., Czech. J. Food Sci.
2007, 25, 49-64. [2.] Linster, C.L.; Van Schaftingen, E., Febs J. 2007,
274, 1-22. [3.] Davey, M.W.; Van Montagu, M.; Inze, D.;
Sanmartin, M.; Kanellis, A.; Smirnoff, N.; Benzie, I.J.J.; Strain, J.J.; Favell, D., J. Sci. Food Agric. 2000, 80, 825-860.
[4.] Noctor, G.; Foyer, C.H. Rev. Plant Physiol. Plant Molec. Biol. 1998, 49, 249-279.
[5.] Wang, Y.; Xu, H.; Zhang, J.M.; Li., Sensors 2008, 8, 2043-2081.
[6.] Yogeswaran, U.; Chen, S.M., Sensors 2008, 8, 290-313.
[7.] Behrens, W.A.; Madere,, Anal. Biochem. 1987, 165, 102-107.
[8.] Shakya, R.; Navarre, D.A., J. Agric. Food Chem. 2006, 54, 5253-5260.
[9.] Melendez-Martinez, A.J.; Vicario, I.M.; Heredia, F.J., Food Chem. 2007, 101, 177-184.
[10.] Wang, J.; Chatrathi, M.P.; Tian, B.M.; Polsky, R., Anal. Chem. 2000, 72, 2514-2518.
[11.] Davey, M.W.; Bauw, G.; VanMontagu., J.Chromatogr. B 1997, 697, 269-276.
[12.] Klejdus, B.; Petrlova, J.; Potesil, D.; Adam, V.; Mikelova, R.; Vacek, J.; Kizek, R.; Kuban, V., Anal. Chim. Acta 2004, 520, 57-67.
[13.] Wu, T.; Guan, Y.Q.; Ye, J.N., Food Chem. 2007, 100, 1573-1579.
[14.] Hansen P.D., Von Usedom A., New biosensors for environmental analysis, EXS 81, 1997.
[15.] Karube I., Yano K., Sasaki S., Nomura Y., Ikebukuro K., Ann. NY Acad. Sci., 1998, 13, p. 622-634.
[16.] S. El Qouatli, R. T. Ngono, R. Najih, A. Chtaini, ZAŠTITA MATERIJALA 52 (2011)4
[17.] Ciszewski A., Milezarek G., Electroanalysis 2001, 13, N°. 10.
[18.] Brazdˇziuviene, K., Jureviˇciute, I., Malinauskas, A., 2007. Electrochim. Acta 53,785-791
[19.] S. Ashok Kumar, Po-Hsun Lo, Shen-Ming Chen., Biosensors and Bioelectronics 24 (2008) 518–523
[20.] Bartlett, P.N.,Wallace, E.N.K., 2001. Phys. Chem. Chem. Phys. 3, 1491–1496
[21.] Miller J.C., Miller J.N., Analyst 113(1988)1351
ACTA TECHNICA CORVINIENSIS – BULLETIN of ENGINEERING
ISSN: 2067-3809 [CD-Rom, online]
copyright © UNIVERSITY POLITEHNICA TIMISOARA, FACULTY OF ENGINEERING HUNEDOARA,
5, REVOLUTIEI, 331128, HUNEDOARA, ROMANIA http://acta.fih.upt.ro

© copyright FACULTY of ENGINEERING ‐ HUNEDOARA, ROMANIA 43
1. Miroslav GOMBÁR
INSTALATION OF HIGH PRESSURE WATER PUMP FOR A WATER JET TECHNOLOGY – HIGH PRESSURE WATER PUMP IN NON-CONVENTIONAL TECHNOLOGIES
1. TECHNICAL UNIVERSITY OF KOSICE, FACULTY OF MANUFACTURING TECHNOLOGIES WITH A SEAT IN PRESOV, STUROVA 31, 080 01 PRESOV, SLOVAKIA
ABSTRACT: The technology water jet is complex hydrodynamic process at ultrahigh pressures, which can be characterized at present days as the area of jet technologies. The process alone requires the most effective and economical utilisation of energy of water jet. It directly is connected with the most convenient determination of production – technology parameters of jet fluid, according to respect of basic physical properties of fluid as a cutting medium and the respect of hydrodynamic rule. KEYWORDS: water jet, hydrodynamic process, ultrahigh pressures
INTRODUCTION A water jet cutting technology is a cold cutting process. It is used for an application by which is not possible to use a chipless machining, chip machining and thermal manufacturing technologies, because they provide unsatisfactory results because of theirs mechanical or physical properties. For prospective customers there are very interesting advantages of high pressure cutting process by the water jet technology compared with other possibilities of manufacturing. A basic equipment of water jet technology is a high pressure water pump. There is pressured a water on a laid out high pressure in the multiplier part which is powered by an oil pump wired in with electromotor. Power of high pressure water pump is determined according how much is possible to produce high pressure water for a minute. A water pressure is created in multiplier part on required laid out pressure. The multiplier, which is called pressure multiplier, works on principle where a piston surface of oil part is in proportion, for example 20:1 respectively above, to a piston surface which pressures water. The oil piston works with a pressure 200 bar and by that pressure on piston surface, which pressures water, is multiplied the pressure on piston surface, which pressures water, 20 - 30 times. There is an output water pressure 400 MPa, respectively 620 MPa. High pressure pump represents specific standard of reliability, its individual elements which subject to industry standards for hydrodynamic and hydro-abrasive using. On Figure 1 there is mentioned review of high pressure pump history of KMT Waterjet systems company.
SL-I SL-II
1971 1988 SL-III SL-IV
1990 1996
SL-V 30-100 Hp SL-V Classic
2004 2005
SL-V 150-200 Hp SL-V 60 Hp
2006 2008 Streamline PRO 60 Hp / 125 Hp

ACTA TECHNICA CORVINIENSIS – Bulletin of Engineering
2013. Fascicule 2 [April–June] 44
October 2008 (6.200 BAR)
Figure 1. High pressure water pump of KMT Waterjet systems company
CHARACTERISTIC OF HIGH PRESSURE PUMP The high pressure pump is equipped by two together operated (controlled) hydraulic multipliers, pressure accumulator, drive hydraulic rising pressure oil pump, electric star panel, control sensors, solenoids, control panel and low pressure water circuit with a filter. The high pressure water pump is situated to frame with dimensions: length - 197cm, width - 91 cm and height -144 cm. The high pressure system is properly built on a gutter box. All elements have a good accessibility at least from two sides for simplification of maintenance. Standard equipments of high pressure water pump: � system of low pressure water, � hydraulic system, � multiplier, � pressure accumulator, � recirculating system, � oil cooling system, � electric system, � separated water and oil gutter boxes. The maximal pressure of high pressure water is limited by a hydraulic safety valve. Pump is convenient for different requirements of production, for small or big areas too. High pressure multiplier has bipartite water piston, which is hung on oil piston which oscillates from one side to another and oppositely. High pressure water is conveyed from a multiplier or more multipliers, which parallel works, to pressure accumulator. Compress proportion is 20:1 with a maximal hydraulic pressure 214bar. Recirculating system, for cooling and filtration of oil, runs when a main electromotor runs too. The main functional properties of high pressure water pump are: � nominal pressure 4 150 bar (60 000 psi), � working pressure 3 800 bar (55 000 psi). INSTALLATION OF HIGH PRESSURE PUMP Installation - application, installation, running and working of high pressure pump, for example SL-IV 100hp, requires complex harmonization of all details of full system. During installation of high pressure pump there is needed to keep these rules: � Strictly to keep requirement on installation and
working of high pressure pump. � Safety procedure and practices must be kept
during installation, start working and during
normal working for maintenance and servicing of pump.
Duties of customers A decision about installation and working of equipment requires cooperation between a prospective buyer and a provider of high pressure pump. Department of provider services normally requires than the prospective buyer fulfilled the next tasks: � High pressure pump should be placed separately,
in specific distance from cutting table. � Provide for a required supply input power of
electric energy and to prevent electric power drops with central equipment disconnecting.
� Provide for a supply of required pressure air and to prevent drops of the supply of required pressure air by handle closed valve.
� Provide for relieving and fixing holders for high pressure tube conveyances.
� Provide for required a water inflow for cutting, inflow and outflow of cooling water and outflow of water after cutting by handle closed valves.
� Provide for interconnection of accumulating outflows for waste water removing.
Responsibilities of provider In the case if all duties of customer are fulfilled then responsibilities of provides will be following: � To guarantee, than interior layout of component
of workstation was according to project. � To guarantee, than electric energy was connected
according to project. � To guarantee, than conveyances for water and air
distribution was according to project. � To control the rightness of direction of
electromotor rotation or eventually correct to set it.
� To test of the electric connection between high pressure pump and cutting table.
� Based on verification, to determine maximal cutting pressure.
� To install and test high pressure conveyances system, from pump to cutting head.
� To realize standard test like the guarantee of installation quality of full system of equipments and all conveyances including the high pressures conveyances.
� To teach in service staff for service, maintenance and service reparation.
� In a protocol to finish the installation, running and working verification of high pressure pump with accessories and cutting head, including to teaching of service stuff for the service of high pressure pump, head and conveyances and their maintenance and service reparations.
Requirements for installation Requirement for installation of high pressure pump are influenced by following basic factors: � Environment: High pressure pump (e.g. SL-IV
100hp stationary) must be installed in the interior, at which conditions of normal environment must not go over minimal or maximal values.
� Anchoring: Pump, e.g. SL-IV 100hp, is fixed by own weight (approximately 1,4 t) without anchoring

ACTA TECHNICA CORVINIENSIS – Bulletin of Engineering
2013. Fascicule 2 [April–June] 45
even when there is not possible to move in consequence of oscillation of multiplier.
� Space: Space around high pressure pump should be minimal 900 mm (36 inches) of free area on all sides for the free movement of service stuff.
� Electric: Electric connection of high pressure pump must be in keeping with international and local norms. Pump has 24 vdc, control system and premises for negligible flow in the control panel.
Requirements for installation of tools system. High pressure tube coning and cutting processes Process for determination of total length of high pressure tube is following: At first there is needed to determine length of tube, distance between fitting according to Figure 2. Next there is added the effectual length two times according to Table 1. At last tube is cut on final length and sharp tube ends are removed. High pressure conveyances of piping and fitting, for using of pressure to 138 bar (60 000 psi), must be only new without using before. The conveyances can cause the component failure, damage, personal injury or death.
Tube length = L + 2EL
Figure 2. Dimensioning of high pressure piping Table 1. Effectual lengths of tube for connection creating
Diameter of high pressure tube (inch)
Effectual length (EL) mm (inch)
1/4“ 12.7 (0.50) 3/8“ 17.5 (0.69) 9/16“ 21.3 (0.84)
Dimensioning of cone and thread on high pressure tube Complex process of coning and thread cutting on end of tube, for creating connection is according to Figure 3, Table 2 and 3, by which coning and thread cutting is realized by tool on Figure 4.
Figure 3. Cone of high pressure tube Table 2. Cone and cutting dimensions
O.D. size mm (inch)
I.D. size mm
(inch)
D (max) mm
(inch)
L (max) mm
(inch)
Cutting NF-LH
6.35 (1/4“)
2.11 (0.083)
3.58 (0.141)
14.3 (0.562)
(1/4“ - 28)
9.52 (3/8“)
3.18 (0.125)
5.56 (0.219)
19.1 (0.750)
(3/8“ - 24)
14.27 (9/16“)
4.78 (0.188)
7.14 (0.281)
23.8 (0.938)
(9/16“ - 18)
Figure 4. Coning and threading tool
1 – Cutting handpiece; 2 – Cutting support; 3 – Moving female screw; 4 – Cutting blade;
5 – Fixative insert; 6 – Coat; 7 – Closing female screw Table 3. Sizes of high pressure conveyances
Tube size (inch) 1/4“ 3/8“ 9/16“
A mm (inch) 3.30 (0.13)
4.07 (0.16)
7.11 (0.28)
Cone tool (IR part) 10079556 10097418 10079663 Cutting tool (IR
part) 10079697 10097434 10097442
Coning process: � Coning tool is placed so that a lubricant could
flow through lubricant blades. � To set moving female screw and to place it
according to dimensions A. � Plug-in tube trought fixative insert to the end
conection of cutting blades and tighten the closing female screw than tube was closed again.
� To rotate moving female screw counterclockwise to the back cutting tools, outside of tube and and tighten the closing female screw by spanner.
� Cutting oil is needed to deposit through the open cone tool. There is good oil with high content of Sulphur. Oil is used during cutting.
� To rotate moving female screw in the clockwise until cutting blades do no hit on the tube end.
� To rotate cutting handpiece and moving female screw together in the clockwise so that cutting blades reduced only thin chip.
� To continue in rotation of cutting handpiece until moving female screw to hit bottom of coat, then to rotate cutting handpiece by higher rotational speeds until to hit cone coil.
� To unscrew the female screw and to reverse cutting support from cone tool. To release fixative insert, to move tube on the coat. In the case if it will be wide-spread approximately on 4 inches then to permit fixative insert.
Process of thread cutting: � To place cutting tool with suitable size on cone
end of tube, to use pressure on the start of cutting and to rotate the holder counterclockwise until the length of cutting thread is not the same as size according to cone and thread table.
High pressure end tube connection – normal connection This type of connection is for general applications, is called normal connection too, and where loading on tube is only form inside pressure reason. Process connection based on Figure 5 is following:

ACTA TECHNICA CORVINIENSIS – Bulletin of Engineering
2013. Fascicule 2 [April–June] 46
Figure 5. High pressure connection – normal
1. To shift closing female screw (2) on tube (1) according to figure, and to lubricate thread by high clean past. Plug-in thread hoop (3) on tube (1), unless one up-to two threads are visible between hoop and tube cone.
2. To lubricate outside thread of handpiece with high clean paste. To insert tube to fitting, plug-in handpiece screw and take through inch isolator.
3. To take through filling to the specified rotate moments according to table of norms of rotate moment.
High pressure end tube connection – antivibration connection If the tube is subject to vibrations, rotating, movement and both side loading (e.g. whipping tube), must be used this type of connection. In the case threads are lubricated like it was mentioned.
Figure 6. High pressure connection and antivibration
1 – tube; 2 – closing screw; 3 – thread hoop; 4 – fixative insert
There is important to secure suitable piping delivery and rail. Process of connection according to Figure 6, is following: 1. To shift closing screw (2) and fixative insert (4) on
tube (1) and thread hoop (3), unless one up-to two thread is visible between hoop and cone tube.
2. To lubricate outside threads of closing screw with high clean paste. To insert tube to the fitting, plug-in closing screw and finalization of inch isolator.
3. Based on table of suggested moment values in this area, finalization closed screw do the standard rotate moment.
REFERENCES [1.] KMEC, J., SOBOTOVÁ, L., BIČEJOVÁ, Ľ. Stupeň
ochrany krytom elektrických systémov v aplikáciách technológií vodného lúča - 2011. In: Transfer inovácií. Č. 19 (2011), s. 253-256. –ISSN 1337-7094 (in Slovak)
[2.] BIČEJOVÁ Ľ., Influence of abrasive lineness change on water jet technologic head of
vibrations origin. In: Scientific Papers : operation and diagnostics of machines and production systems operational states : vol. 3. - Luedenscheid : RAM-Verlag, 2010 P. 29-34. - ISBN 978-3-942303-04-0
[3.] BIČEJOVÁ, Ľ., FABIAN, S., KRENICKÝ, T. Analýza vplyvu zmeny reznej rýchlosti na vznik vibrácií pri delení materiálu technológiou AWJ = Analysis of variations in cutting-speed on the vibration generation during separation of material using technology of AWJ / Ľuba Bičejová, Stanislav Fabian, Tibor Krenický - 2009. In: ERIN 2009. - Ostrava : VŠB TU, 2009 pp. 1-5. - ISBN 9788024819822
[4.] FABIAN, S., KRENICKÝ, T., BIČEJOVÁ, Ľ., Vibrodiagnostic monitoring in technology of AWJ / Stanislav Fabian, Tibor Krenický, Ľuba Bičejová - 2008. In: Mechanical Engineering SI 2008. - Bratislava : STU, 2008 pp. 1-8. - ISBN 9788022729826
[5.] PAVLENKO, S., HAĽKO, J., MAŠČENIK, J., NOVÁKOVÁ, M., Navrhovanie súčastí strojov s podporou PC. Prešov: FVT TU, 2008. 347 p. ISBN 978-80-553-0166-2 (in Slovak)
[6.] KMEC, J., SOBOTOVÁ, L., Models of water jet dividing. In: Výrobné inžinierstvo 10/2 (2011), pp. 24-26. ISSN 1335-7972
[7.] KMEC, J. BIČEJOVÁ, Ľ. Factors influencing hydroerosion surface topography. In: Nonconventional Technologies Review No. 1 (2011), pp. 33-36. - ISSN 1454-3087
[8.] KMEC, J. BIČEJOVÁ, Ľ. Rozdelenie vodného lúča do dvoch rezacích hlavíc = Splitting of water-jet into two cutting heads. In: Operation and diagnostics of machines and production systems operational states. - Brno : Tribun EU, 2008 pp. 100-107. ISBN 9788073996345
[9.] NOVÁKOVÁ, M., PAVLENKO, S. Experimental determining of technological process parameters of thin sheet metal rotary shaping. In: Studia i materialy. Vol. 26-29, No. 1-2 (2010), pp. 2-7. ISSN 0860-7761
[10.] PAVLENKO, S., HAĽKO, J., MAŠČENIK, J., NOVÁKOVÁ, M. Navrhovanie súčastí strojov s podporou PC. FVT TU Prešov, 2008, 347 p., ISBN 978-80-553-0166-2 (in Slovak)
ACTA TECHNICA CORVINIENSIS – BULLETIN of ENGINEERING
ISSN: 2067-3809 [CD-Rom, online]
copyright © UNIVERSITY POLITEHNICA TIMISOARA, FACULTY OF ENGINEERING HUNEDOARA,
5, REVOLUTIEI, 331128, HUNEDOARA, ROMANIA http://acta.fih.upt.ro

© copyright FACULTY of ENGINEERING ‐ HUNEDOARA, ROMANIA 47
1.J.R. MARTY-DELGADO, 2.Y. BERNAL-AGUILAR, 3.M. RAMOS-DÍAZ
CONTROL OF CYLINDRICAL DEEP DRAWING USING GENETIC ALGORITHM
1-3. MECHANICAL ENGINEERING DEPARTMENT, CENTRAL UNIVERSITY “MARTA ABREU” DE LAS VILLAS, SANTA CLARA, VILLA CLARA, 50300, CUBA
ABSTRACT: The main purpose of this work is to develop an intellectualized control technique on the deep drawing of cylindrical cup made of 3003 ASTM aluminum using genetic algorithm. These control methods are employed in order to investigate the most significant parameters in sheet metal forming process such as drawing force, with a view of optimizing these parameters. The genetic algorithm is used for the optimization purpose to minimize the force of the deep drawing process. The results show that these combinations of control system can cover a wide range of both materials and influential forming parameters automatically. The results further confirm that the developed system is effective and valid alternative for quick responsible control system with high flexibility. KEYWORDS: optimization, deep drawing, genetic algorithm
INTRODUCTION The optimization of the deep drawing process is necessary to improve important industrial performance measures such as productivity and cost of goods manufactured. Deep drawing is among the most dominant technologies in modern industry. Such declaration is best confirmed by Aleksandrović [1] in relation to produced quantities, consumption and intensity of development of these processes during the last few decades. In deep drawing processes many variables affect the failure of stamping parts. Failure usually takes place in the form of wrinkling, earing and fracture. These take account of material properties, die design, and process parameters such as blank- holder force (BHF), friction conditions, the drawing ratio as well as maximal punch load (FDmax); the careful control of these parameters can delay the failure of the part. The coupling of simulation software’s with mathematical algorithms for optimizing the deep drawing process parameters is widely increasing in various fields of forming. It was demonstrated [2] that this kind of coupling reduces and improves the products’ cost. Compared to other numerical approximation techniques the finite element analysis (FEA) is presently the most frequently employed mathematical tool in the computer-aided analysis of sheet metal forming processes. Actually, if a complex sheet stamping process is investigated, there is the possibility to analyze it under particular hypotheses, which allow the application of mono-objectives optimization approaches by means of genetic algorithm. Techniques which are getting more attention in these days are neural network model and genetic algorithm. Genetic algorithm employs a random,
directed, search for locating the globally optimal solution. Like other methods, can be applied to problems for which it is not possible to have an analytical relationship for the objective function or to improve the solution to a local optimum, but also to explore a larger extension of the design space. D. Singh [3] explored the roles of die radius, punch radius, friction coefficients and drawing ratios for cylindrical products deep drawing parameter. This work developed an evolutionary neural network, specifically, error back propagation in collaboration with genetic algorithm. The output of the network is used to establish the best parameters to the uniform thickness in the product via the genetic algorithm. Actually, if a complex sheet stamping process is investigated, there is the possibility to analyze it under particular hypotheses, which allow the application of mono-objectives optimization approaches. When multi-objective optimization problems are developed within a sheet metal stamping design, some critical topics to be taken into account, especially conflicting objectives as referred in [4]. The maximal punch load (FDmax) is an important parameter in the deep drawing process. It is used to selection of the machine pressing, tools and restrains in the formation of wrinkles that can appear in the flange of the drawn part. There no exists a unique equation to calculate required drawing load for deep drawing, see for example [5-6], in general point of view, the drawing load for circular components for first draw can be obtained in two ways, either from theoretical equations based on plasticity theory, or by using empirical equations, the generalized expression to take the form:

ACTA TECHNICA CORVINIENSIS – Bulletin of Engineering
2013. Fascicule 2 [April–June] 48
)r,K,n,t,μ,BHF,h,σ(FD fm1max = (1)
where σ1 is the principal stress component; h represents the drawing height; t is the initial thickness of sheet; BHF is the blank holder force; μ the friction coefficient; n the strain hardening exponent; Kfm the strength coefficient (or strain-hardening coefficient), and r the normal anisotropy coefficient. Appropriate values of σ1 and t will be obtained by maximizing FDmax with respect to (effective stress), by writing:
0σd
dF= (2)
According to Abdalla S. Wifi and coworkers [7] in the optimization of the deep drawing process, five main lines of research are identified. This research work is according to the lines based on optimization of the maximal punch load to avoid wrinkling and fracture and the design parameters of the deep drawing mechanism including the die, the punch and the blank holder force. Tsu Hsiao-Chu [8] and coworkers reported the prediction of the deep drawing force and forming height in view of optimizing the values of the working variables involved in the process parameters. In this paper an intellectualized control technique on the deep drawing of cylindrical cup made of 3003 ASTM aluminum are employed in order to investigate the most significant parameters in sheet metal forming process such as drawing force, with a view of optimizing these parameters. The genetic algorithm is presented for the optimization purpose to minimize the force of the deep drawing process and to investigate the roles of other parameters. Genetic Algorithm is computerized search and optimization method based on the mechanics of natural genetics and natural selection. Genetic Algorithm imitates the principle of natural genetics and natural selection to constitute search and optimization procedures. A Genetic Algorithm simulates Darwinian Theory of evolution using highly parallel, mathematical algorithms that, transform a set (population) of mathematical objects into a new population, using operators such as, reproduction, mutation and crossover. Reproduction is usually the first operator applied on a population. The standard genetic algorithm an initial population of individuals is generated at random or heuristically. Every evolutionary step, known as a generation, the individuals in the current population are decoded and evaluated according to some predefined quality criterion, referred to as the fitness, or fitness function. To form a new population (the next generation), individuals are selected according to their fitness as following: 1. Choose parameters for genetic algorithm.
Initialize a random population of strings of size 1. Choose a maximum allowable generation number gn=gnmax .Set gn=0.
2. Evaluate each string in the population. 3. If gn> gn max or other termination criteria is
satisfied, terminate.
4. Perform reproduction on the population, crossover on random number of pairs and perform mutation.
5. Evaluate string in the new population. Set gn= gn+1 and go to step 3.
METHODOLOGY. Configuration and Dimensions of Tools and Workpiece Modeled in FEA To demonstrate the main objective of this work, for a practical problem with industry interest, a workpiece from National Home Industry is taken in to consideration in this paper. This workpiece is one of the component parts from a cooking home and was chosen because there were many problems with it, especially with critical flange areas and wrinkling formation. The workpiece has a high of h=190 mm and final inner diameter of d1=214 mm; the initial thickness is t=3.0 mm. To improve the material flow control a constant blank holder force is used. No wrinkles, scratches or cracks are allowed. The setup and geometry of tools used are given in Figure 1. The chemical composition of the studied material is given in Tab. (1).
Figure 1. The Configuration and Dimensions of Tools and
Workpiece Modeled in FEA The deep drawing of the sheet metal parts are governed by the limitations of wrinkling (buckling) and fracture. These limiting factors are measured by the drawability of the workpiece and is determined by the factor called limiting drawing ratio (LDR) defined by the ratio of the original material radius (D) to the final perfect product radius.
1dD
LDR = (3)
Table 1. Chemical composition (Mass Percent) of the Studied Material
Al Si Fe Cu Mn Zn 3003 96.75 0.62 0.71 0.05 1.2 0.11
The initial diameter of the blank is calculated as: )hd4d(D 1
21 += (4)
The main strains (effective strain) in the radial, circular and thickness directions, satisfying the condition of volume constancy:
0321 =++ ϕϕϕ (5)
At symmetric condition the forming of sheet metal occurs in plane stress state. Stress and strain can be defined by the joint solution of the equations of plasticity theory and the equation describing deformation hardening. It is convenient to present the dependence between the strength coefficient (or strain-hardening coefficient) and the effective strain the form of following function:
nfmK ϕσ = (6)
The strain-hardening exponent, strain-hardening coefficient and plastic strain ratio were obtained using a tensile test to construct the stress curve versus true strain. Based on this curve, the flow

ACTA TECHNICA CORVINIENSIS – Bulletin of Engineering
2013. Fascicule 2 [April–June] 49
curve is obtained that will supply the values of the strain-hardening exponent and strain-hardening coefficient. The plastic strain ratio (r) is obtained with the same test. The required blank holder pressure can be estimated from different empirical equation. Blank holder is forced with a pressure (PBH) to elude wrinkles. The pressure necessary to avoid wrinkling depends on the sheet material and the drawing ratio. If the contact area is ABH, then the load applied by the blank holder is, BHF = ABH*PBH. Schaeffer [9] has recommended the following equation:
( ) msd
LDRcPBH σ⎥⎦⎤
⎢⎣⎡ +−= − 133 005,0
110 (7)
The factor c ranges from 2 to 3; σm is the ultimate tensile strength of the sheet. Blank Holding Force can be calculated using Siebel equation too:
mtd
LDRPBH σ
⎥⎥⎦
⎤
⎢⎢⎣
⎡+⎟
⎠⎞
⎜⎝⎛ −=
1005,011025,0 1
2 (7.1)
The cracking load (Fcr) must always be larger than the maximum drawing load. It can be determined approximately by the equation:
m1cr σsdπF = (8) In practice the dimensions of the die clearance (UD), die radius (RD) and punch radius (RP) are often determined from the empirical equations suggested in technical literature:
)t10(02,0tU D += for aluminum (9) [ ] t)dD(50035,0R 1D -+= (10)
The die radius should be reduced for each subsequent redraw. It has been found to be good practice to reduce the die radius by a factor of 0.6 to 0.8 from one draw to the next. The punch radius RP should be larger than the die radius by a factor of 3-5. Selection of the Objective Function The selection of the right objective is the most critical aspect of optimization in drawing processes. With this information, the solution of the identification problem consists in the minimization of a function that measures the difference between theoretical predictions and experimental data for a given set of parameters. According to the input and output parameters in relation to optimization in deep drawing process the relation involving is presented in Figure 2.
Figure 2. Input and output parameters in relation with FEA
and optimization in deep drawing process In relation to Figure 2, optimization of process parameters such as blank holder force, punch load, friction coefficient, etc., can be accomplished based a on their degree of importance on the sheet metal forming characteristics. An optimal punch load eliminates wrinkling as well as tearing, the two major phenomena that cause failure in formed parts.
Wagner, G. [10], proposed the greatest difficulty in an optimization task is usually to select an appropriate criterion that meets all the requirements to dynamic or static optimization. In this paper the objective function is the drawing load provided during stamping, which is directly linked to the energy consumed by the forming press. The objective function can be formulated as an optimization problem in the following manner, minimize the maximum punch force in the cup deep drawing process. Regarding to figure 1 and 2, the maximum punch force, (FDmax), is determined as the maximum value obtained from the following equation:
⎥⎥⎦
⎤
⎢⎢⎣
⎡++=
pfm
nfm R
tKDtF
dDKetdF
22
ln1,1 21
12
1max πμ
πμπ
(11)
This equation considers the ideal deformation load, load component produced by friction between die and flange and between flange and blank holder, the load increase due to friction at the die radius, and the load necessary for bending the sheet around the die radius. PROBLEM FORMULATION The theory of genetic algorithm shows that the crossover operators as well as the selective operators have no obvious effect on evolution. At the same time, the mutation operators have great potentials for increasing the searching space. In the sheet metal forming, a genetic algorithm simulation program is usually written in C or C++ language. Due to the complicated algorithm, programming is a very heavy and complicated task, which often requires finding mistakes and restoring repeatedly. The programming precision simulation influences directly the precision of the genetic algorithm too. In this paper, the simulation programming was built using the MATLAB genetic algorithm tool box. Using stochastic methods, such as genetic algorithm, global minimum is obtained after hundreds of evaluations of the functions. The standard genetic algorithm takings, an initial population of individuals are generated at random or heuristically. Every evolutionary step, known as a generation, the individuals in the current population are decoded and evaluated according to boundaries, referred to as the fitness, or fitness function. In this case, the main selection criterion is the number of simulations needed to reach the minimum. The main objective is to reduce wrinkles development by optimizing the total force as a function of technological parameter. This optimal control problem can be stated as follows: Minimize: FDmax
Subject to: 07,2LDR84,1 ≤≤
3,0100
5,011025,0 12
≥⎥⎥⎦
⎤
⎢⎢⎣
⎡+⎟
⎠⎞
⎜⎝⎛ −= mt
dLDR
PBH σ
mrcr σsDπF ≤ The ranges of variables and parameters for Genetic Algorithm are selected as below in Tab. (2) and Tab. (3). Intelligent sheet metal forming, which includes four basic elements, real-time monitoring, identification, prediction and control, is a cross between control science and sheet metal forming theory.

ACTA TECHNICA CORVINIENSIS – Bulletin of Engineering
2013. Fascicule 2 [April–June] 50
Table 2: Ranges of variables selected for optimization Variable Lower Bound Upper Bound
µ 0.015 0.03 Rp (mm) 16,5 27,5 RD (mm) 3.5 5.5 PBH (MPa) 30 50 Kfm (MPa) 120 148
c 2 2
Table 3: Parameters for Genetic Algorithm Population type Double vector Population size 500
Selection Roulette
Mutation Use constraint dependent default
Crossover Scatteret Reproduction, crossover fraction 0.8
Elitism 5 RESULTS AND DISCUSSION The strain-hardening exponent, strain-hardening coefficient and plastic strain ratio were obtained using a tensile test to construct the stress curve versus true strain. The plastic strain ratio (r) is obtained with the same test. The control method development in this work used genetic algorithm and finite element methods in order to develop an intellectualized control technique on the deep drawing made of cylindrical cup made from 3003 ASTM aluminum. The ranges of variables and parameters for Genetic Algorithm are selected in consultation with company professionals. A maximum drawing load of 500 KN requires the geometry of the workpiece in the workshop. The optimization process was effected and the proposed values for a drawing load is 163.19 KN, µ=0.015, Kfm = 120.004 MPa, DR = 371.002 mm, BHF = 33 MPa y Rp = 27.5 mm. The appropriate capacity press can be selected by knowing the drawing load. Working with the presses of higher capacities may lead to many types of defects such as cracks and tearing. To verify the proposed solution a new simulation was carried. At this time RP = 23-24 (mm) and Kfm = 142-148 (MPa). The optimization process was effected and the proposed values for a drawing load is at this moment 195.43 KN, µ = 0.015, Kfm = 142.003 MPa, DR = 371.002 mm, BHF = 33 MPa y Rp = 24 mm. Optimization techniques provide a systematic method for determining the process parameters to achieve a specific objective. The present results show that the intelligent control in deep drawing of sheet metal can be successfully used in the field of optimization of parameters. Maximum drawing load and blank holder pressure are optimized which enables selection of proper capacity press. The other process parameters are also optimized using genetic algorithm and finite element methods. Punch load have a significant contribution on the product quality. Appropriate punch load and blank holder force evolved through a process results in controlling the thickness variations in a deep drawn part and thus the quality of the part. Therefore, the punch load criteria are chosen to objective function of 3003 ASTM aluminum in this study. CONCLUSIONS A method for the control of parameters in sheet metal using genetic algorithm and finite element methods has been presented and applied in the case
of cylindrical deep drawing. This method is based on the punch load as objective function criteria. The most important three process parameters were taken into consideration are the blank holder force, the die profile radius and the punch profile radius. The objective function to be minimized was a selection of the appropriate capacity of the press machine. Working with the presses of higher capacities may lead to many types of defects such as cracks and tearing. The main results are as follows: 1. The prediction scheme of the control of parameters in sheet metal was established based on genetic algorithm 2. The genetic algorithm prediction model was established, and the genetic algorithm structure and genetic algorithm parameters were designed. 3. A maximum drawing load of 500 KN requires the geometry of the workpiece in the workshop. The optimization process was effected and the proposed values for a drawing load is 163.19 KN. 4. There is 32.6 % reduction in the forming load. 5. Maximum drawing load is optimized which enables selection of proper capacity press. The other process parameters and geometry parameters are also take in to account. REFERENCES [1.] Aleksandrović, S. and Stefanović, M., "Significance and
Limitations of Variable Blank Holding Force Application in Deep Drawing Proces," Tribology in industry, 27, pp. 48-54, 2005.
[2.] Ayari, F., et al., "Parametric Finite Element Analysis of square cup deep drawing," Archives of Computational Materials Science and Surface, 1, pp. 106-111, 2009.
[3.] Singh, D., et al., "Identification of Optimum Parameters of Deep Drawing of a Cylindrical Workpiece using Neural Network and Genetic Algorithm," World Academy of Science, Engineering and Technology, 78, 2011.
[4.] Wifi, A. and Mosallam, A., "Some aspects of blank-holder force schemes in deep drawing process," Journal of Achievements in Materials and Manufacturing Engineering, 24, 315-323, 2007.
[5.] Monica, I., "Experimental Investigations and Numerical Simulation of the Semispherical Punch Process," Annals of Oradea University. Fascicle of Management and Technological Engineering, vol. XI, 2012.
[6.] Reddy, P. V. R. R., et al., "Parametric Studies on Wrinkling and Fracture Limits in Deep Drawing of Cylindrical Cup " International Journal of Emerging Technology and Advanced Engineering vol. 2, 2012.
[7.] Wifi, A. S., et al., "A Review of the Optimization Techniques Applied to the Deep Drawing Process " in 37th International Conference on Computers and Industrial Engineering Alexandria, Egypt, 2007. Year.
[8.] Hsiao-Chu, T., et al., "Experimental Optimization of Deep Drawing Using Response Surface Methodology," Applied Mechanics and Materials, 121-126, pp. 1495-1499, 2012.
[9.] Schaeffer, L., Ed., Conformação de Chapas Metálicas. Porto Alegre. Rio Grande do Sul. Brazil: Imprensa Livre Editora Ldta, 2004, pp. Pages. 2004
[10.] Wagner, G., "Optimization potentials at the different levels of planning discrete technological processes," in 4th International Doctoral Students Workshop on Logistics, Otto von Guericke University. Magdeburg, 2011, pp. 109-112. Year

© copyright FACULTY of ENGINEERING ‐ HUNEDOARA, ROMANIA 51
1. M. B. I. REAZ
ARTIFICIAL INTELLIGENCE TECHNIQUES FOR ADVANCED SMART HOME IMPLEMENTATION
1. DEPARTMENT OF ELECTRICAL, ELECTRONIC AND SYSTEMS ENGINEERING, UNIVERSITI KEBANGSAAN MALAYSIA 43600, UKM, BANGI, SELANGOR, MALAYSIA
ABSTRACT: Smart-home concept has been around for many years and played a very important part in the design and implementation of future houses. Early research focus on the control of home appliances but current trends are moving into a creation of self-thinking home. In the recent years many research projects were performed utilizing artificial intelligence tools and techniques. This article highlights research projects employing multi-agent system, action prediction, artificial neural network, fuzzy logic and reinforcement learning. It is found that the combination of tools and techniques are crucial for successful implementation. This article provides platform for future relative studies between different algorithms, architectures and serves as a reference point for developing more cutting edge smart home technologies. KEYWORDS: Smart home, multi-agent system, action prediction, artificial neural network, fuzzy logic, reinforcement learning
INTRODUCTION In the early years, smart home is equipped with special structured wiring to enable occupants to remotely control or program an array of automated home electronic devices by entering a single command. This provide convenient interface for homeowner to remotely switch appliances on or off, arm a home security system, control temperature gauges, control lighting, program an entertainment system or home theater, and carry out other related tasks [1]. The current research projects focus more on the creation of intelligent home, a home that is able to control and make decision on its own, which follow the guidelines set by occupants directly and indirectly. Due to this trend, the artificial intelligence (AI) is greatly used in the recent smart-home research. AI is the ability of a computer to perform tasks such as reasoning and learning that human intelligence is capable of doing. In this article we will give a detailed illustration of how AI techniques are being used in the latest smart home projects. MULTIAGENT SYSTEMS FOR SMART HOME A multiagent system (MAS) is a system composed of several agents, capable of speedy mutual interaction between them [2, 3]. This can be message passing or generating changes in their common environment. The agents can be autonomous entities e.g. robots or software agents. MAS can consist of human agents as well. MAS allows the sub problems of a constraint satisfaction problem to be subcontracted to different problem solving agents with their own interests and goals. Each agent in MAS has a set of goals and capabilities. The agent also consists of an intelligent
and reasoning unit. The responsibility of this particular unit is to implement a plan on how to use these capabilities in order to achieve the given goals. A multiagent architecture was developed by Jae Chul Moon and Soon in 2000, for intelligent home network services, which organize heterogeneous and distributed home devices effectively [4]. The architecture consists of several agent spaces that are interconnected to each other with very powerful and flexible model known as Tuple model, was proposed by Carriero and Gelertner in 1980’s, for supporting extremely dynamic communication and coordination patterns [5]. An agent autonomously handles a specific home device, a room-net or several other agents using the agent spaces and the space interconnect, in which status of all devices can be transparently accessed despite of the location of the agent. Due to the location transparency, an agent or a newly attached home device can easily get the information of another agent by taking or reading the information from the agent space as shown in Figure 1. The multi-agent architecture of Jae and Soon is very novel since it provides flexible communication between the agents with asynchronous stream channel of IEEE1394 using event-driven middleware. It supports data transfer rates of up to 400Mbps and 800Mbps in 1394a and 1394b respectively. The only limitation is that the architecture does not support mobility of agent, which is actually the limitation of the Tuple model. In 2002, Cheng-Fa Tsai and Hang-Chang Wu (2002) came out with another multiagent architecture for home network services named as MASSIHN [6]. The architecture uses Java as its programming language

ACTA TECHNICA CORVINIENSIS – Bulletin of Engineering
2013. Fascicule 2 [April–June] 52
which solves the problem of mobile agent in the previous architecture of Jae and Soon (2000) [4].
Figure 1. Overview of Jae and Soon System Architecture
Figure 2. MASS System Architecture Overview
The proposed architecture uses Extensive Markup Language (XML) as a control language. The MASSIHN of Cheng-Fa and Hang-Chang has six major components: message server, MAS space, proxy server, services, agents and MAS clients. These components perform various operations in the system. The mobile agent space system architecture and their relationships are illustrated in Figure 2. Particularly, each space in MASS can be considered as a distributed computing group. A message to the MASS can be sent by the message server. If they want to join the space, all of the MASS Places have to register at the message server. Experimental results showed that this design is much more efficient than the previous architecture of Jae and Soon (2000) [4]. In 2010, a multiagent system to track the user for task isolation was proposed by Alam et al [7]. The algorithm clusters the smart home events by isolating opposite status of home appliance [7]. ACTION PREDICTION FOR SMART HOME To adapt to the occupants and meet the goals of comfort and efficiency, an intelligent environment should be able to acquire and apply the knowledge about its occupants. These capabilities are based upon the effective prediction algorithms. Prediction is based on observations, experience, and scientific reasoning. Given the smart-home device usage pattern data, we can use this data to train the prediction algorithm to forecast the future action that a home inhabitant might perform. In 2003, Diane J. Cook, Michael Youngblood, Manfred Huber and Karthik Gopalratnam developed two learning algorithms as a part of the MAVHome smart home project [8]. The first algorithm predicts actions that the occupant will take in the home. The second one learns a policy to control the home. Given a prediction of inhabitant activities, MAVHome can decide whether or not to automate the daily activities, which includes switching on or off
particular device or activating the security system when the inhabitants are not in the house or improve the activity to meet the house goals. The smart-home inhabitants repeated usage of various devices in their daily activities leads to conclude that the sequence can be modeled as a stationary stochastic process. Diane et. al. used the Markov predictors based on LZ78 family of comparison in their algorithm. For prediction, the algorithm computes the probability of each action in the parsed sequence, and predicts the action with highest probability. The experimental results show that the algorithm predicts inhabitant’s actions very well. However, it is slow and it is limited to handle single inhabitant’s action prediction. Edwin O. Heierman and Diane J. Cook developed another prediction algorithm in 2003, based on a novel data-mining algorithm Episode Discovery (ED) [9]. Within a sequential data stream, the ED discovers behavior patterns. To improve home automation, a prediction algorithm of decision learner is provided by the corresponding filtered data and pattern knowledge. Additionally, incremental interactions are processed by the framework. This can be used in a real-time system also. By processing each event occurrence incrementally, maximal episodes are generated by the algorithm from the input sequence. The occurrences are maintained by an episode window. It is pruned when an occurrence is beyond the allowable window time frame for addition of a new event occurrence. Prior to pruning, the window contents are maximal for that particular window instance. To generate a maximal episode, the contents are used. Next, the algorithm constructs an initial collection of item sets, one for each maximal episode. For significance, additional item sets are generated so that the episode subsets of the maximal episodes can be evaluated. While ensuring item sets leading to significant episodes are retained, ED must prune the complete set of potential item sets in a tractable manner to avoid generating the power set of each maximal episode item set. This algorithm is very efficient and fast. ED can be utilized to improve the predictive accurateness of a home agent and to comprehend the nature of the activities occurring. In 2003, Sira Panduranga Rao and Diane J. Cook used Hidden Markov Model (HMM) for action prediction [10]. Hidden Markov models have been extensively used in various environments which include the location of the devices, device identifiers and speech recognition cluster. Traditional machine learning techniques such as memory-based learners, decision trees etc have difficulty in using historic information that is employed for classification to make sequential predictions. A portion of the history which is implicitly encoded by Markov models, offers an alternative representation. The algorithm identifies the activity which includes a set of actions. Using unsupervised learning, it discovers these tasks. Dividing the action sequence into subsequences is the first step. These are expected to be a part of the similar task. Given the different groups from the partitioning process, the algorithm clusters similar groups together as the first

ACTA TECHNICA CORVINIENSIS – Bulletin of Engineering
2013. Fascicule 2 [April–June] 53
step to form abstract task classes. Then it extracts meta-features describing the group as a whole. Information like the starting time and time duration of the group, the number of actions in the group, the locations visited and devices acted upon can be collected from each group. The information is kept as a partition and supplied to the clustering algorithm. In a HMM, the clusters attained from the clustering step as hidden states. Thus, the hidden states contain the similar features as the clusters. These are the number of actions in the cluster, time duration of set of actions in cluster, start time of actions in cluster, location of devices and device identifiers. Having this information the algorithm then precedes to HMM prediction process. The results show that this approach is very efficient in terms of speed and flexibility compared to other approaches. Another system was developed in 2004 by Lucian Vintan and Arpad Gellert, in which the system predicts the next movement of the home inhabitants using neural predictors [11]. The aim of the system is to improve the quality of ubiquitous systems through enhancing the context awareness of home appliances. The architecture of the system is based on multi-layer perception with back-propagation learning algorithm and a hidden layer as shown in Figure 3. To save computing cost, the rooms and the persons are binary codified. This is of particular interest for fast moving (real-time restrictions) applications or mobile (energy restrictions). Therefore, as a substitute of one-room-one-neuron encoding with complexity N, the system uses bit encoding with complexity log2N. The system can be trained statically and dynamically. In static training, the predictor is trained based on room history patterns which belong to the previous presented benchmarks (person room movements) before effective run-time prediction process. In dynamic training, the system learns online from the actual user activities. This system improves the quality of ubiquitous computing applications. They used two types of predictors: the local and global predictors. The local predictor monitors a single inhabitant that has a higher accuracy compared to the global predictor, which monitors more than one user.
Figure 3. The Multilayer perception used by the system of
Lucian Vintan and Arpad Gellert NEURAL NETWORK FOR SMART HOME A neural network is defined as an interconnected group of artificial or biological neurons. Artificial neural networks (ANN) refer to mechanical, electrical or computational simulations or models of biological neural networks [12]. The requirement for ‘smart’ devices in consumer electronics is growing for the last few years. The reason is the extensive utilization
of low-cost embedded electronics. This is also motivated by the requirement for systems which understand users to design an easy interface. Thus, it is enviable that electronic devices are able to deliberately sense, comprehend surroundings and adapt services according to contexts. Several works had been performed to implement ANN in smart home. In 1995, Marie Chan et al. developed a smart-home automation system for disabled and elderly people [13]. The system is developed using a smart multi-sensor system based on advanced telecommunication. To learn the home inhabitant’s behavior, the system uses ANN. The system monitors the inhabitants of the home using the smart sensors in real time. Figure 4 illustrates the concept used to model the system. It includes learning the habits of the old person and relies on it to arrive at a diagnosis in case of a change in his behavior.
Figure 4. The principle used to model the system
In 1995, Michael C. Mozer used artificial neural networks to develop a home. This programs itself by monitoring the desires and lifestyle of the occupants, learning to accommodate and anticipate their requirements [14]. The system is equipped with sensors that monitor the environment and generate a report at any given time. For each control domain lighting, air and water ventilation and heating, this architecture is replicated. The instant environmental state is supplied through a state transformation which computes statistics such as variances, maxima, minima and averages in a given temporal window. A state representation is the result which provides more information about the environment than the instantaneous values. The instantaneous state is also provided to an occupancy model. This determines whether or not it is occupied for each zone of the house usually corresponding to a room. Although, the occupancy model depends on motion detector signals, but includes rules that say “a zone remains occupied, even when there is no motion, unless there is motion in an adjacent zone that was previous unoccupied.” Thus, even when there is no motion, the occupancy model maintains occupancy status. Figure 5 illustrates the system architecture. The evaluation results show that the system is dynamic and very suitable for complex environment. The most recent system was developed in 2005 by Fei Zuo and Peter H. N. where a face recognition module is embedded into home devices such as music players, televisions and video. The system always observes its surroundings and captures active user presence [15]. Home devices tailor services such as selection of favorite music or TV programs for the individual user by automatic face identification.

ACTA TECHNICA CORVINIENSIS – Bulletin of Engineering
2013. Fascicule 2 [April–June] 54
Figure 5. Diagram illustrating the system architecture
Figure 6. The Face Recognition System Operation
Illustration A conceptual description of the prototype is given in figure 6. The system functions on live-feed video from embedded cameras. It performs the recognition close to real time. It can detect existing faces and tracks the located motions of faces from same user form a smooth trajectory for each frame. The detection of a ‘break’ of this trajectory can easily identify a new user. For accommodating varying face scale, pose, and position, the rest face images are selected for further processing as key samples. For normalization purposes, an accurate extraction of significant facial features is needed. The final face identification looks for a database of the reference faces and the ‘best-match’ is returned. The result of the proposed face recognition system has a comparatively unhindered operation environment. It also offers high processing effectiveness by utilizing low-cost hardware. FUZZY SYSTEM FOR SMART HOME Fuzzy Logic (FL) is a problem-solving control system methodology which lends it to implementing in systems starting from small, simple, embedded micro-controllers to large, networked, multi-channel workstation or PC based data acquisition and control systems. FL provides a conclusion based on imprecise, ambiguous, vague, noisy or missing input information. The main aim of home automation is to provide a convenient and efficient integration and inter-operation within the household appliances. The definition of linguistic rules is a suitable programming method for home automation systems that can be processed by a fuzzy-system. Based on this idea, in 1998 Harald J. Zainzinger developed a neuru- fuzzy controller [16]. The inhabitants are watched by the system at controlling their devices. The home system detects every action related to the correct appliance such as increasing the room temperature by switching on the heater. This event
changes the value of the existing control and is kept in a database that is user-specific. This gives the training-data for the neuro-fuzzy network optimization. The system is a hybrid neuro-fuzzy controller which is based on a generic fuzzy-perception [17]. By a reinforcement-learning algorithm, the system can learn fuzzy rules and sets. The adaptability of this system is the benefit of this implementation. This system also can be used to control other non-time critical applications, and not only limited to smart environment. In 2002, Hani Hagras, Graham Clarke, Martin Colley and Victor Callaghan proposed a smart-home automation system using a fuzzy Incremental Synchronous Learning (ISL) technique [18]. The aim of the system is to provide a non-intrusive, life-long, online method for learning personalized behavior and anticipatory adaptive control for physical environments. The nature of the envisaged target environments are short "initialization" and long "life-long" learning. Generally, a learning process would be non-intrusive within a building. The agent is an augmented behavior based architecture that utilizes a set of parallel Fuzzy Logic Controllers (FLC), each forming a behavior. The behaviors are fixed for an Intelligent Building (IB) which includes the Economy, Emergency and Safety behaviors. It can be dynamic and adjustable such as, Comfort behaviors (i.e. behaviors tailored to inhabitant's real behavior). Each dynamic FLC has a parameter which can be changed with the Rule Base (RB) for each behavior. Each behavior is implemented as a FLC. It uses a singleton fuzzifier, max-product composition, product inference, height defuzzification and triangular membership functions. The system consists of two modes: initialization mode and control mode. During the initialization mode the system needs to monitor the inhabitant’s behavior. After the initialization period, the ISL enters to a Control mode. In this mode, to guide its control of the room’s effectors, the rules learnt during the initialization period are used. Whenever the behavior of the user changes, there is a requirement to delete, add or modify rules in the rule base. ISL suspends environmental control and returns briefly to non-intrusive monitoring cycle during this event. It infers rule base changes essential to find out the new preferences of the users. This is transparent to the user, short cycled and distributed for the duration of the environment use. As such, it forms a life-long learning phase. Compare to other offline method, especially Mendel-Wang ANFlS approach, this method shows comparably better result [19]. However, this has got added benefits adaptation to new users, online and is able to particularize rather than generalize. In 2005, Faiyaz Doctor and Hani Hagras developed a life-long novel learning approach for intelligent agents which are embedded in intelligent environments [20]. The agents aim to implement vision of ambient intelligence in an intelligent inhabited environment (IIE). This was accomplished by providing ubiquitous computing intelligence in environment supporting the actions of users. Ambient

ACTA TECHNICA CORVINIENSIS – Bulletin of Engineering
2013. Fascicule 2 [April–June] 55
intelligence is a new information paradigm. In this paradigm, people are empowered through a digital environment which is “aware” of their context and presence, and is responsive, sensitive and adaptive to their needs. The proposed technique, which is termed as AOFIS, is an unsupervised data-driven one-pass approach for membership functions and extracting fuzzy rules from data to learn a fuzzy controller which will model behaviors of user. Over a time period, the data is collected by observing the user in the environment. AOFIS system is shown in figure 7. The experimental results show that the system learns the user particularized behavior and adjusted online for any changes in life-long learning mode in non-intrusive way. The system is very transparent and therefore, the user was not aware of the intelligently invisible responsive infrastructure of the environment.
Figure 7. A flow diagram of the five phases of AOFIS
REINFORCEMENT LEARNING FOR SMART HOME In machine learning, Reinforcement Learning is a class of problems in machine learning that postulate an agent exploring an environment where the agent perceives its current state and takes actions. The environment provides a reward in return which can be negative or positive. Over the course of the problem, reinforcement learning algorithms attempt to find a policy for maximizing cumulative reward for the agent. The concept of reinforcement learning generated interests of researchers in behavioral architecture design and its implementations. In 2002 Y. Wang, D. J. Cook, V. N. Papudesi and M. Huber, developed a user-guided reinforcement learning of robot assistive tasks for an intelligent environment [21]. A method of achieving variable autonomy was introduced by the system. This was accomplished by integrating autonomous control policies and user input in a Semi-Markov Decision Process (SMDP) model which is made on hybrid control architecture. From a set of reactive behavioral elements, overall behavior is derived which address local perturbations autonomously.
Figure 8. Overview of the control system
The system also employed Q-learning algorithm to serve as a method of training the robot. The training data is obtained from the user commands as shown in
figure 8. The experimental results show that this approach enables person assistive task robots to be used by general end-users. The control and interface approach of the system provide the robots of variable modes of autonomy. In 2004 Diane J. Cook, Sajal Das and Karthik Gopalratnam used reinforcement learning technique to develop a health monitoring system to be used for smart-home environment [22]. The goal of the system is to assist the individuals and elderly with disabilities by giving home capabilities to monitor health trends and assist in the occupant’s day-to-day activities at their homes. Predication techniques and reinforcement learning are both used to develop the system. The prediction portion of the system I used future forecasting of the inhabitants next actions sequence. On the other hand reinforcement learning technique is implemented using Q-learning algorithm that is used for decision-making process. The testing results show that the system successfully watches the inhabitant’s health and provide reminders concerned with the home inhabitant’s health. Another approach for home automation using reinforcement learning was achieved in 2004. C. Gatzoulis, W. Tang and T.R. Wan developed a virtual servant robot to serve a virtual human (the residence of the house) by doing everyday household works [23]. The robot is set to have no prior knowledge of its actual task initially. It will perform its actions arbitrarily. As such, the learning will be from the experience of doing the tasks. Actions which are suitable for the sub-states of the agent are designed in agent control architecture. A state value associated with each state indicates the performance of the learning of the robot. The robot gets positive reward for proper action through a reinforcement mechanism. It gets negative when the selected action does not improve the value of the state. By issuing orders and commands the virtual human interacts with the robot. The system architecture in figure 9 shows the modules and system architecture.
Figure 9. Overview of C. Gatzoulis, W. Tang
and T.R. Wan System Architecture The human state is the vector with the sub-states’ fuzzy values. Based on received reward, system control decides actions to be done. The system controller parameters are modified to improve performance by the update knowledge adaptation module. The system has been tested with two reinforcement learning algorithms based on Q-Learning (QL) [24] and ZLCS [25] with Fuzzy Inference Systems (FIS). Both the algorithms are derived from analogue computation and natural. Gatzoulis et. al. (2000) system uses fuzzy variables to depict an infinite number of diverse likely states of changeable level of importance [23].

ACTA TECHNICA CORVINIENSIS – Bulletin of Engineering
2013. Fascicule 2 [April–June] 56
CONCLUSIONS Based on the discussed research works we can conclude that the need for flexible communication between the agents is very important, especially when there is a shared resource to be used by the agents. We also realized that when designing such systems, a friendly user interface to control the system would be in the favor of the home inhabitants because these systems are very complex. From the illustration of the given works we can conclude that predicting future inhabitant’s device interaction is needed for home automation. On the other hand, since the prediction algorithms do not always provide 100% accuracy it should not be used alone for home automation. To avoid wrong prediction we can combine both prediction algorithms and reasoning techniques such as reinforcement-learning, this way we can make sure that unnecessary prediction outcomes are avoided. We can conclude from the discussed research work that the use of neural-networks significantly increases the automation of home appliances as well as a very user-friendly solution. We further think that such a user interface is very helpful; especially when it comes to people with disabilities, because there is not need for direct interaction with the system and also it is automatically configurable. We can conclude that FL is very suitable for heterogeneous home appliances, because fuzzy logic is very robust in headlining computing problems where we have many rules and devices to be addressed. We conclude that reinforcement learning is very straightforward to implement in smart-home automation application. The simplicity and robustness makes this method very desirable especially when dealing with situation where the agent may not be used. We suggest that future work could be to use a hardware prototype of multi-agent system to manage the smart-home environment. Hardware prototyping using FPGA has been used effectively in many areas and showed a great result. We believe that a multi-agent hardware prototype could be very useful for home automation, as it could provide faster speed and more efficient power consumption than software based. REFERENCES [1.] Jaszczyk P, Król D (2010). Updatable multi-
agent OSGi architecture for smart home system. Agent and Multi-Agent Systems: Technologies and Applications. 6071: 370-379.
[2.] Liu C, Liu F, Liu C, Wu H (2011). Multi-agent reinforcement learning based on K-means algorithm. Chinese Journal of Electronics. 20(3): 414-418.
[3.] Medjahed H, Istrate D, Boudy J, Dorizzi B (2009). Human activities of daily living recognition using fuzzy logic for elderly home monitoring. In: IEEE International Conference on Fuzzy Systems held at Jeju Island, South Korea.IEEE, pp 2001-2006.
[4.] Jae CM, Soon JK (2000). A Multi-Agent Architecture for Intelligent Home Network
Service Using Tuple Space Model. IEEEIEEE Transactions on Consumer Electronics. 46(3):791-794
[5.] Carrier N, Gelemter D (1989). Linda in Context. ACM Transactions on Communications. 1.32(4):444 – 458.
[6.] Cheng-Fa T, Hang-Chang W (2002). MASSIHN: a multi-agent architecture for intelligent home network service. IEEE Transactions on Consumer Electronics. 48(3): 505 – 514.
[7.] Alam MR, Reaz, MBI, Ali MAM, Samad SA, Hashim FH, Hamzah MK (2010). Human activity classification for smart home: A multiagent approach. In: IEEE Symposium on Industrial Electronics & Applications (ISIEA) held at Penang, Malaysia. IEEE, pp 511-514.
[8.] Cook DJ, Huber M, Gopalratnam K, Youngblood M (2003). Learning to Control a Smart Home Environment. Available from http://ranger.uta.edu/holder/courses/cse6362/pubs/Cook03.pdf
[9.] Heierman EO, Cook DJ (2003). Improving Home Automation by Discovering Regularly Occurring Device Usage Patterns. Third IEEE International Conference on Data Mining held at Washington DC. IEEE, pp 537- 540.
[10.] Sira PR, Cook DJ (2004). Identifying Tasks and Predicting Action in Smart Homes using Unlabeled Data. International Journal on Artificial Intelligence Tools. 13(1): 81-100.
[11.] Lucian V, Arpad G (2004). Person Movement Prediction Using Neural Networks. Proceedings of the KI2004 International Workshop on Modeling and Retrieval of Context (MRC 2004) held at Ulm, Germany. pp. 618-623.
[12.] Teoh CC and Tan CE (2010). A neural network approach towards reinforcing smart home security. In: 8th Asia-Pacific Symposium on Information and Telecommunication Technologies (APSITT), 2010 held at Kuching, Malaysia. IEEE, pp 1-5.
[13.] Chan M, Hariton C, Ringeard P, Campo E (1995). Smart house automation system for the elderly and the disabled. IEEE International Conference on Systems, Man and Cybernetics held at Vancouver, Canada. IEEE, 2:1586-1589.
[14.] Michael CM (1998). The Neural Network House: An Environment that Adapts to its Inhabitants. Proceedings of the American Association for Artificial Intelligence Spring Symposium on Intelligent Environments held at Menlo Park, CA. AAAI Press, pp. 110-114.
[15.] Fei Z, Peter HN (2005). Real-time Embedded Face Recognition for Smart Home. IEEE Transactions on Consumer Electronics. 51(1): 183-190.
[16.] Zainzinger HJ (1998). An Artificial Intelligence Based Tool for Home Automation Using MATLAB. Proceedings Tenth IEEE International Conference on Tools with Artificial Intelligence held at Taipei, Taiwan. IEEE, pp. 256-261.
[17.] Nauck D (1994). A Fuzzy Perceptron as a Generic Model for Neuro-Fuzzy Approaches.

ACTA TECHNICA CORVINIENSIS – Bulletin of Engineering
2013. Fascicule 2 [April–June] 57
Proceedings of the German GI-Workshop Fuzzy-Systeme held at Miinchen, Germancy.
[18.] Hagras H, Colley M, Callaghan V, Clarke G, Duman H, and Holmes A (2002). A Fuzzy Incremental Synchronous Learning Technique for Embedded-Agents Learning and Control in Intelligent Inhabited Environments. Proceedings of the IEEE International Conference on Fuzzy Systems held at Honolulu, Hawaii. IEEE, pp.139-145.
[19.] Mendel J, Wang L (1992). Generating Fuzzy Rules by Learning through Examples. IEEE Transactions on Systems, Man and Cybernetics. 22(6): 1414-1427.
[20.] Doctor F, Hagras H, Callaghan V (2005). A fuzzy embedded agent-based approach for realizing ambient intelligence in intelligent inhabited environments. 35(1): 55-65.
[21.] Wang Y, Huber M, Papudesi VN, Cook DJ (2003). User-Guided Reinforcement Learning of Robot Assistive Tasks for an Intelligent Environment. Proceedings of the IEEE/RJS International Conference on Intelligent Robots and Systems held at Las Vegas. IEEE,, 1:424- 429.
[22.] Sajal D and Cook DJ (2004). Health Monitoring in an Agent-Based Smart Home. Proceedings of the International Conference on Smart Homes and Health Telematics (ICOST) held at Singapore. 8(3):238- 247.
[23.] Gatzoulis C, Tang W, Wan TR (2004). Fuzzy Reinforcement Learning for an Evolving Virtual Servant Robot. IEEE International Workshop on Robot and Human Interactive Communication held at Kurashiki, Japan. IEEE, pp. 685- 690.
[24.] Sutton RS, Barto AG (1998). Reinforcement Learning: An Introduction. MIT Press, Cambridge, Chapter 6, pp 148.
[25.] Wilson SW (1994). ZCS: A Zeroth Level Classifier System. Evolutionary Computation. MIT Press. 2(1): 1-18.
ACTA TECHNICA CORVINIENSIS – BULLETIN of ENGINEERING
ISSN: 2067‐3809 [CD‐Rom, online]
copyright © UNIVERSITY POLITEHNICA TIMISOARA, FACULTY OF ENGINEERING HUNEDOARA,
5, REVOLUTIEI, 331128, HUNEDOARA, ROMANIA http://acta.fih.upt.ro

ACTA TECHNICA CORVINIENSIS – Bulletin of Engineering
© copyright FACULTY of ENGINEERING ‐ HUNEDOARA, ROMANIA
ACTA TECHNICA CORVINIENSIS – BULLETIN of ENGINEERING
ISSN: 2067-3809 [CD-Rom, online]
copyright © UNIVERSITY POLITEHNICA TIMISOARA, FACULTY OF ENGINEERING HUNEDOARA,
5, REVOLUTIEI, 331128, HUNEDOARA, ROMANIA http://acta.fih.upt.ro
ACTA TECHNICA CORVINIENSIS – BULLETIN of ENGINEERING
ISSN: 2067-3809 [CD-Rom, online]
copyright © UNIVERSITY POLITEHNICA TIMISOARA, FACULTY OF ENGINEERING HUNEDOARA,
5, REVOLUTIEI, 331128, HUNEDOARA, ROMANIA http://acta.fih.upt.ro

© copyright FACULTY of ENGINEERING ‐ HUNEDOARA, ROMANIA 59
1. Katarína TEPLICKÁ, 2. Jaroslava KÁDÁROVÁ
COMPARISON OF CALCULATION METHODS IN THE FORMATION OF PRODUCT PRICING
1. DEPARTMENT OF BUSINESS AND MANAGEMENT, FACULTY BERG, TECHNICAL UNIVERSITY KOŠICE, SLOVAKIA 2. DEPARTMENT OF ENGINEERING AND MANAGEMENT, MECHANICAL ENGINEERING FACULTY, TECHNICAL UNIVERSITY KOŠICE, SLOVAKIA
ABSTRACT: Creation of calculated price of products in small production firms is very different. Today is custom manufacturing very extended and therefore is creation of calculated price important. In praxis we will use some methods of calculation. Very often are used traditional methods by percentage but in small firms doing not use these methods correctly. Small manufacturers do not create calculated price on the ground of using modern instruments for creation of price and calculated price does not include all costs for custom manufacturing. In this article we point out that the creation of price is very important for small manufacturers because the price of product affects their business. Calculated price that it does not include all costs of product, it can reduce profit or it can bring insolvency in the firm. We can create the calculated price of competitive price, of customer price, of actual costs of order. We solved problem of calculated price of product in custom manufacturing of furniture because this firm has a big problem with liquidity and it can not to pay its debts. We will evaluate calculated price in custom manufacturing of furniture and we will evaluate influence of this calculated price on product and impact on expenses and profit. KEYWORDS: price, costs, product, profit, calculation
INTRODUCTION In praxis we will use some methods of calculation. Very often are used traditional methods by percentage but in small firms doing not use these methods correctly. Creation of calculated price is very different in custom manufacturing. Small businessmen define different valuation methods of products in production of product, they product by customer's requests. The price is important factor for customer and very important key factor for successful order. Custom manufacturing needs to change the creation of calculated price of products and the calculated price must accept competition and customer requests. [2, 3] We can create the calculated price of competitive price, of customer price, of actual costs of order. GOAL OF PROJECT We solved problem of calculated price of product in custom manufacturing of furniture because this firm has a big problem with liquidity and it can not to pay its debts. We will evaluate calculated price in custom manufacturing of furniture and we will evaluate influence of this calculated price on product and impact on expenses and profit. ANALYSIS OF PROJECT Costs of product create the base of sale price. The final sale price depends to relationships between seller and purchaser. This sale price depends on a lot of factors e.g. quantity of production, relationships
between purchasers, competitive offers. The sale price must create maximum economy profit. In praxis firm offers two ways of products: products produce by own production activities and products that are buying for order. This firm has custom manufacturing of furniture because it produces order by customer requests. This firm produces different products or little series of products. The calculated price determines the price of one order and all costs of this order. This firm creates calculated price from direct material, direct lower and manufacturing overhead by the index, that it was intended for base analyses from last years. This access deck minimal cost of order and it contain profit. Calculation of less difficult order determines by following formula:
Costs of direct material on order x index 2
Calculation of difficult order determines by following formula:
Costs of direct material on order x index 2,5
The firm buys products, that it does not produce and it sales this products by 20 % surcharge to final customer. This creation of calculated price is very easy and fast and it is her advantage. Disadvantage is fact that this calculated price does not contain all real costs of order and this price does not make provision for customers and price on

ACTA TECHNICA CORVINIENSIS – Bulletin of Engineering
2013. Fascicule 2 [April–June] 60
market and competitive price. This calculated price does not contain all the costs of order. This calculation method can present distorted fact for example price or effect of the firm. CHARACTERISTIC OF PROJECT We can calculate kitchen unit (figure 1) as one complete order. The price of this order is created by the firm method through index. Creation of the calculated price will be realize by direct costs of material and index 2,5 because this order is difficult to produce.
Figure 1: Kitchen unit – product of calculation
Table1: Calculation of kitchen unit Costs v €
Direct material 750,24 Different material 20% surcharge 863,92
Overhead charges k=2,5 1125,36 Costs of product 2739,52
Source: own source. Table 2: Calculation of direct material
Type of material Consumption Price in €/unit Final price
DTD 31 m2 8,96 277,76 ABS 22 x 2 mm, 80 m 0,66 53,11 ABS 42 x 2 mm 1,33 0
DTD 16 mm 2 m2 5,97 11,95 Stripe 4 m 0,66 2,66 Sololit 11,6 m 2,99 34,65
Work desk 2 ks 69,71 139,41 HPL stripe 1,5 m 0,83 1,24
Screen 82,98 0 Skirting legs
10 cm 28 ks 0,56 15,68
Suspender I 28 ks 0,52 14,56 Suspender II 0,56 0
Suspender 45˚ 4 ks 1,13 4,51 Suspender 1,26 0 Suspender 3,52 0 Set square 16 ks 0,27 4,25
Piston 9,63 0 Suspension 2,32 0
Skep 15 1 ks 63,07 63,07 Tandembox
45 cm 31,87 0
Tandembox 45 cm with 1
relingom 36,91 0
Tandem 50 cm 12,74646 0 Portable 45 cm 1 ks 1,26 1,26
DTD 10 m2 8,3 82,98 ABS 22 x 2 mm, 65 m 0,66 43,15
Total costs: 750,24
We prepared calculation to order – kitchen line by valid methodology that the firm uses. Direct material is presented in table 2, other material is presented in table 3, this material is higher about 20 % surcharge, because it is material, that the firm buy this material through provider, it is not material produced by firm. Overhead charges in the firm contain item of job costs that are inclusive activities as measuring, import, installation of kitchen link and other overheads charges consumption near production order. General calculated price of this product is 2739,52 € with application of method, that the firm use. This calculated price is price of order and together with value added tax creates final price for customer. This price consists of direct material 750,24 €, different material 863,92 € and overhead charges 1125,36 € (direct material x 2,5 + different material – it is costs of product and this price – direct material and different material is overhead charges).
Table 3: Calculation of different material Type of
different material
Amount Price per unit
Total costs in €
Dustbin 1 ks 150,2 150,2 Wash bowl
BLANCOTIPO 9E 1 ks 133 133 Tandembox 50
cm 4 ks 31,87 127,46 Tandembox 50
cm with 1 relingom 3 ks 28,60 85,80
Glass 0,9 m2 79,67 71,70 Sharping 6 ks 3,98 23,90
Clip anchor 12111 5 ks 4,98 24,90
Clip anchor 12939 21 ks 2,66 55,77
AVENTOS HKS 2 ks 23,6 47,20 Total costs: 719,93 Price with 20 % surcharge 863,92
APPLICATION OF JOB-ORDER METHOD OF CALCULATION Job-order method of calculation utilizes all firms that are oneself dealt by piece production or short-run production. It is a production process where the product is produced by individual customer's requests. This job-order method detects costs on concrete order, because every order has different requests. With application of job-order method of calculation we can obtain actual costs for calculated price of product. We can get relevant information about using methods and we can confirm correct methods of calculation when we compare method with index in the firm and job-order method of calculation. [1,7] Following job-order method of calculation, which is going out of items of costing formula, we are found actual costs to one order. Calculated price is 3017,48 €, what it introduces increasing about 277,96 € as that of method using index.

ACTA TECHNICA CORVINIENSIS – Bulletin of Engineering
2013. Fascicule 2 [April–June] 61
We can confirm the fact, that this method using index is not useful to calculate costs of product because it does not contain all information and items of calculated price. This calculated price does not contain item of value added tax and profit.
Table 4: Calculation of order by job-order method Structure of costs v €
Direct material 1614,16 Direct wage 286,00
Different direct costs 13,4% 38,32 Overhead charges 1 079,00
Total costs 3017,48
Steps of account calculated cost on order [6]: � Determination of direct material is located on
the ground of actual consumption of direct material that the order needs. For kitchen unit is direct material in table 2 and the different direct material in table 3 without 20 % surcharge.
� Determination of direct wage – Two employers will make order - carpenters. The work effective fond of one employer is 1920 hours by 40 hours for week. Total annual work plan for two employers will be 3 840 hours. The base pay for one employer is 370 € and daily work one employer 8 hours, his average wage for month is:
� Average wage = (total wage/ the number of time usage) / time usage for day = = ( ) hod/EUR20,28/21/370 =
� The order realized two employers together 130 hours by average wage 2,20 €/hours.
� Direct wage together = EUR,28620,2130 =× .
� Determination of different direct costs is formulated in percent of direct wage.
� Determination of overheads charges on order – we use total overheads charges from financial accounting of the firm. This value is 207 265 € in table 4.
� The account we make by overhead rate that is determined as ratio total costs to total time usage on order. The time usage for one year for all employers is 24 960 hours.
� Hour overhead rate= total overheads charges /
time usage for one year = hod/EUR30,824960207265
= .
Than costs of one order are 8,30 EUR/hour x 130 hour= 1079 €.
Table 5: Structure of overhead costs. Overhead charges v €
Leasing 24 852,- Depreciation 34 477,-
Expenditure of energy 7 800,- Overhead material 60 578,-
Fuelling 5 831,- Repair and maintenance 2 877,-
Lowers 17 280,- Insurance 26 250,-
Communications 3 923,- Other services 21 620,- Taxes and fees 1 777,-
Total costs 207 265,-
CONCLUSIONS We determined by comparing of method by index and job-order method, that the order of kitchen unit was produced with loss, because the calculated price by index method was lower as calculated price by job-order calculation about 277,96 €. The firm did not accept actual overhead charges by enumeration and than the calculated price was lower as actual calculated price. Calculated price 2739,52 € uncovered total cost and profit for product and index is defined incorrect.
Table 6: Comparation of calculated price
Structure of cost Calculation by index
Job-order calculation
Direct material 750,24 1614,16 Direct wage 286,00
Different direct costs 863,92 38,32 Overhead charges 1125,36 1 079,00
Total costs 2739,52 3017,48
We can state following comparison of calculation methods that it will be better for the firm to use job-order calculation and the calculation method by index is not convenient for the firm. Therefore we recommend for the firm to use job- order calculation for kitchen unit, because this calculated price contains all actual cost of product, to revaluate index of calculation, because this index must accept profit and all costs of product, to revalue system of cost evidence, to introduce new way of cost accounting, that it would allow more detail of individual expenses items, that it would allow new application of calculated price, to monitor prices on competitive market, demand and rate after products in furniture manufacturing. Pricing of product is very important part of managerial accounting in the firm. Every firm must prepare relevant calculation for product because the price of product is financial indicator of profit. By the pricing we must accept all costs of product and the price must be accepted by customer. The change of pricing is instrument for continual improvement in the firm. This is a new approach named Kaizen. [5] Kaizen use improvement in all area of the firm and the pricing is one possibility how to change the calculated price for customer and firm. ACKNOWLEDGEMENT This paper is prepared by the project VEGA number 1/0004/11: Proposal of implementation and evaluation methodology of Kaizen in small and middle businesses in Slovakia. REFERENCES [1.] FOLTÍNOVÁ, Alžbeta a kol.: Nákladový
controlling. Bratislava: SPRINT, 2007. 451 s. ISBN 978-80-89085-70-5.
[2.] JANOK, Michal: Nákladové a cenové kalkulácie. Bratislava: 1. vyd. MIKA Conzult, 2002. 228 s. ISBN 80-968504-2-3.
[3.] KOSTKOVÁ, Albína – LAJOŠ Branislav: Ako kalkulovať a rozpočtovať v podniku. Bratislava: 1.vyd. Ekonóm, 2008. 144 s. ISBN 978-80-225-2627-2.

ACTA TECHNICA CORVINIENSIS – Bulletin of Engineering
2013. Fascicule 2 [April–June] 62
[4.] RAJŇÁK, Milan a kol.: Cenové rozhodovanie. Bratislava: 3.vyd. SPRINT , 2007. 236 s. ISBN 978-80-89085-89-7.
[5.] ŠOLC Marek, SUTOOVÁ Andrea, MIKLOŠ Vojtech.: Trvalé zlepšovanie organizácie pomocou nástroja manažérstva kvality Kaizen. In: Kvalita a spoľahlivosť technických systémov: zborník vedeckých prác : 22. - 23.5.2012, Nitra. - Nitra : SPU, 2012 S. 103-108. ISBN 978-80-552-0798-8.
[6.] TEPLICKÁ, K.: Základy manažérskeho účtovníctva. Košice: 1.vyd. Edičné stredisko, Fakulta BERG TU v Košiciach, 2009. 99 s. ISBN 978-80-553-0277-5.
[7.] TUMPACH, M.: Manažérske a nákladové účtovníctvo. 1. vyd., Bratislava: Ekonómia, 2008. ISBN 978-80-8078-168-2
ACTA TECHNICA CORVINIENSIS – BULLETIN of ENGINEERING
ISSN: 2067‐3809 [CD‐Rom, online]
copyright © UNIVERSITY POLITEHNICA TIMISOARA, FACULTY OF ENGINEERING HUNEDOARA,
5, REVOLUTIEI, 331128, HUNEDOARA, ROMANIA http://acta.fih.upt.ro

© copyright FACULTY of ENGINEERING ‐ HUNEDOARA, ROMANIA 63
1. Maria Mikela CHATZIMICHAILIDOU, 2. Stefanos KATSAVOUNIS, 3. Chris CHATZOPOULOS, 4. Dusko LUKAC
MASS CUSTOMIZATION AS A PROJECT PORTFOLIO FOR PROJECT – ORIENTED ORGANIZATIONS
1. DEMOCRITUS UNIVERSITY OF THRACE, CIVIL ENGINEERING, XANTHI, GREECE 2,3. DEMOCRITUS UNIVERSITY OF THRACE, PRODUCTION ENGINEERING & MANAGEMENT, XANTHI, GREECE 4. RHEINISCHE FACHHOCHSCHULE, UNIVERSITY OF APPLIED SCIENCES, DEPARTMENT OF MECHATRONICS, COLOGNE, GERMANY
ABSTRACT: The idea of combining Mass Customization to the Project Management area stems from their common characteristic of uniqueness. Project Management aims to meet the organization objectives by manipulating production phases and limited resources. Being a temporary endeavour, with a defined beginning and end, it undertakes to meet unique goals and objectives, to bring about beneficial change or added value. On the other hand, Mass Customization serves the newly emerged requirements of customized and personalized products. To this extent, we are going to consider and examine Mass Customization as a strategic goal of a Project-oriented Organization, which runs collateral projects, in order to achieve its final purposes. For such a kind of organization, different customized products are considered as multiple projects of a portfolio. Together with the limited resources, an integrated environment is composed where priorities and hierarchical rules produce alternative configurations, which coexist. The paper proposes a dynamic framework, to assist decision makers in project coordination processes with realistic parameters. KEYWORDS: Mass Customization, Project Management, Project Portfolio, RCMPSP
INTRODUCTION Mass Customization seems to be one of the most interesting and flexible manufacturing systems that aims to meet customers’ needs under a much personalized matter. There is a great amount of companies, which adopt customization and personalization as their main strategy, aiming to overcome the ongoing and fierce economic crisis. Companies [1] with high openness and extroversion are, de facto, willing to pay the “forfeit” of maintaining their market share. Customer-centred approaches imply that industrial products or even services have to be considered as unique and of high, both economic and social, importance due to their complexity and demanding production processes. Each ultramodern piece is, beyond question, a project encountered by companies, on the grounds that it frequently involves research or design carefully planned to achieve a particular aim. It is also a temporary system coexisting with the permanent organization and the commonplace tasks and procedures. As commonplace tasks can be considered those comprising Mass Production but on the contrary, Mass Customization embodies temporary organization concept. Along these lines, there is a one-to-one relationship between products and projects, which, in sequence, leads to the Project Portfolio aspect. Regarding the fact that Mass Customization-friendly industries are
likely to produce more than one customized product, there is an emerging need of technically manipulating multi-project circumstances, which will possibly empower empirical management. To elaborate on Project Portfolio, it is “a set of all projects and programmes in a Project-oriented Organisation at a given point in time. It is a time-now-analysis. For organisations that have a large number of projects in their portfolio, it makes sense to have several portfolios for different types of projects” [2]. When an organization has to deal with a given number of projects, it predominantly encompasses obstacles concerning resource planning and time scheduling. As a matter of course, pertinent managers correspond to these critical points by using their experience, subjectivity and their instinct as well. Nevertheless, there is an acknowledged approach called Resource Constrained Multi-project Scheduling Problem (RCMPSP) dedicated to solve this kind of difficulties. Specifically, it involves the scheduling of activities of multiple separate projects, subject to precedence and shared resource constraints [3]. The aforementioned situation is an NP-Hard optimization problem having many applications in large constructions, complex production lines, and wide logistic chains and manufacturing Project Management.

ACTA TECHNICA CORVINIENSIS – Bulletin of Engineering
2013. Fascicule 2 [April–June] 64
NP-hard problems are optimization problems having no optimal solutions. The solution strategy usually utilizes heuristic algorithms, a rule of thumb, by taking into account several assumptions and finding an approximate answer, so as to decrease computational burden and improve efficiency or effectiveness. Efficient heuristics are suitable and viable alternative for many complex optimization problems with low complexity. Greedy heuristics take “short” decisions in each “stage” in order to find local optimals. By using the term “stage”, we convey the scheduling of each corresponding task of one or more projects in a specific time slice. The remaining of the paper is structured as follows: In Section 2, we briefly discuss RCMPSP theory, with a view to the reader’s introduction to the field of multi-project management. Furthermore, the scope and the incentive of combining Mass Customization key principles and Project Management are presented in Section 3. We elaborate on the basics of RCMPSP in Section 4. In Section 5 we attempt to approximate the notion of the RCMPSP by pointing out the conceptual model, which represents an integrated framework including all the key elements, in order to schedule simultaneous projects. The last section recapitulates the facts and gravitates to the contribution to new complex manufacturing conditions. INTRODUCTION TO RCMPSP As mentioned before, Resource Constrained Multi-project Scheduling Problem involves the precedence constrained scheduling of two or more projects’ tasks competing the same scarce resources [4]. Usually in practice, available resources are limited and expensive and organizations have more than one simultaneously active projects leading their resources into insufficient or overload conditions [3]. Its predecessor, Resource-constrained Project Scheduling is an extensively explored area, for those interested in single-project scheduling. On the contrary, in the present paper we strive to highlight the dynamic notion of managing the conflicting schedules of multiple projects. In order to deal with the coexisting projects, the key tool is to detect and resolve conflicts concerning resources and time delays through a decision-making process. The basic decision options are prioritizing, crashing, shifting and releasing tasks [4]. In the literature, there are many different solution methods of the RCMPSP depending on the number, the attributes, the resources and the classification of the criteria used during the decision-making process. Priority-rule based heuristic algorithms combine one or more priority rules, which are going to be presented in Section 4, and schedule schemes. Famous priority rules use time measures, networking relationships and resource availability. Each activity belonging to a decision set, this is where a specific greedy algorithm takes place, obtains a priority rule that minimizes or maximizes an objective function, stated by the Project Manager. Usual objectives bear on the minimization of project delays, average resource utilization and tardiness penalties [3].
Regardless of the method used to solve this kind of problems, there is a pivotal course of action. By materializing priority rules, a priority list of activities is constructed in the planning phase, before any execution step, at the zero-time point. The steps taken are iterative, once the decision of the execution order depends on each period of decision. As a result, high computational effort is required to fulfil the amount of trials. In any period, when activities compete for specific resources, the chosen priority rule or rules are applied. However dynamic approaches have the capability to alter the precedence at each stage, by following up the execution phases. The competitive advantage of these efficient techniques is that they satisfy the non-deterministic nature of the real process. Because of the vast amount of literature research and Project Manager’s acquaintance referring to RCMPSP knowledge, which is up to a degree doubtful, we offer all the fundamental stages of applying the RCMPSP principles in situations where customized products are considered projects and constitute the so called Project Portfolio. Problem specification In practice, the possible obstacles to be met are stated as follows: � A regular project contains even thousands of tasks.
The number depends on the areas of application and the size of the projects, which are about to be executed.
� Additionally, concurrent activities, belonging to different projects, claim the use of limited resources, which are going to be assigned according to their priorities, technical or qualitative. Some examples of resource constraints may be [4]: shared equipment and tools, staff with different qualification, working place with limited access capacity, etc. The resources, claimed above, belong to a Resource Pool, from which the Project Manager picks up personnel and materials, in order to transact a single project or a Project Portfolio.
� There are also customized exclusive constraints. When tasks have rigorous precedence relationships they cannot be executed at the same time [4].
� The dynamic nature of projects is of high importance, since tasks usually delay or finish ahead of schedule. There is also a possibility of staff and equipment shortage in special trades and finally delayed arrivals, replacements or set-up time.
� Conflicting schedules caused by shareable resources or constraints is the major issue to be examined and resolved in order for the multi-project scheduling to be practical, realistic and implementable. To this direction, it is vital to make assumptions based on the RCMPSP techniques.
SCOPE AND INCENTIVES This section aims to address the basic features of Project-oriented Organizations, in order to put up the foundations of correlating Project Management with Mass Customization and resource management.

ACTA TECHNICA CORVINIENSIS – Bulletin of Engineering
2013. Fascicule 2 [April–June] 65
Introduction to projects The first step to verge on project’s rationale is to define its environment. The environment in which projects operate can be summarized by the 5 Cs [5]. These, accordingly, are: � Context – the external general influence on the
organization in which the project is taking place. � Complexity – the level of difficulty or complication
of a piece of work called “project”. � Completeness – how much of the end requirement a
project will deliver. � Competitiveness – how many other organizations
will compete to deliver that work. � Customer focus – the expectation that customers
will have and the needs to be met by the project’s outcome.
Thereafter, at first glance, it is undoubtful that a customized product can be considered as a project to be developed in the above described environment. Moreover, Project Management Association of Japan states that a project refers to a value creation undertaking, based on a specific mission, which is completed in a given or agreed timeframe and under constraints, including resources and external circumstances. Some common themes of projects are evident here [5]: � Unique – the exact project has not been performed
before. The project has a degree of novelty and for this reason, projects are said to have aspects of uniqueness.
� Temporary – the project does have a beginning and an end and requires a group of talented and qualified people to carry out the tasks, this implies temporary organizations.
� Focused – the task of the project is to deliver a particular product, service or result, in other words to accomplish a specific mission.
Additionally to these three vital aspects, project characteristics, which bound together projects and Mass Customization, are shown in Figure 1. According to the experience, these characteristics should prevale in both projects and Mass Customization, in order to have a pure and solid project-oriented production system of customized products.
Figure 1. Project characteristics in agreement with Mass
Customization principles Another key element of projects is innovation. In projects, innovation is materialized by a group of people dedicated to investigate in practice innovative ideas. Figure 2 [5] pictures the duties of temporary organizations (Project Management) and permanent organization (Line Management). In the figure, the
trend is for the line AB to move downwards increasing the degree of innovation activities required from line managers. The result of that is a change in the role of line managers and a reduction of the gap between the role of line and project managers.
Figure 2. Innovation and maintenance activities
in temporary and permanent organizations More information about temporary and permanent organizations is given in the following sub-section. Project-oriented Organizations A Project-oriented Organization [2]: � Uses “Management by Projects” as an
organizational strategy. � Uses Project and Programme Management to carry
out extensive and complex processes. � Has set up Project and Programme Portfolio
Management. � Has specific permanent organizations for
integrating Project and Programme Management. � Has an explicit Project and Programme Management
culture. A structural feature of Project-oriented Organizations is the use of temporary in addition to permanent organizations. On the one side, temporary organizations contribute to the differentiation of the organization, whilst permanent structures include expert pools, project portfolio groups and Project Management Office. Namely, temporary organizations provide organizational flexibility, to carry out projects or programmes and ensure organizational learning through project or programme potential. The coexistence of temporary and permanent organizations is illustrated in Figure 3 [2].
Figure 3. Permanent and temporary organization
coexistence In organizations that produce customized products, specialized knowledge and qualification are of high importance, so they indicate Resource Pools. And this is because Mass Customization differs from Mass Production practices and requirements concerning production lines, general management and marketing, push and pull systems, resource management, training of lower levels of employees. So to this extend,

ACTA TECHNICA CORVINIENSIS – Bulletin of Engineering
2013. Fascicule 2 [April–June] 66
temporary organizational Project Portfolio coordination tasks are crucial. On the other hand, and because of the fact that permanent organizations can and should not be resolved, they coexist to the temporary ones, assisting key processes. Hence both temporary and permanent organizational functions should take place for a systemic and holistic project-oriented approach of Mass Customization. The structural and organizational difference of permanent/conventional and temporary organizations is show in Figure 4. The first half of the picture depicts an organization, it is not necessary to be a project-oriented one, that takes over a project (Pr.1), whilst the second half, refers to a Project-oriented Organization handling N simultaneous projects. The bunch of projects is the so-called Project Portfolio. If projects are interrelated they either refer to a chain of projects or a project network. When projects form a chain, they should have a sequential relationship, whilst it is about networks when projects are connected to some tasks due to technical reasons.
Figure 4. Customized Products illustrated as a bunch of
projects in a Project-oriented Organization In this picture the template of Viable System Modelling [6] is also used, because it serves to briefly depict the main ingredients of the organisational structure of any viable or autonomous system. The ingredients are Operations (circle), Meta-system (square) and External Environment (rectangular shape). Operations refer to production departments or units, while External Environment includes outer factors that influence or be influenced by the existing organization. As for the Meta-system, it represents the higher managerial staff and its name comes from the Greek word “system”, in Greek “sistima” (it comes from the ancient Greek verb “συνίστημι”, pronounced “sinistimi” and means coexist) [7]. The prefix “Meta-” is also a Greek word and denotes the sequence and superiority of managerial actions. Organizational structures of a Project-oriented Organization are Project Management Office, Project Portfolio Group and Project Portfolio Management [2], which are usually integrated to the Meta-system. The Project Management Office provides Project Management support, assists in the fulfilment of personnel management and serves Project Portfolio Management. The Project Portfolio is the sum of projects undertaken by a Project-oriented Organization. The duty of optimizing Project Portfolio results and minimizing project portfolio risks belongs to the Project Management Office. As for the Project Management
Expert Pool, it contains suitable qualified Project Management staff, to execute projects and programmes. Each Expert Pool has a manager responsible for recruitment and development of the Expert Pool staff and for knowledge management. Examples of an Expert Pool for IT organizations may be: software developers, operating system experts and so on. Project Portfolio A portfolio is a collection of projects or programmes grouped together to facilitate effective management efforts to meet strategic business objectives, such as Mass Customization adoption. These projects or programmes are not necessarily interdependent or directly related. Portfolio Management is the centralized management of multiple projects, programmes and possibly portfolios. This typically includes identifying, prioritizing and authorizing projects and programmes to achieve strategic business objectives. The group of projects and programmes within a specific business division could be an example of portfolio. “Effective Portfolio Management is vital to successful product innovation” [8]. Under this scope, organizations make strategic choices (markets, products and technologies) in which they will invest in. It is about resource allocation, how companies will spend scarce engineering, R&D and marketing resources. It also focuses on project selection, depending on opportunities stemming from new products or development projects. Another significant aspect is the balance between numbers of projects, resources and capabilities [8]. The Project Portfolio Management decision problem includes product portfolio methods such as [8]: � Financial models and indices such as NPV and IRR. � Probabilistic financial models: Monte Carlo
simulation and decision trees. � Options pricing theory: treats each stage of new
product project much like purchasing an option on a future investment.
� Strategic approaches: the selection of the portfolio of projects is largely driven by the strategy of the business.
� Scoring models and checklists: on a variety of qualitative questions.
� Analytical hierarchy approaches: paired comparisons of projects and criteria.
� Behavioural approaches: to bring managers to a consensus.
� Mapping approaches or bubble diagrams: designed to allocate resources across the business units.
Apart form these, the basis for Project Portfolio Management is a Project Portfolio database. This database should include information required for the composition of specific Project Portfolio reports. Typical reports include project portfolio budget, resource plan, risk matrix, progress graph and score cards. The fundamental tasks of Project Portfolio coordination are the following and Product Portfolio methods, as mentioned before, give effect to this direction [2]: � Optimize the result of the Project Portfolio as a
whole.

ACTA TECHNICA CORVINIENSIS – Bulletin of Engineering
2013. Fascicule 2 [April–June] 67
� Select the projects and programmes to be started. � Interrupt and cancel projects and programmes, if
necessary. � Define project’s and programme’s priorities. � Coordinate external and internal resources. � Organize learning from and between projects and
programmes. In addition to those been mentioned, Project Portfolio Management corroborate and crave a blend of managerial and mathematical methodologies, by which resources will be properly allocated to projects and tasks. According to literature [3], [4], [10-16], the predominant and holistic tool is the Resource Constrained Multi-project Scheduling Problem techniques, which is analysed in detail in Section 4. Classic RCMPSP Basics Assuming that we are examining a static multiproject environment, the prominent condition, to be analysed, is the resource transfer times, when scarce and expensive resources are to be shared between projects executed in different locations [3]. In large scale construction and manufacturing projects there are two types of shareable resources [17]. Machinery resources that are being transferred in order to execute activities in another project are first level resources and resources that perform the transport are the second level resources. A two level resource approach is consistent to the environment of many large budget technical and research projects, coming along the management of exceptional high cost or limited renewable resources. It is apparent that in lower scale projects, such as conventional Mass Customization production projects, the classification of the resources into first and second level will arise due to the nature of the products. Some assumptions related to the RCMPSP parameters are considered in the following sub-sections. Activities � There are two non-pre-emptive activity types in
each project. Activities executed using resources dedicated to the project and those executed by using shareable resources between more than one projects. The term “non-pre-emptive” conveys the image of assigning a resource to a project and keeping it immovable and dedicated to that project until the end of the activity.
� Deterministic durations, precedence constraints and resource requirements are known in advance.
� Activities executed by using shareable resources require only a certain resource type.
� Precedence constraints are defined only within projects.
Shareable Resources � First and second level shareable resources are
renewable. � All second level resources are able to make only
one movement at a time. A new movement will start after the completion of the current one.
Projects � There are two or more concurrently executed
independent projects, belonging to the Project Portfolio, competing for the same resources.
� There are no precedence constraints between projects.
� The project attributes are: � Well defined objectives. � It is carried out through a series or independent
tasks. � Utilizes various resources. � It has a specific time-frame. � It may be unique or one-time endeavour. � It has a customer. � It involves some degree of uncertainty. Priority Rules There is a great amount of priority rules to be used for the RCMPSP solution, but the most usual rules are the LST and EST [18]. � Latest starting Time (LST) is the latest possible
time that an activity can start without extending the overall duration, due to the resource-unconstrained CPM [17].
� Dynamic Earliest Starting Time (D-EST) is the earliest possible time that an activity can start taking into account precedence and resource constraints [17], [18].
However a modular approach of the whole process will be able to use any rule. To solve this kind of problems, Graph Theory tools are helpful and the most common objective function is the minimization of the multi-project delay. Graph Theory is handy tool, because projects are traditionally depicted as directed acyclic graphs, just like Figure 5.
Figure 5. Multi-project graph
CONCEPTUAL MODEL FOR MANAGING PROJECT PORTFOLIO The contribution of the presented paper is detected in the introduction and suggestion of a holistic context, which could assist and guide the Project Manager's decision-making, regarding multi-project and Portfolio Management. The following steps constitute a compact and comprehensive manual, founded on the grounds of RCMPSP and Project Portfolio Management dictations. In order to understand the notion of multiple projects, a simple three-project example is given in Figure 5. The numbers inside the vertices, in Figure 5 [17], represent the activity numbering, while the numbers outside the vertices denote the execution time of each activity. Alphanumerical labels outside vertices denote the shareable resources (R1, R2, R3). Project-1, Project-2 and Project-3 represent 3 different customized products undertaken by a company and they are to be considered concerning shareable resources and RCMPSP solutions. These

ACTA TECHNICA CORVINIENSIS – Bulletin of Engineering
2013. Fascicule 2 [April–June] 68
projects belong to the Project Portfolio of the Project-oriented Organization and need a strategic plan. This strategic plan is going to offer a sufficient solution due to its NP-hardness. The solution will satisfy, to an extent, the objective function or functions under the subjective selection of priority rules. THE PROPOSED FRAMEWORK OF MULTI-PROJECT ENVIRONMENT One of the fundamental provinces that an engineer should address, in such a kind of RCMPS problems, is strictly delimiting the problem via the mathematical formulation of the multi-project scheduling. This rationale is a customary one for the known Project Management software (e.g., MS Project, Primavera). The critical point, due to which a Project Manager is assessed, is whether the planned Work Break-down Structure (WBS) and resource allocation are in accordance with the actual and real time execution process, or not. Unfortunately, manager’s subjectivity cannot be controlled or forecasted, therefore, it is up to him/her to aptly assign resources to work packages, so as to avoid resource conflicts. Pursuant to Project Management main idea, the arrangement of possible resource conflicts is made by the Resource Levelling technique. This technique embodies priority rules application combined with the approval of the most sensible scenario. Referring to task requirements, resources may be global or local, where the former is a matter of shareable resources between projects, whilst the latter is about those dedicated to a single project. For its optimization a global resource requires either quantitative or qualitative objective functions. As stated in RCMPSP solving strategy, in case of having, for example, three parallel product development projects (see Figure 5) the first step is to make a list, which includes tasks and the corresponding resources, global or local, from all three projects. In case of being global, availability should be investigated. The questions that emerge are: Under which criteria will availability be investigated and when will the resource be available? The answer is straightforward and relates to the objective functions. To elaborate on this, objective functions may include time, cost or project priorities (e.g., ready for execution). Some time-related rules are stated in sub-Section 4.4. However, owing to flux scheduling, a change of the rule would be helpful, if needed. And this explains the dynamic side of the proposed methodology. In dynamic systems there aren’t any mathematical models to provide a solution, hence conceptual models are the only to equip managers and engineers with decision making supporting tools. To this direction, the steps should be traced are: � Specify entities and their attributes: Entities in
Project Management are two. The first one is the project itself and the second one is the resources. Tasks are not to be considered as a separate entity, but they are examined as part of projects.
� Set the objective function(s): Minimization or maximization of time, cost or other factors, as stated by the decision maker.
� Split the amount of resources into global and/or local: Global resources are those, which affect the multi-project scheduling, since local resources are taken for granted, in advance. Because of this, rules referring to local resources are stable and predefined in the planning phase.
� Pick deterministic and non-pre-emptive priority rules: Because the project is still in its planning phase, where circumstances are considered stable. Dynamic scheduling takes place in the phase of execution. However, in early states, such as the planning phase, the decisions to be made are deterministic. To this extent, the Project Manager chooses the rules, supposing that they will adequately meet project needs. Otherwise he/she changes the rule, during execution. Generally, rules refer to tasks, projects and resources. Rules can be chosen from one or more of the above categories. Referring to tasks, activities take priority values based on their features (e.g., shortest processing time first, minimum slack time first). Additionally, priority values are based on projects to which they belong or according to the special characteristics of each project (e.g., shortest activity from shortest project first). Finally, the availability of resources, the type of resources and their combination also affect priorities (e.g., maximum total work content rule). Critical activities are usually of high priority. Specifically, priority rules are: As soon as possible (ASAP) – relates to the total execution time of the project.
As late as possible (ALAP). Shortest activity first. Mostly available resources are consumed first. Minimun slack time first. More interconnected critical tasks first. More successive taks first. First-come-first-served (FCFS) – ready tasks are to be put through first.
Last-come-last-served (LCLS). Arbitrarily – depending on Project Managers subjectivity and qualitative criteria (e.g., customer’s significance to the company).
� Give priority and execute the task(s), which derived from the rules. In each iteration, several pairs of resources – tasks are examined and finally scheduled to be executed. This phase is the execution phase, and in many cases rescheduling is very possible to happen. In this final step, and according to the rules been chosen in the planning phase, a list with the most crucial tasks and their resources is shaped. This list supports the Project Manager’s decision, regarding the sequence of tasks to be performed.
Figure 6 represents the rudimentary steps described above. In order to be comprehensible, this introductory flow-chart is divided into three major steps:
� the pre-project phase, � the planning phase, and � the execution.

ACTA TECHNICA CORVINIENSIS – Bulletin of Engineering
2013. Fascicule 2 [April–June] 69
The RCMPSP methodology is mirrored in the rule determination phase.
Figure 6. The proposed conceptual model
This model, as been previously mentioned, is materialized by the use of Project Portfolio Management best practices and delimited by a triple of resources posed by RCMPSP standardized solution. Future and further applications and experiments will empower the proposed method and could aid to the direction of a more engineering and absolute resource-related decision making. CONCLUSIONS When it’s all been said and done, according to Project Management experts [19], a project is unique under the scope of resources, goals, customers, attitudes, human effort, networking, row of processes and so on. This explains why Mass Customization and Project Management are closely bound together. Thus, by bearing in mind the fact that customized products are unique by nature, a common basis for examining them as a united and solid strategy is formed and provided too.
This papers aims to achieve a “change in the paradigm”, i.e., imbue Mass Customization with a renewed logic and an algorithmic viewpoint, to direct toward a well-known and widely tested technical approach. REFERENCES [1.] M.M. Chatzimichailidou and D. Lukac, “Review
on Living Labs, their predecessors, their principles and the diversity of their applications”, International Conference on Advanced Collaborative Networks, Systems and Applications, Luxembourg, Luxembourg, 19-24 June, 2011.
[2.] International Project Management Association, “PM Baseline”, Vers.3.0, PM Austria, 2009, http://ipma.ch/resources/ipma-publications/ipma-competence-baseline/.
[3.] S.Katsavounis, “Scheduling multiple concurrent projects using shared resources with allocation costs and technical constraints”, International Conference on Telecommunication Technology and Applications, Damascus, Syria, 7-11 April, 2008.
[4.] Q. Hao, W. Shen, Y. Xue and S. Wang, “Task network – based project dynamic scheduling and schedule coordination”, Advanced Engineering Informatics, Vol.24, 2010, pp. 417-427.
[5.] H. Maylor, “Project Management”, Pearson, Edinburgh, England, 2010.
[6.] S. Beer, “The Heart of the Enterprise”, Wiley, Chichester, England, 1979.
[7.] M.M. Chatzimichailidou and S. Katsavounis, “S. Beer’s Viable System Model application in furniture industry-a case study”, Entrepreneurship, Innovation and Regional Development, Sofia, Bulgaria, 1-2 June, 2012.
[8.] R.G. Cooper, S.J. Scott and E.J. Kleinschmidt, “New product Portfolio Management: practices and performance”, Journal of Production Innovation Management, Vol.16, 1999, pp. 333-351.
[9.] R.G. Cooper, S.J. Scott and E.J. Kleinschmidt, “Portfolio Management for new product development: results of an industry practices study”, Research & Development Management, Vol.31, No.4, 2001, pp. 361-380.
[10.] P.M. Berry, B.Y. Choueiry and L. Friha, “Distributed approach to dynamic resource management based on temporal influence”, Intelligent Systems Engineering, Vol.3, No.2, 1994, pp. 79-86.
[11.] J. Brown and B.J. McCarragher, “Maintenance resource allocation using decentralized co-operative control”, Information, Decision and Control, Adelaide, Australia, 8-10 February, 1999.
[12.] P. Brucker, A. Drexl, R. Moehring, K. Neumann and E. Pesch, “Resource constrained project scheduling: notation, classification, models and methods”, European Journal of Operational Research, Vol.112, 1999, pp. 3-41.
[13.] S. Hartmann and R. Kolisch, “Experimental evaluation of state-of-the-art heuristics resource constrained project scheduling

ACTA TECHNICA CORVINIENSIS – Bulletin of Engineering
2013. Fascicule 2 [April–June] 70
problem”, European Journal of Operational Research, Vol.127, No.2, 2000, pp. 394-407.
[14.] M.M. Khattab and K. Soyland, “Limited resources allocation in construction projects”, Computers and Industrial Engineering, Vol.31, No.1-2, 1996, pp. 229-232.
[15.] R. Kolisch, A. Sprecher and A. Drexl, "Characterization and generation of a general class of resource-constrained project scheduling problems”, Management Science, Vol.41, 1995, pp.1693-1703.
[16.] E. Sripresert and N. Dawood, “Multi-constraint information management and visualisation for collaborative planning and control in construction”, ITcon, Vol.8, 2003, pp. 341-366.
[17.] D. Kruger and A. Scholl, “Modelling general resource transfers in (multi-) project scheduling”, Jena Research Papers in Business and Economics, Jena, 2007.
[18.] A. Lova, P. Tormos and F. Barber, “Multi-mode resource constrained project scheduling: scheduling schemes, priority rules and mode selection rules”, Inteligencia Artificial, Revista Iberoamericana de Inteligencia Artificial, No.30, 2006, pp. 69-86.
[19.] R. Gareis, “Happy Projects!”, Manz Verlag, Vienna, Austria, (2005). (in english).
ACTA TECHNICA CORVINIENSIS – BULLETIN of ENGINEERING
ISSN: 2067‐3809 [CD‐Rom, online]
copyright © UNIVERSITY POLITEHNICA TIMISOARA, FACULTY OF ENGINEERING HUNEDOARA,
5, REVOLUTIEI, 331128, HUNEDOARA, ROMANIA http://acta.fih.upt.ro

© copyright FACULTY of ENGINEERING ‐ HUNEDOARA, ROMANIA 71
1. Saša RANĐELOVIĆ, 2. Dragan MIŠIĆ, 3. Miroslav TRAJANOVIĆ, 4. Nikola VITKOVIĆ, 5. Marko VESELINOVIĆ
CUSTOMIZATION OF ORTHOPEDIC INTERNAL FIXATOR
1-5. UNIVERSITY OF NIŠ, FACULTY OF MECHANICAL ENGINEERING, SERBIA
ABSTRACT: Customization and adjustment of medical devices and elements for external and internal fixation is a major challenge in modern orthopedic surgery. As a result a large number of minor and serious illnesses and injuries, congenital disorders, or more often emerging with a large number of anatomical requirements, impose the various technical requirements to be met with one, two or more orthopedic element. Modern lifestyle and pace of today's man activities carries great dangers and risks. At a given moment and inception health condition, expert team will usually need to react very fast, high quality and tested to achieve the desired effect. Since this is a human health or the disruption and damage to his bones and joint system, orthopedic devices and components shall as far as possible be adapted to meet the technical requirements and standards set. KEYWORDS: Orthopedic fixation, production, orthopedic material, FEM analysis
INTRODUCTION Type of injury or disease stage directly determines the medical diagnosis and therefore the medical procedure to be undertaken. In real conditions, in addition to the usual procedures, medical equipment and supplies, sometimes is not enough to use standard components of the implant because of unusual anatomy or potential risk of postoperative complications, such as aseptic weakening. The usual reason for aseptic weakening is the uneven distribution of mechanical stress to the bone volume and the irregular 3D surfaces of bones. This problem can be solved using customization implant design, customized to the specific characteristics of the patient's anatomy. DESIGN AND MANUFACTURE OF FIXATIONS Tibia is situated at the medial side of the leg and composed of middle part (tibial shaft - body) and two extremities: proximal part and distal part. Proximally the tibia has a broad articular surface which articulates with the femur [1]. Tibial plateau (proximal/superior articular surface) fractures are typically complex fractures associated with poor outcomes and a high rate of complications and their treatment remains problematic [2]. Fixation method with Mitkovic’s internal fixator type TPL (tibia-plato-lateral) is possible treatment solution for such kind of injuries. Fixator needs to fit onto the proximal lateral tibia surface. Therefore, in order to obtain the best possible fit, anatomically pre-contouring of Mitkovic’s TPL fixator is well solution. Customization can be undertaken by changing values of dimensions of geometrical entities for previously created 3D fixator model. New values can be obtained from certain radiology image of the bone [3].
Research and development for customization production of orthopedic implants is typically related to direct manufacturing technologies [4,5]. New equipment for the rapid production of prototypes (rapid-manufacturing) allows much greater efficiency in small series or individual production.
Figure 1. Lower Extremities, 1. Femur,
2. Tibia, 3. Fibula [3]
Figure 2. Customization of proximal part of Mitkovic’s TPL fixator in order to achieve accurate fixation for specific
patient’s tibia bone
The latest methods used for the direct production of high strength materials such as titanium, is the melting of the electron beam (electron-beam melting - EBM).

ACTA TECHNICA CORVINIENSIS – Bulletin of Engineering
2013. Fascicule 2 [April–June] 72
Figure 3. EBM process
The application contains a conventional treatment methods that allow a larger series of products with a smaller adjustment fixators for a given concrete conditions.
Figure 4. Additive technology
Figure 5. Lower tool for hot forging technology and finished
part for orthopedic fixation Additive manufacturing, sometimes called “3D printing,” is a group of new technologies that build up objects by adding materials, usually by laying down many thin layers. It is so called to distinguish it from traditional machining that creates objects by cutting material away. Processes of metal forming, both cold and hot working offer technology solutions and still have not overcome the majority of patients. These technologies covered most medical cases in the external and internal fixation. This results in greater savings and necessary for customization products. Orthopedic implants can be very complex, customized products to be produced, based on the above information as soon as possible [6]. Key factors of production for customization orthopedic implants are the level of customization of the final product and delivery time. A higher level of customization reduces the duration of the operation and increases the reliability of future implants. Also, reducing the present risks from possible complications. The general approach in developing the technology of manufacturing companies is to optimize the design of their products according to criteria of simplicity and cost, while adapting their processes mainly for large series production. This is the main reason why they are not able to produce small batches or individual products in an efficient manner. In the traditional sense, the processes for the production of customization implants include a large number of analysis and decision making, such as interpretation and analysis of CT (Computed Tomography) scans,
analysis of wax prototypes, mechanical analysis, information gathering and permits, etc. Lack of efficiency to adapt their traditional workflow activities becomes even more critical when companies have to hire suppliers of various parts, components or services. The fact is that this process involves intensive communication, a number of consultations between the various experts which discuss of the functional (medical), mechanical, organizational, and other perspectives on the process of customized production.
Figure 6. Distal-lateral, proximal-lateral
and lateral plate By process models are represent different informations which describing orthopedic implants. They aim to provide relevant knowledge representation and reasoning in decision making regarding treatment and preoperative planning, and configuration of the virtual enterprise, planning, technology and business process management. For example a generic 3D parametric model selected human bone, can be generated by the available tools and features in one of the 3D modeler. Although a lot of complex surfaces and volumes require a combination of very powerful software options, it is a good way to make a multi-functional model. This will be fully covered by the technical documentation and important details, model development, model analysis and simulation of stress and many other sensitive issues. Attempt to irregular and complex surface and volume dependent on parameter representing mathematical functions and relationships only slightly speeds up the design. Time to get models with high probability, at a later stage will not provide an opportunity for a complete analysis.
Figure 7. Front and medial plate
for lowerleg fixation
Figure 8. Distal-periarticular plate
Implants are usually made from scaffold, fixing (used for heavier loaded bones) and bio-degradable materials for osteo-fixation. These models are generated based on data obtained from CT scans and are essential for digital reconstruction of traumatized bone. Then, based on this model, it is possible designing the scaffold, which replaces the missing part bone. Simulation models allow the prediction and optimization of mechanical behavior

ACTA TECHNICA CORVINIENSIS – Bulletin of Engineering
2013. Fascicule 2 [April–June] 73
of implants under realistic load conditions, using FEM methods (Finite Element Analysis - FEA). SELECTION OF MATERIALS FOR ORTHOPEDIC FIXATORS Modern medical implants are products which have to satisfy strict standard requirements regarding materials, machining technologies and their functionality. They could be used in almost every organ of the human body. Ideally they should have biomechanical properties comparable to those of autogenous tissues without any adverse effects. The principal requirements of all medical orthopedic implants are corrosion resistance, biocompatibility, bioadhesion, biofunctionality, machinability and availability. To fulfill these requirements most of the tests are directed into the study extracts from the material, offering screens for genotoxicity, carcinogenicity, reproductive toxicity, cytotoxicity, irritation, sensitivity and sterilization agent residues [7].
Figure 9. T- plate, proximal
Modern medical implants are regulated and classified in order to ensure safety and effectiveness to the patient. One of the most favorable biomaterial used for biomedical applications is titanium alloy Ti6Al4V due to its combination of the most desirable characteristics including immunity to corrosion, biocompatibility, shear strength, density and osteo-integration. The excellent chemical and corrosion resistance of titanium is caused by the chemical stability of its solid oxide surface layer to a depth of 10 nm. Under in-vivo conditions the titanium oxide (TiO2) is the only stable reaction product whose surface acts as catalyst for a number of chemical reactions, [8]. The biggest risk wear contact between implant and the bone surface, which largely depends on the type of implant materials [9].
Figure 10. Contact stress analysis, bone vs. ceramic, bone
vs. polyethylene and bone vs. pyrocarbon In the case of ceramics with extremely high elastic modulus (407 GPa), there is almost no distortion, and it is a solid contact with the implant that does not respond to the effect of mechanical stress or mechanical force causes a large increase in internal stresses in the bone itself. Polyethylene in contact with the bone mass has completely different characteristics. Its much lower elastic modulus (1 GPa) suggests that the entire burden is transferred to
the established contact implant and the bone implant produced a disproportionate strain which is not permissible. It is clear that pure pirokarbon, when such an analysis, show the best mechanical properties, that is closest to the behavior of human bone mass [8,9,10].
Table 1. Biocompatibility and Bioelasticity Facts
Sili
cone
Bone
Pure
Py
ro-
carb
on
Tita
niu
m
(TA
6V)
Coba
lt
Chro
me
(CrC
o)
Cera
mic
(A
lum
ina)
E (G
Pa)
0.00
04
15 –
20
20 –
25
110
200
- 24
0
407
Den
sity
(g
.cm
-3)
1.1
2.0
1.7
– 2.
0
4.5
8.3
– 9.
2
3.5
The basic idea in the development of new alloys for medical applications, therefore, is to replace aluminum and vanadium with niobium, tantalum and zirconium. In order to thus avoid the negative features are now widely applied to the Ti-6Al-4V alloy, as shown that the toxicity of these elements is extremely low. The alloy Ti-13Nb-13Zr, developed in the United States, shows remarkable properties. This is the type of β titanium alloys and is characterized by low values of elastic modulus and strength significantly improved in comparison to commercial Ti-6Al-4V alloy, which is extremely interesting for applications in biomedical engineering [10]. The relatively low hardness of titanium alloys, however, affect their poor wear resistance, and these alloys without additional surface treatment such as ion implementation, can not be used for the preparation of joint surfaces. THE LEVEL OF CUSTOMIZATION AND COMPLIANCE WITH STANDARDS Experience shows that any impromptu or untested solutions very quickly cause unwanted effects and consequences that are difficult or impossible to correct. For these reasons, the entire field of medicine, and orthopedic and reconstructive surgery requires the application of certain standards and guidelines will be a limit to customization and extensions. The ISO-13485 is an international quality management system (QMS) standard defined for the medical device industry. It is therefore important for manufacturers of equipment, apparatus (accessories) and semiconductor devices used in medical electronics to get certified to the ISO-13485 in order to secure and maintain global business. Created by the International Organization for Standardization (ISO), the ISO-13485:2003 borrowed the structure of the ISO-9001:2000.
Figure 11. Distal, distal medial and proxsimal-medial plate

ACTA TECHNICA CORVINIENSIS – Bulletin of Engineering
2013. Fascicule 2 [April–June] 74
The benefits of registration to ISO-13485 include: 1) international recognition of compliance with the FDA Quality System Regulations and unique medical industry standards, facilitating global business; 2) a more efficient, cost-effective, and stable organization; 3) improved process, product, and service quality; and 4) better documentation of existing processes. ISO-13485:2003 basically consists of: 1) certain ISO-9001 requirements and 2) newly defined requirements catering specifically to the medical device industry. As such, ISO-13485 differs from ISO-9001 in certain ways, modifying or even excluding some of the latest requirements. For instance, the ISO-13485 excludes the ISO-9001's requirements related to continual improvement because most medical device regulations require organizations to maintain their quality management systems, and not to improve them. Thus, while ISO-9001 emphasizes the importance of improving quality systems, ISO-13485 emphasizes the importance of maintaining them. ISO-9001 customer satisfaction requirements were also excluded because some of the committee members who worked on ISO-13485 found them to be too subjective. Some key points adopted by the ISO-13485 include: 1) focus on meeting regulatory requirements; 2) focus on meeting customer requirements; 3) use of a 'process' approach; 4) maintenance of the effectiveness of quality management systems; and 5) maintenance of procedural documentation. As mentioned, the ISO-13485 has special requirements that are not covered by ISO-9001:2000. These special requirements include both documentation and system/process requirements that cater to the medical device industry. Aside from regulation-required documents, additional documentations required by ISO-13485 include those pertaining to: 1) responsibilities and authorities; 2) training procedures; 3) health, cleanliness, and clothing; 6) environmental conditions; 7) control of contaminated products; 8) risk management; 9) customer requirements; 10) design and development; 11) purchasing control, including purchase traceability and verification; 12) reference materials; 13) labeling and packaging; 14) installation and verification; 15) sterilization process validation; 16) preservation of product (including shelf life); and 17) measurement and monitoring. Special system / process requirements of the ISO-13485 include: 1) risk management systems; 2) clinical evaluations and trials; 3) product cleanliness and contamination controls; 4) requirements for implantable devices; 5) proper communication of advisory notices; and 6) additional research and development requirements. CONCLUSIONS Extensively investigations and the facts point to the possibilities and advantages of new technologies in the field of orthopedic surgery and in other medical disciplines. If the problem considered multidisciplinary, using new technologies and higher degree of customization with good knowledge of the properties of new
materials and alloys, patients get a much better chance in their fight for a healthy and normal life. It is certain that medicine retains a leading and crucial role in such a complex process, along with the fact that it must always be ready to accept the latest developments in related disciplines that offer its latest solutions and results. ACKNOWLEDGEMENT This paper is part of project III41017 Virtual human osteo-articular system and its application in preclinical and clinical practice, funded by the Ministry of Education and Science of Republic of Serbia. REFERENCES [1.] P. Brown, "The online skeleton", from http://www-
personal.une.edu.au/~pbrown3/oskel.html, accessed on 2012-10-15.
[2.] N. Russell, P. Tamblyn, R. Jaarsma, "Tibial plateau fractures treated with plate fixation: to lock or not to lock", Eur J Orthop Surg Traumatol, 19, 2009, pp. 75-82.
[3.] T. B. Moeller, E. Reif, "Pocket Atlas of Radiographic Anatomy", Second edition, Thieme, Stuttgart · New York, 2000, pp. 156.
[4.] MW. Chapman. "Principles-of-internal and external fixation", Chapman’s orthopaedic surgery. 3rd ed. Lippincott Williams and Wilkins; 2001.
[5.] R. Thull, D. Grant, "Physical and Chemical Vapor Deposition and Plasma-assisted Techniques for Coating Titanium", In Titanium in Medicine, Brunette D.M., Tengvall P., Textor M., Thomsen P. (eds.), Springer-Verlang Berlin Heidelberg, 2001. pp. 284-335.
[6.] P. Tengvall, I. Lundstrom, "Physico-chemical considerations of titanium as a biomaterial", Clin. Materials 9, 1992. pp.115-134.
[7.] F. Wataria, A. Yokoyamaa, M. Omorib, T. Hiraic, H. Kondoa, M. Uoa, T. Kawasakia, "Biocompatibility of materials and development to functionally graded implant for bio-medical application", Composites Science and Technology 64, 2004, pp. 893-908.
[8.] M. Viceconti, M. Casali, B. Massari, L. Cristofolini, S. Bassinit, A. Toni, "The ‘standardized femur program’ proposal for a reference geometry to be used for the creation of finite element models of the femur", J Biomech. 1996; 29(9):1241.
[9.] Ž. Stepanović, M. Živković, S. Vulović, Lj. Aćimović, B. Ristić, A. Matić, Z. Grujović, "Visoka, otvorena, klinasta osteotomija tibije: analiza pet modaliteta unutrašnje fiksacije metodom konačnih elemenata", Vojnosanitetski pregled, vol 68, br.10, 2011, pp. 867-871.
[10.] N. Vitković, J. Milovanović, M. Trajanović, N. Korunović, M. Stojković, M. Manić, "Methods for creating geometrical model of femur anatomical axis" 34th International Conference on Production Engineering, ICPE 2011, September 28th – 30th, 2011, Nis, Serbia
ACTA TECHNICA CORVINIENSIS – BULLETIN of ENGINEERING
ISSN: 2067‐3809 [CD‐Rom, online]
copyright © UNIVERSITY POLITEHNICA TIMISOARA, FACULTY OF ENGINEERING HUNEDOARA,
5, REVOLUTIEI, 331128, HUNEDOARA, ROMANIA http://acta.fih.upt.ro

© copyright FACULTY of ENGINEERING ‐ HUNEDOARA, ROMANIA 75
1. Grzegorz BUDZIK, 2. Jacek BERNACZEK, 3. Bogdan KOZIK, 4. Mariusz SOBOLAK, 5. Tomasz DZIUBEK, 6. Bartłomiej SOBOLEWSKI, 7. Mirosław GRZELKA
DESIGN DEVELOPMENT, PROTOTYPE MANUFACTURING USING FDM TECHNIQUES AND ACCURACY ANALYSIS OF AERONAUTICAL DUAL-POWER PATH GEAR UNIT
1-6. RZESZOW UNIVERSITY OF TECHNOLOGY, AL. POWSTANCOW WARSZAWY 8, 35-959 RZESZOW, POLAND 7. POZNAN UNIVERSITY OF TECHNOLOGY, POZNAN, POLAND
ABSTRACT: The paper presents a complex process calculations and design development, FDM model manufacturing and accuracy analysis of a demonstrative prototype of a dual-power path gear unit to be applied in aeronautical systems of drive transmission. The process of making a demonstrator of a dual-power path gear unit by means of 3D-CAD modeling and Rapid Prototyping has been described here. The first stage of the designing process of a gear unit is always defining basic parameters of gear work (among others; power, rotational speed, transmission ratio) depending on the unit’s predestination. On the basis of the above, the calculation of main constructional parameters is carried out. Subsequently, it is possible to make 3D-CAD models of toothed wheels and the remaining parts of the gear unit. In case of designing demonstrative prototypes, it is important to take into consideration the assumptions of modeling similarity to a real gear unit. 3D-CAD systems are often equipped with modules for analyzing geometrical parameters and cooperation of individual parts of the unit for example the area of contact. A detailed analysis of cooperation of gear parts of the unit allows for detecting models’ faults early and for deleting them. After making 3D-CAD models one can approach to creating a prototype by means of Rapid Prototyping methods. It is necessary to prepare the numerical data essential as a subsequent stage of the process of making the demonstrator. On that basis the individual parts of the gear unit are made in an incremental process. The accuracy of creating a physical prototype depends mainly on the accuracy of a 3D-CAD/3D-RP model prepared in a process of processing numerical data. A demonstrator described in the paper has been made by means of FDM method. The prototype allowed for analyzing constructional solutions of gear units on a physical model and for preparing assumptions for introductory stand tests. In case of measurement of gear wheels using modern technologies based on numerical machines, measurement process is based on processing of numerical data obtained by measurement using coordinate measuring machines. In this paper is present the opportunity to automate the measurement process of gears, using coordinated optical CMM Baty Venture machine. KEYWORDS: coordinate measurements, rapid prototyping, aeronautical gears, toothed wheels, aeronautical power drives
INTRODUCTION Analysis of the accuracy of air items gears at different stages of technological process requires control of geometrical parameters with the use of coordinate measuring methods [1-4]. The development of coordinate measuring technique is closely linked with the development of computer-aided design methods. The measurement process is based on computer processing of measurement data to a discrete form, thus it is possible to determine the dimensions of the measured object in a virtual three-dimensional space. The measurement procedures are based on determining the value of the measured coordinates of points. In the initial phase of development of these basic methods of measuring device was a tactile coordinate measuring machine. At the
moment, are booming photonics - using non-contact measurement methods coordinate data processing. A dual-power path gear is one of many multi-power solutions of transmitting power where two paths are used in order to split the transmitted power. In a classic multi-phase toothed gear, one gearing transmits the whole power on every phase. In an analogous dual-power path gear, two gearings are found on every phase and they transmit the required power. That is why modules of these wheels are smaller and the gear size is comparable to a traditional one. In case of a dual-power path gear it is also possible to obtain lower weight in comparison to a traditional gear which is especially important in aeronautical gear units [1-3, 7, 9]. A prototype of the described in the paper dual-power path gear (the

ACTA TECHNICA CORVINIENSIS – Bulletin of Engineering
2013. Fascicule 2 [April–June] 76
assumed ratio of 12 ) has been made according to a diagram presented in figure 1.
In order to diminish size of the dual-power path gear it was assumed that axis of its shafts are not placed at one plane. As a result of analyzing introductory solutions of kinematic structure of dual-power path gears, a layout of individual elements of the gear has been determined in accordance with a diagram (fig. 2). As can be seen, an input shaft I and an output shaft III are not coaxial.
Figure 1. A diagram of wheel arrangement
in a dual-power path gear – front view CALCULATION PROCESS FOR A DUAL-POWER PATH GEAR Kinematic assumption data for cooperating wheels is extremely vital in case of a dual- power path gear. To ensure steady operation of wheels, gearings working at a given phase should simultaneously be at the same phase (at an identical arrangement of pinion teeth and wheel teeth in respect to one another). To assure this, the value of α angle should equal:
1
180z
i ⋅=α (1)
where i – an integer, z1 – a number of teeth in wheel nr 1. β angle should analogically equal:
4
180z
j ⋅=β (2)
where j – an integer, z4 – a number of teeth in wheel nr 4. Assuming minimal anti-collision backlash between wheels c one can determine minimal values of angles α and β:
( )( ) ⎟⎟
⎠
⎞⎜⎜⎝
⎛+
++=
21
2min
2arcsinzzm
czm
I
Iα (3)
( )( ) ⎟⎟
⎠
⎞⎜⎜⎝
⎛+
++=
43
3min
2arcsinzzm
czm
II
IIβ (4)
where mI – module of wheels of gearing I, mII – module of wheels of gearing II, z2 – a number of teeth in wheel nr 3, z3 – a number of teeth in wheel nr 4. Preliminarily, while calculating one assumesα angle on the basis of (1) and (3) and then assuming that:
( )2
sin2
21 azzmI =+ α (5)
( )2
sin2
43 azzmII =+ β (6)
and comparing sides: ( ) ( ) βα sin
2sin
24321 zzmzzm III +
=+
(7)
one can determine β angle:
( )( ) ⎟⎟
⎠
⎞⎜⎜⎝
⎛++
= αβ sinarcsin43
21
zzmzzm
II
I (8)
However β angle must comply with condition (2), therefore it is necessary to assume an angle closest to the determined one and complying with conditions (2) and (4). That is why a correction of toothing is necessary in most cases. Wheels 2z and 3z should be situated in respect to each other so that between wheels there is an angle which is a result of subtraction βα − . One should not make a correction of angle of mutual settlement of wheels instead of correction of toothing because it leads to uneven transmission of load by the two paths. Resistance calculations of wheels of the designed gear have been carried out on the basis of guidelines for gears assuming that each gearing transmits maximum 65% of load [6]. DEVELOPMENT AND IMPLEMENTATION OF A DEMONSTRATIVE-RESEARCH PROTOTYPE OF A DUAL-POWER PATH GEAR The carried out calculations of dual-power path gear make it possible to design it in 3D-CAD environment. Contemporary CAD/CAM/CAE/RP systems assist the process efficiently. INVENTOR system has been used for the research. It allows to make geometrical prototypes and to carry out many introductory tests and analysis confirming the designing assumptions or influencing their modification [1, 8]. Models of toothed wheels have been made on the basis of tooth profiles generated by means of copyright computer programs developed in accordance with INVENTOR environment (fig. 2a).
Figure 2. The gear model:
a) 3D-CAD model, b) RP – FDM model As a result of modeling individual parts of the gear and selection of normalized parts taken from a program library, a three-dimensional numerical prototype of a dual-power path gear has been made. An additional task of the 3D-CAD model is checking correctness of construction and operation of the gear in defined conditions. In case of the discussed gear it is also checking the division of power into two paths.

ACTA TECHNICA CORVINIENSIS – Bulletin of Engineering
2013. Fascicule 2 [April–June] 77
CAE programming modules, which are helpful on the stage of analysis, can be applied here. The basis for making a research prototype was 3D-CAD models recorded in STL format. STL models subjected to program processing – division into layers 0,254mm thick applying CatalystEX program attending FDM machines – Staratasys U-Print machine. In this program the models were placed on a plane of working platform of the device (fig. 2b). COORDINATE MEASURING SYSTEM – BATY VENTURE Coordinate measuring system BATY VENTURE it’s a optical CMM machine allows you to perform measurements of the curve or points of objects with complex shapes including gears. A view of optical measuring station is shown in figure 3. Acceleration measurement process BATY scanner can be obtained using automation hardware and software.
Figure 3. The coordinate measuring system
– BATY VENTURE Application program BATY inspection module allows the subsequent analysis of the accuracy of the measured performance of the element with respect to the nominal model in DXF format data. The possibility of analyzing the whole item - described many points - it gives a complete picture of the accuracy of its execution in x,y plane section (fig. 4).
Figure 4. A camera view of gear section during the
measurements process In addition, optical measurement coordinate system gives the possibility to use different systems of measurement to match the CAD model: the geometric elements or best-fit (fig. 5). Since the
density of collected points is a big deviations are visualized as a color map (fig. 6).
Figure 6. Import DXF data of gear and best-fit
operation in machine software
Figure 7. A deviations visualized as a color of FDM
model of gear CONCLUSIONS The test gears have higher accuracy than the estimate for FDM method. One way to increase the accuracy of the prototype, may be a change in the way of modeling the outline of gear rim and the wheel hub. This is especially true if the wheel second grade, which is sensitive to the contraction of material due to its size and shape of the hub. The test gears have a higher accuracy than the estimate for FDM method (± 0.1 mm).The research prototype studied in this paper was made by means of FDM method and the material used was ABSplus. Additionally introductory tests on models of this kind made it possible to carry out an analysis determining correctness of the applied designing methodology and constructional solutions of aeronautical dual-power path gear. The prototype is meant for tests determining power division. The tests will be carried out on a test stand. They will allow for verifying an assumption that division of power is equable in case of geometrical synchronization of gearing cooperation on a given phase of gear. The following stage of the research will be making a gear prototype of a material having qualities similar to target ones and subsequently carrying out tests in conditions of real loading. ACKNOWLEDGEMENTS Financial support of Structural Funds in the Operational Programme - Innovative Economy (IE OP) financed from the European Regional Development Fund - Project "Modern material technologies in aerospace industry", No POIG.0101.02-00-015/08 is gratefully acknowledged.

ACTA TECHNICA CORVINIENSIS – Bulletin of Engineering
2013. Fascicule 2 [April–June] 78
REFERENCES [1] Budzik G., Kozik B., Pacana J., Żmuda B.,
Modelling and prototyping of aeronautical planetary gear demonstrator, Journal of KONES Powertrain and Transport, Vol. 17, No 3 2010, s. 49-54.
[2] Cocking, H., The Design of an Advanced Engineering Gearbox, Vertica, 1986, Vol. 10, No. 2, Westland Helicopters and Hovercraft PLC, Yeovil, England, pp. 213–215.
[3] Krantz T. L., Delgado I. R., Experimental Study of Split-Path Transmission Load Sharing, NASA Technical Memorandum 107202, Army Research Laboratory, Technical Report ARL–TR–1067, San Diego, California, October 6–9, 1996.
[4] Liou W., Rapid Prototyping and engineering applications – a toolbox for prototype development, Taylor & Francis Group, 2008.
[5] Oleksy M., Budzik G., Heneczkowski M., Hybrid polymer composites for rapid prototyping of gears, POLIMERY 2010, 55, 5, s. 403-407.
[6] Pacana J., Kozik B., Budzik G., Defining instantaneous contact track of aeronautical bevel gear applying finite elements method and rapid prototyping method, Journal of KONES Powertrain and Transport, Vol. 17, No 2 2010, s. 379-386.
[7] Smirnov, G., 1990, Multiple-Power-Path Nonplanetary Main Gearbox of the Mi-26 Heavy-Lift Transport Helicopter, Vertiflite, Mil Design Bureau, Moscow, Vol. 36, pp. 20–23.
[8] Sobolak M., Budzik G., Experimental Method of Tooth Contact Analysis (TCA) With Rapid Prototyping (RP) Use, Rapid Prototyping Journal, Volume 14 Number 4 2008, s. 197-201.
[9] White, G., 1974, New Family of High-Ratio Reduction Gear with Multiple Drive Paths, Proc. Instn. Mech. Engrs., Vol. 188, pp. 281–288.
ACTA TECHNICA CORVINIENSIS – BULLETIN of ENGINEERING
ISSN: 2067-3809 [CD-Rom, online]
copyright © UNIVERSITY POLITEHNICA TIMISOARA, FACULTY OF ENGINEERING HUNEDOARA,
5, REVOLUTIEI, 331128, HUNEDOARA, ROMANIA http://acta.fih.upt.ro

© copyright FACULTY of ENGINEERING ‐ HUNEDOARA, ROMANIA 79
1. A.G. VIJAYA KUMAR, 2. Y. RAJASEKHARA GOUD, 3. S.V.K. VARMA, 4. K. RAGHUNATH
THERMAL DIFFUSION AND RADIATION EFFECTS ON UNSTEADY MHD FLOW THROUGH POROUS MEDIUM WITH VARIABLE TEMPERATURE AND MASS DIFFUSION IN THE PRESENCE OF HEAT SOURCE/SINK
1,3. DEPARTMENT OF MATHEMATICS, S.V.UNIVERSITY, TIRUPATI, A.P, INDIA 2. DEPARTMENT OF MATHEMATICS(H&S), G. PULLA REDDY ENGINEERING COLLEGE, KURNOOL, A.P, INDIA 4. DEPARTMENT OF MATHEMATICS, BHEEMA INSTITUTE OF TECHNOLOGY AND SCIENCE, ADONI, KURNOOL, A.P, INDIA
ABSTRACT: The objective of the present study is to investigate thermal diffusion and radiation effects on unsteady MHD flow past an impulsively started infinite vertical plate with variable temperature and mass diffusion in the presence of heat source or sink through porous medium. The fluid considered here is a gray, absorbing/ emitting radiation but a non-scattering medium. At time t>0, the plate is given an impulsive motion with a velocity u=u0 in the vertical upward direction against to the gravitational field. And at the same time, the plate temperature and concentration levels near the plate raised linearly with time t. The dimensionless governing equations involved in the present analysis are solved using the Laplace transform technique. The velocity, temperature, concentration, Skin-friction, the rate or heat transfer and the rate of mass transfer are studied through graphs and tables in terms of different physical parameters entering into the problem. KEYWORDS: MHD, heat and mass transfer, thermal diffusion, Heat source, vertical plate, radiation
INTRODUCTION In nature, there exist flows which are caused not only by the temperature differences but also the concentration differences. These mass transfer differences do affect the rate of heat transfer. In industries, many transport processes exist in which heat and mass transfer takes place simultaneously as a result of combined buoyancy effect in the presence of thermal radiation. Hence, Radiative heat and mass transfer play an important role in manufacturing industries for the design of fins, steel rolling, nuclear power plants, gas turbines and various propulsion device for aircraft, missiles, satellites, combustion and furnace design, materials processing, energy utilization, temperature measurements, remote sensing for astronomy and space exploration, food processing and cryogenic engineering, as well as numerous agricultural, health and military applications. If the temperature of surrounding fluid is rather high, radiation effects play an important role and this situation does exist in space technology. In such cases, one has to take into account the combined effect of thermal radiation and mass diffusion. The study of magneto hydro-dynamics with mass and heat transfer in the presence of radiation and diffusion has attracted the attention of a large number of scholars due to diverse applications. In
astrophysics and geophysics, it is applied to study the stellar and solar structures, radio propagation through the ionosphere, etc. In engineering we find its applications like in MHD pumps, MHD bearings, etc. The phenomenon of mass transfer is also very common in theory of stellar structure and observable effects are detectable on the solar surface. In free convection flow the study of effects of magnetic field play a major rule in liquid metals, electrolytes and ionized gases. In power engineering, the thermal physics of hydro magnetic problems with mass transfer have enormous applications. Radiative flows are encountered in many industrial and environment processes, e.g. heating and cooling chambers, fossil fuel combustion energy processes, evaporation from large open water reservoirs, astrophysical flows, and solar power technology and space vehicle re-entry. On the other hand, Hydro magnetic free convective flows with heat and mass transfer through porous medium have many important applications such as oil and gas production, geothermal energy, cereal grain storage, in chemical engineering for filtration and purification process, in agriculture engineering to study the underground water resources and porous insulation. In view of these applications, the unsteady magneto hydrodynamic incompressible viscous flows past an infinite vertical plate thorough porous medium have received much attention.

ACTA TECHNICA CORVINIENSIS – Bulletin of Engineering
2013. Fascicule 2 [April–June] 80
MHD effects on impulsively started vertical infinite plate with variable temperature in the presence of transverse magnetic field were studied by Soundalgekar et al. [12]. The effects of transversely applied magnetic field, on the flow of an electrically conducting fluid past an impulsively started infinite isothermal vertical plate were also studied by Soundalgekar et al. [11]. The dimensionless governing equations were solved using Laplace transform technique. Kumari and Nath [8] studied the development of the asymmetric flow of a viscous electrically conducting fluid in the forward stagnation point region of a two-dimensional body and over a stretching surface were set into impulsive motion from the rest. The governing equations were solved using finite difference scheme. The radiative free convection flow of an optically thin gray-gas past semi-infinite vertical plate studied by Soundalgekar and Takhar [13]. Hossain and Takhar have considered radiation effects on mixed convection along an isothermal vertical plate [5]. In all above studies the stationary vertical plate considered. Raptis and Perdikis [10] studied the effects of thermal-radiation and free convection flow past a moving vertical plate. The governing equations were solved analytically. Das et al [4] have considered radiation effects on flow past an impulsively started infinite isothermal vertical plate. The governing equations were solved by the Laplace transform technique. Muthucumaraswamy and Janakiraman [9] have studied MHD and radiation effects on moving isothermal vertical plate with variable mass diffusion. Alam and Sattar [3] have analyzed the thermal-diffusion effect on MHD free convection and mass transfer flow. Jha and Singh [6] have studied the importance of the effects of thermal-diffusion (mass diffusion due to temperature gradient). Alam et al [1] studied the thermal-diffusion effect on unsteady MHD free convection and mass transfer flow past an impulsively started vertical porous plate. Recently, Alam et al [2], studied combined free convection and mass transfer flow past a vertical plate with heat generation and thermal-diffusion through porous medium. Rajesh and Varma [14] studied thermal diffusion and radiation effects on MHD flow past a vertical plate with variable temperature and mass diffusion. Recently, Kumar and Varma [15] investigated thermal diffusion and radiation effects on unsteady MHD flow through porous medium with variable temperature and variable mass diffusion. The objective of the present paper is to study the effects of thermal-diffusion and radiation on unsteady MHD flow through porous medium over an infinite vertical plate with variable temperature and mass diffusion in the presence of transverse applied magnetic field and heat source/sink. The dimensionless governing equations involved in the present analysis are solved using Laplace transform technique. The solutions are expressed in terms of exponential and complementary error functions. MATHEMATICAL FORMULATION An unsteady two-dimensional laminar free convection flow of a viscous, incompressible, electrically
conducting, radiating fluid past an impulsively started infinite vertical plate with variable temperature and mass diffusion through porous medium in the presence of transverse applied magnetic field are studied. A temperature dependent heat source (or sink) is assumed to be present in the flow. The plate is taken along x’-axis in vertically upward direction and y’-axis is taken normal to the plate. Initially it is assumed that the plate and fluid are at the same temperature T∞’ and concentration level C∞’ in stationary condition for all the points. At time t’>0, the plate is given an impulsive motion with a velocity u=u0 in the vertical upward direction against to the gravitational field. And at the same time the plate temperature is raised linearly with time t and also the mass is diffused from the plate to the fluid is linearly with time. A transverse magnetic field of uniform strength B0 is assumed to be applied normal to the direction of flow. The viscous dissipation and induced magnetic field are assumed to be negligible. The fluid considered here is gray, absorbing/emitting radiation but a non-scattering medium. Then under by usual Boussinesq’s approximation, the unsteady flow is governed by the following equations.
( ) ( )kuv
uyuvCCgTTg
tu
′′
−′
−′∂′∂
+′−′+′−′=′∂′∂
∞∞ ρσβ
ββ20
2
2* (1)
( )TTQyq
yT
tTc r
p ′−′′+′∂
∂−
′∂′∂
=′∂′∂
∞2
2
κρ (2)
⎟⎟⎠
⎞⎜⎜⎝
⎛′∂′∂
+′∂′∂
=′∂′∂
2
2
12
2
yTD
yCD
tC (3)
With the following initial and boundary conditions yallforCCTTut ′′=′′=′=′≤′ ∞∞ ,,,0:0
( )( ) 0
,,:0 0
=′′′−′+′=′′′−′+′=′=′>′
∞∞
∞∞
yattACCCCtATTTTuut
w
w
∞→′′→′′→′=′ ∞∞ yasCCTTu ,,0 (4)
wherev
uA20= .
The local radiant for the case of an optically thin gray gas is expressed by
( )44*4 TTayqr ′−′−=′∂
∂∞σ (5)
It is assumed that the temperature differences within the flow are sufficiently small and that T’4 may be expressed as a linear function of the temperature. This is obtained by expanding T’4 in a Taylor series about T∞’ and neglecting the higher order terms, thus we get
434 34 ∞∞ ′−′′≅′ TTTT (6) From equations (5) and (6), equation (2) reduces to
( )TTTayT
tTC p ′−′′+
′∂′∂
=′∂′∂
∞∞3*
2
2
16 σκρ (7)
On introducing the following non-dimensional quantities:
,0u
uu′
= ,20
vut
t′
= ,0
vuyy′
= ,∞
∞
′−′′−′
=TTTT
w
θ
)()(
,, 10
∞
∞
∞
∞
′−′′−′
==′−′′−′
=CCvTTD
SC
PCCCC
Cw
wr
w κμ ρ

ACTA TECHNICA CORVINIENSIS – Bulletin of Engineering
2013. Fascicule 2 [April–June] 81
( ) ( )2
20
30
30
,,v
kuK
uCCvg
Gu
TTvgG w
mw
r
′=
′−′=
′−′= ∞
•∞ ββ
,DvSc = ,2
0
20
uvB
Mρσ
=
20
2
20
32
,16uvQH
kuTvaR
κσ ′
=′
= ∞•
(8) We get the following governing equations which are dimensionless
KuMu
yuCGG
tu
mr −−∂∂
++=∂∂
2
2
θ (9)
( )θθθ HRyt
+−∂∂
=∂∂
Pr1
Pr1
2
2 (10)
2
2
2
21y
SyC
SctC
o ∂∂
+∂∂
=∂∂ θ (11)
The initial and boundary conditions in dimensionless form as follows:
:0≤′t ,0=u ,0=θ ,0 yallforC = ,0,,1:0 ====> yattCtut θ
,0→u ,0→θ .0 ∞→→ yasc (12) SOLUTION OF THE PROBLEM The appeared physical parameters are defined in the nomenclature. The dimensionless governing equations from (9) to (11), subject to the boundary conditions (12) are solved by usual Laplace transform technique and the solutions are expressed in terms of exponential and complementary error functions.
( )( )
( ) ⎥⎥⎥⎥⎥
⎦
⎤
⎢⎢⎢⎢⎢
⎣
⎡
⎟⎟⎠
⎞⎜⎜⎝
⎛−−⎟⎟
⎠
⎞⎜⎜⎝
⎛−
+⎟⎟⎠
⎞⎜⎜⎝
⎛+⎟⎟
⎠
⎞⎜⎜⎝
⎛+
=
Pr2Prexp
4Pr
2
Pr2Pr
exp4
Pr2
,St
tyerfcSy
Syt
Stt
yerfcSy
Syt
tyθ
(13)
( )
⎟⎟⎠
⎞⎜⎜⎝
⎛⎟⎠⎞
⎜⎝⎛ −+
⎥⎥⎥⎥⎥
⎦
⎤
⎢⎢⎢⎢⎢
⎣
⎡
⎟⎟⎠
⎞⎜⎜⎝
⎛−−
⎟⎟⎠
⎞⎜⎜⎝
⎛⎟⎟⎠
⎞⎜⎜⎝
⎛+
+=
tScyerfc
cbd
tScytScy
tScyerfcScyt
btyC
2
4exp
221),(
2
2
π
( )
( ) ⎥⎥⎥⎥⎥
⎦
⎤
⎢⎢⎢⎢⎢
⎣
⎡
⎟⎟⎠
⎞⎜⎜⎝
⎛−−−−+
⎟⎟⎠
⎞⎜⎜⎝
⎛−+−
−⎟⎠⎞
⎜⎝⎛ −−
ctt
ScyerfccScy
ctt
ScyerfccScy
ctcbd
2exp
2exp
)exp(21
⎥⎥⎥⎥⎥
⎦
⎤
⎢⎢⎢⎢⎢
⎣
⎡
⎟⎟⎠
⎞⎜⎜⎝
⎛−−+
⎟⎟⎠
⎞⎜⎜⎝
⎛+
⎟⎠⎞
⎜⎝⎛ −−
Pr2Pr)exp(
Pr2Pr)exp(
21
Stt
yerfcSy
Stt
yerfcSy
cbd
⎥⎥⎥⎥⎥
⎦
⎤
⎢⎢⎢⎢⎢
⎣
⎡
⎟⎟⎠
⎞⎜⎜⎝
⎛−−⎟
⎠
⎞⎜⎝
⎛−+
⎟⎟⎠
⎞⎜⎜⎝
⎛+⎟
⎠
⎞⎜⎝
⎛+
−
Pr2Pr)exp(
4Pr
2
Pr2Pr)exp(
4Pr
2
Stt
yerfcSyS
yt
Stt
yerfcSyS
yt
b
( )
( )⎥⎥⎥⎥⎥⎥
⎦
⎤
⎢⎢⎢⎢⎢⎢
⎣
⎡
⎟⎟⎠
⎞⎜⎜⎝
⎛⎟⎠⎞
⎜⎝⎛ −−−−+
⎟⎟⎠
⎞⎜⎜⎝
⎛⎟⎠⎞
⎜⎝⎛ −+−
−⎟⎠⎞
⎜⎝⎛ −+
tcSt
yerfccSy
tcSt
yerfccSy
ctcbd
Pr2PrPrexp
Pr2PrPrexp
)exp(21
( )( )
( )⎥⎥⎥⎥⎥
⎦
⎤
⎢⎢⎢⎢⎢
⎣
⎡
⎟⎟⎠
⎞⎜⎜⎝
⎛ ′−′−+
⎟⎟⎠
⎞⎜⎜⎝
⎛ ′+′
=
tMt
yerfcMy
tMt
yerfcMytyu
2exp
2exp
21,
( )
( ) ⎥⎥⎥⎥⎥
⎦
⎤
⎢⎢⎢⎢⎢
⎣
⎡
⎟⎟⎠
⎞⎜⎜⎝
⎛−−⎟
⎠
⎞⎜⎝
⎛ −+
⎟⎟⎠
⎞⎜⎜⎝
⎛+⎟
⎠
⎞⎜⎝
⎛ +
+
Pr2Prexp
4Pr
2
Pr2Prexp
4Pr
21
Stt
yerfcSyS
yt
Stt
yerfcSyS
yt
A
⎥⎥⎦
⎤
⎢⎢⎣
⎡⎟⎟⎠
⎞⎜⎜⎝
⎛−−⎟⎟
⎠
⎞⎜⎜⎝
⎛⎟⎟⎠
⎞⎜⎜⎝
⎛++
tScytScy
tScyerfcScytA
4exp
22
22
2 π
( )
⎥⎥⎥⎥⎥
⎦
⎤
⎢⎢⎢⎢⎢
⎣
⎡
⎟⎠
⎞⎜⎝
⎛ ′−′−⎟⎠
⎞⎜⎝
⎛′
−+
⎟⎠
⎞⎜⎝
⎛ ′+′⎟⎠⎞
⎜⎝⎛
′+
+−
tMt
yerfcMyMyt
tMt
yerfcMyMyt
AA
2)exp(
42
2)exp(
422
( )
( )⎥⎥⎥⎥⎥⎥
⎦
⎤
⎢⎢⎢⎢⎢⎢
⎣
⎡
⎟⎟⎠
⎞⎜⎜⎝
⎛⎟⎠⎞
⎜⎝⎛ −−−−+
⎟⎟⎠
⎞⎜⎜⎝
⎛⎟⎠⎞
⎜⎝⎛ −+−
−+
tcSt
yerfccSy
tcSt
yerfccSy
ctA
Pr2PrPrexp
Pr2PrPrexp
)exp(2
3
( )
( ) ⎥⎥⎥⎥⎥
⎦
⎤
⎢⎢⎢⎢⎢
⎣
⎡
⎟⎟⎠
⎞⎜⎜⎝
⎛−−−−+
⎟⎟⎠
⎞⎜⎜⎝
⎛−+−
−+
ctt
ScyerfccScy
ctt
ScyerfccScy
ctA
2exp
2exp
)exp(2
4
( ) ( )
( ) ( )⎥⎥⎥⎥⎥
⎦
⎤
⎢⎢⎢⎢⎢
⎣
⎡
⎟⎟⎠
⎞⎜⎜⎝
⎛−′−−′−+
⎟⎟⎠
⎞⎜⎜⎝
⎛−′+−′
−+
tlMt
yerfclMy
tlMt
yerfclMylt
A
2exp
2exp
)exp(2
5
( )
( )⎥⎥⎥⎥⎥⎥
⎦
⎤
⎢⎢⎢⎢⎢⎢
⎣
⎡
⎟⎟⎠
⎞⎜⎜⎝
⎛⎟⎠⎞
⎜⎝⎛ −−−−+
⎟⎟⎠
⎞⎜⎜⎝
⎛⎟⎠⎞
⎜⎝⎛ −+−
−−
tlSt
yerfclSy
tlSt
yerfclSy
ltA
Pr2PrPrexp
Pr2PrPrexp
)exp(2
5
( ) ( )
( ) ( ) ⎥⎥⎥⎥
⎦
⎤
⎢⎢⎢⎢
⎣
⎡
⎟⎠
⎞⎜⎝
⎛ +′−+′−+
⎟⎠
⎞⎜⎝
⎛ +′++′
+tnM
tyerfcnMy
tnMt
yerfcnMyntA
2exp
2exp
)exp(2
6
( )
( ) ⎥⎥⎥⎥⎥
⎦
⎤
⎢⎢⎢⎢⎢
⎣
⎡
⎟⎟⎠
⎞⎜⎜⎝
⎛−−+
⎟⎟⎠
⎞⎜⎜⎝
⎛+
−
ntt
ScyerfcnScy
ntt
ScyerfcnScy
ntA
2exp
2exp
)exp(2
6
( )
( )
⎟⎟⎠
⎞⎜⎜⎝
⎛+
⎥⎥⎥⎥⎥⎥⎥⎥⎥
⎦
⎤
⎢⎢⎢⎢⎢⎢⎢⎢⎢
⎣
⎡
⎟⎟⎠
⎞⎜⎜⎝
⎛−−
+⎟⎟⎠
⎞⎜⎜⎝
⎛+
+
tScyerfcA
Stt
yerfcSy
Stt
yerfcSy
A
2
Pr2Prexp
Pr2Prexp
2
8
7
( )
⎥⎥⎥⎥⎥
⎦
⎤
⎢⎢⎢⎢⎢
⎣
⎡
⎟⎟⎠
⎞⎜⎜⎝
⎛ ′+′+
⎟⎟⎠
⎞⎜⎜⎝
⎛ ′+′
+−
tMt
yerfcMy
tMt
yerfcMyAA
2)exp(
2)exp(
21
87
(15)
whereSc
ScScSbHRSK
MM−
==+=+=′Pr
,,,10
,1
,1
,Pr−′
=−
′−==
ScMn
ScMSl
Sbd
( )( )
,Pr)(
Pr)(
,Pr
Pr
,)1(,
4
3
21
ccMScScSbGmA
ccMScScSbGmA
MGmbA
MSGrbGmA
−+′−−
=
−+′−−
=
′+
=′−
−=
[ ]Pr)()(
)Pr(Pr)()1(Pr25 ccMSMSS
SMGmbcccMSSGrA−+′−′−
−′+−+′−−=
[ ])(
)1)(1(Pr)()1(26 cSccMSM
ScbcSbcSMScGmA+−′′
−+++′−=

ACTA TECHNICA CORVINIENSIS – Bulletin of Engineering
2013. Fascicule 2 [April–June] 82
27 )()Pr)(())(1(Pr
MScSScMSGmbbGmGrcSA
′−−′−+−−
=
[ ]SMc
cSccMbSbcMSccSGmA 28)(Pr)1(
′−+′−′+−
=
NUSSELT NUMBER From temperature field, now we study Nusselt number (rate of change of heat transfer) which is given in non-dimensional form as
0=⎥⎦
⎤⎢⎣
⎡∂∂
−=yy
Nu θ (17)
From equations (13) and (17), we get Nusselt number as follows:
⎥⎦
⎤⎢⎣
⎡+⎟
⎠⎞
⎜⎝⎛−+=
Pr2Pr
PrexpPr
PrSterf
SSttSterfStNu
π
SHERWOOD NUMBER From concentration field, now we study Sherwood number (rate of change of mass transfer) which is given in non-dimensional form as
0=⎥⎦
⎤⎢⎣
⎡∂∂
−=yy
CSh (18)
From equations (14) and (18), we get Sherwood number as follows:
⎥⎦
⎤⎢⎣
⎡+⎟
⎠⎞
⎜⎝⎛ −⎟
⎠⎞
⎜⎝⎛ −−
⎥⎥⎥
⎦
⎤
⎢⎢⎢
⎣
⎡
−−+
−⎟⎠⎞
⎜⎝⎛ −−
⎟⎠⎞
⎜⎝⎛ −++=
PrPrexpPr
)exp()exp(
)1(2
SterfSSttc
bd
cterfcSc
ctt
Scct
cbd
tSc
cbdtScbSh
π
π
ππ
⎥⎥⎥⎥⎥
⎦
⎤
⎢⎢⎢⎢⎢
⎣
⎡
+
⎟⎠⎞
⎜⎝⎛ −+
−
⎥⎥⎥⎥⎥
⎦
⎤
⎢⎢⎢⎢⎢
⎣
⎡
⎟⎠⎞
⎜⎝⎛ −−+
⎟⎠⎞
⎜⎝⎛ +−
−⎟⎠⎞
⎜⎝⎛ −+
Pr2Pr
PrexpPr
Pr
PrPr
PrexpPr
)exp(
SterfS
SttSterfStb
tcSerfcS
ctStt
ctcbd
π
π
RESULTS AND DISCUSSIONS In order to get the physical insight into the problem, we have plotted velocity, temperature, concentration, the rate of heat transfer and the rate of mass transfer for different values of the physical parameters like Radiation parameter (R), Magnetic parameter(M), permeability parameter (K), Soret number(So), Schmidt number (Sc), Thermal Grashof number (Gr), Mass Grashof number (Gm), time (t) and Prandtl number (Pr) in Figures 1-11 and Tables 1-4 for the cases of heating (Gr < 0, Gm < 0) and cooling (Gr > 0, Gm > 0) of the plate at time t = 0.2 or t=0.4. The heating and cooling take place by setting up free-convection current due to temperature and concentration gradient. Figure 1 reveals the effect magnetic field parameter on fluid velocity and we observed that an increase in magnetic parameter M the velocity decreases in cases of cooling and heating of the plate for Pr = 0.71. It is due to fact that the application of transverse magnetic field will result a resistive type force (Lorentz force) similar to drag force, which tends to resist the fluid flow and thus reducing its velocity. Figure (2) displays the influence of thermal-diffusion parameter (soret number So) on the velocity field in both cases of cooling and heating of the plate. it is
found that the fluid velocity increases with increasing values of So in case of cooling of the plate and a reverse effect is observed in the case of heating of the plate.
0 0.2 0.4 0.6 0.8 1 1.2 1.4 1.6 1.8 2-0.2
0
0.2
0.4
0.6
0.8
1
1.2
y
Vel
ocity
M=1, Gr=15, Gm=10M=3, Gr=15, Gm=10
M=5, Gr=15, Gm=10
M=7, Gr=15, Gm=10
M=9, Gr=15, Gm=10M=1, Gr=-15,Gm=-10
M=3, Gr=-15,Gm=-10
M=5, Gr=-15,Gm=-10
M=7, Gr=-15,Gm=-10M=9, Gr=-15,Gm=-10
Figure 1: Velocity profiles for different M
with so=5, Sc=2.01, Pr=0.71,K=0.5,R=10, H=4, and t=0.2
0 0.2 0.4 0.6 0.8 1 1.2 1.4 1.6 1.8 2-0.4
-0.2
0
0.2
0.4
0.6
0.8
1
1.2
y
Vel
ocity
So=1, Gr=15, Gm=10
So=5, Gr=15, Gm=10
So=10,Gr=15, Gm=10
So=15,Gr=15, Gm=10
So=20,Gr=15, Gm=10
So=1, Gr=-15,Gm=-10
So=5, Gr=-15,Gm=-10
So=10,Gr=-15,Gm=-10
So=15,Gr=-15,Gm=-10
So=20,Gr=-15,Gm=-10
Figure 2: Velocity profiles for different So
with M=3, Sc=2.01, Pr=0.71, K=0.5, R=10, H=4, and t=0.2
Figure 3&4 show the effects of Gr (thermal Grashof number) and Gm (mass Grashof number) and time t on the velocity field u. From these figures it is found that the velocity u increases as thermal Grashof number Gr or mass Grashof number Gm or time t increases in case of cooling of the plate. It is because that increase in the values of thermal Grashof number and mass Grashof number has the tendency to increase the thermal and mass buoyancy effect. This gives rise to an increase in the induced flow transport. And a reverse effect is identified in case of heating of the plate.
0 0.2 0.4 0.6 0.8 1 1.2 1.4 1.6-0.2
0
0.2
0.4
0.6
0.8
1
1.2
y
Vel
ocity
Gr=15, Gm=10
Gr=20, Gm=10
Gr=15, Gm=15
Gr=-15,Gm=-10
Gr=-20,Gm=-10
Gr=-15,Gm=-15
Figure 3: Velocity profiles for different Gr & Gm with so=5,
Sc=2.01, M=3, R=10, H=4, K=0.5, Pr=0.71 and t=0.2

ACTA TECHNICA CORVINIENSIS – Bulletin of Engineering
2013. Fascicule 2 [April–June] 83
0 0.5 1 1.5 2 2.5 3-3
-2
-1
0
1
2
3
y
Vel
ocity
t=0.2, Gr=15, Gm=10
t=0.4, Gr=15, Gm=10
t=0.6, Gr=15, Gm=10
t=0.8, Gr=15, Gm=10
t=0.2, Gr=-15,Gm=-10
t=0.4, Gr=-15,Gm=-10
t=0.6, Gr=-15,Gm=-10
t=0.8, Gr=-15,Gm=-10
Figure 4: Velocity profiles for different time t
with so=5, M=3, Pr=0.71, R=10, H=4, K=0.5 Table 1: Velocity for different R for Gr=15, Gm=10
(cooling of the plate) with So=5, Sc=2.01, Pr=0.71, M=3, H=4, K=0.5 and t=0.2
y R=2 R=4 R=6 R=8 0.0 0.2 0.4 0.6 0.8 1.0 1.2 1.4 1.6 1.8 2.0
1.0000 0.7741 0.5474 0.3509 0.2046 0.1090 0.0533 0.0240 0.0099 0.0038 0.0013
1.0000 0.7774 0.5492 0.3501 0.2025 0.1068 0.0517 0.0230 0.0094 0.0036 0.0013
1.0000 0.7805 0.5509 0.3494 0.2006 0.1050 0.0503 0.0222 0.0090 0.0034 0.0012
1.0000 0.7834 0.5524 0.3488 0.1989 0.1033 0.0492 0.0215 0.0087 0.0032 0.0011
Table 2: Velocity for different R for Gr=-15, Gm=-10 (Heating of the plate) with So=5, Sc=2.01, Pr=0.71, M=3,
H=4, K=0.5 and t=0.2 y R=2 R=4 R=6 R=8
0.0 0.2 0.4 0.6 0.8 1.0 1.2 1.4 1.6 1.8 2.0
1.0000 0.4613 0.1922 0.0735 0.0265 0.0093 0.0033 0.0011 0.0003 0.0001 -0.0000
1.0000 0.4580 0.1904 0.0744 0.0287 0.0115 0.0049 0.0021 0.0008 0.0003 0.0001
1.0000 0.4550 0.1888 0.0751 0.0306 0.0134 0.0062 0.0029 0.0012 0.0005 0.0002
1.0000 0.4521 0.1872 0.0757 0.0322 0.0150 0.0074 0.0035 0.0016 0.0006 0.0002
Table 3: Velocity for different H for Gr=15, Gm=10 (cooling of the plate) with So=5, Sc=2.01, Pr=0.71, M=3,
R=10, K=0.5 and t=0.2 y H=1 H=3 H=5 H=7
0.0 0.2 0.4 0.6 0.8 1.0 1.2 1.4 1.6 1.8 2.0
1.0000 0.7819 0.5517 0.3491 0.1997 0.1041 0.0497 0.0218 0.0088 0.0033 0.0011
1.0000 0.7848 0.5532 0.3485 0.1982 0.1026 0.0486 0.0212 0.0085 0.0032 0.0011
1.0000 0.7874 0.5546 0.3480 0.1968 0.1012 0.0477 0.0207 0.0083 0.0031 0.0010
1.0000 0.7899 0.5559 0.3476 0.1955 0.1000 0.0469 0.0202 0.0081 0.0030 0.0010
Table 4: Velocity for different H for Gr=-15, Gm=-10 (Heating of the plate) with So=5, Sc=2.01, Pr=0.71,
M=3,R=10, a=0.5 and t=0.2 y H=1 H=3 H=5 H=7
0.0 0.2 0.4 0.6 0.8 1.0 1.2 1.4 1.6 1.8 2.0
1.0000 0.4535 0.1880 0.0754 0.0314 0.0143 0.0068 0.0032 0.0014 0.0006 0.0002
1.0000 0.4507 0.1865 0.0759 0.0330 0.0158 0.0079 0.0038 0.0017 0.0007 0.0002
1.0000 0.4480 0.1851 0.0765 0.0344 0.0171 0.0088 0.0044 0.0020 0.0008 0.0003
1.0000 0.4456 0.1838 0.0769 0.0356 0.0183 0.0097 0.0048 0.0022 0.0009 0.0003
From Tables 1-4 it is observed that with the increase of radiation parameter R or heat source parameter the velocity increases up to certain y value (distance from the plate) and decreases later for the case of cooling of the plate. But the trend is just reversed in case of heating of the plate. From figure (5) it is seen that in both cases of cooling and heating, the velocity increases as permeability of the porous medium (K) increases.
0 0.2 0.4 0.6 0.8 1 1.2 1.40
0.2
0.4
0.6
0.8
1
1.2
1.4
y
Vel
ocity
K=1.0, Gr=15, Gm=10
K=10, Gr=15, Gm=10
K=1.0, Gr=-15,Gm=-10
K=10, Gr=-15,Gm=-10
Figure 5: Velocity profiles for different K with M=3,
Sc=2.01, Pr=0.71, R=10, H=4 and t=0.2 The temperature of the flow field is mainly affected by the flow parameters, namely, Radiation parameter (R) and the heat source parameter (H). The effects of these parameters on temperature of the flow field are shown in figures 6. It is observed that as radiation parameter R or heat source parameter H increases the temperature of the flow field decreases at all the points in flow region.
0 0.2 0.4 0.6 0.8 1 1.2 1.4 1.6 1.8 20
0.05
0.1
0.15
0.2
0.25
0.3
0.35
0.4
y
Tem
pera
ture
R=1, H=4, t=0.2
R=5, H=4, t=0.2
R=10,H=4,t=0.2
R=1, H=12,t=0.2
R=1, H=4, t=0.4
R=5, H=4, t=0.4
R=10,H=4,t=0.4
R=1, H=12,t=0.4
Figure 6: Temperature profiles for different R and H
0 0.2 0.4 0.6 0.8 1 1.2 1.4 1.6 1.8 20
0.5
1
1.5
2
2.5
3
3.5
4
y
Con
cent
ratio
n
So=1, t=0.2So=5, t=0.2
So=10, t=0.2
So=15, t=0.2So=20, t=0.2
So=25, t=0.2
So=1, t=0.4
So=5, t=0.4So=10, t=0.4
So=15, t=0.4
So=20, t=0.4So=25, t=0.4
Figure 7: Concentration profiles for different So
with R=4, H=1, Sc=2.01 and Pr=0.71 The concentration distributions of the flow field are displayed through figures 7, 8 & 9. It is affected by three flow parameters, namely Soret number (So), Schmidt number (Sc) and radiation parameter(R) respectively. From Figure 7 it is observed that the concentration increases with an increase in So (Soret number). Figure 8 & 9 reveal the effect of Sc and R on the concentration distribution of the flow field.

ACTA TECHNICA CORVINIENSIS – Bulletin of Engineering
2013. Fascicule 2 [April–June] 84
The concentration distribution is found to increase faster up to certain y value (distance from the plate) and decreases later as the Schmidt parameter (Sc) or Radiation parameter (R) become heavier.
0 0.2 0.4 0.6 0.8 1 1.2 1.4 1.6 1.8 20
0.2
0.4
0.6
0.8
1
1.2
1.4
1.6
1.8
y
Con
cent
ratio
n
Sc=0.78, t=0.2
Sc=0.96, t=0.2
Sc=1.30, t=0.2
Sc=1.60, t=0.2
Sc=2.01, t=0.2
Sc=0.78, t=0.4
Sc=0.96, t=0.4
Sc=1.30, t=0.4
Sc=1.60, t=0.4
Sc=2.01, t=0.4
Figure 8: Concentration profiles for different Sc
with So=5, Pr=0.71, R=4 and H=1
0 0.2 0.4 0.6 0.8 1 1.2 1.4 1.6 1.8 20
0.2
0.4
0.6
0.8
1
1.2
1.4
y
Con
cent
ratio
n
R=1, H=4, t=0.2
R=5, H=4, t=0.2
R=10,H=4, t=0.2
R=1, H=12,t=0.2
R=1, H=4, t=0.4
R=5, H=4, t=0.4
R=10,H=4, t=0.4
R=1, H=12,t=0.4
Figure 9: Concentration profiles for different R
with So=5, Sc=2.01, H=1 and Pr=0.71
0 0.5 1 1.5 2 2.5 3 3.5 40
1
2
3
4
5
6
7
8
9
10
t
Nu
Pr=0.71,R=1
Pr=0.71,R=2
Pr=0.71,R=3
Pr=7,R=1
Pr=7,R=2
Pr=7,R=3
Figure 10: Nusselt Number
0.5 1 1.5 2 2.5 3 3.5 4
-35
-30
-25
-20
-15
-10
-5
0
t
She
rwoo
d nu
mbe
r
So=1, Sc=2.01, R=2
So=2, Sc=2.01, R=2
So=3, Sc=2.01, R=2
So=1, Sc=4.0, R=2
So=1, Sc=6.0, R=2
So=1, Sc=2.01, R=6
So=1, Sc=2.01, R=10
Figure 11: Sherwood number for different Sc, So and R
Nusselt number is presented in Figure 10 against time t. From this figure the Nusselt number is observed to increase with increase in R for both water (Pr=7.0) and air (Pr=0.71). It is also observed that Nusselt number for water is higher than that of air (Pr=0.71). The reason is that smaller values of Pr are equivalent to increasing the thermal conductivities and therefore heat is able to diffuse away from the plate
more rapidly than higher values of Pr, hence the rate of heat transfer is reduced. Finally, from Figure 11 it is seen that the Sherwood number decreases with increase in Sc (Schmidt number), So (Soret number) and R (radiation parameter). NOMENCLATURE a*-Absorption coefficient K-Permeability parameter H-Heat source parameter B0-External magnetic field C’-Species concentration Cw’-Concentration of the plate C∞’-Concentration of fluid far away from the plate C-Dimensionless concentration Cp-Specific heat at constant pressure D-Chemical molecular diffusivity D1-Coefficient of thermal diffusivity g-Acceleration due to gravity Gr-Thermal Grashof number Gm-Mass Grashof number M-Magnetic field parameter Nu-Nusselt number Pr-Prandtl number qr-Radiative heat flux in the y- direction R-Radiative parameter Sc-Schmidt number S0-Soret number Sh-Sherwood number T-Temperature of the fluid near the plate Tw’-Temperature of the plate T∞’-Temperature of the fluid far away from the plate t’-Time t-Dimensionless time u’-Velocity of the fluid in the x’ - direction uo-Velocity of the plate u-Dimensionless velocity y’-Co-ordinate axis normal to the plate y-Dimensionless co-ordinate axis normal to the plate Greek symbols: К-Thermal conductivity of the fluid α-Thermal diffusivity β-Volumetric coefficient of thermal expansion β*-Volumetric coefficient of expansion with concentration μ-Coefficient of viscosity υ-Kinematic viscosity ρ-Density of the fluid σ-Electric conductivity θ-Dimensionless temperature erf-Error function erfc-Complementary error function Subscripts: ω-Conditions on the wall ∞-Free stream conditions REFERENCES [1] M.S. Alam, M.M. Rahman and M.A. Maleque,
Local similarity solutions for unsteady MHD free convection and mass transfer flow past an impulsively started vertical porous plate with Dufour and Soret effects, Thammasat int.j.sci.tech. 10(3) (2005), 1-8.
[2] M.S. Alam, M.M. Rahman and M.A. Samad, Numerical study of the combined free-forced convection and mass transfer flow past a vertical porous plate in a porous medium with heat

ACTA TECHNICA CORVINIENSIS – Bulletin of Engineering
2013. Fascicule 2 [April–June] 85
generation and thermal diffusion, Nonlin. Anal.Model. Control 11(4) (2006), 331-343
[3] M.M. Alam and M. A. Sattar, Transient MHD heat and mass transfer flow with thermal diffusion in a rotating system, J. Energy Heat Mass trans. 21 (1999)m 9-21.
[4] U.N. Das, R.K. Deka and V.M. Soundalgekar, Radiation effects on flow past an impulsively started vertical infinite plate, J.theo. Mech. 1(1996), 111-115.
[5] M.A. Hossain and H. S. Takhar, Radiation effect on mixed convection along a vertical plate with uniform surface temperature, Heat Mass Trans. 31(1996), 243-248.
[6] B. K. Jha and A. K. Singh, Soret effects on free-convection and mass transfer flow in the Stokes problem for a infinite vertical plate, Astrophys. Space Sci. 173(2) (1990).
[7] N.G. Kafoussias, MHD thermal –diffusion effects on free convective and mass transfer flow over an infinite vertical moving plate. Astrophys.Space Sci. 192(1) (1992), 11-19.
[8] M. Kumari and G. Nath, Development of two-dimensional boundary layer with an applied magnetic field due to an impulsive motion, Indian J. pure Appl. Math. 30 (1999), 695-708.
[9] R. Muthucumaraswamy and B. Janakiraman, MHD and radiation effects on moving isothermal vertical plate with variable mass diffusion, Theo. Appl. Mech. 33(1) (2006), 17-29.
[10] A. Raptis and C. Perdikis, Radiation and free convection flow past a moving plate, Int. J.Appl Mech. Eng. 4(1999), 817-821.
[11] V.M. Soundalgekar, S.K. Gupta and N.S. Birajdar, Effects of mass transfer and free convection currents on MHD Stokes problem for a vertical plate, Nuclear Eng. Des. 53(1979), 339-346.
[12] V.M. Soundalgekar, M.R.Patil and M.D. Jahagirdar, MHD Stokes problem for a vertical plate with variable temperature, Nuclear Eng. Des. 64(1981), 39-42.
[13] V.M. Soundalgekar and H.S. Takhar, Radiation effects on free convection flow past a semi-infinite vertical plate, Model. Measure.Comrol (1993), 31-40.
[14] V. Rajesh and S.V.K. Varma, Thermal diffusion and radiation effects on MHD flow past an infinite vertical plate with variable temperature and mass diffusion, JP Journal of Heat and Mass Transfer, Vol3, Issue1,Feb(2009).
[15] A.G.V. Kumar and S.V.K. Varma, Thermal diffusion and Radiation effects on MHD flow through porous medium with variable temperature and variable mass diffusion, Int. J. of Fluids Engineering, Vol.3, No.3, (2011), pp.353-368.
ACTA TECHNICA CORVINIENSIS – BULLETIN of ENGINEERING
ISSN: 2067-3809 [CD-Rom, online]
copyright © UNIVERSITY POLITEHNICA TIMISOARA, FACULTY OF ENGINEERING HUNEDOARA,
5, REVOLUTIEI, 331128, HUNEDOARA, ROMANIA http://acta.fih.upt.ro

ACTA TECHNICA CORVINIENSIS – Bulletin of Engineering
© copyright FACULTY of ENGINEERING ‐ HUNEDOARA, ROMANIA
ACTA TECHNICA CORVINIENSIS – BULLETIN of ENGINEERING
ISSN: 2067-3809 [CD-Rom, online]
copyright © UNIVERSITY POLITEHNICA TIMISOARA, FACULTY OF ENGINEERING HUNEDOARA,
5, REVOLUTIEI, 331128, HUNEDOARA, ROMANIA http://acta.fih.upt.ro
ACTA TECHNICA CORVINIENSIS – BULLETIN of ENGINEERING
ISSN: 2067-3809 [CD-Rom, online]
copyright © UNIVERSITY POLITEHNICA TIMISOARA, FACULTY OF ENGINEERING HUNEDOARA,
5, REVOLUTIEI, 331128, HUNEDOARA, ROMANIA http://acta.fih.upt.ro

© copyright FACULTY of ENGINEERING ‐ HUNEDOARA, ROMANIA 87
1. Luba BICEJOVA, 2. Martina NOVAKOVA, 3. Juliana LITECKA
MODIFICATIONS OF THE WATER JET SPLITTING
1-3. TECHNICAL UNIVERSITY OF KOSICE, FACULTY OF MANUFACTURING TECHNOLOGIES WITH A SEAT IN PRESOV, STUROVA 31, 080 01 PRESOV, SLOVAKIA
ABSTRACT: Water jet cutting technology represents a high-performance cutting and shape dividing of all materials. The factors that influence the properties of machined surface can be summarized as factors of liquid hydrodynamic properties, technical factors influencing hydro-erosive process and technological factors influencing hydro-erosive surface of the cutting. Technology of the water jet cutting present progressive approach with unique possibilities that enables shape cutting and dividing of various hard-to-process materials without producing the heat-affected zone of cutting edge within the workpiece. The paper is focused on practical aspects of the AWJ technology setup alternatives; particularly on those which are connected with splitting of the high pressure jet. KEYWORDS: water jet technology, cold cutting, multi-head cutting
INTRODUCTION A water power in its erosive form exists in nature for millions of years. High-pressure water jet cutting known as Jet-Cutting has been continually developed for several decades. An important impulse for water jet using in production technology as a tool has come from aircrafts construction and space technologies areas [1,2]. Water jet cutting technology represents a high-performance cutting and shape dividing of all materials. The best advantage of this technology comparing to the other dividing methods is a process of cold cutting. It is used in conditions where splinter-less, splinter and thermic production technologies provide due to mechanical or physical reasons unsatisfying results or where they totally fail [3]. The factors that influence the properties of machined surface can be summarized as factors of liquid hydrodynamic properties, technical factors influencing hydro-erosive process and technological factors influencing hydro-erosive surface of the cutting [4-6]. The paper is discussing some of the newest trends in the area of the AWJ utilization in the field of production engineering and has been created within cooperation with WATTING firm in Presov. METHODOLOGY According to common setups, hydroabrasive cutting is performed on one cutting desk with one technological head (water nozzle 0.35, abrasive nozzle 1.1 and abrasive flow 650 g/min). The core parts of high-pressure cutting device are high-pressure pump, pump with pressure converter, multiplicator with oil-hydraulic drive and pressure accumulator.
Water pressure is being fed along a high-pressure pipe into the cutting head which is controlled by an electro-pneumatic valve. The water jet cutting principle (Fig. 1) and subsequent cutting with high-pressure water splitting, i.e. cutting with two heads simultaneously (Fig. 2) are possible models of water jet splitting [7,8].
(a)
(b) Figure 1: Schematic representation of the principles of
water jet cutting and hydroerosion cutting: (a) WJM (hydrodynamic water jet) and (b) AWJM
(hydroabrasive water jet)

ACTA TECHNICA CORVINIENSIS – Bulletin of Engineering
2013. Fascicule 2 [April–June] 88
a)
b)
c) Figure 2: Models of water jet splitting into two heads: a) Model of KMWJ-WW based on principles WJM + WJM; b) Model of KMWJ-WA based on principles WJM + AWJM; c) Model of KMWJ-AA based on principles AWJM + AWJM
In the case of two cutting desks, one head for one desk is commonly used. Cutting performance of each of them is designed according to the high-pressure pump performance. Such a way was carried out at the working place of WATING Presov where cutting heads were designed according to a variant I, where head markings are Dw/Da/Pw and where Dw represents inner nozzle diameter, Da represents inner abrasive nozzle diameter and Pw represents water flow rate per minute. In the case of two cutting desks, one head for one desk is commonly used. Cutting performance of each of them is designed according to the high-pressure pump performance. Such a way was carried out at the working place of WATING Presov where cutting heads were designed according to a variant I, where head markings are Dw/Da/Pw and where Dw represents inner nozzle diameter, Da represents inner abrasive nozzle diameter and Pw represents water flow rate per minute.
Variant I: 1st desk – head 0.35/1.02/3.25 and 2nd desk – head 0.35/1.02/3.25
In accordance with requirements for cutting and to increase competitiveness in the market, new possibilities to increase performance without shifting demands were being looked for. One of them is water jet splitting. In the case of water jet splitting into two cutting heads simultaneously on one cutting desk or on two cutting desks, it is possible to combine the cutting heads in variants according to technology producer recommendation. In this case, the water jet splitting has been performed contrarily to recommendation of the technology producer for two cutting heads on both desks simultaneously. Combinations of different water nozzles to abrasive nozzle with inner diameter of 0.76 mm were used, accordingly to the variants 1 – 3 with corresponding Dw/Da/Pw:
Variant 1: 1st desk – head 0.20/0.76/1.05 2nd desk – head 0.25/0.76/1.65
Variant 2: 1st desk – head 0.20/0.76/1.05 2nd desk – head 0.30/0.76/2.37
Variant 3: 1st desk – head 0.25/0.76/1.65 2nd desk – head 0.25/0.76/1.65
Figure 3: Hydroerosive jet surrounded by water mist
(a) AWJM – water mist (b) AWJM – dispersion of abrasive material into the water mist
Figure 3 shows the hydroerosive jet with clear water mist surrounding water-abrasive suspension flowing out the abrasive nozzle. Inside the mist, a very tiny amount of abrasive particles can be found. This phenomenon of hydroerosive jet structure confirms that the lift of the nozzle over the material influences upper erosive edge of cut material. RESULTS AND DISCUSSION. One head cutting costs formula – model KMN1 On the base of long-term practical experience, costs for one head cutting can be calculated with help of

ACTA TECHNICA CORVINIENSIS – Bulletin of Engineering
2013. Fascicule 2 [April–June] 89
cost function which should include both direct and indirect expenses. Suggested cost function used in WATING Prešov for one head cutting took into account all suggested cost items:
CKMN1 = (CA + CW + CE + CU + CM + CH + CP) x 1 / PV [EUR per mm of cut]
where: CA – abrasive material costs; CW – water processing and consumption costs; CE – energy costs (high-pressure pump, XY-desk, cooling, air); CU – consumables costs, water and abrasive, focusing nozzles; CM – handling and storage costs (fork-lift truck, crane, pallets etc.); CH – other indirect variable costs (salary, planned maintenance, amortization etc.); CP – other all operating costs (overhead, testing cuttings, preparations etc.); PV – number of products made at one-layer cutting (depends on the number of cut layers) Subsequently, it is possible to create also a cost function of two heads hydroerosive jet parallel cutting which is considered a contribution for future users in practice. For parallel two heads cutting, suggested costs function takes into account all principal costs items which are related to it. Two heads cutting costs formula – model KMN2 Based on the previous statements, it is possible to formulate a cost function for two heads simultaneous hydroerosive jet splitting which is considered to be a positive contribution for next users in the field:
CKMN2 = (CA + CW + CH + CP + 2x (CE + CU + CM)) x 1/ PV [EUR per mm of cut]
where the parameters are the same as for model KMN1.
Figure 4: Dependence of roughness,
flow rate and head lift On the base of submitted approaches to hydroerosive jet dividing, in the framework of extended survey of WATTING with material AISI 304, thickness 15 mm, high-pressure water jet was split according to various flow rates. Complex identification of technical, technological, measured and interpreted factors presents sum of 25 factors which can be mutually compared in various interpreting relations. Similarly, an important result was obtained (see Fig. 4) showing relation between surface cutting topography roughness and flow rate as well as head lift.
That was interesting to find that the abrasive flow was in such condition for cutting with both one head and two heads lower by one third. An influence of abrasive weight was tested at values of 100, 150, 200 and 250 g/min. Final evaluation showed optimal weight values in the range of 180 - 250 g/min. Finally, verification on the samples (thickness 8 mm and 30 mm, respectively) was carried out. The reason was to work out a methodology of identification of technology and cutting factors for various thicknesses of material AISI 304 and for other kinds of materials being cut by hydroabrasive erosion. Verification of formulated factors was finally carried out on samples made of material AISI 304, thickness 8 mm. Figure 5 shows pieces of verified samples.
Figure 5: Verified samples, thickness 8 mm
Cutting parameters of verified samples mentioned above were recorded and graphically representation of the evaluation is given in Figure 6.
y = 0,1844x - 1,452R2 = 0,9976
y = 0,1362x - 1,226R2 = 0,9406
y = 0,1775x - 5,315R2 = 0,966
y = 0,1283x - 2,808R2 = 0,9131
y = 0,1894x - 11,616R2 = 0,9892
y = 0,1205x - 5,385R2 = 0,9876
y = 0,1704x - 13,078R2 = 0,9582
y = 0,594x - 80,955R2 = 0,9364
y = 0,2922x - 23,61R2 = 0,9934
0
5
10
15
20
25
0 20 40 60 80 100 120 140 160 180
Rýchlosť rezu [mm/min]
Drs
nosť
Ra
[mik
rón]
A=100; Z=4; Dw=0,25; Da=0,76 A=150; Z=4; Dw=0,25; Da=0,76 A=150; Z=4; Dw=0,25; Da=0,76A=200; Z=4; Dw=0,25; Da=0,76 A=200; Z=4; Dw=0,25; Da=0,76 A=250; Z=4; Dw=0,25; Da=0,76A=250; Z=4; Dw=0,25; Da=0,76 A=250; Z=4; Dw=0,25; Da=0,76 A=200; Z=4; Dw=0,25; Da=0,76Lineárny (A=100; Z=4; Dw=0,25; Da=0,76) Lineárny (A=150; Z=4; Dw=0,25; Da=0,76) Lineárny (A=150; Z=4; Dw=0,25; Da=0,76)Lineárny (A=200; Z=4; Dw=0,25; Da=0,76) Lineárny (A=200; Z=4; Dw=0,25; Da=0,76) Lineárny (A=250; Z=4; Dw=0,25; Da=0,76)Lineárny (A=250; Z=4; Dw=0,25; Da=0,76) Lineárny (A=250; Z=4; Dw=0,25; Da=0,76) Lineárny (A=200; Z=4; Dw=0,25; Da=0,76)
Figure 6: Relation between roughness (y-axis) and cutting speed (x-axis) for various abrasive flow rates for AISI 304
material verification, thickness of 8 mm CONCLUSIONS Water jet cutting technology and high-pressured water split into two jets represent progressive approach to the shape cutting and dividing of various kinds of materials without producing of the heat-affected zone at cutting edge of the workpiece. Various designs with respect to the jet splitting are experimentally verified and discussed. Results are important for contemporary practice and from hydroabrasive cutting economy point of view. Presented work provides an important extension of water jet cutting technology itself with an ambition

ACTA TECHNICA CORVINIENSIS – Bulletin of Engineering
2013. Fascicule 2 [April–June] 90
to test possible ways to definition of cutting parameters which would guarantee both technology and economy aspects of water jet cutting process at high-pressure water split into two smaller water flow rates or at one smaller water flow rate. REFERENCES [1] VASILKO, K., GOMBÁR, M. 2006. The influence of
machining parameters on the machined surface quality, in: Modern Metrology in Quality Management Systems, Wydawnictwo Politechniki Swietokryzskiej, Kielce, pp. 275-284
[2] KMEC, J., SOBOTOVA, L. 2011. Progresívne delenie hydroeróziou, in: Proc. of 4th Int. Conf. Strojírenská technologie; 25.-26.1.2011, Plzeň, Czech Republic, ZČU Plzeň, pp. 1-6 (in Slovak)
[3] FABIAN, S., KRENICKY, T. 2008. Vibrodiagnostika výrobných systémov s technológiou AWJ, Spravodaj ATD SR, No. 1, pp. 26-27 (in Slovak)
[4] KMEC, J. 2002. Tlak a prietok vysokotlakej vody v technológii vodný lúč, in: Proc. of 6th Int. Sci. Conf. “Nové smery vo výrobnom inžinierstve 2002”, Prešov, 13.-14.6.2002, FMT TUKE Prešov, pp. 71-73 (in Slovak)
[5] KMEC, J. 2007. Vodný lúč - Modelovanie ekonomických nákladov rezania, in: Proc. of 8th Int. Sci. Conf. “Technology Systems Operation 2007”, 21.-23.11.2007, FMT TUKE, Prešov, pp. 1-3 (in Slovak)
[6] JACKO, P., KRENICKY, T., RIMAR, M. 2011. Identifikácia procesných vibrácií hlavice systému AWJ, in: Proc. of workshop ARTEP 2011, TU Košice, pp. 22/1-22/5 (in Slovak)
[7] KMEC, J., SOBOTOVA, L. 2011. Models of water jet dividing, in: Výrobné inžinierstvo, Vol. 10, No. 2, pp. 24-26
[8] KMEC, J., GOMBÁR, M., FAČKOVEC, R. 2011. Vysokotlakový systém vody v čerpadle pre technológiu vodný lúč, in: Progresívne metódy obrábania: práce Výskumného centra progresívnych metód obrábania v r. 2011, FMT TUKE Prešov, pp. 30-38 (in Slovak)
ACTA TECHNICA CORVINIENSIS – BULLETIN of ENGINEERING
ISSN: 2067-3809 [CD-Rom, online]
copyright © UNIVERSITY POLITEHNICA TIMISOARA, FACULTY OF ENGINEERING HUNEDOARA,
5, REVOLUTIEI, 331128, HUNEDOARA, ROMANIA http://acta.fih.upt.ro

© copyright FACULTY of ENGINEERING ‐ HUNEDOARA, ROMANIA 91
1. Fazdliel Aswad IBRAHIM, 2. Mohd Wira Mohd SHAFIEI, 3. Abdelnaser OMRAN, 4. Ilias SAID
RATING SYSTEMS IN HOUSING DESIGN AND DEVELOPMENT
1-4. SCHOOL OF HOUSING, BUILDING AND PLANNING, UNIVERSITI SAINS MALAYSIA, PENANG, MALAYSIA
ABSTRACT: Green or sustainable design approach in all industries and sectors has become a demand of the global world. The negative impacts of the industries such climate change; global warming, ozone depletion and inefficient resource consumption have received a great concern and awareness among the public, politicians and academicians. Thus, a lot of efforts have been implemented either in terms of theories or practices in order to reduce the negative impacts of the industries. In the building sector, the sustainable building rating systems (SBRS) and certification systems has been designed and adopted in the building sector which intended to foster more sustainable building design, construction and operations by promoting and making possible a better integration of environmental concerns with cost and other traditional decision criteria. However, most of the internationally devised rating systems and certification system have been tailored to suit the building sector of the country where they were developed. Despite the different rating system adopted for the building sector in different country, these rating systems shared the common elements. Therefore, the aim of this paper is to explore the elements used in SBRS and the classification of certification system. This paper will start with the historic of sustainable development and green design, subsequently followed with the discussion on the SBRS adopted which focused only for Asian region and lastly, discussion on the unique elements of SBRS. KEYWORDS: Sustainable Development, Green Building, Building Sector, SBRS
INTRODUCTION Currently, sustainable approach has become a global demand in order to meet the current needs and future generations. However, to achieve this objective, it requires changes from all sectors and industries. For instance, in the automotive industry, developments of hybrid cars and other types of vehicle that reduces emissions have taken top priority in research and development [1,2]. While in the retailers sector, they are urged to reduce the numbers of plastic bags they hand out to the consumer and replace the plastic bag to degradable product such paper bag. Thus, the need for such similar approaches in the building industry need not be further elaborated. The construction industry is acknowledged as one of the industries that contribute to the major problems on the environmental, human health and energy consumption [3,4,5 & 6]. According to the (UNEP SBCI, 2009) in the “Building and Climate Change” report, the building sector in the developed and developing countries contributed as much as one third (30%) of total global greenhouse gas emissions and consumes up to 40% of all energy. Given the massive growth in new construction in the economic transition, and the inefficiencies of existing building stock worldwide, if nothing is done, this scenario would become worst. In order to promote and facilitate the sustainable practice among the construction players, the building rating systems has been introduced. The building rating system is a
building evaluation tools that focus on different areas of sustainable development and are designed for different types of projects (Fowler & Rauch, 2006). However, there are various building evaluation tools has been designed and used in different regions and countries. These evaluation tools have similarities and differences in rating system between regions and countries which it depend on the local conditions [7]. Therefore, this paper is embarks on the following objectives: 1. To review SBRS in Asian countries, 2. Study the elements of these SBSR, and 3. To discuss the unique characteristics of each of all
these SBRS for the improvement of the discussed SBRS, if there is any.
BACKGROUND OF SUSTAINABLE DESIGN Sustainable or green in the construction industry is a concept to satisfy the objectives of sustainable development. Historically, the sustainable development was established in 1987 by the World Commission on Environment and Development [8,9]. The sustainable development was defined as “…the development that meets the needs of the present without compromising the ability of future generations to meet their own needs…” [10,8,3]. The main objective of sustainable development is to treat triple aspect, namely economic, social and environmental equally [11]. This triple bottom line has become a benchmark definition that has been adopted by various publications to base ideas, claims and support sustainability related findings [12]. The

ACTA TECHNICA CORVINIENSIS – Bulletin of Engineering
2013. Fascicule 2 [April–June] 92
second meeting of United Nations Earth Summit in 1992 was intended to bring sustainability to the fore in policy [13]. During this meeting, the Agenda 21 was formulated which it specifically refers to role of human settlements in sustainable development as highlighted in the Chapter 7 [14]. It is widely accepted that the human settlements is the best place to influence the sustainable development because it ‘end product’, the built environment is the context for the majority of human activity [14 & 15). To support the call for sustainable development, the First International Conference on Sustainable Construction was held in Tampa, Florida in 1994 [16,12,17]. The conference convener, Kibert defined sustainable construction as ‘…the creation and responsible maintenance of a healthy built environment based on resource efficient and ecological principles…’ [18,19]. As suggested in this conference, there are seven principles in practicing sustainable design [20]: � Minimize resource consumption (conserve); � Maximize resource reuse (reuse); � Use renewable or recyclable resources
(renew/recycle); � Protect the natural environment (protect nature); � Create a healthy, non-toxic environment (non-
toxics); � Life cycle cost analysis and true cost (economics);
and � Pursue quality in creating the built environment
(quality) To achieve the sustainable design principles, a rating system tool and certificate of classification has been devised by various countries. The development of rating system has been tailored to suit the building sector of the country where they were developed. However, it shared the common objective; to evaluate the level of effectiveness and efficiency of the buildings. The effectiveness and efficiency of the buildings are determined by certain elements which each of the elements in the rating system tool has different score. Finally, the certificate of classification of green building will be given based on the accumulate score from overall elements in the SBRS. Currently, the literatures on SBRS in more focus on the Europe and American settings. It can be said that, there are a little attention has been given to the study related to the SBRS that has been devised in the Asian Region. It is well acknowledged that these three regions have different climate and weather condition which the development of SBRS is highly depending on this aspect. Thus, this paper is aim to review the elements that has been used in Asian SBRS which focus on the new residential development only. By reviewing the differences and similarities between the countries in Asian, better sustainable design practices can be developed and will serve a clear picture to the construction developers who are interested to develop sustainable housing in the Asian Region in the future. However, there are only a few countries of Asian that have already developed the rating system for the new residential development and the rest of the countries are still putting an effort to have their own rating
system. Hence, The SBRS is considered in this paper are Malaysia, Singapore, Indonesia, Japan and Hong Kong. SUSTAINABLE BUILDING RATING SYSTEMS (SBRS) SBRS are defined as tools that examine the performance of the building and translate that examination into an overall assessment that allows for comparison against the other buildings [21]. To assess the performance of the buildings, there are several elements that have been highlighted in each rating systems. The following are the discussion on the rating system for the new residential development that has been applied for the housing industry in Malaysia, Singapore, Japan and Hong Kong. After review these systems, this paper will discuss on the unique characteristic of these SBRS, if there is any. Green Building Index (GBI) – Malaysia
Green Building Index (GBI) was developed by Pertubuhan Akitek Malaysia (PAM) and Association of Consulting Engineers Malaysia (ACEM) [22]. The first version of GBI for residential new construction (GBI RNC 1.0) was established in May 2009 and followed by GBI RNC 2.0 in 2011. GBI is a second rating tools that are devised based on tropical setting [23]. There are six main elements to evaluate the performance and environmental design of Malaysian buildings; Energy Efficiency (EE), Indoor Environmental Quality (IEQ), Sustainable Site Planning & Management (SM), Materials & Resources (MR), Water Efficiency (Mills & Glass), and Innovation (IN). Each of these elements have a different total score, and different level of building award or certification will be obtained based on the accumulate score from each elements. Table (1) shows the total score for each element in the GBI NRC 2.0, meanwhile Table (2) shows the GBI NRC 2.0 certification classification.
Table 1: GBI NRC Assessment Criteria Score Summary ELEMENTS SCORE
Energy Efficiency (EE) 23 Indoor Environmental Quality (IEQ) 12 Sustainable Site Planning & Management (SM)
37
Materials & Resources (MR) 10 Water Efficiency (WE) 12 Innovation (IN) 6 TOTAL SCORE 100 Source: GSB (2011)
Table 2: GBI NRC Green Mark Classification GBI RATING & CLASSIFICATION SCORE
Platinum 86+ points Gold 76 – 85 points Silver 66 – 75 points Certified 50 – 65 point Source: GSB (2011)
BCA Green Mark – Singapore The Building and Construction Authority (BCA) Green Mark was launched in 2005 (BCA, 2006) (http://www.bca.gov.sg) and became the first rating tools that develop based on tropical climate. The BCA is an agency under the Ministry of National Development of Singapore. In April 2008, the new

ACTA TECHNICA CORVINIENSIS – Bulletin of Engineering
2013. Fascicule 2 [April–June] 93
buildings and works on existing building which exceeding 2000 square meters are mandatory to achieve minimum BCA Green Mark. The new building of residential in Singapore will be assessed based on BCA Green Mark for New Residential Building Version RB/4.0. Table (3) shows the score and building award classifications for this version.
Table 3: BCA Green Mark Classification Green Mark Rating and
Classification Score
Green Mark Platinum 90 and above Green Mark Gold Plus 85 – 89
Green Mark Gold 75 – 84 Green Mark Certified 50 – 74
Source: BCA (2010)
The building is evaluated over five elements, energy efficiency, water efficiency, environmental protection, indoor environmental quality, and other green features. Table (4) shows the summary score for each element.
Table 4: BCA Green Mark Summary for Residential Building
Elements Score Energy Efficiency 87 Water Efficiency 14 Environmental Protection 41 Indoor Environment Quality 6 Other Green Features 7 TOTAL SCORE 155 Source: BCA (2010)
GREENSHIP – Indonesia Rating system GREENSHIP was developed by the Green Building Council of Indonesia. The GBC Indonesia was established in 2009 and is an independent institutions and non-profit organization which responsible to promote sustainability approach in the built environment of Indonesia [21]. The first version of GREENSHIP for New Building was released in June 2010 (GBCI, 2010). Thus, it can be said that, GREENSHIP is the third rating system after Singapore and Malaysia that was devised based on tropical settings. So far, the GREENSHIP rating tools still did not separate the rating tools between new development of residential and non-residential buildings. The GREENSHIP assessment of the building is based on six elements. Table (5) shows the assessment elements and summary of the score for each element used in the GREENSHIP rating tool for the new building.
Table 5: Summary of GREENSHIP for New Building and Assessment Score Elements Score
Appropriate Site Development (ASD) 17 Energy Efficiency & Refrigerant (EER) 26 Water Conservation 21 Materials Resource & Cycle (MRC) 14 Indoor Health and Comfort 10 Building Environmental Management (BEM)
13
TOTAL SCORE 101 Source: GBCI (2010)
Comprehensive Assessment System for Building Environmental Efficiency (CASBEE) – Japan CASBEE is a joint governmental, academic, and industrial building assessment project underway in Japan (Bunz, et al., 2006). The development of CASBEE was begin in 2001(Fowler & Rauch, 2006) under a committee established within the Institute for Building Environment and Energy Conservation, under the guidance of the Ministry of Land, Infrastructure and Transport (IBEC, 2008). CASBEE presents a new assessment concept which distinguished between environmental load (L) and quality of building performance (Bunz, et al., 2006; Fowler & Rauch, 2006; Sinou & Kyvelou, 2006). Another two concepts applied in the development of CASBEE were first it was designed for the assessment of buildings which corresponds to their lifecycle and secondly, it introduced the new indicator, namely BEE (building environmental efficiency) (Sinou & Kyvelou, 2006). The assessment of CASBEE is given in the BEE form as a single value where BEE is defined as Q / L (quality of building performance) / (building environmental loads) (Bunz, et al., 2006; Sinou & Kyvelou, 2006). To assess the BEE value for the new construction (CASBEE – NC), the quality of building performance is divided into three elements, namely, indoor environment, quality of services, and outdoor environment on site. Meanwhile the building environmental load (L) is also comprised three elements, namely, energy, resources and materials, and off-site environment [20, 24, 25]. The BEE value can be divided into five classes from S down to C. the classification of CASBEE system shown in the Table (6).
Table 6: Classification of CASBEE Score and Rating System
Bee Value Assessment CASBEE Ranks 3.0 and higher Excellent S
1.5 ~ 3.0 Very Good A 1.0 ~ 1.5 Good B+ 0.5 ~ 1.0 Fairy Poor B-
Less than 0.5 Poor C Source: IBEC (2008)
Building Environmental Assessment Method (BEAM) – Hong Kong BEAM scheme was established in 1996 and was adapted largely based on the UK Building Research Establishment’s BREEAM (Bunz et al., 2006). BEAM is owned and operated by the BEAM Society, an independent not-for-profit organization whose membership is drawn from the many professional and interest groups that are part of Hong Kong’s building construction and real estate sectors [26]. The original HK-BEAM scheme comprised two versions, one for new (HK-BEAM 1/96) and the other for existing office buildings (HK-BEAM 2/96) [27]. Meanwhile, the pilot assessment tool for the new building was developed in 2003 (version 4/03) and after an extensive review by the BEAM Society Technical Review Panels [26], the HK-BEAM 4/04 ‘New Building’ was released in 2004 [28]. However, this version is replaced with the new version of assessment in 2009 which known as

ACTA TECHNICA CORVINIENSIS – Bulletin of Engineering
2013. Fascicule 2 [April–June] 94
“BEAM Plus for New Building” as a response to the climate change and global warming issue [29]. In April 2010, the “BEAM Plus for New Buildings Version 1.1” was established as a replacement to the existing version of new building assessment. In this new version, as show in the Table (7), there are 7 elements to evaluate the performance of new building and the bonus credit for each element. Each of these elements has a different weighting factor. While, the bonus credits would not count towards the total number of credits available, but would count towards the total of credits qualifying for an award classification [26].
Table 7: The Score of BEAM Plus for New Building Assessment Elements, Weighting Factor of Elements
and Bonus Credit
Elements Score Bonus Credit
Weighting Factor (%)
Site Aspects (SA) 22 3B 25 Materials Aspect
(MA) 22 1B 8
Energy Use (EU) 42 2B 35 Water Use 9 1B 12
Indoor Environmental Quality (IEQ)
32 3B 20
Innovations and Additions (IA) - 5B -
Source: BEAM Society (2010)
For the overall assessment, the building classification is determined by the percentage of the applicable score gained under each element and it’s weighting factor. As an additional requirement, the minimum percentage of credit must be obtained for the three elements, SA, EU, and IEQ in order to qualify for the overall grade. The building also needs to achieve the minimum number of credit under the IA element [26]. Table (8) shows the classification award and minimum percentage of credits that need to be obtained by the building to get the overall grade.
Table 8: BEAM Classification Award and Minimum Percentage and Credit for Overall Grade
Minimum Percentage
(%)
Beam
Cl
assi
fica
tion
Ass
essm
ent
Ove
rall
Pe
rcen
tage
(%
)
SA EU IEQ
IA
(cre
dit)
Platinum Excellent 75 70 70 70 3
Gold Very Good 65 60 60 60 2
Silver Good 55 50 50 50 1
Bronze Above Average 40 40 40 40 -
(BEAM Society, 2010)
DISCUSSION OF UNIQUE CHARACTERISTICS From the review on the selected of SBRS in Asian, there are several similarities and differences between theses SBRS. First, in terms of elements used to assess the new residential building, secondly,
the assessment system and lastly, the building award classification. Obviously, the similarity of this assessment tool is that the elements used in these SBRS are almost shared similar characteristics such as energy, water, indoor air quality, site management, material, and innovation. However, the Green Mark of Singapore did not include the site management into consideration to assess the performance of building. This is due to the fact that the facilities and transportation system in Singapore has already developed. Thus, this site management in Singapore is no longer become an element that need to be consider by the housing developer. Meanwhile, CASBEE of Japan is the only rating system that has unique elements where it takes ‘quality of services’ into the assessment consideration. For the new residential building assessment system, GBI (Malaysia), Green Mark (Singapore) and GREENSHIP (Indonesia) have similar approach. The total mark is calculated based on the cumulative mark of each element in the rating system which the total mark will determine the award classification. Meanwhile for CASBBE (Japan) and BEAM Plus (Hong Kong), the both of this rating system have different a way to calculate the total mark gained by the building. For CASBEE, the performance of the building is calculated based on quality of building performance and environmental load (L). The value of Q/L will determine the performance of building which this value known as BEE value. The new residential building in Hong Kong is assessed based on the accumulate score in each element in the rating system of BEAM Plus. Additionally, the elements in the BEAM Plus rating system have different bonus credit. The total bonus obtained during the assessment will determine the award classification. However, to get the overall grade, as shown in the Table (8), the building needs to achieve the minimum percentage for three elements; site aspect, material aspect and indoor environmental quality. For the building award, Indonesia is the only country that still develops their building award classification. For the GBI, Green Mark and BEAM Plus have similar award classification. Despite these three rating system have different range of point or mark to get the building award, it have four award classification. The highest award is PLATINUM and the lowest award classification is CERTIFIED for GBI and Green Mark, and Bronze for the BEAM Plus. For CASBEE system, this rating system is totally different with GBI, Green Mark, and BEAM Plus. CASBEE award has five classifications with the highest CASBEE rank will be labeled with S and the lowest award is C. CONCLUSIONS The aim of this paper is to review the rating system used to assess the new residential building in the selected country of Asian. By reviewing the existing SBRS some modification can be made in order to improve this rating system. As mentioned earlier, GREENSHIP is still developing its own building award classification. Seems Indonesia

ACTA TECHNICA CORVINIENSIS – Bulletin of Engineering
2013. Fascicule 2 [April–June] 95
is neighborhood to Malaysia and Singapore, it may take GBI and Green Mark as example to develop the award classification. However, it should have own approach to classify the performance of the building just what has CASBEE did to has a unique award classification. In CASBEE system, it also includes the quality of service which this element cannot be found in other rating system. Under this element, earthquake resistance is taken into consideration. This shows that the local condition is an important factor in developing rating system. As we acknowledged, Indonesia also have similar situation. Thus, in the GREENSHIP rating system, the earthquake resistance should be taken into consideration in order to extend the lifetime of building and ensure the security and safety of occupant. Meanwhile, in Malaysia, one of the common problems that always occurred in every year is flood. Maybe in the GBI rating system, this item should be added: flood resistance. By taking local condition into consideration while assessing the building performance, it will improve the existing tools and optimize the building performance. Indirectly, the protection on the environmental will be improved as desired in the sustainability approach. REFERENCES [1.] Nurul Amin, A.T.M. Reducing Emissions from
Private Cars: Incentive Measures for Behavioural Change: United Nations Environment Progremme (UNEP), 2009.
[2.] Tonachel, L. The Next Generation of Hybrid Cars: Plug-in Hybrids Can Help Reduce Global Warming and Slash Oil Depedency: Natural Resouces Defense Council, 2007.
[3.] Pitt, M., Tucker, M., Riley, M., & Longden, J. Towards sustainable construction: promotion and best practices. Construction Innovation, 9, 201-224, 2009.
[4.] Spence, R., & Mulligan, H. Sustainable development and the construction industry. Habitat International, 19(3), 279-292, 1995.
[5.] UNEP. Agenda 21: Promoting Sustainable Human Settlement Development. Chapter 7: Promoting Sustainable Human Settlement Development Retrieved 01 October, 2010, from http://www.un.org/esa/dsd/agenda21/res_agenda21_07.shtml, 1992
[6.] Vadera, S., Woolas, P., Flint, C., Pearson, I., Hodge, M., Jordan, W., et al. Strategy for Sustainable Construction. 1 Victoria Street, 2008.
[7.] Bunz, K.R., P.E., G.P.H., & Tiller, D.K. Survey of Sustainable Building Design Practices in North America, Europe, and Asia (Vol. 12), 2006
[8.] Klunder, G. The Search for the Most Eco-efficient Strategies for Sustainable Housing Construction; Dutch Lessons. Journal of Housing and the Built Environment, 19, 111-126, 2004.
[9.] WCED. Our Common Future. Oxford, 1987. [10.] Ding, G.K.C. Sustainable construction--The role
of environmental assessment tools. Journal of Environmental Management, 86(3), 451-464, 2008.
[11.] Said, I., Osman, O., Mohd Shafiei, M. W., Abd Razak, A., & Mohamad Abdo Rashideh, W. Identifying The Indicators Of Sustainability In The Construction Industry. The International Journal of Organizational Innovation, 2(3), 336-350, 2010.
[12.] du Plessis, C. Agenda 21 for Sustainable Construction in Developing Contries (Discussion Document): The International Council for Research and Innovation in Building Construction, 2002.
[13.] Mills, F.T., & Glass, J. The Construction Design Manager’s Role in Delivering Sustainable Buildings. Architectural Engineering and Design Managemnet, 5, 75-90, 2009.
[14.] Bourdeau, L. Sustainable Development and the Future of Construction: A Comparison of Visions. Building Research & Information, 27(6), 354-366, 1999.
[15.] Hill, R.C., & Bowen, P.A. Sustainable Construction: Principles and a Framework for Attainment. Construction Management and Economics, 15(3), 223-239, 1997.
[16.] CIB Report Publication 225. Sustainable Development and the Future of Construction: A Comparison of Visions from Various Countries: CIB, 1998.
[17.] Shafii, F., Arman, A., & Othman, M.Z. Achieving Sustainable Construction in the Developing Countries of Southeast Asia. Paper presented at the Proceedings of the 6th Asia-Pacific Structural Engineering and Construction Conference (ASPEC), Kuala Lumpur, 5-6th September, 2006.
[18.] Guy, G.B., & Kibert, C.J. Developing Indicators of Sustainability: US Experience. Building Research & Information, 26(1), 39-45, 1998.
[19.] Zainul Abidin, N. Sustainable Construction Practices in Malaysia. Global Warming, Green Energy and Technology, 385-398, 2010.
[20.] Fowler, K.M., & Rauch, E.M. Sustainable Building Rating Systems Summary (Technical Report): United States Department of Energy, 2006.
[21.] [21]. GSB. (2011). GBI Assessment Criteria for Residential New Construction (RNC) Version 2.0 (Guidelines). Kuala Lumpur.
[22.] GBCI. GREENSHIP Rating Tools for New Building Version 1.0 (Guidelines): Green Building Council Indonesia, 2010.
[23.] Tan, L.M. The Development of GBI Malaysia, 2009.
[24.] IBEC. (2008). Comprehensive Assessment System for Building Environmental Efficiency (CASBEE) for New Construction (Technical Manual): Institute for Building Environment and Energy Conservation (IBEC).

ACTA TECHNICA CORVINIENSIS – Bulletin of Engineering
2013. Fascicule 2 [April–June] 96
[25.] Sinou, M., & Kyvelou, S. Present and Future of
building Performance Assessment Tools. Management of Environmental Quality, 17(5), 570-586, 2006.
[26.] BEAM Society. BEAM Plus New Buildings Version 1.1 (Guidelines): Hong Kong Green Building Council and Building Environmental Assessment Method (BEAM Society), 2010.
[27.] Lee, W.L., & Burnett, J. Benchmarking Energy Use Assessment of HK-BEAM, BREEAM and LEED. Building and Environment, 43, 1882-1891, 2008.
[28.] HK-BEAM Society. (2004). Hong Kong Building Environmental Assessment Method 4/04 'New Buildings': Hong Kong Building Environmental Assessment Method (HK-BEAM).
[29.] BEAM Society. Building Environmental Assessment Method for New Buildings: Building Environmental Assessment Method (BEAM), 2009.
[30.] BCA. (2010). BCA Green Mark for New Residential Buildings Version RB/4.0 (Certification Standard): Building and Construction Authority (BCA).
[31.] UNEP SBCI. Buildings and Climate Change: Summary for Decision-Makers, 2009.
ACTA TECHNICA CORVINIENSIS – BULLETIN of ENGINEERING
ISSN: 2067-3809 [CD-Rom, online]
copyright © UNIVERSITY POLITEHNICA TIMISOARA, FACULTY OF ENGINEERING HUNEDOARA,
5, REVOLUTIEI, 331128, HUNEDOARA, ROMANIA http://acta.fih.upt.ro

© copyright FACULTY of ENGINEERING ‐ HUNEDOARA, ROMANIA 97
1. Ala’a M. DARWISH, 2. Wameedh G. ABDUL-HUSSEIN, 3. Zeena T. JALEEL
ELIMINATING HALF OF THE CONSTRUCTIONAL DEFLECTIONS OF SIMPLY SUPPORTED STEEL BRIDGES BY USING TEMPORARY CONTINUITY
1-3. BUILDING AND CONSTRUCTION ENGINEERING FACULTY, UNIVERSITY OF TECHNOLOGY, BAGHDAD, IRAQ
ABSTRACT: When it is required to cast a bridge over a valley, a river or a busy highway, it is difficult to use the required shoring for the concrete casting molds. In such cases, the heavy weight of fresh concrete will be directly subjected to the bridge girders. This situation will apply severe stresses to the bare supporting - normally long span - girders, leading to an un-favorite and uncorrectable permanent deflection. In this research, a simple test was done to simulate the mentioned critical case. It was found that; by constructing temporary joints for both ends of the steel girders of a simply supported bridge panel with its adjacent panels will apply reversal moments to the original panel. By reducing mid span moments due to the weight of fresh concrete of the deck slab during construction, a noticeable reduction–up to Fifty percent–of the expected mid span constructional deflection can be eliminated. KEYWORDS: Bridge construction, Steel bridges, Bridge deflection control, Constructional bridge deflection, Plate-Girder bridge, Deck slab construction
INTRODUCTION A normal bridge is a long structure, usually consists of several spans. Each span is also considered as a long structure compared to other types of engineering constructions. Bridges are designed to sustain the safe passing of heavy traffic and pedestrians loading. Heavy loading in addition to long span result in greater stresses leading to the adaption of huge sections. These large scale formations and their extra weight require special precautions during manufacturing, transporting and erecting. Generally, it is impossible to construct a bridge panel within one stroke. Therefore; design and construction processes will follow suitable procedures to fulfill the required aim of building a safe, durable and nice looking bridge without making any destruction to the site surroundings. Mainly, bridges are designed to be constructed by the use of reinforced concrete, pre-stressed concrete, steel or their combinations to act in a composite manner. In most cases, each panel consists of a number of equally spaced supporting girders topped by a reinforced concrete deck slab. During design stages, supporting girders are analyzed and designed to carry its self-weight and the weight of the fresh concrete of the deck slab plus 20% of the bridge live loading to account for the weight of the casing moulds, the construction equipments and the workers. The design is cross checked under the full dead and live loading for composite action of the hardened concrete that will be fully attached by shear connectors to the supporting girders.
In cases where a bridge has to be constructed over a deep valley/river or in a busy city, it is difficult to construct or to attain-for few weeks- for the removal of the required temporary deck slab casting molds and its shoring. In such situation the constructing engineer will face a trouble of supporting his un-shored temporary molds directly over the supporting girders. This will lead to an inevitable expected deflection. The mentioned extreme loading case is embarrassing during design stages. If the fresh concrete load of the deck slab is considered to be held by the supporting girders alone, it will lead to larger sections, altering the aesthetic appearance of the bridge and certainly it will increase the cost. While, following the standard code procedures without taking construction stresses into consideration will lead to un- favorite deflections. To have a numerical idea regarding the problem; for 10m wide bridge spanning 30m and with a concrete deck slab thickness of 20cm, the total uniformly distributed load due to the weight of the fresh concrete only – without the 20% increment of the live load- will be 156 tons. This load alone is much greater than the design live load recommended by AASHTO standard truck {1} which is suggested to be applied after the completion of the bridge. Normally this temporary construction load is taken by the shoring system, but if there is no shoring a problem will certainly arise.{2} For suspension bridges there is no problem of deflection, because each hanger could be considered as a support transforming the total load to the main cables which directs its tensile force to the bridge towers and

ACTA TECHNICA CORVINIENSIS – Bulletin of Engineering
2013. Fascicule 2 [April–June] 98
anchors then to the foundation. For Pre-stressed bridges, the problem is automatically solved due to the natural cambering of its girders. The expected constructional deflection will reduce the original cambering resulting in a flat surface under the effect of the total dead load of the bridge. {3} the pre-stressing force is placed eccentrically to counteract the downward deflection of the flexural member caused by gravity loads and service loads. The problem in steel bridges is more difficult, but it can be solved by fabricating an artificial cambering by an elaborate and costly methods. {4} not much has changed over the past thirty years in the general means and methods that a fabricator uses to induce camber in a member.{5} There is no known way to inspect beam camber after the beam is received in the field because of factors that include: � The release of stress in member over time and in
varying application. � The effects of the dead weight of the member. � The restraint caused by the end connections in the
erected state. � The effects of additional dead load that may
ultimately be intended to be applied, if any. {5} AASHTO Specifications limits live load deflections to Span/800 for different types of ordinary bridges. But there is no specific limitation for dead load deflections. In the present research a test has been done to highlight the idea of a new suggested method for constructing the reinforced concrete deck slabs of Steel bridges. Temporary clamping of both ends of the supporting girders with adjacent panels girders -before casting the concrete of the reinforced concrete deck slab- can reduce mid span moment and deflection. It is believed that; the mentioned un-costly method can reduce construction deflections to acceptable limits. TESTING PROGRAM Materials: During all the test stages, the following materials have been used to simulate the following actual bridge components (presented in Table 1.)
Table 1. Materials used Material Properties Simulation for
1
Four steel rulers. Each ruler has the following properties: � Cross sectional area of
25x0.5 mm. � Length of 30cm. � Weight of 1gm/cm.
� Second moment of Area equals:
433
mm26.012
5.02512bh
)I( =×
==
Bridge girders.
2 A number of 6 gm Plastic
blocks having the dimensions of 6x20x40 mm.
The weight of fresh concrete of a Bridge
Deck- Slab.
3 Super glue, Cyanoscrylete adhesive.
The role of Shear Connectors to join composite member
components.
4 Two Φ4mm bolts. Temporary End Clamping.
5 Eight, 35mm long, Erasing Rubbers having triangular
cross sections. Bridge Bearings.
Testing procedure: Three 32cm steel rulers were temporary jointed by two 4mm diameter bolts and screws. Each joint was done by fastening a single bolt as shown in Figure 1.
Figure 1. Temporary jointing the steel rulers by screws
The total length of the jointed rulers was 92cm. Three 30 cm c/c supports were used. The intermediate couple of supports were topped by two red rubber erasers 2 cm apart, while the end two supports were topped by a single blue rubber eraser as shown in Figure 2.
Figure 2. The temporary continuous steel rulers
The system simulates a disassembling continuous beam having three 28cm long spans. For deflection comparison, the forth ruler was simply supported over two additional yellow rubber erasers -28cm apart –resting on the intermediate two supports. Two 6gm plastic prisms were put at the center of the intermediate span of the continuous ruler and at the center of the simply supported ruler. Segmental Loading was continued for the whole rulers’ lengths as shown in Figure 3. The central Deflections for both rulers were tabulated in Table 1.
Figure 3. Incremental Loading continued
until the ends of spans

ACTA TECHNICA CORVINIENSIS – Bulletin of Engineering
2013. Fascicule 2 [April–June] 99
Figure 3. Incremental Loading continued
until the ends of spans (continue)
Table 2. Deflection measurements for simply and continuous rulers
Weight (gm)
Simply Def. (mm)
Continuous Def. (mm)
0 0 0 12 0.25 0 24 0.75 0.25 36 1.75 0.75 48 2.50 1.25 60 3.50 1.75 72 4.50 2.50 84 6.00 3.00 96 7.00 3.50 108 8.00 3.75 120 8.75 4.25 132 9.50 4.75 144 11.00 5.25 156 12.00 6.00 168 13.50 7.00 180 15.00 8.00 192 17.50 9.50 204 20.00 11.00 216 22.50 12.50 228 25.00 13.00 240 27.00 14.00 252 28.00 14.50 264 29.00 14.75 276 30.00 15.00
Figure 4. Gluing the weights together
and with its continuous ruler The second stage was gluing the weights together and with its holding continuous ruler as shown in Figure 4. This action was done to simulate the state of a hardened concrete attached to its supporting girders in a real bridge. Gluing also reflects the positive properties of composite structural members, especially its higher moment resisting capacity.
Under the same loading, normally a member having a noticeable moment resistance shows less deflection. For comparison and to simulate the case of casting fresh concrete over simply supporting girders, the simply supported ruler was left without gluing to its loadings. The third stage of the test was done by unscrewing the bolts to leave the intermediate loaded span of the previously continuous span alone. It was found that the glued ruler had preserved its shape with no further deflection, as shown in the Figure 5.
Figure 5. Final Deflections after releasing
the continuity clamping Graph 1 shows the magnitude and the mode of deflection increase with the increase of loading – during all the test stages- for both of the continuous and the simply supported rulers.
Graph 1. Mode of deflection for both of the continuous
and the simply supported rulers DISCUSSION The simply supported – uniformly loaded – ruler shows the expected excessive deflection of a simply supported bridge girder subjected to the load of fresh concrete during construction. While the – temporary continuous three spans – rulers explain the idea of this research which aims to reduce central constructional deflection. The reverse moments due to the weights of the adjacent rulers will act as temporary partial two ends fixation. The application of the glue to attach weights segments to each other and to its supporting – temporary continuous- ruler simulates the state of concrete hardening in a real bridge. The hardened concrete in a finished bridge acts compositely with its supporting girders, which means a noticeable increase in its moment resisting capacity. A composite member having higher moment resistance will certainly produce less deflection compared to a similar simply supported bared girder subjected to the same loading. Unscrewing the bolts which connect the three continuous rulers reflect the release of the temporary clamping and the return to the original design of a specified span under a given loading. The final result represents the intended constructional trick to reduce unfavorite deflection in real bridges.

ACTA TECHNICA CORVINIENSIS – Bulletin of Engineering
2013. Fascicule 2 [April–June] 100
CALCULATIONS The 28 cm long simply supported ruler was loaded with a uniformly distributed load of 276/28=9.9gm/cm in addition to its self weight of 1gm/cm. Therefore, its mid span maximum moment
will be: cm.gm10688
28)19.9(8
lwM
22
maxs =×+
=×
=
Figure 6. Loading and bending moment diagrams
for the simply and the continuous rulers While for the triple 28cm long spans of the continuous ruler, the negative end moments of the intermediate span ends will be:
cm.gm4802
31311M maxc =
××=
Therefore, the positive moment of the middle span will be reduced to be 1068- 480 = 588 gm.cm. Figure 6 shows loading and bending moment diagrams for the simply and the continuous rulers. To find the Elastic modulus (E) of the rulers, the deflection (Δ) equation {6} for a uniformly loaded (w) simply supported beam AB can be applied to the actual test deflection of 30mm as follows:
2
33
mm/gm10176816E26.0E384
2803055mm30
El384lw5
Δ
=⇒⇒⇒××
××==
×=
To calculate the central deflection Δ of the continuous triple span ruler, the following formula {6} for a beam-uniformly distributed load and variable end moments will be used:
⎥⎦
⎤⎢⎣
⎡−−++⎟
⎠⎞
⎜⎝⎛ −+−=Δ
wlM
wlMlx
wMx
wlM
wlMlx
Elwx
x241811224142
24323
By substituting the values of w = 1.09 gm/mm, x = 140 mm, E = 10176816 gm/mm2, I = 0.26 mm4, l = 280 mm, and M1 = M2 = 4800 gm.mm, the central deflection will be:
( ) +××
+××-××
×= 333
140 28014009.1480012
140282140[26.01017681624
14009.1Δ
mm2.15]09.1
2804800409.1
28048008=
××-
××-
The above calculation shows that the maximum bending moment was reduced by:
( )%45
10682805881068
=×-
While the central deflection was reduced by: ( )
%5030
1002.1530≈
×-
Lastly, the test results closely match the theoretical calculations.
SUGGESTED APPLICATION It is believed that; constructing temporary fixed joints for both ends of a simply supported steel bridge will reduce the expected constructional deflection during casting the concrete of its deck slab. Figure 7 shows the proposed temporary joints. Each joint should be designed to have not less strength than that of the full strength of the two jointed parts. Precautions also should be taken to arrange these joints to be easily taken apart after the completion of the required purpose.
Figure 7. The proposed Temporary Connection
CONCLUSIONS The following statement has been concluded: Temporary jointing both ends of a simply supported un-shored deck girder steel bridge- during the process of casting its deck slab concrete - can reduce FIFTY Percent of its inevitable and unfavorite mid span Deflection. REFERENCES [1.] AASHTO LRFD Bridge Design Specifications, 17th Ed.,
2007. [2.] Ala’a M. Darwish, ‘Eliminating upside-down
movements in Suspension Bridges’, Journal of Civil Engineering, IEB, Vol.3, No.2. pp 123-131, Bangladesh, Dec, 2009.
[3.] N. Edward G., ‘Pre-stressed concrete’, 4th Ed., Pearson Education, Inc., pp 403-480, 2003.
[4.] E. Criste, ‘Beam Cambering and Costs’, Structure Magazine, April, 2009.
[5.] American Institute of Steel Construction. ‘Code of Standard Practice for Steel Buildings and Bridges’.
[6.] AISC Steel Construction Manual 14th Edition (AISC 325-11).
ACTA TECHNICA CORVINIENSIS – BULLETIN of ENGINEERING
ISSN: 2067-3809 [CD-Rom, online]
copyright © UNIVERSITY POLITEHNICA TIMISOARA, FACULTY OF ENGINEERING HUNEDOARA,
5, REVOLUTIEI, 331128, HUNEDOARA, ROMANIA http://acta.fih.upt.ro

© copyright FACULTY of ENGINEERING ‐ HUNEDOARA, ROMANIA 101
1. Fathollah OMMI, 2. Ehsan MOVAHEDNEJAD, 3. Kouros NEKOFAR
COMPARING PERFORMANCE CHARACTERISTICS OF A GASOLINE AND CNG ENGINES AND INCREASING VOLUME EFFICIENCY AND POWER USING DESIGNED TURBOCHARGER
1. TARBIAT MODARES UNIVERSITY, TEHRAN, IRAN 2. ISLAMIC AZAD UNIVERSITY OF JOLFA, JOLFA, IRAN 3. ISLAMIC AZAD UNIVERSITY OF CHALOOS, CHALOOS, IRAN
ABSTRACT: In recent years, the utilization of cleaner alternative fuels such as natural gas, methanol reformed gas (MRG), and hydrogen, is much more common, as a solution for environmental problems including global warming effect and for the shortage of crude oil reserve in the world. Power reduction is one of the important problems of converting gasoline engine to CNG and using the turbocharger can be a solution for increasing the engine power. In this paper, a model of a 4–cylinder multi-point fuel injection engine was prepared using a one dimensional fluid dynamics code for both gasoline fuel and CNG. The accuracy of the model was verified using experimental results of the engine testing showing good agreement between the model and the real engine. As a result, predictions are obtained that provide a detailed picture of engine performance condition with different fuel. In addition, two different turbochargers has been added to intake system and the engine performance characteristics like efficiency, net power and fuel consumption compared to CNG and gasoline engines without turbocharger. As a result, according to engine results and compressor characteristics a turbocharger was select for the based CNG engine. KEYWORDS: Turbocharger, CNG, Volume Efficiency, Power
INTRODUCTION Comparing CNG spray engines with gasoline engines, their power can be reduced about 10 to 15 percent. The two main reasons for this decline when injected into a CNG gaseous state that some of the intake air space may be occupied to the engine and it reduces the volumetric efficiency. Another reason for high ratio of the air to the fuel in gas stiochiometric conditions is high ratio of the gasoline, the figure is about 17.2 to 1 for gas and it is 14.7 to 1 for gasoline. This factor is determined more necessary for CNG engine to the air than gasoline engine to the air. And the amount of additional air to the engine can be provided by overfeeding engine. In other words, if we can increase the amount of air pressure inlet in the engine, so it can also increase the amount of inlet air mass to the engine. Mass density of air entering the engine will cause the combustion to be complete which improves the thermal efficiency and therefore to compensate for CNG engines seems to be necessary [1]. Until now, much research on using the models of turbocharged engine optimization is done. Andreas et al in 2001 replaced the engine with compressed natural gas instead of gasoline and its effect on engine performance and they analyzed CFD codes using laboratory on a real engine and he used experimental results as well [1]. Amseden et al used
the code KIVA 3V to model the combustion process. [2, 3] During a study that was conducted in 1996 by Johnson, he found out these changes can be reduced by keeping the fuel consumption of the engine can be increased to 10% and reduce the amount of pollutants [4.] Kordiner et al (1999) have been analyzed the changes in the feeding engine and got similar answers [5]; another problem in the feeding engine is the occurrence of Nak phenomenon that Grandien and Ångström examined this phenomenon and the resistance of the engine against the NAK phenomenon in 1999 [7,6]. David Garni in 2001 with the creation of a one-dimensional model has analyzed the turbocharged engine performance and his model can be used for modeling non-uniform flow [8]. In the current study a one-dimensional model is used to model XU7 engine. The data required for the model include: 1. Geometric data and lateral friction engine
components, 2. Engine characteristics such as diameter, stroke,
compression ratio, valve timing and ignition. 3. The performance of the engine with duct wall
temperature, connections and engine components. Some of the parameters such as the geometric characteristics of the components are obtained as direct measures and while calibrating the model with the real state be corrected.

ACTA TECHNICA CORVINIENSIS – Bulletin of Engineering
2013. Fascicule 2 [April–June] 102
The simulation engine air inlet geometry for all runners, flow of exhaust gases to filter carefully measured.
Table 1: Specifications of Engine Bore 83 mm
Stroke 81.4 Mm Bore/Stroke 1.019 Displacement 1761 cm3
Compression Ratio 9.3 Intake Valve Opening 32.5 BTDC Intake Valve Closing 64.3 ABDC
Exhaust Valve Opening 61 BBDC Exhaust Valve Closing 15 ATDC
After Gasoline and CNG engine model, engine dynamometer test results of the modeling results using both validation and performance characteristics of the engine can be compared with each other. Finally, with regard to the design parameters of the turbocharger, the proper feeding system was chosen for the selected engine. MODELING A one-dimensional dynamic gas-source code used to analyze the dynamic wave pressure, mass flow and energy loss in a variety of systems. Able to model fluid flow using a variety of volume compressibility, duct, tubing, orifices, and applying the boundary conditions of the environment. Different types of graphs of various parameters on the output of the engine to the code below uses a variety of models referred to in engine is able to calculate the performance parameters. Based on the analysis of motor runner compression wave function is used [9]. Unsteady compressible flow equation in order to achieve this should be resolved. This equation used by the method of characteristics (method of characteristic). Extracted from the experimental data One of the parameters using the test results is the values of the flow coefficient from air valve and smoke. These values were conducted using the flow test and by flow bench test that the scheme of the apparatus is shown in Figure 1.
Figure 1: The schema of the table
1 - Time valves measuring openness 2 - closure 3 - Cylindrical Interfaces 4 - Meter turns 5 - 6 Gauge Pressure Tank - Relax 7 - rigid tube 8 - Pressure gauge 9 - Holes 10 - 11 gauge pressure - flow control valve 12 - Temperature
gauge 13 - 14 honeycomb paths - blower / suction air The coefficient of flow table test (flow bench) has been obtained. With this test, the pressure drop is measured between the valve and the flow rate.
Values of upstream pressure and temperature, downstream static flow and flow rate are the necessary data for calculation the flow coefficients or drop coefficients. First, using the pressure ratio, the flow isotropic velocity is obtained as equation (1) shows.
⎥⎥
⎦
⎤
⎢⎢
⎣
⎡
⎟⎟⎠
⎞⎜⎜⎝
⎛−
−=
−1
11
2λλ
λλ
o
o PPRTVis
(1)
R is the gas constant, λ is P and P0 specific warmness that respectively is downstream and upstream pressure. The effective surface of valve is also calculated by using equation (2).
δ
f
Re4
2C
= (2)
Discharge coefficients versus lift valves inlet and outlet in the figures (2) and (3) are shown.
0
0.02
0.04
0.06
0.08
0.1
0.12
0 2 4 6 8 10 12 14
Lift (mm)
CD
Figure 2. The discharge coefficients in the valve inlet
0
0.01
0.02
0.03
0.04
0.05
0.06
0.07
0.08
0.09
0 2 4 6 8 10 12 14
Lift (mm)
CD
Figure 3.) The discharge coefficients in the valve outlet
Effect of openness valve is timing on volumetric efficiency of the engine's performance. The parameters may influence directly on the cylinder intake air and combustion products withdrawal and it can control the rate of return flows to the ports. [10] Flow Friction Model Fluid and wall friction coefficients were calculated for the accomplished: [11] A: First, the flow of Reynolds number is
calculatedμUDρ
Re = . That U is an instantaneous
velocity of the fluid; D is the pipe diameter, ρ is an instantaneous density and μ is the viscosity of the fluid. B. The thickness of the boundary layer flow regime is dependent on is calculated from the following relationship: For turbulent flow D10.δ = For laminar flow D25.δ =
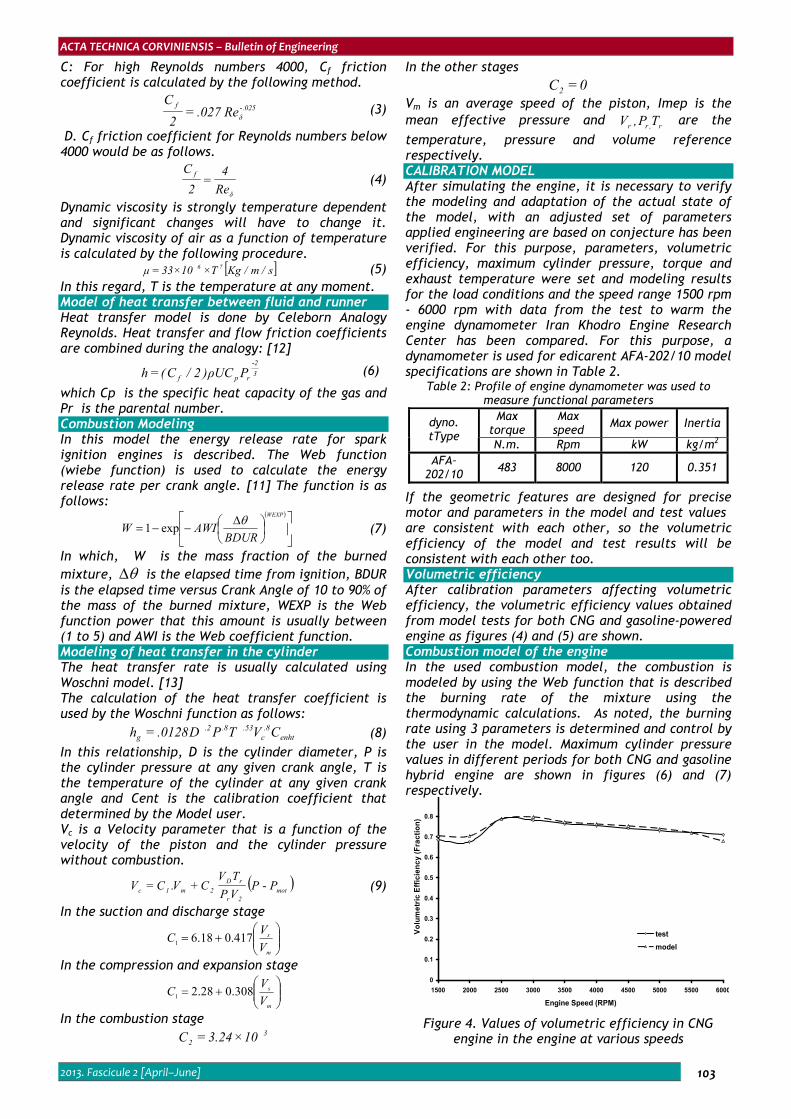
ACTA TECHNICA CORVINIENSIS – Bulletin of Engineering
2013. Fascicule 2 [April–June] 103
C: For high Reynolds numbers 4000, Cf friction coefficient is calculated by the following method.
025.δ
f Re027.2
C-= (3)
D. Cf friction coefficient for Reynolds numbers below 4000 would be as follows.
δ
f
Re4
2C
= (4)
Dynamic viscosity is strongly temperature dependent and significant changes will have to change it. Dynamic viscosity of air as a function of temperature is calculated by the following procedure.
[ ]s/m/KgT1033μ 76 ××= (5) In this regard, T is the temperature at any moment. Model of heat transfer between fluid and runner Heat transfer model is done by Celeborn Analogy Reynolds. Heat transfer and flow friction coefficients are combined during the analogy: [12]
32
rpf PUCρ)2/C(h-
= (6)
which Cp is the specific heat capacity of the gas and Pr is the parental number. Combustion Modeling In this model the energy release rate for spark ignition engines is described. The Web function (wiebe function) is used to calculate the energy release rate per crank angle. [11] The function is as follows:
( )
⎥⎦
⎤⎢⎣
⎡⎟⎠⎞
⎜⎝⎛ Δ
−−=WEXP
BDURAWIW θexp1
(7)
In which, W is the mass fraction of the burned mixture, θΔ is the elapsed time from ignition, BDUR is the elapsed time versus Crank Angle of 10 to 90% of the mass of the burned mixture, WEXP is the Web function power that this amount is usually between (1 to 5) and AWI is the Web coefficient function. Modeling of heat transfer in the cylinder The heat transfer rate is usually calculated using Woschni model. [13] The calculation of the heat transfer coefficient is used by the Woschni function as follows:
enht8.
c53.8.2.
g CVTPD0128.h = (8) In this relationship, D is the cylinder diameter, P is the cylinder pressure at any given crank angle, T is the temperature of the cylinder at any given crank angle and Cent is the calibration coefficient that determined by the Model user. Vc is a Velocity parameter that is a function of the velocity of the piston and the cylinder pressure without combustion.
( )mot2r
rD2m1c PP
VPTV
CV.CV -+= (9)
In the suction and discharge stage
⎟⎟⎠
⎞⎜⎜⎝
⎛+=
m
s
VVC 417.018.61
In the compression and expansion stage
⎟⎟⎠
⎞⎜⎜⎝
⎛+=
m
s
VVC 308.028.21
In the combustion stage 3
2 1024.3C ×=
In the other stages 0C2 =
Vm is an average speed of the piston, Imep is the mean effective pressure and r,rr TP,V are the temperature, pressure and volume reference respectively. CALIBRATION MODEL After simulating the engine, it is necessary to verify the modeling and adaptation of the actual state of the model, with an adjusted set of parameters applied engineering are based on conjecture has been verified. For this purpose, parameters, volumetric efficiency, maximum cylinder pressure, torque and exhaust temperature were set and modeling results for the load conditions and the speed range 1500 rpm - 6000 rpm with data from the test to warm the engine dynamometer Iran Khodro Engine Research Center has been compared. For this purpose, a dynamometer is used for edicarent AFA-202/10 model specifications are shown in Table 2.
Table 2: Profile of engine dynamometer was used to measure functional parameters
Max torque
Max speed Max power Inertia dyno.
tType N.m. Rpm kW kg/m2
AFA–202/10 483 8000 120 0.351
If the geometric features are designed for precise motor and parameters in the model and test values are consistent with each other, so the volumetric efficiency of the model and test results will be consistent with each other too. Volumetric efficiency After calibration parameters affecting volumetric efficiency, the volumetric efficiency values obtained from model tests for both CNG and gasoline-powered engine as figures (4) and (5) are shown. Combustion model of the engine In the used combustion model, the combustion is modeled by using the Web function that is described the burning rate of the mixture using the thermodynamic calculations. As noted, the burning rate using 3 parameters is determined and control by the user in the model. Maximum cylinder pressure values in different periods for both CNG and gasoline hybrid engine are shown in figures (6) and (7) respectively.
0
0.1
0.2
0.3
0.4
0.5
0.6
0.7
0.8
1500 2000 2500 3000 3500 4000 4500 5000 5500 6000
Engine Speed (RPM)
Vol
umet
ric E
ffici
ency
(Fra
ctio
n)
testmodel
Figure 4. Values of volumetric efficiency in CNG
engine in the engine at various speeds

ACTA TECHNICA CORVINIENSIS – Bulletin of Engineering
2013. Fascicule 2 [April–June] 104
0
0.1
0.2
0.3
0.4
0.5
0.6
0.7
0.8
0.9
1
1500 2000 2500 3000 3500 4000 4500 5000 5500 6000
Engine Speed (RPM)
Vol
umet
ric E
ffici
ency
(Fra
ctio
n)
testmodel
Figure 5. Values of volumetric efficiency
in gasoline engine at various speeds
30
32
34
36
38
40
42
44
46
48
1500 2000 2500 3000 3500 4000 4500 5000 5500 6000
Engine Speed [RPM]
cyl
inde
r pre
ssur
e [b
ar]
ModelTest
Figure 6. Values for maximum pressure cylinder
CNG engine at various speeds
20
25
30
35
40
45
50
55
60
1500 2500 3500 4500 5500 6500
Engine Speed [RPM]
Pre
ssur
e [B
ar]
ModelTest
Figure 7. Values for maximum pressure cylinder
gasoline engine at various speeds Heat transfer model in cylinder Woschni model is used to calculate the heat transfer rate from the cylinder. With the energy release, some of the air-fuel mixture into energy used and the amount of additional heat is wasted. To ensure the accuracy of calculating the heat transfer rate and the strain energy release rate must be calculated at and this was done with great care in the previous section. Therefore, the pressure inside the cylinder to model and test moments, mean effective pressure for the test model must be equal. Figures (8) and (9) for both CNG and gasoline hybrid engine have indicated them.
6
6.5
7
7.5
8
8.5
9
1500 2000 2500 3000 3500 4000 4500 5000 5500 6000
Engine Speed [RPM]
IMEP
[bar
]
ModelTest
Figure 8. Indicated mean effective pressure for CNG engine
at various speeds
7
7.5
8
8.5
9
9.5
10
1500 2500 3500 4500 5500 6500
Engine Speed [RPM]
IMEP
[bar
]
ModelTest
Figure 9. The mean effective pressure for the gasoline
engine at various speeds
60
65
70
75
80
85
90
95
100
105
1500 2000 2500 3000 3500 4000 4500 5000 5500 6000
Engine Speed [RPM]
Torq
ue [N
.M]
TestModel
Figure 10. CNG engine brake torque at various speeds
60
65
70
75
80
85
90
95
100
105
1500 2000 2500 3000 3500 4000 4500 5000 5500 6000
Engine Speed [RPM]
Torq
ue [N
.M]
TestModel
Figure 11. Gasoline engine brake torque at various speeds

ACTA TECHNICA CORVINIENSIS – Bulletin of Engineering
2013. Fascicule 2 [April–June] 105
After ensuring the same indicatedr mean effective pressure for test and model, if the mechanical efficiency of the test and model are consistent with each other, then be concluded that the heat transfer rate is modeled correctly. Moreover, figures (10) and (11) are shown the brake torque model and test for both CNG and gasoline engines and fuel-burning natural gas. Select the appropriate turbocharger After calibrating the exact model, in the figures (4) and (5) is seen to be the volumetric efficiency of the CNG engine is lower that gasoline engine and therefore we should compensate the loss by a technique and also increase the volumetric efficiency as possible and even for this reason, the turbocharger is used to compensate this loss and increasing the volumetric efficiency. Most of overfeeding is done in the engines made and the purpose overfeeding is to increase the power and torque versus speed range. The problem of the overfeeding engine is to achieve the maximum output power, and in combination with maximum strength, improving the low-speed torque is reduced to postpone Turbo Lag [8]. To achieve this goal, careful planning and consideration of turbine engine components are required harmonized. We should change some of the design parameters to converting XU-7 natural breathing engine to an overfeeding engine, of course some parameters such as engine geometry and runner do not changed and should enter the codeand no optimization on any of these parameters. These changes will be discussed. In general, the following points should be noted for the choice of a turbocharged engine: A) The selected turbocharger engine torque for different speeds increased to the desired value. B) The turbocharger is chosen as small as possible. As turbocharger is smaller so its launching is faster, and increasing or decreasing its speed will be faster with high or low load , as a result the delay will be lower in the performance turbocharger (turbo lag). Inertia turbocharger is much smaller than it would be there and a further delay in performance will be resolved. C) much less of a turbocharger to the combustion gases is used to increase the torque, the better. However, the turbine control valve (waste gate) will open more and more gases are discharged to the atmosphere. Or in other words, as the combustion gases flow through the turbine is less, so turbocharger will have a higher response rate. D) the turbocharger engine must be carefully selected that the selected compressor turbocharger and turbine will work with high efficiency and all functional parts and engine turbine and compressor are working in the area. This points do not reach to the surge line. E) the maximum turbocharger shall not exceed the maximum speed as the manufacturer made. [15] Some tips for choosing the turbocharger to the engine XU-7 has been taken into consideration. Two turbocharger engines XU-7 is considered to be there and the analysis results will be shown that which of the turbocharger is suitable for the engine and the turbochargers are mady by the Company
IHIthat the characteristics of the turbine and its compressor are presented in Table 3.
Table 3: turbine and compressor for both turbochargers Compressor Turbine
f4c109a RHF4HTTW14P12 turbocharger b f4c93f RHF4HTTW14P12 turbocharger a
Some engine design parameters such as timing of inputs and outputs valves, valve lift curve, and ignition timing and etc have been changed in conversion of a normal breathing engine to an overfeeding engine. Thus, the first of these changes and then overfeeding is appropriate.The optimum choice of two turbochargers must be found that would allow the engine to increase torque. The results for both turbocharger models (b) and (a) is shown in figure (12).
0
20
40
60
80
100
120
140
160
180
1500 2000 2500 3000 3500 4000 4500 5000 5500 6000
Engine Speed [RPM]
Bra
ke T
orqu
e [N
.M]
Turbocharger-bTurbocharger-a
Figure 12. Torque values of the overfeeding engine with
two turbochargers at full load state As the two diagrams show that the turbocharger (a) can be a limit engine torque; although in the diagram (28), the turbocharger (b) can not provide the desired torque. So the first reason for being better turbocharger (a) of the turbocharger (b) to provide the desired torque. Generally due to the exhaust of combustion energy is low at low speeds thus, selecting the proper turbocharger and engine torque at low speeds, in order to increase the torque is very important; compressor efficiency model has been calculated in both turbochargers (a) and (b).
30
35
40
45
50
55
60
65
70
75
80
1500 2000 2500 3000 3500 4000 4500 5000 5500 6000
Engine Speed [RPM]
Effic
ienc
y [%
]
Compressor a
Compressor b
Figure 13. Comparing the compressor efficiency for two turbochargers at various speeds and at full load state
The efficiency for both compressors at different speeds in is shown in figure (13). As the digaram showed the turbocharger compressor efficiency (a) is

ACTA TECHNICA CORVINIENSIS – Bulletin of Engineering
2013. Fascicule 2 [April–June] 106
much that turbocharger compressor efficiency (b). Turbocharger compressor performance (a) is better than the performance of the turbocharger compressor (b). In general it can be said that in all rounds of turbocharger compressor (a) will work with a higher efficiency than turbocharger compressor (b). It can be concluded from this figure that the turbocharger (a) for the engine is betther than turbocharger (b), because the turbocharger will be appropriate in a region with high efficiency operation. Because turbine for both turbochargers (b) and (a) are the same and also shown in Figure (14), the mass flow through the turbine control valves for both turbines are the same, so it is expected that the work produced by the turbine for different modes is the same in both of them as diagram (14) shows it. Figure (15) shows two turbochargers (b) and (a) at different engine speeds at full load state. As figure shows the turbocharge round (b) has the maximum turbocharger speed from turbocharge (a). Therfore, dynamic forces and vibrations of the turbocharger (a) is far less than the turbocharger (b) and the turbocharger (a) is better than turbocharge (b).
0
1
2
3
4
5
6
1500 2000 2500 3000 3500 4000 4500 5000 5500 6000
Engine Speed [RPM]
Pow
er [k
W]
Turbocharger-aTurbocharger-b
Figure 14. Produced power by both turbocharger
turbines at full load state
0
20000
40000
60000
80000
100000
120000
140000
160000
180000
1500 2000 2500 3000 3500 4000 4500 5000 5500 6000
Engine Speed [RPM]
Spee
d [R
PM]
Turbocharger aTurbocharger b
Figure 15. The turbocharge round across two engines
at full load state The reasons for turbocharger (a) is suitable for XU-7 engine. So in modeling , turbocharge (a) is used; the engine volumetric efficiency with normal breathing and forced breathing were compared after engine modeling in gas mode. The results for both turbocharge is shown in figure (16).
0
0.2
0.4
0.6
0.8
1
1.2
1.4
1500 2000 2500 3000 3500 4000 4500 5000 5500 6000
RPM
volu
met
ric e
ffici
ency
(CN
G)
NATurbo-aTurbo-b
Figure 16. Comparing the volumetric efficiency of the
engine to normal breathing and forced breathing engine with two turbochargers
Comparing the results of CNG engine natural breathing and at overfeeding One of the important tips on choosing a turbocharger engine is that engine performance parts at different rounds lie in the functional area of the turbine and compressor and possibly functional areas are in a region that turbine efficiency and compressor is high in this area. Engine performance parts should not be close to the surge line and if the points of the line are far better. Because turbine efficiency and compressor is very low in the area and if the motor functional areas are close to the surge line or in the surge area, so the engine torque will be loss there; This phenomenon also causes severe fluctuations in volumetric efficiency and engine torque. In this area turbocharger increasingly works unstable and flow through the compressor can greatly vary. This is a very unpleasant and cause severe vibration and turbocharger engine. The functional parts of engine XU-7 on the compressor map is shown in figure (17).
Figure 17. The functional parts of the engine (around 1500
to 6000 rpm) on compressor performance curve As the figure (17) shows, we close on surge area at around 1500 RPM and one of the reasons why this model is around 1500 RPM is not desirable. Another reason for the lack of proper for feeding engine model at round 1500 RPM is to ignore the effects of oscillating pressure resulting from combustion gases (pulse) and the unstable nature of the flow. According to the functional map of a turbocharger compressor and turbine (map) with the steady flow test that should be done.

ACTA TECHNICA CORVINIENSIS – Bulletin of Engineering
2013. Fascicule 2 [April–June] 107
The engine speed is greater than the effects of pulse and flow goes to quasi-steady.. Another improper reason model at around 1500 RPM ignores the effects of three-dimensional flow. Because at low speeds due to the inertia of the fluid is lower than the low point, Viscosity forces against the forces of inertia can not be ignored. At low speeds (almost below 2000 RPM) because the combustion gases are down so the engine torque will not increase as desire. Using Overfeeding , inlet air pressure to the engine by the turbocharger compressor will increase; This will increase more air into the cylinder and engine volumetric efficiency. Figure (18) shows the values of volumetric efficiency for XU-7 engine with natural breathing (NA) and overfeeding (TC), as is clear from this diagram, the volumetric efficiency at high speeds is almost more; this is due to the high energy of combustion gases and the high mass flow rate of combustion gases at high speeds.
0.6
0.7
0.8
0.9
1
1.1
1.2
1.3
1500 2000 2500 3000 3500 4000 4500 5000 5500 6000
Engine Speed [RPM]
Volu
met
ric E
ffici
ency
TC-CNGNA-CNGNA-Gasoline
Figure 18. XU-7 engine volumetric efficiency versus engine
speed for both normal breathing and overfeeding In general it can be said that overfeeding engine causes more air-fuel mixture into the cylinder; also this causes more energy to be released and the amount of torque and maximum cylinder pressure is higher than normal breathing engine. Diagrams (19) and (20) show the amount of torque and maximum cylinder pressure at different periods for both normal breathing and overfeeding engines XU-7.
0
20
40
60
80
100
120
140
160
180
1500 2000 2500 3000 3500 4000 4500 5000 5500 6000
Engine Speed [RPM]
Bra
ke T
orqu
e [N
.M]
TCNA
Figure 19. Values of brake cracking versus engine speed for
engine XU-7 in normal breathing and overfeeding
0
10
20
30
40
50
60
70
1500 2000 2500 3000 3500 4000 4500 5000 5500 6000
Engine Speed [RPM]
Pres
sure
[bar
]
NATC-new
Figure 20. Values of maximum cylinder pressure at
different engine speeds for both normal breathing and overfeeding
By increasing the amount of realeased energy and maximum cylinder pressure at feeding effect, the temperature of the combustion gases in the engine TC will be higher than engine NA. Figure (21) shows the temperature of the combustion gases for both NA and TC engines.
900
950
1000
1050
1100
1150
1500 2000 2500 3000 3500 4000 4500 5000 5500 6000
Engine Speed [RPM]
Tem
pera
ture
[K]
TCNA
Figure 21. The tempreture of combustion gases in exhaust manifold at engine XU-7 for both natural breathing and
overfeeding So according to the above mentioned, one-dimensional modeling is a useful tool for predecting the engine performance. Using the modeling, all the engine performance parameters can be predicted. It can also effect changes in the design parameters on the performance of the engine. As modeling shows, one of the turbochargers have high engine power for other performance parameters of the engine. CONCLUSIONS In the present study, a one-dimensional model was used to model the XU-7 engine. After Gasoline and CNG engine model, the results of modeling was valid by using the results of engine dynamometer test and functional characteristics were compared between the two engines, and finally given the design parameters of the turbocharger, the engine system was selected for overfeeding. The results were presented in a CNG engine with a significant power reduction compared to gasoline engine. So two systems were modeled on CNG engine for solving this problem.

ACTA TECHNICA CORVINIENSIS – Bulletin of Engineering
2013. Fascicule 2 [April–June] 108
The results were presented that using the designed turbocharger, the volumetric efficiency, braking torque and pressure inside the combustion chamber for overfeeding CNG engine have high level than natural breathing. REFERENCES [1.] L. Andreassi, S. Cordiner & V. Rocco, M.
Gambino & S. Iannaccone "Analysis of Combustion Instability Phenomena in a CNG Fueled Heavy Duty Turbocharged Engine", SAE Paper 2001-01-1907.
[2.] Amsden, A.A., Rourke, P.J, and Butler, "KIVA III: A KIVA Program With Block Structured Mesh for Complex Geometries" Los Alamos National Labs. LA-12503-M.
[3.] Andrassi L., De Maio A., Bella G., Bernaschi M."Internal Combustion Engine Computational Tools: Use and Development" Proccedings of 4th International Combustion Engines: Experiments and Modeling, September 12-16 Capri.
[4.] Johansson B."Cycle to Cycle Variations in SI Engines. The Effects of Fluid Flow and Gas Composition in the Vicinity of the Spark Plug On Early Combustion" SAE Paper 962084, 1996.
[5.] Cordiner S., Gambino M., Rocco V., Unich A. "Analysis of Crevice Mechanism for UHC formation Process in a CNG Fuelled Diesel Engine" ASME ICE Division 1996 Spring Engine Technology Conference 21-24 April 1996.
[6.] Borje Grandin. & Hans-Erik Angstrom. "Replacing Fuel Enrichment in a Turbo Charged SI Engine: Lean Burn or Cooled EGR" SAE Paper 1999-01-3505.
[7.] Konig, G. and Sheppard, C. G. W., "End Gas Auto ignition and Knock in a Spark Ignition Engine" SAE Paper 902135, 1990.
[8.] David Gurney " The Design of Turbocharged Engines using 1D simulation ", SAE Paper 2001-01-0576”.
[9.] R S Benson, The Thermodynamics and Gas Dynamics of Internal combustion Engines, volume1, Edited by J H Horlock and D E Winterbone Clarendon Press, 1982.
[10.] N Watson, M S Jonata, Turbocharging the Internal combustion engine, Macmillan, 1982.
[11.] GT-Power software Reference manual. [12.] Wave software Reference manual. [13.] Huber K., Woschni G. and Seilinger K.,
"Investigations on Heat Transfer in Internal Combustion Engines under Low Load and Motoring Conditions", SAE Paper 905018 (1990).
[14.] [14] Chen, F. M., "A Mixed Friction Model for Dynamically Loaded Contacts with Application to Piston Ring Lubrication", Proceedings of the 7th Leeds-Lyon Symposium on Tribology, 1980.
[15.] Duchaussoy, Y., Lefebvre, A., Bonetto, R. "Dilution Interest on Turbo chargered SI Engine Combustion" SAE Paper 2003-01-0629.
ACTA TECHNICA CORVINIENSIS – BULLETIN of ENGINEERING
ISSN: 2067-3809 [CD-Rom, online]
copyright © UNIVERSITY POLITEHNICA TIMISOARA, FACULTY OF ENGINEERING HUNEDOARA,
5, REVOLUTIEI, 331128, HUNEDOARA, ROMANIA http://acta.fih.upt.ro

© copyright FACULTY of ENGINEERING ‐ HUNEDOARA, ROMANIA 109
1. István BÍRÓ
SIMPLE NUMERICAL METHOD FOR 2-DOF PLANAR KINETICAL PROBLEMS
1. TECHNICAL INSTITUTE, FACULTY OF ENGINEERING, UNIVERSITY OF SZEGED, H-6724 SZEGED, MARS SQ. 7, HUNGARY
ABSTRACT: The motion analysis is an important field in the education of mechanical engineers. Kinematical and kinetical analysis of rigid bodies linked to each other by different constraints (mechanical systems) leads to integration of second order differential equations. In this way the kinematical functions of parts of mechanical systems can be determined. The degrees of freedom of the mechanical system increase as a result of the application of elastic parts in it. Numerical methods can be applied to solve such problems. A simple numerical method will be demonstrated by author by the aid of several examples. Some parts of results obtained by using the numerical method were checked by analytical way. The published method can be used in the technical higher education. KEYWORDS: rigid bodies, motion analysis, kinematical functions
INTRODUCTION The knowledge of motion analysis plays an important role in the education of mechanical engineers. Dynamical analysis of mechanical systems is a fundamental chapter in motion analysis. Mechanical systems having one or two degrees of freedom can be described by second order differential equations or differential equation systems. Analytical solution of them in most cases is quite difficult or impossible. In such cases the application of numerical methods is advantage. The results obtained in this way can be demonstrated in different kinematical diagrams. It helps engineer students better learning of school-work and connections among different physical quantities. In this paper the results of kinetical analysis of two mechanical systems will be demonstrated. THE SIMPLE NUMERICAL METHOD Let us suppose that the mechanical system can be described by ),( ϕrq=q generalized coordinates.
Physical quantities oooo rr ϕϕ ,,, && describe the initial
state of the system. Time step: ii tt −+1 . Applied algorithms can be seen in table below.
Table 1. Applied algorithms t ),,,( ϕϕ&&&& rrr r& r
ot ),,,( ooooo rrr ϕϕ&&&& or& or
1t ),,,( 11111 ϕϕ&&&& rrr )( 11 ooo ttrrr −+= &&&& )( 11 ooo ttrrr −+= &
2t ),,,( 22222 ϕϕ&&&& rrr )( 12112 ttrrr −+= &&&& )( 12112 ttrrr −+= &
3t …. …. ….
4t …. …. ….
Table 2. Applied algorithms t ),,,( ϕϕϕ &&&& rr ϕ& ϕ
ot ),,,( ooooo rr ϕϕϕ &&&& oϕ& oϕ
1t ),,,( 11111 ϕϕϕ &&&& rr )(11 ooo tt −+= ϕϕϕ &&&& )( 11 ooo tt −+= ϕϕϕ &
2t ),,,( 22222 ϕϕϕ &&&& rr )( 12112 tt −+= ϕϕϕ &&&& )( 12112 tt −+= ϕϕϕ &
3t …. …. ….
4t …. …. ….
EXAMPLE 1: SPRING PENDULUM (DOF: 2) In Fig. 1 the sketch of spring pendulum can be seen.
Figure 1. Sketch of spring pendulum
Data: M = -1 Nm, s = 800 N/m, m = 2 kg, R = 0,2 m (length of unloaded rod), g = 10 m/s2, smro /0=& ,
mr 28,0= , srado /0=ϕ& , rado 1=ϕ (time step: 0.0001 s, time interval: 0 ≤ t ≤ 1 s)

ACTA TECHNICA CORVINIENSIS – Bulletin of Engineering
2013. Fascicule 2 [April–June] 110
The motion of the spring pendulum is described by the following second order differential equation system. They can be obtained by the aid of second order Lagrangian-equation.
mmgrrsmrr o ϕϕ cos)(2 +−−
=&
&& ,
22sin
mrrmrmgrM ϕϕϕ&&
&&−−
=
After two-time numerical integration of motion equations the following kinematical functions can be obtained.
r"(t), m/s2
-40-30-20-10
01020304050
0 0,1 0,2 0,3 0,4 0,5 0,6 0,7 0,8 0,9 1
φ"(t), rad/s2
-150
-100
-50
0
50
100
150
0 0,1 0,2 0,3 0,4 0,5 0,6 0,7 0,8 0,9 1
r'(t), m/s
-2,0
-1,5
-1,0
-0,5
0,0
0,5
1,0
1,5
2,0
0 0,1 0,2 0,3 0,4 0,5 0,6 0,7 0,8 0,9 1
φ'(t), rad/s
-15
-10
-5
0
5
10
15
0,0 0,1 0,2 0,3 0,4 0,5 0,6 0,7 0,8 0,9 1,0
r(t), m
0,00
0,05
0,10
0,15
0,20
0,25
0,30
0,35
0 0,2 0,4 0,6 0,8 1
φ(t), rad
-2,0
-1,5
-1,0
-0,5
0,0
0,5
1,0
1,5
0 0,1 0,2 0,3 0,4 0,5 0,6 0,7 0,8 0,9 1
Figure 2. The kinematical functions for Example 1:
Spring pendulum EXAMPLE 2: LINK MECHANISM WITH RECIPROCATING MOTION MASS (DOF: 2) In Fig. 2 a sketch of a simple mechanical system (two degrees of freedom) can be seen. There is a mass and a link mechanism in between a spring.
Figure 3. Sketch of link mechanism
Data: M = 2 Nm, J = 4 kgm2, r = 0.15 m, s = 1000 N/m, m = 20 kg, smxo /0=& , mxo 0= , srado /3=ϕ& ,
rado 0=ϕ , (time step: 0.005 s, time interval: 0 ≤ t ≤ 3 s). The motion of the link mechanism can be described by the following second order differential equation system.
msxxksrr −−
=&
&&ϕcos
,
JrxsrM )cos( ϕϕ −−
=&&
After two-time numerical integration of motion equations the kinematical functions will be the followings.

ACTA TECHNICA CORVINIENSIS – Bulletin of Engineering
2013. Fascicule 2 [April–June] 111
φ"(t), rad/s2
-10-8-6-4-202468
1012
0,0 0,5 1,0 1,5 2,0 2,5 3,0
x"(t), m/s2
-15
-10
-5
0
5
10
15
0 0,5 1 1,5 2 2,5 3
φ'(t), rad/s
0
1
2
3
4
5
6
7
0 0,5 1 1,5 2 2,5 3
x'(t), m/s
-2,5-2,0-1,5-1,0-0,50,00,51,01,52,02,5
0 0,5 1 1,5 2 2,5 3
φ(t), rad
0
2
4
6
8
10
12
0,0 0,5 1,0 1,5 2,0 2,5 3,0
x(t), m
-0,5
-0,4
-0,3
-0,2
-0,1
0,0
0,1
0,2
0,3
0 0,5 1 1,5 2 2,5 3
Figure 4. The kinematical functions for Example 2:
Link mechanism with reciprocating motion mass CONCLUSIONS The above demonstrated method can be applied easily for engineer students in the higher education. The method is suitable for investigation of similar mechanical systems having one or more degrees of freedom. By consequent modification of data (physical quantities) of systems a wide range of possible structures and their kinematical behavior can be analyzed. For this reason the application of this method can be advantageous for engineer students. REFERENCES [1.] BOSZNAY, Á.: Műszaki rezgéstan, Műszaki
Tankönyvkiadó, Budapest, 1962. [2.] HEGEDŰS, A.: A műszaki rezgéstan alapjai.
Szent István Egyetemi Kiadó, Gödöllő, 2009, p. 149.
[3.] CSIZMADIA, B.M., NÁNDORI, E. (szerk.): Mechanika mérnököknek, Mozgástan, Nemzeti Tankönyvkiadó, Budapest, 2001
ACTA TECHNICA CORVINIENSIS – BULLETIN of ENGINEERING
ISSN: 2067-3809 [CD-Rom, online]
copyright © UNIVERSITY POLITEHNICA TIMISOARA, FACULTY OF ENGINEERING HUNEDOARA,
5, REVOLUTIEI, 331128, HUNEDOARA, ROMANIA http://acta.fih.upt.ro

ACTA TECHNICA CORVINIENSIS – Bulletin of Engineering
© copyright FACULTY of ENGINEERING ‐ HUNEDOARA, ROMANIA
ACTA TECHNICA CORVINIENSIS – BULLETIN of ENGINEERING
ISSN: 2067-3809 [CD-Rom, online]
copyright © UNIVERSITY POLITEHNICA TIMISOARA, FACULTY OF ENGINEERING HUNEDOARA,
5, REVOLUTIEI, 331128, HUNEDOARA, ROMANIA http://acta.fih.upt.ro
ACTA TECHNICA CORVINIENSIS – BULLETIN of ENGINEERING
ISSN: 2067-3809 [CD-Rom, online]
copyright © UNIVERSITY POLITEHNICA TIMISOARA, FACULTY OF ENGINEERING HUNEDOARA,
5, REVOLUTIEI, 331128, HUNEDOARA, ROMANIA http://acta.fih.upt.ro

© copyright FACULTY of ENGINEERING ‐ HUNEDOARA, ROMANIA 113
1. Jan KMEC
SAFE WORKING CONDITIONS FOR THE WATER JET TECHNOLOGY
1. TECHNICAL UNIVERSITY OF KOŠICE IN PREŠOV, FACULTY OF MANAGEMENT, KONŠTANTÍNOVA 16, 080 01 PREŠOV, SLOVAKIA
ABSTRACT: Water-jet cutting technology provides new possibility to shape cutting and various material cold cutting without heat influence of material on cutting edge. However, the power of the water jet overcomes expectation of a people that are not familiar with the technology. Work safety with water-jet in various production technologies must make provision for not only safety work with water-jet technology, but also safety work with all devices, which are on that workplace situated and also material manipulation. So, the paper is focused on some of the safety aspects at the water-jet workplaces. KEYWORDS: Water-jet cutting technology, cold cut, safety
INTRODUCTION Water-jet cutting technology represents unique, for the future oriented possibility of high automation introduction at high-speed cutting really all material types. In 30-thy year’s American and Russian engineers first time tried to use water stream in mining, demarcating by high speed and that for coal, stone and rock mining. In the end of 60-thy year’s one American airplane producer decided, that he use water jet cutting for processing of fleeced bonded textiles, plastic materials and materials folded from more layers. High-pressure cutting with water stream, which is named also Water jet-Cutting, was afterwards continuously developed. Important impulse for water jet using in production technique like tool has came from aircraft designing and astronautics. TECHNOLOGY WATERJET - SAFETY WORK WITH WATER-JET The water-jet cutting principle is visible on following Figure 1.
Figure 1. The principle of water-jet cutting
– hydro-abrasive method
Safety processes and safety practices of water jet technology must be monitored during introducing to the operation, during lonely operation and maintenance of high pressure pumps. In this area has created tables and symbolic descriptions used in real practice, which is needed to follow at operation of workplaces for water jet material separation. The Table 1 shows the most important symbolic descriptions of water jet.
Table 1. Tables and abbreviations for safety at work with water-jet
Show on dangerous, which can cause personal injuries or property damage, if care instructions are ignored.
Show on dangerous, which can cause serious personal injuries, death or substantial property damage, if warning is ignored.
High pressure of water stream can cause eyes injuries. Protect your eyes, when you work near the machine.
Dangerous noise can cause hearing loss. Protect your ears, if you work near the machine.
Dangerous electric tension can cause injury or death. Before opening the case unplug and disconnect main electric supply.
Wrong function
Hydraulic multipliers

ACTA TECHNICA CORVINIENSIS – Bulletin of Engineering
2013. Fascicule 2 [April–June] 114
Table 1. Tables and abbreviations for safety at work with water-jet (continue)
Pressure control
High pressure
Low pressure
Start/Initialization
Stop
Running
The Table 2 explains the warning label precautions at water jet operations. The great injuries can be made also when the machine does not work, but the pump system was not switch off. After following starting of work on machine, the high pressure of water jet can injure the person as cutting injuries.
Table 2. Warning Label Precautions
In the Table 3 is shown the important symbols from the point of view of maintenance and service.
Table 3. Warning Label Precautions
The electrical enclosure and motor junction box can present an electrical shock hazard. Always disconnect and lockout the main power before opening the enclosure. You must always disconnect and lockout the main power and the circuit disconnect on the electrical enclosure door before performing any type of maintenance.
The surface of high pressure water and hydraulic components becomes hot during normal operation. Failed or failing components can become extremely hot during operation.
Ensure that all protective guards, shields or covers are in place on the equipment at all times. Never operate the pump with the guards removed.
High pressure water and/or hydraulic pressure can remain in the system even when the pump has been shut off. All pressure can be safely bled from the system by opening the high pressure cutting water valve for a few seconds after shutting off the pump. Pressing the EMERGENCY STOP button turns the control power to the intensifier off, stops the pump and bleeds the high pressure water through the safety dump valve. Depressurization of the high pressure system creates a loud hissing sound when the dump valve opens. The sound fades quickly as the pressure drops.
All personnel involved in the installation, operation and/or service of the intensifier must carefully read, understand and follow the procedures in this manual to avoid creating unsafe conditions, risking damage to the equipment, or personal injury.
SAFETY PROCESSES Safety procedures must be following while it is worked with high pressure pump, with some its high pressure part. Such pump can operate only by qualified person. It is concerned at following safety procedures: � High pressure of water from 3800 to 4150 bar (55
to 60 000 psi) at water-jet cutting systems should not be reason for disconcertment. User must have respect before that pressure and use current safety processes and safety working practices.
� Everyone, who is connected with water-jet cutting system must realize, that power of water-jet

ACTA TECHNICA CORVINIENSIS – Bulletin of Engineering
2013. Fascicule 2 [April–June] 115
cutting stream can penetrate into many hard and strong materials.
� Not qualified personal must not move in water-jet cutting area.
� In water-jet cutting area must be all time used safety glasses and earmuffs.
� All emergency STOP buttons must be regularly checked. During normal operation are pulled out.
� Check of buttons: Turn on electric supply and activate emergency STOP button so, that are pushed, you must see, if energy exploding. Every device should be checked according special table. All the time, when device is checked, must function or must be returned into the original status before the start of operation.
� Use high clean lubricating wax for all threaded high-pressure connections. All piping, assembled and screwed connections should be tightened into the recommended moment values. If the circuit is under high pressure, do not try tight or install any high pressure parts, see safety of high pressure tubing.
� All high pressure leakages must be immediately repaired.
� Check all equipment according tables. � Before maintenance starting, turn off the main
stop and ensure that high pressure is released. SAFETY OF THE HIGH PRESSURE TUBING Tubing with high pressure must be installed without stress in torsion. Suitable support and direction must be ensured. 9/16“ external diameter of high pressure pipes and armatures are recommended between the pump and the cutting head. Tubes of these big dimensions will decrease vibration, tension and bend between pump tubing and cutting area. Bigger tubing diameter also decreases the pressure and pressure pulsation. GENERAL MAINTENANCE FROM POINT OF VIEW OF WORK SAFETY Suitable maintenance is important for reliable and rigorous performance. Preventive maintenance reduces stoppage time for repairing, provides bigger operating life of parts and increases work safety. High-pressure water will cut almost all what reaches. Every infiltration must be immediately repaired to prevent damage or serious personal injury. Maintenance directions are following: � Regular equipment checking is recommended, � Keep equipment and surroundings clear, � Check pressures, temperatures and seal tightness, � Immediately execute repairing, � Maintenance record should be saved. Working environment at water jet operations: � Keep clear working environment for repair and
maintenance waterjet pump. � Use clear working table for repairs and clear
working environment. � Use not woolen materials for wiping. � If parts with compressed air are released, use
only clear, dry air. If parts are wash solvent, use only clear filtrated liquid.
� Always use original spare parts from producer for original version, reliability, safety and guarantee protection.
Safety recommendations for working persons: � Carefully read the safety instructions. � Turn off all electric power. � Shut all incoming delivery valves and open all
unwatering valves. � Shut injection and transfer valves, if energy is
closed, safety exiting valve will open and release water high pressure hidden in releasing tubing.
� Ensure suitable drawer, bowl, tanks, etc. For fixation and detention liquid to avoid of hazardous working environment.
� Abide double control for ensuring, that all pressure is removed from system before you continue in work.
� Especially medical treatment is required always at treatment of wounding by waterjet according to card for emergency rescue. This card is part of technology delivery.
� Avoid of leaking, sharpen abrasions or bend loads, if work with expensive technology parts.
� Ensure, that all parts are clean, without sharpen edges, particulates, dirt, etc.
� Use high clean lubricant wax, if assemble some high pressure part or set.
� After repair any high-pressure part, check all high pressure connections for releasing of pressure.
CONCLUSIONS Work safety with water-jet in various production technologies must make provision for not only safety work with water-jet technology, but also safety work with all devices, which are on that workplace situated and also material manipulation. In case of other workplace devices, manipulation with material, interoperable transport, storage, control and overall work environment, i.e. production logistic, safety regulations valid for technology operation are applied and followed, in accordance with law, in terms of Inspectorate of work safety and State health authority. Acknowledgements The contribution was prepared in the frame of solving of grant scientific project VEGA No. 1/0396/11. REFERENCES [1.] KMEC, J., SOBOTOVÁ, L., BIČEJOVÁ, Ľ. Kategórie
faktorov vplývajúcich na hydroeróziu. In: Trendy a inovatívne prístupy v podnikových procesoch : 13. medzinárodná vedecká konferencia : zborník príspevkov : 8.12.2010, Košice. - Košice : SjF TU, 2010 S. 1-10. - ISBN 978-80-553-0570-7 (in Slovak)
[2.] BIČEJOVÁ Ľ., Influence of abrasive lineness change on water jet technologic head of vibrations origin. In: Scientific Papers : operation and diagnostics of machines and production systems operational states : vol. 3. - Luedenscheid : RAM-Verlag, 2010 P. 29-34. - ISBN 978-3-942303-04-0
[3.] BIČEJOVÁ, Ľ., FABIAN, S., KRENICKÝ, T. Analýza vplyvu zmeny reznej rýchlosti na vznik vibrácií pri delení materiálu technológiou AWJ = Analysis of variations in cutting-speed on the vibration generation during separation of material using

ACTA TECHNICA CORVINIENSIS – Bulletin of Engineering
2013. Fascicule 2 [April–June] 116
technology of AWJ. In: ERIN 2009. - Ostrava : VŠB TU, 2009 P. 1-5. - ISBN 9788024819822
[4.] FABIAN, S., KRENICKÝ, T., BIČEJOVÁ, Ľ., Vibrodiagnostic monitoring in technology of AWJ. In: Mechanical Engineering SI 2008. - Bratislava : STU, 2008, pp. 1-8.
[5.] NOVÁKOVÁ, M., PAVLENKO, S. Experimental determining of technological process parameters of thin sheet metal rotary shaping / Martina Nováková, Slavko Pavlenko - 2010. - 1 elektronický optický disk (CD-ROM). In: Studia i materialy. Vol. 26-29, no. 1-2 (2010), p. 2-7. - ISSN 0860-7761
[6.] PAVLENKO, S., HAĽKO, J., MAŠČENIK, J., NOVÁKOVÁ, M., Navrhovanie súčastí strojov s podporou PC. Prešov: FVT TU, - 2008. - 347 s. - ISBN 978-80-553-0166-2 (in Slovak)
[7.] VASILKO, K., GOMBÁR, M., The influence of machining parameters on the machined surface quality. In: Modern Metrology in Quality Management Systems. - Kielce: Wydawnictwo Politechniki Swietokryzskiej, 2006 P. 275-284.
[8.] VASILKO, K., GOMBÁR, M., Identifikácia vzťahu rezných podmienok a morfológie obrobenej plochy = The identification relation cutting conditions and morfologie cut surface. In: Nové smery vo výrobných technológiách 2006. - Košice : FVT TU, 2006 pp. 132-135
ACTA TECHNICA CORVINIENSIS – BULLETIN of ENGINEERING
ISSN: 2067-3809 [CD-Rom, online]
copyright © UNIVERSITY POLITEHNICA TIMISOARA, FACULTY OF ENGINEERING HUNEDOARA,
5, REVOLUTIEI, 331128, HUNEDOARA, ROMANIA http://acta.fih.upt.ro

© copyright FACULTY of ENGINEERING ‐ HUNEDOARA, ROMANIA 117
1. G. ADEDOKUN, 2. J.A. OLADOSU, 3. T. K. AJIBOYE
SMALL HYDRO POWER POTENTIAL CAPACITY ESTIMATION FOR PROVISION OF RURAL ELECTRICITY IN NIGERIA
1,2. DEPARTMENT OF ELECTRICAL/ELECTRONICS ENGINEERING, OSUN STATE COLLEGE OF TECHNOLOGY, ESA-OKE, NIGERIA 3. MECHANICAL ENGINEERING DEPARTMENT, UNIVERSITY OF ILORIN, NIGERIA
ABSTRACT: Nigeria’s electricity demand increases due to growth in industrialization and socioeconomic weight. Regrettably, power industry of the country has not been able to satisfy the need of their customers. Therefore, if the country is to meet its energy demand alternative sources of power generation are very essential. Opportunities abound in hydropower scheme development as a viable energy source of electricity which will curtail and minimize greenhouse gases and emissions into environment. Meanwhile, there are small rivers all over the country with potential sites suitable for small hydropower scheme, development of which will ensure the supply of electricity to remote communities. This can be used as a substitute for commercial fuels, which effect reduce cost of fuelling and raise the earning potential of the rural communities. KEYWORDS: power, generation, small hydropower, potential, capacity, install, gross head, net head, electricity
INTRODUCTION Energy is the essential locomotive for economic growth and accelerated development of a country. There is a straight correlation between per capital earnings and the use of energy; thus, this is a direct gauge of quality of life and a key factor in fight for poverty lessening. Country`s energy demand increases day by day; unluckily, myriad of technical and administrative challenges have been bedeviling electrical power generation and utilization in Nigeria. Hence, alternative sources of power generation have to be invented if country is to meet its energy demand and attain the desired industrial and economic development. Opportunities thrive in small hydropower (SHP) schemes development as a viable source of energy for electricity generation. Small hydro power scheme is defined as any hydro power installation rated less than 10MW installed capacity (Odesanya, 2005). There are many small rivers all over the country with potential sites fitting for SHP schemes, the progress of which will provide electricity to isolated communities; then, used as a substitute for commercial fuels, which effect reduces cost of fuelling and raises earning potential of the rural communities. However, the only problem often encountered in SHP growth is how to determine the potential capacity of the proposed site because the hydropower potential is limited by the intermittent nature of rivers flows which have high water discharges during rainy and very low discharges in dry season. Consequently, in hydropower projects site selection, water discharge
and head are fundamental; so the proposed site having a good combination has to be investigated. While the head at a site is constant, the available flow rates are highly variable; so, study of maximum flows is very important from the point of design or installed capacity; the average flows is important from the consideration of the energy output and minimum flows are required to predict dependable plant capacity. Since, the entire quantity available at a site (except flood flow) is utilized in power production, the study of water demand for hydropower amount to collection of stream flow data and their analysis. Usually the analysis relates to the preparation of flow-duration curves, which indicates the magnitude of discharge against the percentage of time the discharge is exceeded at a site (Nwachukwu, 2005). Therefore, stream flow is an important parameter in determining the maximum power derivable from any flowing river, hence the focus of this work is to examine the easy and less expensive methods of estimating the potential capacity of a stream for effective power generation. METHOD OF STUDY. Theoretical background Small hydropower scheme makes use of falling water in a stream, river or storage dam to generate electric power. The water falling through the storage and level of the turbines gains kinetic energy which it then impacts to turbine blades of alternator. The power P available from a hydro scheme is given by (Weedy, 1979)
( )wattHQgρP = (1) where, Q is the flow rate (m3/s) of the water through the turbine blades,

ACTA TECHNICA CORVINIENSIS – Bulletin of Engineering
2013. Fascicule 2 [April–June] 118
ρ is the water density (1000 kg/m3 ), g is the acceleration due to gravity (9.81 m/s2), and H is the gross head (m). Substituting,
( )kWHQ81.9P = The expression above gives available power, P as a function of flow rate Q, which is volume of water passing through a given area in a given time measured in cubic metres per second; and H, which is the gross head in metres. Accordingly, to estimate the hydro-potential capacity of a site it is important to know the variation of the discharge throughout the year and the available gross head. Determination of available gross head The gross head is the vertical height that the water falls through in generating electric power. The field measurements of gross head are usually carried out either by using any surveying techniques, namely; surveyor’s staff and level, Clinometers or Abbey level, Digital Theodolites with electronic digital level or surveying by global positioning system (Tamunotonye, 2005). Having estimated the gross head available it is necessary to allow for the losses that may arise from trash racks, pipe friction, bends and valves. The net head available to drive turbine is equal to the gross head minus the sum of all the losses. Therefore,
∑-= lgn HHH (2)
where, Hn is the net head, Hg is the gross head, and ΣHl is summation of all the head losses. ESTIMATION OF STREAM FLOW. Data collection The hydrological data required in SHP development are mainly stream flow and rainfall data. Stream flow fluctuates, and this fluctuation can be visualized when the flows are plotted against the time. Understanding the pattern reveals when to measure low flow and average flow. Measurements of stream flow from a hydrological stream-gauging network are the main and best source of the surface water flow data (Ram S. Gupta, 1989). However, no national data collection program anywhere in the world collects sufficient data to satisfy all the design and decision-making needs in any catchment area (Fleming, 1976). The world meteorological organization recommended that when the data are inadequate; project activity should begin with installation of a hydrological gauging network. In Nigeria, stream flow measurements are carried out by government through the River Basin Development Authority, who established gauging stations on rivers within their catchment area and these flow data can be obtained from them. However, in the past fifteen years there have not been stream flow measurements due to lack of funding. Therefore, flow data collections for most of the rivers have since stopped, resulting inadequate data for analysis (Nwachukwu, 2005). In practice, streams of interest usually are not gauged and there are no flow records to work with,
so gauging stations have to be established to obtain discharge for at least a year. Measurement of stream flow The volume of water passing through a given area in a given time measured in cubic metres per second is described as flow rate. Thus, the product of the cross-sectional area of the stream and the velocity be measured is the flow rate (Tamunotonye, 2005),
AVQ meanmean ×= (3) where, Qmean is the mean flow rate (m3/s), Vmean is the mean velocity (m/s), and A is the cross-section area of the stream (m2). The cross-sectional area of a water course can be obtained by dividing the cross section into a series of trapezoids. Measuring the trapezoid sides, by marked rules the cross-section area would be given by,
( )n
h...............hhhbA n321 +.+++×= (4)
where, h1, h2 , ………. = water depth at different points along the base level b = width across the river
Figure 1. Cross-section of a river
The velocity across the flow and vertical is not constant; so, in order to obtain a mean value it is necessary to measure velocity of water at a number of points. There are several methods applicable in measuring the stream flow, a few common and less expensive methods are stated: bucket, float, current meter and stage control methods STREAM FLOW DATA REQUIREMENT In designing a small hydropower scheme mean monthly and annual flow record are often used. The stream flow and rainfall data for the catchment area of the stream under investigation are required. The available record must be of adequate length in order for analysis to be meaningful. Generally, small hydropower schemes have a life span of range of 20-50 years depending on the make, type and capacity (Nigam, 1985). Therefore, 20 years stream flow record is considered adequate for the analysis and development of small hydropower schemes. The desirable length of stream flow record will largely depend on the length of available, rainfall and availability of stream flow records of other rivers within the project area. Success of the scheme depends on how accurate has been the estimation of total quality of water available and its variability. Proper estimation of water availability is, therefore, very essential. This would require collection of data and then computation by suitable method on the basis of available data. For computation of water availability, rain fall and run-off data should be collected. The water availability for SHP is based on 90% dependability

ACTA TECHNICA CORVINIENSIS – Bulletin of Engineering
2013. Fascicule 2 [April–June] 119
(Nwachukwu, 2005). Depending upon the type of data available, the water availability can be computed from one of the following method, namely; direct observation method and rain-fall run-off series method. STREAM FLOW DATA ANALYSIS The main objective of stream flow record analysis in SHP development is to prepare a flow duration curve and then determine design flow, installed capacity, plant capacity factor and average discharge. In order to ascertain how often flow of a given magnitude occurred during the period of record, a flow duration curve is prepared. From available data, the discharge is plotted as ordinate against the percent of time that discharge is exceeded on the abscissa and this can be of daily, mean monthly or mean annual flows. Flow duration curves from long-term monthly stream flow records offer a convenient tool in plant capacity design (Nwachukwu, 2005). The procedure used to prepare a flow-duration curve is as follows, demonstrated with a case study of Osun River.
Table 1: Mean monthly stream flow (m3/s) of Osun River YEAR JAN FEB MAR APR MAY JUNE 1979 84 89 74 97 158 127 1980 74 59 49 69 159 262 1981 42 58 76 111 228 176 1982 65 69 93 82 150 266 1983 73 132 62 116 154 144 1984 33 64 42 97 140 129 1985 105 97 42 67 114 132
YEAR JULY AUG SEP OCT NOV DEC 1979 89 56 48 47 72 136 1980 108 69 47 110 114 81 1981 118 66 47 46 65 65 1982 187 82 55 42 96 76 1983 129 68 42 84 145 155 1984 104 62 43 56 55 51 1985 144 75 50 35 23 24
The discharge in the range 0 to 300m3/s has been divided into 15 classes of 20m3/s each as shown in column1 in table 2. The data are scanned through and each item is noted in the class group in which it belongs. The total in each class is shown in column 2. Column 3 shows the accumulated number of items of column 2, starting from the bottom. The items accumulated are shown as percent in column 4. The plots of largest values in each class in column 1 against column 4 are shown in figure 2. From the plot, the design flow rate is Q corresponding to 40% exceed (Nwachukwu, 2005) Q40 = 100m3/s and the capacity point is Q15 = 154m3/s. The mean flow rate Qav (Nwachukwu, 2005) is computed from;
( ) ( ) ( )( )80706050403020
10909551000ay
QQQQQQQ10.0
QQ075.0QQ05.0QQ025.0Q
+++++++
+++++= (6)
where, Qav = average discharge, Q5, Q10 = discharge corresponding to 5%, 10%, exceed, Q0, Q100 = discharge nearly 0 and 100% of time (any discharge of less than 5% and more than 95% respectively.
The real power equation [3] is between P = 7QH and P = 8.5QH (kW) where, Q = design flow rate m3/s taken as Q40, H = available head measured in metres. From flow-duration curve fig.2, Q40 = 100 m3/s. Therefore, the power equation in the case of a low head plant (less than 10 m) in which the fore bay level varies, the gross head should be measured to the minimum force bay level.
Table 2: computation of flow-duration curve 1 2 3 4
Class flow range (m3/s)
Number of items
Cumulative number of
items
Percent of time
0 – 20 0 84 100 21 – 40 4 84 100 41 – 60 20 80 95.2 61 – 80 19 60 71.4 81 – 100 12 41 48.8 101 – 120 9 29 34.5 121 – 140 7 20 23.8 141 – 160 8 13 15.5 161 – 180 1 5 6.0 181 – 200 1 4 4.8 201 – 220 0 3 3.6 221 – 240 1 3 3.6 241 – 260 0 2 2.4 261 – 280 2 2 2.4 281 – 300 0 0 0
Figure 2: Discharge– percent of time exceeded
P = 7 x100x100 kW = 7000 kW or 7 MW The corresponding design or installed capacity of the plant is based on maximum flow, which is usually as Q15 (i.e, flow exceeded 15% of the time) [3]. Flood flows above this magnitude are allowed to overflow without producing power. The corresponding installed capacity is given by
( )kWHQ7P 15instal ××= ( )kW10780101547Pinstal =××=
MW7.10Pinstal = Annual energy output E is given by
kWh8760HQ7E ay ×××=
( )m10HkWhQ613200E ay ==
From the curve Qav = 92 m3/s Therefore, E = 56414400 kWh or 56414.4 MWh

ACTA TECHNICA CORVINIENSIS – Bulletin of Engineering
2013. Fascicule 2 [April–June] 120
The plant capacity factor is the ratio of the average power production to the installed capacity and this is
practically taken as 597.015492
15==Q
Qay
A plant capacity factor of 0.6 is common for storage type power schemes (Ram, 1989). CONCLUSIONS Locating a good site for installation of a new plant is one of the main obstacles for small hydroelectric power generation. The site where the small hydropower is installed must have sufficient head and enough water flow rate to produce sufficient amount of energy and the site must also be close to the location where the energy is going to be utilized. Flow rate is very essential for hydropower generation since the head at a proposed site is practically constant while the available flow is highly variable. Having known the water discharge, annual energy output of the proposed site under consideration can be estimated which will serve as an input energy to run hydro turbine of the SHP scheme to generate electricity. Since the entire quantity available at a site is utilized in power production, the study of water demand for hydropower amount to collection of stream flow data and their analysis. Therefore, stream flow is an important parameter in determining the maximum power derivable from any flowing river. RECOMMENDATION Exploring the potential of SHP scheme as eco-friendly source of energy serves the least cost option for provision of electricity to underdeveloped rural areas compared to the extension of grid. They are affordable if necessary subsidy is provided. Furthermore, the value added benefits of the scheme is as follow: Availability of local labour and materials; thereby, increasing the income of the poor. They help to check rural/urban immigration. They are flexible and can usefully be integrated into almost any kind of development programme such as rural development, poverty alleviation programme and environment protection programmes. REFERENCES [1.] Gundiri M.N (2005), Guidelines for the design
of hydraulic structures for small hydropower schemes, paper presented at national workshop on capacity building in small hydropower for the provision of rural energy, pp. 1–8, Ogun-Osun River Basin Development Authority, Nigeria.
[2.] Nigam P.S (1085), Hand Book of Hydro Electric Engineering, Second edition.
[3.] Nwachukwu M.C (2005), Hydrological data collection and analysis for small hydropower development, national workshop on capacity building in small hydropower for the provision of rural energy, pp. 1–20, Ogun-Osun River Basin Development Authority, Nigeria.
[4.] Odesanya M.O (2005), Social impact assessment and its mitigation in SHP projects, national workshop on capacity building in small hydropower for the provision of rural energy, pp. 1 – 2, Ogun-Osun River Basin Development Authority, Nigeria.
[5.] Ram S. Gupta (1989), Hydrological and Hydraulic Systems Practice. Wall Inc.
[6.] Tamunotonye Brown (2005), Determining Potential Capacity of Small Hydropower Site, pp. 2 – 5, Ogun-Osun River Basin Development Authority, Nigeria.
[7.] US Bureau of Reclamations (1987), Design of small Dams, WR Technical Publ. 2nd edition.
[8.] Weedy B.M (1979), Electric Power Systems, third edition. Chichester New York: John Willy & Son.
[9.] Yanmaz A.M (2001), Applied Water Resources Engineering, Ankara, Ghana: METU Press
ACTA TECHNICA CORVINIENSIS – BULLETIN of ENGINEERING
ISSN: 2067-3809 [CD-Rom, online]
copyright © UNIVERSITY POLITEHNICA TIMISOARA, FACULTY OF ENGINEERING HUNEDOARA,
5, REVOLUTIEI, 331128, HUNEDOARA, ROMANIA http://acta.fih.upt.ro

© copyright FACULTY of ENGINEERING ‐ HUNEDOARA, ROMANIA 121
1. Cristina HORA, 2. Simona DZIŢAC, 3. Călin SECUI, 4. Gabriel BENDEA
RELIABILITY ANALYSIS OF SPHERICAL VALVE (VS) FROM HPP REMEŢI USING MONTE CARLO SIMULATION
1-4. UNIVERSITY OF ORADEA, FACULTY OF POWER ENGINEERING AND INDUSTRIAL MANAGEMENT, 1, UNIVERSITĂŢII, ORADEA, ROMANIA
ABSTRACT: In every hydro energetic arrangement, the water approaches, in differently construction elements and trough them, are equipped with valves. These valves assure the normal functioning of equipments, respectively there operatively insulation in case of failures or repairs. Also, the reliability level of hydro mechanical equipments can have a major impact on the operational reliability of HPP (Hydro Power Plants). In consequence, there are justified the concerns regarding the predictive reliability of them. In this paper, these studies of hydro-mechanical equipments reliability are made using the Monte Carlo simulation. KEYWORDS: reliability, hydro mechanical equipment, Monte Carlo simulation
INTRODUCTION In every hydro energetic arrangement, the water approaches, in differently construction elements and trough them, are equipped with valves. These valves assure the normal functioning of equipments, respectively there operatively insulation in case of failures or repairs. The accomplished studies [4, 5], indicate that some valves type are more performing under the reliability aspects than other equipments (hydraulic turbines). In succession, on the reliability studies, the valves are treated as bivalent elements (Functioning; Faulting). The reliability analysis of hydro mechanical equipments it has been made using the Monte Carlo simulation [2, 6, 7]. RELIABILITY ANALYSIS OF SPHERICAL VALVE (VS) FROM HPP REMEŢI USING SIMULATION PROGRAM The spherical valve equipment, SV 150-500, is a complex ensemble who attended the hydraulic turbine FVM 52-320. It is located upstream of turbine and downstream of distributor. The spherical valve performed one’s functions namely, the safety device for turbine. The valve control its automatic realize, in the hydro generator on-off process. During a several distinctly operations the spherical valve it has manual control, from the local panel. During the reliability analyses, the spherical valve (SV) from HPP Remeti, it has been regarded like a system compound of following subsystems (figure 1): � The closing subsystem (CSS); � The sealing subsystem (SSS); � The control subsystem (NSS); � The operate subsystem (OSS); � The protection subsystem (PSS).
Figure 1. The spherical valve subsystems
According to previously specifications (for the simplified reliability analyses) SV it has been treated as a system compound of five subsystems. In consequence, it can represent the simplified equivalent diagram, who reflects the necessity that, all the subsystems to be in work for satisfied all the spherical valve functions.
Figure 2. The equivalent diagram of SV
Depend on results obtained from the operational reliability studies [4,5], it can estimate the subsystems reliability indicators [Ri, Fi, µi, Mi].

ACTA TECHNICA CORVINIENSIS – Bulletin of Engineering
2013. Fascicule 2 [April–June] 122
The calculus relations are:
[ ]
[ ][ ]
ri tμi
i
ii
SVi
iSV
e1M;μ%β%ν
μ
;F100
%νF;
μλλ
F
--==
=+
= (1)
where: λ, µ - the SV reliability indicators; FSV – failure probability of SV; νi, βi – the weight of number failures and failures time, of the (i) subsystems from the total value of these indicators at the level of SV.
The maintainability values (Mi) are determined using condition that the maintenance corrective operations must finished in MTM = 42 h [4]. The values are represented in table 1.
Table 1 – The values of reliability indicators for the VS subsystems
Subsystem CSS (E1) SSS(E2) NSS (E3) Fi x 103 3.9355 27.7062 9.2878
[ ]1i h−μ
0.00625 0.00855 0.006
Mi 0.23087 0.30169 0.22282 Ri 0.9960645 0.9722938 0.9907122
λi [h-1] 0.000024694 0.00024363 0.000056249
Subsystem OSS (E4) PSS (E5) Fi x 103 101.852 14.6402
[ ]1i h−μ
0.006908 0.007159
Mi 0.2518381 0.2596838 Ri 0.898148 0.9853598
These values will be input into the simulation program whose editing window is shown in figure 3.
Figure 3. – The editing window of analyzed system
Following the steps from [2, 3], it's obtained figures 4÷7, which refers to the characteristic equation, specifying the input data, the failure and repair rate values, also the saved and loading data windows of simulated system.
Figure 4. – The characteristic equation of system
Figure 5. – Specifying the simulation data
of analyzed system
Figure 6. –The saved data window
for system analysis
Figure 7. – The loading data window
of analyzed system
Figure 8. – The simulation module for 15 years
and 10 000 simulations

ACTA TECHNICA CORVINIENSIS – Bulletin of Engineering
2013. Fascicule 2 [April–June] 123
Figure 8 shows how to display the results for 15 years of analysis and 10.000 simulations, so that in figure 9 is presented the simulation results display window.
Figure 9. - The simulation results display window
Figure 10. - The window display module of operating
diagram for analysis system
Figure 11. – The operating diagram
of analyzed system for 15 years
Figure 10 shows the display module of operating diagrams and diagram in figure 11, 12 presents the corresponding data input module. It is noted the existence of defects over time at both component and system level. This and the simulation results are due to the elements in series of analyzed system.
Figure 12. – The operating diagram
of analized system for 1 year
To be convinced of the usefulness and accuracy of the reliability simulation program will be a comparison of the results obtained by simulation and those obtained by analytical calculus - DEF method - [4,5], on reliability. The analytical calculus of system reliability is Rsis = 0.849132, comparable to that obtained in the simulation, which was: Rsis = 0.85084. Must be made clear that the simulation results are influenced by the system evolution in time, taking into account the defects that occur during the analysis. It is observed that defects are the most common at element 4 which has the lowest reliability. Frequent defects of 4 element, serially connected to the other element, leading to overall system failure, so to decrease system reliability. It is found that the differences that arise in calculating the reliability by Monte Carlo and analytical methods are very small, which gives the judge that Monte Carlo simulation method can be applied in reliability analysis of hydraulic equipment. CONCLUSIONS 1. In the reliability analysis will consider the
spherical valve (VS) as a complex system consists of five subsystems connected in series.
2. For complex systems, the program presented in [2] and run for VS is considered very effective, allowing reliability calculus, drawing of operating diagrams for all elements and system in record time.
3. The assessments made by this program are accurate, these results derived comparing the reliability by Monte Carlo simulation, or directly through DEF.

ACTA TECHNICA CORVINIENSIS – Bulletin of Engineering
2013. Fascicule 2 [April–June] 124
System MONTE CARLO 10000 simulations DEF
VS Rsis = 0.849132 Rsis = 0.85084
4. The Monte Carlo method remains one of the successful methods in various energy analysis.
REFERENCES [1.] Felea, I. - Ingineria fiabilităţii în
electroenergetică, Editura Didactică şi Pedagogică, Bucureşti, 1996
[2.] Dziţac, S. – Fiabilitatea şi disponibilitatea sistemelor de distribuţie a energiei electrice, Editura Universităţii din Oradea, ISBN: 978-973 -759 -754 - 0, 2009
[3.] Dziţac Simona, Vesselenyi T., Dziţac I., Văleanu E., - Electrical power station reliabilitymodelling procedure using the Monte Carlo method, The 4 th International Federationof Automatic Control Conference on Management and Control of Production and Logistics - IFAC MCPL, 27-30 septembre, 2007, Sibiu, România, vol III, pp. 695- 700, ISBN: 978-973-739-481-1, Papers published by Elsevier (Pergamon)
[4.] Hora, C. – Fiabilitatea echipamentelor din centralele hidrolectrice, Editura Universităţii din Oradea, 2007
[5.] Hora, C., Vereş, M. - Contributions regarding the predictive reliability analysis of the hydro mechanical equipments from hydro power plants, The 6th International Conference on Electromechanical and Power Systems, SIELMEN 2007, 4-6 octombrie, Chişinău
[6.] Hora C., Dziţac S., Dumitrescu D., Hora H. - Reliability analysis of cut-off plate (vir) from HPP Tileagd using Monte Carlo simulation Journal of Sustainable Energy, vol. II, No. 1, March, 2011, pg. 21-25, ISSN 2067-5534
[7.] Hora C., Dziţac S., Dumitrescu D., Hora H., Reliability analysis of hydro - generator groups using Monte Carlo simulation Annals of the Oradea University, Fascicle of Management and Technological Engineering, volume X(XX), 2011, nr. 2, pg. 24-29, ISSN 1583-0691
ACTA TECHNICA CORVINIENSIS – BULLETIN of ENGINEERING
ISSN: 2067-3809 [CD-Rom, online]
copyright © UNIVERSITY POLITEHNICA TIMISOARA, FACULTY OF ENGINEERING HUNEDOARA,
5, REVOLUTIEI, 331128, HUNEDOARA, ROMANIA http://acta.fih.upt.ro

© copyright FACULTY of ENGINEERING ‐ HUNEDOARA, ROMANIA 125
1. József CSANÁDI, 2. Cecilia HODÚR, 3. József FENYVESSY
THE PROBLEM OF THE DETERMINATION OF WATER AND COW MILK ADULTERATING GOAT MILK
1,3. DEPARTMENT OF UNIT OPERATIONS AND ENVIRONMENTAL TECHNIQUES, FACULTY OF ENGINEERING, UNIVERSITY OF SZEGED, 6725 SZEGED, MARS TÉR 7, HUNGARY
2. DEPARTMENT OF FOOD ENGINEERING, FACULTY OF ENGINEERING, UNIVERSITY OF SZEGED, 6725 SZEGED, MARS TÉR 7, HUNGARY
ABSTRACT: The demonstrability of the adulteration of goat milk with added water and cow milk was investigated by measurement of the freezing point of the milk. Milk samples collected from a Saanen goat flock were mixed with water in the ranges 0-90% and 1-10% and with cow milk in the ranges 0-90%. The freezing points of the samples were determined by a standard cryoscopic method. Our results suggested that the freezing point prescribed as a reference value by the Codex Alimentarius Hungaricus and the EU directives for fresh and unadulterated goat milk (-0.52 °C) is too liberal, and this opens the door for the adulteration of goat milk. Only extraneous water in excess of 6% could be detected reliably in goat milk and therefore the measured freezing points at lower extraneous water contents appear falsely as good results. Accordingly, revision of the reference freezing point value of goat milk seems reasonable. Similarly, demonstrated that the adulteration of goat milk with cow milk can not be proved by measurement of the freezing point unless the goat milk contains cow milk in excess of 50%. KEYWORDS: Goat milk, freezing point, adulteration
INTRODUCTION During the past ten years has been a perceptible change in the outlook of goat breeding worldwide. The goat sector seems to be waking up from a century-long dream and to be showing the signs of a slow development. Increasing attention is being paid to the production of milk and meat products from goat. Goat milk contains nutrients with high physiological value and goat milk as a drink has advantages over cow milk in many ways. Goat milk is the most digestible milk for humans, it has a full set of amino acids and it is especially healthy in consequence of properties according to most references. It is most important therefore that available goat milk should not be adulterated. In Hungary, section 2-51-180 of the Codex Alimentarius Hungaricus relates to the quality standard of raw goat milk. Adulteration (with water) is investigated via measurement of the freezing point of the milk. The Codex gives -0.52°C as the reference freezing point for both goat milk and cow milk. However, in many references the average freezing point of goat milk is given as markedly lower (more negative) than this by Princivalle (1948) -0.582°C; Szíjártó and van De Voort (1983) -0.5527°C; Sanchez et al. (2005) -0.564°C; El-Gadir et al. (2005) -0.561°C; Whitney (2006) -0.553°C; and Mayer et al. (1995) -0.548°C. The range of freezing point was reported by James (1976) to be between -0.550°C and -0.578°C; by
Haenlein (2001) to be between -0.53°C and -0.55°C; by Kukovics et al. (2004) to be between -0.542°C and -0.565°C; by Sanchez et al. (2005) to be between -0.545°C and -0.657°C; by Rattray and Jelen (1996) to be between -0.553°C and -0.574°C; by Juarez and Ramos (1986) to be between -0.540°C and -0.573°C. I contrast, Barbano (2006) concluded that the freezing point of goat milk is the same as that of cow milk (- 0.519°C). Some authors draw attention to the importance of the circumstances of the milking, the sampling and the measurement in the interest of achieving the correct result. A common mistake in the cleaning of the milking machines is the retention of a small quantity of rinsing water. Some water will be present in the milk samples if the milking machine or/and the holding tank was not properly dried after cleaning and sterilization. Other circumstances of the measurement that affect the results are added preservatives (Sanchez et. al. 2005), the temperature of the sample and the settings of the cryoscope. Our aim in the present work was to investigate the demonstrability of extraneous water in goat milk considering the current official reference freezing point. We also investigated whether the addition of cow milk, as the most obvious method for the adulteration of goat milk, is demonstrable. Our investigation of fresh goat milk samples furnished information especially about the freezing point of milk from Saanen goats.

ACTA TECHNICA CORVINIENSIS – Bulletin of Engineering
2013. Fascicule 2 [April–June] 126
METHODS. Milk samples The samples for the investigation were collected from the goat farm of the “MKF Company’s (Szarvas, Hungary). One litre bulk milk samples were made by mixing the morning and the evening milk from 20 Saanen goats registered in the National Registration System and stored at 5°C until the measurement. The goats were milked by hand in milking boxes during feeding. Samples were collected in 10 occasions in the period from February until the end of April. Cow milk samples for investigations of the mixing of cow milk with goat milk were also collected also from the farm of the MKF Company. The bulk milk samples were collected from regularly milked Holstein Friesian cows, and stored similarly to the goat milk samples. Freezing point determination 88 goat milk samples were mixed with water, and 44 goat milk samples were mixed with cow milk in duplicate for determination of the freezing points. The freezing point measurements and the making of the calibration solutions were carried out by the IDF method as detailed in the 2nd Appendix of Section 3-1-91/180 of the Codex Alimentarius Hungaricus. The instrument was calibrated with NaCl solutions with freezing points of -0.408°C and -0.600°C. Original cells supplied by the producers of the Cryoscope I (Gerber-Funke GMBH) were used in the measurements. The cells were first cleaned then rinsed with distilled water, dried at 105°C and cooled in a desiccator over anhydrous silica gel before use. 2.5 ml samples were added to the cells with a BIOHIT Proline automatic pipette. The measurements were carried out on the basis of the current reference freezing point (-0.52°C) and also on the basis of the mean freezing point that were determined (-0.56°C) similar to that reported by Szíjártó and Van de Voort (1983). The compositions of the original milk samples were determined with a Bentley B150 Infrared Instrument (Bently Instruments, Inc. Chaska, Minnesota 55318, USA). MS Excel was used to evaluate the results and to draw the diagrams. Instrument settings Measuring method: Plateau Temperature of cooling liquid: -6.5°C Cooling back temperature: 2.0°C Frequency of agitator: 91.5 Hz Amplitude of agitator: 42% Stirred beat: 46 RESULTS AND DISCUSSION The mean composition of Saanen goat milk samples was close to that of cow milk (3.12% protein; 3.40% fat; 4.39% lactose; 12.07% total solid). We did not observe any indicative of mastitis, and the low fat content of the goat milk samples was therefore somewhat unusual. The lactose content in the goat milk samples was lower than that in the cow milk confiring published results of Posati and Orr (1976); Jennes (1980); Fenyvessy and Csanádi (1999); and Park and Haenlein (2006) but in contrast with those of Irvine (1974) and Balatoni and Ketting (1981).
Evaluation of freezing points of goat milk samples The values of the freezing points of the collected cow milk samples varied between -0.5247°C and -0.5317°C with a mean of -0.5285°C (SD = 0.0029; CV% = 0.548). These data correspond to those in recent references: Boor et al. (1998) -0.517°C; IDF BS3095 (1988) -0.5233°C, ADAS (1999) -0.517°C (range: -0.486 - -0.532°C); Slaghuis and Klungel (2008) -0.530°C (range: -0.463 - -0.584°C); Unger (2001) range: -0.510 - -0.53°C; Henno et al. (2008) range: -0.527 - -0.5249°C. The freezing points of the goat milk samples varied from -0.5526°C to -0.5825°C, with a mean of -0.5616°C (SD = 0.101, CV% = 1.798). These data correspond to those in publications which reported a lower freezing point of goat milk as compared with the freezing point of cow milk. Adulteration of goat milk with cow milk In our preliminary research we found that the freezing point of goat milk changes to an appreciable extent only when is added in a considerable quantity; we therefore report now only results on samples to which cow milk was added 10% steps up to 90%.
010
2030
405060
7080
90100
-0.570 -0.560 -0.550 -0.540 -0.530
Freezing point (°C)
Qua
ntit
y of
co
w m
ilk a
dde
d to
go
at m
ilk (
%)
Figure 1. Influence of added cow milk
on the freezing point of goat milk
As we expected, we observed a close linear correlation (R2=0.997) between the quantity of cow milk added and the change in the freezing point (Figure 1). The freezing point of the milk increased in parallel with the increase of the amount of added cow milk. If the average freezing point value cited in the literature (-0.56°C) as the basic freezing point of the unadulterated goat milk was used as a reference value, the adulteration with cow milk could demonstrate only in the samples that contained more than 17-18% cow milk. Thus, we proved that only very large-scale adulteration with cow milk is demonstrable with this method, but even then only if we have a correct reference freezing point. Accordingly, other methods were devised for the demonstration of the adulteration of goat milk with cow milk, based on determination of the protein fractions in the milk.

ACTA TECHNICA CORVINIENSIS – Bulletin of Engineering
2013. Fascicule 2 [April–June] 127
Adulteration of goat milk with water Inasmuch as the freezing point of water is markedly higher than that of goat milk, the addition of water in 10% steps up to 90% gave freezing points which unequivocally indicated the added water in the goat milk. As expected, the freezing point of goat milk was to a noteworthy extent by the added water, and the current reference value (-0.52°C) was exceeded even when only 10% of water was added. The close linear correlation between the freezing point and the quantity of added water (Fig. 2.) indicated a 0.01°C increase in freezing point for every 1.78% of water added to the goat milk. Alternatively, every 1.0% of added water increases the freezing point of goat milk by 0.0047°C.
R 2 = 0.9985
0
10
20
30
40
50
60
70
80
90
100
-0.600 -0.500 -0.400 -0.300 -0.200 -0.100 0.000
Freezing point (°C)
Adde
d w
ater
(%
)
Figure 2. Effect of adulteration with water on
freezing point of goat milk
Our data closely resemble those reported by Balatoni (1978) and Advanced Instruments (1995): every 0.01°C freezing point increase corresponds to 1.82-1.90% added water, i.e. each 1.0% of added water increases the freezing point by 0.005°C.
R 2 = 0.9973
0
2
4
6
8
10
12
-0.560 -0.550 -0.540 -0.530 -0.520 -0.510 -0.500 -0.490Freezing point (%)
Extr
ane
ous
wat
er (
%)
Figure 3. The effect of added water on the freezing point of goat milk (Range of the added water: 0-10%)
Collected data differ a little from those of Unger (2001), who suggested that a 0.01% freezing point increase corresponds to 2.0% added water in the milk. Such a wide range of adulteration is not probable in practice and we therefore repeated the investigations within the range 0.0-10.0%. These results are demonstrated in Figure 3. A close linear correlation was again found between the level of adulteration and the freezing point of the milk samples containing these lower quantities of water. According to expectations, the regression coefficient was slightly better than in the previous experiment and 1.71% of added water was found to change the freezing point by 0.01°C in this experiment. It should be noted that the samples containing less than 6.0% of would have been classified as “unadulterated” if the current reference value (-0.52°C) had been used. There were differences between our and the literature data as concerns the changes in freezing point caused by addition of fixed quantities of water. The results reported by Balatoni (1976), Advanced Instruments (1995) and Unger (2001) refer to cow milk, but the good level of accordance indicates that the increase in the freezing point of goat milk in consequence of the addition of is similar to that for cow milk. Insofar as the adulteration of goat milk with water is demonstrable by measurement of the freezing point, the question arises as to how the correctness of the reference value affects the conclusion concerning the quantity of water added to the goat milk. Dependence of accuracy on the reference value When the current reference value was used, we found that the determination of the extent of adulteration was correct only if the goat milk contained more than 40% of added water (Table 1) The imprecision of the results in the low ranges did not allow determination of the real quantity of added water.
Table 1. Accuracy of determination of water added to goat milk (n: 5; reference value: -0.52°C) Quantity of added water
(%)
Mean of measured
values SD CV (%)
0 0.00 0.00 0.00 10 6.04 1.13 18.64 20 17.82 1.05 5.88 30 28.64 0.91 3.17 40 39.37 0.76 1.94 50 49.69 0.67 1.35 60 59.72 0.56 0.93 70 69.53 0.55 0.79 80 79.13 0.81 1.03 90 88.3 0.90 1.02
A high quantity of added water in goat milk can easily be demonstrated by other means (sensory analysis, composition, density, or Ld°), and we therefore investigated adulteration with smaller quantities of added water.

ACTA TECHNICA CORVINIENSIS – Bulletin of Engineering
2013. Fascicule 2 [April–June] 128
The results proved that, when the current reference value is used, determine of the degree of adulteration with less than 7.0% added water is impossible (Figure 4). We found an imprecision of ~ 6-7% relative to data when the correct freezing point was used. Since the classification requirements do not prescribe other examinations for the determination of such adulteration, the criterion “corresponds to the natural composition” is not sufficient for verification of the lack of adulteration.
0
1
2
3
4
5
6
0 2 4 6 8 10Real quantity of added water (%)
Mea
sure
d ad
ded
wat
er (
%)
Figure 4. Relationship between real
and measured quantities of added water in goat milk (Reference value: -0.52°C)
As the quantities of the milk components decrease in a similar ratio (%) as the added quantity of water increased, possible changes in composition of these components do not prove adulteration. For instance, 10% added water decreases the fat content from 4.0% only to ~3.6%. Thus the current reference value can not be regarded as trustworthy, and this gives a possibility for adulteration even 6-7% water without the danger of detection.
y = 1.0059x + 0.0157
R 2 = 0.9987
0
2
4
6
8
10
12
0 2 4 6 8 10Real quantity of added water (%)
Mea
sure
d ad
ded
wat
er (
%)
Figure 5. Relationship between real
and measured quantities of added water (Reference value: -0.56°C)
We presumed that precise demonstration of the level of adulteration would become possible only trough use of a well-chosen reference value. Accordingly, we repeated the examinations, but with the mean freezing point of the original goat milk samples as reference value. These experiments led to very auspicious results (Figure 5). The mean of the differences of the measured values from the real quantities of water added was 0.049%, while the range of the difference was 0.0-0.25%; this imprecision is negligible. The results prove that real quantity of water added to goat milk can be determined with good accuracy by using a well-chosen reference value. It is important, that at the moment we can not specify a precise and correct reference value relating to the freezing point of Hungarian or European goat milk. However, the results to date clearly show that the current reference value is not sufficiently precise for quality control and particularly not for the improvement of the quality of goat milk. CONCLUSIONS Presented results demonstrate that the current reference value gives a possibility for the adulteration of goat milk in marked amount of water (up to 7%). This does not facilitate efforts to improve the quality of goat milk. The mean freezing point that we found, -0.561°C, corresponds with the published data. We confirmed the effect of the adulteration on the freezing point for goat milk samples mixed with either cow milk or water. As there was a close linear correlation between the extent of adulteration and the freezing point of milk. On the basis of our preliminary and present results and keeping the principle of graduation, we suggest a reference freezing point of -0.545°C for determination of the adulteration of goat milk. It is not possible to demonstrate the adulteration of goat milk with cow milk in any range by using the current reference value. When the instrument was adjusted to the measured mean freezing point of goat milk, only more than 16% cow milk was demonstrable. Hence, other well known methods must be used for this purpose. The selection of a correct freezing point reference value is very important in the determination of the adulteration of goat milk because an incorrect reference can lead to marked differences from the true determination of the quantity of added water. When the EU-recommended reference value is used, only more than ~ 6% added water is demonstrable in goat milk. Accordingly, there is a current need for the determination of the correct reference value of the freezing point of goat milk, which may even vary from member country to member country. This will demand a huge numbers of investigations. REFERENCES [1.] Advanced Instruments, 1995. Brochure: Added water
and the freezing point of milk. [2.] Anonymous, 1992. Council directive 92/46/EEC of 16
July 1992, Laying down the health rules for the

ACTA TECHNICA CORVINIENSIS – Bulletin of Engineering
2013. Fascicule 2 [April–June] 129
production and placing on the market of raw milk, heat-treated milk and milk based products.
[3.] Balatoni M., 1976. Tejipari táblázatok. Mezőgazdasági Kiadó Budapest ISBN: 963 230 335 (Dairy tables, Agricultural Publishing Budapest)
[4.] Balatoni M, Ketting F., 1981. Tejipari kézikönyv. Mezőgazdasági Kiadó, (Dairy Handbook, Agricultural Publishing Hungary)
[5.] Barbano C. A., 2006. DPC2: Animal Products (Dairy) Approved Criteria for Farm Dairies New Zeeland Food Safety Authority, http://www.nzfsa.govt.nz/dairy/publications/approved-criteria/dpc2approvedcriteriaforfarmdairies_1.pdf
[6.] Boor K. J., Brown D. P., Murphy S. C., Kozlowski S. M., Bandler D. K., 1998. Microbiological and Chemical Quality of Raw Milk in New York State. J. Dairy Sci. 81, (6) 1743-1748.
[7.] Codex Alimentarius Hungaricus 2-51. 1.4.3. Nyers kecsketej. Fizikai és kémiai követelmények. 15. (Raw Goat Milk, Physical and chemical requirements 15.)
[8.] El-Gadir, M. E. A., El-Zubeir, I. E. M., 2005. Production performance of crossbred (Saanen and Nubian) goats in the second kidding under Sudan conditions Pakistan Journal of Biological Sciences, 8, (5) 734-739.
[9.] Fenyvessy J., Csanádi J., 1999. Nutritional evaluation of components of small ruminants (ewe’s, goat) milk. Hungarian Dairy Journal – Science and Practice. 59, (2) 23-27.
[10.] Haenlein G.F.W. (2001): The concept of milk quality in the USA. Int. J. Anim. Sci. 16, 5–8.
[11.] Henno M., Ots M., Jõudu I., Kaart T. Kärt O., 2008. Factors affecting the freezing point stability of milk from individual cows. Int. Dairy J. 18, (2), 210-215.
[12.] IDF BS3095; Part 2:1988. Recommendations for the Interpretation of the Freezing Point
[13.] Irvine M. D., 1974. The composition of milk as its effect the yield of cheese. Proceeding of 11th Annual Marshall Invitational Cheese Seminar, Marshall Div. Miles Lab. Madison WI., USA in: Park and Haenlein, Handbook of milks and non-bovine mammals. Blackwell Publishing 2006.
[14.] James, G. V., 1976. A note on the freezing point of goat milk. J. Assoc. Publ. Anal. 14, (3) 111-115.
[15.] Jennes R., 1980. Composition and characteristics of goat milk. Review. J. Dairy Sci. 63. 1968-1979.
[16.] Juàrez, M. and Ramos, M., 1986. Physico-chemical characteristics of goat milk as distinct from those of cow milk. In: Proceedings of the IDF Seminar in Production and Utilization of Ewe's and Goat's Milk, Bulletin No. 202 Athens, Greece (1986), 54–67.
[17.] Kukovics, S., Ábrahám, M., Németh, T., 2004. Hygienic characteristics and classification of Hungarian sheep and goat milk. Tejgazdaság, (Hungarian Dairy Journal – Science and Practice) 64, (2) 35-40.
[18.] Mayer H. K., Schober D., Ulberth F., Kneifel W., 1995. Physico-chemical characteristics of goat milk in Austria – seasonal variations and differences between breeds. Production and Utilization of Ewe and Goat Milk IDF and CIRVAL Conference in Crete (Greece) 19-21. October 1995. Proceeding of the IDF/CIRVAl Seminar, 278.
[19.] Park Y. W., Haenlein G. F. W., 2006. Handbook of milks and non-bovine mammals. Blackwell Publishing 2006.
[20.] Posati L. P., Orr M. L., 1976. Composition of Foods. Agric Handbook No. 8-1. ARS USDA, Washington, DC.
[21.] Princivalle, E., 1948. Richerche sul latte di capra. Nota I. Ann. Chim. Appl. Roma 8: (10/11) 617.
[22.] Rattray W., Jelen P., 1996. Freezing Point and Sensory Quality of Skim Milk as Affected by Addition of Ultrafiltration Permeates for Protein Standardization. Int. Dairy J. 6, (6) 569-579.
[23.] Sanchez A., Sierra D.; Luengo C.; Corrales J. C.; Morales C. T.; Contreras A.; Gonzalo C., 2005. Influence of storage and preservation on fossomatic cell count and composition of goat milk. J. Dairy Sci. 88, (9) 3095-3100.
[24.] Slaghuis B. A., Klungel G.H., 2008. Variation of freezing point of cows’ milk free from extraneous water during lactation Research Station for Cattle, Sheep and Horse Husbandry, PO Box 2176, 8203 AD Lelystad, NL. http://bsas.org.uk/downloads/milkcomp/28.pdf (23.01.2008.)
[25.] Szijarto, van de Voort, 1983. Determination of added water and bovine milk to caprine milk. J. Dairy Sci. 66, (3). 620-623.
[26.] Unger A., 2001. A fagyáspont. In: Szakály S., Tejgazdaságtan, Mezőgazda Kiadó Budapest 2001. (Dairy, Agricultural Publishing Budapest) ISBN: 963 657 3333 6
[27.] Zee, B., Drogt, J., Giessen, T.J.J., 1982. The freezing point of authentic farm tank milk in Netherlands. Netherlands Milk and Dairy Journal 36, 291–303.
[28.] Whitney H., 2006. Raw Milk Quality Testing Animal Production Factsheet Publication: AP017. Government of Newfoundland and Labrador, Department of Natural Resources.
ACTA TECHNICA CORVINIENSIS – BULLETIN of ENGINEERING
ISSN: 2067-3809 [CD-Rom, online]
copyright © UNIVERSITY POLITEHNICA TIMISOARA, FACULTY OF ENGINEERING HUNEDOARA,
5, REVOLUTIEI, 331128, HUNEDOARA, ROMANIA http://acta.fih.upt.ro

ACTA TECHNICA CORVINIENSIS – Bulletin of Engineering
© copyright FACULTY of ENGINEERING ‐ HUNEDOARA, ROMANIA
ACTA TECHNICA CORVINIENSIS – BULLETIN of ENGINEERING
ISSN: 2067-3809 [CD-Rom, online]
copyright © UNIVERSITY POLITEHNICA TIMISOARA, FACULTY OF ENGINEERING HUNEDOARA,
5, REVOLUTIEI, 331128, HUNEDOARA, ROMANIA http://acta.fih.upt.ro
ACTA TECHNICA CORVINIENSIS – BULLETIN of ENGINEERING
ISSN: 2067-3809 [CD-Rom, online]
copyright © UNIVERSITY POLITEHNICA TIMISOARA, FACULTY OF ENGINEERING HUNEDOARA,
5, REVOLUTIEI, 331128, HUNEDOARA, ROMANIA http://acta.fih.upt.ro

© copyright FACULTY of ENGINEERING ‐ HUNEDOARA, ROMANIA 131
1. Mohammed Ali I. AL-HASHIMI, 2. Manar M. AL-SAFAR
REMOVAL OF CADMIUM FROM SYNTHETIC WATER BY USING AGRICULTURAL WASTES
1-2. ENVIRONMENTAL & SANITARY ENGINEERING BRANCH, UNIVERSITY OF TECHNOLOGY, BUILDING & CONSTRUCTION ENGINEERING DEPARTMENT, BAGHDAD, IRAQ
ABSTRACT: Heavy metals are among the most toxic contaminants of surface water. The main sources of toxic metals are industrial wastes from processes such as electroplating, metal finishing, chemical manufacturing, and nuclear fuel processing. Since most of heavy metals are non degradable into nontoxic metals end products, these concentration must be reduced to acceptable levels before discharged them into environment. The goal of this research Examine the ability of different media to reduce the concentration of cadmium ions in aqueous solution. The application of low-cost adsorbents obtained from plant wastes as a replacement for costly conventional methods of removing cadmium ions from waste water has been reviewed. Langmuir and Freundlich adsorption isotherms were applicable to the absorption process and their constants were evaluated. The single component adsorption of heavy metal ions named Cadmium (II) onto powdered activated carbon (PAC), karab, rice husks and corncobs from water aqueous solution has been investigated in batch. The multiple correlations simulated the experimental data of the batch tests, and regression equations were found for (PAC), karab, rice husks and corncobs with correlation coefficient for each media: 0.984, 0.946, 0.951, 0.932, respectively. In batch tests the effects of pH of solution, dosage adsorbent, contact time, initial concentration, mixing (stirring) speed and particle size diameter were studied. The optimum values of pH of solution was 5.5, for dosage adsorbent was 1g sorbent/100ml of Cd(II), for contact time was 30min, for initial concentration was 125 mg/L and for mixing (stirring) speed was 100 rpm. In continuous fixed bed tests, the effects of flow rate, and bed height of Cd (II) uptake onto rice husks studied. Different flow rates were used (1,3,5,7) L/hr. Different bed height (10, 20 and 30) cm was used. The removal of Cd (II) increased as the bed height increased and decreased as the flow increased. KEYWORDS: Cadmium, Adsorption, Isotherm
INTRODUCTION Cadmium is highly toxic non-essential metal which accumulates in the kidneys of mammals and can cause kidney dysfunction [Alloway and Ayres, 1997]. Cadmium may interfere with the metallothionein's ability to regulate zinc and copper concentrations in the body. Epidemiological studies have revealed that Cd2+ may contribute to some forms of cancer in humans and low exposures may result in kidney damage [Terry and Stone, 2002]. Cadmium is widely distributed in the environment of Iraq as a result of the use of galvanizing, pigments, stabilizers, thermoplastics, batteries and alloys. Moreover, the absence of the direct control from environmental protection agencies on above industries has increased the size of this problem. Cadmium is responsible for serious damage to the health of humans: � The most severe from Cd (II) toxicity in humans is
"itai- itai", a disease characterized by excruciating pain in the bone [Sulaymon, et al., 2010].
� The harmful effects of cadmium include a number of acute and chronic disorders, such as renal damage, emphysema, hypertension, and testicular etrophy [Tilaki, et al., 2004].
� Cadmium toxicity contributes to a large number of health conditions, including the major killer diseases such as heart disease, cancer and diabetes. Cadmium concentrates in the kidney, liver and various other organs and is considered more toxic than either lead or mercury. It is toxic at levels one tenth that of lead, mercury, aluminum, or nickel [Sayed, et al., 2010].
The term “biosorption” is used to describe metabolism independent binding of heavy metals and/or radionuclides to nonliving adsorbents. The discovery and development of biosorption phenomena provide a basis for a whole new technology aimed at removal of heavy metallic species from dilute solutions in the range of 1 to 100 mg/L [Chong and Volesky, 1995]. There are various methods to treat the metal contaminated effluent such as precipitation, reverse osmosis, ion exchange, coagulation, and adsorption. But the selection of the treatment methods differ with respect to costs, complexity and efficiency. Among these technologies adsorption is a user-friendly technique for the removal of heavy metal. This process-seems to be most versatile and effective method for removal of heavy metal if combined with

ACTA TECHNICA CORVINIENSIS – Bulletin of Engineering
2013. Fascicule 2 [April–June] 132
appropriate regeneration steps [Said, 2010]. The biosorption equilibrium and kinetic data are fitted using different models and process parameters were evaluated [Sayed, et al., 2010]. The term biosorption commonly refers to the passive binding of metal ions or radioactive elements by dead adsorbents. It has to be distinguished from bio-accumulation which is usually understood to be an active, metabolically mediated metal-accumulation process occurring specifically in living organisms [Volesky and Naja, 2005]. In the experimental works, the dissolved Cd (II) in aqueous solutions has been selected as the sorbate. The single component adsorption of heavy metal ions named Cadmium (II) onto powdered activated carbon (PAC), karab, rice husks and corncobs from water aqueous solution has been investigated in batch tests. The Langmuir model can be represented as:
( )f
fmaxe bC1
bCqq
+= (1)
This classical model incorporates two easily interpretable constants: qmax, which corresponds to the maximum achievable uptake by a system; and b, which is related to the affinity between the sorbate and sorbent. The Langmuir constant “qmax” is often used to compare the performance of biosorbents; while the other constant “b” characterizes the initial slope of the isotherm. Thus, for a good biosorbent, a high qmax and a steep initial isotherm slope (i.e., high b) are generally desirable [Aksu, et al., 2002]. The Freundlich (Freundlich, 1926) model has been widely used for many years. The Freundlich equation has the general form:
n/1efe CKq = (2)
where Kf and n are constants and n>1. The Freundlich equation is basically empirical, but is often useful as a means for data desorption [Graaham, 1959]. (Metcalf and Eddy, 2003), define Freundlich isotherm as follows:-
n/1efe CKq
mx
== (3)
where x/m = mass of adsorbate adsorbed per unit mass of adsorbent after equilibrium, mg adsorbate/g activated carbon Kf = Freundlich capacity factor, (mg absorbate/g activated carbon) * (L water/mg adsorbate) 1/n 1/n = Freundlich intensity parameter. Other terms are defined previously. The constants in the Freundlich isotherm can be determined by plotting log (x/m) versus log Ce and making use of the linearized form of equation (2) rewritten as:
ef CnKmx log/1loglog +=⎟⎠⎞
⎜⎝⎛ (4)
A breakthrough curve represents the effluent concentration history (i.e. effluent concentration versus time) along the course of the adsorption concentration operation. The height of MTZ varies with the flow rate. The removal efficiency is influenced by various factors such as temperature of
solution, pH of solution, sorbent dosage, mixing (stirring) speed, contact time, particle size of the sorbent and initial metal ion concentration. Sayed, et al. (2010) found the effect of pH change in the range 1 to 8 on the adsorption of Ni (II) and Cd (II) on rice straw. The removal of Ni (II) was about 28% at a pH 1 and its reached maximum value 47% at about pH 5. Further increase of pH leads to slight decrease in Ni (II) removal efficiency. The removal percentage of Cd (II) showed a rapid increase from 25% to 76% when the pH increased from 1 to 6. Mapolelo and Torto (2004) proved that the biosorption capacity of Cd2+, Cr3+, Cr6+, Cu2+, Pb2+ and Zn2+ is dependent on pH. For all metal ions they studied, the optimal pH values are all greater than 5. The optimal pH for Cd and Pb biosorption is 5.8, while for Cr (III) and Pb is 5.2. As the pH further increases, the biosorption capacity subsequently decreases. The objective of this research was to investigate the optimum conditions of cadmium adsorption. MATERIALS AND METHODS Powdered activated carbon (supplied by BDH chemicals Ltd Poole England, charcoal animal) is used as an adsorbent in the present work. For the rice husks the chemical composition predominantly contains cellulose (32-47%), hemicellulose (19-27%) and lignin (5-24%) [Sayed et al., 2010]. While, the palm Karab was collected from Baghdad, Khastawi type. Corncobs are available in Iraq and it is in hand in winter. In this study the argue-wasted product has been identified for sorbent for removal of heavy metal ions in aqueous solutions. Preparation of the adsorbent The adsorbent was collected from Baghdad. Then sun dried and washed with tap water then rinsed with distilled deionized water several times and thereafter dried temperature of 105oC in an oven for 24 hours. Following cut the adsorbent into small pieces by using a housing food processor and through a sieve No.40 (ASTM E 11). This was done to remove any large particles and to obtain particles of size less than (0.425 mm). This fine adsorbent was used in the batch experiments described below. For preservation, it was kept in plastic bags to minimize its contact with humidity. Preparation the synthetic polluted water sample 1000 mg/L standard stock solution of Cd (II) was prepared from Cd(NO3)2.4H2O. The required amount of metal salt was dissolved into 1L of distilled water and stir. Determination of metal ion concentration All experiments after filtration, the synthetic polluted aqueous solution and the samples resulted from each treatment were analyzed for the concentration of Cd (II) by atomic absorption sepectro- photometer (AAS) for concentrations more than 0.1 ppm and the Inductively Coupled Plasma -Mass Spectrometry (ICP-MS) instrument for concentrations less than 0.1 ppm. Samples were read three times and the mean values were computed. Equipment The equipment used in this study are:

ACTA TECHNICA CORVINIENSIS – Bulletin of Engineering
2013. Fascicule 2 [April–June] 133
1. Housing grinder for grinding the agricultural wastes.
2. Oven for drying the agricultural wastes (model 05, cap 64L, made in England).
3. Glass wares (pipette, conical flasks, volumetric flasks, graduated cylinders and beakers).
4. Disposable Polyethylene bottles for samples. 5. Sieves No. 40, 14, 10, 8 (ASTM E11 Body 316L
MESH S-STEEL/ RF, made in Germany). 6. Calibrated pH meter of type (HANNA instrument,
pH 211 Microprocessor pH meter made in Portugal) is used with its standards solution (standards are of pH=4, and 7), to measure the pH of the samples.
7. Digital Balance 4 decimal degrees (Precisa xp 220A), made in Switzerland.
8. Qualitative filter paper, made in China. 9. Sedimentation Jar Test (Aztec Environmental
Control LTD, made in Germany. 10. Atomic absorption sepctro- photometer (GBC 933
plus, made in Australia. The optimum masses of activated carbon, rice husk, karab and corncobs which were 1, 1.5, 2, 2.5 g, respectively, and the optimum pH of solutions which was 5.5, were used for Cd(II) in these experiments. These experiments were used to obtain the equilibrium isotherm curves for single metal ions by plotting the mass of solute adsorbed per mass of adsorbent, qe, against the equilibrium concentration of the solution, Ce, and then to obtain the equilibrium isotherm parameters. A volume of 100 ml of metal ion solution in different initial concentration of 25-125 mg/L was placed in five beakers containing the fixed mass of the sorbent. The beakers were then shaken at a constant speed of 100 rpm in a Jar Test through a at temperature 25°C ± 1 for 30. After shaking, the sorbent was separated by filtration through a filter paper 0.425 mm. The filtrate was analyzed for the remaining metal ion concentration by atomic absorption spectrophotometer AAS. A small laboratory scale of fixed–beds absorber is constructed in Sanitary Engineering Laboratory/ Building & Construction Department / Technology University. A schematic representation of the experimental equipment is shown in Figure (1), where the flow direction is downward by gravity. The major equipment used in this setup are: 1. Two polyvinylchloride (PVC) tanks: one for inlet
and another for outlet, each of (30 liter) capacity. 2. Three glass columns of 3 cm internal diameter and
40 cm height, as shown in Figure (1). 3. Centrifugal pump (type, Marquees water pump,
model MKP 60/1) of PVC propeller and case and with capacity 40 L/min with 0.5 hp, used to pump the solution to the feed tank.
The experimental procedure carried out was as follows: � Preparing the metal ion solution with desired
concentration in the feed tank. � The adsorber column was filled with the rice husks
for the desired bed depth. � The solution was passed by gravity to the adsorber
column at the desired flow rate.
� Samples were taken at certain periods of time (15 min).
� The concentration of the metal ion in each sample was measured using AAS.
The media (rice husks) was packed in the column to the desired depth, and fed to the column as slurry by mixing the media with distilled water in order to avoid the formation of air bubbles inside the media. Then, solution was placed in the inlet container, and the outflow was adjusted by the valves number 1 and 2, as shown in Figure (1). Synthetic polluted water was prepared, and its pH was adjusted to the desired value and then placed in the inlet container to flow through the column by gravity. Samples were collected every 15min from the outlet, and its Cd+2 ion concentration was measured by Atomic Absorption Spectrophotometer.
Figure (1): Schematic representation
of the continuous flow system (column system) used in this study. (1) Drain valve; (2) Pump’s section
valve; (3) Sampling valve RESULTS AND DISCUSSION In batch experiments, the influence of the dosage adsorbent, pH of solution, stirring speed and initial metal ion concentration on the removal of Cd(II), from solution by adsorption onto powder activated carbon, rice husks, karab and corncobs as an adsorbent was studied. Effect of pH solution The removal of metal ions from aqueous solution by adsorption is related to the pH of solution. The first set of tests, therefore, examines the effect of pH on the effluent concentration. The low biosorption capacity at pH values below 4.0 was attributed to hydrogen ions that compete with metal ions on the sorption sites. In other words, at lower pH, due to protonation of the binding sites resulting from a high concentration of protons, the negative charge intensity on the sites is reduced, resulting in the reduction or even inhibition of the binding of metal ions. Similar findings were reported by other researchers [Desi et al., 1998; Emani et al., 2003]. At high pH values, the removal takes place by adsorption as well as precipitation, due to formation

ACTA TECHNICA CORVINIENSIS – Bulletin of Engineering
2013. Fascicule 2 [April–June] 134
of metals hydroxide. This can be explained by the fact that, as the pH of the solution increased the OH- ions in the solution increase and form some complexes with metal ions and precipitate as metals hydroxide [Al-Najar, 2009].
Figure (2):- Effect of pH on Cd(II) uptake
for different materials
In general, it is noticed from the Figure (1) that the Cd(II) uptake of the three types of agro-adsorbents is very low at a pH of 2.0. Then, increasing the pH of the solution from 2 to 4 leads to a rapid increase in the Cd(II) uptake. The effect of dosage adsorbent The effect of dosage adsorbent on adsorption of Cd(II) at a constant adsorbate concentration was studied for the purpose of determining the optimum adsorbents dosage that will bring a best removal. First experiments (batch) started with a dose of 1 to 2.5 g of sorbent/100 ml cadmium solution of 50 ppm and a contact time of 30 min. Results of experiments are shown in Figure (3). The metal percent removal increases with a further increase in the quantity of adsorbent the corresponding increase in the observed uptake of Cd(II). Also, from Figure (3), the optimum sorbent amount required for efficient treatment can be well noticed. A crucial parameter for an optimal removal of metal ions in the wastewater.
Figure (3):- Effect of dosage adsorbent on Cd(II) uptake
for different materials
The effect of contact time The kinetics of metal removal by rice straw was relatively fast within 5 min and during the first hour was remarkably changed with time. The equilibrium time was taken as 30 min for further experimental measurements, the results are shown in Figure (4).
Figure (4):- Effect of contact time on Cd(II) uptake
for different materials The effect of initial concentration The effect of initial metal ion concentration on the breakthrough curves for each metal ion was investigated for all the systems. The change in initial metal ion concentration will have a significant effect on the breakthrough curves. Experiments were done at different initial concentrations of cadmium ion (25, 50, 75, 100 and 125 mg/L), and the other conditions were kept the same (pH=5.5, sorbent dosage=1g/100 ml, contact time= 30 min, stirring speed= 100 rpm, Vol. = 100 ml and particle size diameter= 0.425 mm) by rice husks, karab, corncobs and PAC.
Figure (5):- Effect of initial concentration on Cd(II) uptake
for different materials
Figure (5) shows a linear increasing relation between the adsorbents uptake and initial Cd(II) concentrations. The effect of stirring (mixing) speed The effect of stirring (mixing) the sorbent system on Cd(II) removal efficiency by different adsorbents was studied by varying the speed of mixing from 0 (with no-mixing as a control for comparison) to 200 rpm, while keeping the

ACTA TECHNICA CORVINIENSIS – Bulletin of Engineering
2013. Fascicule 2 [April–June] 135
dosage of sorbent, the contact time and optimum pH as constants. The Cd (II) uptake is increasing when the stirring speed is increasing from (0 to 100) rpm then remain constant for all adsorbents, as shown in Figure (6).
Figure (6):- Effect of stirring speed on Cd(II) uptake for
different materials Effect of adsorbent particle size One can notice from Figure (7) the effect of adsorbents particle size on Cd(II) uptake is negligible and cannot be recognized easily. From Figure (7), these differences are meaningless compared with other influential factors (pH, dosage adsorbent, contact time, initial concentration and stirring (mixing) speed).
Figure (7):- Effect of particle size diameter on Cd(II)
uptake for different materials EQUILIBRIUM ISOTHERM STUDIES Langmuir model In batch tests, Figures (8), (9), (10) and (11) reveal the plot of Cf/qe vs. Cf for rice husks, karab, corncobs and PAC, respectively. These Figures show a straight line which means that the equilibrium data is correlated well with Langmuir equations. The constants of Langmuir equation for each media were calculated from the slope and the intercept of the straight line and listed in Table (1).
Figure (8):- Plot of Cf/qe vs. Cf for determination
of Langmuir constants for rice husks.
Figure (9):- Plot of Cf/qe vs. Cf for determination
of Langmuir constants for karab.
Figure (10):- Plot of Cf/qe vs. Cf for determination
of Langmuir constants for corncobs.
Figure (11):- Plot of Cf/qe vs. Cf for determination
of Langmuir constants for PAC

ACTA TECHNICA CORVINIENSIS – Bulletin of Engineering
2013. Fascicule 2 [April–June] 136
Table (1):-Constant values of Langmuir equation and the equation for each media.
Media qmax b R2 Equation
PAC 3.4843 0.994 0.85 qe=3.4843*0.994Cf/ (1+0.994Cf)
Karab 37.037 3.448 0.626 qe=37.037*3.448Cf/ (1+3.448Cf)
Rice husks 24.39 0.0413 0.508 qe=24.39*0.0413Cf/
(1+0.0413Cf)
Corncobs 12.5 4.417 0.374 qe=12.5*0.4.417Cf/ (1+4.417Cf)
Freundlich model Figures (12), (13), (14) and (15) illustrate the plotting of Log qe vs. Log Cf for rice husks, karab, corncobs and PAC, respectively. These Figures show a straight line (Freundlich adsorption isotherm) which means that the equilibrium data is correlated well with Freundlich equation.
Figure (12):- Plot of Log qe vs. Log Cf for determination of
Freundlich constant for rice husks.
Figure (13):- Plot of Log qe vs. Log Cf for determination of
Freundlich constant for karab.
Figure (14):- Plot of Log qe vs. Log Cf for determination of
Freundlich constant for corncobs.
Figure (15):- Plot of Log qe vs. Log Cf for determination of
Freundlich constant for PAC. The constants for Freundlich equation were calculated from the slope and intercept of the straight line, as tabulated in Table (2).
Table (2):- Constant values of Freundlich equation and the equation for each media.
Media Kf 1/n R2 Equation PAC 0.18 1.087 0.927 qe=0.18Cf
1.087 Karab 0.202 1.285 0.946 qe=0.202Cf
1.285 Rice husks 1.3 0.748 0.92 qe=1.3Cf
0.748 Corncobs 0.144 1.307 0.9 qe=0.144Cf
1.307
Multiple correlation The degree of relationship existing between three or more variables is called a multiple correlation. A regression equation is an equation for estimating a dependent variable, say X1, from the independent variables X1, X2, X3, … and is called a regression equation of X1 on X2, X3, …. In functional notation, this sometimes is written briefly as X1 =F(X2, X3, …) read “X1 is a function of X2, X3, and so on” [Spiegel,1979]. In batch experiments, the removal efficiency of Cd(II) (sorption process) affected by many factors, therefore, it can be simulated with the regression equation by application the Excel program. The Cd(II) uptake capacity has an optimum value for each factor. The optimum value for each factor was found and put in the equation to find the correlation coefficient of it. The effect of particle size diameter can be neglected, because there was no optimum value for Cd(II) uptake capacity. Table (3) shows the relationships between the Cd(II) uptake capacity and their affected factors with determination coefficient of the equation for each media.
Table (3):- The best equation for Cd(II) uptake capacity and its correlation coefficient for each media
Media R2 Equation
PAC 0.984 58.02
25.05
22.14
92.03
05.316
xxxxx
10*7.1y -=
Karab 0.946 54.02
26.05
16.14
28.03
72.114
xxxxx
1024.2y -*=
Rice husks 0.951 72.02
29.05
07.14
27.03
16.114
xxxxx
1071.8y -*=
Corncobs 0.932 41.02
23.05
24.14
52.03
6.215
xxxxx
1059.1y -*=

ACTA TECHNICA CORVINIENSIS – Bulletin of Engineering
2013. Fascicule 2 [April–June] 137
Table (3):- The best equation for Cd(II) uptake capacity and its correlation coefficient for each media (continue)
Media y practical
(mgCd (II)/g) adsorbent
y theortical (mgCd (II)/g)
adsorbent
PAC 3.35 2.632 Karab 3.84 3.373
Rice husks 4.31 3.941 Corncobs 3.49 2.892
Where: y: Cd (II) uptake capacity (mg Cd(II)/g adsorbent), X1:pH, X2: dosage adsorbent (mg), X3: contact time (min), X4: initial concentration (mg/L), X5: stirring speed (rpm), ypractical: Cd (II) uptake capacity (mg Cd(II)/g adsorbent) calculated from batch tests and ytheoretical: Cd (II) uptake capacity (mg Cd(II)/g adsorbent) calculated from the equation by multiple correlation. Continuous tests In column tests, a series of experimental breakthrough curves were plotted for adsorption of a single component system. The experiments included studying the effect of flow rate (Q) and the effect of the height of the adsorbate bed (H). The effect of flow rate Four column experiments were carried out at different flow rates (influents) (1, 3, 5 and 7 L/h) and at constant initial conditions: pH 5.5, rice husks particle size (0.425-1.4 mm), bed height (20 cm) and initial cadmium concentration (100 ppm). Data of effluent concentrations (Cf) vs. time of these experiments were plotted in Figures (16) and (17). It is clear from these figures that as the flow rate increases, the time of breakthrough point decreases. This is because that the residence time of solute in the bed decreases as the flow rate increases and there is not enough time for adsorption equilibrium to be reached, which results in lower bed utilization, and the absorbent solution leaves the column before equilibrium.
Figure (16):- Breakthrough curves of Cd(II) sorption for
different flow rates
Figure (17) illustrates the effect of flow rate on the rate of uptake by plotting the accumulative Cd(II) uptakes (qac) vs. time of column operation. From this figure, it can be seen that the accumulative uptake, at a certain time, increases when the flow rate increases, because the increase in flow rate means
more loading of metal ions onto the rice husks particles surfaces and then quicker saturation of rice husks adsorbent. The rate of Cd(II) uptake is clearly shown in the slopes of the linear portions of the relations in this figure.
Figure (17):- Uptake curves for different flow rates
The effect of bed height Rice husks bed height effect was examined by carrying out three experiments at different heights (H = 10, 20 and 30 cm) of weights (W = 56, 84 and 121 g), respectively. Other initial conditions were kept constants, flow rate (Q = 3 L/h), pH 5.5, particle size (0.425-1.4 mm) and average cadmium ion concentration (Ci = 100 ppm). Figure (18) shown that the time required to reach the equilibrium state increases as the bed height increases. This can be attributed to the presence of more available sites of the removal in the media when increasing the bed height and, therefore, the time required reaching the equilibrium state increases.
Figure (18):- Breakthrough curves of Cd(II) biosorption for
different bed heights
Besides, the accumulative Cd(II) uptakes (qac) for the rice husks vs. time of column operation were plotted as in Figure (18). From this figure, it can be seen that the time to saturation increases when the rice husks height increases, because using extra amount of rice husks results in extra surfaces for sorption, long flow paths and more contact time between the cadmium solution and rice husks particles.

ACTA TECHNICA CORVINIENSIS – Bulletin of Engineering
2013. Fascicule 2 [April–June] 138
CONCLUSIONS Several sorption topics were studied and considered by this research and here below, the main conclusions that were obtained from batch tests and column tests: � For batch tests: 1. Rice husks, karab and corncobs are more effective
to remove cadmium from synthetic waste water than activated carbon used in batch system.
2. Rice husks> karab> corncobs> PAC. 3. Optimum conditions for Cd (II) uptake capacity
were pH of solution 5.5, for adsorbent dosage 1g adsorbent/100 ml of Cd (II), contact time 30min, initial concentration 125 mg/L and mixing (stirring) speed 100 rpm.
4. The Cd (II) uptake rate was not affected by particle size of adsorbents.
5. The equilibrium isotherm for the above systems is well represented by equations high correlation coefficient (0.927, 0.946, 0.92 and 0.9) for PAC, rice husks, karab and corncobs.
6. Rice husks can be used instead of activated carbon in wastewater treatment plant for the removal of Cd (II).
7. The multiple correlations simulated the experimental data in batch tests. The correlation coefficient for PAC, karab, rice husks and corncobs are: 0.984, 0.946, 0.951 and 0.932, respectively.
� For continuous tests: 1. The breakpoint was related to the flow rate and
the bed depth, i.e., the time required to reach breakpoint decreases with the increases of flow rate and decreases of bed depth.
2. The sorption results obtained from column tests are better than those of batch one for both effluent concentrations and uptake capacities. Besides, treatment by column is most practical.
REFERENCES [1.] Aksu, Z., Gönen, F. and Demircan, Z., (2002),
"Biosorption of chromium (VI) ions by Mowital (R)B30H resin immobilized activated sludge in a packed bed: comparison with granular activated carbon", Process Biochem, 8,pp.175–186.
[2.] Al- Ganabi, A.A.M , (1995) , "removal of pollutants from water by adsorption " , M.Sc Thesis University Of Baghdad
[3.] Alloway, B. J. and Ayres, D. C., (1997),"Chemical principals of environmental pollution", Second Edition, Blackie Academic and Professional, London
[4.] Al-Najar, J. A. A., (2009), “Removal of heavy metals by adsorption using activated carbon and kaolinite”, Ph.D. Thesis, University of Technology.
[5.] Chong, K., H., and Volesky, B., (1995), "Metal biosorption equilibria in a attractive alternative for metal removal and recovery", Env. Sci, 61, pp 379.
[6.] Desi, I., Nagymajtenyi, L. and Schulz, H. (1998),"Behavioural and neurotoxicological changes caused by cadmium treatment of rats during development". J. Appl. Toxicol., 18, pp. 63-70
[7.] Emani, P., Teresa, C. S., Maria, A. S., Oswaldo, K. and David, M. (2003), "Review heavy metal–induced oxidative stress in algae". Journal of Phycology, 39(6), pp. 1008-1011.
[8.] Graaham, D., (1959), Eng. Prog. Symposium Series, Vol. 55, No. 24, pp.17.(Cited in Ref. Al-Ganabi).
[9.] Metcalf & Eddy, Inc., (2003), “Wastewater engineering: treatment and reuse”, 4th Edition, Tata McGraw-Hill Publishing company limited, New Delhi.
[10.] Said, A. G., (2010), “Biosorption of Pb (II) ions from aqueous solutions onto rice husk and its ash”, Journal of American science, Vol.6 (10), pp.143-150.
[11.] Sayed, G. O., Dessouki, H. A., and Ibrahim, S.S., (2010), “Biosorption of Ni (II) and Cd (II) ions from aqueous solutions onto rice straw”, Chemical Science Journal, Vol., CSJ-9
[12.] Spiegel M. R., (1979), “Theory and problems of statistics in SI units”, 1st Edition, McGraw-Hill.
[13.] Sulaymon, H. A., Abdul-Hameed, H. M., (2010),"Competitive adsorption of cadmium lead and mercury ions onto activated carbon in batch adsorber", J. Int. Environmental Application & Science, 5 (4), pp. 491-513.
[14.] Terry, P. A. and Stone, W., (2002), "Biosorption of cadmium and copper contaminated water by scenedesmus abundans", Chemosphere, 47, pp.249–255.
[15.] Tilaki , R. A. D., Mahvi, A. H., Shariat, M., and Nasseri, S., (2004), “Study of cadmium removal from environmental water by biofilm covered granular activated carbon”, Iranian J. Pupl. Health, Vol. 33, No.4, pp. 43-52.
[16.] Volesky, B. and Naja, G., (2005), “Biosorption: Application Strategies”, www.biosorption.mcgill.ca.
ACTA TECHNICA CORVINIENSIS – BULLETIN of ENGINEERING
ISSN: 2067-3809 [CD-Rom, online]
copyright © UNIVERSITY POLITEHNICA TIMISOARA, FACULTY OF ENGINEERING HUNEDOARA,
5, REVOLUTIEI, 331128, HUNEDOARA, ROMANIA http://acta.fih.upt.ro

© copyright FACULTY of ENGINEERING ‐ HUNEDOARA, ROMANIA 139
1. H.LAIB, 2. H. KOURA, 3. A. CHAGHI
AN ADVANCED CONTROL APPROACH FOR MODULAR ACTIVE POWER FILTERING
1-3. LSPIE LABORATORY, ELECTRICAL ENGINEERING DEPARTMENT, BATNA UNIVERSITY, ALGERIA
ABSTRACT: In this paper, a new modular active power filtering approach is proposed to eliminate harmonic currents and compensate reactive power. The method for identifying reference currents is based on FMVs “multi-variable filter” .This method uses two (FMVs) having the advantage of extracting harmonic directly from the αβ axis, the first FMV (FMV Current) extracts the fundamental and individual harmonic component of the distorted line current signal and injects equal-but- opposite of each harmonic current into the line using a voltage source inverter VSI dedicated to that specific harmonic and the second FMV (FMV Voltage) estimates the fundamental component of the line voltage. Moreover the dc-side voltage is controlled by a fuzzy logic controller. The new approach has been illustrated in order to find the best way to reduce network harmonic currents and reactive power compensating of the connected load. All of the studies have been carried out through detail digital dynamic simulation using the MATLAB/Simulink Power System Toolbox. KEYWORDS: Modular active power filter, Fuzzy logic control, harmonics current compensation, multi-variable filter
INTRODUCTION In recent years, the usage of modern electronic equipment is increasing rapidly. These appliances inject harmonic and reactive current into power system, thus contributing to degradation in the power quality. The shunt active power filter (APF) shows a strong vitality in eliminating harmonics and reactive power. The use of this solution (APFs) to mitigate harmonic problems and to compensate reactive power is dated back to the 1970s [1], [2], [3]. Since then, the theory and applications of APFs have drawn much attention. It injects equal-but-opposite current as well as absorbs or generates reactive power, thereby controlling the harmonics. The objective of this research is to develop an efficient and reliable modular active power filter system to realize a cost-effective solution to the harmonic problem. The proposed filter system consists of a number VSI module, each dedicated to filter a specific harmonic of choice. In this paper, a modular active power filtering with two FMVs: “multi-variable filter” to extracts the individual harmonic components of the distorted line current signal and to estimate the fundamental component of the line voltage is proposed in three phase three wire electrical distribution system, feeding non-linear loads. Analysis and simulation results show improved performance. THE PROPOSED MODULAR ACTIVE POWER FILTERS SYSTEM The basic blocks of the proposed modular active filter system connected to the electric distribution
system are shown in Figure 1. The system consists of a number of tree-phase voltage-source inverter (VSI) modules connected in parallel for each phase. Each filter module is dedicated to suppress a chosen specific low-order harmonic.
Figure 1. The proposed modular
active power filters system
The proposed active filter system uses two FMVs to process the signals obtained from the power line. The method is based on extraction of fundamental component and individual harmonics of a distorted current by one module of FMV (the current FMV) and the fundamental voltage by the other FMV (the voltage FMV). The output of the FMV current is used to generate the modulating signals for the VSI modules. The power rating of the modules will decrease and their switching frequency (bandwidth) will increase as the order of the harmonic to be filtered increases. As a result, the overall switching losses are reduced due to selected harmonic elimination and balanced

ACTA TECHNICA CORVINIENSIS – Bulletin of Engineering
2013. Fascicule 2 [April–June] 140
power rating-switching frequency product [1], [2], [3]. The information made available by the FMV current allows to select harmonic elimination. The output of the second FMV (FMV voltage) is the fundamental component of the line voltage signal. It is used as a synchronizing signal in regulation of the voltage source of the inverters modules [4], [5], [6], [7]. MULTI-VARIABLE FILTER AND ITS BEHAVIORS This filter says FMV, was developed by M.Benhabibe [4]. It’s based on the work of Song Hong-Scok and is based on the extraction of the fundamental signals, directly from the αβ axes. However, it can be used very well to isolate the direct or inverse of a particular harmonics order. The equivalent transfer function of the integration in the synchronous references frame «SRF» is expressed by the equation:
∫ −= dttUeetV xyjwtjwt
xy )()( (1)
After Laplace transformation, we get the following equation:
22)()(
)()(
)(c
c
wKsjwKsK
sxsx
sH++++
==αβ
αβ (2)
By developing this equation, we obtain the expressions:
)s(xw)Ks(
w.K
)s(xw)Ks()Ks.(K
)s(x
β2c
2c
α2c
2αβ
++-
+++
= (3)
)s(xw)Ks()Ks.(K
)s(xw)Ks(
w.K)s(x
β2c
2
α2c
2c
β
+++
+
++=
(4)
[ ] )s(xs
w)s(x)s(x
sK
)s(x βc
βαα --= (5)
[ ] )s(xs
w)s(x)s(x
sK
)s(x αc
βββ --= (6)
where: wc: The cut-off frequency of the filter and is defined by fc n ωεω ..=
wf: The angular frequency of the fundamental component of the input signal, ε: Constant gain equal to ± 1 (direct component (ε = 1) or reverse (ε = -1). n: The order of the signal component to be filtered (n = 3,5,7,9…).
: The output signal of the filter. : The input signal of the filter.
k: Constant gain. Figure 2 illustrates the scheme of the multivariable filter. The strategy developed for this new approach is based on using two FMVs; the first one is used to extract the fundamental and the individual harmonic (3rd, 5th, 7th) components of the distorted line current
signal. The second is use to obtain a good voltage signal without harmonics. In this section, we can present the simulation results concerning the study of the FMV filter to present its performance and benefits. This study justifies our choice to introduce this filter in extracting in the references instead of the conventional extraction filters.
Figure 2. Multi-Variable Filter
Figure 3 shows the multi-variable filter output results representing the two phase’s current component in αβ axis before and after filtering.
Figure 3. Two Phase Load Currant in αβ Axis
Before and After Filtering
The simulation results demonstrate the effectiveness of the FMV in this studied case (harmonics and unbalance). It is performing well and perfectly extracts harmonic currents without change of phase or amplitude [5] [6] [7].

ACTA TECHNICA CORVINIENSIS – Bulletin of Engineering
2013. Fascicule 2 [April–June] 141
DESCRIPTION OF THE ADVANCED CONTROL METHOD The main function of the controller is to create the PWM switching signals for the connected VSI modules. Figure 4 shows the schematic diagram of the proposed control scheme for the Ith VSI filter module. The objective of this controller is to maintain a constant dc-voltage (to compensate for the losses of the filter module) and to inject a compensating current equal to the Ith harmonic current of the nonlinear load [8], [9].
Figure 4. Control scheme of the Ith VSI filter module
without reactive power compensation
In the proposed control scheme, a two-control loop system is adopted, an open-loop and a closed-loop control systems. In the open loop system, the Ith
harmonic signal is obtained from the output of the current FMV and then its value is summed by (-Vs.udc), i.e. the gain of the filter module. The output udc of the fuzzy logic controller is used to maintain the dc-side voltage at its reference value. The closed-loop control based a fuzzy logic controller is used to maintain a constant value of dc-side voltage [8], [10], [11], [12]. The opposite of this signal is used as a current reference signal for that particular Ith harmonic component. The sum of the open loop control signal (current reference signal) and the closed-loop control signal (for regulating dc-side voltage) is used as the modulating signal of the three phases PWM control strategy to create the PWM switching pattern for the switches of the VSC module which is dedicated to the Ith harmonic. SIMULATION RESULTS In order to test the performance of the proposed modular active approach filter in steady-state, the system of Figure 1, was simulated using MATLAB software. Simulation parameters used in this paper are summarized in table.1.
Table 1. Parameters of simulation f = 50 H
Vsa = 240√2 Vsb = 240√2 Vsc = 240√2 Rs = 3.5 mΏ Ls = 0.05 mH Rc = 0.82 mΏ Lc = 0.023 mH
Rd = 1 Ώ Ld = 2.6 mH C = 8 μf Lf = 50 mH
Rf = 5 mΏ α = 20 at t = 0.1s α = 40
The harmonics are extracted from the line current signal (IL) using the FMV Current. The first three dominant harmonics are selected to be suppressed. Control signals for the 3rd, 5th and 7th harmonics are obtained. Each is used to generate the PWM switching pattern for one VSI dedicated to suppress the corresponding harmonic. In this case, 3 VSI are used. Figure 5 shows the waveforms of the phase-a distorted current and its harmonic spectrum with a harmonic distortion rate equal to 18.00%.before filtering, and the THD is decreased to a value of 1.21%.after filtering. Also as can be seen from figure 6.b the line current takes a form very close to a sinusoidal and from Figure 6.e, 6.f the injected currents harmonic into the line by the active filter modules follow their references. The waveforms clearly illustrate the successful elimination of the selected harmonics from the line current. From figure 6.c we can see the phase shift between current and voltage source, this phase shift make a degradation of power factor that we want to make very closer to unity. Figure 6.d, shows the DC capacitor voltage is well regulated and maintained at a constant value of 850V with a very limited fluctuation which justifies the effectiveness of the fuzzy logic controller to regulate the DC capacitor of the shunt active filter module.

ACTA TECHNICA CORVINIENSIS – Bulletin of Engineering
2013. Fascicule 2 [April–June] 142
Figure 6. Simulation Results of Modular Active Power
Filtering Without reactive power compensation CONCLUSIONS In this paper, a modular active power filter system is proposed which is capable of performing harmonic filtering in 3-phase 3-wire distribution system. The control strategy based on FMVs “multi-variable filter for identifying reference currents, eliminate the bloc of the conventional instantaneous real and imaginary powers theory initiated by Akagi. The dc-side voltage controlled by a fuzzy logic controller is well regulated and maintained at a constant value. The proposed active power filter has the ability to extract the fundamental system voltage in case the line voltage is unbalanced and harmonic polluted. The proposed active filter system has also the ability to extract information on individual harmonic components which allow us not only reducing the THD but also suppressing each harmonic component to meet the requirements of the IEEE 519 standard which emphasis that each harmonic component to be below a certain level. On the basis of simulation results it can be concluded that with this advanced approch improvements in control, the modular active power filters are capable to better compensate the current harmonics and reactive power in three phase three-wire electrical networks.

ACTA TECHNICA CORVINIENSIS – Bulletin of Engineering
2013. Fascicule 2 [April–June] 143
REFERENCES [1] Ramadan A. El Shatshat: “A Novel Modular
Approach to Active Power-Line Harmonic Filtering in Distribution S Systems”. Thesis presented to the University of Waterloo in fulfillment of the thesis requirement for the degree of Doctor of Philosophy in electrical and cornuted Engineering. Waterloo, Ontario, Canada, 2001.
[2] R. El Shatshat, M. Kazerani, M.M.A. Salama: “Modular Active Power Filtering Approaches: Power Splitting verses Frequency Splitting”. Proceedings of the 1999 IEEE Canadian Conference on Electrical and Computer Engineering. Shaw Conference Center, Edmonton, Alberta, Canada May 9-12 1999.
[3] El Shatshat, M. Kazerani, M.M.A. Salama: “Modular Approach to Active Power-Line Harmonic Filtering” Trans, Electric Power Systems Research 61 (2002) 185–194.
[4] M.C. Benhabib, E. Jacquot, S. Saadate: ‘’An Advanced Control Approach for a Shunt Active Power Filter’’. International Conference on Renewable Energy and power Quality,9-11 April 2003, Vigo, Spain.
[5] Arnaud Gaillard: “Système éolien basé sur une MADA: contribution à l’étude de la qualité de l’énergie électrique et de la continuité de service” these présentée pour l'obtention du grade de Docteur de l'Université Henri Poincaré, Nancy-I en génie électrique 30 avril 2010.
[6] Stratégies de commande des filtres actifs parallèle et hybride avec validations expérimentales ‘’ présentée pour l'obtention du grade de Docteur de l'Université Henri Poincaré, Nancy-I en génie électrique. 29 mai 2008.
[7] M C. Benhabib, S. Saadate: “A Now Topology for a Modular active Power Filter” Trans, IEEE ISIE 2005, June 20- 23, 2005, Dubrovnik, Croatia.
[8] Ould Abdeslam : ‘’Techniques neuromimétiques pour la commande dans les systèmes électriques: application au filtrage actif’’ thèse présentée pour l'obtention du grade de Docteur de l'Université Haute-Alsace, U.F.R. des Sciences et Techniques 08 décembre 2005.
[9] D. Ould Abdeslam, P. Wira, D. Flieller, J. Mercklé: ‘’Une nouvelle approche neuromimétique pour l'identification et la compensation des harmoniques dans les systèmes électriques’’ Trans, Conference on Electrical Engineering and its Applications, Sidi Bel-Abbes, Algeria, 2006.
[10] A. Sahbani, M. Labben-Ben Braiek, M. A.Dami, M. Jemli : ‘’Commande d’un filtre actif triphasé shunt par logique floue’’. Trans, 3rd International Conference: Sciences of Electronic, Technologies of Information and Telecommunications, 2005 – Tunisia
[11] Gonzalo Cabodevila: ‘’Commande et Identification Floue‘’ livre, École Nationale Supérieure de Mécanique et des Microtechniques 26, chemin de l’Épitaphe 25030 Besançon cedex – France.
[12] Xu Dianguo, He Na, Wang Wei: ’’Study on Fuzzy Controller with a Self-adjustable Factor of Active Power Filter’’, Trans, Department of Electrical Engineering, Harbin Institute of Technology, Harbin, 150001, CHINA. 1-4244-0136-4/06/$20.00 '2006 IEEE
ACTA TECHNICA CORVINIENSIS – BULLETIN of ENGINEERING
ISSN: 2067-3809 [CD-Rom, online]
copyright © UNIVERSITY POLITEHNICA TIMISOARA, FACULTY OF ENGINEERING HUNEDOARA,
5, REVOLUTIEI, 331128, HUNEDOARA, ROMANIA http://acta.fih.upt.ro

ACTA TECHNICA CORVINIENSIS – Bulletin of Engineering
© copyright FACULTY of ENGINEERING ‐ HUNEDOARA, ROMANIA
ACTA TECHNICA CORVINIENSIS – BULLETIN of ENGINEERING
ISSN: 2067-3809 [CD-Rom, online]
copyright © UNIVERSITY POLITEHNICA TIMISOARA, FACULTY OF ENGINEERING HUNEDOARA,
5, REVOLUTIEI, 331128, HUNEDOARA, ROMANIA http://acta.fih.upt.ro
ACTA TECHNICA CORVINIENSIS – BULLETIN of ENGINEERING
ISSN: 2067-3809 [CD-Rom, online]
copyright © UNIVERSITY POLITEHNICA TIMISOARA, FACULTY OF ENGINEERING HUNEDOARA,
5, REVOLUTIEI, 331128, HUNEDOARA, ROMANIA http://acta.fih.upt.ro

© copyright FACULTY of ENGINEERING ‐ HUNEDOARA, ROMANIA 145
1. Naqib DANESHJO, 2. Baryalai TAHZIB, 3. Cristian STRATYINSKI, 4. Andreas KOHLA
METHODS FOR SECURING OF RELIABILITY IN REPRODUCTION PROCESS
1,3,4. TECHNICAL UNIVERSITY, FACULTY OF AERONAUTICS, DEPARTMENT OF AVIATION ENGINEERING, RAMPOVÁ 7, 041 21 KOŠICE, SLOVAKIA 2. TECHNICAL UNIVERSITY, FACULTY OF CIVIL ENGINEERING, DEPARTMENT OF ENVIRONMENTAL ENGINEERING, VYSOKOŠKOLSKÁ 4, 042 00 KOŠICE, SLOVAKIA
ABSTRACT: Reproduction process of the products creates three main stages introduced be-low. If we should take into consideration also safety then all reproduction process should be finished through safe ecological liquidation of the product that has be-come a waste. From this point of view it is very important to realize that every product before or late will become the waste. KEYWORDS: reliability, design, production, reproduction process
INTRODUCTION What will it become with the waste it is designed into large measure already in the design phase? Reliability of design: It depends from construction abilities of designers and projectors. This ability is determined with a technical sentiment of project designers, experiences from similar solutions, choice of construction politics that supports reliability and existing level of available technological conditions. It is possible here to include prices of materials, possibilities of production and availableness of parts produced in series. Reliability of production (workmanship): It depends from holding on technological processes of manufacture and assembly of machineries, from suitable reliable technology, from suitable choice of diagnostics and checked places at critical points of the technological processes. Reliability of utilizing (operation): This reliability depends from holding on prescribed operation conditions, from holding on maintenance measures and utilization of technical diagnostics. It is necessary to solve methods of reaching high reliability at once after analysis of a system state. We emphasize the reality that maintenance in narrower sense is only one from the methods of securing reliability. On the other hand it is the most frequent method utilized for practical aims. The reliability of the objects is reached by means of: � good constructional solution (design reliability), � application of reserved systems (design
reliability), � securing reliability of production, assembly and
transport (production reliability), � adequate education (qualification)of attendance
(reliability of use),
� reduction of unfavourable influences from environment of the object (reliability of use),
� utilizing suitable maintenance and technical diagnostics (reliability of use).
METHODS FOR ACHIEVING OF BETTER RELIABILITY USING DESIGN MEANS It is possible increase of reliability through lowering number if possible undesirable interaction of elements: 1. We reach it by lowering number of object main
functions. It has an effect a simpler construction but also lowering functional properties. It is the certain optimum measure of functional properties number that designer shall elect. For per-forming arbitrary work function of machinery in the given quality it is necessary always-equal number of main functions. It is decisive from the standpoint of re-liability and amenities that functions let from designer to an attendance respectively a user and that will be secured by the machinery.
2. We reach it by integration of elements on the common material porter. The number of functions lowers total reliability only in this case if single functional parts have final limited life. It is in majority of cases fulfilled. At the object without reserved elements what it is also fulfilled in majority of cases, total reliability of objects is something lower or equal to reliability of the least reliable element of the given object. For increasing reliability of single elements from a standpoint of their mutual interactions we integrate (situate) elements on the common material porter. Possible number of undesirable interactions is lowered with it and total reliability of the object is increased. At right constructional solution it is possible to reach an

ACTA TECHNICA CORVINIENSIS – Bulletin of Engineering
2013. Fascicule 2 [April–June] 146
expressive growth of single elements reliability. A measure of mutual influence of elements and environment depends from density of material functions porters that can enter into mutual interaction and so to be damaged. Judging depends from toughness of single parts from grades of freedom and also possible loading influences beside existing functions. These factors determine reliability of single parts that it is possible only hard exactly to describe. In this regard it is suitable judging by analysis of reliability. At the analysis it is possible to coordinate weight coefficients and on the basic of experiences and simulation of failure possibility to assign a measure of reliability.
Figure 1. Non-integrated elements
Figure 2. integrated elements
Increase of reliability is possible by suitable constructional design preventing of influence of sources of degrading processes. To preventing it is possible to come from a choice of two tactics of protection: Tactics of object parts resisting to unfavourable failure influences, Tactics of object functional activity temporary abolition during duration of unfavourable failure influence. At this tactics protection becomes with it that during object activity stopping possibility of arise relevant failures is pre-vented. TACTICS OF FAILURE PREVENTION 1. We perform it through reduction of loading of
the functional parts. We can reach it through over-dimensioning sizes and lowering work speeds, outputs etc. The designer performs these measures up to the state when he reaches demanded or optimum life of the functional parts.
Figure 3. Loading of functional parts
2. We perform it through limitation of outside unfavourable influences e.g. the application of preset stabilized electric source of voltage in front of device, covering of the functional parts, application of resisted covers etc. In this case we influence only indirectly the influence of loads resulting from the function of machinery.
Figure 4. Limitation of external
unfavourable influences 3. We perform it through limitation of dynamic
load internal sources. We reach it through choice of optimum exactness of parts, counterbalancing of rotating elements, leading heat with cooling or other methods, isolating source vibrations etc.
Figure 5. Reduction of internal causes
of dynamic loading 4. We perform through making out of functional
parts from constructional materials of higher resistance and through development of material (hardening, alloying, alloys, composed materials etc.). By such tactics also we can reach a wished life.
Figure 6. Functional parts of construction
materials increased resistance 5. We secure through dynamic protection with
feedback. Regulation system fulfils automatically a dynamic protection on higher level. E.g. system with correction shifting of functional exhibited part.
Figure 7. Dynamic protection with feedback

ACTA TECHNICA CORVINIENSIS – Bulletin of Engineering
2013. Fascicule 2 [April–June] 147
TACTICS OF TEMPORARY SHUTDOWN OF FUNCTIONALITY 1. We perform through intentional weakening of
functional nodal points that it is possible light to change or again to put together. At load beyond measure the functional nodal point crumbles. So activity of the function is interrupted but it does not come to relevant damages of nodal point parts. In every case it comes however to a manifest failure.
Example: We can arrange here also the bias protection of electronic elements with fuse. In this case more it is prevented also to further activity of unfavourable influence. Restoration of the function rests in a change of the fuse.
Figure 8. Protection by shutdown of operation
2. We reach by automatic technical diagnostics (on-line diagnostics).
In this case becomes alarm or blocking of the functional activity of the object at one as the system discovers an occurrence of the critical (unfavourable, unacceptable) state. � on a functional part of the object (machinery), � in surrounding of the object. The alarm system is utilized at relatively slow development of the relevant failure. On the other hand the blocking system is utilized for prohibiting to quick development of a failure into the relevant failure.
Figure 9. Application of alarm system
The tactics are the followings: 1. Tactics of avoiding At this tactics main defend factor of the animal is to shirk to working unfavourable influence of the aggressor. The basic of shirking is measurement of unfavourable influence measure and succeeding performing shirking manoeuvre. Majority of the animals assigns of course such a type of behaving.
Typical feature is speed and freshness. We can choice as a representative a cat. In technical practice regulation system and technical on line diagnostics corresponds to this tactics. We can shift here also application of fuses. The fuses block the further activity of the object that would lead to arise of the relevant failure.
Figure 10. Tactics of hide
T-tolerance field in that material of the object can by worn without arise of the relevant failure. 2. Tactics of attack At this tactics the main detection factor of the animal is to liquidate influence of an enemy. It is possible with the active or passive attack. The passive attack rests in taking advantage of liquidating element on the surface of protection zone e.g. they are spurs of a hedgehog or poisonous skin of South-American frogs and similar. The representative of active attack a badger can be. It is known about it that it does not give in its territory without fight. In technical practice e.g. application of additional element on detection of functional surface against wear. Such an element can be a layer of lubricant between friction surfaces. The lubricant on the surface liquidates the influence of degradation between mutually moving parts. The case of active attack is already harder to illustrate on technical machinery because machines with its function need not work against lowering outside degradation processes. It is not however fully excluded possibility.
Figure 11. Tactics of attack
3. Tactics of avoiding At this tactics main defend factor of the animal is to shirk to working unfavourable influence of the aggressor. The basic of shirking is measurement of unfavourable influence measure and succeeding performing shirking manoeuvre. Majority of the animals assigns of course such a type of behaving. Typical feature is speed and freshness. We can choice as a representative a cat. In technical practice regulation system and technical on line diagnostics corresponds to this tactics. We can shift here also application of fuses. The fuses block the further activity of the object that would lead to arise of the relevant failure.

ACTA TECHNICA CORVINIENSIS – Bulletin of Engineering
2013. Fascicule 2 [April–June] 148
Figure 12. Tactics of avoiding
4. Tactics of avoiding At this tactics the main defend factor of the animal is the utilization of detection cover that is a part of the animal body. The main representative is a frog with its firm armour.
Figure 13. Tactics of resistance
In technical practice the utilization of resistant materials with good strength properties corresponds these facts. Against other tactics the material with better properties is dominant so that it is manifested with increased reliability with regard on the given degradation influence. CONCLUSIONS The technical diagnostics has the narrow continuity with the maintenance of machines and devices and is one from methods of securing total reliability of objects. The reliability is an important part of the object quality. The final aim of all technical effort is a satisfaction of people need. The most general notion expressing this need is the quality. The satisfaction of people need has its philosophical limits as the need of people is various and variable with time. We can however receive a simple agreement that the best satisfaction of need it is possible to reach through high quality of products. Reliability is the general property of the object resting in ability to fill demanded technical functions in the given tolerance and stated time of application at the given technical conditions. Reliability is the complex property which at determination of the object and its conditions can include single properties e.g. without failures, life, holding and storage. Technical conditions are understood whole of specifications of technical proper-ties prescribed for demanded function of object further methods of its operation, storage, transport, maintenance and corrections. REFERENCES [1.] SINAY, Juraj - PAČAIOVÁ, Hana - KOPAS, Melichar -
ORAVEC, Milan: Application of risk theory in man - machine - environment systems. In: Fundamentals and Assessment Tools for Occupational Ergonomics. - Boca Raton: CRC Taylor & Francis, 2006 P. 8-1-8-11. - ISBN 0849319374
[2.] ORAVEC, Milan: Posudzovanie rizík.bezpečnosť strojných systémov, bezpečnosť chemických prevádzok, bezpečnosť líniových stavieb.1. vyd - Ostrava: Sdružení požárního a bezpečnostního inženýrství, - 2008. - 104 p. - ISBN 978-80-7385-043
[3.] PAULIKOVÁ, Alena: Mechanical engineering industry and electromagnetic pollutionl with fourier transformation = =Strojársky priemysel a elektro- magnetické znečistenie. In: Rozvoj technológie obrábania RTO 2000. - Košice: TU, 2000 S. 102-106. - ISBN 807099505X.
[4.] IŽARÍKOVÁ G.: Tvorba 3D modelov výstavbových prostriedkov montá-žnych systémov. In: Transfer inovácií. 8/2005. - Košice: SjF-TU, 2005 S. 237-240. - ISBN 8080734615.
[5.] AL ALI, Mohamad: The simulation of weakening of steel columns` cross-sections caused by welding when strengthening under load. In: Computa-tional Models for Civil Engineering. - Iasi: Societatea Academica "Matei - Teiu Botez", 2008 P. 342-349. - ISBN 9789738955417.
[6.] ŠEMINSKÝ, Jaroslav: Virtuálne projektovanie automatizovaných výrob-ných systémov. In: SEKEL 2007 a principia cybernetica 2007. - Praha: ČVUT, 2007 2 p. - ISBN 9788001038048
[7.] FABIAN, Michal: CAD - 3D modelovanie v CATIA V5: objemy, povrchy, výkresy, aplikácie v praxi. 1. vyd. Košice : SjF TU, 2008. 197 s. ISBN 978-80-553-0095-5
[8.] KNEŽO, Dušan: Mathematical model of substances degradation. In: AEI ´2011: international conference on applied electrical engineering and informatics 2011: September 3-10, 2011, s. l., Italy. - Košice : TU, 2011 P. 174-176. - ISBN 978-80-553-0740-4
[9.] ANDREJIOVÁ, Miriam - KIMÁKOVÁ, Zuzana: Regulačné diagramy a spôsobilosť výrobného procesu pomocou programu R .In: Forum Statisticum Slovacum. Roč. 7, č. 2 (2011), s. 8-13. - ISSN 1336-7420
ACTA TECHNICA CORVINIENSIS – BULLETIN of ENGINEERING
ISSN: 2067-3809 [CD-Rom, online]
copyright © UNIVERSITY POLITEHNICA TIMISOARA, FACULTY OF ENGINEERING HUNEDOARA,
5, REVOLUTIEI, 331128, HUNEDOARA, ROMANIA http://acta.fih.upt.ro

© copyright FACULTY of ENGINEERING ‐ HUNEDOARA, ROMANIA 149
1. Szilárd SZÉLPÁL, 2. Oriane POSER, 3. Marietta ÁBEL
ENZYME RECOVERY BY MEMBRANE SEPARATION METHOD FROM WASTE PRODUCTS OF THE FOOD INDUSTRY
1,3. UNIVERSITY OF SZEGED, FACULTY OF ENGINEERING, DEPARTMENT OF PROCESS ENGINEERING, SZEGED, HUNGARY 2. DEPARTMENT OF ENGINEERING AND PROCESS SCIENCES, AGRO SUP DIJON UNIVERSITY OF BURGUNDY, FRANCE
ABSTRACT: Recycling waste products of food industry become more and more important: one side because of the environmental matter the other side because of the economic reasons. The most preferred basic material for second generation bio-fuels is the waste products, food industrial waste products such as sugar chip, straw or bagasse. The cost of the process depends on the cost of the hydrolysis of cellulose/lignocelluloses i.e. the cost of the enzymes. These enzymes are very expensive that’s why it’s so important to find a good enzyme recovery method. In our research programme the membrane separation was used for enzyme recovery. Different ultra-filtration membranes such as a polyether-sulfone membrane with a cut-off value of 5 kDa, (PES5) and thin-film membrane with a cut-off value of 4 kDa (TF4) was used for separation the hydrolyzatethe aim of our work was to determine the optimal conditions for the enzymes separation, the value of the fluxes and the resistances values and the investigate the effect of the ultrasound on the membrane separation. We found that the fluxes are enhanced and the fouling resistance is decreased due to the ultrasound application and we also found that the gel layer resistance is increased during the processing. KEYWORDS: bioethanol, ultrafiltration, enzyme recovery
INTRODUCTION In the food industry and in the agribusiness, the waste management is becomes more and more important. These sectors produce a lot of biologically infectious or contaminated waste products (Mold, insects etc.) but these wastes contain lot of useful organic components such as cellulose, sugar, etc which could be useful for bio-fuel production. The amount of waste become reducable on this way and it’s also possible to replace one part of the fossil fuels (Mabee et al. 2011). Cellulose-containing waste is very common for example in sugar industry: molasses (sugar-beet pulp without sugar) or bagasse (sugar cane without sugar). The main problem with the cellulose is the necessity of hydrolysis before fermentation since it cannot be transformed directly into bioethanol; first, it should be transformed (with hydrolysis) into glucose and after the glucose should be fermented into ethanol (Buaban et al, 2010). It’s also possible to do these two processes in the same time: it’s called Simultaneous Saccharification and Fermentation (SSF) (Morales-Rodriguez et al, 2010). Different ways had been tested to make the cellulose more accessible for fermentation. One method is the heating of the cellulose with steam or another common method is the acidic hydrolysis with sulfuric acid (H2SO4).
These two methods cannot be applied in practice because the elevated temperature improved the enzymatic digestion but unfortunately, this high temperature leading to a significant reduction in total sugar recovery (Kahar et al, 2010). Kahar proposed another method: using enzymes (like cellulase and β-glycosidase and a few other fermentation enzymes too, like cell-wall degrading enzymes including xylanase, pectase, ligninase as suggest Shunichi et al 2008 and Mübeccel et al, 2000.) in addition of light chemical treatment 0,1% of H2SO4 and physical treatment: milling and heating at 120°C for 20 min in an autoclave. The enzymes cannot be immobilized for a maximal efficiency but have to be free in the solution (Ruchi et al, 2011). The advantages of the enzymes were experienced after the use but the costs of the enzymes are high for using in this bioethanol production method. So it is very important to find a way to recover and recycle those enzymes after use. During the research programme it was found that the best recovering procedure is the membrane separation. (Lipnizki, 2010). There are different kinds of membrane separation. The membrane process is based on the membrane itself, which is a perm-selective barrier between two phases.

ACTA TECHNICA CORVINIENSIS – Bulletin of Engineering
2013. Fascicule 2 [April–June] 150
These membranes are passed certain components through and held back some other components or molecules. The membranes can be categorized by their thickness, construction, charge or according to their origin. The membrane science knows four different membrane separation processes: micro-filtration, ultra-filtration, nano-filtration and reverse osmosis. The main difference is the pore size of the membranes and the applied differential pressure. Micro-filtration has pore size between 0.1 and 10µm and the used pressure is 0.2-0.6 MPa, in ultra-filtration the pore size is between 10-3and 0.1µm and the used pressure is 0.2-1 MPa; the nano-filtration has pore size between 1 and 10 nm and has applied pressure between 1-4 MPa. In the reverse osmosis process, it’s only the water which can pass through the membrane. The reverse osmosis membrane separation process used 0.1-1 nm pore size membranes with 3-10 MPa pressure. The most frequently used methods are nano-filtration and ultra-filtration. Ultra-filtration is used to clarify fruit juice or to filter protein and retain casein in the diary industry. Nano-filtration is mostly used in the water treatment industry: to filter antibiotics or pesticides, softening and reducing the salt content in water. (Daufin 1998) There are some advantages the work can be affected at ambient temperature, no chemical has to be added and the process can be continued. But there are also drawbacks: risks of fouling, limited selectivity and lifetime. For continuous processes the pumps can be very expensive. (Bimbenet 2001) In our work, our first purpose was to find the best parameters to recover enzymes with membrane ultra-filtration, and our second objective was to investigate the effect of ultrasound of filter parameters. MATERIAL AND METHODS All experience was carried out under optimal conditions for the enzymes. This reported 26°C ± 0.2, and they were repeated twice. The model solution was prepared from 5% glucose and from 2% of cellulase of Trichoderma reesei (Cellulast 1.5L, Novozymes A/S, Denmark; 700 U/g) and from cellobiase of Aspergillus niger (Novozym 188, Novozymes A/S, Denmark; 250 U/g). The hydrolyzate was made from sugar-beet pulp. It was prepared in a 2L fermentation unit (Labfors Minifors, Belgium) at 26°C±0.2 and pH 4±0.1. Enzymes used are the same than above at concentration of 200, 400 and 600 µL g of solution
-1. Polyether sulfone (PES) membranes with a cut-off value at 5kDa and thin-film membranes with a cut-off value at 4kDa were used in a micellar enhanced ultra filtration (MEUF) device. During the measurements, 3.5 bar pressure was applied and the feed solution was stirred with a magnetic stirrer at 350 rpm to prevent fouling of the membranes and to facilitate the formation of micelles. The permeates and the concentrates were analyzed after the measurements and the sugar and protein content were measured too.
It had been calculated the different components of total membrane resistance. The retention (R) of the model and the hydrolyzates were calculated by the following formula [1]:
100cc1R0
⋅⎟⎟⎠
⎞⎜⎜⎝
⎛−= [1]
where c is the concentration of the permeate phase ([%] or [mg dm−3]), and the c0 is the concentration of the feed ([%] or [mg dm−3]). The value of the fouling coefficients was determined from the analysis of the flux-time functions [2]:
K0tJJ -= [2]
where J0 is the initial permeate flux [L m-2 h-1], t is the filtration time [h], and K is the fouling index. The membrane resistance (RM) was calculated from the following correlation [3]:
ηJpΔ
Rw
M = [3]
where JW is the flux of water [m3 m-2 h-1], and η is the water viscosity at 25 °C. The fouling resistance (Rf) of the membrane was determined by washing the gel layer from the membrane. The fouling resistance [4] and the resistance of the polarization layer (Rg) were calculated as [5]:
MW
f RηJ
pΔR -= [4]
fMW
g RRηJ
pΔR --= [5]
where Δp is the pressure difference between the two sides of the water (Pas), η [Pas] is the viscosity of the filtered solution. The Reynolds’ number was calculated as [6]:
ηρnd
Re2
mix = [6]
where ρ is the retentate density [kg m-3], n is the rotation rate of the stirrer [s-1], η is the viscosity of the retentate [Pas], and d is the diameter of the stirrer [m]. The protein quantity was determined by the Kjeldhal method, and the glucose content was calculated by colorimetric method with a spectrophotometer. The ultrasonic treatment was used at the same time of the membrane separation. RESULTS AND DISCUSSION The measured fluxes were showed almost the same values on smaller pressure values. These fluxes were showed exponential raise after the 2.5 bar pressure value on higher pressure values, but this raise was slowed after the 3.5 bar value. The 3.5 bar pressure was chosen to our experiences, because an outlier data of the flux value was measured in this pressure value (Table 1).
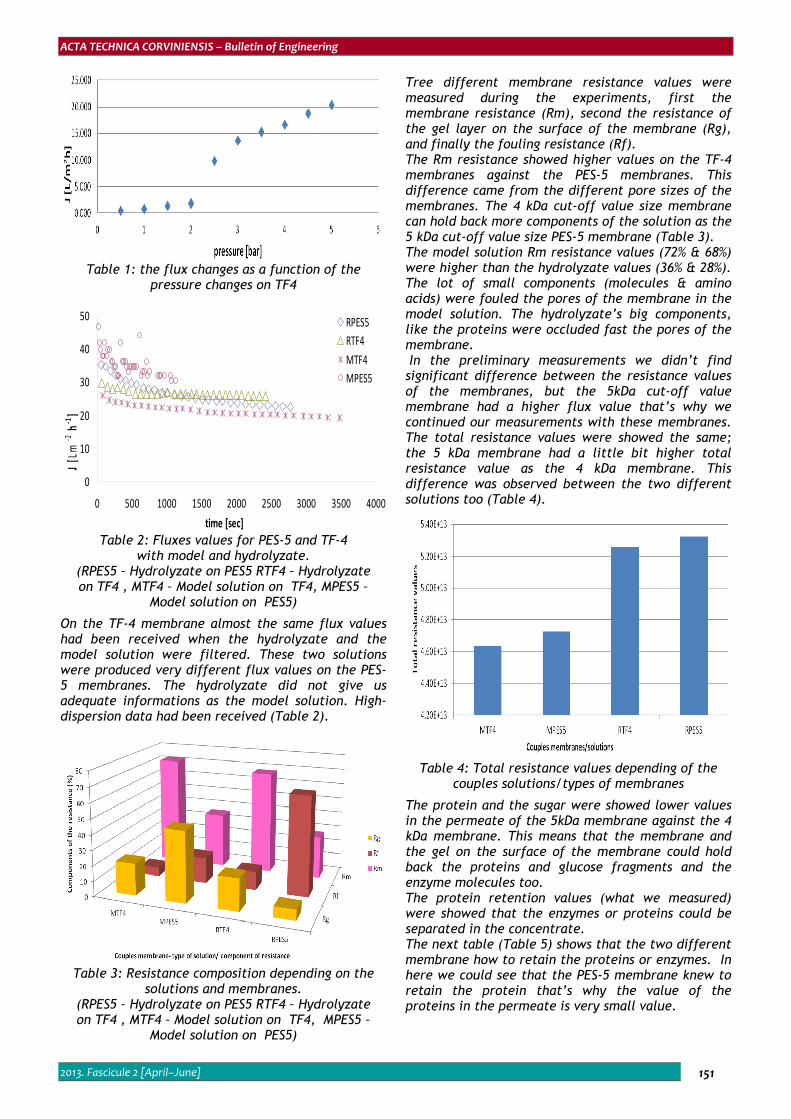
ACTA TECHNICA CORVINIENSIS – Bulletin of Engineering
2013. Fascicule 2 [April–June] 151
Table 1: the flux changes as a function of the
pressure changes on TF4
0
10
20
30
40
50
0 500 1000 1500 2000 2500 3000 3500 4000
time [sec]
J [L
m‐2 h
‐1]
RPES5RTF4MTF4MPES5
Table 2: Fluxes values for PES-5 and TF-4
with model and hydrolyzate. (RPES5 – Hydrolyzate on PES5 RTF4 – Hydrolyzate on TF4 , MTF4 – Model solution on TF4, MPES5 –
Model solution on PES5)
On the TF-4 membrane almost the same flux values had been received when the hydrolyzate and the model solution were filtered. These two solutions were produced very different flux values on the PES-5 membranes. The hydrolyzate did not give us adequate informations as the model solution. High-dispersion data had been received (Table 2).
Table 3: Resistance composition depending on the
solutions and membranes. (RPES5 – Hydrolyzate on PES5 RTF4 – Hydrolyzate on TF4 , MTF4 – Model solution on TF4, MPES5 –
Model solution on PES5)
Tree different membrane resistance values were measured during the experiments, first the membrane resistance (Rm), second the resistance of the gel layer on the surface of the membrane (Rg), and finally the fouling resistance (Rf). The Rm resistance showed higher values on the TF-4 membranes against the PES-5 membranes. This difference came from the different pore sizes of the membranes. The 4 kDa cut-off value size membrane can hold back more components of the solution as the 5 kDa cut-off value size PES-5 membrane (Table 3). The model solution Rm resistance values (72% & 68%) were higher than the hydrolyzate values (36% & 28%). The lot of small components (molecules & amino acids) were fouled the pores of the membrane in the model solution. The hydrolyzate’s big components, like the proteins were occluded fast the pores of the membrane. In the preliminary measurements we didn’t find significant difference between the resistance values of the membranes, but the 5kDa cut-off value membrane had a higher flux value that’s why we continued our measurements with these membranes. The total resistance values were showed the same; the 5 kDa membrane had a little bit higher total resistance value as the 4 kDa membrane. This difference was observed between the two different solutions too (Table 4).
Table 4: Total resistance values depending of the
couples solutions/types of membranes
The protein and the sugar were showed lower values in the permeate of the 5kDa membrane against the 4 kDa membrane. This means that the membrane and the gel on the surface of the membrane could hold back the proteins and glucose fragments and the enzyme molecules too. The protein retention values (what we measured) were showed that the enzymes or proteins could be separated in the concentrate. The next table (Table 5) shows that the two different membrane how to retain the proteins or enzymes. In here we could see that the PES-5 membrane knew to retain the protein that’s why the value of the proteins in the permeate is very small value.

ACTA TECHNICA CORVINIENSIS – Bulletin of Engineering
2013. Fascicule 2 [April–June] 152
Table 5: The protein retention contents measured in
the different solutions (TF-4 permeate, TF-4 concentrate; TF-4 and PES-5
feed: PES-5 permeate, PES-5 concentrate)
The enzymes and proteins were being able to hold back the gel on the surface of the 5 kDa membrane and the pore size of the membrane. The 4 kDa membrane was showed the same values of the proteins in the permeate solution and in the concentrate as in the feed. Because of this dates the 5 kDa membrane was chosen to use to our work and continued our measurements with it. In the next step the enzyme was separated and recovered them with using the 5 kDa membrane for the separation process. The Ultrasound was used in this process to. We tried to measure that the ultrasound can be help to recover the enzymes or increase the retention values of the membrane. Higher flux values were produced the use of ultrasound than the membrane separation without ultrasound (Table 6). The protein molecules were fractured the ultrasound and raised the amount of these fragments in the feed of the model solution because the ultrasound had an anti-fouling and an anti-gel layer effect. This means that the ultrasound could disrupt the structure of the gel on the surface of the membrane and prevent the formation of this gel.
Table 6: The model solution flux values are graphed as a function of time with
or without US on PES-5 membrane
It can be seen on the table 7 that the flux values are lower with using ultrasound than the ultrafiltration of the hydrolyzate without using ultrasound. This gel was disrupted the ultrasound on the surface of the membrane, but also the molecules of the enzymes and the proteins were disrupted the ultrasound too, that’s why the pores of the membrane were obturated these fragments and lower fluxes were measured with ultrasound. Lot of small, disrupted items and molecules were generated the treatment which the pores of the membrane were obturated these items and the concentration of the feed was increased too.
Table 7: The hydrolyzate flux values
are graphed as a function of time with or without US on PES-5 membrane
Table 8: The total resistance values
as a function of depending of the application or not of US and of the solution
When the ultrasound was used for the filtration the total resistance values were become higher in the fouling resistance and in the membrane resistance. When the ultrasound wasn’t used in the process the model solutions flux values were become smaller. The fragments of the proteins and the enzymes were made a gel on the surface of the membrane because of the effect of concentration polarization, and the concentration of the feed was increased the thickness of this gel. Since the concentration at the membrane

ACTA TECHNICA CORVINIENSIS – Bulletin of Engineering
2013. Fascicule 2 [April–June] 153
surface is larger than the feed side of the main mass, and therefore a movement in the opposite direction in order is generated that reduces the flux. That’s why the total resistance shown lower values with using ultrasound in the fouling resistance and in the membrane resistance too. The gel resistance showed a difference because the values are much bigger when we used ultrasound than when we not used it. These values mean that the ultrasound obturated the protein and enzyme fragments. As we can see on the above diagram, when increased the number of small, obturated fragments due to this the gel resistance increased too. We could see than the different solutions showed the same effects. CONCLUSIONS In our research project we tried to find the best way of enzyme recovery by membrane separation. We thought that the membrane filtration could help recovering the enzymes which we used in the fermentation of sugar-beet to creating bioethanol. Model solution and hydrolyzate’s were used for the measurements which were contained 2% cellulose and cellobiase enzymes. Our first step was to find the best conditions for the separation process. We found that the temperature between 24-28 degree, 3.5 pressure and 4-4.2 pH were the best conditions for the enzymes to work and for the separation process to recovery the most of the used enzymes. Our second step was to find the appropriate membrane. Tests were made with two different pore size membranes, the TF-4 and the PES-5. We found that the PES-5 membrane is better to recovery most of the used enzymes and better not to obturating fast the pores of the membrane. A deposit of gel was made the concentration polarization effect on the surface of the membrane that’s why a stirrer was used during the separation process. The stirrer could help for us to slow down the gel formation. The same flux and resistance intervals were showed the model solution and the hydrolyzate during the tests. After this we wanted to see if we using ultrasound in the separation process how it is going to change the different values. A lot of small fragments from the proteins and enzymes were made the ultrasound and the membrane was obturated these small fragments and the speed of the gel formation on the surface of the membrane was increased it too. The flux values were augmented the gel because the concentration of the feed became lower. In the end of our experiences we can say that the membrane separation is a good process to separate the enzymes in the feed and recover them. Acknowledgment We would like to thank for the TÁMOP-4.2.1/B-09/1/KONV-2010-0005 identification number, "Establish the Excellence Research Centre in the University of Szeged" in the TÁMOP-4.2.2/B-10/1-2010 -0012 "the Department of Research University Centre of Excellence knowledge base expansion and long-term technical sustainability basis of scientific
excellence in recruitment by providing" entitled projects, which are assistance by the EU, co-financed by the European Social Fund, and which made it possible to perform our conduct, and OTKA. REFERENCES [1.] Benchaporn Buaban, Hiroyuki Inoue, Shinichi
Yano, and Lily Eurwilaichitr: Bioethanol production from ball milled bagasse using an on-site produced fungal enzyme cocktail and xylose-fermenting Pichia stipitis; Bio mass and bio energy, Volume 33, Pages 822 – 827. (2009 )
[2.] Kyllönen H.M., P. Pirkonen, M. Nyström: Membrane filtration enhanced by ultrasound: a review; Desalination, Volume 181, Pages 319–335. (2005)
[3.] Lipnizki Frank: Membrane process opportunities and challenges in the bioethanol industry; Desalination, Volume 250, Pages 1067–1069. (2010)
[4.] Mabee W.E., McFarlane P.N., Saddler J.N.: Biomass availability for lignocellulosic ethanol production; Bio mass and bio energy, Volume 35, Pages 4519-4529. (2011)
[5.] Miller S., Lorenz G.: Use of dinitrosalicylic acid reagent for determination of reducing sugar ; Analytical Chemistry, Volume 31, Issue 3, Pages 426-428. (1959)
[6.] Morales-Rodriguez Ricardo, Anne S. Meyer, Krist V. Gernaey, Gürkan Sin: Dynamic model-based evaluation of process configurations for integrated operation of hydrolysis and co-fermentation for bioethanol production from lignocellulose; Bioresource Technology, Volume 102, Pages 1174–1184. (2011)
[7.] Mübeccel Ergun, S. Ferda Mutlu: Application of a statistical technique to the production of ethanol from sugar beet molasses by Saccharomyces cerevisiae; Bioresource Technology, Volume 73, Pages 251-255. (2000)
[8.] Prihardi Kahar, Kazuo Taku, and Shuzo Tanaka: Enzymatic digestion of corncobs pretreated with low strength of sulfuric acid for bioethanol production; Journal of Bioscience and Bioengineering, Volume 110, No. 4, Pages 453–458. (2010)
[9.] Ruchi Mutreja, Debasish Das, Dinesh Goyal, and Arun Goyal: Bioconversion of AgriculturalWaste to Ethanol by SSF Using Recombinant Cellulase fromClostridium thermocellum; Enzyme Research, Volume 11, Article ID 340279, Page 1-6. (2011)
[10.] Shunichi Nakayama, Tomotake Morita, Hideyuki Negishi, Toru Ikegami, Keiji Sakaki & Dai Kitamoto: Candida krusei produces ethanolwithout production of succinic acid; a potential advantage for ethanol recovery bypervaporation membrane separation; Federation of European Microbiological Societies (FEMS), Yeast Research, Volume 8, Pages 706–714. (2008)
[11.] Ulbricht Mathias: Advanced functional polymer membranes; Polymer, Volume 47, Pages 2217–2262. (2006)

ACTA TECHNICA CORVINIENSIS – Bulletin of Engineering
2013. Fascicule 2 [April–June] 154
[12.] J.-J. Bimbenet, P. Granier: Les Procédés de
séparation par membranes, électrodialyse osmose inverse ultrafiltration utilisations actuelles et potentielles;Editor : CDIUPA Coll : Actualités scientifiques et techniques en industries agro-al, numéro 9, Pages 126-130. (2001)
[13.] E. Dale: Ultrasonics: data, equations, and their practical uses, Volume 10, Editor: Boca Raton Florida: CRC Press (Taylor & Francis Group), Page. 328. (2009)
[14.] G. Daufin, F. Rene, P. Aimar: Séparations par membrane dans les procedes de l'industrie alimentaire; Editor:Technique Et Documentation Coll : Sciences Tech.agro-Alimentaire, Pages 49-62. (1998)
ACTA TECHNICA CORVINIENSIS – BULLETIN of ENGINEERING
ISSN: 2067-3809 [CD-Rom, online]
copyright © UNIVERSITY POLITEHNICA TIMISOARA, FACULTY OF ENGINEERING HUNEDOARA,
5, REVOLUTIEI, 331128, HUNEDOARA, ROMANIA http://acta.fih.upt.ro

© copyright FACULTY of ENGINEERING ‐ HUNEDOARA, ROMANIA 155
Scientific Events in 2013
1. THE 7th INTERNATIONAL WORKING CONFERENCE TOTAL QUALITY MANAGEMENT − ADVANCED AND INTELLIGENT APPROACHES − TQM 2013 with 3rd SPECIAL CONFERENCE “MANUFUTURE IN SERBIA 2013” 4 − 7 June, 2013, Belgrade, SERBIA
The main objective of the 7th TQM Conference is to provide an international forum around the world for the exchange of knowledge, experience, research results and information about various aspects of the state-of-the-art and the future development of total quality management. The scope of the Conference covers philosophical, scientific and practical concepts concerning research, development and application of TQM-based advanced approaches. Topics of interest include, but are not limited to: � Business excellence models (applications and development trends); � TQM & manufacturing management; � World class performance; � Attractive quality; � Robust engineering; � Six sigma model; � Intelligent quality tools and methods; � Virtual factory and virtual quality; � Intelligent metrology in manufacturing; � Intelligent and virtual CMM; � Business process improvement; � Breakthrough management; � Organizational Excellence; � Intelligent design for quality; � Intelligent Business; � Quality in Higher Education; � Quality of the Public Services / health care; � Advanced Quality approaches; � Digital engineering/manufacturing; � Manufuture initiative and Micro-nano manufacturing / Metrology Detailed informations here: http://cent.mas.bg.ac.rs/tqm/2013/index.html 2. THE 5th INTERNATIONAL CONFERENCE ON GEARS WITH EXHIBITION − GEARS 2013
7 − 9 October, 2013 Technical University of Munich (TUM), Garching (near Munich), GERMANY
The fifth international conference on gears and transmissions in Germany will become a broad platform for equipment manufacturers and producers and researchers of gear and transmission systems to present new solutions and their latest research results. Climate change is one of the big issues in public discussion, in politics and industry. The conference will show, what the transmission and drive train industry can contribute to increase energy efficiency. Gears are vital in the efficiency of different applications. They transmit and vary torque between prime movers and applications. There is still room for improvement, which will be demonstrated by the presenters. New concepts for drive trains of energy supply systems provide answers to the increasing demand for energy worldwide. These concepts must be introduced to global markets more quickly. Therefore, new designs are necessary and will be presented at the conference. The state-of-the-art of industrial applications will be demonstrated at an exhibition beside the conference.

ACTA TECHNICA CORVINIENSIS – Bulletin of Engineering
2013. Fascicule 2 [April–June] 156
The conference will last three days, comprising keynote addresses and presentations in a series of plenary and parallel sessions. The official language of the conference will be English. No simultaneous translation will be provided. The conference program and the registration form will be available in June 2013. Detailed informations here: www.vdi-gears.eu 3. THE 11th INTERNATIONAL CONFERENCE ON ACCOMPLISHMENTS IN ELECTRICAL AND MECHANICAL ENGINEERING
− DEMI 2013 University of Banja Luka, Faculty of Mechanical Engineering 26 − 28 May, 2013, Banja Luka, BOSNIA & HERZEGOVINA
We are pleased to inform you that the Faculty of Mechanical Engineering Banja Luka will organize the 11th International Conference on Accomplishments in Electrical and Mechanical Engineering and Information Technology, DEMI 2013. The Conference will be held from 30 May to 1 June 2013 at the Faculty of Mechanical Engineering Banja Luka. The aim of the Conference is to review the current state of research in the field of mechanical and electrical engineering as well as information technologies. We hope that results of scientific investigations obtained by research institutions and research results obtained by industry will significantly contribute to the implementation of new technologies in production processes and induce the competitiveness of domestic industry. The Conference aims to encourage new forms of cooperation between scientific institutions and manufacturing companies, which can help those companies overcome difficulties related to the transition process and the global crisis. We would like to invite all scientists, researchers and experts from the industry to take part in the DEMI 2013 Conference, to exchange their experiences and to present the latest results of their research. Scope and topics of the conference: � Production Technologies and Engineering: Production technologies, conventional and unconventional processes,
production systems and computer integrated manufacturing, metrology, quality, industrial management … � Mechanics and Design: Mechanics of rigid and deformable bodies, Fluid mechanics, hydraulics and pneumatics, design
methods, stability of structures, products design, analysis and synthesis of construction… � Transport and Means of Transport: Engines, vehicles, railway vehicles, transport systems modeling, contemporary
means and systems of transport, logistics… � Energy and Thermal Engineering: Thermal Engineering, heating, air conditioning ventilation, refrigeration, energy
efficiency, renewable energy sources … � Maintenance of Technical Systems, Occupational Safety: Maintenance methods and techniques design and
management of maintenance systems, maintenance versus new technologies, maintenance versus environment protection, occupational safety, ...
� Mechatronics: Industrial automation, automatic control systems, proportional and servo technology, robotics… The Conference organizer is planning marketing and commercial presentations of companies for conference participants. We would like to invite all companies to take this opportunity and present their products and services to the Conference participants. Detailed informations here: http://demi.rs.ba 4. THE 6th INTERNATIONAL CONFERENCE FOR ENTREPRENEURSHIP, INNOVATION AND REGIONAL DEVELOPMENT
− ICEIRD 2013 Program Theme: Regional Economic Resilience through Innovation and Enterprise 20 − 21 June, 2013, Istanbul, TURKEY
In the face of fragile economic recovery following the economic and financial crisis of 2008, many firms all around the world continue to invest in growth-enhancing activities to achieve a sustainable development. While the crisis has heavily hit all aspects of business vested interests, investments in innovation, entrepreneurship and regional partnership have been the key priority to ensuring a strong and stable economic growth. The objective of the conference is to gather decision makers (government, ministries and state agencies), innovation experts (universities, research and development centers, technology transfer centers, start-up centers) and practitioners (SME’s, business incubators and business support organizations) to generate discussion and exchange on the potential of entrepreneurship promotion and innovation to national and regional competitiveness. Researchers and practitioners are invited to submit workshop proposals addressing research on entrepreneurship, innovation, and regional development for ICEIRD 2013. Detailed informations here: http://www.iceird2013.org/ 5. THE 8th RESEARCH/EXPERT CONFERENCE WITH INTERNATIONAL PARTICIPATION − QUALITY 2013
6 − 8 June, 2013, Neum, BOSNIA & HERZEGOVINA Organizing Committee invites all potential authors to submit abstracts (up to 100 words), not later than February 28th 2013. The official Conference languages are English, Bosnian, Serbian and Croatian. We remind authors that special section with presentations in English language will be organized at the conference. The Research/Expert Conference will be performed as follows: plenary session (Key papers concerned global topics) and symposium (papers according to the conference topics). Detailed informations here: http://www.quality.unze.ba/ 6. THE 7th INTERNATIONAL SCIENTIFIC-PROFESSIONAL CONFERENCE − SB 2013
“CONTEMPORARY PRODUCTION PROCESSES, EQUIPMENT AND MATERIALS FOR WELDED CONSTRUCTIONS AND PRODUCTS” 23 − 25 October, 2013, Slavonski Brod, CROATIA
During last six meetings this conference had gathered number of experts and scientists who presented and introduced novelty in welding profession. Due to that, for the seventh time, organizers call everyone who can give their contribution to the area of welding technology and welding related techniques, automation and robotization in production of welded constructions, and all others that can, in any other way, give their contribution to development of welding practice, to

ACTA TECHNICA CORVINIENSIS – Bulletin of Engineering
2013. Fascicule 2 [April–June] 157
present their scientific and professional knowledge and experiences. This year, also, there will be the exhibition of welding devices, filler metals and equipment, and all presented papers will be published i the conference proceedings and CD media. We thank to all our present partners of this conference for their contribution and welcome you in Slavonski Brod. Topics of interest for the conference should be related but not limited to the following thematic focuses: � New technologies and materials � Welding processes � Robotization and automation � Pressure vessels � Welding related techniques � Manufacturing of welded construction � Quality control of welded products � Reliability and safety of welded productions and constructions � Weldability of materials � Filler metals � Equipment for welding and welding related techniques � Personnel and education in welding � Metallurgy � Ecology and occupational health � Economical aspects of welding Detailed informations here: http://www.sfsb.hr/dtzsb/ 7. THE 13th INTERNATIONAL MULTIDISCIPLINARY SCIENTIFIC GEOCONFERENCE & EXPO − SGEM 2013 − SURVEYING
− GEOLOGY & MINING − ECOLOGY − MANAGEMENT Modern Management of Mine Producing, Geology and Environmental Protection 16 − 22 June, 2013, Albena Resort, BULGARIA
The Multidisciplinary GeoConference will bring together researchers, educators, and practitioners representing research and educational institutions, companies, government agencies and consulting organizations from all over the world to exchange of ideas, to define the research priorities and to propose potential solutions of problems related to the global changes. International Multidisciplinary Scientific GeoConference aims are: � To provide the best platform for knowledge and experience shearing in the field of geosciences; � To incorporate and strengthen the capacity of geo-scientists for facing the challenges of our time; � To give the opportunities for future co-operation; � To emphasize the role of multidisciplinary approach in revealing and solving the environmental problems in local,
regional and global scale; � To outline research direction, identify, report, and disseminate issues and/or problems in geo-sciences applications; � To discuss the new developments and technologies in surveying geology and mining, ecology, and management, in
order to ensure the sustainable use of natural resources. SGEM International Multidisciplinary Scientific GeoConference and Expo is organized under the auspices of Ministry of environment and water, Bulgaria. Main organizers are the Academies of Sciences of the following countries: Bulgaria, Czech Republic, Iran, Latvia, Poland, Russia, Serbia, Slovakia, Ukraine, and also the Bulgarian Industrial Association. Detailed informations here: www.sgem.org 8. FEDERATED CONFERENCE ON COMPUTER SCIENCE AND INFORMATION SYSTEMS − FedCSIS 2013
8 − 11 September, 2013, Kraków, POLAND The 2013 Federated Conference on Computer Science and Information Systems cordially invites you to consider contributing an Event (conference, symposium, workshop, consortium meeting, special session). The FedCSIS multi-conference consists of a significant number of recurring Events, but proposals for new associated Events are welcome until January 14, 2013. The Events can run over any span of time within the conference dates, from half-day to three days. The FedCSIS Events provide a platform for bringing together researchers, practitioners, and academia to present and discuss ideas, challenges, and potential solutions on established or emerging topics related to research and practice in computer science and information systems. The Events will be selected based on the scientific/technical interest and/or their relevance to practitioners in their topics, the clarity of the proposal in addressing the requested information, the innovativeness of the Event topics, and the capacity in the FedCSIS multi-conference program. Detailed informations here: www.fedcsis.org 9. THE 7th INTERNATIONAL CONFERENCE ON PHYSICAL AND NUMERICAL SIMULATION OF MATERIALS PROCESSING −
ICPNS ’13 16 − 19 June, 2013, Oulu, FINLAND
Following on from its six predecessors in Harbin (1990), Hainan (1997), Beijing (1999), Shanghai (2004), Zhengzhou (2007) and Guilin (2010), this conference will be held outside China for the first time. It provides an excellent international forum for those who wish to present their latest work on advances in the field of physical and numerical simulation methods and their applications in the processing of advanced materials. Oulu will provide an excellent environment for a highly enjoyable stay during the conference with among other things 24 hours of daylight. The main topics of ICPNS ’13 will be: � Physical simulation (Gleeble testing, torsion, dilatometry, thermal analysis, etc) of material processing: continuous
casting, thermo-mechanical processing, hot rolling, forging, extrusion, forming, welding, heat treatments, etc. � Numerical simulation and modeling of liquid metal processing, continuous casting, thermo-mechanical processes, and

ACTA TECHNICA CORVINIENSIS – Bulletin of Engineering
2013. Fascicule 2 [April–June] 158
all phenomena occurring during metal processing. � Metal surfaces: properties and behavior. � Processing and characterization of advanced materials. � Fabrication of advanced materials. Detailed informations here: http://www.icpns13.org/ 10. THE 3rd INTERNATIONAL CONFERENCE ON ENVIRONMENT AND INDUSTRIAL INNOVATION − ICEII 2013
19 − 20 May, 2013, Copenhagen, DENMARK The 3rd INTERNATIONAL CONFERENCE ON ENVIRONMENT AND INDUSTRIAL INNOVATION (ICEII 2013) is the premier forum for the presentation of technological advances and research results in the fields of Environment and Industrial Innovation. ICEII 2013 will bring together leading engineers and scientists, academics and industrial experts in Environment and Industrial Innovation from around the world. The primary goal of the conference is to promote research and developmental activities in Environment and Industrial Innovation. Another goal is to promote scientific information interchange between researchers, developers, engineers, students, and practitioners working in India and abroad. The conference will be held every year to make it an ideal platform for people to share views and experiences in Environment and Industrial Innovation and related areas. Topics of interest for submission include, but are not limited to: � Advanced Ceramic-porous ceramic � Aerodynamics � Application of Spatial technology � Catalysis and Environment � Environmental Biotechnology � Environment management � Environmental Chemistry � Environmental engineering � Environmental Planning of Mines � Environmental Pollution Control � Fermentation Technology � Fermentation Technology � Industrial Environment � Industrial Microbiology � Industrial Microbiology � Industrial pollution � Land resource utility � Pharmaceutical Technology � Renewable Energy � Wastewater Quality Modeling � Wind engineering Detailed informations here: http://www.iceii.org 11. THE SECOND INTERNATIONAL CONFERENCE “MECHANICAL ENGINEERING IN THE XXI CENTURY”
Mechanical Engineering Faculty of the University of Niš 20 − 21 June, 2013, Niš, SERBIA
It is our great pleasure to announce that the Faculty of Mechanical Engineering, University of Niš, is organizing the Second International Conference “Mechanical Engineering in the 21st Century”. The Conference will take place in Niš on June 20-21, 2013. In recent years, the economic system has been changed in the direction of market economy, private property, and intensive creation of small and medium enterprises. The strategy and policy of the scientific and technological development of Serbia pays most attention to the innovative environment, which should assure the application of results from fundamental and applied research. The Second International Conference “Mechanical Engineering in the 21st Century” aims to bring together researchers from scientific and industrial institutions to present and communicate their newest results, to create personal contacts, to promote research within the area of mechanical engineering, to find possibilities of cooperation in bilateral or multilateral projects, and to stimulate the participation of doctoral students. You are cordially invited to attend and participate in the Second International Conference “Mechanical Engineering in the 21st Century”. Detailed informations here: http://www.masfak.ni.ac.rs 12. EDUCATION, RESEARCH, INNOVATION − ERIN 2013
15 - 17 May 2013, Častá –Papiernička, SLOVAKIA We are inviting you to the seventh year of the international conference for young researchers and PhD. students “EDUCATION, RESEARCH, INNOVATION – ERIN”. The Conference is held under auspices of professor Lubomír SOOS, Dean of the Faculty of Mechanical Engineering, Slovak University of Technology in Bratislava. The Conference ERIN will take place in Častá -Papiernička on the 15th - 17th of May 2013. For more information see http://erinconference.org The Conference topics are: 1. INNOVATION TECHNOLOGY 2. PRODUCTION TECHNOLOGY 3. SOURCES OF ENERGY 4. COMPLEMENTARY TOPIC

ACTA TECHNICA CORVINIENSIS – Bulletin of Engineering
2013. Fascicule 2 [April–June] 159
An accompanying program of the Conference ERIN: - the presentation of the international companies - an interesting excursion for conference participants to the Small Carpathian region - awards of the winners of the competition ERIN 2013 More information about topics can be found on the website http://erinconference.org 13. INTERNATIONAL CONFERENCE ON ENERGY EFFICIENCY AND AGRICULTURAL ENGINEERING − EE & AE 2013
17 − 18 May, 2013, Ruse, BULGARIA Following the success of previously organized EE&AE Conferences, the Organizing Committee is proud to announce the Energy Efficiency and Agricultural Engineering Conference 2013, held at the University of Ruse Angel Kanchev, on 17-18 May, 2013, Ruse, Bulgaria. The main objectives of the Conference are to promote exchange of research results, scientific ideas and their practical implementation concerning Energy Efficiency and Education in Agriculture and to assist personal contacts between scientists and specialists, especially from South-Eastern Europe and the developing countries. Students and young scientists will be encouraged to participate in the Conference. Main topics of the conference: � Agricultural Waste Management � Computer Technologies in Agriculture � Electronics in Agriculture � Energy and Environment in Agriculture � Food Engineering and Biotechnology � Higher Education and Training � Information Systems and Precision Farming � Land, Water and Agro-Processing Engineering � Management and Ergonomics � Plant and Animal Production Engineering � Power and Machinery � Renewable Energy Sources More information about topics can be found on the website http://eeae-conf.uni-ruse.bg 14. INTERNATIONAL CONFERENCE ON MATHEMATICAL MODELING IN PHYSICAL SCIENCES - IC-MSQUARE 2013
1- 5 September, 2013, Prague, CZECH REPUBLIC It is our pleasure to circulate the announcement of the 2nd International Conference on Mathematical Modeling in Physical Sciences, IC-MSQUARE 2013. The conference aims to promote the knowledge and the development of high-quality research in mathematical fields that have to do with the applications of other scientific fields and the modern technological trends that appear in them, these fields being those of Physics, Chemistry, Biology, Medicine, Economics, Sociology, Environmental sciences etc. IC-MSQUARE-2013 topics encompass, but are not restricted to, the following areas: � mathematical modeling in Fundamental Physics � evolutionary computation � complex physical and technical systems � software and computer complexes for experimental data processing � qualitative modeling including fuzzy and iterative approaches to modeling � nonlinear problems � computational chemistry, biology, and biophysics � new generation computing tools, distributed scientific computing � computational modeling in engineering and science � multiscale modeling, multiphysics modeling � progress in discretization methods � financial mathematics and mathematics in economics etc. You may find details of the Conference visiting the Conference website at http://www.icmsquare.net. 15. 14th INTERNATIONAL WORKSHOP ON RESEARCH AND EDUCATION IN MECHATRONICS - REM 2013
6 - 7 June, 2013, Vienna, AUSTRIA We would like to invite you to the 14th INTERNATIONAL WORKSHOP ON RESEARCH AND EDUCATION IN MECHATRONICS (REM 2013) organized by the Association for Supporting Automation and Robotics “Verein zur Foerderung der Automation und Robotik (F-AR)”. This is a 2 day event, promoted by the International Network of Mechatronic Universities (www.mechatronics-net.de). The 14th INTERNATIONAL WORKSHOP ON RESEARCH AND EDUCATION IN MECHATRONICS is a very well established event in the field of research and education in Mechatronics. Experts from many different countries will come together to exchange their knowledge and experience with colleagues. REM is the basis for new networks and cooperation in R&D and in educating Mechatronics engineers. We hope to give you an opportunity for further cooperations, e.g. in student and university teachers exchange. Furthermore we include keynote presentations by renowned researchers from universities and from industry. Topics of interest for the conference should be related but not limited to the following thematic focuses: Mechatronic Systems Methodologies and Tools Industrial and Mobile Robots in Production Education and Learning Please consult the web site of REM 2013 for further information: http://www.f-ar.at/REM2013

ACTA TECHNICA CORVINIENSIS – Bulletin of Engineering
2013. Fascicule 2 [April–June] 160
16. IV. CENTRAL EUROPEAN CONFERENCE ON LOGISTICS – CECOL 2013 5 – 7 November, 2013, Magdeburg, GERMANY
As a result of the scientific collaboration among higher education centers of the central European zone and three previous successful editions held in Miskolc, Hungary (2010), Częstochowa, Poland (2011), Trnava, Slovak Republic (2012) the Institute of Logistics and Material Handling Systems (ILM), belonging to the Faculty of Mechanical Engineering (FMB) is proud to announce that the 4th Central European Conference on Logistics (CECOL 2013) will be held in the city of Magdeburg, Germany, during November 5th-7th, 2013. The CECOL 2013 will provide a high-level international platform for academicians and practitioners from all over the world, to present their research results and development activities in the broad field of logistics. This way, the organizing committee is pleased to invite prospective authors to submit their original manuscripts to the conference. Topics of interest for the conference should be related but not limited to the following thematic focuses: 1. Modeling and simulation in logistics 2. Logistics process analysis and planning 3. Localization, navigation and communication in transportation and logistics 4. Manufacturing process and logistics networks simulations 5. Production planning and scheduling 6. Maintenance and robot implementation into the logistic processes 7. New teaching and research approaches in logistics For any further information, we recommend you to have a look at the conference website www.ilm.ovgu.de/cecol2013. 17. THE 5th INTERNATIONAL CONFERENCE “MANAGEMENT OF TECHNOLOGY - STEP TO SUSTAINABLE PRODUCTION”
– MOTSP 2013 29 – 31 May 2013, Novi Vinodolski, CROATIA
The 5th International Conference "Management of Technology - Step to Sustainable Production" (MOTSP 2013), will take place from 29-31 May 2013, Novi Vinodolski, Croatia, as a joint project organized by the Faculty of Mechanical Engineering and Naval Architecture and Croatian Association for PLM (CAPLM). MOTSP 2013 conference are an occasion for researchers, scientists, engineers, and technologist from a wide variety of fields to come together to share in their sinergy of management of technology and sustainable production. We assume management of technology, stimulation of innovation, invention and transfer of technology as some of the important challenges of the developed countries and countries of transition. Technology is considered as all knowledge, products, processes, tools, methods and applied systems in production of goods or services. Please consult the web site of MOTSP 2013 for further information: http://www.motsp2013.org/ 18. Workshop: MODERN APPROACH TO PRODUCT DEVELOPMENT AND BUSINESS IMPROVEMENT
16 - 19 May 2013, Balatonfüred, HUNGARY The goal of this Workshop is to highlight the modern approach to product development and improvement of business and its purpose is to inform the professional and scientific community with the following topics: � Innovation as a key parameter in the product development process - Moderator Prof. Dr. Vojislav Miltenović � Development as a way to improve business - Moderator Prof. Dr. Milan Gašović � Modern methods of product development - Moderator Prof. Dr. Miroslav Vereš � How to improve the quality and design - Moderator Prof. Dr. Duško Pavletić � Modern technologies in product manufacturing - Moderator Prof. Dr. Stanislaw Legutko � Project management in product development and production - Moderator Prof. Dr. Milan Ikonić � Development and product management in the life cycle - Moderator Prof. Dr. Zoran Anišić Hereby, we call participants to take an active participation in the Workshop by having own presentation about defined topics. After the positive reviewing their paper will be published in the journal Machine Design printed by Faculty of Technical Sciences in cooperation with ADEKO association.
ACTA TECHNICA CORVINIENSIS – BULLETIN of ENGINEERING
ISSN: 2067-3809 [CD-Rom, online]
copyright © UNIVERSITY POLITEHNICA TIMISOARA, FACULTY OF ENGINEERING HUNEDOARA,
5, REVOLUTIEI, 331128, HUNEDOARA, ROMANIA http://acta.fih.upt.ro

© copyright FACULTY of ENGINEERING ‐ HUNEDOARA, ROMANIA 161
MANUSCRIPT PREPARATION – General Guidelines
These instructions are written in a form that satisfies all of the formatting requirements for the author manuscript. Please use them as a template in preparing your manuscript. Authors must take special care to follow these instructions concerning margins. The basic instructions are simple:
� Manuscript shall be formatted for an A4 size page. � The top and left margins shall be 25 mm. � The bottom and right margins shall be 25 mm. � The text shall have both the left and right margins justified.
The original of the technical paper will be sent through e-mail as attached document (*.doc, Windows 95 or higher). Manuscripts should be submitted to e-mail: [email protected], with mention “for ACTA TECHNICA CORVINIENSIS – Bull. of Eng.”. STRUCTURE The manuscript should be organized in the following order: Title of the paper, Authors' names and affiliation, Abstract, Key Words, Introduction, Body of the paper (in sequential headings), Conclusion, Acknowledgements (where applicable), References, and Appendices (where applicable). THE TITLE The title is centered on the page and is CAPITALIZED AND SET IN BOLDFACE (font size 14 pt). It should adequately describe the content of the paper. An abbreviated title of less than 60 characters (including spaces) should also be suggested. AUTHOR’S NAME AND AFFILIATION The author's name(s) follows the title and is also centered on the page (font size 11 pt). A blank line is required between the title and the author's name(s). Last names should be spelled out in full and succeeded by author's initials. The author's affiliation (in font size 11 pt) is provided below. Phone and fax numbers do not appear. ABSTRACT A nonmathematical abstract, not exceeding 200 words, is required for all papers. It should be an abbreviated, accurate presentation of the contents of the paper. It should contain sufficient information to enable readers to decide whether they should obtain and read the entire paper. Do not cite references in the abstract. KEY WORDS The author should provide a list of three to five key words that clearly describe the subject matter of the paper. TEXT LAYOUT The manuscript must be typed single spacing. Use extra line spacing between equations, illustrations, figures and tables. The body of the text should be prepared using Georgia or Times New Roman. The font size used for preparation of the manuscript must be 11 points. The first paragraph following a heading should not be indented. The following paragraphs must be indented 10 mm. Note that there is no line spacing between paragraphs unless a subheading is used. Symbols for physical quantities in the text should be written in italics.

ACTA TECHNICA CORVINIENSIS – Bulletin of Engineering
2013. Fascicule 2 [April–June] 162
FIGURES AND TABLES Figures (diagrams and photographs) should be numbered consecutively using Arabic numbers. They should be placed in the text soon after the point where they are referenced. Figures should be centered in a column and should have a figure caption placed underneath. Captions should be centered in the column, in the format “Figure 1” and are in upper and lower case letters. When referring to a figure in the body of the text, the abbreviation "Figure" is used Illustrations must be submitted in digital format, with a good resolution. Table captions appear centered above the table in upper and lower case letters. When referring to a table in the text, "Table" with the proper number is used. Captions should be centered in the column, in the format “Table 1” and are in upper and lower case letters. Tables are numbered consecutively and independently of any figures. All figures and tables must be incorporated into the text. EQUATIONS AND MATHEMATICAL EXPRESSIONS Equation numbers should appear in parentheses and be numbered consecutively. All equation numbers must appear on the right-hand side of the equation and should be referred to within the text. CONCLUSION A conclusion section must be included and should indicate clearly the advantages, limitations and possible applications of the paper. Discuss about future work. ACKNOWLEDGEMENTS An acknowledgement section may be presented after the conclusion, if desired. Individuals or units other than authors who were of direct help in the work could be acknowledged by a brief statement following the text. REFERENCES References should be listed together at the end of the paper in alphabetical order by author’s surname. List of references indent 10 mm from the second line of each references. Personal communications and unpublished data are not acceptable references. Journal Papers: Surname 1, Initials; Surname 2, Initials and Surname3, Initials: Title, Journal Name, volume (number), pages, year. Books: Surname 1, Initials and Surname 2, Initials: Title, Edition (if existent), Place of publication, Publisher, year. Proceedings Papers: Surname 1, Initials; Surname 2, Initials and Surname 3, Initials: Paper title, Proceedings title, pages, year.
ACTA TECHNICA CORVINIENSIS – BULLETIN of ENGINEERING
ISSN: 2067-3809 [CD-Rom, online]
copyright © UNIVERSITY POLITEHNICA TIMISOARA, FACULTY OF ENGINEERING HUNEDOARA,
5, REVOLUTIEI, 331128, HUNEDOARA, ROMANIA http://acta.fih.upt.ro

© copyright FACULTY of ENGINEERING ‐ HUNEDOARA, ROMANIA 163
Indexes & Databases
ACTA TECHNICA CORVINIENSIS – BULLETIN of ENGINEERING is accredited and ranked in the “B+” CATEGORY Journal by CNCSIS – The National University Research Council’s Classification of Romanian Journals (poz. 940). The Journal is a part of the SCIPIO - The Romanian Editorial Platform.
ACTA TECHNICA CORVINIENSIS – BULLETIN of ENGINEERING is indexed and covered in the following databases and directories: INDEX COPERNICUS – JOURNAL MASTER LIST
http://journals.indexcopernicus.com/ GENAMICS JOURNALSEEK Database
http://journalseek.net/ DOAJ – Directory of Open Access Journals
http://www.doaj.org/
EVISA Database
http://www.speciation.net/ CHEMICAL ABSTRACTS SERVICE (CAS)
http://www.cas.org/ EBSCO Publishing
http://www.ebscohost.com/

ACTA TECHNICA CORVINIENSIS – Bulletin of Engineering
2013. Fascicule 2 [April–June] 164
GOOGLE SCHOLAR
http://scholar.google.com SCIRUS - Elsevier
http://www.scirus.com/
ULRICHSweb – Global serials directory
http://ulrichsweb.serialssolutions.com
getCITED
http://www.getcited.org BASE - Bielefeld Academic Search Engine
http://www.base-search.net Electronic Journals Library
http://rzblx1.uni-regensburg.de Open J-Gate
http://www.openj-gate.com ProQUEST Research Library
http://www.proquest.com
ACTA TECHNICA CORVINIENSIS – BULLETIN of ENGINEERING
ISSN: 2067-3809 [CD-Rom, online]
copyright © UNIVERSITY POLITEHNICA TIMISOARA, FACULTY OF ENGINEERING HUNEDOARA,
5, REVOLUTIEI, 331128, HUNEDOARA, ROMANIA http://acta.fih.upt.ro

ACTA TECHNICA CORVINIENSIS – BULLETIN of ENGINEERING
ACTA TECHNICA CORVINIENSIS – BULLETIN of ENGINEERING
ISSN: 2067‐3809 [CD‐Rom, online] copyright © UNIVERSITY POLITEHNICA TIMISOARA,
FACULTY OF ENGINEERING HUNEDOARA, 5, REVOLUTIEI, 331128, HUNEDOARA,
ROMANIA http://acta.fih.upt.ro
