science of tsunami hazards of tsunami hazards ... survey after the doublet outer-rise earthquake in...
TRANSCRIPT

ISSN 8755-6839
SCIENCE OF TSUNAMI HAZARDS
Journal of Tsunami Society International
Volume 31 Number 4 2012
TSUNAMI MITIGATION PLANNING IN PACITAN, INDONESIA: A REVIEW OF EXISTING EFFORTS AND WAYS AHEAD
A. Muhari
Ministry of Marine Affairs and Fisheries (KKP), Jakarta 10110, Indonesia Disaster Control Research Center, Tohoku University, Sendai 980-8579, Japan
M. Mück
German Remote Sensing Data Center (DFD), German Aerospace Center (DLR), 82234 Wessling, Germany
S. Diposaptono Ministry of Marine Affairs and Fisheries (KKP), Jakarta 10110, Indonesia
H. Spahn
GIZ International Services, Jakarta 10310, Indonesia
ABSTRACT A small bay-town in East Java Province, Indonesia is selected as a pilot area for an integrated model of tsunami mitigation. Located at the south coast of Java, Pacitan is facing a seismic gap between two tsunami-earthquake events, which are the 1994 (M 7.2) and the 2006 tsunami (M 7.7). The efforts were started in 2008 by constructing the structural components in stages. Coastal forests development and the installation of land-based ocean radar were completed within 3 years. In line with these efforts, comprehensive risk assessment is now being conducted. Detailed tsunami simulations were carried out in addition to the preparation of vulnerability analysis. We attempted to establish novel risk assessment methods and products. We complete the countermeasures by planning two-year activities of community preparedness to ensure the sustainability of the above mentioned efforts. The key objective is the development of a comprehensive and coherent tsunami mitigation system on local level. Keywords: Tsunami mitigation, Risk assessment, Numerical simulation, Decision support system, Capacity building
Vol. 31, No. 4, page 244 (2012)

1 INTRODUCTION
1.1 Background
Two mega-tsunamis hit two different countries in the last 8 years. Although punctuated by several events that are also not a small tsunami, the 2004 Indian Ocean earthquake tsunami (M 9.1) and the 2011 Japan earthquake tsunami (M 9.0) are two of the most significant events in the last 50 years. These events had two different impacts on coastal communities. Due to different disaster management conditions, the 2004 Indian Ocean tsunami killed at least 250 thousand people with 150 thousand of them in Indonesia. At that time, there were no tsunami disaster mitigation efforts, including tsunami early warning devices available (e.g. Muhari et al. 2007). In contrary, the 2011 tsunami hit a country that was equipped with one of the best tsunami mitigation and early warning systems in the world (e.g. Imamura and Abe. 2009, Shuto and Fujima. 2009). Even though still 19.000 people were missing and died as a result of the tsunami (NPA, 2012), the intervention of those structural countermeasures in line with continuous public education significantly reduced the number of casualties. On deriving the objective, this paper is advantaged by the above two tsunami experiences. We suppose that if the integrated mitigation efforts are available, the potential of human risk due to tsunami can be significantly reduced by continuously educating people in tsunami prone areas. We are first looking back to the mile-stones reached as a response to the 2004 Indian Ocean tsunami in Indonesia. In the aftermath of the catastrophe, an ‘end-to-end’ tsunami warning system was designed and developed (Rudloff et al. 2009, Lauterjung et al. 2010). Although the system is seemed to need more time to be fully functional, it is already able to issue the warning within 5 min (Pariatmono. 2012). The dissemination process seems to be the priority problem to enhance in the near future. Hayden et al. (2007) said that the role of warning dissemination is a key part in the success of such large-scale evacuations and its inadequacy in certain cases has been a ‘primary contribution to deaths and injuries.’ Experiences in the case of the 2010 Mentawai Islands tsunami-earthquake where the tsunami arrival time was less than 15 min (Muhari et al. 2010), and the 2011 Japan tsunami in Papua region where the tsunami was lasting up to 12 hours (Khafid and Handayani. 2011) are still the main weaknesses of the present system on disseminating and terminating the warning. As locals in Mentawai Island could not obtain fast warning due to insufficient warning time during the 2010 tsunami-earthquake, it yield to 546 casualties as a result of late evacuation. In Papua region, the long wave propagation passing through ocean ridges created several wave trains due to the trapped tsunami energy and excites ridge waves during the 2011 Japan tsunami (Koshimura et al. 2001). However, tsunami warning was terminated after the second wave in the first wave train (Fig 1). As the result, a locality returns to the lowland area and was swept by the next waves.
Vol. 31, No. 4, page 245 (2012)

Fig 1: The tide gauge record in Jayapura, Papua, Indonesia during the 2011 Japan tsunami
The next problem is the inappropriate response of people to the tsunami warning and limited structural facilities to reduce tsunami impact and evacuation measures. Results of the questionnaire survey after the doublet outer-rise earthquake in April 2012 off the Simelue Island, Indonesia stated that even people in Banda Aceh are still have inadequate behavior to respond adequately to the warning and to start the evacuation (I-RAPID. 2012 and J-RAPID. 2012). For the latter, such situations do not only occur in areas with limited experience with tsunamis. In Japan, the inappropriate behavior especially during evacuation such as using cars, ‘family evacuation’ and underestimating the hazard that yields to the delay of evacuation was repeatedly observed. In this case, sustainable education might be the only solution. Dengler (2004) said that tsunami education activities have been proven as the essential tools for near-source tsunami mitigation. This might be correct especially for the children. A success story of an amazing evacuation conducted by students of an Unosumai Elementary School in Kamaishi Town, Japan is one of the warrants that continuous education can bring significant change on how people respond to the tsunami warning (e.g. Katada, 2011). Learning from the above-mentioned experiences and literature, we design comprehensive countermeasures to be implemented in a pilot area in Indonesia. Pacitan, a small bay-town in the south of Java, Indonesia is selected as a case study. A step-by-step planning is consisting of three main parts of activities: the first is the tsunami hazard-vulnerability and risk assessment, followed by the development of structural countermeasures, and finally, the most important process to ensure the sustainability of the above efforts, the capacity development concept on tsunami preparedness, awareness and close assistantship in public education programs. This paper is aimed to described the concept and explain the past and ongoing processes in Pacitan town and district. The explanations are complemented by the future planned activities in the next two years in the framework of a research cooperation and project between Indonesia (KKP) and Germany (PROTECTS project).
Vol. 31, No. 4, page 246 (2012)

1.2 Overview of the pilot area
Pacitan lies on 8º 11’ S and 111º 7’ E. The U-shape bay regency is facing the southern part of the Indian Ocean and is characterized by flat topographic conditions with average ground level of 4 to 5 m. Historical earthquakes compiled by Newcomb and McCann (1987) in Fig. 2 indicate that there were no significant large earthquake occurred in the last 150 years. However, it should be noted that even the earthquakes were not so strong; three last earthquakes on that region generated significant tsunamis along the coast. In the easternmost part of the region, the 1977 outer-rise earthquake (M 8.3) occurred with a maximum run-up of 8 m in Lunyuk, Sumbawa Island (Gusman et al. 2009). In 1994, either tsunami earthquake (Polet and Kanamori, 2000) or slip over subducting seamount (Abercrombie et al. 2001) with M 7.6 generated a maximum of 14 m tsunami in Banyuwangi, East Java Indonesia (Tsuji et al. 1995). In the westernmost part, a M 7.8 earthquake generated an extreme run-up height of 21 m in West Java, Indonesia (Fritz et al. 2007). The very long seismic signal and significant discrepancy between the earthquake magnitude and the resulting tsunami height suggested that this event is a tsunami-earthquake (e.g. Ammon et al. 2006). Among the 1994 and the 2006 events, there exists a seismic gap that is directly facing Pacitan town (Fig. 2). We assume that the gap will be the source for future tsunamis particularly for Pacitan town, thus the hazard analysis will focus to explore the potential impact due to the tsunami generated in the existing gap.
Fig. 2: Historical earthquake along the south part of Java Island (inset is the location of Pacitan)
Vol. 31, No. 4, page 247 (2012)

1.3 Outline of the paper
This paper is first describing the background of seismic hazard in Pacitan that underlies the objective of the research. Next, we formulate the concept of tsunami mitigation from a general point of view into a site specific context based on the related physical and socio-cultural aspects in Pacitan Town. The detailed tsunami hazard assessment is then carried out to evaluate the potential impact on the coastal community. Based on this information, two structural countermeasures will be described. One is the coastal forest plantation, and the second is the installation of land-based ocean radar which was finished last year. In the last part, we draw the plan for future activities based on the concept derived in the second part. Methods on vulnerability and risk assessment will be presented and key approaches for the future activities are described. Central is the development of a capacity-development concept on tsunami preparedness for local communities.
2 CONCEPTION OF TSUNAMI MITIGATION
2.1 State of the art
In general, mitigation is defined as any sustained effort undertaken to reduce a hazard risk through the reduction of the likelihood and/or the consequence component of that hazard’s risk (Coppola 2007). It consists of two major types that are the structural and nonstructural part. It attempts to reduce the risk likelihood and risk consequences, to avoid the risk, to accept the risk and to transfer the risk. In Japan, this concept is known as tsunami countermeasure instead of mitigation (see Shuto and Kojima. 2009). Based on 10 recommendations derived by the Council of Earthquake Disaster Prevention (CEDP) in 1933, both structural and nonstructural measures were compiled as the main effort to reduce the tsunami risk without taking into account the tsunami early warning –which was not available during that time– and the further education program. Along with the time, this concept is enhanced by the establishment of numerical models on tsunami computation that is the basic for tsunami warning systems. Also, the importance of appropriate response by the society is realized as one of the key factors for successful evacuation (e.g. Imamura 2005). Thus, the continuous assistantship and public education are necessary to reduce the risk bias (Imamura. 2009). Even though the 2011 event shows that these efforts have not shown positive results for the elderly, but it successfully suppresses the number of death among children as shown by the death distribution according to age and gender (NPA, 2011). In the US, through the National Tsunami Hazard Mitigation Program (NTHMP), five recommendations were addressed to be conducted 4 years after the 1992 California earthquake and tsunami. The recommendations cover broader aspects such as producing inundation maps, improving seismic networks, tsunami buoys, developing hazard mitigation programs and the development of technical guidelines and supports (Bernard. 2001). The overall accomplishment and impacts of the NTHMP program on developing the resilient community is given by Bernard (2005) and Trisler et al. (2005) that indicates the significant increment of planning and coordination, information and public education feedback from 16 local emergency managers along the west coasts of the US.
Vol. 31, No. 4, page 248 (2012)
In Indonesia, such an integrated concept is not yet available. The efforts are still limited on the development of the tsunami warning system (Lauterjung et al. 2010, Münch et al. 2011), while the public education and preparedness (e.g. KOGAMI. 2011, Rafliana 2012) is conducted as a not fully integrated way with the above system. As a result, response of people to conduct appropriate evacuation is still far from the appropriate condition as shown by questionnaire surveys after the last major earthquakes in West Sumatran coast in 2012 (M 8.6 and 8.0) documented by I-RAPID (2012) and J-RAPID (2012). 2.2 Formulation of mitigation concept in Pacitan Town
Pacitan is one of the participating districts in the “Project for Training, Education and Consulting of Tsunami Early Warning System” (PROTECTS), the follow-up project of the German Indonesian Cooperation on Tsunami Early Warning System (GITEWS), to support Indonesia in strengthening the capacity of local governments and civil society actors so as to provide the services necessary for sustainable tsunami preparedness.
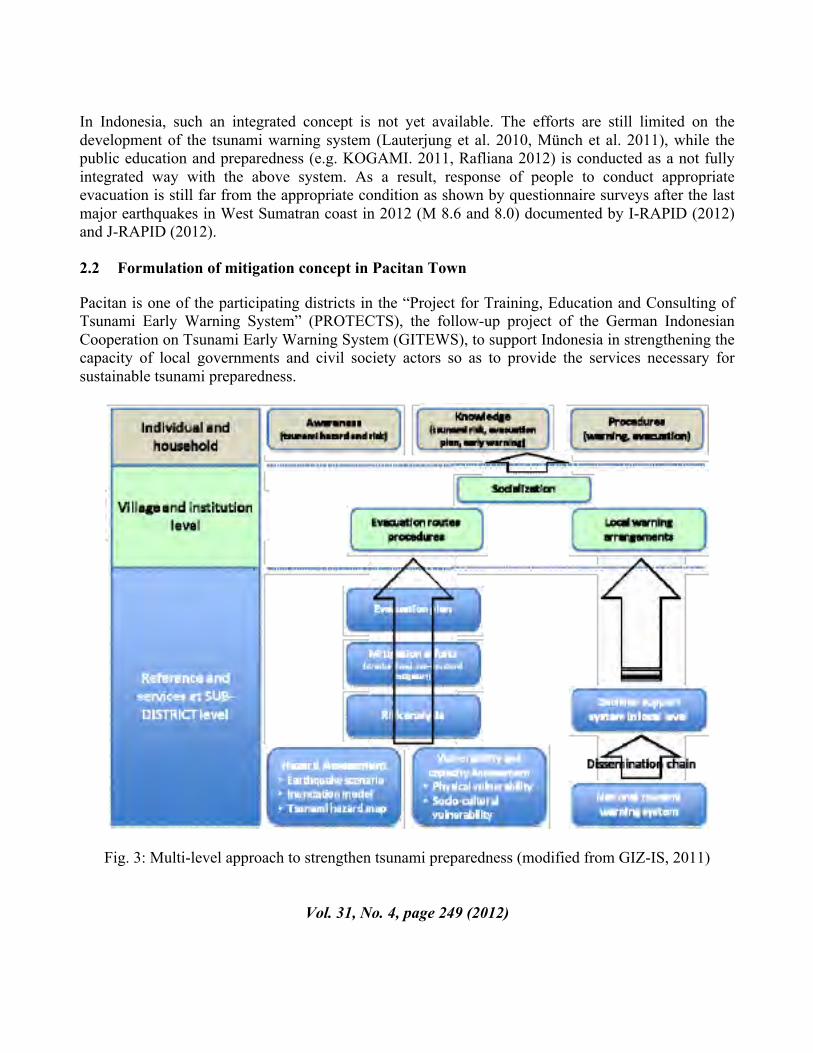
Fig. 3: Multi-level approach to strengthen tsunami preparedness (modified from GIZ-IS, 2011)
Vol. 31, No. 4, page 249 (2012)
Within the agreed tsunami mitigation concept focussed on the capacity-development for local communities, which was designed by the German Agency for International Cooperation (GIZ) together with the Indonesian National Board for Disaster Management (BNPB), and a number of provincial disaster management agencies (BPBD), a multi-level approach involving key players at all levels is implemented since June 2011. It follows a step-by-step approach as described in Fig. 3 to build awareness, knowledge and solid procedures within at-risk communities. This approach addresses the specific conditions in the context of near-field tsunamis (short arrival-times, high level of uncertainty) which require that individuals are enabled to quickly take decisions and correct actions even in the absence of guidance from local authorities or the failure of warning services during an emergency. Local evacuation maps and procedures and warning arrangements are needed to support people in the risk areas in this regard. To develop such plans at village level it requires references regarding hazardous and safe zones and recommended evacuation strategies, as well as the development of local warning services. The responsibility to provide such references, including risk assessments, evacuation plans and the setting up of mechanisms for decision-making and warning dissemination to the community at risk lies with district government. Consequently, the capacity building approach starts by addressing the district level, especially the local disaster-management agencies, first. The capacity-development process is facilitated through a sequence of workshops, implemented by the provincial government, involving representatives from local working groups. During the workshops the participants are introduced to the main topics, such as hazard and risk assessments, evacuation planning, the local warning chain, community awareness and tsunami-simulation exercises. Between the individual workshops the local working groups are in charge to implement the required action in their respective areas. The project offers technical trainings on evacuation planning and local warning services as well as preparing local facilitators to support preparedness processes at village level and to implement community awareness campaigns at grass root level. Beside the implementation of a capacity-development concept on tsunami preparedness, a good and complete understanding of the overall set up of the Indonesian Tsunami Early Warning System (InaTEWS), the time line, the warning scheme and how warnings are being distributed is needed by all actors who are involved in the development of the local warning dissemination mechanism. The National Agency of Meteorology, Climatology and Geophysics (BMKG) operates the National Tsunami Warning Center (NTWC) in Indonesia and is the only appointed official institution responsible to generate tsunami warnings. Using multiple communication channels, BMKG produces and sends tsunami warnings from its Warning Center in Jakarta to ‘Interface Institutions (media, local governements, emergency operation centers, etc.). Local authorities in tsunami-prone areas are in charge of informing their communities about an imminent threat and providing clear guidance on how to react. Near-field tsunamis, however, give only little time for warning and evacuation, so local dissemination must be quick and reliable (GIZ, 2010c). However, the uncertainty on the hazard posed by tsunami sometime cannot be judged by the limited equipment of the national tsunami warning. For instance, during the 2011 tsunami, the tsunami warning in Japan (that is claimed as the best system in the world) predicts only M 7.9 after the massive earthquake with (actually) M 9.0-9.1. The JMA
Vol. 31, No. 4, page 250 (2012)

issued tsunami warning of 3 m tsunami height in Iwate and 6 m in Miyagi. But the actual tsunami observed by the GPS buoys informs that tsunami have been formed with 7 m height in front of Iwate coast (MLIT, 2011). In this sense, the availability of multi-layer equipment for near-field tsunami warning is subsequently necessary to update the first prediction made by the tsunami simulation data base. In Pacitan, therefore, we designed a decision support system for the local government (towns or city level) using a High Frequency (HF) radar antenna to observed continuously the current properties of the ocean. Even though the use of ocean radar in tsunami warning is still in development (Borner et al. 2010, Gurgel et al. 2011, we attempt to prepare the equipment we need on developing the technology. During the planning of the local decision support system, we plant and construct coastal forest along the east part of Pacitan Bay. Shuto et al (1985) said the coastal forest only effective to reduce tsunami with a height less than 3 m. However, their configuration along the coast could be useful on reducing the number of floating debris carried out by the tsunami inland. The subsequent phases of the concept displayed in Fig.3 will be explained in the following.
3 THE PAST AND ONGOING ACTIVITIES
3.1 Tsunami hazard assessment
We determine the source scenario as parametric study using four hypothetical sources. Four scenarios are selected to cover the earthquake magnitude ranges from 7.5 Mw – 8.5 Mw. In the biggest magnitude, we add another scenario that accommodates the potential of slip in updip near the trench as given in Table 1. We assumed the strike, dip and rake as 284º, 12º and 99º. Particularly for the tsunami-earthquake component, we assumed that the additional slip in shallow sediment has the dip of 60º. This is the same value of additional slip as for the 1994 tsunami in East Java proposed by Latief (2000). Also, for all fault parameter, we assumed homogenous rigidity as 3.5 × 10¹⁰ N/m2.
Table1. Hypothetical sources used for the numerical model
The epicenter of the earthquake is assumed in the middle of the largest rupture area (arrow in Fig. 4). We numerically computed the above source scenarios using half space method proposed by Okada (1985).
Vol. 31, No. 4, page 251 (2012)

Fig 4. Rupture areas of the hypothetical sources. Dashed lines show the tsunami-earthquake scenarios, inset box are the nested region for inundation model in Pacitan Town. Concurrently from the largest
to smallest are the regions 1 to 5. The initial tsunamis are then propagated numerically using shallow water equation and discretized using the finite different method in a leap frog scheme given by Imamura (1996). We divided the numerical domain into five regions. Region 1 using numerical grid size of 648 m resampled from GEBCO_08 data (British Oceanographic Data Center, 2008) with original accuracy of 30 arc-sec (about 926m) with using the nearest neighbor method. Region II and III are obtained from the similar data set resampling method to create 162 m cell size for region II and 40.5 for region III. For region IV and V, we used SRTM best tile (DLR, 2009) with accuracy of 30 m. However, one should note that topographic data in SRTM used in this research is the ‘surface elevation’ data that consists of all nature and man-made structures. Ideally, the SRTM data should be manually corrected with the average height of land cover features like it was demonstrated by Roemer et al. (2012), but the lack of field survey data made it impossible to determine the average height of the land-cover features. Thus, such a limitation is highly acknowledged that it may reduce the accuracy of the resulting numerical calculation on tsunami inundation. The SRTM best tile data is resampled into 13.5 m for region IV and 5 m for region V. We manually digitized the local nautical chart for Pacitan waters obtained from the Indonesia Navy No. 70, and manually smoothes the chart in the coastal area. The set of equations used in the numerical model is given as follow,
Vol. 31, No. 4, page 252 (2012)
(1)
(2)
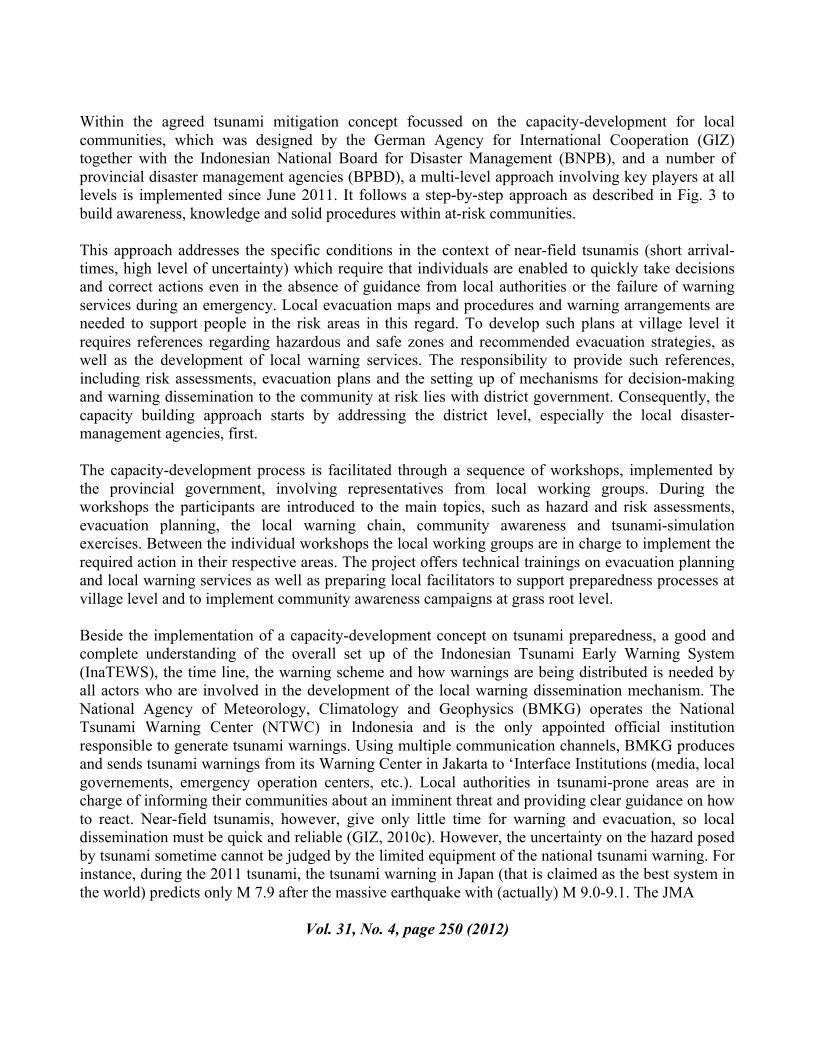
In these equations, M and N denote the discharge flux in the x and y directions, respectively; η denotes the water elevation, n stands for the Manning coefficient, and h represents the water depth. In the case of run-up, the friction component should accommodate different roughness values due to different land cover. Here, we used a method of Equivalent Roughness Model (ERM) by taking into account the resistance due to different roughness values in non-residential areas, and combining different roughness and drag force due to the existence of buildings in residential areas. The formulation derived by Aburaya and Imamura (2002) is given below, while detailed explanation on its implementation in densely populated area given by Muhari et al. (2011).
Here ne is the equivalent roughness, n0 is the original manning coefficient where variation depends on the land cover. θ is the percentage of the bottom area occupied by the building in a grid on the numerical domain and D is the flow depth. CD is the drag coefficient. FEMA 55 (FEMA, 2003) suggests drag coefficient values from 1.25 to 2, depending on the ratio between the width of building and the flow depth. In case of highly populated areas where the building size varies from small to large, it will be very difficult to assign different values for each building. Therefore, in this case, we choose a fixed average value as 1.5 applied in the residential area. By using the above equations, the initial sources is numerically propagated and inundated for 3 hours simulation with 0.25 sec time step. The snapshot of tsunami propagation (in case of the tsunami-earthquake) is given by Fig. 5. Impressions from the above snapshot files are that the existence ridges waves when tsunami passes through the sea mount just after it propagates 5 min from the source. Even though the strike of the source was made to be parallel to the coastline –in order to maximize the tsunami impact–, the above mention phenomenon showing the energy radiation is not directly hitting Pacitan Town as visualized in Fig. 6.
Vol. 31, No. 4, page 253 (2012)
(3)
(4)
(5)

Fig.5: Snapshot of tsunami propagation from the tsunami-earthquake scenario
Fig.6. Distribution of maximum tsunami height from each scenario
Vol. 31, No. 4, page 254 (2012)

The result of numerical simulation suggests that the scenario 4 produced the worst impact in term of the maximum tsunami height along the coast. Thus, it used for further analysis to assess the inundation pattern. We prepared the input data for inundation model as given in Fig. 7. Beside the topographic data (Fig. 7, left), a land use file was put in a separate file to calculate the roughness except building/houses (Fig. 7, center). For residential areas, another file consisting of the percentage of building occupancy on each numerical grid is prepared also in a separate file (Fig. 7, right). These data will be used simultaneously during the calculation.
Fig.7. The input data for calculation of tsunami inundation: topographic data (left), land use data (center) and percentage of building occupancy (right).
The values of Manning roughness for specific land use is refered to Kotani et al. (1997). We visualized the results of the inundation model in Fig.9. It can be seen that a tsunami is potentially flooding Pacitan Town with a maximum flow depth of 10.8 m and in average of 4 m. The area on the right hand side of the bay (right side of the river) is the lowest ground level in the numerical domain. Hence, the area shows the deepest flow depth in the region. The flow velocity is modeled with a maximum of 14.59 m/sec inside the fishery port (in the left part inside the harbor) and an average of 3.6 m/sec.
Vol. 31, No. 4, page 255 (2012)

Fig.9. Distribution of maximum tsunami flow depth and flow velocity
3.2 Coastal forest plantation
The coastal forest was planted in 2 phases, first was started in 2008 and the following phases was conducted in 2011 (Fig. 10). We use whistling pine (Casuarina equisetifolia) that has been proven to be appropriate for the sand type beach in south Java coasts (MoMAF, 2011). Previously, Shuto (1993) said that coastal forest can be functioned to stop the floating debris if the tsunami height less than 3 m. Furthermore, Harada and Imamura (2005) stated that the reduction of the tsunami inundation extent, flow depth, flow velocity and hydrodynamic force will be depending on the width and density of the trees in the forest. They conclude that a 200 width of coastal forest might be able to reduce the inundation extent and flow depth of a 3 m tsunami up to 80%. Also, it can be very useful to reduce tsunami energy of a 3 m tsunami up to 30%.
Vol. 31, No. 4, page 256 (2012)

Figure 10. Location of the coastal forest development in Pacitan Bay We plan to construct at least 100 m width of costal forest. In the first and second step, the built coastal forest has 70 m width. Actually, original land that has been used is around 100 m. However, the trees that were planted in the back of the present coastal forest (Fig. 11) was the different type of whistling pine. It was planted by –locally called– ketapang (Terminalia Catappa). Unfortunatelly, this species is not successfully growth so it left an empty space behing the present forest. The problem why the second species is not growth is still left for further analysis.
Figure 11. Planting and the growth of whistling pine in Pacitan Bay
Vol. 31, No. 4, page 257 (2012)

3.3 Local decision support system
The first local decision support system for tsunami warning in Indonesia is introduced by Muhari et al. (2010) using tide gauges. They put a tide gauge in a small island around 11 km from the city, and in real time the data was transferred to the base station in emergency office using radio frequency. However, not all tsunami prone cities in Indonesia has small island in front of them that can be used to install the tide gauge. Pacitan Bay is one of them. Therefore, we are looking for another alternative to develop the system that can help the local authorities to make an appropriate decision once the big earthquake occurred. The selection to choose radar system was motivated by facts that it can detect the 2011 Tohoku tsunami in Chili and Japan (Lipa et al. 2011). However, it has been admitted that up to present, the radar equipment is able to detect tsunami after it confirmed by the other data (such as tide gauge). There is no such a function that automatically discriminate which is tsunami and which is not available from the radar in the present time. Therefore, the development of automatic algorithm for the radar to detect the tsunami is still being intensively discussed. We believed, with the ability to detect the ocean current up to 150 km offshore, this equipment could become the basis for the decision support system or even the local tsunami warning in the future. To date, we already install the radar sensor and the visualization of the data was interfaced in Indonesian as given in Fig. 12.
Figure 12. Visualization of the radar data in a simple interface
Vol. 31, No. 4, page 258 (2012)

4 FUTURE PLANNED ACTIVITIES
As shown in Fig.3, risk information is a crucial precondition for the implementation of tsunami preparedness strategies for local communities. Risk knowledge within this framework specifically refers to the knowledge of probabilities of hazard distribution on land and the question whether elements are exposed to the hazard. For the case of tsunami the knowledge of the area inundated by tsunami is necessary for defining the evacuation zone and the deployment of warning dissemination infrastructure, such as sirens. But risk knowledge is not limited to hazard and exposure assessment. As already defined, vulnerability assessment refers to analyzing the underlying factors that determines the likelihood of damage and loss of life during and after an extreme event. Within the PROTECTS project, the German Aerospace Center (DLR) is responsible to provide risk information for the participating districts as a basis for further capacity development and evacuation planning. Available hazard assessment results (see 3.1) are the basis for the development of 3 map products for Pacitan district covering vulnerability and risk information. The method developed within the GITEWS project (Strunz et al., 2011) will be used as explained in the following sub-sections. 4.1 Exposure map In case of a tsunami, the decision whether a region should be warned requires sound information on the spatial distribution of exposed population in order to prioritize tsunami warnings and to develop efficient evacuation planning strategies. In Indonesia, population distribution data are available for villages as smallest administrative level provided by the National Statistical Agency (BPS). To improve the spatial resolution of population data, a method to disaggregate population information from available datasets to land use classes was developed and validated by Khomarudin et al., (2010) as shown in Fig.13,
Fig.13. Concept of population distribution modeling
Vol. 31, No. 4, page 259 (2012)
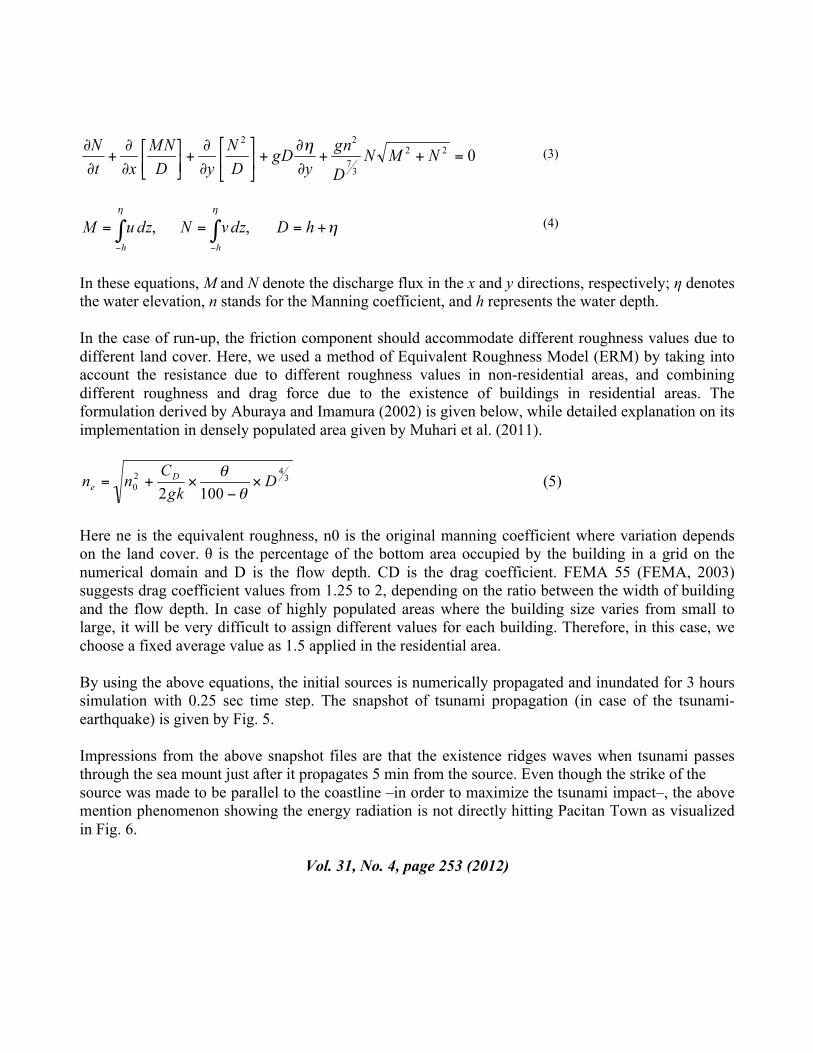
Here, statistical analysis of people’s activities is used to allocate weights for the disaggregation whereby the determination of weighting factors that distribute the population to land use classes during day- and night-time is crucial. There are two sources of statistical data in Indonesia that provide information. Site specific information on the livelihood of population is necessary to apply this method in order to calculate the potential number of people engaged in different land use activities at various times of the day. The result of the population distribution modeling, finalized within this project, will be an enhanced population density map (day and night distribution) for Pacitan town with a scale of 1:25 000. 4.2 Evacuation time map Having the information of tsunami hazard and the potential exposed people, we will start to develop the evacuation plan. In this step, the concept of evacuation time map (Post et al. 2009, Wegscheider et al. 2011) will be used to spatially determine the time needed to evacuate toward specific destination inside or outside the tsunami affected areas. The conception displayed in Fig.14, briefly described that the evacuation time that influences the normal walking speed of human depends on: (1) location of tsunami safe areas and their properties, (2) land cover, (3) topography (slope), (4) population density, (5) age and gender distribution and (6) density of critical facilities (e.g. primary schools, hospitals). The location of safe areas determines the distance an evacuee has to cover. Land cover and slope alters the evacuee’s movement and speed (ADPC, 2007). Related to demographic factors it has been found in several studies that age and gender distributions significantly impact fatality rates due to contributions to longer evacuation times. In evacuation modeling studies, the impact of population density and evacuation properties of different group sizes are accounted for. The larger the group and the higher the population density the slower the evacuation process (Klüpfel, 2003). The existence of critical facilities such as schools and hospitals result in reduced response capabilities due to the presence of people needing special attention during an evacuation (Johnson, 2006). Obviously physical and mental disabilities are limiting factors for individuals to cope during a disaster.
Fig.14. Concept for evacuation time modeling
Vol. 31, No. 4, page 260 (2012)
The basic principle for the quantification of evacuation time is a GIS analysis to define the fastest path (best evacuation route) from a given point to the nearest safe area. Using the determined credible evacuation area, so called access points to safe areas can be assigned. Additionally, first characteristics of a safe area referred as temporary shelter areas for evacuation are determined (e.g. land cover, size, slope). A measure of travel costs is used which can be considered as travel time (evacuation time) needed when approaching the next safe area. In this concept, the accessibility to a safe area is calculated on a cost surface which consists of a regular two dimensional grid where each cell value represents the cost to travel through it depending on costs introduced by land cover, population density, slope, critical facility density, age and gender distribution. Using the cost weighted distance approach the time needed from each location (raster cell) within the credible evacuation area to the next safe area is calculated using the ArcGIS cost distance algorithm (ESRI, 2001). For Pacitan town, an evacuation time map with a scale of 1 : 25 000 will be produced showing areas where evacuation is/ is not possible within a certain time due to available capacity of evacuation buildings (if known) and the available evacuation time (based on numerical modelling). 4.3 Risk map As risk is conventionally expressed by the equation Risk = Hazard × Vulnerability, risk assessment is a logical outcome of the hazard and vulnerability assessment. Main objectives of the risk assessment were the identification of areas of high tsunami risk in terms of potential loss of life. Where high risk areas are identified, there is an urgent need for action by local authorities to improve the response capability of the population, thus reducing the risk. The identification of high risk areas raises the awareness of vulnerable “hotspots” and provides information vital to the support of emergency decision making. The official activities of planning and implementing risk reduction measures, like the construction of tsunami shelters, the governance of construction activities, the signposting of evacuation routes, or the installation of structural and natural coastal protection measures, need to be prioritized. The degree of risk is determined by a decision tree method as detailed explained in Wegscheider et al., (2011). 4.4 Evacuation planning and socialization processes Evacuation of people in risk areas is the first priority once a tsunami early warning is received and/or natural warning signs indicate the possibility of a tsunami. As the available time span between a warning and the impact of tsunami waves in Indonesia is generally very short, all necessary preparations need to be made in advance to ensure that as many people as possible get a chance to evacuate (Spahn et al., 2010). A five-step method for tsunami evacuation planning (Fig.15) was developed by GIZ-IS (GIZ-IS, 2010a) within the GITEWS project, enabling local authorities and other stakeholders in Indonesian communities to design, disseminate, test and improve tsunami evacuation plans. The approach will be implemented in Pacitan district for the next two years.
Vol. 31, No. 4, page 261 (2012)

The planning steps Topics to be discussed Output Step 1: Prepare for the planning
Mandates, planning team and resource persons, data and information, resources, planning process and timeframe
Work plan
Step 2: Understand your community’s tsunami risk
Hazard: inundation area and arrival time Vulnerability: physical exposure of population and facilities, capability to evacuate, preparedness and readiness to evacuate, early warning system Potential evacuation routes and shelter, high risk areas
Maps, data inventory, mind map and assessment report
Step3: Design your evacuation strategy and map
Evacuation strategy: evacuation time, evacuation zone(s), safe areas, assembly areas, modes of evacuation, evacuation shelter buildings, evacuation routes, when to (self-)evacuate Support during evacuation: traffic management, vulnerable facilities, evacuation signage
Preliminary evacuation plan: document that include map, strategy and recommendations; draft public evacuation map
Step 4: Assess, endorse and disseminate your evacuation plan
Public assessment of the plan, endorsement by local authorities, dissemination to institution and public, outreach strategy
Endorsed evacuation plan, dissemination and outreach plan
Step 5: Test, evaluate and improve your evacuation plan
Tsunami simulation exercises, means of observation and evaluation, revision of evacuation plan
Plan to test, evaluate and improve the evacuation plan
Fig.15. Five-step concept for tsunami evacuation planning (GIZ-IS, 2010a)
Vol. 31, No. 4, page 262 (2012)

5 CONCLUSIONS
We reported past, ongoing and future activities on developing an integrated tsunami mitigation in Pacitan Town, Indonesia. Started with the tsunami hazard assessment, the preliminary efforts on structural mitigation consist of warning equipments and coastal forest planting is conducted. In line with these efforts, close assistantship on strengthening the tsunami awareness and preparedness from district level down to individual/household level is planned. We expect that method and lessons we present in this paper can be applied in other tsunami prone cities in order to reduce the potential loss of life due to tsunami. REFERENCES ADPC (2007): EVACUATION ROUTES TOOLS ArcGIS toolbox - User’s manual.- Italian Ministry
for the Environment Land and Sea. Department for Environmental Research and Development, Bangkok, 88 pp.
Ando, M. (2011): Interviews With Survivors of Tohoku Earthquake, EOS transaction-AGU, 92 (46), 411-412. doi:10.1029/2011GL049580.
Dengler, L. (2005). The Role of Education in the National Tsunami Hazard Mitigation Program. Natural Hazards, 35(1), 141-153. doi:10.1007/s11069-004-2409-x
ESRI (2001): ArcGIS (TM) Spatial Analyst: Advanced GIS Spatial Analysis Using Raster and Vector Data., ESRI White Paper, Redlands, 17.
GIZ-IS (2010a): Planning for Tsunami Evacuations: A Guidebook for Local Authorities and other Stakeholder in Indonesian Communities. http://www.gitews.org/tsunami-kit/en/E4/tool/Guidebook%20Planning%20for%20Tsunami%20Evacuations.pdf (July 19, 2012)
GIZ-IS (2010b): Knowledge and Awareness for Tsunami Preparedness – Introduction. http://www.gitews.org/tsunami-kit/en/E5/introduction/Introduction%20to%20Knowledge%20and%20Awareness.pdf (July 19, 2012)
GIZ-IS (2010c):Guidebook – Dissemination of Tsunami Early Warning at the Local Level in Indonesia. http://www.gitews.org/tsunami-kit/en/E3/tool/Guidebook%20Dissemination%20of%20Early%20Warning%20at%20the%20Local%20Level%20in%20Indonesia.pdf (July 23, 2012)
Hayden, M.H., Drobot, S., et al., 2007. Information sources for flash flood warnings in Denver, CO and Austin, TX. Environmental Hazards 7 (3), 211–219
Vol. 31, No. 4, page 263 (2012)

Imamura, F., & Abe, I. (2009). History and Challenge of Tsunami Warning Systems in Japan. Journal of Disaster Research (JDR), 4(4), 267-271.
Johnson, C. W. (2006): Using Computer Simulations to Support A Risk-Based Approach For Hospital Evacuation.
Khomarudin, R.M., et al. (2010): Tsunami Risk and Vulnerability: Remote Sensing and GIS Approaches for Surface Roughness Determination, Settlement Mapping and Population Distribution Modeling. Dissertation, LMU München: Faculty of Geosciences.
Klüpfel, H. L. (2003): A Cellular Automaton Model for Crowd Movement and Egress Simulation, Ph.D., Universität Duisburg-Essen.
McAdoo, B. G., Moore, A., & Baumwoll, J. (2008). Indigenous knowledge and the near field population response during the 2007 Solomon Islands tsunami. Natural Hazards, 48(1), 73-82. doi:10.1007/s11069-008-9249-z
McAdoo B, Dengler L, Titov V, Prasetya G (2006) Smong: how an oral history saved thousands on Indonesia’s Simeulue Island. Earthq Spectra 22(S3):661–669
Muhari, A., Diposaptono, S., & Imamura, F. (2007). Toward an Integrated Tsunami Disaster Mitigation : Lessons Learned from previous tsunami events in Indonesia, Journal of Natural Disaster Sciences (JNDS), 29 (1), 13-19.
Shuto, N., & Fujima, K. (2009). A short history of tsunami research and countermeasures in Japan. Proceedings of the Japan Academy, Series B, 85(8), 267-275. doi:10.2183/pjab.85.267
Spahn et al. (2010): Experience from three years of local capacity development for tsunami early warning in Indonesia: challenges, lessons and the way ahead. In: Natural Hazards and Earth System Sciences (10), pp. 1411-1429.
Strunz, G., et al. (2011): Tsunami risk assessment in Indonesia. In: Natural Hazards and Earth System
Sciences (11), pp. 67-82.
Wegscheider, S. et al. (2011): Generating tsunami risk knowledge at community level as a base for
planning and implementation of risk reduction strategies. In: Natural Hazards and Earth System Sciences (11), pp. 249-258.
SHUTO, N. (1985) ‘‘Effects and limit of coastal forests against tsunami attack,’’ Proceedings of the Coastal Engineering, JSCE, 32, 465–469 (in Japanese).
Vol. 31, No. 4, page 264 (2012)
Gurgel, K.-W., Dzvonkovskaya, A., Pohlmann, T., Schlick, T., & Gill, E. (2011). Simulation and detection of tsunami signatures in ocean surface currents measured by HF radar. Ocean Dynamics, 61(10), 1495–1507. doi:10.1007/s10236-011-0420-9
Börner, T., Galletti, M., Marquart, N. P., & Krieger, G. (2010). Concept study of radar sensors for near-field tsunami early warning. Natural Hazards and Earth System Science, 10(9), 1957–1964. doi:10.5194/nhess-10-1957-2010
Shuto, N. (1993). Tsunami intensity and disasters, in Tsunami in the world, Edited by Stefano Tinti, Kluwer Academic Publisher, 197-216 pp
Harada and Imamura. (2005). Effects of coastal forest on tsunami hazard mitigation – a preliminary investigation. Advances in Natural and Technological Hazards Research, Vol. 23 (II), 279-292 pp.
Lipa, B., Barrick, D., Saitoh, S.-I., Ishikawa, Y., Awaji, T., Largier, J., & Garfield, N. (2011). Japan Tsunami Current Flows Observed by HF Radars on Two Continents. Remote Sensing, 3(8), 1663–1679. doi:10.3390/rs3081663
National Police Agency of Japan (NPA), List of identified victims of tsunami Japan in Miyagi, Iwate, and Fukushima Prefecture. 2011 (in Japanese). Available at: http://www.npa.go.jp/archive/keibi/biki/mimoto/identity.htm , last accessed 20 May 2011
Rudloff, A. lauterjung, J. Munch, U. Tinti, S. (2009). Preface The GITEWS Project ( German-Indonesian Tsunami Early Warning System ), Natural Hazard and Earth System Sciece-NHESS, 1381–1382.
Lauterjung, J., Münch, U., & Rudloff, a. (2010). The challenge of installing a tsunami early warning system in the vicinity of the Sunda Arc, Indonesia. Natural Hazards and Earth System Science, 10(4), 641–646. doi:10.5194/nhess-10-641-2010
Pariatmono. (2012). The Influence of Mentawai Tsunami to Public Policy on Tsunami Warning in Indonesia, Journal of Disaster Research Vol. 7 (1), 102-106 pp
Muhari, A., Imamura, F., Natawidjaja D. H., Post, J., Latief, H., Ismail F. A.: Tsunami mitigation efforts with pTA in West Sumatra Province, Indonesia, Journal of Earthquake and Tsunami 4, 341–368, 2010
Khafid and Handayani. S.: Report of the tide observation during the 2011 Japan tsunami using BAKOSURTANAL stations in Papua, North Molucca and North Sulawesi, National Agency for Survey and Mapping, Internal report, 2011.
Vol. 31, No. 4, page 265 (2012)

Koshimura, S., Imamura, F., & Shuto, N. (2001). Characteristics of Tsunamis Propagating over Oceanic Ridges : Numerical Simulation of the 1996 Irian Jaya Earthquake Tsunami, 213–229.
Indonesian Rapid Assessment Team (I-RAPID). (2012). Evaluation of the Indonesian tsunami early warning system on the April 2012 Aceh earthquake. (In Indonesia).
Japan Rapid Assessment Team (J-RAPID). (2012). Questionnaire Survey after the April 2012 Aceh earthquake.
Katada, T. (2011). No miracle that 99.8% of the school kids survived: How the children in Kamaishi got through the tsunami. Wedge Infinity http://wedge.ismedia.jp/articles/-/1334?page=1 last accessed July 30, 2012
K.R. Newcomb and Mccann, W. R. (1987). Seismic history and seismotectonic of the Sunda Arc, Journal Geophysical Research, Vol 92 (4), 421–439.
Gusman, a. R., Tanioka, Y., Matsumoto, H., & Iwasaki, S.-I. (2009). Analysis of the Tsunami Generated by the Great 1977 Sumba Earthquake that Occurred in Indonesia. Bulletin of the Seismological Society of America, 99(4), 2169–2179. doi:10.1785/0120080324
Polet, J., & Kanamori, H. (2000). Shallow subduction zone earthquakes and their tsunamigenic potential. Geophysical Journal International, 142(3), 684–702. doi:10.1046/j.1365-246x.2000.00205.x
Abercrombie, R. E., Antolik, M., & Felzer, K. (2001). The 1994 Java tsunami earthquake : Slip over a subducting seamount, Journal of Geophysical Research, Vol 106 (B4), 6595–6607.
Tsuji, Y., & Synolakis, C. E. (1995). Field Survey , of the East Java Earthquake and Tsunami of June 3 1994, Pure and Applied Geophysics, Vol 144 (3/4), 839-854 pp
Fritz, H. M., Kongko, W., Moore, A., McAdoo, B., Goff, J., Harbitz, C., Uslu, B., et al. (2007). Extreme runup from the 17 July 2006 Java tsunami. Geophysical Research Letters, 34(12), 1–5. doi:10.1029/2007GL029404
Ammon, C. J., Kanamori, H., Lay, T., & Velasco, A. a. (2006). The 17 July 2006 Java tsunami earthquake. Geophysical Research Letters, 33(24), 1–5. doi:10.1029/2006GL028005
Coppola, D. P. 2007, Introduction to international disaster management, Elsevier Publication, 175 pp
Vol. 31, No. 4, page 266 (2012)

Shuto, N., & Fujima, K. (2009). A short history of tsunami research and countermeasures in Japan. Proceedings of the Japan Academy, Series B, 85(8), 267–275. doi:10.2183/pjab.85.267
Imamura, F.: Tsunami counter-measure in Japan: could people evacuate after receiving a warning?, in “Know Risk,” United Nation – ISDR, 223 pp, 2005
Bernard, E. N. (2001) The U.S. National Tsunami Hazard Mitigation Program Summary, ITS proceeding, NTHMP review session, pp 21–27.
Bernard, E. N. (2005). The U. S. National Tsunami Hazard Mitigation Program : A Successful State – Federal Partnership, Natural Hazard (35), 5–24.
Jonientz-Trisler, C., Simmons, R. S., Yanagi, B. S., Crawford, G. L., Darienzo, M., Eisner, R. K., Petty, E., et al. (2005). Planning for Tsunami-Resilient Communities. Natural Hazards, 35(1), 121–139. doi:10.1007/s11069-004-2408-y
Münch, U., Rudloff, a., & Lauterjung, J. (2011). Postface “The GITEWS Project – results, summary and outlook.” Natural Hazards and Earth System Science, 11(3), 765–769. doi:10.5194/nhess-11-765-2011
KOGAMI (2008), Tsunami Alert Community, http://kogami.or.id/ .
Rafliana, I. (2012). Disaster Education in Indonesia : Learning How It Works from Six Years of Experience After Indian Ocean Tsunami in 2004, 7(1), 83–91.
Latief, H., Puspito, N. T., and Imamura, F.: Tsunami Catalog and Zones in Indonesia, Journal of Natural Disaster Science, 22(1), 25–43, 2000.Okada 1985
Imamura, F.: Review of tsunami simulation with a finite difference method, in “Long wave runup models,” H. Yeh, P. Liu, and C. Synolakis, eds., World Scientific, Singapore, 25–42, 1996Roemer et al, 2012
Aburaya, T. and Imamura, F.: Proposal of a tsunami run-up simulation using combined equivalent roughness, Annual Journal of Coastal Engineering, JSCE 49, 276-280. (in Japanese)Muhari et al. (2011).
Federal Emergency Management Agency (FEMA): Coastal construction manual, Third Edition (FEMA 55), 296 pp., 2003
Kotani, M., Imamura, F. & Shuto, N.: Tsunami run-up simulation and damage estimation by using geographical information system, Proc. Coastal Engineering, JSCE 45, 356–360 (in Japanese)
Vol. 31, No. 4, page 267 (2012)