science comprehensive mapping of spectral classes in the imager
TRANSCRIPT
MARS MARS INFORMATICS
The International Journal of Mars Science and Exploration Open Access Journals Science
Comprehensive mapping of spectral classes in the imager for Mars Pathfinder Super Pan
1William H. Farrand , Erzsébet Merényi2, Jeffrey R. Johnson3 and James F. Bell III4
1 2Space Science Institute, 4750 Walnut Street #205, Boulder, CO 80301 USA [email protected]; Department of Electrical Engineering, Rice University, Houston, TX 77005 USA; 3 4Astrogeology Team, U.S. Geological Survey, Flagstaff, AZ 86001 USA; Department of Astronomy, Cornell University, Ithaca, NY 14853 USA
Citation: Mars 4, 33-55, 2008; doi:10.1555/mars.2008.0004History: Submitted November 9, 2007; Reviewed: April 21, 2008; Revised June 5, 2008; Accepted June 5, 2008; Published July 11, 2008 Editor: Oded Aharonson, California Institute of Technology Reviewers: Michael R. Mendenhall, Air Force Institute of Technology; R. Aileen Yingst, University of Wisconsin Green Bay Open Access: Copyright © 2008 Farrand et al. This is an open-access paper distributed under the terms of a Creative Commons Attribution License, which permits unrestricted use, distribution, and reproduction in any medium, provided the original work is properly cited.
Abstract
Background: Mars Pathfinder landed on the Ares Vallis outflow channel on July 4, 1997. The Mars Pathfinder’s Imager for Mars Pathfinder (IMP) collected the “Super Pan”, a 360 degree panorama consisting of all 8 left eye filters and all 7 right eye filters in the IMP’s 430 to 1010 nm visible and near infrared (VNIR) spectral range. Previous studies utilizing the Super Pan identified a set of spectral classes corresponding to several rock and soil types called Gray Rocks, Red Rocks, Pink Rocks, Maroon Rocks, Bright Red Drift, and Brown Soil. Later studies identified another unique rock spectral class, Black Rock.
Method: In this study, we used a Self-Organizing Map (SOM) Artificial Neural Network (ANN) classification architecture to perform both unsupervised clustering analyses and supervised classifications on several large segments of the Super Pan.
Conclusion: The unsupervised clustering in the present study identified over 20 clusters and we concentrate on those most closely related either to previously identified spectral classes or to other geologically significant units. Rock spectral clusters included several occurrences of the predominant Gray Rock class and two occurrences of the less common Black Rock class. Our clustering and classification analyses also identified far-field spectral classes that occur as layers on the slopes of the Twin Peaks which had not been isolated previously. Spectral parameter plots of the means of the classes used in the supervised classifications differ from those of previous studies. Many of these class means plot along what was previously deemed the “secondary” trend (increasing 900 nm band depth with increasing red/blue ratio). We interpret these as representative of soils and of rock surface coatings rather than windswept, presumably bare, rock surfaces. The class with the highest 530 nm band depth and highest red/blue ratio and accompanying relatively high 900 nm band depth corresponds to the previously identified Brown Soil class, which we interpret as a material that might be associated with ancient periods where conditions were wet enough to allow some development of ferric oxide crystalline minerals.
Introduction
Spacecraft landed on other planetary surfaces provide the ability to perform in situ measurements and up-close remote sensing observations. The value of such missions for the study of Mars was proven with the Viking Landers and has been reaffirmed with the success of the Mars Exploration Rover (MER) mission (e.g., Squyres et al. 2004; Squyres et al. 2004). Between these two sets of missions, the Mars Pathfinder (MPF) mission provided a stepping stone from
single location lander science to extensive roving capabilities, because the mission had some instruments fixed on its landing platform and others mounted on the mobile Sojourner rover (Golombek et al. 1997). Each of the five successful landed spacecraft on Mars has provided insights into very different sites. Most of them, with the exception of the Opportunity rover, landed in high to intermediate albedo regions on Mars. These regions were landscapes covered with bright, mobile dust, dark rocks (with variable degrees of
33

Farrand et al: Mars, 4, 33-55, 2008
coating), and other darker soils. In this investigation we reanalyzed a set of multispectral data from the so-called “Super Pan” acquired by the MPF Imager for Mars Pathfinder (IMP; Smith et al. 1997). We performed this analysis using Self Organizing Maps (SOMs) for unsupervised segmentation (clustering) and SOM-hybrid Artificial Neural Networks (ANN) for supervised classification following the interpretation and labeling of clusters produced by the SOM. This analysis has provided more insights into the nature of the MPF landing site in Ares Vallis. We also applied some results from the exploration of the Gusev crater site by the MER Spirit rover to the interpretation of the observations made earlier at the MPF site.
The MPF landing site is on the Ares Vallis floodplain at approximately 19.30° N, 33.52° W. This is a region with an albedo intermediate between Martian bright and dark regions. It was noted by Wyatt et al. (2003) that the region is also intermediate between the basaltic “surface type 1” and, nominally, more andesitic or weathered “surface type 2” spectral classes identified by the Mars Global Surveyor TES (Bandfield et al. 2000; Wyatt and McSween 2002). The pre-landing expectation was that the landing site might contain a variety of rocks transported from both the ancient Noachian highlands and the Hesperian ridged plains by outflow channel events (Golombek et al. 1997). Early results, based on Alpha Particle X-Ray Spectrometer (APXS) measurements and IMP multispectral imaging measurements, indicated that only a single lithology, comparable to a terrestrial basaltic andesite (with several dust coated variants) was likely present at the site (McSween et al. 1999). The single rock class observed in IMP multispectral data was dubbed “Gray Rock”. Other color classes of rock, dubbed “Maroon Rock” and “Red Rock” based on their false-color multispectral properties, were deemed to be Gray Rocks with different coatings (McSween et al. 1999; Barnouin-Jha et al. 2000). Another class, “Pink Rock” was considered to be either another variety of coated rock or a highly indurated soil (Moore et al. 1999). Soil at the MPF landing site consisted of bright drift material, darker fines, an intermediate albedo “Brown Soil”, and a spectrally distinct layer beneath the surface veneer (“Disturbed Soil”) (Bell et al. 2000). Spectral classes identified in previous studies were separated by McSween et al. (1999) into two “trends”. As described in more detail below, the “primary trend” classes, Gray, Red, and Pink rocks and Bright Drift, fall on a common trend line in plots of 530 nm band depth vs. 670/440 nm ratio. The “secondary trend” classes, Maroon Rocks and Brown Soils, follow a separate trend line on these plots.
More recent studies have proposed the presence of at least one more distinct lithology at the MPF site, the “Black Rock” class. The Black Rock spectral class differs from the Gray Rock spectral class in that it has a shorter wavelength relative reflectance maximum at 670 nm compared to Gray Rock’s 750 nm reflectance peak, and a relatively strong long wavelength absorption band centered at 930 nm where the Gray Rock had a weak absorption at or longwards of 1000
nm (Murchie et al. 2000; Bell et al. 2002). Initial recognition of this spectral class was made in near field (i.e., near the lander) observations of pebble- to cobble-sized examples. More recent work has demonstrated larger occurrences of Black Rock in the far field (Murchie et al. 2003; Farrand et al. 2004). Variability in the spectral signature of the Black Rock class was noted by Bell et al. (2002). Murchie et al. (2003) noted high fractions of a material with a 900 nm band, in their estimation- the “Black Rock” spectral class, in the far field on the flanks of North Twin Peak and associated with Big Crater. These authors also performed a comprehensive examination of the morphologic and spectral properties of rocks observable in the Super Pan and found a number of relationships between spectral parameters and shape classes (such as were also described recently by Yingst et al. 2007).
Questions remain about observations made during Pathfinder’s brief mission. These include questions about the nature of the Gray Rock material and whether Black Rock is related to Gray Rock (perhaps they are just "fresher" surfaces of Gray Rock). Such questions can be addressed through reanalysis of datasets collected by MPF. In this study, multispectral IMP observations are reexamined using advanced SOM and SOM-hybrid ANN clustering and classification techniques. Results from class maps obtained from these analyses are used to obtain more complete statistics on spectral classes present at the MPF landing site and to relate the spectral characteristics of classes obtained from this work to those identified in earlier studies. The nature of some of the classes is addressed by relating features observed at the MPF landing site to those observed by similar multispectral investigations at the MER landing sites. In particular, Spirit’s landing site at Gusev crater resembles the MPF landing site in several important ways, in that it is in a bright terrain with bright soils and dark rocks.
Another outstanding question is related to the nature of the observed soils. While the Bright Drift material is known to be related to global dust observed at other landing sites, the nature of the other soil classes: “Dark Soil”, “Brown Soil”, “Disturbed Soil”, and a class noted by Bell et al. (2002), “Rock Soil”, is not so well understood. Bell et al. (2000) noted that Dark Soil might simply be a coarser grained version of existing bright soils at the landing site and that Disturbed Soil might be Brown Soil exposed by the action of the Sojourner rover’s wheels and mixed with some fraction of Bright Drift. Likewise, examples of the Rock Soil class were described by Bell et al. (2002) as a mechanically weathered soil class, occurring notably close to boulders and also armoring drifts such as those typified by Mermaid dune.
In this study we have sought to obtain additional information on the nature of the MPF landing site from the IMP Super Pan through comprehensive clustering and classification of the surface spectral signatures in several of the Super Pan octants. By mapping spectral variations of interest consistently across extensive areas we collected significant statistics for these spectral classes from which geologic trends may be derived with higher confidence than from
34
http://marsjournal.org
Farrand et al: Mars, 4, 33-55, 2008
analyses involving smaller numbers of pixels. Previous studies had examined the Super Pan by making spectral parameter maps of the data (e.g., McSween et al. 1999) and through spectral mixture analysis of the data (Bell et al. 2002). However, large-scale spectral classification of the entire data set has not been performed using more sophisticated methods. By obtaining larger clusters of pixels in select spectral classes, additional information can be derived on their nature as revealed by their spectral signature and degree of spectral variability. In addition, we anticipated the potential to observe spatial patterns among a number of classes which could provide information on the nature and geologic significance of these spectral classes. Both the neural clustering and supervised classification that we use are very sensitive to subtle but consistent spectral differences. In this paper, we report on the results of their application to several large azimuthal segments or "octants" of the Super Pan. We address how these classifications were performed and the significance of the results with regards to the outstanding scientific questions noted above.
Data
The IMP consisted of a mast-mounted CCD focal plane array with optics separated by 15 cm for stereoscopic imaging capability. It utilized a 512 × 512 CCD that was split in half to accommodate measurements from each “eye”. Identical 248 × 256 pixel subarrays were allocated to each eye resulting in a 14.0° × 14.4° field of view. The optics’ angular resolution of 1 mrad/pixel yielded a spatial resolution of approximately 1 mm/pixel to 1 cm/pixel for objects 1 to 10 m from the camera, respectively. Color information was provided in each eye by a filter wheel. Band centers and full-width half-maximum (FWHM) information for the resulting spectral channels are provided in Table 1. The 443 and 671 nm filters which are present in each eye, provided blue and red stereo coverage, respectively. These two filters plus 10 more at 480, 531, 600, 752, 802, 858, 898, 931, 968, and 1003 nm constitute the 12 “geology bands” used for most multispectral assessments. Additional details about the IMP optics and electronics can be found in Smith et al. (1997).
The Super Pan is a nearly comprehensive 360° view around the lander in all 12 geology filters, transmitted at an approximately 2:1 compression ratio (Gaddis et al. 1999). It
was separated into eight separate image mosaics (“octants” labeled S0181 through S0188), with each mosaic consisting of many separate but contiguous camera azimuth and elevation pointing positions (each referred to here as “segments”). The octants are laterally contiguous to each other. The segments were collected as mission planning allowed at various points over the lifetime of the mission, but the Super Pan was never completed with the result that octants appear to have blocky edges or might appear to have holes where segments were never collected or are missing spectral bands. Version 3 of the IMP calibration algorithm (Johnson et al. 2001) was used to calibrate the images to relative reflectance (R*) using images of the radiometric calibration targets (RCTs) acquired close in time to a given Super Pan image sequence (Reid et al. 1999). There are a number of sources of potential systematic errors in the IMP calibration, including temporal and viewing geometry (phase function) differences between images of the scene and of the RCTs; the changing balance of direct vs. diffuse illumination of the surface, depending on topographic slope, viewing azimuth, and time of day; and changes in the scattering properties of atmospheric aerosols (e.g., Tomasko et al. 1999; Thomas et al. 1999). Version 3 of the IMP calibration algorithm (Johnson et al. 2001; Reid et al. 1999) compensates for some of these potential sources of systematic errors by converting the data to apparent radiance factor (the radiance reflected from the surface divided by the radiance reflected from a Lambertian calibration target with an incidence angle of zero). R* was obtained for each segment by dividing radiance factor by the cosine of the incidence angle for that segment (Reid et al. 1999). The algorithm used an approximation to the sky model of Tomasko et al. (1999) to convert the scene brightnesses to values that could have been predicted if they had been observed simultaneously with the RCT images.
The USGS geometric control network of the landing site was used with Integrated Software for Imagers and Spectrometers (ISIS) algorithms to compute the appropriate map projection parameters (Kirk et al. 1999). Using a single pixel resampling, the sub-pixel registration offsets among different bands for a given scene and camera eye and projection parameters were simultaneously used to produce separate left- and right-eye multispectral image mosaics for each of the Super Pan octants. As noted, the effect of diffuse illumination on IMP recorded surface spectra has been accounted for to a certain extent, but not entirely. The effect of atmospheric scattering decreases with increasing wavelength; hence, the main effect of diffuse illumination is at shorter (right eye dominated) wavelengths. To further mitigate effects from skylight, initial classifications and interpretations were performed with the longer wavelength left eye data. This practice of relying most strongly on left eye data in order to mitigate skylight effects was also followed by
Table 1. Band centers and full width half maximum (FWHM) band widths of IMP spectral bands. All values are in nanometers.
Left band center
Left FWHM Right band center
Right FWHM
443 26 443 26 671 20 480 27 802 21 531 30 858 34 600 21 898 41 671 20 931 27 752 19 968 31 967 30 Bell et al. (2002). Right eye data were also
deemed valuable and were classified and results compared with the left eye classifications with the knowledge that diffuse illumination could have had a greater influence.
1003 29
A problem in past analyses of the IMP Super Pan has been
35
http://marsjournal.org
Farrand et al: Mars, 4, 33-55, 2008
Here, t is the index of the learning step (time), a(t) is a learning rate, and h
that the individual segments composing each octant were collected at different times with different viewing geometries, the result being that image statistics varied between adjacent segments.
j,i(x)(t) is the so-called neighborhood function that determines the degree of adaptation for each neuron’s weight as a function of the grid distance of neuron j from the winner neuron i. Both a(t) and h
Bell et al. (2002) overcame this impediment by working on each octant in a segment-by-segment fashion and then the overall results were considered. In the present study we used a version of the Super Pan in which these segment-to-segment disparities have been substantially mitigated (Murchie et al. 2003), but between some sections differences remain which are substantial enough to cause the clustering algorithm to produce a set of alternate spectral classes in those segments. The effects of these residual calibration differences on the classification are discussed in more detail below.
j,i(x)(t) should decrease with time.
After convergence of the learning (when the prototype vectors no longer show appreciable change), and assuming that the learning went correctly, groups of similar prototypes will be attached to neurons that form contiguous neighborhoods in the SOM grid. This allows identification of groups of similar prototypes by evaluation of the Euclidean distances of the weights (prototypes) of adjacent neurons in the grid. Large distances between weights of adjacent neurons delineate cluster boundaries, whereas small distances indicate that the respective prototypes belong to the same similarity group (cluster). Clustering of the prototypes into these similarity groups on the SOM grid is usually done by visualizing the weight distances in some form and overlaying on the SOM grid, then applying semi-automated methods to capture the clusters of prototypes. After this, each data point will be automatically assigned to the cluster of the prototype that represents the particular data point.
Processing approach
Our analyses involve both unsupervised clustering, for exploratory assessment and mapping of all possible spectral groups in a scene; and subsequent supervised classification, after interpretation and labeling of geologically meaningful clusters. In the following, the term “clustering” always refers to unsupervised segmentation, and correspondingly, “cluster” and “cluster map” refer to the products of unsupervised segmentation. Similarly, “classification” always refers to supervised classification and “class” and “class map” refer to the products of supervised classification (e.g., Schowengerdt 1997).
This 2-stage clustering has two advantages: the VQ phase reduces noise, and the clustering need only be done for the prototypes, which saves computational cost. The SOM approach has additional, unique, advantages: the placement of the prototypes in the data space by adaptive learning provides, in principle, the best approximation of the probability distribution function (pdf) of the data with the given number of prototypes. The spatially ordered layout of the prototypes on the SOM grid facilitates the detection of the cluster boundaries by providing a 2-dimensional rendering of the data structure (for an overview, see Kohonen 1997 and
The main strength of our analyses is in the use of Self-Organizing Maps (SOMs). The SOM Artificial Neural Network paradigm was proposed in the early 1980s (Kohonen 1997), primarily for unsupervised clustering. A Kohonen SOM (KSOM) is a rigid 1-, 2- or sometimes higher dimensional grid of artificial neurons, where each neuron j has a weight vector wj attached to it. The weight vectors have the same dimensionality as the input data space. Clustering is performed in two stages. The first stage is a Vector Quantization (VQ), whereby the weight vectors of the neurons are iteratively adjusted through unsupervised learning, so that they become quantization prototypes of the data and will be distributed in the data space to best model the data. A unique property of SOM VQ is that the quantization prototypes also become spatially ordered on the rigid SOM grid according to their similarity relationships: prototypes that are closer to one another in the data space will be mapped to neurons that are close to each other on the SOM grid, and vice versa. This is achieved by repetitive application of the following learning steps:
Villmann et al. 2003). These properties are very powerful and enable the detection of sophisticated, many-cluster data structures from multi- to hyperspectral data. SOMs are capable of improved identification of complicated data structures where other clustering methods fall short (e.g., Merényi et al. 2007a).
The disadvantage of SOM clustering is that they need very long training for the VQ phase, because ANNs are inherently massively parallel but are usually run on sequential computers. This disadvantage can be eliminated by appropriate hardware implementations such as the utilization of a parallel processing architecture.
We use SOMs with non-standard features (e.g., Villmann et 1) Competition: Select an input vector x randomly. The
neuron whose weight is closest to x “wins”. al. 2003
where i and j are grid indices of neurons (not to be confused with a spatial location within the image).
2) Synaptic adaptation:
; Merényi et al. 2007b) that allow more precise structure detection than with a KSOM, for data with high dimensionality, large volume, and complex structure with many clusters of widely varying statistics. For example, we can control the size of the areal representation of clusters in the SOM grid, to ensure that very small clusters that may be the most interesting to discover, will get their fair chance for being represented and thus can be discovered. The mechanism for this is called SOM magnification and it can force information into a theoretically optimum placement of
i(x) = argmin x −w j , j =1,...,N
w j (t +1) = w j (t)+ a(t)h j,i(x)(t)(x −w j (t))
36
http://marsjournal.org

Farrand et al: Mars, 4, 33-55, 2008
the prototypes in data space (maximum entropy mapping), which most faithfully models the probability distribution function (pdf). The KSOM is not a maximum entropy mapping, and therefore can unfavorably distort representation of some clusters. With magnification control, we can also force more-than-proportional areal representation of rare clusters (without knowing that they exist in the data), and thereby increase the probability of their detection (Merényi et al. 2007b; Merényi et al. 2004a; Merényi et al. 2004b).
A converged SOM contains knowledge about the structure of the input data. This lends substantial support for subsequent supervised classification, if the SOM is used as a hidden layer in a feed-forward ANN architecture where a categorization output layer is attached to the SOM. We call this architecture an SOM-hybrid ANN. Details of it are given in previous works (e.g., Kohonen 1997; Merényi et al. 2004a, Howell et al. 1994). In this SOM-hybrid architecture, the SOM is trained first in an unsupervised mode, allowing it to form its own view of the data manifold. Then supervised training of the output layer is turned on. The converged SOM will effectively prevent the output layer from learning labels inconsistent with the known cluster structure. That is to say, representative samples of a given cluster must be consistently labeled or the SOM will ignore the inconsistent labels. Thus, data from subclusters of a larger cluster could be provided the same label (that of the larger cluster) and be mapped together, but samples from separate clusters given the same label will be ignored. This setup is easier to train than, for example, the popular back propagation ANN (e.g., Rumelhart et al. 1986; Lippmann 1987), helps achieve higher classification accuracy, and needs less labeled training data to achieve high accuracy (e.g., Howell et al. 1994).
The following methodology was applied for the processing of the Super Pan octants: first, we performed detailed cluster analysis of octant S0184 analyzing first the 8 band left eye and then the 7 band right eye IMP data. This provided a comprehensive map (noting again that there are gaps of coverage in the maps where component segments were never collected or where bands can be missing from a segment) of the spatial distribution of spectrally similar groups for each of those octants. We then examined the resulting clusters for geologic interpretation, comparing the mean spectra of the clusters with known signatures and with results from other analyses, and labeled the meaningful clusters for the purpose of subsequent supervised classification. Some clusters that clearly represented the same surface material, but that had slight differences due to the aforementioned residual calibration differences, were merged by labeling them as one class. Likewise, some geologically meaningful units that may have been split into more than one spectral cluster, were merged. Some clusters that could not be interpreted or that were deemed suspect (for example, clusters from shaded regions) were left out of the supervised classification. Due to time and resource limitations, clustering analyses were performed only on the left and right eye S0184 octant data. However, supervised classifications were performed on octants S0182, S0183, S0184, S0185, S0186, and S0187
using the two hybrid ANNs that we had trained with the training samples and labels derived from the S0184 left and right octants, respectively. In principle, this supervised classification would be effective if all octants have a similar set of materials, and if calibration differences and effects of viewing geometry were exceedingly small across all image segments. However, in practice the quality of the class maps decreased (as judged by an increase in the number of unclassified pixels) with increasing distance from octant S0184 (making classifications of S0181 and S0188 untenable). We interpret this effect as being due to calibration offsets between octants. Rather than performing clustering analyses on each octant and coming up with a set of training samples from each, we restricted our analysis of supervised classification results primarily to the S0183, S0184, and S0185 octants.
As a preprocessing step, before clustering and classification, the spectra were normalized, i.e., each spectrum (data vector) was divided by its Euclidean norm. This treatment cancels linear illumination (slope) effects while preserving the spectral relationships, thus, unless significant photometric effects for a given surface type exist (e.g., Johnson et al. 1999), spectra of the same material will look the same regardless of the geometry. Unfortunately, geometric albedo will also be “equalized” by this normalization, so if two materials only differ in albedo they become indistinguishable and will be assigned to the same spectral cluster / class.
In order to bridge analyses done from an earlier study (Bell et al. 2002) with this one, some unique classes were mapped using an approach related to the spectral mixture analysis (SMA) approach (Adams et al. 1993) pursued by Bell et al. (2002). Specifically, in some octants, the Black Rock spectral class was mapped using the Constrained Energy Minimization (CEM) approach (Harsanyi 1993;
Farrand and Harsanyi 1997). The CEM approach is related to the SMA approach in that it determines the fractional abundance of some endmember or target material. However, unlike SMA, not all endmember materials need be identified. Instead the scene is essentially decomposed in terms of a desired target spectrum and undesired background spectra. Pixels devoid of the target signature are constrained to be nulled to zero and those pixels that are identical to the target signature are constrained to equal one. Application of the CEM methodology to map out Black Rock occurrences in individual octants was effective since the Black Rock occurrences represent an areally minor portion of the octant and thus could not be well modeled as SMA endmembers; i.e., as materials that significantly contributed to the signal from pixels across the scene.
Clusters and classes that were mapped with the SOM ANN approach were subjected to closer examination, and compared to previous studies, by calculating and plotting out the mean values for spectral parameters of these clusters and classes. Spectral parameters used were a subset of those listed by Bell et al. (2000).
37
http://marsjournal.org

Farrand et al: Mars, 4, 33-55, 2008
Where practical, the same designations (A, B, C, etc.) have been maintained for similar materials in both left eye and right eye clustering analyses and classifications. Obviously, since the two eyes measure different portions of the VNIR spectrum, the spectra obtained for these classes from the left and right eyes are distinct. However, while there is generally good agreement in the cluster and class maps derived from each eye, there are differences that affect the spectral parameter analysis discussed below.
Analysis Results
Unsupervised clustering of the Super Pan Figure 1 shows cluster maps derived from the left eye and right eye data for the S0184 octant. A key at the bottom of each image relates each color to a cluster. The ability of the SOM clustering to discriminate subtle spectral differences resulted in a relatively large number of clusters for each eye. These clusters include several that are restricted to shadows. Since these were derived from areas dominated by skylight, they are not considered further in this discussion. Supervised classification of Super Pan octants
Since some materials comprised multiple clusters, subsequent supervised classifications were performed following labeling of clusters according to geologic meaning. Training samples were selected from the resulting significant clusters noted above. In the case of Brown Soil, where, in the left eye cluster analysis, that unit was described by clusters that primarily described other soil classes, a single class corresponding to that one material was defined by selecting training samples across all pertinent clusters and grouping them into a single new class. As noted above, the Gray Rock class was described by several clusters; however, in this instance these clusters were translated into corresponding classes instead of amalgamating them into a single class so that the distribution of these spectral units might be tracked. Table 2 lists spectral classes identified in previous studies and how classes utilized in this study relate to them.
As was noted above, even though segment-to-segment radiometric and calibration differences are muted in the version of the Super Pan used in this study, they have not been entirely eliminated, hence the patchy appearance of the S0184 left eye cluster map and the fact that a single material might be mapped by different clusters in different segments of the octant. For example, in most of the segments of the octant, cluster H (orange) represents Bright Drift, but in some segments, cluster L (brown) maps similar drifts.
Previously recognized spectral classes were interpreted by the unsupervised segmentation in one of several different ways. Some previously identified spectral classes, such as the Gray Rock class, were split into multiple clusters, indicating spectral variations within the previously monolithic class; however in this case, the spectral variations are not attributed to substantive compositional variability within the rock substrate, but rather to changes in the coating of the rock and/or viewing geometry effects.
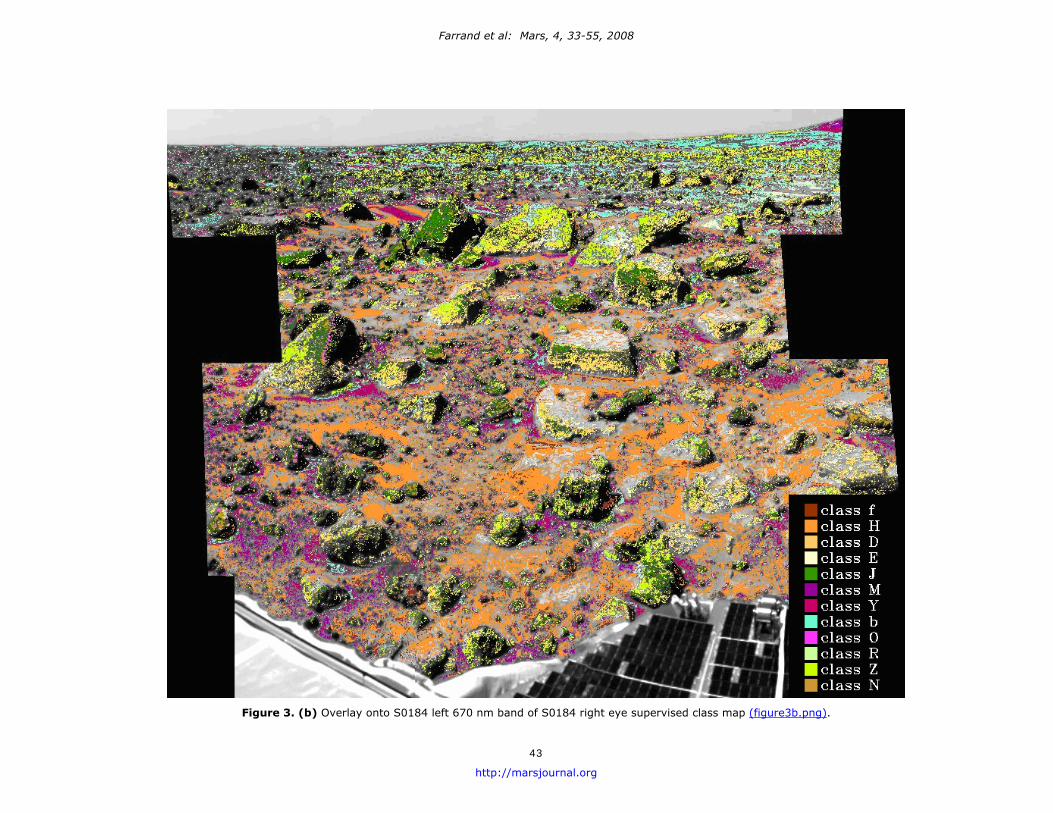
Training sample spectra from each of the classes used in the supervised classifications are shown in Figure 2. Supervised class maps of the S0184 left and right eye octants that resulted from this methodology as well as left eye class maps
Black Rock represents an example where a previously described single spectral class is represented by two clusters corresponding to two distinct spectral signatures that are interpreted as representing real compositional variability. In another circumstance, a previously recognized class was not uniquely recognized, but was instead associated with clusters primarily associated with other materials. The primary example of this is the Brown Soil class. Known exposures of Brown Soil were grouped into clusters H and W, the former being the cluster most often associated with Bright Drift deposits and the latter being a cluster that also mapped out Dark Soil exposures. Cluster H has a moderate strength 900 nm band and cluster W has a weak 900 nm band, thus in the left eye channels these can account for the 900 nm band in Brown Soil. The stronger 530 nm kink in Brown Soil can not be accounted for by the right eye cluster H and W equivalents and thus there was a separate cluster f for Brown Soil resulting from the right eye analysis. Finally, some of the previously recognized spectral classes were not uniquely identified either in the cluster analysis or mapped out in the supervised classification. An example is Maroon Rock which was not uniquely mapped in this study. The left eye spectra of Maroon Rock examples are very similar to those of Brown Soil occurrences with both sharing a 900 nm absorption band of similar band width but with Brown Soil occurrences having on average a somewhat deeper band depth. Given this similarity, in our supervised class maps, Maroon Rock occurrences were mapped as class f.
Table 2. Spectral classes identified in previous studies related to classes from this study.
Class Distinguishing spectral characteristics
Corresponding ANN Class(es)
Gray Rock Low albedo, negative NIR slope
D, E, Z, J, N
Black Rock Low albedo, strong 900 to 1000 nm absorption
O, R
Maroon Rock Strong 530 nm band, Shallow 900 nm
absorption
f
Red Rock Similar to Bright Drift, but with higher blue
reflectance
H
Pink Rock Similar to Bright Drift but with higher
reflectance in all bands
--
Bright Drift High albedo, steep red-blue slope, flat NIR
reflectance
H, L
Brown Soil Intermediate albedo, shallow 900 nm band
f
Disturbed Soil Low albedo, shallow 900 nm band
f or unclassified
Rock Soil Low albedo, negative NIR slope
Y, E, b, J, K
Dark Soil Low albedo b (left); M,Y (right)
Twin Peaks Intermediate albedo, shallow 900 nm band
M, K (left eye only)
38
http://marsjournal.org

Farrand et al: Mars, 4, 33-55, 2008
Figure 1. (a) S0184 left eye cluster map overlaid on the 670 nm band image (figure1a.png).
39
http://marsjournal.org

Farrand et al: Mars, 4, 33-55, 2008
Figure 1. (b) S0184 right eye cluster map overlaid on the 670 nm band image (figure1b.png).
40
http://marsjournal.org

Farrand et al: Mars, 4, 33-55, 2008
Figure 2. (a) Albedo normalized right eye training sample spectra (figure2a.png).
from the S0185 and S0183 octants are shown in Figure 3. In the remainder of this section we discuss the geologic classes listed in Table 2 and the SOM-hybrid ANN classes that correspond to them.
Figure 2. (b) Albedo normalized left eye training sample spectra (figure2b.png).
differences only rather than their albedo differences. Gray Rock
While thick, optically impervious coatings account for different spectral classes- namely Maroon Rock and Red Rock. In the case of the different ANN classes describing Gray Rock they might be accounted for, at least in part, by thin dust coatings. As ferric dust coatings get thicker they act to mask the ferrous iron absorptions of the substrate, increase albedo, and produce a negative continuum slope in the NIR (
In the ANN class map of left eye data, Gray Rock is described primarily by classes D, E, and Z with some rocks displaying patches of classes J and N. These left eye spectra are shown in Figure 4(a). These classes display the negative NIR slope consistent with that attributed to Gray Rock by McSween et al. (1999). Classes J and D display an upturn in reflectance in the final 1003 nm band. The McSween et al.
Fischer and Pieters 1993(1999) spectrum for the Gray Rock “Wallace” displays a class D-type of spectrum with an upturn in 1003 nm reflectance.
). The Gray Rock classes D and E appear to be more strongly influenced by these thin coatings based on their higher reflectances (Figure 4(a)) and as is discussed below, class E has affinities to Red Rock occurrences. In the right eye data, Gray Rock is described primarily by
classes D, E, and Z with patches of class b. The patches of class E and b identify higher albedo areas on Gray Rocks. Right eye spectra of these classes are shown in Figure 4(b). These spectra are all very similar with differences primarily in their albedo and their red/blue (670 nm / 440 nm) ratio and 530 to 600 nm ratios with these values increasing in the following order: class D, E, Z, to b. As was noted above, clustering was performed on albedo normalized data thus these classes were distinguished on the basis of spectral
Black Rock The Black Rock class is best classified in the left eye data based on its long wavelength absorption feature. Our clustering discovered two subtypes of Black Rock and thus this class has been split into an O and R class (Merényi et al. 2004b). Class O has a discernable band minimum shortward of 1000 nm in the 935 nm band. The band minimum of class R could be coincident with the 1003 nm band or could occur
41
http://marsjournal.org

Farrand et al: Mars, 4, 33-55, 2008 4
42
http://marsjournal.org
Figure 3. (a) Overlay onto S0184 left 670 nm band of left eye supervised class map (figure3a.png).
Farrand et al: Mars, 4, 33-55, 2008
Figure 3. (b) Overlay onto S0184 left 670 nm band of S0184 right eye supervised class map (figure3b.png).
43
http://marsjournal.org
Farrand et al: Mars, 4, 33-55, 2008
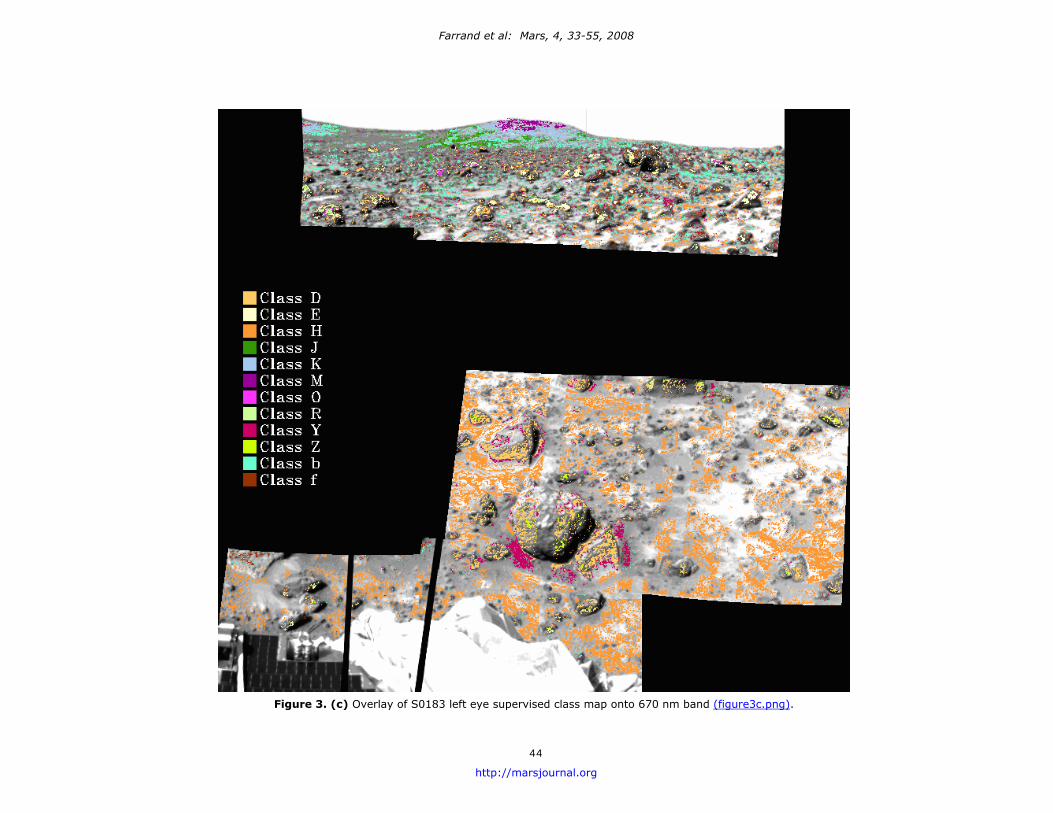
Figure 3. (c) Overlay of S0183 left eye supervised class map onto 670 nm band (figure3c.png).
44
http://marsjournal.org
Farrand et al: Mars, 4, 33-55, 2008
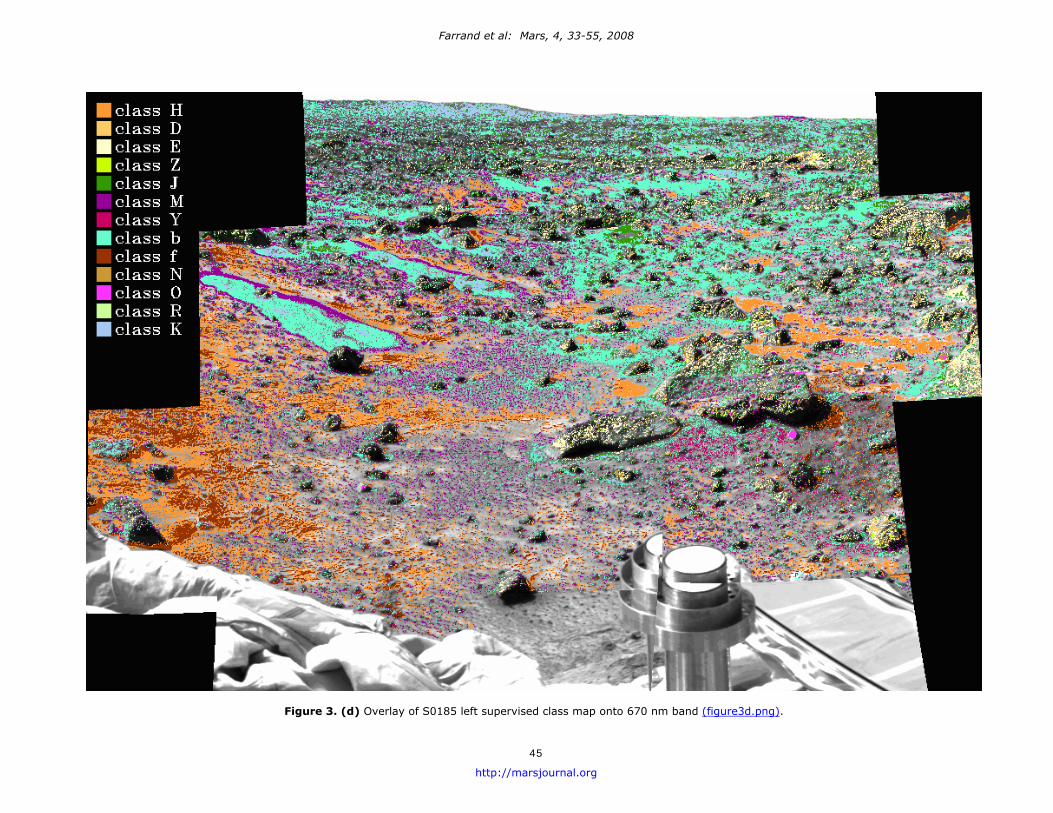
Figure 3. (d) Overlay of S0185 left supervised class map onto 670 nm band (figure3d.png).
45
http://marsjournal.org

Farrand et al: Mars, 4, 33-55, 2008
(a)
Figure 5. Black Rock class spectra derived from training samples. The right eye spectra were drawn from samples corresponding to those used for the left eye training samples. The class R spectrum was offset downwards by 0.04. (figure5.png).
(b) Y classes. Red Rock was described by McSween et al. (1999) as having spectral properties similar to Bright Drift. Here in the S0184 octant, examples of Red Rock are mapped by class H, the class most closely associated with Bright Drift, and also, in the right eye data, by class E which is a relatively high reflectance Gray Rock class. As was noted previously and as will be discussed further below, class E overlaps with Red Rock. The fact that a single class overlaps between Gray Rock and Red Rock examples serves to indicate that we are mapping primarily spectral rather than photometric differences since Johnson et al. (1999) drew a distinction in photometric properties between Gray Rocks and Red Rocks.
The nature of the Pink Rock class is still in doubt. It has been interpreted as a coated rock and alternatively interpreted as indurated soil (McSween et al. 1999). The type example of the Pink Rock class is the rock “Scooby Doo” which is in octant S0188. A segment of the left eye portion of this octant (a three color composite of which is shown in Figure 6(a)) was examined in an earlier unpublished study (Merényi) with a stand-alone cluster analysis. A single cluster (cream-colored cluster in Figure 6(b)) mapped out the brightest portions of Scooby Doo. Again we note that this cluster, while corresponding to a relatively high albedo unit, was determined on the basis of spectral shape since the clustering was performed on albedo-normalized data. Bright drift materials were mapped out by the brown-colored cluster in Figure 6(b) and other clusters mapped out rock surfaces. A cluster from the unsupervised clustering of octant S0184 that mapped out high albedo patches, interpreted as a lighter-toned coating, is class E. This cluster was maintained as a class for the supervised classification. Based on its relatively high albedo and the interpretation of it as a coating we compare it to the cream-colored cluster from Figure 6(b). Figure 7 compares the spectra of the mean of class E from octant S0184 with the mean of the cream-colored cluster that covers Scooby Doo for the segment from octant S0188. The S0184 class E mean is much lower in reflectance and there
Figure 4. (a) Gray Rock left eye spectra, not albedo normalized (figure4a.png). (b) Gray Rock right eye spectra, not albedo normalized (figure4b.png).
at a longer wavelength. Combined eye spectra (with right eye spectra selected from regions corresponding to left eye training sample locations; in this and all combined eye spectra shown, the left eye spectra were additively adjusted up or down to match the right eye spectra at the 670 nm band) of these Black Rock classes are shown in Figure 5.
Coated rock classes The type examples of the Maroon Rock class are in octants S0182 and S0188. Due to the time and resource limitations mentioned above, the S0182 octant was not subjected to clustering analysis. In the supervised classifications, the previously known occurrences of Maroon Rock in octants S0183, S0184, S0185, and the discontinuous classification in S0182 were generally covered by pixels in the f, H, M, and
46
http://marsjournal.org

Farrand et al: Mars, 4, 33-55, 2008
Figure 7. Left eye spectra of mean of the cream-colored unit from the S0188 segment compared against the mean of supervised class E from the S0184 octant. Both spectra, have error bars for standard deviation of the mean (figure7.png).
3(a) and it was merged with class H in the S0183 class map in Figure 3(c). In the right eye clustering analysis, this class is mapped by class H over all segments of the octant. Right and left eye spectra of Bright Drift (class H), along with other soil classes, are shown in Figure 8.
Brown Soil and Disturbed Soil
In the S0184 left eye cluster map, the Brown Soil class was mapped principally by clusters H and W but in the right eye data it was described by cluster f. For the supervised classifications, a class f was created also for the left eye images, picking training data from the corresponding locations and carefully checking the uniqueness of the spectra.
Figure 6. (a) Composite of left eye bands 3, 2, and 1 of segment of octant S0188 containing the “Pink Rock” Scooby Doo” (bright rock in upper right). (b) Cluster map of this segment with Pink Rock material mapped out by a cream-colored unit. (figure6.png)
In the supervised classification, occurrences of Disturbed Soil in S0185 were mapped co-equally by class f and H (corresponding to Brown Soil and Bright Drift) or they were unclassified. These are reasonable assignments since the Disturbed Soil represents areas where the surface veneer of Bright Drift was mixed by the rover’s wheels with underlying soil, which we interpret as being equivalent with Brown Soil.
are other subtle spectral differences between the two (for example, a more negative slope from 800 to 1000 nm in the class E spectrum than in the cream-colored cluster spectrum). However, the error bars (denoting the standard deviation of the mean for the averaged pixels) are large enough in both spectra to indicate uncertainty as to how different or similar the two classes are. Note that these spectra are drawn from the original R* data not from the albedo-normalized data used for the clustering analysis. Rock Soil and Dark Soil
The Rock Soil and Dark Soil classes have some overlap. In the left eye data, Rock Soil is described primarily by class Y, but also, to a lesser extent, by classes E, b, J, and K. In the right eye data it is described primarily by class Y but also by classes b and Z. Dark Soil is classified by classes M and Y in the right eye data and principally by class b in the left eye data. Spectra are shown in Figure 8.
Bright Drift The Bright Drift class is described primarily by class H in the clustering analysis of the S0184 octant and training samples from this cluster were used for the supervised classification of neighboring octants. As mentioned above, subtle calibration offsets in some of the component segments of the left eye data of this octant led to the use of the alternate class L to describe Bright Drift. To avoid confusion with the primary bright drift class, class H, class L is not shown for those octant segments in S0184 where it was used in Figure
Spatial distribution of classes of interest
The MPF landing site is on the Ares Vallis floodplain and
47
http://marsjournal.org

Farrand et al: Mars, 4, 33-55, 2008
(a)
(b)
Figure 8. Unnormalized soil class spectra shown separately as right eye (on the left) and left eye (on the right) (figure8.png).
the site has been interpreted as a depositional plain similar to terrestrial catastrophic flood plains. Some of the rocks have also been interpreted as crater ejecta (Ward et al. 1999). The distribution of rock classes does not, therefore, have a definite connection to the underlying bedrock lithology. However, the distance that these rocks have been transported is unknown. Thus, if the rocks were weathered in place or if the transport distance was minimal, they could be representative of the underlying bedrock lithology. Assessments can also be made regarding the spatial distribution of soil classes and of features in the far field.
Figure 9. (a) Combined eye spectra (for classes M and b) with spectra from right eye selected to match areas extracted from the left eye) of classes showing layering on the Twin Peaks. For classes M and b, left eye spectra were additively adjusted to match the reflectance (at the 670 nm band) of the right eye data. In the right eye mapping, there was no class K and for the left eye, class Y was a minor component of the Twin Peaks Far field features (figure9a.png)
One of the more striking results from the classification work has been the observation of apparent layering on the North and South Twin Peaks. Previous studies focusing on the morphology of the Twin Peaks have also observed potential layering (Rice et al. 1999). There are differences in the way that these far field classes are mapped out in the left eye vs. the right eye data. In the supervised class maps of left eye data, each peak (in octants S0184 and S0183) displays a summit capped by class M and then an interlayering of classes b and K. In the supervised class maps of right eye data, there is a more straightforward top-down sequence of classes M, Y, and b. Left eye class M has a broad absorption with a continuum-removed band center at 950 nm. Left eye spectra of classes b and K have shallower long wavelength
. (b) Mosaic of subsections from S0184 and S0183 left eye bands 3, 2, 1 composite (top) and mosaic of subsections of left eye class maps (bottom) showing layering in the Twin Peaks (figure9b.png).
absorptions. Spectra of these classes are shown in Figure 9(a) and a subsection of the class maps that show this layering is shown in Figure 9(b).
Also in the far-field of the S0183 octant are boulder-sized examples of the Black Rock class. Application of CEM to component segments in S0183 highlights these Black Rock boulders (see Figure 10(b)). These larger examples were also noted by Murchie et al. (2003) and by Farrand et al. (2004). These Black Rock examples in the far field are also
48
http://marsjournal.org
Farrand et al: Mars, 4, 33-55, 2008
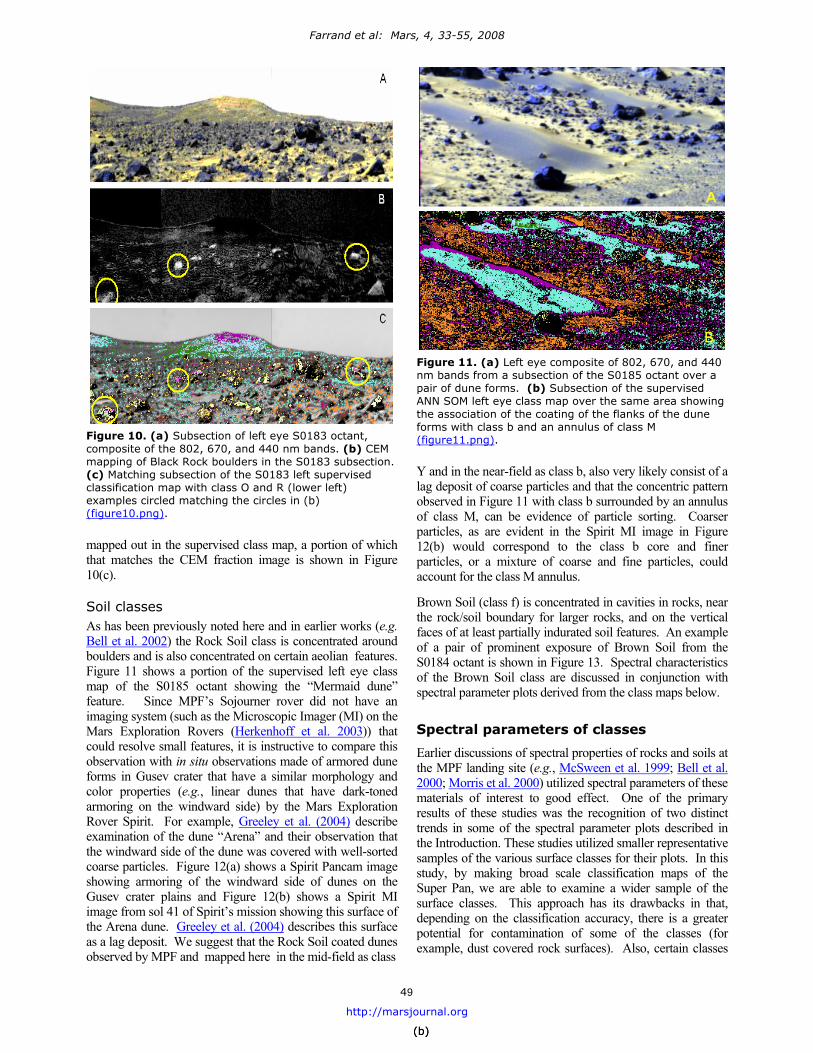
Figure 11. (a) Left eye composite of 802, 670, and 440 nm bands from a subsection of the S0185 octant over a pair of dune forms. (b) Subsection of the supervised ANN SOM left eye class map over the same area showing the association of the coating of the flanks of the dune forms with class b and an annulus of class M
Figure 10. (a) Subsection of left eye S0183 octant, composite of the 802, 670, and 440 nm bands. (b) CEM mapping of Black Rock boulders in the S0183 subsection. (c) Matching subsection of the S0183 left supervised classification map with class O and R (lower left) examples circled matching the circles in (b)
(figure11.png).
Y and in the near-field as class b, also very likely consist of a lag deposit of coarse particles and that the concentric pattern observed in Figure 11 with class b surrounded by an annulus of class M, can be evidence of particle sorting. Coarser particles, as are evident in the Spirit MI image in Figure 12(b) would correspond to the class b core and finer particles, or a mixture of coarse and fine particles, could account for the class M annulus.
(figure10.png).
mapped out in the supervised class map, a portion of which that matches the CEM fraction image is shown in Figure 10(c).
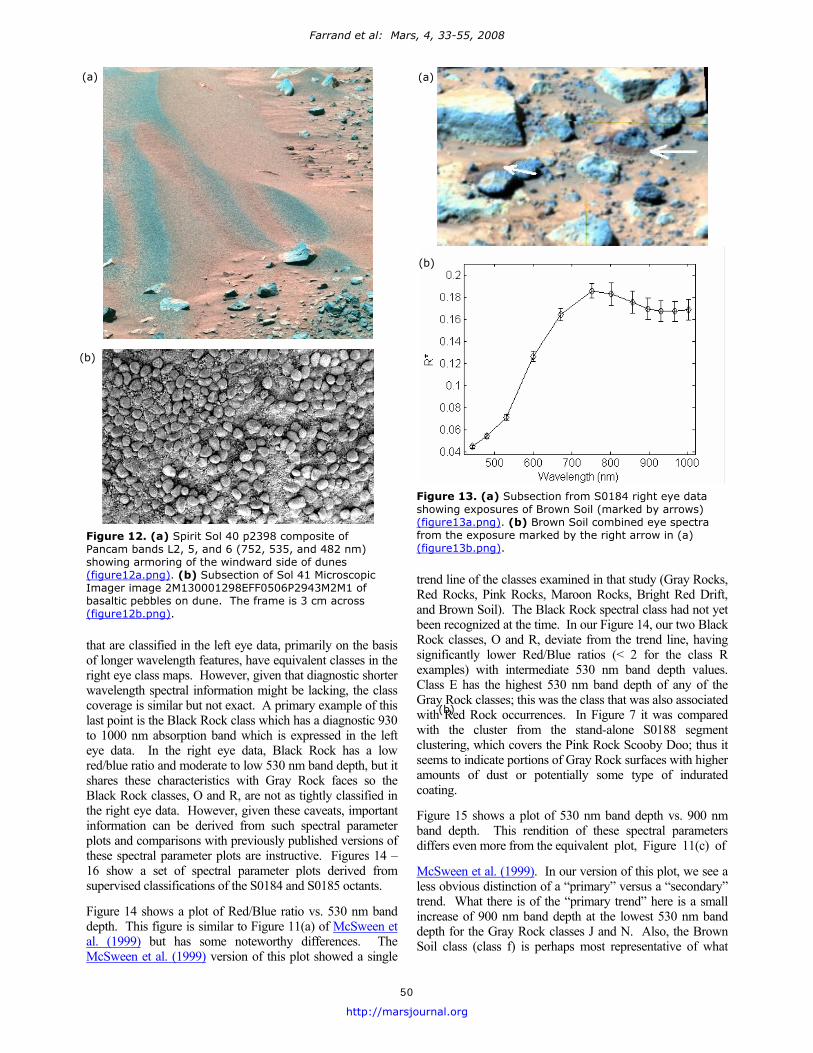
Brown Soil (class f) is concentrated in cavities in rocks, near the rock/soil boundary for larger rocks, and on the vertical faces of at least partially indurated soil features. An example of a pair of prominent exposure of Brown Soil from the S0184 octant is shown in Figure 13. Spectral characteristics of the Brown Soil class are discussed in conjunction with spectral parameter plots derived from the class maps below.
Soil classes As has been previously noted here and in earlier works (e.g. Bell et al. 2002) the Rock Soil class is concentrated around boulders and is also concentrated on certain aeolian features. Figure 11 shows a portion of the supervised left eye class map of the S0185 octant showing the “Mermaid dune” feature. Since MPF’s Sojourner rover did not have an imaging system (such as the Microscopic Imager (MI) on the Mars Exploration Rovers ( Spectral parameters of classes Herkenhoff et al. 2003)) that could resolve small features, it is instructive to compare this observation with in situ observations made of armored dune forms in Gusev crater that have a similar morphology and color properties (e.g., linear dunes that have dark-toned armoring on the windward side) by the Mars Exploration Rover Spirit. For example,
Earlier discussions of spectral properties of rocks and soils at the MPF landing site (e.g., McSween et al. 1999
Greeley et al. (2004) describe examination of the dune “Arena” and their observation that the windward side of the dune was covered with well-sorted coarse particles. Figure 12(a) shows a Spirit Pancam image showing armoring of the windward side of dunes on the Gusev crater plains and Figure 12(b) shows a Spirit MI image from sol 41 of Spirit’s mission showing this surface of the Arena dune. Greeley et al. (2004) describes this surface as a lag deposit. We suggest that the Rock Soil coated dunes observed by MPF and mapped here in the mid-field as class
; Bell et al. 2000; Morris et al. 2000) utilized spectral parameters of these materials of interest to good effect. One of the primary results of these studies was the recognition of two distinct trends in some of the spectral parameter plots described in the Introduction. These studies utilized smaller representative samples of the various surface classes for their plots. In this study, by making broad scale classification maps of the Super Pan, we are able to examine a wider sample of the surface classes. This approach has its drawbacks in that, depending on the classification accuracy, there is a greater potential for contamination of some of the classes (for example, dust covered rock surfaces). Also, certain classes
49
http://marsjournal.org (b) (b)
Farrand et al: Mars, 4, 33-55, 2008
(a) (a)
(b)
(b)
Figure 13. (a) Subsection from S0184 right eye data showing exposures of Brown Soil (marked by arrows) (figure13a.png)
that are classified in the left eye data, primarily on the basis of longer wavelength features, have equivalent classes in the right eye class maps. However, given that diagnostic shorter wavelength spectral information might be lacking, the class coverage is similar but not exact. A primary example of this last point is the Black Rock class which has a diagnostic 930 to 1000 nm absorption band which is expressed in the left eye data. In the right eye data, Black Rock has a low red/blue ratio and moderate to low 530 nm band depth, but it shares these characteristics with Gray Rock faces so the Black Rock classes, O and R, are not as tightly classified in the right eye data. However, given these caveats, important information can be derived from such spectral parameter plots and comparisons with previously published versions of these spectral parameter plots are instructive. Figures 14 – 16 show a set of spectral parameter plots derived from supervised classifications of the S0184 and S0185 octants.
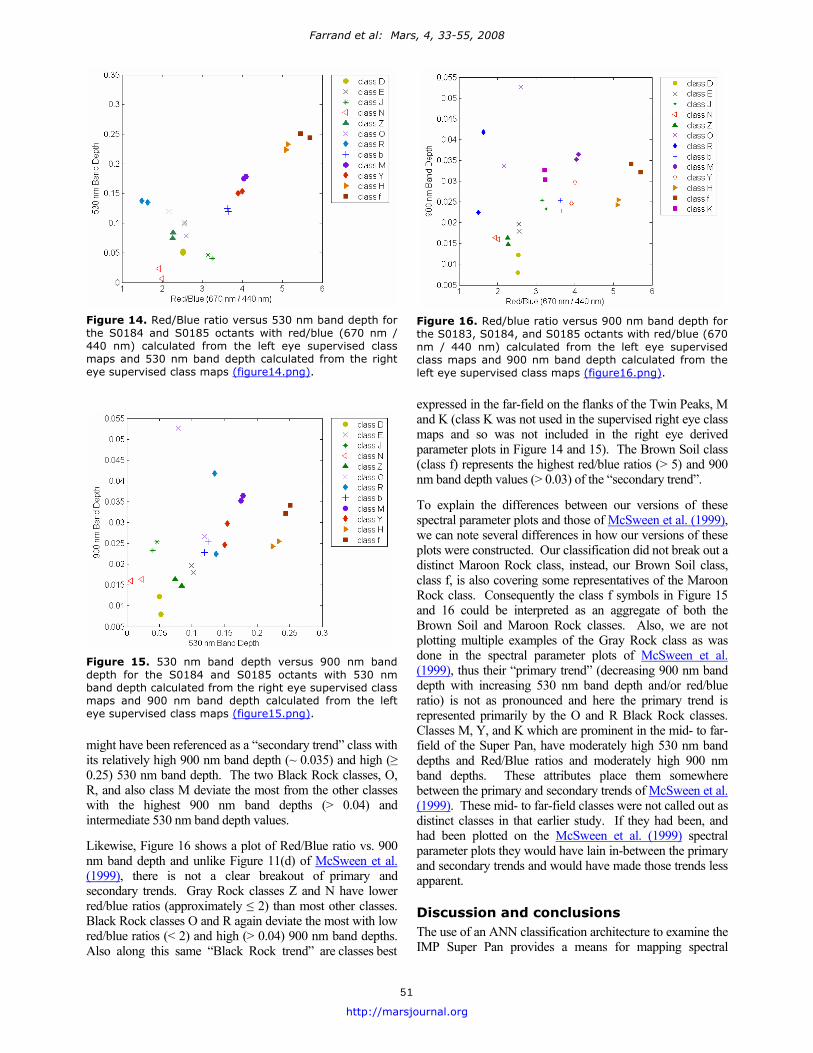
Figure 14 shows a plot of Red/Blue ratio vs. 530 nm band depth. This figure is similar to Figure 11(a) of McSween et al. (1999) but has some noteworthy differences. The McSween et al. (1999) version of this plot showed a single
trend line of the classes examined in that study (Gray Rocks, Red Rocks, Pink Rocks, Maroon Rocks, Bright Red Drift, and Brown Soil). The Black Rock spectral class had not yet been recognized at the time. In our Figure 14, our two Black Rock classes, O and R, deviate from the trend line, having significantly lower Red/Blue ratios (< 2 for the class R examples) with intermediate 530 nm band depth values. Class E has the highest 530 nm band depth of any of the Gray Rock classes; this was the class that was also associated with Red Rock occurrences. In Figure 7 it was compared with the cluster from the stand-alone S0188 segment clustering, which covers the Pink Rock Scooby Doo; thus it seems to indicate portions of Gray Rock surfaces with higher amounts of dust or potentially some type of indurated coating.
Figure 15 shows a plot of 530 nm band depth vs. 900 nm band depth. This rendition of these spectral parameters differs even more from the equivalent plot, Figure 11(c) of
McSween et al. (1999). In our version of this plot, we see a less obvious distinction of a “primary” versus a “secondary” trend. What there is of the “primary trend” here is a small increase of 900 nm band depth at the lowest 530 nm band depth for the Gray Rock classes J and N. Also, the Brown Soil class (class f) is perhaps most representative of what
. (b) Brown Soil combined eye spectra from the exposure marked by the right arrow in (a) Figure 12. (a) Spirit Sol 40 p2398 composite of
Pancam bands L2, 5, and 6 (752, 535, and 482 nm) showing armoring of the windward side of dunes
(figure13b.png).
(figure12a.png). (b) Subsection of Sol 41 Microscopic Imager image 2M130001298EFF0506P2943M2M1 of basaltic pebbles on dune. The frame is 3 cm across (figure12b.png).
(b)
50
http://marsjournal.org
Farrand et al: Mars, 4, 33-55, 2008
Figure 14. Red/Blue ratio versus 530 nm band depth forthe S0184 and S0185 octants with red/blue (670 nm /440 nm) calculated from the left eye supervised classmaps and 530 nm band depth calculated from the righteye supervised class maps
Figure 16. Red/blue ratio versus 900 nm band depth for the S0183, S0184, and S0185 octants with red/blue (670 nm / 440 nm) calculated from the left eye supervised class maps and 900 nm band depth calculated from the left eye supervised class maps (figure14.png)
Figure 15. 530 nm band depth versus 900 nm banddepth for the S0184 and S0185 octants with 530 nmband depth calculated from the right eye supervised classmaps and 900 nm band depth calculated from the lefteye supervised class maps (figure15.png).
might have been referenced as a “secondary trend” class with its relatively high 900 nm band depth (~ 0.035) and high (≥ 0.25) 530 nm band depth. The two Black Rock classes, O, R, and also class M deviate the most from the other classes with the highest 900 nm band depths (> 0.04) and intermediate 530 nm band depth values.
Likewise, Figure 16 shows a plot of Red/Blue ratio vs. 900 nm band depth and unlike Figure 11(d) of McSween et al. (1999), there is not a clear breakout of primary and secondary trends. Gray Rock classes Z and N have lower red/blue ratios (approximately ≤ 2) than most other classes. Black Rock classes O and R again deviate the most with low red/blue ratios (< 2) and high (> 0.04) 900 nm band depths. Also along this same “Black Rock trend” are classes best
(figure16.png). .
expressed in the far-field on the flanks of the Twin Peaks, M and K (class K was not used in the supervised right eye class maps and so was not included in the right eye derived parameter plots in Figure 14 and 15). The Brown Soil class (class f) represents the highest red/blue ratios (> 5) and 900 nm band depth values (> 0.03) of the “secondary trend”.
To explain the differences between our versions of these spectral parameter plots and those of McSween et al. (1999), we can note several differences in how our versions of these plots were constructed. Our classification did not break out a distinct Maroon Rock class, instead, our Brown Soil class, class f, is also covering some representatives of the Maroon Rock class. Consequently the class f symbols in Figure 15 and 16 could be interpreted as an aggregate of both the Brown Soil and Maroon Rock classes. Also, we are not plotting multiple examples of the Gray Rock class as was done in the spectral parameter plots of McSween et al. (1999), thus their “primary trend” (decreasing 900 nm band depth with increasing 530 nm band depth and/or red/blue ratio) is not as pronounced and here the primary trend is represented primarily by the O and R Black Rock classes. Classes M, Y, and K which are prominent in the mid- to far-field of the Super Pan, have moderately high 530 nm band depths and Red/Blue ratios and moderately high 900 nm band depths. These attributes place them somewhere between the primary and secondary trends of McSween et al. (1999). These mid- to far-field classes were not called out as distinct classes in that earlier study. If they had been, and had been plotted on the McSween et al. (1999) spectral parameter plots they would have lain in-between the primary and secondary trends and would have made those trends less apparent.
Discussion and conclusions The use of an ANN classification architecture to examine the IMP Super Pan provides a means for mapping spectral
51
http://marsjournal.org
Farrand et al: Mars, 4, 33-55, 2008
classes over larger portions of the image and utilizing statistics from those classes to better understand their nature. It is also of interest to note which classes were identified in this study by the unsupervised clustering analysis and compare them with the spectral classes identified by McSween et al. (1999). Of the classes identified by those authors (Gray Rocks, Red Rocks, Pink Rocks, Maroon Rocks, Bright Red Drift, and Brown Soil), the unsupervised clustering in the present study does not find unique one-to-one correspondence with these classes but instead finds sets of classes which correspond to these earlier classes; for example, the set of classes D, E, J, N, and Z correspond to Gray Rock. A spectrally unique material such as Black Rock was identified in unsupervised cluster analysis of the S0184 octant by two unique classes, O and R. Other classes with distinct spatial associations, such as the mid-to-far field classes M and Y, were selected in the unsupervised cluster analysis. These classes, along with refined training samples of geologically significant classes such as Black Rock and Brown Soil, were included in the supervised classification analyses of the S0184, S0183, and S0185 octants. Examination of the trends in the spectral parameter plots of Figures 14–16, which were drawn from the supervised classification of the S0184 and S0185 octants, are instructive in comparison with similar plots in McSween et al. (1999). The “primary” and “secondary” spectral trends which were observed by McSween et al. (1999) in their examination of the spectral parameters of examples of the classes identified by those authors are hinted at in Figures 14–16, but do not stand out. Part of the reason for this is taken here to be due to the fact that in the earlier study, the examples used as representative of the spectral classes were spectral subsets and that the classes mapped here incorporate a larger number of pixels, some with mixed spectral characteristics and so trends observed with the smaller number of spectral samples were more apparent. A related point is that by querying a larger number of spatial samples, a more representative view of the relative importance of previously identified spectral trends was gained. Taking this viewpoint, the most important spectral trend in the octants examined was McSween et al. (1999)’s “secondary” trend with a larger number of classes falling into this trend than into the “primary” trend.
While several clusters were determined from the SOM clustering to describe Gray Rock occurrences, it can be noted that in the spectral parameter plots of Figures 14–16 that these Gray Rock classes (D, Z, N, E, and to a lesser extent J) do plot in the same general region in the spectral parameter plots with low 900 nm band depth, low Red/Blue ratios and low 530 nm band depth. It can also be noted that the spectral parameters derived from the Black Rock classes are distinct from the Gray Rock classes with distinctly higher 900 nm band depths and even lower Red/Blue ratios. Thus the Black Rock surfaces are definitely spectrally distinct from the Gray Rock surfaces. We do not have enough information to determine if Gray Rock surfaces are coated and Black Rock surfaces are uncoated or if they actually do represent different lithologies. Given that some of the Gray Rock surfaces are on elevated rock faces and thus have been
subjected to eolian abrasion, it is very likely that these surfaces could be uncoated. Farrand et al. (2006) noted that many rock surfaces observed by Spirit in Gusev Crater had spectral properties on wind-abraded surfaces that were comparable to surfaces abraded by the rover’s Rock Abrasion Tool (RAT).
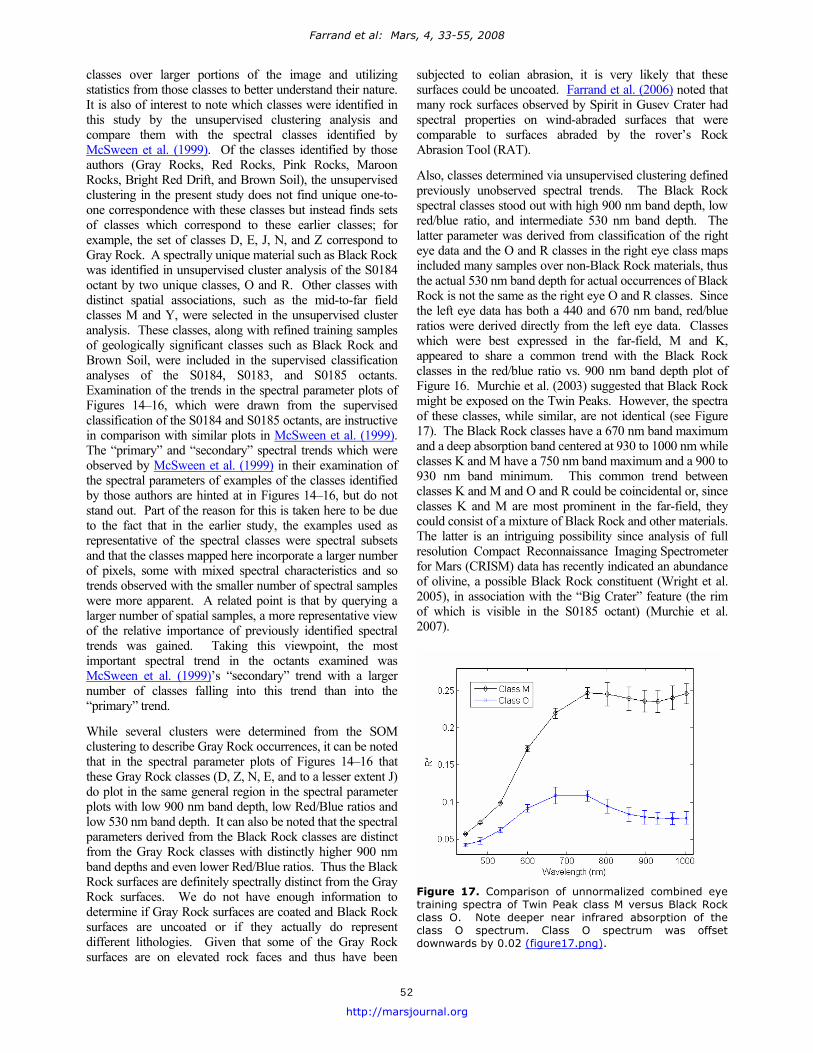
Also, classes determined via unsupervised clustering defined previously unobserved spectral trends. The Black Rock spectral classes stood out with high 900 nm band depth, low red/blue ratio, and intermediate 530 nm band depth. The latter parameter was derived from classification of the right eye data and the O and R classes in the right eye class maps included many samples over non-Black Rock materials, thus the actual 530 nm band depth for actual occurrences of Black Rock is not the same as the right eye O and R classes. Since the left eye data has both a 440 and 670 nm band, red/blue ratios were derived directly from the left eye data. Classes which were best expressed in the far-field, M and K, appeared to share a common trend with the Black Rock classes in the red/blue ratio vs. 900 nm band depth plot of Figure 16. Murchie et al. (2003) suggested that Black Rock might be exposed on the Twin Peaks. However, the spectra of these classes, while similar, are not identical (see Figure 17). The Black Rock classes have a 670 nm band maximum and a deep absorption band centered at 930 to 1000 nm while classes K and M have a 750 nm band maximum and a 900 to 930 nm band minimum. This common trend between classes K and M and O and R could be coincidental or, since classes K and M are most prominent in the far-field, they could consist of a mixture of Black Rock and other materials. The latter is an intriguing possibility since analysis of full resolution Compact Reconnaissance Imaging Spectrometer for Mars (CRISM) data has recently indicated an abundance of olivine, a possible Black Rock constituent (Wright et al. 2005), in association with the “Big Crater” feature (the rim of which is visible in the S0185 octant) (Murchie et al. 2007).
Figure 17. Comparison of unnormalized combined eye training spectra of Twin Peak class M versus Black Rock class O. Note deeper near infrared absorption of the class O spectrum. Class O spectrum was offset downwards by 0.02 (figure17.png).
52
http://marsjournal.org

Farrand et al: Mars, 4, 33-55, 2008
Class f is also a significant class in that it displays the highest red/blue ratios, highest 535 nm band depth and also a significant 900 nm band. We interpret the Brown Soil class to be an older soil than Bright Drift (as characterized here by class H). The higher 530 nm band depth could be indicative of some degree of crystalline hematite development because hematite has an intense charge transfer band in the near-UV which in well-crystalline red hematite is manifested as a change in slope centered at, or somewhat shortwards of 550 nm (Morris et al. 1985). The 900 nm band could also be indicative of the development of hematite, but since the band center is at 900 nm and not at 860 nm, clearly other phases such as unoxidized ferrous iron phases are present as well. The fact that the MPF landing site is located within terrain washed over by ancient outflow channel events could be significant in contributing water that might have helped spur the development of crystalline phases in Brown Soil. In their scenario for the development of the observed “stratigraphy” at the MPF landing site, McSween et al. (1999) posited a “stage 1” in which Maroon Rocks and Brown Soil were emplaced, a “stage 2” in which small cobbles were emplaced, and a “stage 3” consisting of eolian erosion and coating of red dust onto some rock faces. The deeper absorption bands in the class f spectrum would support stage 1 as being a flooding or outflow event. However, the fact that well-crystalline hematite spectra are not seen indicates that the development of crystalline phases has not gone to completion- very likely indicating that any interaction with water was transitory and not sustained.
Directory of Supporting Data
root directoryfarrand_mars_2008_0004.pdfFull-resolution images Figure 1 figure1a.png, figure1b.pngFigure 2 figure2a.png, figure2b.pngFigure 3 figure3a.png, figure3b.png
figure3c.png, figure3d.pngFigure 4 figure4a.png, figure4b.pngFigure 5 figure5.pngFigure 6 figure6.pngFigure 7 figure7.pngFigure 8 figure8.pngFigure 9 figure9a.png, figure9b.pngFigure 10 figure10.pngFigure 11 figure11.pngFigure 12 figure12a.png, figure12b.pngFigure 13 figure13a.png, figure13b.pngFigure 14 figure14.pngFigure 15 figure15.png Figure 16 figure16.pngFigure 17 figure17.png
Acknowledgements
This research was partially supported by grant NAG5-13294 from the Mars Data Analysis Program, and by grant NNG05GA94G from the Applied Information Research Program, of NASA, Science Mission Directorate. Help with performing the classification runs by graduate student Kadim
Taşdemir is greatly appreciated. We also acknowledge and thank Scott Murchie and Olivier Barnouin-Jha for providing the recalibrated version of the Super Pan.
References
Adams, J. B., M. O. Smith and A. R. Gillespie (1993) “Imaging spectroscopy: Interpretation based on spectral mixture analysis” in Remote Geochemical Analysis: Elemental and Mineralogical Composition (editors C. M. Pieters and P. A. J. Englert) 145-146 New York, Cambridge University Press.
Bandfield, J. L., V. E. Hamilton, and P. R. Christensen (2000) “A global view of Martian surface compositions from MGS-TES” Science 287, 1626-1630. doi:10.1126/science.287.5458.1626
Barnouin-Jha, O., S. Murchie, J. R. Johnson, J. F. Bell III and R. V. Morris (2000) “Rock coatings at the Mars Pathfinder landing site” Lunar and Planetary Science XXXI, Abstract No. 1262, Lunar and Planetary Institute, Houston.
Bell III, J. F. et al. (2000) “Mineralogic and compositional properties of Martian soil and dust: Results from Mars Pathfinder” Journal of Geophysical Research 105, 1721-1755. doi:10.1029/1999JE001060
Bell III, J. F., W. H. Farrand, J. R. Johnson and R. V. Morris (2002) “Low abundance materials at the Mars Pathfinder landing site: An investigation using spectral mixture analysis and related techniques” Icarus 158, 56-71. doi:10.1006/icar.2002.6865
Deal, K. S., R. E. Arvidson, and B. L. Jolliff (2003) “Remote mapping of the Ja’u Desert, Hawaii: Silica in a Mars analog terrain” Lunar and Planetary Science XXXIV, Abstract No. 1952, Lunar and Planetary Institute, Houston.
Farrand, W. H. and J. C. Harsanyi (1997) “Mapping the distribution of mine tailings in the Coeur d’Alene River Valley, Idaho through the use of a Constrained Energy Minimization technique” Remote Sensing of Environment 59, 64-76. doi:10.1016/S0034-4257(96)00080-6
Farrand, W., E. Merényi, S. Murchie, O. Barnouin-Jha, and J. Johnson (2004) “Mapping rock and soil units in the MPF Superpan using a Kohonen self-organizing map” Lunar and Planetary Science XXXV, Abstract No. 1916, Lunar and Planetary Institute, Houston.
Farrand, W. H., J. F. Bell III, J. R. Johnson, S. W. Squyres, J. Soderblom and D. W. Ming (2006) “Spectral variability among rocks in visible and near infrared multispectral Pancam data collected at Gusev Crater: Examinations using spectral mixture analysis and related techniques” Journal of Geophysical Research 111, E02S15. doi:10.1029/2005JE002495
Fischer, E. M. and C. M. Pieters (1993) “The continuum slope of Mars: Bidirectional reflectance investigations and applications to Olympus Mons” Icarus 102, 185-202. doi:10.1006/icar.1993.1043
Gaddis, L. et al. (1999) “Digital mapping of the Mars Pathfinder landing site: Design, acquisition, and derivation of cartographic products for science applications” Journal of Geophysical Research 104, 8853-8868. doi:10.1029/1998JE900013
Golombek, M. P., H. J. Moore, A. F. C. Haldemann, T. J. Parker and J. T. Schofield (1999) “Assessment of Mars Pathfinder landing site predictions” Journal of Geophysical Research 104, 8585-8594. doi:10.1029/1998JE900015
Greeley, R. et al. (2004) “Wind-related processes detected by the Spirit rover at Gusev Crater, Mars” Science 305, 810-821. doi:10.1126/science.1100108
53
http://marsjournal.org

Farrand et al: Mars, 4, 33-55, 2008
Harsanyi, J. M. (1993) “Detection and classification of subpixel spectral signatures in hyperspectral image sequences” Ph.D. dissertation, University of Maryland, Baltimore County.
Morris, R. V. et al. (2000) “Mineralogy, composition, and alteration of Mars Pathfinder rocks and soils: Evidence from multispectral, elemental, and magnetic data on terrestrial analogue, SNC meteorite, and Pathfinder samples” Journal of Geophysical Research 105, 1757-1817.
Herkenhoff, K.E. et al. (2003) “Athena Microscopic Imager investigation” Journal of Geophysical Research 108, 8065. doi:10.1029/1999JE001059doi:10.1029/2003JE002076
Murchie, S., O. Barnouin-Jha, J. Johnson, J. F. Bell III, H. Y. McSween Jr., and R. V. Morris (2000) “Diverse rock types at the Mars Pathfinder landing site” Lunar and Planetary Science XXXI, Abstract No. 1267, Lunar and Planetary Institute, Houston.
Howell, E. S., E. Merényi and L. A. Lebofsky (1994) “Classification of asteroid spectra using a neural network” Journal of Geophysical Research 99, 10847-10865. doi:10.1029/93JE03575
Johnson, J. R. et al. (1999) “Preliminary results on photometric properties of materials at the Sagan Memorial Station, Mars” Journal of Geophysical Research 104, 8809-8830.
Murchie, S., O. Barnouin-Jha, K. Barnouin-Jha, J. Bishop, J. Johnson, H. McSween and R. Morris (2003) “New insights into the geology of the Mars Pathfinder landing site from spectral and morphologic analysis of the 12-color SuperPan panorama” Sixth International Conference on Mars, Abstract No. 3060, Lunar and Planetary Institute, Houston
doi:10.1029/98JE02247Johnson, J. R., T. Sucharski and R.J. Reid (2001)
“Implementation of the image for Mars Pathfinder calibration algorithms in ISIS” Lunar and Planetary Science XXXII, Abstract No. 2062, Lunar and Planetary Institute, Houston. Murchie, S., J. Bishop, D. Humm, R. Morris, S. Pelkey, F.
Seelos and K. Seelos (2007) “Characteristics of the Mars Pathfinder landing site from CRISM hyperspectral imaging” Lunar and Planetary Science XXXI, Abstract No. 1478, Lunar and Planetary Institute, Houston.
Kirk, R. L. et al. (1999) “Digital photogrammetric analysis of the IMP camera images: Mapping the Mars Pathfinder landing site in three dimensions” Journal of Geophysical Research 104, 8869-8887. doi:10.1029/1998JE900012
Reid, R. J. et al. (1999) “Imager for Mars Pathfinder (IMP) image calibration” Journal of Geophysical Research 104, 8907-8926.
Kohonen, T. (1997) Self-Organizing Maps, Springer, Berlin. Kraft, D., T. G. Sharp and J. R. Michalski (2003) “Thermal
emission spectra of silica-coated basalt and considerations for Martian surface morphology” Lunar and Planetary Science XXXIV, Abstract No. 1420, Lunar and Planetary Institute, Houston.
doi:10.1029/1998JE900011Rice, J. W., M.T. Lemmon, P. H. Smith and R. A. Yingst
(1999) “Sedimentary structures at the Mars Pathfinder landing site” Lunar and Planetary Science XXX, Abstract No. 2063, Lunar and Planetary Institute, Houston. Lippmann, R. P. (1987) “An introduction to computing with
neural nets” IEEE ASSP Magazine, 4, 4-22. Rumelhart, D. E., G. E. Hinton and R. J. Williams (1986)
“Learning internal representations by error propagation” in Parallel distributed processing: Explorations in the microstructure of cognition (editors D. E. Rumelhart and J. L. McClelland) 318-362, The MIT Press, Cambridge.
doi:10.1109/MASSP.1987.1165576McSween Jr., H. Y. et al.(1999) “Chemical, multispectral and
textural constraints on the composition and origin of rocks at the Mars Pathfinder landing site” Journal of Geophysical Research 104, 8679-8716. doi:10.1029/98JE02551
Schowengerdt, R. A. (1997) Models and methods for image processing, Academic Press, San Diego Merényi, E., W. H. Farrand and P. Tracadas (2004a)
“Mapping surface materials on Mars from Mars Pathfinder spectral images With HYPEREYE” Proceedings of the International Conference on Information Technology 2, Las Vegas, 607–614.
Smith, P.H. et al. (1997) “The imager for Mars Pathfinder experiment” Journal of Geophysical Research 102, 4003-4025. doi:10.1029/96JE03568
Squyres, S.W. et al. (2004) “The Spirit rover's Athena science investigation at Gusev Crater, Mars” Science 305, 794-799.
Merényi, E., A. Jain and W. H. Farrand (2004b) “Applications of SOM magnification to data mining” WSEAS Transactions on Systems 3(5), 2122-2128. doi:10.1126/science.3050794
Squyres, S.W. et al. (2004) “The Opportunity rover's Athena science investigation at Meridiani Planum, Mars” Science 306, 1698-1703.
Merényi, E., B. Csathó and K. Taşdemir (2007a) “Knowledge discovery in urban environments from fused multi-dimensional imagery” Proceedings of the 4th IEEE GRSS/ISPRS Joint Workshop on Remote Sensing and Data Fusion over Urban Areas (URBAN 2007), 13, Paris.
doi:10.1126/science.1106171Thomas, N., W. J. Markiewicz, R. M, Sablotny, M. W.
Wuttke, H. U. Keller, J. R. Johnson, R. J. Reid and P. H. Smith (1999) “The color of the Martian sky and its influence on the illumination of the Martian surface” Journal of Geophysical Research 104, 8795-8808.
Merényi, E., A. Jain and Th. Villmann (2007b) “Explicit magnification control of self-organizing maps for ‘forbidden data’” IEEE Transactions on Neural Networks 18(3), 786-797. doi:10.1029/98JE02556
Tomasko, M. G., L. R. Doose, M. Lemmon, P. H. Smith and E. Wegryn (1999) “Properties of dust in the Martian atmosphere from the Imager on Mars Pathfinder” Journal of Geophysical Research 104, 8987-9008.
doi:10.1109/TNN.2007.895833Moore, H. J., D. B. Bickler, J. A. Crisp, H. J. Eisen, J. A.
Gensler, A. F. C. Haldemann, J. R. Matijevic, L. K. Reid and F. Pavlics (1999) “Soil-like deposits observed by Sojourner, the Pathfinder rover” Journal of Geophysical Research 104, 8729-8746.
doi:10.1029/1998JE900016Villmann, T., E. Merényi and B. Hammer (2003) “Neural
maps in remote sensing image analysis” Neural Networks, 16(3-4), 389-403.
doi:10.1029/1998JE900005doi:10.1016/S0893-Morris, R. V., H. V. Lauer Jr., C. A. Lawson, E. K. Gibson Jr.,
G. A. Nace and C. Stewart (1985) “Spectral and other physicochemical properties of submicron powders of hematite (α-Fe
6080(03)00021-2Ward, A. W., L. R. Gaddis, R. L. Kirk, L. A. Soderblom, K. L.
Tanaka, M. P. Golombek, T. J. Parker, R. Greeley and R. O. Kuzmin (1999) “General geology and geomorphology of the Mars Pathfinder landing site” Journal of Geophysical Research 104, 8555-8571.
2O3), magnetite (Fe3O4), goethite (α -FeOOH), and lepidocrocite (γ-FeOOH)” Journal of Geophysical Research 90, 3126-3144. doi:10.1029/JB090iB04p03126
doi:10.1029/1998JE900021
54
http://marsjournal.org

Farrand et al: Mars, 4, 33-55, 2008
Wright, S. P., W. H. Farrand, A. D. Rogers and E. Merényi (2005) “The nature of the Mars Pathfinder ‘Black Rock’ lithology: Comparisons with SNC meteorites and OMEGA spectral images of Chryse Planitia” AGU Fall Meeting, Eos Transactions 86 Abstract P21B-0145, San Francisco.
Wyatt, M. B. and H. Y. McSween Jr. (2002) “Spectral
evidence for weathered basalt as an alternative to andesite in the northern lowlands of Mars” Nature 417, 263-266. doi:10.1038/417263a
Wyatt, M. B., H. Y. McSween Jr., J. E. Moersch and P. R. Christensen (2003) “Analysis of surface compositions in the Oxia Palus region on Mars from Mars Global Surveyor Thermal Emission Spectrometer Observations” Journal of Geophysical Research 108, 5107. doi:10.1029/2002JE001986
Yingst, R. A., A. F. C. Haldemann, K. L. Biedermann and A. M. Monhead (2007) “Quantitative morphology of rocks at the Mars Pathfinder landing site” Journal of Geophysical Research 112, E06002. doi:10.1029/2005JE002582
55
http://marsjournal.org