science and engineering labor force...3-4 chapter 3. science and engineering labor force figure...
TRANSCRIPT

Chapter 3Science and Engineering
Labor Force
♦ 3-1
Highlights .....................................................................................................................................3-5U.S. S&E Workforce: Definition, Size, and Growth ................................................................3-5S&E Workers in the Economy .................................................................................................3-5S&E Labor Market Conditions .................................................................................................3-5Demographics of the S&E Workforce ......................................................................................3-6Global S&E Labor Force ..........................................................................................................3-6
Introduction ..................................................................................................................................3-7Chapter Overview .....................................................................................................................3-7Chapter Organization ................................................................................................................3-7
U.S. S&E Workforce: Definition, Size, and Growth ...................................................................3-7Definition of the S&E Workforce .............................................................................................3-7Size of the S&E Workforce ....................................................................................................3-10Growth of the S&E Workforce ...............................................................................................3-11Educational Distribution of Workers in S&E Occupations ....................................................3-14Occupational Distribution of S&E Degree Holders and Relationship between Jobs
and Degrees ........................................................................................................................3-16S&E Workers in the Economy ...................................................................................................3-19
Employment Sectors ...............................................................................................................3-19Employer Size .........................................................................................................................3-23Industry Employment .............................................................................................................3-24Employment by Metropolitan Area ........................................................................................3-24Scientists and Engineers and Innovation-Related Activities ..................................................3-24
S&E Labor Market Conditions ..................................................................................................3-28Unemployment .......................................................................................................................3-28Involuntarily Working Out of One’s Field of Highest Degree ...............................................3-31Earnings ..................................................................................................................................3-32Recent S&E Graduates ...........................................................................................................3-33
Age and Retirement of the S&E Workforce ..............................................................................3-40Age Differences among Occupations .....................................................................................3-41Age Differences among Degree Fields ...................................................................................3-41Retirement ...............................................................................................................................3-42
Women and Minorities in the S&E Workforce .........................................................................3-43Women in the S&E Workforce ...............................................................................................3-43Minorities in the S&E Workforce ...........................................................................................3-45Salary Differences for Women and Racial and Ethnic Minorities .........................................3-49
Immigration and the S&E Workforce ........................................................................................3-51Characteristics of Foreign-Born Scientists and Engineers .....................................................3-52Source of Education ...............................................................................................................3-53New Foreign-Born Workers ..................................................................................................3-54High-Skill Migration Worldwide ..........................................................................................3-58

3-2 ♦ Chapter 3. Science and Engineering Labor Force
List of TablesTable 3-1. Major sources of data on the U.S. labor force ............................................................3-8Table 3-2. Classification of degree fields and occupations .........................................................3-9Table 3-3. Measures and size of U.S. S&E workforce: 2010, 2011, and 2012 .........................3-10Table 3-4. Educational background of college graduates employed in S&E occupations,
by broad S&E occupational category: 2010..........................................................................3-16Table 3-5. Relationship of highest degree to job among S&E highest degree holders
not in S&E occupations, by degree level: 2010 ....................................................................3-17Table 3-6. Employment sector of scientists and engineers, by broad occupational
category and degree field: 2010 ............................................................................................3-20Table 3-7. Self-employed scientists and engineers, by education, occupation, and type
of business: 2010 ...................................................................................................................3-22Table 3-8. Employment in S&E occupations, by major industry sector: May 2012 .................3-25Table 3-9. Metropolitan areas with largest proportion of workers in S&E occupations:
May 2012 ..............................................................................................................................3-26Table 3-10. R&D activity rate of scientists and engineers employed in S&E occupations,
by broad occupational category and level of highest degree: 2010 ......................................3-27Table 3-11. Scientists and engineers participating in work-related training, by labor force
status and occupation: 2010 ..................................................................................................3-28Table 3-12. Alternative measures of labor underutilization ......................................................3-30Table 3-13. Scientists and engineers who are working involuntarily out of field,
by S&E degree field: 1993–2010 ..........................................................................................3-31Table 3-14. Annual earnings and earnings growth in science, technology, and related
occupations: May 2009–May 2012 .......................................................................................3-32Table 3-15. Median salaries for employed college-educated individuals, by broad field
of highest degree and broad occupational category: 2010 ....................................................3-32Table 3-16. Labor market indicators for recent S&E degree recipients up to 5 years
after receiving degree, by level and field of highest degree: 2010 .......................................3-35Table 3-17. Employment characteristics of recent SEH doctorate recipients up to 3 years
after receiving doctorate, by field of degree: 2001–10 .........................................................3-36Table 3-18. Employed SEH doctorate recipients holding tenure and tenure-track
appointments at academic institutions, by field of and years since degree: 1993–2010 .......3-36Table 3-19. Salaries for recent SEH doctorate recipients up to 5 years after receiving
degree at selected percentiles, by field of degree: 2010 ........................................................3-37Table 3-20. Median salaries for recent SEH doctorate recipients up to 5 years after
receiving degree, by field of degree and employment sector: 2010 .....................................3-37Table 3-21. Median salaries for recent U.S. SEH doctorate recipients in postdoc and
non-postdoc positions up to 5 years after receiving degree: 2010 ........................................3-40Table 3-22. Racial and ethnic distribution of employed individuals in S&E occupations,
and of S&E degree holders, college graduates, and U.S. residents: 2010 ............................3-47
List of SidebarsNSF’s Scientists and Engineers Statistical Data System ............................................................3-9Projected Growth of Employment in S&E Occupations ..........................................................3-12The U.S. S&E Workforce Without a Bachelor’s Degree .........................................................3-15Employment of Biomedical Sciences Doctorates .....................................................................3-39S&E Credentials and the Male-Female Gap in S&E Employment ...........................................3-46
Global S&E Labor Force ...........................................................................................................3-59Size and Growth of the Global S&E Labor Force ..................................................................3-59R&D Employment Abroad by U.S. Companies .....................................................................3-61
Conclusion .................................................................................................................................3-61Notes ..........................................................................................................................................3-62Glossary .....................................................................................................................................3-64References ..................................................................................................................................3-64

Science and Engineering Indicators 2014 ♦ 3-3
Table 3-23. Distribution of workers in S&E occupations, by race and ethnicity: 1993–2010 .............................................................................................................................3-48
Table 3-24. Racial and ethnic distribution of employed individuals with S&E highest degree, by field of highest degree: 2010 ...............................................................................3-48
Table 3-25. Racial and ethnic distribution of employed individuals with S&E highest degree, by level of highest degree: 2010 ...............................................................................3-48
Table 3-26. Median annual salary among S&E highest degree holders working full time, by sex, race, and ethnicity: 1995, 2003, 2010 .......................................................................3-49
Table 3-27. Foreign-born workers in S&E occupations, by education level: Selected years, 2000–11 ......................................................................................................................3-52
Table 3-28. Annual salaries for new H-1B visa recipients, by occupation: FY 2011 ...............3-55Table 3-29. Five-year stay rates for U.S. S&E doctorate recipients with temporary
visas at graduation, by selected country/region/economy: 2001–11 ....................................3-57Table 3-A. Bureau of Labor Statistics projections of employment and job openings in
S&E and other selected occupations: 2010–20 .....................................................................3-13
List of FiguresFigure 3-1. Employment in S&E occupations, by broad occupational category: 2010
and 2012 ................................................................................................................................3-11Figure 3-2. S&E degrees among college graduates, by field and level of highest
degree: 2010 ..........................................................................................................................3-11Figure 3-3. Average annual growth in the number of employed individuals whose
highest degree is in S&E, by field and level of highest degree: 2003–10 ............................3-14Figure 3-4. Educational attainment, by type of occupation: 2011 .............................................3-14Figure 3-5. Occupational distribution of scientists and engineers, by broad field of
highest degree: 2010 .............................................................................................................3-16Figure 3-6. Occupational distribution of S&E highest degree holders, by field of
highest degree: 2010 .............................................................................................................3-18Figure 3-7. S&E degree holders working in S&E occupations, by level and field of
S&E highest degree: 2010 .....................................................................................................3-18Figure 3-8. S&E degree holders employed in jobs related to highest degree, by level of
and years since highest degree: 2010 ....................................................................................3-19Figure 3-9. Employed scientists and engineers, by employment sector: 1993–2010 ................3-20Figure 3-10. S&E highest degree holders, by degree level and employment sector: 2010 .......3-21Figure 3-11. Broad S&E occupational categories, by employment sector: 2010 ......................3-22Figure 3-12. Scientists and engineers employed in the business sector, by employer
size: 2010 ..............................................................................................................................3-23Figure 3-13. S&E highest degree holders employed in the business sector, by highest
degree level and employer size: 2010 ...................................................................................3-24Figure 3-14. Employed scientists and engineers with R&D activity, by broad field of
highest degree and broad occupational category: 2010 ........................................................3-27Figure 3-15. Employed SEH doctorate holders with R&D activity, by years since
doctoral degree: 2010 ............................................................................................................3-27Figure 3-16. Unemployment rates of scientists and engineers, by level of and years
since highest degree: 2010 ....................................................................................................3-29Figure 3-17. Unemployment rate, by occupation: 1983–2012 ..................................................3-29Figure 3-18. Unemployment rates for workers in S&E, STEM, and all occupations:
March 2008–April 2013 ........................................................................................................3-30Figure 3-19. Measures of labor underutilization for workers in S&E and all occupations:
March 2008–April 2013 ........................................................................................................3-30Figure 3-20. Scientists and engineers who are working involuntarily out of field,
by level of and years since highest degree: 2010 ..................................................................3-31Figure 3-21. Median salaries for employed college-educated individuals, by broad
field of highest degree and years since highest degree: 2010 ...............................................3-33Figure 3-22. Median salaries for employed scientists and engineers, by level of and
years since highest degree: 2010 ...........................................................................................3-33

3-4 ♦ Chapter 3. Science and Engineering Labor Force
Figure 3-23. Median salaries for employed scientists and engineers, by broad field and level of highest degree: 2010..........................................................................................3-34
Figure 3-24. Recent U.S. SEH doctorate recipients in postdoc positions, by field of and years since doctorate: 2010 ............................................................................................3-40
Figure 3-25. Age distribution of scientists and engineers in the labor force, by sex: 1993 and 2010 .......................................................................................................................3-41
Figure 3-26. Age distribution of employed scientists and engineers, by broad occupational category and broad field of highest degree: 2010 ............................................3-41
Figure 3-27. Older scientists and engineers who work full time, by age and highest degree level: 2010 .................................................................................................................3-42
Figure 3-28. Older scientists and engineers who report not working because of retirement, by age: 2010 ..........................................................................................................................3-42
Figure 3-29. Women in the workforce and in S&E: 1993 and 2010 .........................................3-43Figure 3-30. Women in S&E occupations: 1993–2010 .............................................................3-44Figure 3-31. Employed women with highest degree in S&E, by degree level: 1993–2010 ......3-45Figure 3-32. Highest degree holders in S&E not in the labor force, by sex and age: 2010 .......3-47Figure 3-33. Estimated salary differences between women and men with highest degree
in S&E employed full time, controlling for selected characteristics, by degree level: 2010 ............................................................................................................3-50
Figure 3-34. Estimated salary differences between minorities and whites and Asians with highest degree in S&E employed full time, controlling for selected characteristics, by degree level: 2010 ............................................................................................................3-50
Figure 3-35. Foreign-born scientists and engineers employed in S&E occupations, by highest degree level and broad occupational category: 2010 ...........................................3-52
Figure 3-36. Foreign-born individuals with highest degree in S&E living in the United States, by place of birth: 2010 ...............................................................................................3-53
Figure 3-37. Temporary work visas issued in categories with many high-skilled workers: FYs 1991–2012 ......................................................................................................3-54
Figure 3-38. Plans of foreign recipients of U.S. S&E doctoral degrees at graduation to stay in the United States, by year of doctorate: 1991–2011..............................................3-55
Figure 3-39. Plans of foreign recipients of U.S. S&E doctoral degrees at graduation to stay in the United States, by place of origin and year of doctorate: 1998–2001 and 2008–11 ..........................................................................................................................3-56
Figure 3-40. Stay rates for U.S. S&E doctorate recipients with permanent or temporary visas at graduation, by selected year of doctorate: 2003–11 .................................................3-57
Figure 3-41. Top countries of origin of foreign-born persons residing in OECD countries and having at least a tertiary education, age 25 years or more, by sex: 2000 .......................3-59
Figure 3-42. Estimated number of researchers in selected countries/regions: 1995–2011 ........3-60Figure 3-43. Researchers as a share of total employment in selected countries/regions:
1995–2011 .............................................................................................................................3-60Figure 3-A. Bureau of Labor Statistics projected increases in employment for S&E
and selected other occupations: 2010–20 ..............................................................................3-12Figure 3-B. Bureau of Labor Statistics projected job openings in S&E and selected other
occupations: 2010–20............................................................................................................3-13Figure 3-C. Estimated differences in the proportions of women and of men with S&E
highest degree employed in S&E occupations, controlling for selected characteristics: 2010 .......................................................................................................................................3-46

U.S. S&E Workforce: Definition, Size, and GrowthThe S&E workforce can be defined in several ways: by workers in S&E occupations, by holders of S&E degrees, and by the use of S&E technical expertise on the job. The estimated size of the S&E workforce varies depending on the criteria chosen.
♦ In 2010, estimates of the size of the U.S. S&E workforce ranged from approximately 5 million to more than 19 million depending on the definition used.
♦ In 2010, there were about 5.4 million college gradu-ates employed in S&E occupations in the United States. Occupations in the computer and mathematical sciences (2.4 million) and engineering (1.6 million) were the larg-est categories of S&E occupations. Occupations in the life sciences (597,000), social sciences (518,000), and physical sciences (320,000) each employed a smaller number of S&E workers.
♦ In 2010, about 19.5 million college graduates in the United States had a bachelor’s or higher level degree in an S&E field of study. Almost three-fourths (74%) of these college graduates (14.5 million) held their highest level of degree (bachelor’s, master’s, professional, or doctor-ate) in an S&E field. Overall, the most common fields of S&E highest degrees were social sciences (40%) and en-gineering (23%). Computer and mathematical sciences, life sciences, and physical sciences together accounted for slightly more than one-third (38%) of individuals with S&E highest degrees.
♦ The application of S&E knowledge and skills is wide-spread across the U.S. economy and not just limited to S&E occupations. The number of college-educated individuals reporting that their jobs require at least a bachelor’s degree level of technical expertise in one or more S&E fields (16.5 million) is significantly higher than the number in occupations with formal S&E titles (5.4 million).
The S&E workforce has grown steadily over time. ♦ Between 1960 and 2011, the number of workers in S&E
occupations grew at an average annual rate of 3.3%, greater than the 1.5% growth rate for the total workforce.
♦ Data from more recent years indicate that trends in S&E employment compared favorably to overall employment trends during and after the 2007–09 economic down-turn. Between 2006 and 2012, the number of workers employed in S&E occupations rose slightly, whereas the total workforce shrank.
S&E Workers in the EconomyScientists and engineers work for all types of employers.
♦ By far the largest employer of scientists and engineers (individuals with an S&E degree or employed in an S&E occupation) is the business sector (70%), followed by the education sector (19%) and the government sector (11%). Within the business sector, for-profit businesses employ the largest number of scientists and engineers.
♦ Scientists and engineers with S&E doctorates are more evenly distributed between the business sector (46%) and the education sector (45%). Within the education sector, over 90% are found in 4-year academic institu-tions, including those in postdoctoral and other tempo-rary positions.
♦ Small firms are important employers of those with S&E highest degrees (individuals who attained their highest level of degree in an S&E field of study). Firms with fewer than 100 persons employ 37% of such individuals in the business sector.
♦ Within the business sector, the industry with the largest number of workers in S&E occupations is the profession-al, scientific, and technical services industry.
♦ Employment in S&E occupations is geographically con-centrated in the United States. The 20 metropolitan areas with the largest proportion of the workforce employed in S&E occupations accounted for 18% of nationwide S&E employment, compared to 8% of all employment.
S&E Labor Market ConditionsWorkers with S&E degrees or in S&E occupations tend to earn more than other comparable workers.
♦ Half of the workers in S&E occupations earned $78,270 or more in 2012, more than double the median earnings ($34,750) of the total U.S. workforce.
♦ Employed college graduates with a highest degree in S&E earn more than those with non-S&E degrees. Moreover, within each broad degree field (S&E and non-S&E), those employed in S&E occupations earn more than those in non-S&E occupations.
Individuals whose work is associated with S&E are less often exposed to unemployment.
♦ Unemployment rates for those in S&E occupations tend to be lower than those for all college graduates and much lower than those for the overall labor force. In October 2010, an estimated 4.3% of scientists and engineers and 5.1% of all college-educated individuals in the labor force were unemployed. At the same time, the official un-employment rate for the entire U.S. labor force was 9.0%.
♦ Unemployment rates for S&E doctorate holders are gen-erally lower than for those at other degree levels.
Highlights
Science and Engineering Indicators 2014 ♦ 3-5

Demographics of the S&E WorkforceThe U.S. S&E labor force is aging. However, in 2010, a larger proportion of older scientists and engineers re-ported being in the labor force than in 1993.
♦ The proportion of scientists and engineers in the U.S. la-bor force over age 50 increased from 20% in 1993 to 33% in 2010. The median age of such individuals was 44 years in 2010, compared to 41 years in 1993.
♦ Between 1993 and 2010, increasing percentages of sci-entists and engineers in their 60s reported that they were still in the labor force. Whereas 54% of scientists and en-gineers between the ages of 60 and 69 were employed in 1993, the comparable percentage rose to 63% in 2010.
Women remain underrepresented in the S&E workforce, although to a lesser degree than in the past.
♦ Despite accounting for half of the college-educated work-force, in 2010 women constituted 37% of employed indi-viduals with a highest degree in an S&E field and 28% of employed individuals in S&E occupations.
♦ From 1993 to 2010, growth occurred in both the propor-tion of workers with a highest degree in an S&E field who are women (increasing from 31% to 37%) and the proportion of women in S&E occupations (increasing from 23% to 28%).
♦ Women employed in S&E occupations are concentrated in different occupational categories than are men, with relatively high proportions of women in the social sci-ences (58%) and life sciences (48%) and relatively low proportions in engineering (13%) and computer and mathematical sciences (25%).
Historically underrepresented racial and ethnic groups, particularly blacks and Hispanics, continue to display lower S&E participation rates relative to their presence in the U.S. population. Conversely, Asians and foreign-born individuals display higher S&E participation rates relative to their overall presence in the U.S. population.
♦ Hispanics, blacks, and American Indians or Alaska Natives together make up 26% of the U.S. population age 21 and older but a much smaller proportion of the S&E workforce: 10% of workers in S&E occupations and 13% of S&E highest degree holders.
♦ Asians work in S&E occupations at higher rates (19%) than their representation in the U.S. population age 21 and older (5%). Asians have a large presence in engineering and computer sciences occupations, particularly among computer software and hardware engineers, software de-velopers, and postsecondary teachers in engineering.
♦ About 70% of workers in S&E occupations are non-His-panic whites, which is comparable to their overall repre-sentation in the U.S. population age 21 and older (68%).
♦ Foreign-born individuals account for slightly more than one-fourth of all workers in S&E occupations, which is higher than their representation in the entire college-edu-cated workforce (15%). Foreign-born workers employed in S&E occupations tend to have higher levels of educa-tion than their U.S. native-born counterparts.
A variety of indicators point to a decline in the immi-gration of scientists and engineers during the 2007–09 economic downturn. However, data since the downturn suggest that this decline may be temporary.
♦ After several years of growth, the number of temporary work visas issued to high-skill workers fell during the 2007–09 economic downturn. It has rebounded since then, although data for 2012 indicate that the issuance of temporary work visas has not yet reached the recent highs seen in 2007 and 2008.
♦ After rising for most of the decade 2000–09, the number of foreign recipients of U.S. S&E doctoral degrees de-clined in 2009 and 2010. It has risen slightly in 2011 but remains below the recent highs seen in 2007 and 2008.
♦ Among foreign-born U.S. S&E doctorate recipients with temporary visas at graduation, the proportion that re-mained in the United States 5 years after receiving their degrees rose during the first half of the decade of the 2000s, reaching 67% in 2005. The proportion declined during the economic downturn but rose to 66% in 2011.
Global S&E Labor ForceWorldwide, the number of workers engaged in research has been growing.
♦ Among countries with large numbers of researchers—defined as workers engaged in the creation and development of new knowledge, products, and processes—growth has been most rapid since the mid-1990s in China and South Korea.
♦ The United States and the European Union experi-enced steady growth but at a lower rate than in China or South Korea.
♦ Japan and Russia were exceptions to the worldwide trend. Between 1995 and 2011, the number of researchers in Japan remained largely unchanged, and in Russia the number declined.
3-6 ♦ Chapter 3. Science and Engineering Labor Force
Science and Engineering Indicators 2014 ♦ 3-7
IntroductionChapter Overview
Policymakers and scholars consistently emphasize inno-vation based on S&E research and development as a vehicle for a nation’s economic growth and global competitiveness. Workers with S&E expertise are an integral part of a na-tion’s innovative capacity because of their high skill level, their creative ideas, and their ability not only to advance ba-sic scientific knowledge but also to transform advances in fundamental knowledge into tangible products and services. As a result, these workers make important contributions to improving living standards and accelerating the pace of a nation’s economic and productivity growth.
Chapter OrganizationThe U.S. workforce includes both individuals employed
in S&E occupations and individuals educated in S&E fields but employed in a variety of non-S&E occupations. Many more individuals have S&E degrees than work in S&E oc-cupations. Indicative of a knowledge-based economy, many individuals in non-S&E occupations report that their work nevertheless requires a bachelor’s degree level of S&E ex-pertise. Therefore, the first section in this chapter, “U.S. S&E Workforce: Definition, Size, and Growth,” discusses the U.S. S&E workforce based on three measures: workers in S&E occupations, holders of S&E degrees, and use of S&E technical expertise on the job. This section also dis-cusses the interplay between educational background and occupational choice as well as the growth in the U.S. S&E workforce over time.
The second section in this chapter, “S&E Workers in the Economy,” examines the distribution of S&E workers across employment sectors. It describes the distribution of S&E workers across sectors (e.g., business, education, gov-ernment) as well as within particular sectors (e.g., local, state, and federal government). This section also presents data on geographic distribution of S&E employment in the United States. Data on R&D activity and work-related train-ing by S&E workers are also discussed.
The third section, “S&E Labor Market Conditions,” looks at labor market outcomes for S&E workers. Data in this sec-tion focus on earnings and unemployment. Data on recent S&E graduates are also discussed, as are broader measures of labor underutilization that go beyond the conventional un-employment rate.
The next three sections cover labor force demographics. “Age and Retirement of the S&E Workforce” presents data on the age distribution and retirement patterns of S&E work-ers. “Women and Minorities in the S&E Workforce” focuses on S&E participation by women and by racial and ethnic minorities; this section also presents data on salary differ-ences by sex and by race and ethnicity. “Immigration and the S&E Workforce” presents data on S&E participation by foreign-born individuals in the United States as well as the worldwide migration patterns of high-skill workers.
The final section in this chapter is “Global S&E Labor Force.” Although there are indications that the global S&E labor force has grown, international data on the characteris-tics of this broader labor force are particularly limited and are not always comparable with data for the United States. In this final section, data from the Organisation for Economic Co-operation and Development (OECD) are used to present indicators of worldwide R&D employment.
This chapter uses a variety of data sources, including, but not limited to, the National Science Foundation’s (NSF’s) Scientists and Engineers Statistical Data System (SESTAT), the Census Bureau’s American Community Survey (ACS), the Occupational Employment Statistics (OES) survey ad-ministered by the Bureau of Labor Statistics (BLS), and the Current Population Survey (CPS) sponsored jointly by the Census Bureau and BLS. Different sources cover different segments of the population and different levels of detail on different topics. (See table 3-1 and sidebar, “NSF’s Scientists and Engineers Statistical Data System.”) Although data col-lection methods and definitions can differ across surveys in ways that affect estimates, combining data from different sources facilitates an accurate and comprehensive picture of the very specialized S&E workforce. A particular mea-sure or categorization of the workforce may be better suited for addressing some questions than others, and a particular data source may not include information in every category. Analyses of long-term trends, international trends, and com-parison of S&E and non-S&E workers are discussed when-ever data are available.
U.S. S&E Workforce: Definition, Size, and Growth
Definition of the S&E WorkforceBecause there is no standard definition of S&E work-
ers, this section uses multiple categorizations to measure the U.S. S&E workforce. In general, this section defines the S&E workforce to include people who either work in S&E occupations or hold S&E degrees.1 The application of S&E knowledge and skills is not limited to jobs with formal S&E titles; the number of college graduates reporting that their jobs require at least a bachelor’s degree level of knowledge in one or more S&E fields exceeds the number of workers employed in S&E occupations in the economy. Therefore, this section also presents data on the use of S&E techni-cal expertise on the job to provide an estimate of the U.S. S&E workforce. The estimated number of scientists and engineers varies based on the criteria applied to define the S&E workforce.
U.S. federal occupation data classify workers by the ac-tivities or tasks they primarily perform in their jobs. The NSF and Census Bureau occupational data in this chapter come from federal statistical surveys in which individuals or household members provide information about job titles and work activities. This information is used to classify jobs

3-8 ♦ Chapter 3. Science and Engineering Labor Force
into standard occupational categories based on the Standard Occupational Classification (SOC) system.2 In contrast, the BLS-administered OES survey relies on employers to clas-sify their workers using SOC definitions. Differences be-tween employer- and individual-provided information can affect the content of occupational data.
NSF has developed a widely used set of SOC categories that it calls S&E occupations. Very broadly, these occupa-tions include life scientists, computer and mathematical sci-entists, physical scientists, social scientists, and engineers. NSF also includes postsecondary teachers of these fields in S&E occupations. A second category of occupations, S&E-related occupations, includes health-related occupations, S&E managers, S&E technicians and technologists, archi-tects, actuaries, S&E precollege teachers, and postsecond-ary teachers in S&E-related fields. The S&E occupations are generally assumed to require at least a bachelor’s de-gree level of education in an S&E field. The vast majority of S&E-related occupations also require S&E knowledge or training, but an S&E bachelor’s degree may not be a
required credential for employment in some of these occu-pations. Examples include health technicians and computer network managers. Other occupations, although classified as non-S&E occupations, may include individuals who use S&E technical expertise in their work. Examples include technical writers who edit scientific publications and sales-people who sell specialized research equipment to chemists and biologists. The NSF occupational classification of S&E, S&E-related, and non-S&E occupations appears in table 3-2 along with the NSF educational classification of S&E, S&E-related, and non-S&E degree fields.
Other general terms, including science, technology, engi-neering, and mathematics (STEM), science and technology (S&T), and science, engineering, and technology (SET), are often used to designate the part of the labor force that works with S&E. These terms are broadly equivalent and have no standard definition.
The number of individuals who have S&E training or who reported applying S&E technical expertise in their jobs exceeds the number of individuals employed in S&E
Table 3-1Major sources of data on the U.S. labor force
Data source Data collection agency Data years Major topics Respondent Coverage
Occupational Employment Statistics (OES)
Department of Labor, Bureau of Labor Statistics
Through 2012 Employment status Occupation Salary IndustryEmployer location
(national, state, metropolitan statistical area)
Employing organizations
All full-time and part-time wage and salary workers in non-farm industries; does not cover self-employed, unincorporated firms, household workers, or unpaid family workers
Scientists and Engineers Statistical Data System—see sidebar “NSF’s Scientists and Engineers Statistical Data System”
National Science Foundation, National Center for Science and Engineering Statistics
Through 2010 Employment status Occupation Job characteristics
(work activities, technical expertise)
Salary Detailed educational
history Demographic
characteristics
Individuals Individuals with bachelor’s degree or higher in S&E or S&E-related field or with non-S&E bachelor’s but working in S&E or S&E-related occupation
American Community Survey (ACS)
Department of Commerce, Census Bureau
Through 2011 Employment status Occupation First bachelor’s
degree field Educational
attainment Demographic
characteristics
Households U.S. population
Current Population Survey (CPS)
Department of Labor, Bureau of Labor Statistics
Through 2013 Employment status Occupation Educational
attainment Demographic
characteristics
Households Civilian noninstitutional population age 16 and over
Science and Engineering Indicators 2014

Science and Engineering Indicators 2014 ♦ 3-9
NSF’s Scientists and Engineers Statistical Data System (SESTAT) provides detailed employment, education, and demographic data for scientists and engineers under age 76 residing in the United States. The 2010 SESTAT defines scientists and engineers as individuals who have college degrees in S&E or S&E-related fields or who are working in S&E or S&E-related occupations.* (See table 3-2 for def-initions of S&E and S&E-related occupations.) Unless oth-erwise noted, the term “scientists and engineers” as used in this chapter refers to this broad SESTAT population. Data available through SESTAT are collected by three large demographic and workforce surveys of individuals con-ducted by NSF: the National Survey of College Graduates (NSCG), the National Survey of Recent College Graduates (NSRCG), and the Survey of Doctorate Recipients (SDR). SESTAT integrates the data from the three surveys, and together the data provide a comprehensive picture of sci-entists and engineers in the United States.
The NSCG is the central component of SESTAT, providing data that detail the characteristics of the entire college-educated population in the United States (regard-less of their S&E background). Its population of college graduates includes individuals trained as scientists and
engineers who hold at least a bachelor’s degree. Because it covers the entire college graduate population residing in the United States, the NSCG provides information on individuals educated or employed in S&E fields as well as those employed or educated in non-S&E fields. The data presented in this chapter for all college graduates (regardless of S&E background) are based on the NSCG.
Whereas NSCG data cover the general college-edu-cated population, the NSRCG supplements SESTAT by adding recent college graduates at the bachelor’s and master’s degree level. The 2010 NSRCG data represent almost 1.5 million recent bachelor’s and master’s gradu-ates in science, engineering, and health (SEH) fields from academic years 2008 and 2009.
The SDR supplements SESTAT by adding doctoral scientists and engineers who earned their SEH doctorates from U.S. academic institutions. Data from the 2010 SDR were collected from doctoral graduates who received SEH research degrees from a U.S. academic institution before 1 July 2009.
*For details on the 2010 SESTAT see http://www.nsf.gov/statistics/sestat/ and http://www.nsf.gov/statistics/infbrief/nsf13311/.
NSF’s Scientists and Engineers Statistical Data System
Table 3-2Classification of degree fields and occupations
Occupation classification
Classification Degree field Occupation STEM S&T
S&E Biological, agricultural, and environmental life sciences
Biological, agricultural, and environmental life scientists
X X
Computer and mathematical sciences Computer and mathematical scientists X XPhysical sciences Physical scientists X XSocial sciences Social scientists X XEngineering Engineers X X
S&E postsecondary teachers X X
S&E-related Health fields Health-related occupationsScience and math teacher education S&E managers XTechnology and technical fields S&E precollege teachersArchitecture S&E technicians and technologists X XActuarial science Architects
ActuariesS&E-related postsecondary teachers
Non-S&E Management and administration Non-S&E managersEducation (except science and math
teacher education)Management-related occupationsNon-S&E precollege teachers
Social services and related fields Non-S&E postsecondary teachersSales and marketing Social services occupationsArts and humanities Sales and marketing occupationsOther fields Arts and humanities occupations
Other occupations
S&T = science and technology; STEM = science, technology, engineering, and mathematics.
NOTES: The designations STEM and S&T refer to occupations only. For more detailed classification of occupations and degrees by S&E, S&E-related, and non-S&E, see National Science Foundation, National Center for Science and Engineering Statistics, Scientists and Engineers Statistical Data System (SESTAT), http://sestat.nsf.gov.
Science and Engineering Indicators 2014
3-10 ♦ Chapter 3. Science and Engineering Labor Force
occupations. A relatively narrow definition of the S&E workforce consists of workers in occupations that NSF des-ignates as S&E occupations. A much broader definition of an S&E worker, defined by SESTAT, includes any individ-ual with at least a bachelor’s (or higher) degree in an S&E or S&E-related field of study or a college graduate in any field employed in an S&E or S&E-related occupation. The S&E workforce may also be defined by the technical expertise or training required to perform a job. Unlike information on occupational categories or educational credentials, informa-tion on the use of technical knowledge, skills, or expertise in a person’s job reflects that individual’s subjective opinion about the content and characteristics of the job.3 The next section provides estimates of the size of the S&E workforce using all three definitions.
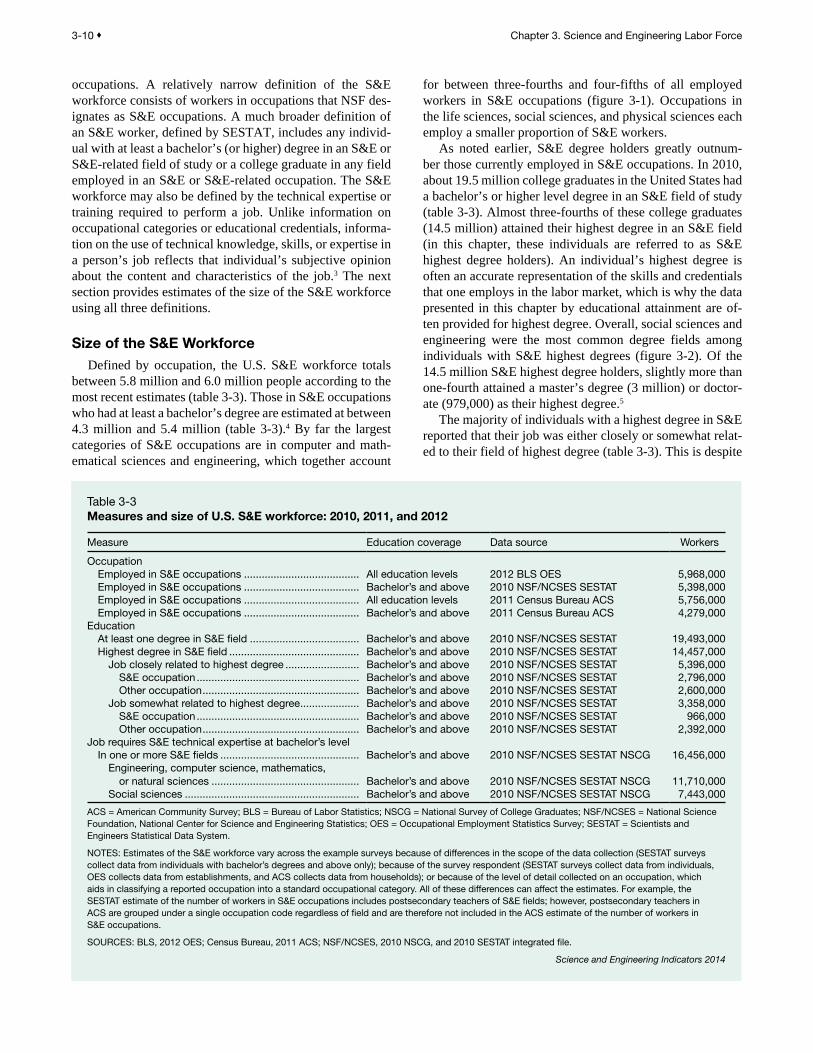
Size of the S&E WorkforceDefined by occupation, the U.S. S&E workforce totals
between 5.8 million and 6.0 million people according to the most recent estimates (table 3-3). Those in S&E occupations who had at least a bachelor’s degree are estimated at between 4.3 million and 5.4 million (table 3-3).4 By far the largest categories of S&E occupations are in computer and math-ematical sciences and engineering, which together account
for between three-fourths and four-fifths of all employed workers in S&E occupations (figure 3-1). Occupations in the life sciences, social sciences, and physical sciences each employ a smaller proportion of S&E workers.
As noted earlier, S&E degree holders greatly outnum-ber those currently employed in S&E occupations. In 2010, about 19.5 million college graduates in the United States had a bachelor’s or higher level degree in an S&E field of study (table 3-3). Almost three-fourths of these college graduates (14.5 million) attained their highest degree in an S&E field (in this chapter, these individuals are referred to as S&E highest degree holders). An individual’s highest degree is often an accurate representation of the skills and credentials that one employs in the labor market, which is why the data presented in this chapter by educational attainment are of-ten provided for highest degree. Overall, social sciences and engineering were the most common degree fields among individuals with S&E highest degrees (figure 3-2). Of the 14.5 million S&E highest degree holders, slightly more than one-fourth attained a master’s degree (3 million) or doctor-ate (979,000) as their highest degree.5
The majority of individuals with a highest degree in S&E reported that their job was either closely or somewhat relat-ed to their field of highest degree (table 3-3). This is despite
Table 3-3Measures and size of U.S. S&E workforce: 2010, 2011, and 2012
Measure Education coverage Data source Workers
OccupationEmployed in S&E occupations ....................................... All education levels 2012 BLS OES 5,968,000Employed in S&E occupations ....................................... Bachelor’s and above 2010 NSF/NCSES SESTAT 5,398,000Employed in S&E occupations ....................................... All education levels 2011 Census Bureau ACS 5,756,000Employed in S&E occupations ....................................... Bachelor’s and above 2011 Census Bureau ACS 4,279,000
EducationAt least one degree in S&E field ..................................... Bachelor’s and above 2010 NSF/NCSES SESTAT 19,493,000Highest degree in S&E field ............................................ Bachelor’s and above 2010 NSF/NCSES SESTAT 14,457,000
Job closely related to highest degree ......................... Bachelor’s and above 2010 NSF/NCSES SESTAT 5,396,000S&E occupation ....................................................... Bachelor’s and above 2010 NSF/NCSES SESTAT 2,796,000Other occupation ..................................................... Bachelor’s and above 2010 NSF/NCSES SESTAT 2,600,000
Job somewhat related to highest degree .................... Bachelor’s and above 2010 NSF/NCSES SESTAT 3,358,000S&E occupation ....................................................... Bachelor’s and above 2010 NSF/NCSES SESTAT 966,000Other occupation ..................................................... Bachelor’s and above 2010 NSF/NCSES SESTAT 2,392,000
Job requires S&E technical expertise at bachelor’s levelIn one or more S&E fields ............................................... Bachelor’s and above 2010 NSF/NCSES SESTAT NSCG 16,456,000
Engineering, computer science, mathematics, or natural sciences .................................................. Bachelor’s and above 2010 NSF/NCSES SESTAT NSCG 11,710,000
Social sciences ........................................................... Bachelor’s and above 2010 NSF/NCSES SESTAT NSCG 7,443,000
ACS = American Community Survey; BLS = Bureau of Labor Statistics; NSCG = National Survey of College Graduates; NSF/NCSES = National Science Foundation, National Center for Science and Engineering Statistics; OES = Occupational Employment Statistics Survey; SESTAT = Scientists and Engineers Statistical Data System.
NOTES: Estimates of the S&E workforce vary across the example surveys because of differences in the scope of the data collection (SESTAT surveys collect data from individuals with bachelor’s degrees and above only); because of the survey respondent (SESTAT surveys collect data from individuals, OES collects data from establishments, and ACS collects data from households); or because of the level of detail collected on an occupation, which aids in classifying a reported occupation into a standard occupational category. All of these differences can affect the estimates. For example, the SESTAT estimate of the number of workers in S&E occupations includes postsecondary teachers of S&E fields; however, postsecondary teachers in ACS are grouped under a single occupation code regardless of field and are therefore not included in the ACS estimate of the number of workers in S&E occupations.
SOURCES: BLS, 2012 OES; Census Bureau, 2011 ACS; NSF/NCSES, 2010 NSCG, and 2010 SESTAT integrated file.
Science and Engineering Indicators 2014

Science and Engineering Indicators 2014 ♦ 3-11
the fact that many of these individuals were employed in oc-cupations not categorized as S&E. This suggests that the ap-plication of S&E knowledge and skills is widespread across the U.S. economy and not just limited to S&E occupations.
The extensive use of S&E expertise in the workplace is also evident from the number of college graduates who in-dicate that their jobs require technical expertise at the bach-elor’s degree level in S&E fields. According to the 2010 National Survey of College Graduates (NSCG), 16.5 mil-lion college graduates reported that their jobs require at least this level of technical expertise in one or more S&E fields (table 3-3). This figure is much higher than the estimated number of college graduates employed in S&E occupations (5.4 million).
Growth of the S&E WorkforceThe S&E workforce has grown faster over time than the
overall workforce. According to Census Bureau data, em-ployment in S&E occupations grew from about 1.1 million in 1960 to about 5.8 million in 2011.6 This represents an average annual growth rate of 3.3%, compared to the 1.5% growth in total employment during this period. As a pro-portion of all employment, S&E occupational employment grew from 1.6% in 1960 to 4.1% in 2011.
Data from more recent years indicate that trends in S&E employment compared favorably to overall employment trends during and after the 2007–09 economic downturn. OES employment estimates from BLS indicate that the size of the S&E workforce rose slightly from 5.4 million in May 2006 to 5.8 million in May 2009 and then remained relative-ly steady through May 2012, reaching a level of 6 million. In contrast, the total workforce during this period declined from 133 million in May 2006 to 131 million in May 2009 and then to 130 million in May 2012. The broader STEM aggregate (including S&E technicians, S&E managers, etc.) remained relatively steady at 7.9 million in May 2012, com-pared with 7.8 million in May 2009 and 7.4 million in May 2006. BLS projects that between 2010 and 2020 S&E occu-pations—particularly computer and mathematical sciences, life sciences, and social sciences-related occupations—will grow at a faster rate than the total workforce. (See sidebar, “Projected Growth of Employment in S&E Occupations.”)
The growth in the number of individuals with S&E de-grees in recent years can be examined using data from NSF’s SESTAT. The number of S&E highest degree holders em-ployed in the United States grew from 9.6 million to 11.4 million between 2003 and 2010, with most broad fields ex-hibiting growth (figure 3-3). Similarly, employment in S&E occupations among college degree holders rose from 4.8 million to 5.4 million during this timeframe. Although indi-viduals with advanced degrees beyond the bachelor’s level
SOURCES: Bureau of Labor Statistics, Occupational Employment Statistics Survey, 2012; National Science Foundation, National Center for Science and Engineering Statistics, Scientists and Engineers Statistical Data System (SESTAT) (2010), http://sestat.nsf.gov.
Science and Engineering Indicators 2014
Percent
Figure 3-1Employment in S&E occupations, by broad occupational category: 2010 and 2012
2010(bachelor’s
education andhigher)
2012(all education
levels)
0
20
40
60
80
100
Life scientists
Computer and mathematical scientists
Physical scientists
Social scientists
Engineers
NOTE: All degree levels include professional degrees not shown separately.
SOURCE: National Science Foundation, National Center for Science and Engineering Statistics, Scientists and Engineers Statistical Data System (SESTAT) (2010), http://sestat.nsf.gov.
Science and Engineering Indicators 2014
Percent
Figure 3-2S&E degrees among college graduates, by field and level of highest degree: 2010
Allhighestdegreelevels
Highestdegree:
Bachelor’s
Highestdegree:Master’s
Highestdegree:
Doctorate
0
20
40
60
80
100
Biological, agricultural, and environmental life sciences
Computer and mathematical sciences
Physicalsciences
Socialsciences
Engineering

3-12 ♦ Chapter 3. Science and Engineering Labor Force
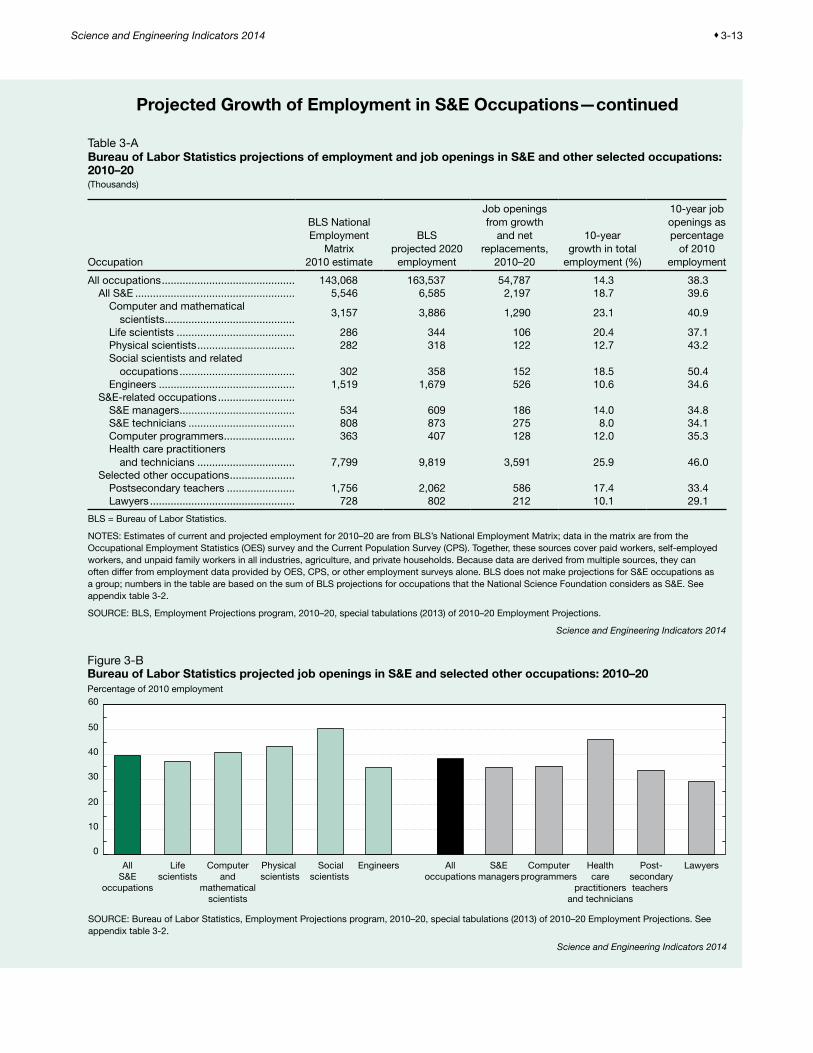
The most recent Bureau of Labor Statistics (BLS) oc-cupational projections, for the period 2010–20, suggest that total employment in occupations that NSF classifies as S&E will increase at a faster rate (18.7%) than employment in all occupations (14.3%) (figure 3-A; table 3-A). These projec-tions are based only on the demand for narrowly defined S&E occupations and do not include the wider range of occupations in which S&E degree holders often use their training.
BLS also projects that, for the period 2010–20, job open-ings in NSF-identified S&E occupations will represent a slightly larger proportion of current employment than open-ings in all other occupations: 39.6% versus 38.3% (figure 3-B). Job openings include both growth in total employment and openings caused by attrition.
Of the BLS-projected job openings in NSF-identified S&E occupations, 59% are in computer and mathematical scientist occupations, the largest sub-category of S&E oc-cupations (table 3-A). These occupations also have the larg-est growth rate (23.1%). Life sciences and social sciences occupations, which account for a much smaller proportion of S&E occupations, have the next highest projected growth rates: 20.4% and 18.5%, respectively. Job openings in the social sciences are projected to be particularly high, repre-senting half of the current employment in that field. Physical scientists and engineering occupations are projected to grow at rates slightly lower than the rate for all occupations. Total job openings in physical sciences, however, are expected to represent a larger share of current employment than open-ings in all occupations.
In addition to S&E occupations, table 3-A also shows selected other occupations that contain significant numbers of S&E-trained workers. Among these, the health care prac-titioners and technicians occupation, which employs more workers than all S&E occupations combined, is projected to grow at 25.9%, nearly double the rate of growth in all occupations. The postsecondary teachers occupation, which includes all fields of instruction, and the S&E managers oc-cupation are projected to grow 17.4% and 14.0%, respec-tively, both of which are lower than the projected growth rate in S&E occupations but close to (S&E managers) or higher than (postsecondary teachers) the projected growth rate in all occupations. In contrast, BLS projects that com-puter programmers and S&E technicians will grow more slowly than all occupations as well as all S&E occupations.
Employment projections are uncertain.* Many indus-try and government decisions that affect hiring are closely linked to national and global fluctuations in aggregate eco-nomic activity, which are difficult to forecast long in ad-vance. In addition, technological and other innovations will influence demand for workers in specific occupations. The assumptions underlying projections are sensitive to funda-mental empirical relationships, and, as a result, may be-come less accurate as overall economic conditions change.
* Although BLS does a reasonable job of projecting employment in many occupations, the mean absolute percentage error in the 1996 fore-cast of employment in detailed occupations in 2006 was 17.6% (Wyatt 2010). The inaccuracies in the 1996 projection of 2006 employment were primarily driven by not projecting the housing bubble and increas-es in oil prices (Wyatt 2010).
Projected Growth of Employment in S&E Occupations
Figure 3-ABureau of Labor Statistics projected increases in employment for S&E and selected other occupations: 2010–20Percent
SOURCE: Bureau of Labor Statistics, Employment Projections program, 2010–20, special tabulations (2013) of 2010–20 Employment Projections. See appendix table 3-2.
Science and Engineering Indicators 2014
AllS&E
occupations
Lifescientists
Computerand
mathematicalscientists
Socialscientists
Physicalscientists
Engineers Alloccupations
Healthcare
practitionersand technicians
S&Emanagers
Post-secondaryteachers
LawyersComputerprogrammers
0
5
10
15
20
25
30
Science and Engineering Indicators 2014 ♦ 3-13
Projected Growth of Employment in S&E Occupations—continued
Table 3-ABureau of Labor Statistics projections of employment and job openings in S&E and other selected occupations: 2010–20(Thousands)
Occupation
BLS National Employment
Matrix 2010 estimate
BLS projected 2020
employment
Job openings from growth
and net replacements,
2010–20
10-year growth in total
employment (%)
10-year job openings as percentage
of 2010 employment
All occupations ............................................. 143,068 163,537 54,787 14.3 38.3All S&E ...................................................... 5,546 6,585 2,197 18.7 39.6
Computer and mathematical scientists ............................................
3,157 3,886 1,290 23.1 40.9
Life scientists ........................................ 286 344 106 20.4 37.1Physical scientists ................................. 282 318 122 12.7 43.2Social scientists and related
occupations ....................................... 302 358 152 18.5 50.4Engineers .............................................. 1,519 1,679 526 10.6 34.6
S&E-related occupations ..........................S&E managers ....................................... 534 609 186 14.0 34.8S&E technicians .................................... 808 873 275 8.0 34.1Computer programmers ........................ 363 407 128 12.0 35.3Health care practitioners
and technicians ................................. 7,799 9,819 3,591 25.9 46.0Selected other occupations ......................
Postsecondary teachers ....................... 1,756 2,062 586 17.4 33.4Lawyers ................................................. 728 802 212 10.1 29.1
BLS = Bureau of Labor Statistics.
NOTES: Estimates of current and projected employment for 2010–20 are from BLS’s National Employment Matrix; data in the matrix are from the Occupational Employment Statistics (OES) survey and the Current Population Survey (CPS). Together, these sources cover paid workers, self-employed workers, and unpaid family workers in all industries, agriculture, and private households. Because data are derived from multiple sources, they can often differ from employment data provided by OES, CPS, or other employment surveys alone. BLS does not make projections for S&E occupations as a group; numbers in the table are based on the sum of BLS projections for occupations that the National Science Foundation considers as S&E. See appendix table 3-2.
SOURCE: BLS, Employment Projections program, 2010–20, special tabulations (2013) of 2010–20 Employment Projections.
Science and Engineering Indicators 2014
Figure 3-BBureau of Labor Statistics projected job openings in S&E and selected other occupations: 2010–20Percentage of 2010 employment
SOURCE: Bureau of Labor Statistics, Employment Projections program, 2010–20, special tabulations (2013) of 2010–20 Employment Projections. See appendix table 3-2.
Science and Engineering Indicators 2014
AllS&E
occupations
Lifescientists
Computerand
mathematicalscientists
Socialscientists
Physical scientists
Engineers Alloccupations
Healthcare
practitionersand technicians
S&Emanagers
Post-secondaryteachers
LawyersComputerprogrammers
0
10
20
30
40
50
60

3-14 ♦ Chapter 3. Science and Engineering Labor Force
GED = General Equivalency Diploma.
SOURCE: Census Bureau, American Community Survey (2011).
Science and Engineering Indicators 2014
Percent
Figure 3-4Educational attainment, by type of occupation: 2011
S&E occupations,except
postsecondaryteachers
All otheroccupations
0
20
40
60
80
100
High school or less, no diploma
High school diploma or GED
Some college, no degree
Associate’s
Bachelor’s
Master’s
Professional
Doctorate
account for a minority of the college graduate population, between 2003 and 2010 the growth in S&E degree holders with advanced degrees generally outpaced the growth in in-dividuals with bachelor’s degrees in most broad fields (with the exception of social sciences) (figure 3-3). (See chapter 2 for a fuller discussion of S&E degrees.)
A number of factors likely contributed to the growth in the U.S. S&E labor force over time: the rising demand for S&E skills in a global and highly technological economic landscape; increases in U.S. S&E degrees earned by women, by racial and ethnic minority groups, and by foreign-born individuals; temporary and permanent migration to the United States of those with foreign S&E educations; and the relatively small proportion of scientists and engineers retir-ing from the S&E labor force. The demographic sections of this chapter provide data on aging and retirement patterns of scientists and engineers as well as on S&E participation by women, by racial and ethnic minorities, and by foreign- born individuals.
Educational Distribution of Workers in S&E Occupations
Workers in S&E occupations have undergone more formal education than the general workforce (figure 3-4). Data from the 2011 ACS indicate that a larger proportion of workers in nonacademic S&E occupations (74%) hold a bachelor’s or higher degree than workers in all other occu-pations (30%).7 The proportion of workers with advanced degrees beyond the bachelor’s level is 31% in S&E occu-pations, compared to 11% in all other occupations. About 7% of all S&E workers (except postsecondary teachers) have doctorates.
Figure 3-3Average annual growth in the number of employed individuals whose highest degree is in S&E, by field and level of highest degree: 2003–10Percent
SOURCE: National Science Foundation, National Center for Science and Engineering Statistics, Science and Engineering Statistical Data System (SESTAT) (2003 and 2010), http://sestat.nsf.gov.
Science and Engineering Indicators 2014
Computer andmathematical sciences
Biological, agricultural, andenvironmental life sciences
Physical sciences Social sciences Engineering
–1
0
–2
1
2
3
4
5
6
Bachelor’s Master’s Doctorate

Science and Engineering Indicators 2014 ♦ 3-15
Compared with the rest of the workforce, a very small minority of those employed in S&E occupations have only a high school degree. Many individuals enter the S&E workforce with marketable technical skills from technical or vocational schools (with or without an earned associ-ate’s degree) or college courses, and many acquire these skills through workforce experience or on-the-job training. In information technology, and to some extent in other oc-cupations, employers frequently use certification exams, not formal degrees, to judge skills. (See sidebar, “The U.S. S&E Workforce Without a Bachelor’s Degree” and the discussion in chapter 2.)
According to the 2010 SESTAT data, the vast major-ity (81%) of college graduates employed in S&E occupa-tions have at least one S&E degree (table 3-4), suggesting that formal S&E training is the usual pathway for obtaining
employment in these occupations. However, the importance of formal S&E training in the same broad field as one’s S&E occupation varies across occupational categories. Among computer and mathematical scientists, for example, less than half (44%) have a bachelor’s or higher level degree in the field of computer and mathematical sciences. The pro-portion is significantly higher in other broad S&E occupa-tional categories: 73% of life scientists, 72% of physical scientists, 77% of social scientists, and 81% of engineers have a bachelor’s or higher level degree in their respective broad field. Slightly more than one-fourth (28%) of comput-er and mathematical scientists do not have any S&E degree. The next section presents data on the proportion of S&E de-gree holders who obtain employment in S&E and non-S&E occupational categories.
Although the Scientists and Engineers Statistical Data System (SESTAT) provides detailed information on col-lege graduate scientists and engineers, it lacks similar data on individuals who do not have a bachelor’s degree. The Census Bureau’s American Community Survey (ACS) provides nationally representative occupational data for workers at all levels of education.* In 2011, about one-fourth of S&E workers age 25 and older did not have a bachelor’s degree. This sidebar looks at the demograph-ic, educational, and employment characteristics of these S&E workers without a bachelor’s degree.†
Relative to college graduate workers employed in S&E occupations, a disproportionate number of those without a bachelor’s degree employed in S&E occupa-tions were black or Hispanic and native U.S. born. In 2011, about 9% of S&E workers without a bachelor’s de-gree were black, and another 9% were Hispanic. In con-trast, 6% of college-educated S&E workers were black and 5% were Hispanic. Asians represented only 3% of S&E workers without a bachelor’s degree, compared to 19% of S&E workers with a bachelor’s degree. In 2011, only 8% of S&E workers without a college degree were foreign born, compared to about one-fourth of college-educated S&E workers.
S&E workers without a bachelor’s degree were mostly concentrated in computer occupations, with 69% employed in the field. In comparison, 44% of the college-educated S&E workers held computer jobs. Among com-puter occupations, computer support specialists, network and computer systems administrators, and other com-puter occupations together represented about half of the S&E workers without a bachelor’s degree employed in computer occupations. Unlike the computer field, life sci-ences, physical sciences, and social sciences occupations
had much smaller proportions of workers without a bach-elor’s degree. About 3% of the S&E workforce without a bachelor’s degree were employed in these areas com-bined, compared to about one-fifth of the college-educat-ed S&E workforce.
Relative to other occupations, S&E occupations pro-vide stable employment with good earnings for workers without a college degree. In 2011, the median earnings among workers 25 years of age and older, without a bachelor’s degree, and employed in S&E occupations ($60,000) was twice as high as the median earnings among comparable workers employed in other occupa-tions ($30,000). The unemployment rate among these workers in S&E occupations was 6%, about half the rate in other occupations (11%).
Workers employed in S&E occupations had more formal training (even if they did not have a bachelor’s degree) than those employed in other occupations, so it is not surprising that salaries were higher in S&E jobs. About one-third of the workers without a bachelor’s degree employed in S&E occupations had an associ-ate’s degree, compared to 14% of those employed in other occupations.
* For methodological reasons, estimates from ACS and SESTAT dif-fer slightly even for the college graduate population, which both sur-veys cover. For example, the two surveys vary in the level of detail collected on work activities, which affects how workers are coded into standard occupational categories. In addition, ACS collects data from households, whereas SESTAT collects data from individuals. Finally, the analysis using ACS data counts postsecondary teachers of S&E as working in non-S&E occupations because the Census Bureau data do not identify them by field.
† This sidebar defines the S&E workforce by workers in S&E occu-pations (except postsecondary teachers in S&E fields). The ACS data do not allow for separate identification of postsecondary teachers by fields. See appendix table 3-1 for a list of S&E occupations in the 2011 ACS.
The U.S. S&E Workforce Without a Bachelor’s Degree

3-16 ♦ Chapter 3. Science and Engineering Labor Force
Occupational Distribution of S&E Degree Holders and Relationship between Jobs and Degrees
NSF’s SESTAT provides information on the degree and occupational choices of scientists and engineers in the United States, thus enabling a comparison of the interplay between degree and occupation for members of the S&E workforce with and without a highest degree in an S&E dis-cipline. Although an S&E degree is often necessary to obtain S&E employment, the data indicate that many individuals with S&E degrees pursue careers outside of S&E. The ma-jority of workers with S&E training who work in non-S&E jobs reported that their work is nonetheless related to their S&E training, suggesting that the application of S&E skills and expertise extends well beyond the jobs NSF classifies as S&E. (The next section, “S&E Workers in the Economy,” provides data on R&D activity of scientists and engineers employed in S&E and non-S&E occupations.)
Only about half of S&E highest degree holders are em-ployed in an S&E (35%) or S&E-related (14%) occupation; the rest are employed in non-S&E occupations. Figure 3-5 shows the occupational distribution of the S&E workforce with S&E, S&E-related, and non-S&E highest degrees. The largest category of non-S&E jobs for S&E highest degree holders is management and management-related occupa-tions (2.1 million workers), followed by sales and marketing occupations (995,000 workers) (appendix table 3-3). Other non-S&E occupations with a large number of S&E-trained workers include social services occupations (400,000) and
Table 3-4Educational background of college graduates employed in S&E occupations, by broad S&E occupational category: 2010(Percent)
Educational backgroundAll S&E
occupations
Biological, agricultural,
and environmental life scientists
Computer and mathematical
scientistsPhysical scientists
Social scientists Engineers
Total (n) .................................................... 5,398,000 597,000 2,394,000 320,000 518,000 1,569,000At least one S&E degree .......................... 81.1 86.3 72.1 96.9 81.9 89.5
At least one S&E degree in field ....... 81.1 73.2 44.2 72.2 76.8 81.0Highest degree in field ..................... 74.1 66.3 40.1 66.3 67.4 73.4All degrees in S&E ............................ 69.3 71.4 61.8 88.1 56.2 80.5
No S&E degrees but at least one S&E-related degree .............................. 4.7 7.4 4.6 2.5 2.1 5.1
No S&E or S&E-related degree but at least one non-S&E degree ................... 14.2 6.5 23.4 0.6 16.0 5.3
NOTES: At least one S&E degree in field is the proportion of workers in a particular S&E occupational category with at least one degree in the same broad field. Highest degree in field is the proportion of workers in a particular S&E occupational category with highest degree in the same broad field. For example, among computer and mathematical scientists, these data refer to the proportion with at least one college-level or higher degree in the broad field of computer and mathematical sciences and the proportion with highest degree in the broad field of computer and mathematical sciences, respectively. Detail may not add to total because of rounding.
SOURCE: National Science Foundation, National Center for Science and Engineering Statistics, Scientists and Engineers Statistical Data System (SESTAT) (2010), http://sestat.nsf.gov.
Science and Engineering Indicators 2014
NOTE: Scientists and engineers include those with one or more S&E or S&E-related degrees at the bachelor’s level or higher or those who have only a non-S&E degree at the bachelor's level or higher and are employed in an S&E or S&E-related occupation.
SOURCE: National Science Foundation, National Center for Science and Engineering Statistics, Scientists and Engineers Statistical Data System (SESTAT) (2010), http://sestat.nsf.gov.
Science and Engineering Indicators 2014
Percent
Figure 3-5Occupational distribution of scientists and engineers, by broad field of highest degree: 2010
S&E �eld S&E-related�eld
Non-S&E�eld
0
20
40
60
80
100
S&E occupation
S&E-relatedoccupation
Non-S&Eoccupation
Science and Engineering Indicators 2014 ♦ 3-17
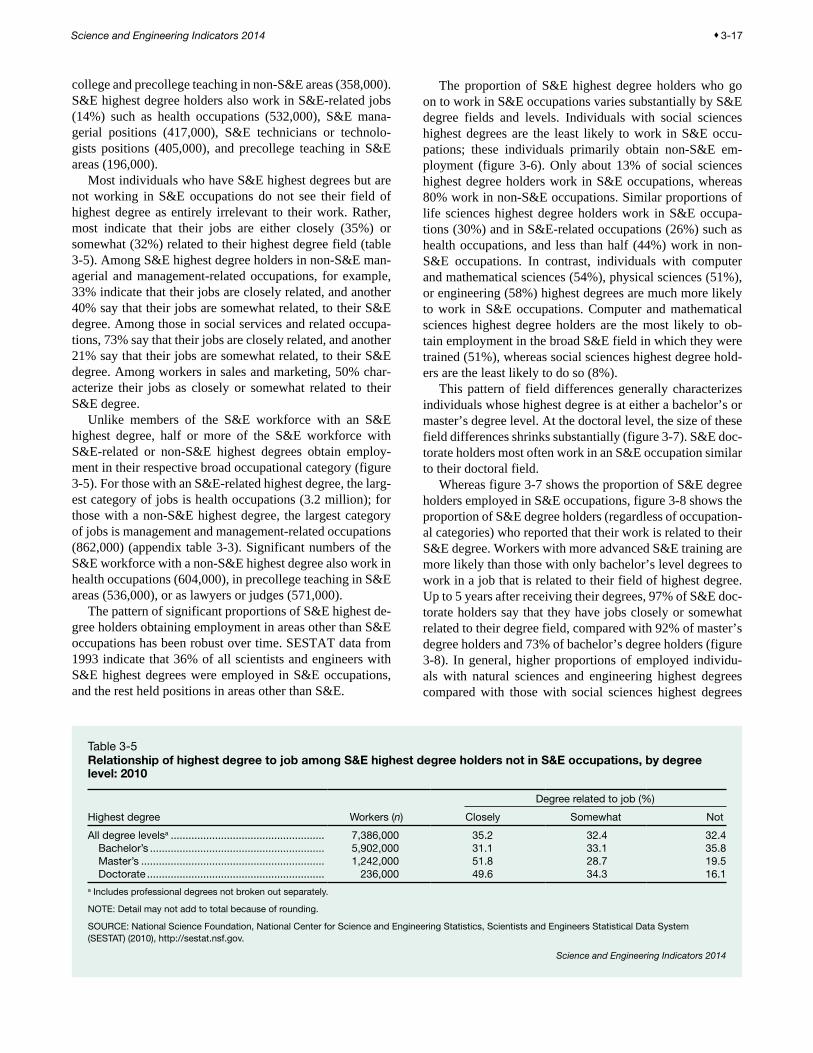
college and precollege teaching in non-S&E areas (358,000). S&E highest degree holders also work in S&E-related jobs (14%) such as health occupations (532,000), S&E mana-gerial positions (417,000), S&E technicians or technolo-gists positions (405,000), and precollege teaching in S&E areas (196,000).
Most individuals who have S&E highest degrees but are not working in S&E occupations do not see their field of highest degree as entirely irrelevant to their work. Rather, most indicate that their jobs are either closely (35%) or somewhat (32%) related to their highest degree field (table 3-5). Among S&E highest degree holders in non-S&E man-agerial and management-related occupations, for example, 33% indicate that their jobs are closely related, and another 40% say that their jobs are somewhat related, to their S&E degree. Among those in social services and related occupa-tions, 73% say that their jobs are closely related, and another 21% say that their jobs are somewhat related, to their S&E degree. Among workers in sales and marketing, 50% char-acterize their jobs as closely or somewhat related to their S&E degree.
Unlike members of the S&E workforce with an S&E highest degree, half or more of the S&E workforce with S&E-related or non-S&E highest degrees obtain employ-ment in their respective broad occupational category (figure 3-5). For those with an S&E-related highest degree, the larg-est category of jobs is health occupations (3.2 million); for those with a non-S&E highest degree, the largest category of jobs is management and management-related occupations (862,000) (appendix table 3-3). Significant numbers of the S&E workforce with a non-S&E highest degree also work in health occupations (604,000), in precollege teaching in S&E areas (536,000), or as lawyers or judges (571,000).
The pattern of significant proportions of S&E highest de-gree holders obtaining employment in areas other than S&E occupations has been robust over time. SESTAT data from 1993 indicate that 36% of all scientists and engineers with S&E highest degrees were employed in S&E occupations, and the rest held positions in areas other than S&E.
The proportion of S&E highest degree holders who go on to work in S&E occupations varies substantially by S&E degree fields and levels. Individuals with social sciences highest degrees are the least likely to work in S&E occu-pations; these individuals primarily obtain non-S&E em-ployment (figure 3-6). Only about 13% of social sciences highest degree holders work in S&E occupations, whereas 80% work in non-S&E occupations. Similar proportions of life sciences highest degree holders work in S&E occupa-tions (30%) and in S&E-related occupations (26%) such as health occupations, and less than half (44%) work in non-S&E occupations. In contrast, individuals with computer and mathematical sciences (54%), physical sciences (51%), or engineering (58%) highest degrees are much more likely to work in S&E occupations. Computer and mathematical sciences highest degree holders are the most likely to ob-tain employment in the broad S&E field in which they were trained (51%), whereas social sciences highest degree hold-ers are the least likely to do so (8%).
This pattern of field differences generally characterizes individuals whose highest degree is at either a bachelor’s or master’s degree level. At the doctoral level, the size of these field differences shrinks substantially (figure 3-7). S&E doc-torate holders most often work in an S&E occupation similar to their doctoral field.
Whereas figure 3-7 shows the proportion of S&E degree holders employed in S&E occupations, figure 3-8 shows the proportion of S&E degree holders (regardless of occupation-al categories) who reported that their work is related to their S&E degree. Workers with more advanced S&E training are more likely than those with only bachelor’s level degrees to work in a job that is related to their field of highest degree. Up to 5 years after receiving their degrees, 97% of S&E doc-torate holders say that they have jobs closely or somewhat related to their degree field, compared with 92% of master’s degree holders and 73% of bachelor’s degree holders (figure 3-8). In general, higher proportions of employed individu-als with natural sciences and engineering highest degrees compared with those with social sciences highest degrees
Table 3-5Relationship of highest degree to job among S&E highest degree holders not in S&E occupations, by degree level: 2010
Highest degree Workers (n)
Degree related to job (%)
Closely Somewhat Not
All degree levelsa .................................................... 7,386,000 35.2 32.4 32.4Bachelor’s ........................................................... 5,902,000 31.1 33.1 35.8Master’s .............................................................. 1,242,000 51.8 28.7 19.5Doctorate ............................................................ 236,000 49.6 34.3 16.1
a Includes professional degrees not broken out separately.
NOTE: Detail may not add to total because of rounding.
SOURCE: National Science Foundation, National Center for Science and Engineering Statistics, Scientists and Engineers Statistical Data System (SESTAT) (2010), http://sestat.nsf.gov.
Science and Engineering Indicators 2014

3-18 ♦ Chapter 3. Science and Engineering Labor Force
Figure 3-7S&E degree holders working in S&E occupations, by level and field of S&E highest degree: 2010Percent
NOTE: Individuals may have degrees in more than one S&E degree �eld.
SOURCE: National Science Foundation, National Center for Science and Engineering Statistics, Scientists and Engineers Statistical Data System (SESTAT) (2010), http://sestat.nsf.gov.
Science and Engineering Indicators 2014
Highest degree: Doctorate Highest degree: Master’s Highest degree: Bachelor’s0
20
40
60
80
100EngineeringSocial sciencesPhysical sciencesComputer and
mathematical sciencesBiological, agricultural, and environmental life sciences
NOTES: Detail may not add to total because of rounding. For each broad S&E highest degree �eld, S&E occupation (in �eld of highest degree) includes individuals who report being employed in an occupation in the same broad category. For example, for highest degree holders in computer and mathematical sciences, S&E occupation (in �eld of highest degree) includes those who report computer or mathematical sciences as their occupation, and S&E occupation (not in �eld of highest degree) includes those who report an S&E occupation other than computer or mathematical sciences occupations.
SOURCE: National Science Foundation, National Center for Science and Engineering Statistics, Scientists and Engineers Statistical Data System (SESTAT) (2010), http://sestat.nsf.gov.
Science and Engineering Indicators 2014
Percent
Figure 3-6Occupational distribution of S&E highest degree holders, by field of highest degree: 2010
Computer andmathematical
sciences
Biological, agricultural,and environmental
life sciences
Physical sciences
Field of highest degree
Social sciences Engineering0
20
40
60
80
100
S&E occupation(in �eld of highest degree)
S&E occupation(not in �eld ofhighest degree)
Non-S&Eoccupations
S&E-relatedoccupations

Science and Engineering Indicators 2014 ♦ 3-19
indicate that their jobs are related to their field of highest de-gree. Thus, among the SESTAT population of scientists and engineers in 2010, 75% of life sciences highest degree hold-ers, 77% of physical sciences highest degree holders, 87% of computer and mathematical sciences highest degree holders, and 88% of engineering highest degree holders reported that their jobs were either closely or somewhat related to their highest degree field compared with 66% of social sciences highest degree holders. This is not surprising given that indi-viduals trained in the social sciences most often obtain em-ployment in non-S&E occupations.
The pattern of a stronger relationship between S&E jobs and S&E degrees at higher degree levels is robust across ca-reer stages, as seen in comparisons among groups of bach-elor’s, master’s, and doctoral degree holders at comparable numbers of years since receiving their degrees (figure 3-8). For each group, the relationship between job and field of highest degree becomes weaker over time. Possible reasons for this decline include changes in career interests, develop-ment of skills in different areas, promotion to general man-agement positions, or realization that some of the original training has become obsolete. Despite these potential fac-tors, the career-cycle decline in the relevance of an S&E de-gree appears modest.
Figure 3-8S&E degree holders employed in jobs related to highest degree, by level of and years since highest degree: 2010Percent
NOTE: Data include those who report their job is either closely related or somewhat related to the �eld of their highest degree.
SOURCE: National Science Foundation, National Center for Science and Engineering Statistics, Scientists and Engineers Statistical Data System (SESTAT) (2010), http://sestat.nsf.gov.
Science and Engineering Indicators 2014
< 5 5–9 10–14 15–19
Years since degree
20–24 25–29 30–34 ≥ 350
60
70
80
90
100
Bachelor’s
Master’s
Doctorate
S&E Workers in the EconomyTo understand the economic and scientific contributions
of scientists and engineers, it is important to know how they are distributed across the economy and what kind of work they perform. This section examines the characteristics of organizations that employ scientists and engineers, includ-ing sector and size of employing organizations. This sec-tion also describes the distribution of S&E workers within particular sectors. The data indicate that individuals trained in S&E fields or working in S&E occupations are found in all sectors, including for-profit businesses; non-profit orga-nizations; public and private educational institutions; and local, state, and federal government. This section also ex-amines self-employed scientists and engineers, as well as the concentration of S&E workers by industry sectors and by geography.
The S&E labor force is often seen as a major contributor to innovation. Work such as patenting activity, R&D activ-ity, and work-related training are indicators of worker skill level, productivity, and innovative capacity. In addition to collecting information on formal education and employ-ment, SESTAT gathers data on the degree to which workers engage in such activities. This section concludes with data on these activities.
Throughout this section, data are provided for the broad SESTAT population of scientists and engineers, includ-ing those employed in S&E or S&E-related occupations as well as those with S&E or S&E-related bachelor’s or higher level degrees. Whenever possible, the data distinguish be-tween individuals with S&E degrees and those working in S&E occupations.
Employment SectorsThe business sector is by far the largest employer of the
broad S&E workforce covered by SESTAT, employing about 70% of individuals trained or working in S&E in 2010 (table 3-6). The education sector, including private and public in-stitutions, employs 19% of the SESTAT population of sci-entists and engineers, and the government sector, including federal, state, and local government, employs another 11%. Within the business sector, for-profit businesses account for a larger number of scientists and engineers than non-profit organizations or the self-employed; within the education sector, 2-year and precollege institutions employ a larger number of scientists and engineers than 4-year institutions.
The relative distribution in the business, education, and government sectors has remained relatively stable since the early 1990s (figure 3-9). Nonetheless, some minor shifts oc-curred between 1993 and 2010:
♦ The proportion of scientists and engineers working in 4-year educational institutions dropped slightly (from 9.3% to 7.9%).

3-20 ♦ Chapter 3. Science and Engineering Labor Force
Table 3-6Employment sector of scientists and engineers, by broad occupational category and degree field: 2010
Employment sector
All employed scientists and
engineersHighest degree
in S&ES&E
occupationsS&E-related occupations
Non-S&E occupations
Total (n) ........................................................................ 21,903,000 11,385,000 5,398,000 6,957,000 9,549,000Business/industry (%) .............................................. 69.8 71.8 70.3 68.3 70.7
For-profit businesses............................................ 52.5 58.6 62.1 45.3 52.3Nonprofit organizations ........................................ 10.7 7.0 4.6 17.6 9.1Self-employed, unincorporated businesses ........ 6.6 6.2 3.6 5.4 9.3
Education (%) ......................................................... 19.0 15.5 17.6 23.0 16.94-year institutions ................................................. 7.9 8.6 14.3 7.4 4.72-year and precollege institutions ....................... 11.1 6.9 3.3 15.7 12.2
Government (%) ....................................................... 11.2 12.6 12.2 8.7 12.4Federal ................................................................. 4.5 5.4 6.3 3.7 4.2State/local ............................................................ 6.6 7.3 5.9 5.0 8.2
NOTE: Scientists and engineers include those with one or more S&E or S&E-related degrees at the bachelor’s level or higher or those who have only a non-S&E degree at the bachelor’s level or higher and are employed in an S&E or S&E-related occupation.
SOURCE: National Science Foundation, National Center for Science and Engineering Statistics, Scientists and Engineers Statistical Data System (SESTAT) (2010), http://sestat.nsf.gov.
Science and Engineering Indicators 2014
NOTES: During 1993–99, scientists and engineers include those with one or more S&E degrees at the bachelor’s level or higher or those who have only a non-S&E degree at the bachelor’s level or higher and are employed in an S&E occupation. During 2003–10, scientists and engineers include those with one or more S&E or S&E-related degrees at the bachelor’s level or higher or those who have only a non-S&E degree at the bachelor’s level or higher and are employed in an S&E or S&E-related occupation.
SOURCE: National Science Foundation, National Center for Science and Engineering Statistics, Scientists and Engineers Statistical Data System (SESTAT) (1993–2010), http://sestat.nsf.gov.
Science and Engineering Indicators 2014
Percent
Figure 3-9Employed scientists and engineers, by employment sector: 1993–2010
1993 1995 1997 1999 2003 2006 2008 20100
20
40
60
80
100
4-year institutions
2-year and precollege institutions
Federal government
State/local government
Self-employed, unincorporatedbusinesses
Nonpro�t organizations
For-pro�t businesses

Science and Engineering Indicators 2014 ♦ 3-21
♦ The proportion of scientists and engineers working in the federal government declined by almost one-third (from 6.4% to 4.5%).
♦ The proportion of scientists and engineers working in the non-profit sector nearly doubled (from 5.8% to 10.7%). Some differences exist in the concentration of particular
groups of S&E workers across employment sectors. For ex-ample, academic institutions are the largest employer of the SESTAT population with doctorates, even though the busi-ness sector is the largest employer of the overall SESTAT population. Whereas individuals employed in engineering occupations and computer and mathematical sciences occu-pations are largely concentrated in the business sector, those employed as life scientists and social scientists are more evenly distributed between the business and education sec-tors. The following discussion provides a deeper analysis of the economic sectors in which scientists and engineers work.
Education SectorOverall, the education sector employs nearly one-fifth
of the broad S&E workforce covered by SESTAT (table 3-6). Depending on the population, however, the proportion working within different parts of the education sector varies. For example, within the education sector, the vast majority of S&E highest degree holders whose highest degree is at the doctoral level work in 4-year institutions, but the majority of those whose highest degree is at the bachelor’s level work in 2-year and precollege institutions (figure 3-10; appendix
table 3-4). In addition to tenure or tenure-track faculty, the doctorate population in the education sector includes indi-viduals who hold postdoctoral appointments and other tem-porary positions, work in various other S&E teaching and research jobs, perform administrative functions, and are employed in a wide variety of non-S&E occupations. (See chapter 5 for additional details on academic employment of science, engineering, and health [SEH] doctorates.)
Of scientists and engineers who are employed in S&E occupations, 18% work in the education sector (table 3-6). Within the education sector, the majority of those employed in S&E occupations are concentrated in 4-year institutions (81%). In comparison, the great majority of workers in S&E-related or non-S&E occupations in the education sec-tor are found in 2-year and precollege institutions (68% and 72%, respectively). These workers in these types of institu-tions are primarily teachers. Within S&E occupations, larger proportions of life, physical, and social scientists work in the education sector than engineers or computer and mathemati-cal scientists (figure 3-11).
Business Sector
For-profit businesses. For-profit businesses employ the largest proportion of scientists and engineers (table 3-6). For the broad SESTAT population with doctorates, however, for-profit businesses are second to 4-year educational in-stitutions (figure 3-10; appendix table 3-4). Approximately three-fourths of scientists and engineers working in com-puter and mathematical sciences occupations (73%) and in engineering occupations (76%) are employed by for-profit businesses. The proportions are much lower for those in oth-er S&E occupations, ranging from 18% for social scientists to 40% for physical scientists (figure 3-11).
Non-profit organizations. Non-profit organizations have shown substantial growth in the percentage of scientists and engineers that they employ (figure 3-9). This growth is driv-en primarily by those working in S&E-related occupations, which include health-related jobs. Among all scientists and engineers employed in S&E-related occupations, 18% work in non-profit organizations (table 3-6). Among those in S&E occupations, the proportion working in non-profit organiza-tions is much smaller (5%), although the proportion varies significantly across S&E occupational categories: from 2% of engineers to 9% of social scientists are employed by these organizations (figure 3-11).
Self-employment. In 2010, almost 4.2 million scien-tists and engineers (19%) reported being self-employed in either an unincorporated or incorporated business, profes-sional practice, or farm (table 3-7).8 Scientists and engineers working in S&E-related or non-S&E occupations reported higher levels of self-employment (18% and 24%, respective-ly) than those working in S&E occupations (12%). Among S&E highest degree holders, those with professional degrees
NOTE: All degree levels include professional degrees not reported separately.
SOURCE: National Science Foundation, National Center for Science and Engineering Statistics, Scientists and Engineers Statistical Data System (SESTAT) (2010), http://sestat.nsf.gov.
Science and Engineering Indicators 2014
Percent
Figure 3-10S&E highest degree holders, by degree level and employment sector: 2010
Alldegreelevels
Bachelor’s Master’s Doctorate0
20
40
60
80
100
4-yearinstitutions
2-year and precollegeinstitutions
Federal government
State/local government
Self-employed, unincorporated businesses
Nonpro�t organizations
For-pro�t businesses

3-22 ♦ Chapter 3. Science and Engineering Labor Force
SOURCE: National Science Foundation, National Center for Science and Engineering Statistics, Scientists and Engineers Statistical Data System (SESTAT) (2010) http://sestat.nsf.gov.
Science and Engineering Indicators 2014
Percent
Figure 3-11Broad S&E occupational categories, by employment sector: 2010
All S&Eoccupations
Computer andmathematical
scientists
Biological,agricultural, andenvironmentallife scientists
Physical andrelated
scientists
Social andrelated scientists
Engineers0
20
40
60
80
100
4-year institutions
2-year and precollege institutions
Federal government
State/local government
Self-employed,unincorporated businesses
Nonpro�t organizations
For-pro�t businesses
Table 3-7Self-employed scientists and engineers, by education, occupation, and type of business: 2010(Percent)
Characteristic TotalUnincorporated
businessIncorporated
business
All self-employed scientists and engineers ...................................... 19.0 6.6 12.4
Highest degree in S&E field .............................................................. 17.9 6.2 11.7Biological, agricultural, and environmental life sciences .............. 17.8 6.3 11.5Computer and mathematical sciences ......................................... 14.8 4.5 10.3Physical sciences ......................................................................... 17.3 5.9 11.4Social sciences ............................................................................. 18.9 7.8 11.1Engineering ................................................................................... 18.7 4.7 14.0
S&E highest degree level ..................................................................Bachelor’s ..................................................................................... 19.4 6.3 13.1Master’s ........................................................................................ 14.7 5.9 8.8Doctorate ...................................................................................... 11.7 5.3 6.4Professional .................................................................................. 47.8 39.1 8.7
OccupationS&E occupation ............................................................................ 12.0 3.6 8.4
Biological, agricultural, and environmental life scientists ......... 6.2 2.0 4.2Computer and mathematical scientists .................................... 11.7 3.1 8.6Physical scientists ..................................................................... 7.5 1.9 5.6Social scientists ........................................................................ 16.4 10.4 6.0Engineers .................................................................................. 14.1 2.9 11.2
S&E-related occupations .............................................................. 18.4 5.4 13.0Non-S&E occupations .................................................................. 23.5 9.3 14.2
NOTE: Scientists and engineers include those with one or more S&E or S&E-related degrees at the bachelor’s level or higher or those who have only a non-S&E degree at the bachelor’s level or higher and are employed in an S&E or S&E-related occupation.
SOURCE: National Science Foundation, National Center for Science and Engineering Statistics, Scientists and Engineers Statistical Data System (SESTAT) (2010), http://sestat.nsf.gov.
Science and Engineering Indicators 2014
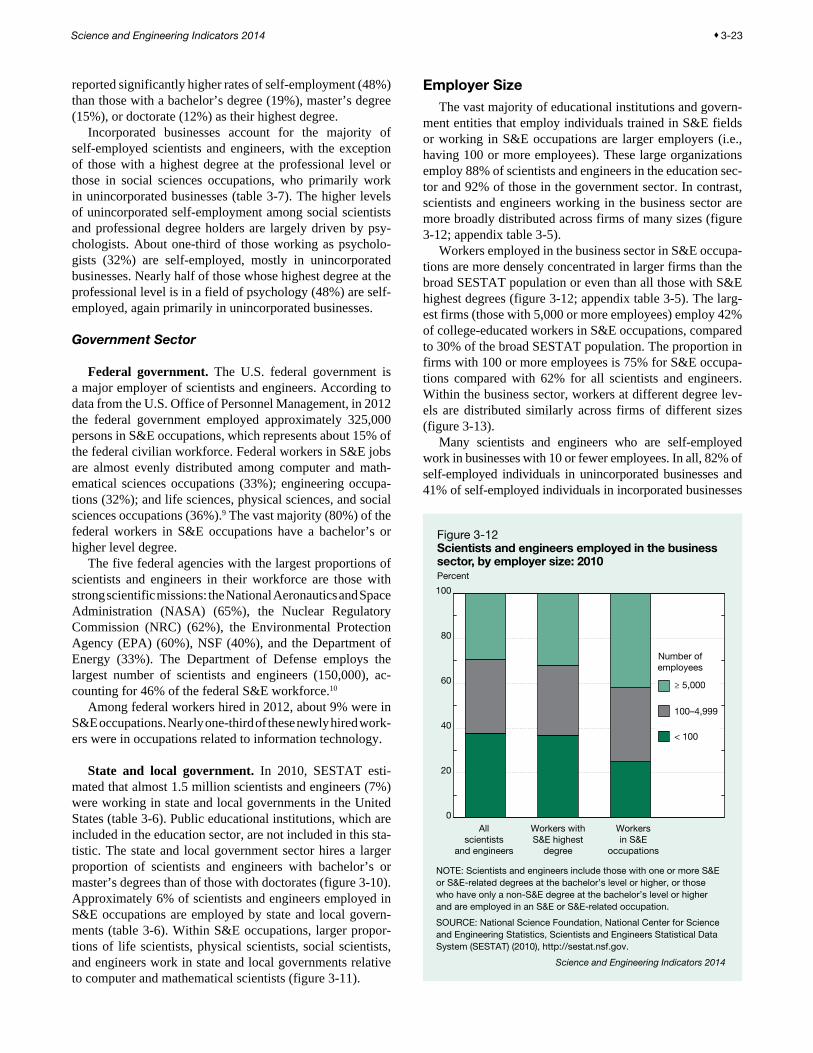
Science and Engineering Indicators 2014 ♦ 3-23
reported significantly higher rates of self-employment (48%) than those with a bachelor’s degree (19%), master’s degree (15%), or doctorate (12%) as their highest degree.
Incorporated businesses account for the majority of self-employed scientists and engineers, with the exception of those with a highest degree at the professional level or those in social sciences occupations, who primarily work in unincorporated businesses (table 3-7). The higher levels of unincorporated self-employment among social scientists and professional degree holders are largely driven by psy-chologists. About one-third of those working as psycholo-gists (32%) are self-employed, mostly in unincorporated businesses. Nearly half of those whose highest degree at the professional level is in a field of psychology (48%) are self-employed, again primarily in unincorporated businesses.
Government Sector
Federal government. The U.S. federal government is a major employer of scientists and engineers. According to data from the U.S. Office of Personnel Management, in 2012 the federal government employed approximately 325,000 persons in S&E occupations, which represents about 15% of the federal civilian workforce. Federal workers in S&E jobs are almost evenly distributed among computer and math-ematical sciences occupations (33%); engineering occupa-tions (32%); and life sciences, physical sciences, and social sciences occupations (36%).9 The vast majority (80%) of the federal workers in S&E occupations have a bachelor’s or higher level degree.
The five federal agencies with the largest proportions of scientists and engineers in their workforce are those with strong scientific missions: the National Aeronautics and Space Administration (NASA) (65%), the Nuclear Regulatory Commission (NRC) (62%), the Environmental Protection Agency (EPA) (60%), NSF (40%), and the Department of Energy (33%). The Department of Defense employs the largest number of scientists and engineers (150,000), ac-counting for 46% of the federal S&E workforce.10
Among federal workers hired in 2012, about 9% were in S&E occupations. Nearly one-third of these newly hired work-ers were in occupations related to information technology.
State and local government. In 2010, SESTAT esti-mated that almost 1.5 million scientists and engineers (7%) were working in state and local governments in the United States (table 3-6). Public educational institutions, which are included in the education sector, are not included in this sta-tistic. The state and local government sector hires a larger proportion of scientists and engineers with bachelor’s or master’s degrees than of those with doctorates (figure 3-10). Approximately 6% of scientists and engineers employed in S&E occupations are employed by state and local govern-ments (table 3-6). Within S&E occupations, larger propor-tions of life scientists, physical scientists, social scientists, and engineers work in state and local governments relative to computer and mathematical scientists (figure 3-11).
Employer SizeThe vast majority of educational institutions and govern-
ment entities that employ individuals trained in S&E fields or working in S&E occupations are larger employers (i.e., having 100 or more employees). These large organizations employ 88% of scientists and engineers in the education sec-tor and 92% of those in the government sector. In contrast, scientists and engineers working in the business sector are more broadly distributed across firms of many sizes (figure 3-12; appendix table 3-5).
Workers employed in the business sector in S&E occupa-tions are more densely concentrated in larger firms than the broad SESTAT population or even than all those with S&E highest degrees (figure 3-12; appendix table 3-5). The larg-est firms (those with 5,000 or more employees) employ 42% of college-educated workers in S&E occupations, compared to 30% of the broad SESTAT population. The proportion in firms with 100 or more employees is 75% for S&E occupa-tions compared with 62% for all scientists and engineers. Within the business sector, workers at different degree lev-els are distributed similarly across firms of different sizes (figure 3-13).
Many scientists and engineers who are self-employed work in businesses with 10 or fewer employees. In all, 82% of self-employed individuals in unincorporated businesses and 41% of self-employed individuals in incorporated businesses
NOTE: Scientists and engineers include those with one or more S&E or S&E-related degrees at the bachelor’s level or higher, or those who have only a non-S&E degree at the bachelor’s level or higher and are employed in an S&E or S&E-related occupation.
SOURCE: National Science Foundation, National Center for Science and Engineering Statistics, Scientists and Engineers Statistical Data System (SESTAT) (2010), http://sestat.nsf.gov.
Science and Engineering Indicators 2014
Percent
Figure 3-12Scientists and engineers employed in the business sector, by employer size: 2010
Allscientists
and engineers
Workers withS&E highest
degree
Workersin S&E
occupations
0
20
40
60
80
100
< 100
100–4,999
≥ 5,000
Number ofemployees

3-24 ♦ Chapter 3. Science and Engineering Labor Force
work in businesses with 10 or fewer employees. In contrast, only 5% of all other scientists and engineers work in busi-nesses with 10 or fewer employees. Many of these scientists and engineers likely think of themselves as independent pro-fessionals rather than small business owners.
Industry EmploymentThe OES survey provides detailed estimates for employ-
ment in S&E occupations by type of industry; however, it ex-cludes the self-employed and those employed in agriculture and in recent startups. Industries vary in their proportions of S&E workers (table 3-8). In 2012, the industry group with the largest S&E employment was professional, scientific, and technical services, which employed about 1.8 million (31%) S&E workers, followed by manufacturing, which employed 887,000 (15%) S&E workers (table 3-8). The government, which includes federal, state, and local govern-ment, employed 636,000 (11%) S&E workers; educational services, which includes private and public educational in-stitutions, employed another 684,000 (12%) S&E workers. These four industry groups—professional, scientific, and technical services; manufacturing; government; and edu-cational services—had a disproportionate concentration of S&E jobs. Together, these industry groups employed about
two-thirds of all workers in S&E occupations (68%), com-pared with one-third of workers in all occupations (32%).
S&E employment intensity, defined by an industry’s S&E employment as a proportion of its total employment, was highest in professional, scientific, and technical services (24%) followed by information (17%) and management of companies and enterprises (13%) (table 3-8). The broad in-dustry groups with S&E employment intensity below the na-tional average (4.6%) together employed 59% of all workers in 2012 but only 14% of workers in S&E occupations. These groups with S&E employment intensity below the national average include large employers such as health care and social assistance, retail trade, and accommodation and food services.
Employment by Metropolitan AreaThe availability of a skilled workforce is an important
predictor of a region’s population, productivity, and techno-logical growth (Carlino, Chatterjee, and Hunt 2001; Glaeser and Saiz 2003). The federal government uses standard defi-nitions to describe geographical regions in the United States for comparative purposes. It designates very large metro-politan areas, sometimes dividing them into smaller metro-politan divisions that can also be substantial in size (Office of Management and Budget 2009).
This section presents the following indicators of the availability of S&E workers in a metropolitan area: (1) the number of S&E workers in the metropolitan area or division, (2) the proportion of the entire metropolitan area workforce in S&E occupations, and (3) the proportion of the nation-wide S&E workforce in the metropolitan area. Data on the metropolitan areas with the largest proportion of workers in S&E occupations appear in table 3-9. These estimates are affected by the geographic scope of each metropolitan area, which can vary significantly. In particular, comparisons be-tween areas can be strongly affected by how much territory outside the urban core is included in the metropolitan area.
S&E employment in the United States is geographically concentrated; that is, a small number of geographic areas ac-count for a significant proportion of S&E jobs. For example, the 20 metropolitan areas listed in table 3-9 account for 18% of nationwide employment in S&E jobs, compared to about 8% of employment in all occupations.
Scientists and Engineers and Innovation-Related Activities
Who Performs R&D?Because R&D creates new types of goods and services
that can fuel economic and productivity growth and enhance living standards, individuals with S&E expertise who use their knowledge in R&D attract special interest. This section uses SESTAT data to examine the R&D activity of scien-tists and engineers. In this section, R&D activity is defined as the proportion of workers who reported basic research, applied research, design, or development as a primary or secondary work activity in their principal job (i.e., activities
SOURCE: National Science Foundation, National Center for Science and Engineering Statistics, Scientists and Engineers Statistical Data System (SESTAT) (2010), http://sestat.nsf.gov.
Science and Engineering Indicators 2014
Percent
Figure 3-13S&E highest degree holders employed in the business sector, by highest degree level and employer size: 2010
Bachelor’s Master’s Doctorate0
20
40
60
80
100
≤ 10
11–24
25–99
100–499
500–999
1,000–4,999
5,000–24,999
≥ 25,000
Number ofemployees
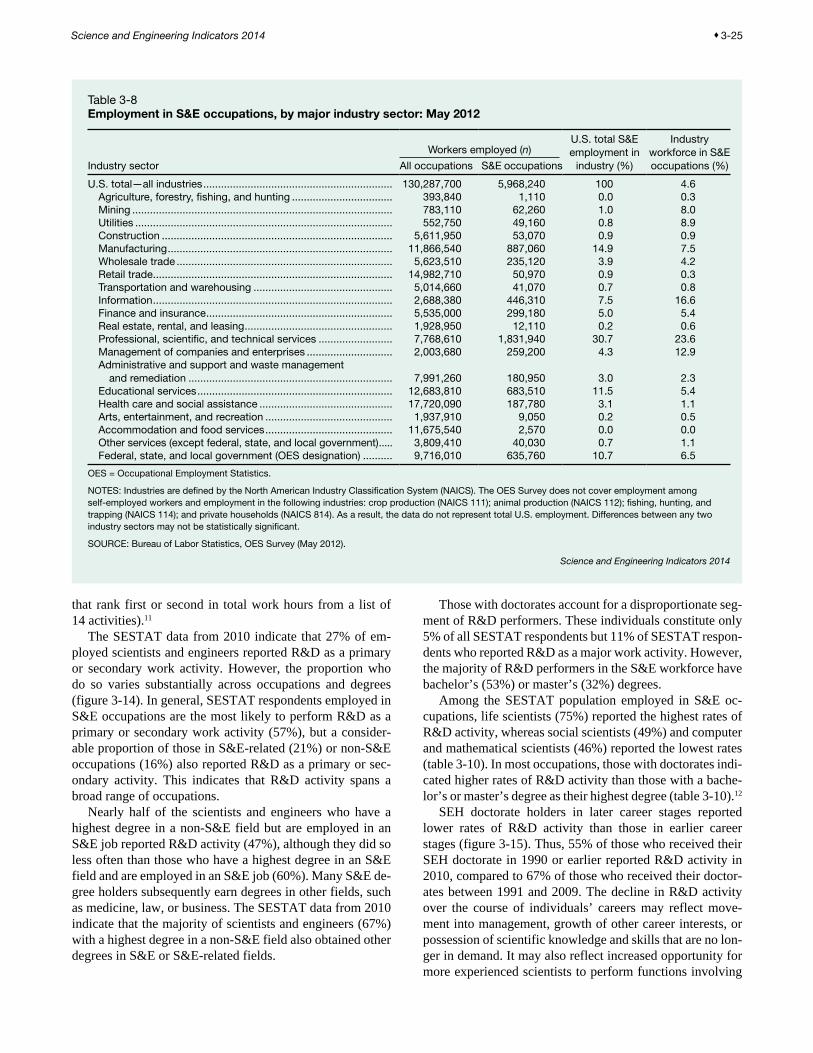
Science and Engineering Indicators 2014 ♦ 3-25
that rank first or second in total work hours from a list of 14 activities).11
The SESTAT data from 2010 indicate that 27% of em-ployed scientists and engineers reported R&D as a primary or secondary work activity. However, the proportion who do so varies substantially across occupations and degrees (figure 3-14). In general, SESTAT respondents employed in S&E occupations are the most likely to perform R&D as a primary or secondary work activity (57%), but a consider-able proportion of those in S&E-related (21%) or non-S&E occupations (16%) also reported R&D as a primary or sec-ondary activity. This indicates that R&D activity spans a broad range of occupations.
Nearly half of the scientists and engineers who have a highest degree in a non-S&E field but are employed in an S&E job reported R&D activity (47%), although they did so less often than those who have a highest degree in an S&E field and are employed in an S&E job (60%). Many S&E de-gree holders subsequently earn degrees in other fields, such as medicine, law, or business. The SESTAT data from 2010 indicate that the majority of scientists and engineers (67%) with a highest degree in a non-S&E field also obtained other degrees in S&E or S&E-related fields.
Those with doctorates account for a disproportionate seg-ment of R&D performers. These individuals constitute only 5% of all SESTAT respondents but 11% of SESTAT respon-dents who reported R&D as a major work activity. However, the majority of R&D performers in the S&E workforce have bachelor’s (53%) or master’s (32%) degrees.
Among the SESTAT population employed in S&E oc-cupations, life scientists (75%) reported the highest rates of R&D activity, whereas social scientists (49%) and computer and mathematical scientists (46%) reported the lowest rates (table 3-10). In most occupations, those with doctorates indi-cated higher rates of R&D activity than those with a bache-lor’s or master’s degree as their highest degree (table 3-10).12
SEH doctorate holders in later career stages reported lower rates of R&D activity than those in earlier career stages (figure 3-15). Thus, 55% of those who received their SEH doctorate in 1990 or earlier reported R&D activity in 2010, compared to 67% of those who received their doctor-ates between 1991 and 2009. The decline in R&D activity over the course of individuals’ careers may reflect move-ment into management, growth of other career interests, or possession of scientific knowledge and skills that are no lon-ger in demand. It may also reflect increased opportunity for more experienced scientists to perform functions involving
Table 3-8Employment in S&E occupations, by major industry sector: May 2012
Industry sector
U.S. total S&E employment in
industry (%)
Industry workforce in S&E occupations (%)All occupations S&E occupations
U.S. total—all industries ................................................................ 130,287,700 5,968,240 100 4.6Agriculture, forestry, fishing, and hunting .................................. 393,840 1,110 0.0 0.3Mining ........................................................................................ 783,110 62,260 1.0 8.0Utilities ....................................................................................... 552,750 49,160 0.8 8.9Construction .............................................................................. 5,611,950 53,070 0.9 0.9Manufacturing ............................................................................ 11,866,540 887,060 14.9 7.5Wholesale trade ......................................................................... 5,623,510 235,120 3.9 4.2Retail trade ................................................................................. 14,982,710 50,970 0.9 0.3Transportation and warehousing ............................................... 5,014,660 41,070 0.7 0.8Information ................................................................................. 2,688,380 446,310 7.5 16.6Finance and insurance ............................................................... 5,535,000 299,180 5.0 5.4Real estate, rental, and leasing .................................................. 1,928,950 12,110 0.2 0.6Professional, scientific, and technical services ......................... 7,768,610 1,831,940 30.7 23.6Management of companies and enterprises ............................. 2,003,680 259,200 4.3 12.9Administrative and support and waste management
and remediation ..................................................................... 7,991,260 180,950 3.0 2.3Educational services .................................................................. 12,683,810 683,510 11.5 5.4Health care and social assistance ............................................. 17,720,090 187,780 3.1 1.1Arts, entertainment, and recreation ........................................... 1,937,910 9,050 0.2 0.5Accommodation and food services ........................................... 11,675,540 2,570 0.0 0.0Other services (except federal, state, and local government) ..... 3,809,410 40,030 0.7 1.1Federal, state, and local government (OES designation) .......... 9,716,010 635,760 10.7 6.5
OES = Occupational Employment Statistics.
NOTES: Industries are defined by the North American Industry Classification System (NAICS). The OES Survey does not cover employment among self-employed workers and employment in the following industries: crop production (NAICS 111); animal production (NAICS 112); fishing, hunting, and trapping (NAICS 114); and private households (NAICS 814). As a result, the data do not represent total U.S. employment. Differences between any two industry sectors may not be statistically significant.
SOURCE: Bureau of Labor Statistics, OES Survey (May 2012).
Science and Engineering Indicators 2014
Workers employed (n)

3-26 ♦ Chapter 3. Science and Engineering Labor Force
the interpretation and use of, as opposed to the creation and development of, scientific knowledge.
For the most part, scientists and engineers performing R&D activity are distributed similarly across broad employ-ment sectors as scientists and engineers who do not perform R&D as a primary or secondary work activity. About 70% of scientists and engineers in each group are employed in the business sector (68% and 71%, respectively), about 20% are employed in the education sector (21% and 18%, respec-tively), and 11% are employed in the government sector. However, within the education sector, 4-year institutions employ 66% of SESTAT respondents who perform R&D as a primary or secondary work activity, compared to 31% of those who do not.
Patenting ActivityThe U.S. Patent and Trademark Office (USPTO) grants
patents to inventions that are new, useful, and not obvious. Patenting is a limited but useful indicator of the inventive activity of scientists and engineers. Not all patent applica-tions received by the USPTO are granted, not all granted patents result in commercial products, and not all R&D leads to patents because inventors often protect commercially use-ful discoveries in other ways such as copyrights and trade secrets. NSF data indicate that, among U.S.-trained SEH
doctorates, 16% reported patenting activity during the period from 2003 to 2008 (National Science Board [NSB] 2012).13 Patenting activity varied significantly across disciplines, with doctorate holders in engineering and physical sciences reporting the highest rates and those in mathematics, statis-tics, and psychology reporting the lowest rates. Doctorate holders in engineering and physical sciences also reported the highest average number of patent applications per person and the highest average number of patents granted. For an in-depth analysis of the relevant data, see the NSB Science and Engineering Indicators 2012 (NSB 2012).
Work-Related TrainingIn addition to formal education, workers very often en-
gage in work-related training. Such training can contribute to innovation and productivity growth by enhancing skills, efficiency, and knowledge. In 2010, 55% of scientists and engineers in the labor force reported participating in work-related training within the past 12 months of being surveyed (table 3-11). Among those who were employed, workers in S&E-related jobs (health-related occupations, S&E manag-ers, S&E precollege teachers, and S&E technicians and tech-nologists) exhibited higher rates of participation (73%) than workers in S&E (55%) or non-S&E jobs (61%). In general, employed scientists and engineers reported higher rates of
Table 3-9Metropolitan areas with largest proportion of workers in S&E occupations: May 2012
Metropolitan area
Workers employed (n) Metropolitan area workforce
in S&E occupations (%)
U.S. total S&E employment
in metropolitan area (%)
All occupations
S&E occupations
U.S. total .................................................................................. 130,287,700 5,968,240 4.6 100.0 San Jose–Sunnyvale–Santa Clara, CA ................................ 898,610 142,430 15.9 2.4 Boulder, CO ......................................................................... 159,440 21,160 13.3 0.4 Huntsville, AL ....................................................................... 203,400 26,590 13.1 0.4 Corvallis, OR ........................................................................ 33,310 4,170 12.5 0.1 Framingham, MA, NECTA Division ...................................... 157,290 19,550 12.4 0.3 Durham–Chapel Hill, NC ...................................................... 272,250 32,690 12.0 0.5 Washington-Arlington-Alexandria, DC-VA-MD-WV,
Metropolitan Division........................................................ 2,343,510 265,370 11.3 4.4 Lowell-Billerica-Chelmsford, MA-NH, NECTA Division ....... 116,620 12,830 11.0 0.2 Seattle-Bellevue-Everett, WA, Metropolitan Division ........... 1,409,500 148,670 10.5 2.5 Bethesda-Rockville-Frederick, MD, Metropolitan Division ... 560,000 54,380 9.7 0.9 Bloomington-Normal, IL ...................................................... 86,920 8,280 9.5 0.1 Kennewick-Pasco-Richland, WA ......................................... 97,300 8,850 9.1 0.1 Boston-Cambridge-Quincy, MA, NECTA Division ............... 1,711,350 154,470 9.0 2.6 San Francisco–San Mateo–Redwood City, CA,
Metropolitan Division........................................................ 1,000,430 89,480 8.9 1.5 Ann Arbor, MI ....................................................................... 193,760 16,870 8.7 0.3 Fort Collins–Loveland, CO ................................................... 132,630 11,060 8.3 0.2 Ames, IA ............................................................................... 40,270 3,280 8.1 0.1 Olympia, WA ........................................................................ 93,850 7,520 8.0 0.1 Austin–Round Rock–San Marcos, TX .................................. 812,600 64,780 8.0 1.1 College Station–Bryan, TX ................................................... 92,990 7,370 7.9 0.1
NECTA = New England City and Town Area.
NOTES: The data exclude metropolitan statistical areas where S&E proportions were suppressed. Larger metropolitan areas are broken into component metropolitan divisions. Differences between any two areas may not be statistically significant.
SOURCE: Bureau of Labor Statistics, Occupational Employment Statistics Survey (May 2012).
Science and Engineering Indicators 2014

Science and Engineering Indicators 2014 ♦ 3-27
participation (63%) than unemployed scientists and engi-neers (30%). Women participated in work-related training at a higher rate than men: 58% of women compared with 52% of men (appendix table 3-6). This difference exists among most groups defined by labor force status or highest degree level.
Figure 3-14Employed scientists and engineers with R&D activity, by broad field of highest degree and broad occupational category: 2010
Percent
NOTES: Scientists and engineers include those with one or more S&E or S&E-related degrees at the bachelor’s level or higher or those who have only a non-S&E degree at the bachelor’s level or higher and are employed in an S&E or S&E-related occupation. R&D activity here refers to the share of workers reporting basic research, applied research, design, or development as a primary or secondary work activity in their principal job—activities ranking �rst or second in work hours.
SOURCE: National Science Foundation, National Center for Science and Engineering Statistics, Scientists and Engineers Statistical Data System (SESTAT) (2010), http://sestat.nsf.gov.
Science and Engineering Indicators 2014
All �elds
S&E �eld
S&E-related�eld
Non-S&E�eld
0 20 40 60 80 100
Non-S&Eoccupations
S&E occupations
S&E-relatedoccupations
Table 3-10R&D activity rate of scientists and engineers employed in S&E occupations, by broad occupational category and level of highest degree: 2010(Percent)
Highest degree level
Biological, agricultural, and environmental life scientists
Computer and mathematical
scientistsPhysical scientists
Social scientists Engineers
All degree levels ...................................... 75.2 45.5 70.3 49.4 66.5Bachelor’s ............................................ 66.9 44.0 65.6 47.6 62.9Master’s ............................................... 74.5 46.3 65.5 46.8 70.0Doctorate ............................................. 86.8 64.1 80.0 54.2 83.9
NOTES: All degree levels include professional degrees not broken out separately. R&D activity rate is the proportion of workers who report that basic research, applied research, design, or development is a primary or secondary work activity in their principal job—activities ranking first or second in work hours.
SOURCE: National Science Foundation, National Center for Science and Engineering Statistics, Scientists and Engineers Statistical Data System (SESTAT) (2010), http://sestat.nsf.gov.
Science and Engineering Indicators 2014
Figure 3-15Employed SEH doctorate holders with R&D activity, by years since doctoral degree: 2010Percent
SEH = science, engineering, and health.
NOTE: R&D activity here refers to the share of workers reporting basic research, applied research, design, or development as a primary or secondary work activity in their principal job—activities ranking �rst or second in work hours.
SOURCE: National Science Foundation, National Center for Science and Engineering Statistics, Survey of Doctorate Recipients (SDR) (2010), http://sestat.nsf.gov.
Science and Engineering Indicators 2014
Years since degree
< 5 5–9 10–14 15–19 20–24 25–29 30–34 ≥ 35 0
50
60
70
80
90
100

3-28 ♦ Chapter 3. Science and Engineering Labor Force
Among scientists and engineers who participated in work-related training within the 12 months before being surveyed, most did so to improve skills or knowledge in their current occupational field (52%) (appendix table 3-7).14 Others did so for licensure/certification in their current occupational field (24%) or because it was required or expected by their employer (15%). Relative to those who were employed or not in the labor force, those who were unemployed more often reported that they engaged in work-related training to facilitate a change to a different occupational field. Not sur-prisingly, those who were not in the labor force more often reported that they engaged in this activity for leisure or per-sonal interest than those who were in the labor force.
S&E Labor Market ConditionsThis section looks at a variety of labor market indicators
to assess the overall health of the labor market for scientists and engineers. Indicators of labor market participation (such as rates of unemployment and involuntarily working out of one’s degree field) and earnings provide meaningful infor-mation on economic rewards and the overall attractiveness of careers in S&E fields. Many labor market indicators are lagging indicators, which change some time after other indi-cators show that the economy has begun to follow a particu-lar trend. For example, although the most recent recession officially began in December 2007 and ended in June 2009, unemployment rates continued to rise after the recession had officially ended.15 Rates of unemployment, rates of working involuntarily out of one’s field of highest degree, and earn-ings should all be considered in this context.
UnemploymentIn general, those who hold S&E degrees or work in S&E
occupations have had lower rates of unemployment than the broader labor force. However, the S&E workforce is not ex-empt from unemployment due to overall business cycles or to specific events affecting individuals in their fields. In October 2010, an estimated 4.3% of the broad SESTAT population were unemployed (appendix table 3-8). At the same time, the official unemployment rate reported by BLS for the entire U.S. labor force was about twice as high, 9.0%.16 According to the NSCG, the unemployment rate for all college graduates was 5.1% in the same period. Thus, joblessness among scien-tists and engineers compares favorably with the rates for the labor force as a whole and the college-educated labor force.
In 2010, scientists and engineers employed in non-S&E occupations generally had a higher unemployment rate (5.6%) than those employed in S&E occupations (unemploy-ment rates ranged from 2.3% among social scientists to 4.6% among engineers) (appendix table 3-8). Advanced degree holders are less vulnerable to unemployment than those with only bachelor’s degrees (appendix table 3-8). Nonetheless, a comparison of SESTAT data from 2006, before the onset of the economic downturn, and from 2010, after the down-turn ended, shows clear evidence that the SESTAT popula-tion of scientists and engineers were affected by the broader economic conditions: unemployment rates for comparable groups were generally higher in 2010 than in 2006.17 For example, between 2006 and 2010, the unemployment rate among scientists and engineers with a highest degree at the bachelor’s level rose from 2.9% to 4.9%; among those with a doctorate, the rate rose from 1.6% to 2.6%. During the same period, unemployment rates nearly doubled among engineers (from 2.4% in 2006 to 4.6% in 2010) and among scientists and engineers employed in non-S&E occupations (from 3.0% in 2006 to 5.6% in 2010).
The extent of unemployment also varies by career stages. Scientists and engineers in the early- to mid-stages of their career cycles (about 5 to 30 years after obtaining
Table 3-11Scientists and engineers participating in work-related training, by labor force status and occupation: 2010
Labor force status and occupation Number Percent
All scientists and engineers ................ 14,688,000 54.6Employed ........................................ 13,894,000 63.4
S&E occupations ......................... 2,950,000 54.6Biological, agric ultural, and
environmental life scientists ... 351,000 58.8Computer and mathematical
scientists .............................. 1,154,000 48.2Physical scientists ................... 166,000 51.9Social scientists ....................... 343,000 66.2Engineers ................................. 937,000 59.7
S&E-related occupations ............ 5,085,000 73.1Non-S&E occupations ................. 5,859,000 61.4
Unemployed ................................... 297,000 29.9S&E occupations ......................... 54,000 25.0
Biological, agricultural, and environmental life scientists ... 5,000 21.7
Computer and mathematical scientists .............................. 20,000 21.5
Physical and related scientists.... 4,000 36.4Social and related scientists .... 4,000 33.3Engineers ................................. 21,000 27.6
S&E-related occupations ............ 72,000 39.6Non-S&E occupations ................. 171,000 30.1
Not in labor force ............................ 497,000 12.5
NOTES: Scientists and engineers include those with one or more S&E or S&E-related degrees at the bachelor’s level or higher or those who have only a non-S&E degree at the bachelor’s level or higher and are employed in an S&E or S&E-related occupation in 2010. Unemployed individuals are those not working but who looked for a job in the preceding 4 weeks. For unemployed, the last job held was used for classification. Detail may not add to total because of rounding.
SOURCE: National Science Foundation, National Center for Science and Engineering Statistics, Scientists and Engineers Statistical Data System (SESTAT) (2010), http://sestat.nsf.gov.
Science and Engineering Indicators 2014

Science and Engineering Indicators 2014 ♦ 3-29
their highest degree) are less likely to be jobless than those at earlier points in their careers (figure 3-16). As workers strengthen their skills by acquiring labor market experience and adding on-the-job knowledge to their formal training, their work situations become more secure. However, among scientists and engineers in the later stages of their careers (about 35 or more years after obtaining their highest degree), the unemployment rates are higher than for those who are in the early- to mid-career stages. This suggests that over time scientists and engineers either become more selective about the work they are willing to do or find their skills becoming obsolete, which results in higher unemployment toward the later stages of their careers.
CPS data allow for analysis of unemployment rates over the past three decades.18 CPS data indicate that workers em-ployed in S&E occupations have historically experienced lower unemployment rates than the overall labor market (fig-ure 3-17). CPS data for the period 1983–2012 indicate that the unemployment rate for college-educated individuals in S&E occupations ranged from a low of 1.3% to a high of 4.3%, which contrasted favorably with rates for the entire college-educated labor force (ranging from 1.8% to 7.8%). The unemployment rate for S&E technicians and computer programmers ranged from 2.1% to 7.4%; in comparison, the unemployment rate for the entire labor force ranged from 4.0% to 9.6%.
Figure 3-16Unemployment rates of scientists and engineers, by level of and years since highest degree: 2010Percent
NOTES: All degree levels include professional degrees not shown separately. Scientists and engineers include those with one or more S&E or S&E-related degrees at the bachelor’s level or higher or those who have only a non-S&E degree degree at the bachelor's level or higher and are employed in an S&E or S&E-related occupation.
SOURCE: National Science Foundation, National Center for Science and Engineering Statistics, Scientists and Engineers Statistical Data System (SESTAT) (2010), http://sestat.nsf.gov.
Science and Engineering Indicators 2014
Years since degree
1–4 5–9 10–14 15–19 20–24 25–29 30–34 ≥ 350
2
4
6
8
10
All degree levelsBachelor’sMaster’s
Doctorate
Figure 3-17Unemployment rate, by occupation: 1983–2012Percent
SOURCES: National Bureau of Economic Research, Merged Outgoing Rotation Group �les (1983–2012); Bureau of Labor Statistics, Current Population Survey (1983–2012).
Science and Engineering Indicators 2014
20122009200620032000199719941991198819830
2
4
6
8
10
12All U.S. workers
Workers with bachelor’s degree or higherWorkers in S&E occupations (bachelor’s degree or higher)
S&E technicians and computer programmers (any education level)
During the economic downturn that began in late 2007, unemployment rates among workers employed in S&E oc-cupations generally followed the historic pattern (figure 3-18). Unemployment peaked at 5.7% in S&E occupations and 6.1% in the broader STEM occupations, which include S&E occupations as well as computer programmers, techni-cians, and S&E managers. In comparison, peak unemploy-ment in all occupations was considerably higher (10.5%). In addition to lower rates, unemployment in S&E occupa-tions began declining earlier than in all occupations. As of early 2013, however, unemployment rates among all work-ers (7.7%) as well as S&E workers (3.0%) were still higher than in the beginning of 2008 (5.4% and 2.1%, respectively).
Broader Measures of Labor UnderutilizationThe most commonly cited unemployment measure is the
percentage of people who are not working but who have looked for work in the preceding 4 weeks. This is the official unemployment rate (U3). In addition to U3, BLS reports five other measures (table 3-12), which provide narrower (U1 and U2) or broader (U4–U6) measures of unemployment than the standard measure (U3). These additional measures, called “alternative measures of labor underutilization,” provide additional detail about differences in employment patterns between the S&E labor force and the overall labor force (appendix table 3-9).
Trends in indicators of labor underutilization during the economic downturn that began at the end of 2007 consis-tently indicate that workers whose most recent job was in an S&E occupation experienced lower underutilization rates than the general labor force (figure 3-19). In addition to lower U3, workers in S&E occupations experienced lower long-term unemployment (U1), defined as unemployment
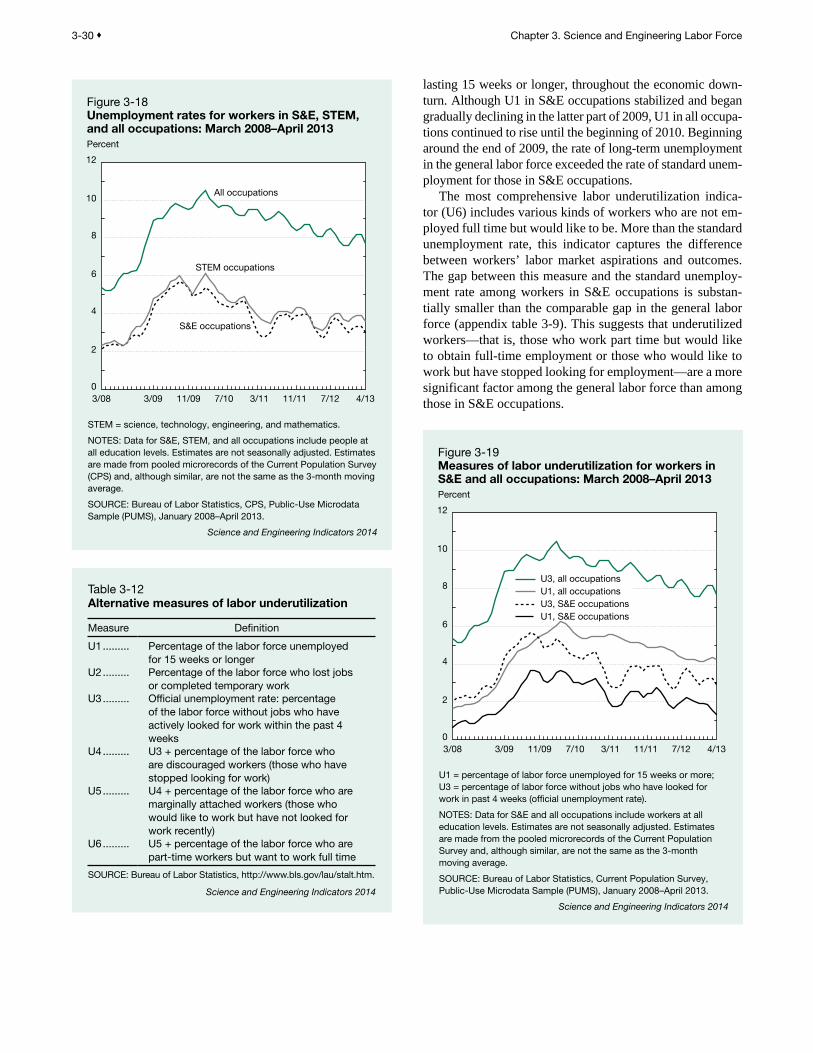
3-30 ♦ Chapter 3. Science and Engineering Labor Force
Figure 3-18Unemployment rates for workers in S&E, STEM, and all occupations: March 2008–April 2013Percent
STEM = science, technology, engineering, and mathematics.
NOTES: Data for S&E, STEM, and all occupations include people at all education levels. Estimates are not seasonally adjusted. Estimates are made from pooled microrecords of the Current Population Survey (CPS) and, although similar, are not the same as the 3-month moving average.
SOURCE: Bureau of Labor Statistics, CPS, Public-Use Microdata Sample (PUMS), January 2008–April 2013.
Science and Engineering Indicators 2014
3/08 3/09 11/09 7/10 3/11 11/11 7/12 4/130
2
4
6
8
10
12
All occupations
S&E occupations
STEM occupations
lasting 15 weeks or longer, throughout the economic down-turn. Although U1 in S&E occupations stabilized and began gradually declining in the latter part of 2009, U1 in all occupa-tions continued to rise until the beginning of 2010. Beginning around the end of 2009, the rate of long-term unemployment in the general labor force exceeded the rate of standard unem-ployment for those in S&E occupations.
The most comprehensive labor underutilization indica-tor (U6) includes various kinds of workers who are not em-ployed full time but would like to be. More than the standard unemployment rate, this indicator captures the difference between workers’ labor market aspirations and outcomes. The gap between this measure and the standard unemploy-ment rate among workers in S&E occupations is substan-tially smaller than the comparable gap in the general labor force (appendix table 3-9). This suggests that underutilized workers—that is, those who work part time but would like to obtain full-time employment or those who would like to work but have stopped looking for employment—are a more significant factor among the general labor force than among those in S&E occupations.
Table 3-12Alternative measures of labor underutilization
Measure Definition
U1 ......... Percentage of the labor force unemployed for 15 weeks or longer
U2 ......... Percentage of the labor force who lost jobs or completed temporary work
U3 ......... Official unemployment rate: percentage of the labor force without jobs who have actively looked for work within the past 4 weeks
U4 ......... U3 + percentage of the labor force who are discouraged workers (those who have stopped looking for work)
U5 ......... U4 + percentage of the labor force who are marginally attached workers (those who would like to work but have not looked for work recently)
U6 ......... U5 + percentage of the labor force who are part-time workers but want to work full time
SOURCE: Bureau of Labor Statistics, http://www.bls.gov/lau/stalt.htm.
Science and Engineering Indicators 2014
Figure 3-19Measures of labor underutilization for workers in S&E and all occupations: March 2008–April 2013Percent
U1 = percentage of labor force unemployed for 15 weeks or more; U3 = percentage of labor force without jobs who have looked for work in past 4 weeks (of�cial unemployment rate).
NOTES: Data for S&E and all occupations include workers at all education levels. Estimates are not seasonally adjusted. Estimates are made from the pooled microrecords of the Current Population Survey and, although similar, are not the same as the 3-month moving average.
SOURCE: Bureau of Labor Statistics, Current Population Survey, Public-Use Microdata Sample (PUMS), January 2008–April 2013.
Science and Engineering Indicators 2014
3/08 3/09 11/09 7/10 3/11 11/11 7/12 4/130
2
4
6
8
10
12
U3, all occupationsU1, all occupationsU3, S&E occupationsU1, S&E occupations

Science and Engineering Indicators 2014 ♦ 3-31
Involuntarily Working Out of One’s Field of Highest Degree
SESTAT data provide information on the relevance of individuals’ educational background for their principal job. SESTAT also provides data on why individuals obtain employment outside of their field of highest degree. The SESTAT population of scientists and engineers who report-ed that a lack of suitable jobs in their field of highest degree was the reason for their working out of field are identified as those who are working involuntarily out of field (IOF). The size of this group as a proportion of all employed scientists and engineers is considered the IOF rate.
Of the nearly 22 million employed scientists and engi-neers in 2010, almost 1.4 million reported working out of the field of their highest degree because of a lack of suitable jobs in their degree field, indicating an IOF rate of 6.4%. SESTAT respondents were allowed to report more than one reason for working out of field. Other reasons included pay and promotion opportunities (reported by 2.1 million individuals), change in career or professional interests (1.8 million), working conditions (2.1 million), family-related reasons (1 million), job location (1.9 million), and other rea-sons (400,000). When asked about the single most important reason for working in a job not related to their field of high-est degree, pay and promotion opportunities were cited by most, followed by change in career interests and lack of a suitable job in their field of highest degree.
IOF rates vary by degree fields and levels. Scientists and engineers with a highest degree in engineering and comput-er and mathematical sciences display lower IOF rates than those with physical, life, or social sciences degrees (table 3-13). Advanced degree holders are less likely to work in-voluntarily out of field than those with bachelor’s degrees only: in 2010, the IOF rate was 2.9% for the SESTAT popu-lation with doctorates, 4.0% for those with master’s degrees, and 8.8% for those with bachelor’s degrees only. However,
among bachelor’s degree holders, IOF rates gradually de-cline across career stages up to mid- to late career points, and then gradually rise (figure 3-20). In comparison, among holders of master’s degrees and doctorates, IOF rates remain stable over the long term.
Table 3-13Scientists and engineers who are working involuntarily out of field, by S&E degree field: 1993–2010(Percent)
S&E degree field 1993 1995 1997 1999 2003 2006 2008 2010
All scientists and engineers ..................................................... 7.8 7.7 7.3 5.4 5.9 6.2 5.3 6.4Highest degree in S&E field ................................................. 9.2 8.9 8.5 6.3 7.8 8.1 7.1 8.4
Biological, agricultural, and environmental life sciences ... 10.3 10.2 10.0 8.3 10.1 9.7 10.1 10.1Computer and mathematical sciences ............................ 5.3 4.1 4.0 2.9 4.9 5.7 4.5 5.1Physical sciences ............................................................. 9.7 10.2 10.0 7.6 8.8 8.6 7.1 8.2Social sciences ................................................................ 13.3 12.7 12.1 8.7 10.1 10.6 9.2 11.3Engineering ...................................................................... 4.4 4.4 3.9 2.7 4.2 4.5 3.6 4.9
NOTES: During 1993–99, scientists and engineers include those with one or more S&E degrees at the bachelor’s level or higher or those who have only a non-S&E degree at the bachelor’s level or higher and are employed in an S&E occupation. During 2003–10, scientists and engineers include those with one or more S&E or S&E-related degrees at the bachelor’s level or higher or those who have only a non-S&E degree at the bachelor’s level or higher and are employed in an S&E or S&E-related occupation. The involuntarily out-of-field rate is the proportion of all employed individuals who report that their job is not related to their field of highest degree because a job in their highest degree field was not available.
SOURCE: National Science Foundation, National Center for Science and Engineering Statistics, Scientists and Engineers Statistical Data System (SESTAT) (1993–2010), http://sestat.nsf.gov.
Science and Engineering Indicators 2014
Figure 3-20Scientists and engineers who are working involuntarily out of field, by level of and years since highest degree: 2010Percent
NOTES: Involuntarily out-of-�eld rate is the proportion of all employed individuals who reported working in a job not related to their �eld of highest degree because a job in that �eld was not available. Scientists and engineers include those with one or more S&E or S&E-related degrees at the bachelor’s level or higher or those who have only a non-S&E degree at the bachelor’s level or higher and are employed in an S&E or S&E-related occupation.
SOURCE: National Science Foundation, National Center for Science and Engineering Statistics, Scientists and Engineers Statistical Data System (SESTAT) (2010), http://sestat.nsf.gov.
Science and Engineering Indicators 2014
Years since degree
1–4 5–9 10–14 15–19 20–24 25–29 30–34 ≥ 350
2
4
6
8
10
12
14
Doctorate
All degreelevels
Bachelor’s
Master’s
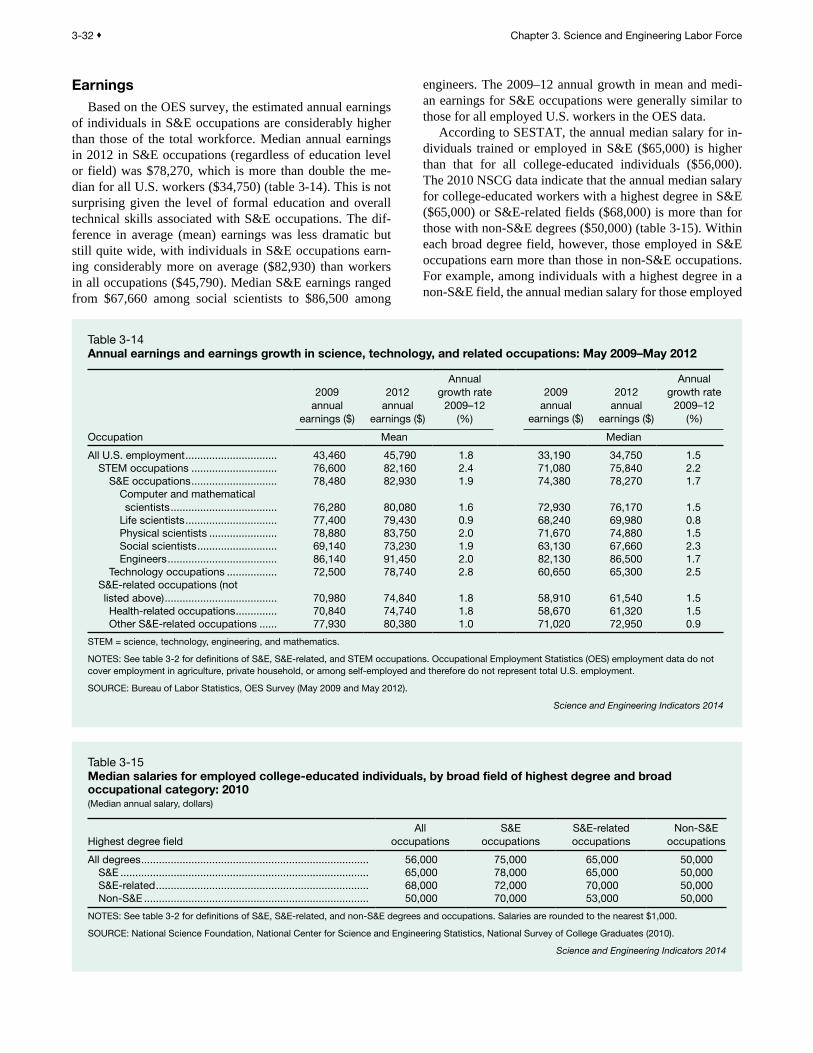
3-32 ♦ Chapter 3. Science and Engineering Labor Force
Earnings Based on the OES survey, the estimated annual earnings
of individuals in S&E occupations are considerably higher than those of the total workforce. Median annual earnings in 2012 in S&E occupations (regardless of education level or field) was $78,270, which is more than double the me-dian for all U.S. workers ($34,750) (table 3-14). This is not surprising given the level of formal education and overall technical skills associated with S&E occupations. The dif-ference in average (mean) earnings was less dramatic but still quite wide, with individuals in S&E occupations earn-ing considerably more on average ($82,930) than workers in all occupations ($45,790). Median S&E earnings ranged from $67,660 among social scientists to $86,500 among
engineers. The 2009–12 annual growth in mean and medi-an earnings for S&E occupations were generally similar to those for all employed U.S. workers in the OES data.
According to SESTAT, the annual median salary for in-dividuals trained or employed in S&E ($65,000) is higher than that for all college-educated individuals ($56,000). The 2010 NSCG data indicate that the annual median salary for college-educated workers with a highest degree in S&E ($65,000) or S&E-related fields ($68,000) is more than for those with non-S&E degrees ($50,000) (table 3-15). Within each broad degree field, however, those employed in S&E occupations earn more than those in non-S&E occupations. For example, among individuals with a highest degree in a non-S&E field, the annual median salary for those employed
Table 3-14Annual earnings and earnings growth in science, technology, and related occupations: May 2009–May 2012
Occupation
2009 annual
earnings ($)
2012 annual
earnings ($)
Annual growth rate
2009–12 (%)
2009 annual
earnings ($)
2012 annual
earnings ($)
Annual growth rate
2009–12 (%)
MedianMean
All U.S. employment ............................... 43,460 45,790 1.8 33,190 34,750 1.5 STEM occupations ............................. 76,600 82,160 2.4 71,080 75,840 2.2
S&E occupations ............................. 78,480 82,930 1.9 74,380 78,270 1.7Computer and mathematical scientists .................................... 76,280 80,080 1.6 72,930 76,170 1.5
Life scientists ............................... 77,400 79,430 0.9 68,240 69,980 0.8Physical scientists ....................... 78,880 83,750 2.0 71,670 74,880 1.5Social scientists ........................... 69,140 73,230 1.9 63,130 67,660 2.3Engineers ..................................... 86,140 91,450 2.0 82,130 86,500 1.7
Technology occupations ................. 72,500 78,740 2.8 60,650 65,300 2.5S&E-related occupations (not listed above) ...................................... 70,980 74,840 1.8 58,910 61,540 1.5Health-related occupations .............. 70,840 74,740 1.8 58,670 61,320 1.5Other S&E-related occupations ...... 77,930 80,380 1.0 71,020 72,950 0.9
STEM = science, technology, engineering, and mathematics.
NOTES: See table 3-2 for definitions of S&E, S&E-related, and STEM occupations. Occupational Employment Statistics (OES) employment data do not cover employment in agriculture, private household, or among self-employed and therefore do not represent total U.S. employment.
SOURCE: Bureau of Labor Statistics, OES Survey (May 2009 and May 2012).
Science and Engineering Indicators 2014
Table 3-15Median salaries for employed college-educated individuals, by broad field of highest degree and broad occupational category: 2010(Median annual salary, dollars)
Highest degree fieldAll
occupationsS&E
occupationsS&E-related occupations
Non-S&E occupations
All degrees ............................................................................. 56,000 75,000 65,000 50,000S&E .................................................................................... 65,000 78,000 65,000 50,000S&E-related ........................................................................ 68,000 72,000 70,000 50,000Non-S&E ............................................................................ 50,000 70,000 53,000 50,000
NOTES: See table 3-2 for definitions of S&E, S&E-related, and non-S&E degrees and occupations. Salaries are rounded to the nearest $1,000.
SOURCE: National Science Foundation, National Center for Science and Engineering Statistics, National Survey of College Graduates (2010).
Science and Engineering Indicators 2014

Science and Engineering Indicators 2014 ♦ 3-33
in an S&E occupation ($70,000) is more than for those em-ployed in a non-S&E occupation ($50,000); among individ-uals with a highest degree in an S&E or S&E-related field, those employed in an S&E or S&E-related occupation earn more than those employed in a non-S&E occupation.
The earnings premium enjoyed by college-educated indi-viduals with an S&E or S&E-related degree is present at all career stages. Figure 3-21 presents data on median salaries for groups with S&E, S&E-related, or non-S&E highest de-grees at comparable numbers of years since receiving their highest degrees. Although median salaries are similar in the beginning for S&E and non-S&E degree holders, both of which are lower than that for S&E-related degree holders, the rise in earnings associated with career progression is much steeper among individuals with S&E degrees.
Earnings vary by degree levels. In 2010, the annual medi-an salaries among scientists and engineers with bachelor’s or master’s as highest degree levels were $57,000 and $68,000, respectively. Those with doctorates ($85,000) or profession-al degrees ($116,000) earned significantly more. The pattern by degree level holds across career stages (figure 3-22).
S&E highest degree holders earn more than non-S&E highest degree holders at the master’s degree and doctoral levels (figure 3-23). Among professional degree holders, in contrast, non-S&E degree holders earn more than S&E de-gree holders.
Among employed individuals without a bachelor’s degree, S&E occupations provide stable jobs with com-petitive salaries relative to those workers in non-S&E oc-cupations. (See sidebar, “The U.S. S&E Workforce Without a Bachelor’s Degree.”)
Recent S&E GraduatesIn today’s knowledge-based and globally integrated
economy marked by rapid information flow and develop-ment of new knowledge, products, and processes, demand for certain skills and abilities may change fast. The employ-ment outcomes of recent graduates are an important indica-tor of current changes in labor market conditions. Compared with experienced S&E workers, recent S&E graduates more often bring new ideas and newly acquired skills to the la-bor market. This section examines the employment out-comes of recent recipients of S&E bachelor’s, master’s, and doctoral degrees.
General Labor Market Indicators for Recent Graduates
Table 3-16 summarizes some basic labor market statistics in 2010 for recent recipients of S&E degrees; recent here is defined as between 1 and 5 years since receiving the degree.
Figure 3-21Median salaries for employed college-educated individuals, by broad field of highest degree and years since highest degree: 2010 Thousands of dollars
NOTE: See table 3-2 for classi�cation of S&E, S&E-related, and non-S&E degree �elds.
SOURCE: National Science Foundation, National Center for Science and Engineering Statistics, National Survey of College Graduates (2010).
Science and Engineering Indicators 2014
1–4 5–9 10–14 15–19
Years since highest degree
20–24 25–29 30–34 ≥ 350
20
40
60
80
100
S&E-related �eld
Non-S&E �eld
S&E �eld
Figure 3-22Median salaries for employed scientists and engineers, by level of and years since highest degree: 2010Thousands of dollars
NOTE: Scientists and engineers include those with one or more S&E or S&E-related degrees at the bachelor’s level or higher or those who have only a non-S&E degree at the bachelor’s level or higher and are employed in an S&E or S&E-related occupation.
SOURCE: National Science Foundation, Division of Science Resources Statistics, Scientists and Engineers Statistical Data System (SESTAT) (2010), http://sestat.nsf.gov.
Science and Engineering Indicators 2014
Years since highest degree
1–4 5–9 10–14 15–19 20–24 25–29 30–34 ≥ 350
20
40
60
80
100
120
140
160
Bachelor’s
Master’s
Doctorate
Professional

3-34 ♦ Chapter 3. Science and Engineering Labor Force
Among the nearly 22 million employed SESTAT respon-dents in October 2010, about 1.8 million are recent S&E degree recipients. Overall, the unemployment rate among these recent graduates was 6.6%, higher than the 4.3% un-employment rate seen among the entire SESTAT popula-tion of scientists and engineers. However, none of the recent graduating groups by S&E degree field or level exceeded the unemployment rate of 9.0% for the entire U.S. labor force.
Among recent bachelor’s degree holders, the unemploy-ment rate averaged 7.7%, ranging from 5.2% for those with physical sciences degrees to 8.8% for those with social sci-ences degrees. Overall, unemployment was generally lower for those with doctorates than for those with less advanced degrees. Early in their careers, as individuals gather labor market experience and on-the-job skills, they tend to have a higher incidence of job change and unemployment, which may partially explain some of the higher unemployment rates seen among those with a bachelor’s degree as their highest level degree.
A useful but more subjective indicator of labor market conditions for recent graduates is the proportion who report
that their job is unrelated to their highest degree field be-cause a job in their degree field was not available (working involuntarily out of field or IOF rate). Of the 1.8 million employed scientists and engineers who received their high-est degree in an S&E field in the previous 5 years, 10.8% indicated working involuntarily out of field (table 3-16).
A larger proportion of recent S&E degree recipients re-ported working out of field because a suitable job was not available (10.8%) compared to the overall SESTAT popula-tion of scientists and engineers (6.4%). When asked about the single most important reason for working out of field, the most frequently cited reason by recent S&E degree re-cipients was lack of a suitable job in their degree field (cited by 29% of recent S&E degree recipients working out of field), followed by pay and promotion opportunities (20%) and change in career or professional interests (13%). The responses provided by the entire SESTAT population work-ing out of field (regardless of graduation year) were similar, but the factors were ranked differently: the most commonly cited reason was pay and promotion opportunities (cited by 26% of all SESTAT respondents working out of field), fol-lowed by change in career or professional interests (21%) and lack of a suitable job in their degree field (19%).
Among recent bachelor’s degree holders, the IOF rate in 2010 averaged 13.5%, but it ranged from 4.1% for recent engineering graduates to 18.0% for recent graduates in the social sciences (table 3-16). In all degree fields for which reliable estimates are available, the IOF rate was lower for advanced degree (master’s) holders than for those with bachelor’s degrees only.
The median salary for recent S&E bachelor’s degree re-cipients in 2010 was $35,000, ranging from $30,000 in life sciences and physical sciences to $57,000 in engineering (table 3-16). Recent master’s degree recipients had a median salary of $55,000, and recent doctorate recipients had a me-dian salary of $60,000.
In 2010, among recent S&E degree recipients, those who received their degrees in 2008 or 2009, after the eco-nomic downturn began, had higher unemployment rates and IOF rates (7.4% and 12.6%, respectively) than those who received their degrees between 2005 and 2007 (6.0% and 9.5%, respectively) (appendix table 3-10). In particular, among recent master’s degree holders, the unemployment rate was higher for the group receiving degrees between 2008 and 2009 than the group receiving degrees between 2005 and 2007; among recent bachelor’s degree holders, the IOF rate was higher for the group receiving degrees between 2008 and 2009 than the group receiving degrees between 2005 and 2007. The doctorate population in these two groups reported similar unemployment rates and IOF rates in 2010.
Recent Doctorate Recipients The career rewards of highly skilled individuals in gen-
eral, and doctorate holders in particular, often extend be-yond salary and employment to the more personal rewards of doing the kind of work for which they have trained. No single standard measure satisfactorily reflects the state of the
Figure 3-23Median salaries for employed scientists and engineers, by broad field and level of highest degree: 2010
Thousands of dollars
NOTES: See table 3-2 for de�nitions of S&E, S&E-related, and non-S&E degrees. Scientists and engineers include those with one or more S&E or S&E-related degrees at the bachelor's level or higher or those who have only a non-S&E degree at the bachelor's level or higher and are employed in an S&E or S&E-related occupation.
SOURCE: National Science Foundation, National Center for Science and Engineering Statistics, Scientists and Engineers Statistical Data System (SESTAT) (2010), http://sestat.nsf.gov.
Science and Engineering Indicators 2014
0 20 40 60 80 100 120 140
S&E �eld
S&E-related�eld
Non-S&E�eld
Bachelor’s
Doctorate
Professional
Master’s

Science and Engineering Indicators 2014 ♦ 3-35
doctoral S&E labor market. This section discusses a range of relevant labor market indicators, including unemployment rates, IOF employment, employment in academia compared with other sectors, employment in postdoctoral positions, and salaries. Although a doctorate opens both career and sal-ary opportunities, these opportunities may come at the price of many years of lost labor market earnings. For some doc-torate holders, an ensuing postdoctoral position can further extend this period of low earnings.
Unemployment. As of October 2010, the 2.3% unem-ployment rate (table 3-17) for SEH doctorate recipients up to 3 years after receiving their doctorates was almost identical to the unemployment rate for all SEH doctorates (2.4%); it was considerably lower than the unemployment rate of the civilian labor force in general (9.0%) and the unemployment rate for the entire SESTAT population regardless of level or year of award of highest degree (4.3%).
Working involuntarily out of field. About 1.8% of the employed recent SEH doctorate recipients reported that they took a job that was not related to the field of their doctorate because a suitable job in their field was not available (table 3-17). This compared favorably with the IOF rate for the entire SESTAT population (6.4%).
Tenure-track positions. Although many science doctor-ate recipients aspire to tenure-track academic appointments (Sauermann and Roach 2012), most end up working in other
positions and sectors. In 2010, about 15% of those who had earned their SEH doctorate within the previous 3 years had a tenure or tenure-track faculty appointment, a proportion that has held broadly steady since 1993 (table 3-18). Across the broad SEH fields, this proportion varied significantly, from about 7% to 8% among recent doctorates in life sciences, physical sciences, and engineering to about 41% among those in the social sciences.
The proportion of SEH doctorates who hold a tenure or tenure-track faculty appointment increases the more time has passed since earning their doctorate. In 2010, the propor-tion of SEH doctorates with tenure or tenure-track appoint-ments who had been in the labor market for 3 to 5 years was higher (20%) than the rate among those who had completed their doctorate within 3 years (15%) (table 3-18). The extent of the increase varies across the broad areas of training. In the social sciences, for example, a relatively large percent-age of individuals get into a tenure or tenure-track position within 3 years of obtaining their doctorate, and the increase associated with 3 to 5 years of labor market exposure is not as dramatic as in some other fields, such as physical sciences or mathematics and statistics. (See chapter 5 for a discus-sion of trends in tenure-track positions as a proportion of all academic positions.)
The availability of tenure-track positions may be coun-terbalanced by the availability of desirable nonacademic employment opportunities. Although the proportion of in-dividuals who obtain tenure or tenure-track employment within 3 years of completing their doctorates has remained
Table 3-16Labor market indicators for recent S&E degree recipients up to 5 years after receiving degree, by level and field of highest degree: 2010
Indicator and highest degree levelAll S&E fields
Biological, agricultural, and environmental life sciences
Computer and mathematical
sciencesPhysical sciences
Social sciences Engineering
Unemployment rate (%)All degree levels ........................................... 6.6 6.1 6.7 4.2 8.0 4.4
Bachelor’s ................................................ 7.7 7.3 8.2 5.2 8.8 5.6Master’s .................................................... 4.0 2.3 2.6 5.3 5.9 2.9Doctorate ................................................. 1.6 2.8 S S S 3.6
Involuntarily out-of-field (IOF) rate (%)All degree levels ........................................... 10.8 10.2 7.5 9.9 15.6 3.7
Bachelor’s ................................................ 13.5 12.4 10.6 10.9 18.0 4.1Master’s .................................................... 4.7 4.8 1.4 S 6.3 3.0Doctorate ................................................. 1.7 S S S S S
Median annual salary ($)All degree levels ........................................... 40,000 35,000 55,000 36,000 33,000 60,000
Bachelor’s ................................................ 35,000 30,000 50,000 30,000 31,000 57,000Master’s .................................................... 55,000 48,000 68,000 32,000 39,000 73,000Doctorate ................................................. 60,000 47,000 85,000 55,000 62,000 85,000
S = suppressed for reasons of confidentiality and/or reliability.
NOTES: Median annual salaries are rounded to the nearest $1,000. All degree levels includes professional degrees not broken out separately. Data include degrees earned from October 2005 to October 2009. The IOF rate is the proportion of all employed individuals who report that their job is not related to their field of highest degree because a job in their highest degree field was not available.
SOURCE: National Science Foundation, National Center for Science and Engineering Statistics, Scientists and Engineers Statistical Data System (SESTAT) (2010), http://sestat.nsf.gov.
Science and Engineering Indicators 2014

3-36 ♦ Chapter 3. Science and Engineering Labor Force
Table 3-17Employment characteristics of recent SEH doctorate recipients up to 3 years after receiving doctorate, by field of degree: 2001–10
Recent doctorates (n) Unemployment rate (%)Involuntarily
out-of-field rate (%)
Field of doctorate 2001 2003 2006 2008 2010 2001 2003 2006 2008 2010 2001 2003 2006 2008 2010
All recent SEH doctorates ...... 48,700 43,700 49,500 52,600 52,700 1.3 2.5 1.2 1.5 2.3 2.8 2.1 1.4 1.3 1.8Biological, agricultural,
and environmental life sciences ..................... 12,300 11,200 12,600 13,400 14,100 1.4 2.4 0.9 1.7 1.5 2.6 1.0 0.3 1.0 1.5
Computer and information sciences ....... 1,600 1,400 1,500 2,400 2,500 0.3 4.1 1.9 S S S S 2.6 1.4 S
Mathematics and statistics .. 2,200 1,600 2,000 2,400 2,400 0.2 3.4 S S S 1.4 3.4 2.2 1.1 SPhysical sciences .............. 7,700 6,500 7,400 7,500 7,700 1.5 1.3 1.1 3.0 2.6 5.4 4.2 2.6 2.3 1.4Psychology ......................... 7,200 6,300 7,000 5,800 5,400 1.5 2.7 1.2 0.8 3.8 3.0 1.5 1.4 0.8 2.0Social sciences ................... 5,800 6,000 6,200 5,900 6,000 1.6 3.1 1.4 2.1 3.4 3.3 3.0 2.3 3.4 3.5Engineering ......................... 9,400 8,000 9,500 12,000 11,300 1.5 3.0 1.8 1.2 2.7 2.0 3.0 1.6 0.7 1.9Health .................................. 2,400 2,700 3,200 3,300 3,400 0.4 0.7 0.9 1.2 S S 1.1 S S S
S = suppressed for reasons of confidentiality and/or reliability.
SEH = science, engineering, and health.
NOTES: Involuntarily out-of-field rate is the proportion of all employed individuals who report working in a job not related to their field of doctorate because a job in that field was not available. Data for 2001 and 2006 include graduates from 12 months to 36 months prior to the survey reference date; data for 2003, 2008, and 2010 include graduates from 15 months to 36 months prior to the survey reference date. Detail may not add to total because of rounding.
SOURCE: National Science Foundation, National Center for Science and Engineering Statistics, Survey of Doctorate Recipients (SDR) (2001–10), http://sestat.nsf.gov.
Science and Engineering Indicators 2014
Table 3-18Employed SEH doctorate recipients holding tenure and tenure-track appointments at academic institutions, by field of and years since degree: 1993–2010(Percent)
Years since doctorate and field 1993 1995 1997 1999 2001 2003 2006 2008 2010
< 3 yearsAll SEH fields ...................................................... 18.1 16.3 15.8 13.5 16.5 18.6 17.7 16.2 14.7
Biological, agricultural, and environmental life sciences ................................................. 9.0 8.5 9.3 7.7 8.6 7.8 7.2 6.5 7.6
Computer and information sciences................ 31.5 36.5 23.4 18.2 20.7 32.5 31.2 22.0 20.8Mathematics and statistics ............................. 40.9 39.8 26.9 18.9 25.2 38.4 31.6 31.3 26.1Physical sciences ............................................ 8.8 6.9 8.5 7.8 10.0 13.3 9.8 8.8 6.8Psychology ...................................................... 12.8 13.6 14.7 16.0 15.6 14.6 17.0 18.1 16.0Social sciences ............................................... 43.5 35.9 37.4 35.4 38.5 44.8 39.3 45.4 41.1Engineering ..................................................... 15.0 11.5 9.4 6.4 11.3 10.8 12.4 9.3 7.5Health .............................................................. 33.9 34.2 30.1 28.1 32.1 30.3 36.2 27.7 24.2
3–5 yearsAll SEH fields ...................................................... 27.0 24.6 24.2 21.0 18.5 23.8 25.9 22.9 19.7
Biological, agricultural, and environmental life sciences ................................................. 17.3 17.0 18.1 16.4 14.3 15.5 13.7 14.3 10.6
Computer and information sciences ............... 55.7 37.4 40.7 25.9 17.3 32.2 45.7 37.8 22.2Mathematics and statistics ............................. 54.9 45.5 48.1 41.0 28.9 45.5 50.6 40.7 41.7Physical sciences ............................................ 18.8 15.5 14.5 11.9 15.8 18.3 19.7 16.5 14.7Psychology ...................................................... 17.0 20.7 16.8 17.6 17.5 19.9 23.8 18.3 19.1Social sciences ............................................... 54.3 52.4 50.4 46.5 38.8 46.0 50.4 48.9 46.7Engineering ..................................................... 22.7 19.3 19.4 12.6 10.8 15.9 16.3 15.5 13.0Health .............................................................. 47.4 40.2 41.1 39.5 25.1 40.8 43.1 34.4 33.3
SEH = science, engineering, and health.
NOTES: Proportions are calculated on the basis of all doctorates working in all sectors of the economy. Data for 1993–99, 2001, and 2006 include graduates from 12 months to 60 months prior to the survey reference date; data for 2003, 2008, and 2010 include graduates from 15 months to 60 months prior to the survey reference date.
SOURCE: National Science Foundation, National Center for Science and Engineering Statistics, Survey of Doctorate Recipients (1993–2010), http://sestat.nsf.gov.
Science and Engineering Indicators 2014

Science and Engineering Indicators 2014 ♦ 3-37
broadly stable since 1993, the proportion of graduates with tenure or tenure-track positions within 3 to 5 years of receiv-ing their doctorates has declined since 1993 in most broad areas of SEH training (table 3-18). One of the steepest de-clines occurred in computer sciences despite the high de-mand for computer sciences faculty.
Salaries for recent SEH doctorate recipients. For all SEH degree fields in 2010, the median annual salary for re-cent doctorate recipients within 5 years after receiving their degrees was $66,000. Across various SEH degree fields, median annual salaries ranged from a low of $50,000 in biological sciences to a high of $94,000 in computer and information sciences (table 3-19). Between 2008 and 2010, a period marked by the economic downturn and its immediate aftermath, median salaries for recent recipients of doctoral degrees in most SEH areas either stayed the same or de-clined slightly (the median salary for recent SEH doctorate recipients in 2008 was $67,000).
By type of employment, salaries for recent doctorate re-cipients ranged from $42,000 for postdoctoral positions in 4-year institutions to $90,000 for those employed in the busi-ness sector (table 3-20). Each sector, however, exhibited sub-stantial variation depending on SEH fields of training.
Postdoctoral PositionsA significant number of new S&E doctorate recipients
take a postdoctoral appointment (generally known as a post-doc) as their first position after receiving their doctorate.
Table 3-19Salaries for recent SEH doctorate recipients up to 5 years after receiving degree at selected percentiles, by field of degree: 2010(Dollars)
Field of doctorate25th
percentile50th
percentile75th
percentile
All SEH fields ............... 47,000 66,000 90,000Biological,
agricultural, and environmental life sciences .......... 42,000 50,000 71,000
Computer and information sciences ............... 75,000 94,000 120,000
Mathematics and statistics ............... 51,000 64,000 95,000
Physical sciences .... 45,000 60,000 84,000Psychology .............. 47,000 60,000 77,000Social sciences ........ 50,000 63,000 84,000Engineering .............. 67,000 87,000 101,000Health ....................... 57,000 75,000 92,000
SEH = science, engineering, and health.
NOTES: Salaries are rounded to the nearest $1,000. Data include graduates from 15 months to 60 months prior to the survey reference date.
SOURCE: National Science Foundation, National Center for Science and Engineering Statistics, Survey of Doctorate Recipients (2010), http://sestat.nsf.gov.
Science and Engineering Indicators 2014
Table 3-20Median salaries for recent SEH doctorate recipients up to 5 years after receiving degree, by field of degree and employment sector: 2010(Dollars)
Education
4-year institutions
Field of doctorateAll
sectorsAll
positions
Tenured or tenure-track
position Postdoc
2-year or precollege institutions Government
Business/ industry
All SEH fields ........................................... 66,000 52,000 65,000 42,000 52,000 76,000 90,000Biological, agricultural, and
environmental life sciences .............. 50,000 45,000 60,000 42,000 45,000 65,000 73,000Computer and information sciences.... 94,000 70,000 74,000 47,000 S 99,000 111,000Mathematics and statistics .................. 64,000 56,000 62,000 51,000 58,000 S 95,000Physical sciences ................................ 60,000 47,000 60,000 42,000 51,000 71,000 86,000Psychology .......................................... 60,000 55,000 57,000 42,000 59,000 78,000 65,000Social sciences .................................... 63,000 58,000 63,000 44,000 57,000 85,000 98,000Engineering............................................ 87,000 59,000 80,000 42,000 S 86,000 95,000Health ................................................... 75,000 69,000 72,000 41,000 51,000 85,000 93,000
S = suppressed for reasons of confidentiality and/or reliability.
SEH = science, engineering, and health.
NOTES: Salaries are rounded to the nearest $1,000. Data include graduates from 15 months to 60 months prior to the survey reference date. The 2-year or precollege institutions include 2-year colleges and community colleges or technical institutes and also preschool, elementary, middle, or secondary schools. The 4-year institutions include 4-year colleges or universities, medical schools, and university-affiliated research institutes.
SOURCE: National Science Foundation, National Center for Science and Engineering Statistics, Survey of Doctorate Recipients (2010), http://sestat.nsf.gov.
Science and Engineering Indicators 2014

3-38 ♦ Chapter 3. Science and Engineering Labor Force
Postdoc positions are defined as temporary, short-term posi-tions, primarily for acquiring additional training in an aca-demic, government, industry, or non-profit setting.19 This section looks at employment characteristics of postdocs.
The incidence of SEH doctorate holders taking postdoc positions during their careers has risen over time. Among U.S. SEH doctorate holders who received their doctorate before 1972, 31% reported having had a postdoc position earlier in their careers; this proportion rose to 46% among 2002–05 graduates (NSB 2010). Although individuals in postdoc positions often perform cutting-edge research, these positions generally offer lower salaries than permanent posi-tions, which essentially adds to the costs of doctoral stud-ies and has the unintended consequence of making science careers less desirable to potential graduate students. The growing number of postdoc positions, as well as the rise in average postdoc tenure, has received much attention in sci-ence policy in recent years (e.g., NIH 2012). Neither the rea-sons for this growth nor its effects on the state of scientific research are well understood. However, possible contribut-ing factors include increases in competition for tenure-track academic research jobs, the need for collaborative research in large teams, the influx of graduate students in SEH ar-eas with strong postdoc traditions, and the need for addi-tional specialized training. (See sidebar, “Employment of Biomedical Sciences Doctorates.”)
Number of postdocs. In October 2010, NSF’s Survey of Doctorate Recipients (SDR) estimated that 30,800 U.S. SEH doctorate recipients were employed in postdoc posi-tions. The vast majority of these postdoc positions were in 4-year academic institutions (75%), with the remainder in industry (16%) and government (10%). The fall 2010 and fall 2011 estimates from NSF’s Survey of Graduate Students and Postdoctorates in Science and Engineering, which cov-ers academic postdocs, were 63,400 and 62,900, respective-ly (NSF/NCSES 2013a and 2013b). These estimates cover different segments of the postdoc population. The Survey of Graduate Students and Postdoctorates in Science and Engineering gathers information on postdocs from U.S. aca-demic graduate departments, regardless of where these indi-viduals earned their doctorates. It does not cover individuals in nonacademic employment, at some university research centers, or at academic departments that lack graduate pro-grams. In contrast, the SDR covers U.S. residents with re-search doctorates in SEH fields from U.S. universities, but not those with doctorates from non-U.S. universities. As a result, the SDR omits a large number of postdocs who are foreign trained. The two survey estimates overlap in some populations (U.S.-trained doctorates and those working in academia), but differ in others (the Survey of Graduate Students and Postdoctorates in Science and Engineering covers foreign-trained doctorates, but not those in the indus-try or government sectors). In addition, the titles of post-doc researchers vary across organizations and often change as individuals advance through their postdoc appointment;
both of these factors further complicate the data collection process (NIH 2012).20
Postdocs by academic discipline. Although postdocs are increasingly common in SEH fields, the extent to which a postdoc appointment is part of an individual’s career path varies greatly across SEH fields. In the field of life sciences, for example, postdocs have historically been more common than in other SEH fields. According to NSF’s Survey of Earned Doctorates (SED), the proportion of new doctorate recipients in 2011 indicating that they would take a postdoc appointment after graduation ranged from nearly 70% in life sciences (including agricultural sciences/natural resources, biological/biomedical sciences, and health sciences) to 37% in the social sciences (appendix table 3-11). SDR data indi-cate that in 2010 about half of those who had received their doctorates in the previous 3 years in biological/agricultural/environmental life sciences (53%) or physical sciences (47%) were employed in postdoc positions, compared to only 11% in the social sciences (figure 3-24). Within physi-cal sciences, chemistry and physics have particularly strong postdoc traditions.
Postdoc compensation. Low compensation for postdocs is frequently raised as a concern by those who are worried about the effect of the increasing number and length of post-doc positions on the attractiveness of science careers. In 2010, the median salary for postdocs who had received their doctorate within the past 5 years was just over half (57%) the median salary paid to non-postdocs (table 3-21). This proportion ranged from about half among individuals with doctorates in engineering (48%) and computer and infor-mation sciences (50%) to about three-quarters among those with doctorates in social sciences (69%) and mathematics and statistics (76%).
Among recent graduates, similar proportions of postdocs and non-postdocs have access to certain employer-provid-ed benefits, such as health insurance (95% of postdocs and 92% of non-postdocs) and paid vacation, sick, or personal days (87% of postdocs and 86% of non-postdocs). However, a much smaller proportion of recent graduates in postdoc positions have access to employer-provided pensions or re-tirement plans (56% of postdocs and 84% of non-postdocs). Information on the quality of these benefits—for example, the coverage and premium of health insurance plans, num-ber of personal days offered by employer, and type of retire-ment benefits—is not available.
Reasons for taking postdoc positions. The 2010 SDR asked individuals in postdoc positions to report their rea-son for accepting these appointments. When asked about the primary reason, most responses were consistent with the traditional objective of a postdoc position as a type of advanced apprenticeship for career progression, such as “postdoc generally expected in field,” “additional training in PhD field,” “additional training in an area outside of PhD

Science and Engineering Indicators 2014 ♦ 3-39
Employment patterns in the biomedical sciences have changed in the past two decades. The growth in the num-ber of doctorates trained in the field has far surpassed the growth in academic positions, contributing to lengthy post-doc appointments, stiff competition for academic jobs, and an increasing proportion of doctorates going into posi-tions that are not research-intensive (National Institutes of Health [NIH] 2012). According to the Survey of Doctorate Recipients (SDR), between 1993 and 2010, the number of U.S.-educated doctorate holders in the biomedical sciences substantially rose (from about 105,000 to nearly 180,000).* Over this same time, the proportion employed in academia declined (58% to 51%) as did the proportion employed in tenure or tenure-track positions (35% to 26%) despite the fact that both increased in absolute number. The proportion of U.S.-educated doctorate holders who reported research (basic or applied) as their primary or secondary work ac-tivity also declined in the education sector (from 75% to 70%). In contrast, the proportion of biomedical sciences doctorates employed in the business sector rose (from 31% to 39%). The majority of the increase in the business sector was driven by those whose jobs did not involve research as their primary or secondary work activity. The proportion of biomedical sciences doctorates reporting that they are em-ployed in jobs closely related to their doctoral degree has declined over this same time (from 68% to 60%), whereas the proportion employed in jobs “somewhat” related to their doctorate has increased (from 24% to 32%). The available data cover the U.S.-educated doctorate holders; the data on foreign-trained doctorates in the field, a segment of the workforce that has grown significantly (NIH 2012), are not comprehensive. The information on postdoc researchers is also not comprehensive.
Despite the persistence of generally favorable employ-ment indicators for biomedical sciences doctorates (the un-employment rate was around 2% in 1993 and 2010, and the rate of working involuntarily out of field was around 3% in both periods), the changes in the employment patterns have generated significant concerns in the profession. Concerns center on the rising number of research doctorates unable to find tenure-track academic research positions, the increas-ing number and length of postdoc appointments, the influx of foreign-trained doctorates seeking academic positions, and the rising number of early career doctorates taking posi-tions that are not research-intensive and for which current graduate programs may not provide appropriate preparation. In addition, the overall training period, including PhD and postdoc research, is longer in the biomedical sciences than in other comparable disciplines, such as chemistry, physics, and mathematics (NIH 2012). Furthermore, average start-ing salaries are lower among doctorates in the biomedical sciences than in other fields, such as chemistry, clinical and health fields, and economics (NIH 2012).
In light of the changes in the profession and the resulting concern in the science community, NIH convened a working
group consisting of biomedical educators and other experts on the biomedical workforce to develop a set of policy recom-mendations to support a robust and viable workforce.† The working group recently presented specific recommendations targeted at enhancing graduate training, postdoc research ex-perience, and data collection and dissemination regarding the biomedical workforce. The following is a summary of the main recommendations of this working group:
♦ To prepare early career scientists for a wide range of ca-reer options, encourage graduate programs to undertake innovative approaches. These may include offering al-ternative degree programs, such as master’s programs, and providing training in areas that are generally not covered in a research-oriented doctoral program, such as project management, business entrepreneurship skills, working in small businesses, and teaching in aca-demic institutions that are not research-intensive.
♦ To shorten the length of training in the field, limit the number of years that a graduate student may be support-ed by NIH funds (any combination of training grants, fellowships, and research project grants).
♦ To improve the quality of training and mentoring re-ceived by graduate students and postdoc researchers, increase the proportion of trainees supported by NIH training grants and fellowships relative to the propor-tion supported by NIH research project grants without increasing the total number of graduate student and post-doc researcher positions.
♦ Improve postdoc compensation and benefits, and fa-cilitate the prompt transitions of postdocs and doctoral students into permanent positions by developing indi-vidual career development opportunities.
♦ Encourage institutions receiving NIH funds to gather and share comprehensive information on career outcomes of their PhD trainees and postdoc researchers, such as com-pletion rates, time to degree, time in postdoc training, and post-training career outcome. This will help prospective graduate students and postdocs contemplating careers in the biomedical sciences to make informed decisions in a changing biomedical labor market.
♦ Encourage NIH, through collaboration with other fed-eral agencies, to undertake initiatives to enhance the collection, analysis, and dissemination of information on biomedical sciences doctorates and postdocs.
* See NIH (2012) for a discussion on the fields of science considered as biomedical sciences. Based on the report, the following degree categories from the SDR are included in the data presented in this sidebar: biochem-istry and biophysics, bioengineering and biomedical engineering, cell and molecular biology, microbiological sciences and immunology, zoology, bi-ology (general), botany, ecology, genetics (animal and plant), nutritional science, pharmacology (human and animal), physiology and pathology (human and animal), and other biological sciences.
† For detailed information, see the NIH report available at http://acd.od.nih.gov/Biomedical_research_wgreport.pdf (accessed 16 November 2013).
Employment of Biomedical Sciences Doctorates
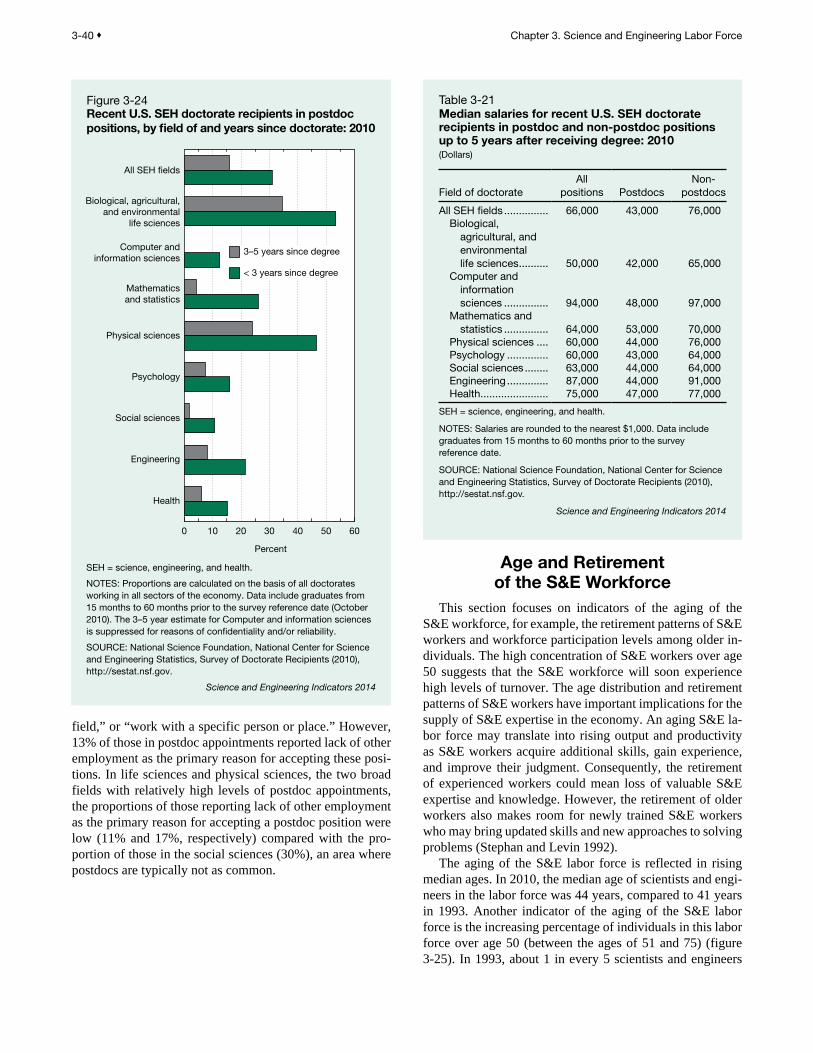
3-40 ♦ Chapter 3. Science and Engineering Labor Force
field,” or “work with a specific person or place.” However, 13% of those in postdoc appointments reported lack of other employment as the primary reason for accepting these posi-tions. In life sciences and physical sciences, the two broad fields with relatively high levels of postdoc appointments, the proportions of those reporting lack of other employment as the primary reason for accepting a postdoc position were low (11% and 17%, respectively) compared with the pro-portion of those in the social sciences (30%), an area where postdocs are typically not as common.
Age and Retirement of the S&E Workforce
This section focuses on indicators of the aging of the S&E workforce, for example, the retirement patterns of S&E workers and workforce participation levels among older in-dividuals. The high concentration of S&E workers over age 50 suggests that the S&E workforce will soon experience high levels of turnover. The age distribution and retirement patterns of S&E workers have important implications for the supply of S&E expertise in the economy. An aging S&E la-bor force may translate into rising output and productivity as S&E workers acquire additional skills, gain experience, and improve their judgment. Consequently, the retirement of experienced workers could mean loss of valuable S&E expertise and knowledge. However, the retirement of older workers also makes room for newly trained S&E workers who may bring updated skills and new approaches to solving problems (Stephan and Levin 1992).
The aging of the S&E labor force is reflected in rising median ages. In 2010, the median age of scientists and engi-neers in the labor force was 44 years, compared to 41 years in 1993. Another indicator of the aging of the S&E labor force is the increasing percentage of individuals in this labor force over age 50 (between the ages of 51 and 75) (figure 3-25). In 1993, about 1 in every 5 scientists and engineers
Figure 3-24Recent U.S. SEH doctorate recipients in postdoc positions, by field of and years since doctorate: 2010
Percent
SEH = science, engineering, and health.
NOTES: Proportions are calculated on the basis of all doctorates working in all sectors of the economy. Data include graduates from 15 months to 60 months prior to the survey reference date (October 2010). The 3–5 year estimate for Computer and information sciences is suppressed for reasons of con�dentiality and/or reliability.
SOURCE: National Science Foundation, National Center for Science and Engineering Statistics, Survey of Doctorate Recipients (2010), http://sestat.nsf.gov.
Science and Engineering Indicators 2014
0 10 20 30 40 50 60
< 3 years since degree
3–5 years since degree
Health
Engineering
Social sciences
Psychology
Physical sciences
Mathematicsand statistics
Computer andinformation sciences
Biological, agricultural,and environmental
life sciences
All SEH �elds
Table 3-21Median salaries for recent U.S. SEH doctorate recipients in postdoc and non-postdoc positions up to 5 years after receiving degree: 2010(Dollars)
Field of doctorateAll
positions PostdocsNon-
postdocs
All SEH fields ............... 66,000 43,000 76,000Biological,
agricultural, and environmental life sciences .......... 50,000 42,000 65,000
Computer and information sciences ............... 94,000 48,000 97,000
Mathematics and statistics ............... 64,000 53,000 70,000
Physical sciences .... 60,000 44,000 76,000Psychology .............. 60,000 43,000 64,000Social sciences ........ 63,000 44,000 64,000Engineering .............. 87,000 44,000 91,000Health ....................... 75,000 47,000 77,000
SEH = science, engineering, and health.
NOTES: Salaries are rounded to the nearest $1,000. Data include graduates from 15 months to 60 months prior to the survey reference date.
SOURCE: National Science Foundation, National Center for Science and Engineering Statistics, Survey of Doctorate Recipients (2010), http://sestat.nsf.gov.
Science and Engineering Indicators 2014

Science and Engineering Indicators 2014 ♦ 3-41
in the labor force was in that age group (20%), whereas by 2010 the proportion rose to 1 out of 3 (33%).
Between 1993 and 2010, the proportion of scientists and engineers in the labor force over 50 years of age rose for both men and women; however, the female labor force con-tinues to be younger relative to their male counterparts (fig-ure 3-25). In 2010, 30% of female scientists and engineers in the labor force were between 51 and 75 years of age, com-pared to 36% of male scientists and engineers in the labor force. In 2010, the median ages in the SESTAT population were 42 years for women and 45 years for men, whereas in 1993 the median ages were 38 and 42, respectively.
Age Differences among OccupationsSESTAT respondents working in S&E occupations are
younger than those in S&E-related or non-S&E occupations (figure 3-26). In 2010, 26% of those in S&E occupations were between 51 and 75 years of age compared with 34% of those in S&E-related occupations and 36% of those in non-S&E occupations. The median age of the SESTAT pop-ulation employed in S&E occupations was 42 years, com-pared to 44 years among those employed in S&E-related
occupations and 45 years among those employed in non-S&E occupations.
The age differences across S&E and non-S&E occu-pations were more pronounced for men than for women. Among male scientists and engineers, 27% of those em-ployed in S&E occupations were between the ages of 51 and 75 compared with 41% of those employed in non-S&E oc-cupations. Among female scientists and engineers, 24% of those employed in S&E occupations were between the ages of 51 and 75 compared with 30% of those employed in non-S&E occupations.
Age Differences among Degree FieldsSimilar to the trend seen across broad occupational cat-
egories, S&E highest degree holders are generally younger than those holding highest degrees in S&E-related or non-S&E fields (figure 3-26). In 2010, 30% of S&E highest de-gree holders were between 51 and 75 years of age compared with 36% of those with highest degrees in S&E-related or non-S&E fields. However, degree holders in different S&E fields varied in their ages. S&E highest degree holders in the physical sciences, particularly the men in this group, were older than those in other S&E fields (appendix table 3-12). S&E highest degree holders in computer and mathematical
NOTES: For 1993 data, scientists and engineers include those with one or more S&E degrees at the bachelor’s level or higher or those who have only a non-S&E degree at the bachelor's level or higher and are employed in an S&E occupation. For 2010 data, scientists and engineers include those with one or more S&E or S&E-related degrees at the bachelor’s level or higher or those who have only a non-S&E degree at the bachelor’s level or higher and are employed in an S&E or S&E-related occupation. The Scientists and Engineers Statistical Data System (SESTAT) does not cover scientists and engineers over age 75.
SOURCE: National Science Foundation, National Center for Science and Engineering Statistics, SESTAT (1993, 2010), http://sestat.nsf.gov.
Science and Engineering Indicators 2014
Figure 3-25Age distribution of scientists and engineers in the labor force, by sex: 1993 and 2010
1993Total Female Male
2010 1993 2010 1993 20100
20
40
60
80
100
< 30
30–50
51–75
Years ofage
Percent
NOTES: Scientists and engineers include those with one or more S&E or S&E-related degrees at the bachelor's level or higher or those who have only a non-S&E degree at the bachelor's level or higher and are employed in an S&E or S&E-related occupation. The Scientists and Engineers Statistical Data System (SESTAT) does not cover scientists and engineers over age 75.
SOURCE: National Science Foundation, National Center for Science and Engineering Statistics, SESTAT (2010), http://sestat.nsf.gov.
Science and Engineering Indicators 2014
Figure 3-26Age distribution of employed scientists and engineers, by broad occupational category and broad field of highest degree: 2010
S&E S&E-related
Occupation Highest degree
Non-S&E
S&E S&E-related
Non-S&E
0
20
40
60
80
100
Percent
< 30
30–50
51–75
Years ofage

3-42 ♦ Chapter 3. Science and Engineering Labor Force
sciences, in social sciences, and in engineering were rela-tively young.
Within broad degree areas, the age profile of different de-gree fields varies (appendix table 3-12). For example, within computer and mathematical sciences degree fields, 16% of highest degree holders in computer and information sci-ences were between 51 and 75 years of age compared with 39% of highest degree holders in mathematics and statistics. In all broad S&E fields of highest degree except computer and mathematical sciences, women were younger than their male counterparts (appendix table 3-12).
RetirementThe increasing proportion of the SESTAT labor force
over 50 years of age raises the issue of how impending re-tirement will affect the supply of S&E workers. Patterns of labor force participation among older individuals provide useful information about potential retirement ages and how retirement ages may have changed over time.
Recent patterns of leaving the labor force and shifting to part-time work among older members of the workforce sug-gest that after age 55 the labor force participation rate among scientists and engineers begins to decline and is markedly reduced by the time workers reach their late 60s. One indi-cation of the relationship between age and the level of labor force participation is illustrated by figure 3-27, which shows
the proportions of older scientists and engineers working full time. In 2010, at age 50, 80% of scientists and engineers worked full time (35 hours or more per week) in their princi-pal job. Among individuals in their mid- to late-50s, this pro-portion dropped steeply. Among those in their mid-60s, for example, only about one-third worked full time. The overall pattern of declining full-time participation starting in indi-viduals’ mid- to late-50s held at all degree levels, although doctorate holders generally worked full time at higher rates than bachelor’s degree holders (figure 3-27).
Between 1993 and 2010, increasing proportions of SESTAT respondents in their 60s reported still being in the labor force. Whereas 69% of SESTAT respondents between the ages of 60 and 64 were in the labor force in 1993, this pro-portion rose to 74% in 2010. For those between the ages of 65 and 69, the proportion rose from 39% in 1993 to 47% in 2010.
Reasons provided by SESTAT respondents for labor force nonparticipation or part-time work status also shed light on the relationship between age and retirement. In 2010, about 2.5 million scientists and engineers reported that they were out of the labor force because of retirement. The vast majority (87%) of retired individuals were 60–75 years of age, and half of the retired individuals (51%) were between the ages of 67 and 75. Individuals with doctorates reported lower rates of retirement than those without doctor-ates (figure 3-28).
Figure 3-28Older scientists and engineers who report not working because of retirement, by age: 2010Percent
NOTES: All degree levels include professional degrees not reported separately. The missing data points are suppressed for reasons of con�dentiality and/or reliability. Scientists and engineers include those with one or more S&E or S&E-related degrees at the bachelor’s level or higher or those who have only a non-S&E degree at the bachelor’s level or higher and are employed in an S&E or S&E-related occupation.
SOURCE: National Science Foundation, National Center for Science and Engineering Statistics, Scientists and Engineers Statistical Data System (SESTAT) (2010), http://sestat.nsf.gov.
Science and Engineering Indicators 2014
Years of age
50 53 55 57 59 61 63 65 67 69 71 73 750
20
40
60
80
100
All degree levels
Bachelor’s
Master’s
Doctorate
Figure 3-27Older scientists and engineers who work full time, by age and highest degree level: 2010Percent
NOTES: All degree levels include professional degrees not reported separately. Scientists and engineers include those with one or more S&E or S&E-related degrees at the bachelor’s level or higher or those who have only a non-S&E degree at the bachelor’s level or higher and are employed in an S&E or S&E-related occupation.
SOURCE: National Science Foundation, National Center for Science and Engineering Statistics, Scientists and Engineers Statistical Data System (SESTAT) (2010), http://sestat.nsf.gov.
Science and Engineering Indicators 2014
Years of age
50 53 55 57 59 61 63 65 67 69 71 73 750
20
40
60
80
100
All degree levels
Bachelor’s
Master’s
Doctorate

Science and Engineering Indicators 2014 ♦ 3-43
Retirement, however, does not always mean that workers permanently leave the labor force. After nominally retiring from their jobs, some workers continue to work part time, work in a different capacity, or decide to return to the labor market at a later time. About 1.4 million scientists and en-gineers employed in 2010 reported that they had previously retired from a job. A total of 653,000 scientists and engi-neers working part time in 2010 reported their reason for working part time as having “previously retired or semi-re-tired.” Individuals who chose to stay in or return to the labor market following an occurrence of retirement were younger (median age 62) than those who were out of the labor force following retirement (median age 67).
Compared to all employed scientists and engineers includ-ed in SESTAT, the 1.4 million SESTAT respondents who stayed in or returned to the workforce after having retired from a previous position were less likely to hold S&E jobs (18% versus 25% for all employed SESTAT respondents) or to work in areas closely related to their highest degree (46% versus 58% for all employed SESTAT respondents) and more likely to be self-employed in unincorporated business-es (17% versus 7% for all employed SESTAT respondents).
Women and Minorities in the S&E Workforce
As researchers and policymakers increasingly empha-size the need for expanding S&E capabilities in the United States, many view demographic groups with lower rates of S&E participation as an underutilized source of human capi-tal for S&E work. Historically, in the United States, S&E fields have had particularly low concentrations of women and members of many racial and ethnic minority groups (i.e., blacks, Hispanics, American Indians or Alaska Natives), both relative to the concentrations of these groups in other occupational or degree areas and relative to their represen-tation in the general population. However, women and ra-cial and ethnic minorities increasingly have been choosing a wider range of degrees and occupations over time. This section presents data on S&E participation by women and by racial and ethnic minorities. It also presents data on earnings differentials by sex and by race and ethnicity.
Women in the S&E WorkforceHistorically, men have outnumbered women by wide
margins with regards to both S&E employment and S&E training. Although the number of women in S&E occupa-tions or with S&E degrees nearly doubled over the past two decades, the disparity has narrowed only modestly. The im-balance is still particularly pronounced in S&E occupations. In 2010, women constituted only 28% of workers in these occupations, even though they accounted for nearly half of the college-educated workforce. Among S&E degree hold-ers, the disparity was smaller but nonetheless significant, with women representing 37% of employed individuals with a highest degree in S&E (figure 3-29).
Women in S&E OccupationsAlthough women represented only 28% of individuals in
S&E occupations in 2010, women’s presence varies widely across S&E occupational fields (appendix table 3-13). The percentage of female S&E workers is lowest in engineering, where women constituted 13% of the workforce in 2010. Among engineering occupations with large numbers of work-ers, the disparity between men and women is greatest among mechanical engineers, with women accounting for only 7% of the workforce. Other large engineering occupations in which women account for about 11% to 12% of the work-force include electrical and computer hardware engineers and aerospace, aeronautical, and astronautical engineers.
Other disproportionately male S&E occupations include physical scientists (30% women) and computer and mathe-matical scientists (25% women). Within the physical scienc-es occupations, physicists and astronomers have the largest imbalance (18% women). Within the computer and math-ematical sciences occupations, the largest component, com-puter and information scientists, has the smallest proportion of women (23%). The mathematical scientists component is much closer to parity (46% women).
In 2010, sex parity in S&E occupations was close among life scientists (48% women). Within the life sciences occu-pations, biological and medical scientists, the largest com-ponent, had reached gender parity (52% women). The field of social sciences was majority female (58%). Occupations within the social sciences, however, varied with respect to the proportion of female workers. Thus, women accounted for slightly more than one-third of economists (37%) but
Figure 3-29Women in the workforce and in S&E: 1993 and 2010Percent
SOURCES: National Science Foundation, National Center for Science and Engineering Statistics, Scientists and Engineers Statistical Data System (SESTAT) and National Survey of College Graduates (NSCG) (1993 and 2010), http://sestat.nsf.gov.
Science and Engineering Indicators 2014
College-educatedworkforce
S&E occupations S&E highest degree0
10
20
30
40
50
60
1993 2010

3-44 ♦ Chapter 3. Science and Engineering Labor Force
more than two-thirds of psychologists (70%). Psychologists, estimated at about 171,000 total workers in SESTAT (ap-pendix table 3-13), was an example of a large S&E occupa-tion with substantially more women than men.
In contrast to jobs in S&E occupations, a majority of jobs in S&E-related occupations (56%) are held by women (ap-pendix table 3-13). The largest component, health-related occupations, employed a large number of women (68% women), primarily as nurse practitioners, pharmacists, reg-istered nurses, dietitians, therapists, physician assistants, and health technologists and technicians.
Since the early 1990s, the number of women working in each broad S&E occupational category has risen signif-icantly. The rate of growth has been strongest among life scientists, computer and mathematical scientists, and social scientists. These three broad S&E fields together employed 80% of women in S&E occupations in 2010, compared with 59% of men in S&E occupations. Between 1993 and 2010, the number of women more than doubled among life scien-tists (an increase of 162%) and nearly doubled among so-cial scientists (an increase of 87%). The number of men also grew, but the rate of growth for women was greater than that for men, resulting in an increase in the proportion of female life scientists and female social scientists (figure 3-30).
During the same period, the number of women in com-puter and mathematical sciences occupations nearly doubled (an increase of 97%). However, unlike the other broad S&E occupational categories, the rate of growth in male partici-pation was larger (161%) than that of women, resulting in an overall decline in the proportion of women from 31% to
25%. These trends made the gender disparity among com-puter and mathematical scientists second only to engineers. The declining proportion of women in the computer and mathematical sciences occupations reflects increasing dis-parities in participation among those whose highest degree is at the bachelor’s degree level. Among computer and math-ematical scientists with a doctoral degree, the proportion of women increased, from 16% in 1993 to 20% in 2010.
During the past two decades, women have also increased their proportion among workers in engineering (from 9% to 13%) and in the physical sciences (from 21% to 30%). In these two occupational categories, this increase was led by an expansion of women’s numbers in the workforce (by 67% in engineering and 60% in physical sciences) while men’s numbers barely changed between 1993 and 2010.
Women among S&E Highest Degree HoldersThe sex disparity among employed S&E highest degree
holders is less than the disparity among those in S&E oc-cupations. In 2010, among individuals with a highest degree in an S&E field, women constituted 37% of those who were employed, up from 31% in 1993. The pattern of variation in the proportion of men and women among degree fields echoes the pattern of variation among occupations associ-ated with those fields (appendix table 3-14). In 2010, 54% of S&E highest degree holders in the social sciences fields were women, as were 48% of those with a highest degree in the biological and related sciences. Men outnumbered women among computer sciences and mathematics highest degree holders (28% women) and among physical sciences highest degree holders (27% women). Disparities, however, were greatest among those with a highest degree in engi-neering (only 14% women). In all fields except computer and mathematical sciences, the proportion of women in the workforce with associated highest degrees has been increas-ing over the past two decades. In computer and mathemati-cal sciences, this proportion has declined even as the number of women with a highest degree in the field has risen.
Sex differences are not limited to the field of degree, but also extend to the level of S&E degree. Men outnumber women among S&E highest degree holders at the bache-lor’s, master’s, and doctoral levels. Moreover, the sex dis-parity is higher among S&E doctorate holders than among S&E bachelor’s or master’s degree holders. For example, in 2010 women accounted for 38% of those whose highest de-gree in S&E was at the bachelor’s or master’s level but 30% of those whose highest degree in S&E was at the doctoral level (figure 3-31). At the doctoral level, however, the pro-portion of women has been steadily increasing. The trend at the bachelor’s and master’s levels has been somewhat differ-ent: although the proportion of women in the workforce rose from 1993 to 2003, it remained mostly steady from 2003 to 2010 (figure 3-31).
Working men and women with S&E highest degrees also differ in the extent to which they are employed in the same field as their S&E highest degree. However, this disparity is
Figure 3-30Women in S&E occupations: 1993–2010Percent
NOTE: National estimates were not available from the Scientists and Engineers Statistical Data System (SESTAT) in 2001.
SOURCE: National Science Foundation, National Center for Science and Engineering Statistics, SESTAT (1993–2010), http://sestat.nsf.gov.
Science and Engineering Indicators 2014
1993 1995 1997 1999 2003 2006 2008 20100
10
20
30
40
50
60
70
80
All S&E occupationsComputer/mathematical scientists
Biological/agricultural/environmental life scientistsPhysical scientists
Social scientists
Engineers

Science and Engineering Indicators 2014 ♦ 3-45
largely the result of women having a high concentration in the two degree areas—social sciences and life sciences—where degree holders most often work in non-S&E occupations. In 2010, these two broad fields accounted for three-fourths of all employed women with S&E highest degrees, compared with 41% of all employed men with S&E highest degrees (appendix table 3-14). (See sidebar, “S&E Credentials and the Male-Female Gap in S&E Employment.”)
Across all S&E degree areas, 19% of women with an S&E highest degree are employed in the S&E field in which they earned their degree compared with 32% of men (appendix table 3-15). However, within the majority of degree areas (life sciences, social sciences, and engineering), similar proportions of men and women are employed in the S&E field in which they earned their degree. Computer and mathematical sciences fields are exceptions, where a larger proportion of men (54%) than women (43%) work in an occupation that matches their degree field and a larger proportion of women (38%) than men (27%) work in non-S&E occupations. Among those with life sciences degrees, although a similar proportion of men (23%) and women (22%) work in their degree field, a larger propor-tion of women (35%) than men (18%) are employed in S&E-related occupations. These sex differences in the degree fields of life sciences and computer and mathematical sciences are primarily driven by those whose highest degrees are at the bachelor’s or master’s levels.
Men and women with a highest degree in an S&E field also differ in their labor force nonparticipation rates. Compared with men, women were more likely to be out of the labor force (22% versus 14% for men). The difference in nonpar-ticipation was particularly pronounced between the ages of
30 and 65 (figure 3-32). In 2010, 19% of the women in this age group with an S&E highest degree were out of the labor force compared with 7% of the men. Many women in this group identified family reasons as an important factor: 48% of women reported that family was a factor for their labor force nonparticipation compared with 9% of men. Within this age range, women were also much more likely than men to report that they did not need to work or did not want to work (41% of women versus 26% of men). Men, on the other hand, were much more likely than women to cite re-tirement as a reason for not working (28% of women versus 71% of men).
Minorities in the S&E WorkforceThe participation of underrepresented racial and ethnic
minorities in the S&E workforce has been a concern of poli-cymakers who are interested in the development and employ-ment of diverse human capital to maintain the United States’ global competitiveness in S&E. This section addresses the level of diversity in S&E by race and Hispanic ethnicity.21 Like the preceding section, this section draws on data from NSF’s SESTAT surveys to report on levels of S&E partici-pation: first across occupations and then across the overall workforce with S&E degrees.
Whether defined by occupation, S&E degree, or the com-bined criteria used in SESTAT, the majority of scientists and engineers in the United States are non-Hispanic whites. The next largest group of scientists and engineers are Asians. On the other hand, several racial and ethnic minority groups, in-cluding blacks, Hispanics, and American Indians or Alaska Natives, have low levels of participation in S&E fields both compared with other groups and compared with their propor-tion in the population (table 3-22).
Race and Ethnicity Trends in S&E Occupations In 2010, among the 5.4 million workers employed in
S&E occupations, 70% were white, which is similar to the proportion (68%) in the U.S. population age 21 and older (table 3-22). However, S&E participation by whites varied across the broad S&E occupational categories, from 65% of computer and mathematical scientists to 81% of social sci-entists (appendix table 3-16). The concentration of whites in some occupations was more pronounced: they account-ed for approximately 90% of workers among forestry and conservation scientists, geologists and earth scientists, and political scientists.
Asians, with nearly a million workers in S&E occupations, accounted for 19% of S&E employment. Among the over-all population age 21 and older, their proportion was much smaller (5%). Asians had a large presence in computer and engineering fields, constituting 33% of computer software engineers, 30% of software developers, 40% of computer hardware engineers, 27% of bioengineers or biomedical en-gineers, and 35% of postsecondary teachers in engineering (appendix table 3-16). On the other hand, the proportion of Asians in social sciences occupations was much lower both
Figure 3-31Employed women with highest degree in S&E, by degree level: 1993–2010Percent
NOTE: National estimates were not available from the Scientists and Engineers Statistical Data System (SESTAT) in 2001.
SOURCE: National Science Foundation, National Center for Science and Engineering Statistics, SESTAT (1993–2010), http://sestat.nsf.gov.
Science and Engineering Indicators 2014
1993 1995 1997 1999 2003 2006 2008 20100
5
10
15
20
25
30
35
40
45
Bachelor’s
Master’s
Doctorate

3-46 ♦ Chapter 3. Science and Engineering Labor Force
compared with their participation in other S&E fields and compared with whites. For example, Asians accounted for just 6% of workers in social sciences occupations.
The social sciences are the one S&E occupational cat-egory in which the proportions of blacks (5%) and Hispanics (6%) are similar to that of Asians (6%) (appendix table 3-16). As a result, underrepresented racial and ethnic mi-norities (blacks, Hispanics, and American Indians or Alaska Natives) collectively outnumber Asians among social scien-tists. In the other broad S&E occupational categories, Asians represent a larger segment than all underrepresented racial and ethnic minorities combined.
In general, the proportions of Hispanics across the broad S&E occupational categories were roughly similar (between
5% and 6%), whereas blacks had higher rates of participa-tion among computer and mathematical scientists (6%) relative to life scientists (3%), physical scientists (3%), and engineers (4%) (appendix table 3-16). Hispanics had a particularly large presence among sociologists (13%); psychologists (7%); aeronautical, aerospace, and astronau-tical engineers (9%); and civil engineers (8%). Blacks had relatively high participation rates among computer support specialists (16%), information security analysts (14%), and sociologists (13%).
Over the past two decades, the U.S. workforce in S&E occupations has been becoming more diverse with increas-ing proportions of Asians, blacks, and Hispanics and a de-creasing proportion of whites (table 3-23). In 1993, 84% of
Among college-educated individuals, a significantly higher proportion of men than women are employed in S&E occupations. For example, among S&E highest degree holders working full time, 26% of women, com-pared to 43% of men, hold positions with formal S&E jobs. This gender gap in S&E employment is found in all racial and ethnic groups. For example, among S&E highest degree holders working full time, S&E jobs are held by 43% of Asian women compared to 58% of Asian men, 22% of black women compared to 32% of black men, 19% of Hispanic women compared to 37% of Hispanic men, and 24% of white women compared to 41% of white men. The participation gap exists de-spite the trend that increasing proportions of women in all racial and ethnic groups are graduating from college. In most racial and ethnic groups, for example, a higher percentage of women than men have college degrees.
Field of degree, level of highest degree, employ-ment sector, and other characteristics that are typically believed to be associated with occupational fields vary between men and women. As a result, it can be mislead-ing to directly compare S&E employment rates by sex. Compared with men, women tend to have many charac-teristics—such as degrees in the life and social sciences, highest degrees at the bachelor’s level, and employment in 2-year academic institutions and in the non-profit sec-tor—that are associated with working outside S&E oc-cupations. Statistical models can estimate the size of the male-female participation gap in S&E occupations when various occupation-related factors are taken into account. However, estimates of these differences vary somewhat depending on the assumptions that underlie the statistical model used.
After accounting for differences between men and women in field of degree, level of highest degree, and employment sector, the participation gap in S&E occu-pations declines significantly (from 17 to 6 percentage
points) but does not attenuate completely (figure 3-C). Adding measures of personal and family characteristics that may affect S&E participation to academic and em-ployment information further reduces the estimated par-ticipation gap marginally (from 6 to 5 percentage points). This suggests that although measurable differences be-tween men and women explain a significant portion of the male-female participation gap in S&E occupations, they do not entirely explain the differing propensity of men and women to obtain S&E employment. As such, boosting college attendance alone is unlikely to equalize male-female participation in S&E employment as long as men and women study different fields and attain degrees at different levels.
S&E Credentials and the Male-Female Gap in S&E Employment
Figure 3-CEstimated differences in the proportions of women and of men with S&E highest degree employed in S&E occupations, controlling for selected characteristics: 2010
NOTE: Coef�cients are estimated in a probit regression model using a binary (0–1) variable indicating employment in S&E occupations as the dependent variable.
SOURCE: National Science Foundation, National Center for Science and Engineering Statistics, SESTAT (2010), http://sestat.nsf.gov.
Science and Engineering Indicators 2014
Total difference
Controlling foracademic training and
employment sector
Plus demographics andother characteristics
50 10
Negative differential (percentage point)
15 20
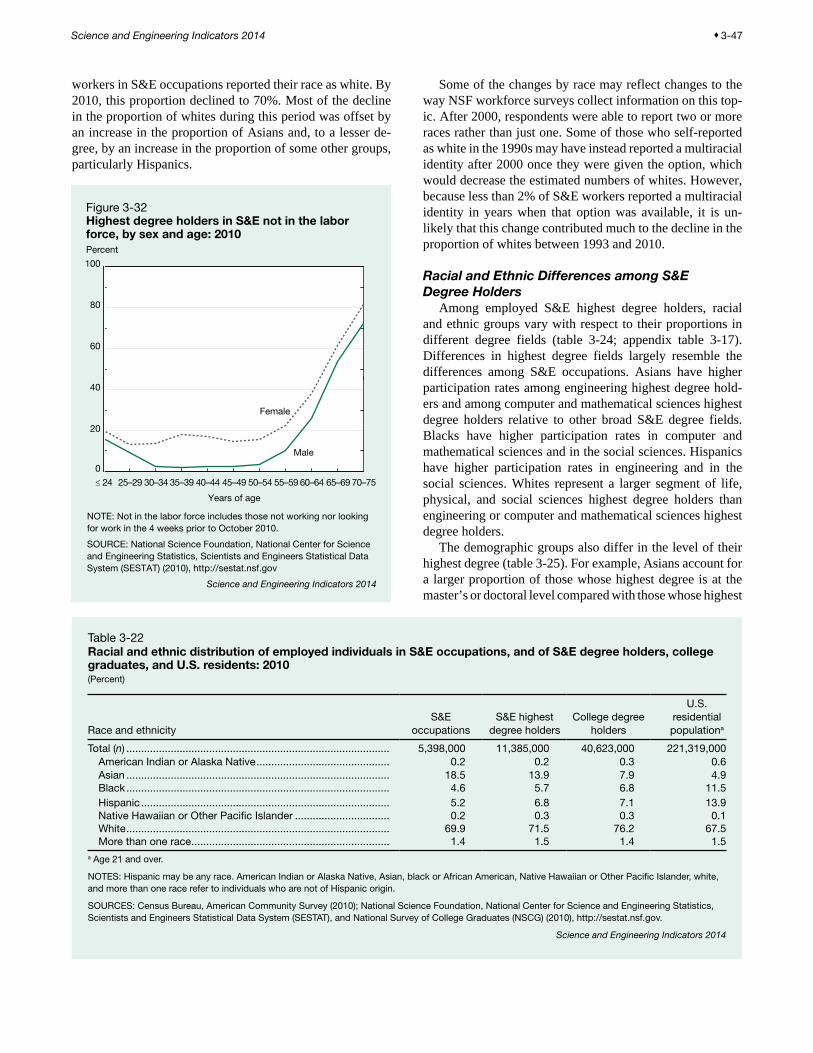
Science and Engineering Indicators 2014 ♦ 3-47
workers in S&E occupations reported their race as white. By 2010, this proportion declined to 70%. Most of the decline in the proportion of whites during this period was offset by an increase in the proportion of Asians and, to a lesser de-gree, by an increase in the proportion of some other groups, particularly Hispanics.
Some of the changes by race may reflect changes to the way NSF workforce surveys collect information on this top-ic. After 2000, respondents were able to report two or more races rather than just one. Some of those who self-reported as white in the 1990s may have instead reported a multiracial identity after 2000 once they were given the option, which would decrease the estimated numbers of whites. However, because less than 2% of S&E workers reported a multiracial identity in years when that option was available, it is un-likely that this change contributed much to the decline in the proportion of whites between 1993 and 2010.
Racial and Ethnic Differences among S&E Degree Holders
Among employed S&E highest degree holders, racial and ethnic groups vary with respect to their proportions in different degree fields (table 3-24; appendix table 3-17). Differences in highest degree fields largely resemble the differences among S&E occupations. Asians have higher participation rates among engineering highest degree hold-ers and among computer and mathematical sciences highest degree holders relative to other broad S&E degree fields. Blacks have higher participation rates in computer and mathematical sciences and in the social sciences. Hispanics have higher participation rates in engineering and in the social sciences. Whites represent a larger segment of life, physical, and social sciences highest degree holders than engineering or computer and mathematical sciences highest degree holders.
The demographic groups also differ in the level of their highest degree (table 3-25). For example, Asians account for a larger proportion of those whose highest degree is at the master’s or doctoral level compared with those whose highest
Figure 3-32Highest degree holders in S&E not in the labor force, by sex and age: 2010Percent
NOTE: Not in the labor force includes those not working nor looking for work in the 4 weeks prior to October 2010.
SOURCE: National Science Foundation, National Center for Science and Engineering Statistics, Scientists and Engineers Statistical Data System (SESTAT) (2010), http://sestat.nsf.gov
Science and Engineering Indicators 2014
≤ 24 25–29 30–34 35–39 40–44 45–49
Years of age
50–54 55–59 60–64 65–69 70–75
0
20
40
60
80
100
Female
Male
Table 3-22Racial and ethnic distribution of employed individuals in S&E occupations, and of S&E degree holders, college graduates, and U.S. residents: 2010(Percent)
Race and ethnicityS&E
occupationsS&E highest
degree holdersCollege degree
holders
U.S. residential populationa
Total (n) ......................................................................................... 5,398,000 11,385,000 40,623,000 221,319,000American Indian or Alaska Native ............................................. 0.2 0.2 0.3 0.6Asian ......................................................................................... 18.5 13.9 7.9 4.9Black ......................................................................................... 4.6 5.7 6.8 11.5Hispanic .................................................................................... 5.2 6.8 7.1 13.9Native Hawaiian or Other Pacific Islander ................................ 0.2 0.3 0.3 0.1White ......................................................................................... 69.9 71.5 76.2 67.5More than one race ................................................................... 1.4 1.5 1.4 1.5
a Age 21 and over.
NOTES: Hispanic may be any race. American Indian or Alaska Native, Asian, black or African American, Native Hawaiian or Other Pacific Islander, white, and more than one race refer to individuals who are not of Hispanic origin.
SOURCES: Census Bureau, American Community Survey (2010); National Science Foundation, National Center for Science and Engineering Statistics, Scientists and Engineers Statistical Data System (SESTAT), and National Survey of College Graduates (NSCG) (2010), http://sestat.nsf.gov.
Science and Engineering Indicators 2014

3-48 ♦ Chapter 3. Science and Engineering Labor Force
Table 3-23Distribution of workers in S&E occupations, by race and ethnicity: 1993–2010(Percent)
Race and ethnicity 1993 1995 1997 1999 2003 2006 2008 2010
American Indian or Alaska Native ........................................... 0.2 0.3 0.3 0.3 0.3 0.4 0.3 0.2Asian ........................................................................................ 9.1 9.6 10.4 11.0 14.2 16.1 16.9 18.5Black ........................................................................................ 3.6 3.4 3.4 3.4 4.3 3.9 3.9 4.6Hispanic ................................................................................... 2.9 2.8 3.1 3.4 4.4 4.6 4.9 5.2Native Hawaiian or Other Pacific Islander ............................... NA NA NA NA 0.3 0.5 0.4 0.2White ....................................................................................... 84.1 83.9 82.9 81.8 75.2 73.2 71.8 69.9More than one race ................................................................. NA NA NA NA 1.4 1.4 1.7 1.4
NA = not available.
NOTES: Before 2003, respondents could not classify themselves in more than one racial and ethnic category. Before 2003, Asian included Native Hawaiian and Other Pacific Islander. Hispanic may be any race. American Indian or Alaska Native, Asian, black or African American, Native Hawaiian or Other Pacific Islander, white, and more than one race refer to individuals who are not of Hispanic origin.
SOURCE: National Science Foundation, National Center for Science and Engineering Statistics, Scientists and Engineers Statistical Data System (SESTAT) (1993–2010), http://sestat.nsf.gov.
Science and Engineering Indicators 2014
Table 3-24Racial and ethnic distribution of employed individuals with S&E highest degree, by field of highest degree: 2010(Percent)
Race and ethnicityAll S&E fields
Biological, agricultural, and environmental life sciences
Computer and mathematical
sciencesPhysical sciences
Social sciences Engineering
Employed with highest degree in S&E (n) ...... 11,385,000 1,764,000 1,886,000 693,000 4,363,000 2,679,000 American Indian or Alaska Native ............... 0.2 0.3 0.2 0.3 0.3 0.2Asian ........................................................... 13.9 12.0 22.7 15.2 6.5 20.6Black ........................................................... 5.7 3.6 7.7 3.6 7.6 3.2Hispanic ...................................................... 6.8 6.2 5.5 4.5 7.7 7.4Native Hawaiian or Other Pacific Islander ... 0.3 S 0.2 0.1 0.3 0.4White ........................................................... 71.5 75.7 62.6 75.3 75.8 66.9More than one race ..................................... 1.5 1.4 1.1 1.2 1.9 1.3
S = suppressed for reasons of confidentiality and/or reliability.
NOTES: Hispanic may be any race. American Indian or Alaska Native, Asian, black or African American, Native Hawaiian or Other Pacific Islander, white, and more than one race refer to individuals who are not of Hispanic origin.
SOURCE: National Science Foundation, National Center for Science and Engineering Statistics, Scientists and Engineers Statistical Data System (SESTAT) (2010), http://sestat.nsf.gov.
Science and Engineering Indicators 2014
Table 3-25Racial and ethnic distribution of employed individuals with S&E highest degree, by level of highest degree: 2010(Percent)
Race and ethnicity Bachelor’s Master’s Doctorate
Employed with highest degree in S&E (n) ................................................... 8,160,000 2,356,000 847,000American Indian or Alaska Native ............................................................ 0.3 0.2 0.1Asian ........................................................................................................ 11.0 20.6 23.0Black ........................................................................................................ 6.1 5.6 2.8Hispanic ................................................................................................... 7.5 5.7 3.8Native Hawaiian or Other Pacific Islander ................................................ 0.4 0.2 0.1White ........................................................................................................ 73.1 66.3 69.1More than one race .................................................................................. 1.6 1.4 1.1
NOTES: Hispanic may be any race. American Indian or Alaska Native, Asian, black or African American, Native Hawaiian or Other Pacific Islander, white, and more than one race refer to individuals who are not of Hispanic origin.
SOURCE: National Science Foundation, National Center for Science and Engineering Statistics, Scientists and Engineers Statistical Data System (SESTAT) (2010), http://sestat.nsf.gov.
Science and Engineering Indicators 2014

Science and Engineering Indicators 2014 ♦ 3-49
degree is at the bachelor’s level. Conversely, non-Asians represent a larger proportion of those whose highest degree is at the bachelor’s and master’s degree level compared with those whose highest degree is at the doctoral level.
Asian S&E highest degree holders are more likely than those in other racial and ethnic groups to work in S&E oc-cupations and to work in the area in which they earned their degree (appendix table 3-15). Among blacks, Hispanics, and whites, about one-quarter or less of S&E highest degree holders work in their same broad field of highest degree. By comparison, nearly 40% of Asians work in the same broad field in which they received their highest degree.
Salary Differences for Women and Racial and Ethnic Minorities
Women and racial and ethnic minority groups general-ly receive less pay than their male and white counterparts (table 3-26). In 2010, among full-time workers with a high-est degree in an S&E field, the median salary for women ($53,000) was about one-third lower than that for men ($80,000). Among S&E highest degree holders who work full-time in S&E occupations, the difference in median salary between men ($85,000) and women ($69,000) was smaller (19% less) (appendix table 3-18).
Salary differences among racial and ethnic groups were somewhat smaller than salary differences between men and women (table 3-26; appendix table 3-19). Among S&E highest degree holders working full time, American Indians or Alaska Natives earned 18% less than whites, blacks earned 22% less than whites, and Hispanics earned 17% less than whites. Relative to Asians, American Indians or Alaska Natives earned 21% less, blacks earned 25% less, and Hispanics earned 20% less. These salary differences were generally more modest among those who worked in S&E occupations (appendix table 3-19).
Overall, salary differences between men and women and among racial and ethnic groups remained largely unchanged between 1995 and 2010 (table 3-26).
Differences in average age, work experience, academic training, sector and occupation of employment, and other characteristics can make direct comparison of salary statis-tics misleading. Statistical models can estimate the size of the salary difference between men and women, or the sal-ary difference between racial and ethnic groups, when vari-ous salary-related factors are taken into account. Estimates of these differences vary somewhat depending on the assump-tions that underlie the statistical model used. The remainder of this section presents estimated salary differences between men and women among individuals who are otherwise simi-lar in age, work experience, field of highest degree, type of academic institution awarding highest degree (Carnegie clas-sification and public/private status), occupational field and sector, and other relevant characteristics that are likely to in-fluence salaries. Data bearing on salary differences between minorities (American Indians or Alaska Natives, blacks, Hispanics, Native Hawaiians or Other Pacific Islanders, and those reporting more than one race) relative to Asians and whites are also included.
Without accounting for any factors except level of degree, women working full time whose highest degree is at the bach-elor’s level in an S&E field earned 31% less than men (fig-ure 3-33).22 The salary difference is smaller, but nonetheless substantial, at both the master’s level (29%) and the doctoral level (22%). The salary differences for non-Asian minorities relative to whites and Asians are narrower (figure 3-34). On average, minority salary levels are 22% lower than those of whites and Asians at the bachelor’s level, 14% lower at the master’s level, and 16% lower at the doctoral level.
Effects of Education, Employment, and Experience on Salary Differences
Salaries differ across degree field, occupational field and sector, and experience. For example, median salaries in 2010 were generally higher among individuals with highest de-grees in engineering ($86,000), physical sciences ($68,000), or computer and mathematical sciences ($79,000) compared with those with highest degrees in life sciences ($50,000) or social sciences ($50,000). Degree areas with lower salaries generally have higher concentrations of women and of racial and ethnic minorities. Disproportionately larger proportions
Table 3-26Median annual salary among S&E highest degree holders working full time, by sex, race, and ethnicity: 1995, 2003, 2010(Dollars)
Characteristic 1995 2003 2010
All ............................................ 44,000 60,000 70,000Sex
Female ............................. 34,000 45,000 53,000Male ................................. 49,000 68,000 80,000
Race and ethnicityAmerican Indian or
Alaska Native ............... S 48,000 59,000Asian ............................... 45,000 64,000 75,000Black ............................... 35,000 48,000 56,000Hispanic .......................... 38,000 50,000 60,000Native Hawaiian or
Other Pacific Islander ... NA 56,000 56,000White ............................... 45,000 60,000 72,000More than one race ......... NA 50,000 60,000
NA = not available; S = suppressed for reasons of confidentiality and/or reliability.
NOTES: Salaries are rounded to the nearest $1,000. Data for 1995 include some individuals with multiple races in each category. Hispanic may be any race. American Indian or Alaska Native, Asian, black or African American, Native Hawaiian or Other Pacific Islander, white, and more than one race refer to individuals who are not of Hispanic origin.
SOURCE: National Science Foundation, National Center for Science and Engineering Statistics, Scientists and Engineers Statistical Data System (SESTAT) (1995, 2003, 2010), http://sestat.nsf.gov.
Science and Engineering Indicators 2014

3-50 ♦ Chapter 3. Science and Engineering Labor Force
of degree holders in life sciences, and particularly in the so-cial sciences, relative to other S&E degree fields, work in occupations not categorized as S&E, where salaries are gen-erally lower than in S&E occupations (appendix table 3-18). As a result, differences in degree and occupational fields are likely to explain much of the salary differences by sex and by race and ethnicity.
Salaries also differ across employment sector. Academic and non-profit employers typically pay less for similar skills than employers in the private sector, and government compensation falls somewhere between these two groups. These differences are salient for understanding salary varia-tions by sex and by race and ethnicity because men, Asians, and whites are more highly concentrated in the private for-profit sector.
Salaries also vary by indicators of experience, such as age or years since completing one’s degree. Because of the rapid increase in female participation in S&E fields in recent years, female S&E highest degree holders employed full time are younger than their male counterparts (median age
40 years for women versus 44 years for men), which trans-lates to fewer years of labor market experience for women relative to men. White S&E highest degree holders with sim-ilar characteristics are also older (44 years) compared with Asians (39 years) and most other racial and ethnic minorities (Hispanics: 39 years, blacks: 42 years, American Indians or Alaska Natives: 43 years, and Native Hawaiians or Other Pacific Islanders: 33 years).
After controlling for differences in field of highest de-gree, degree-granting institution, field of occupation, em-ployment sector, and experience,23 the estimated salary difference between men and women narrows by more than half (figure 3-33). However, among men and women in sim-ilar jobs, and with similar highest degree fields and levels of experience, women still earn 12% less than men among indi-viduals whose highest degree is at the bachelor’s level, 10% less than men among individuals whose highest degree is at
Figure 3-33Estimated salary differences between women and men with highest degree in S&E employed full time, controlling for selected characteristics, by degree level: 2010
Negative differential (percent)
NOTES: Salary differences represent the estimated percentage difference in women’s average full-time salary relative to men’s average full-time salary. Coef�cients are estimated in an ordinary least squares regression model using the natural log of full-time annual salary as dependent variable and then transformed into percentage difference.
SOURCE: National Science Foundation, National Center for Science and Engineering Statistics, SESTAT (2010), http://sestat.nsf.gov.
Science and Engineering Indicators 2014
Plus demographicsand other
characteristics
Controlling foreducation and
employment
Total differencein full-time salary
0 5 10 15 20 25 30 35
Bachelor’s
Doctorate
Master’s
Figure 3-34Estimated salary differences between minorities and whites and Asians with highest degree in S&E employed full time, controlling for selected characteristics, by degree level: 2010
Negative differential (percent)
NOTES: Salary differences represent the estimated percentage difference in the average full-time salary of minorities relative to the average full-time salary of whites and Asians. Coef�cients are estimated in an ordinary least squares regression model using the natural log of full-time annual salary as dependent variable and then transformed into percentage difference. Minorities include American Indian or Alaska Natives, blacks, Hispanics (of any race), Native Hawaiian or Other Paci�c Islanders, and those reporting more than one race.
SOURCE: National Science Foundation, National Center for Science and Engineering Statistics, SESTAT (2010), http://sestat.nsf.gov.
Science and Engineering Indicators 2014
0 5 10 15 20 25
Bachelor’s
Doctorate
Master’s
Plus demographicsand other
characteristics
Controlling foreducation and
employment
Total differencein full-time salary

Science and Engineering Indicators 2014 ♦ 3-51
the master’s level, and 9% less than men among individuals whose highest degree is at the doctoral level.
Compared with whites and Asians, other racial and ethnic groups with their highest degree at the bachelor’s level also earn less (15%) after controlling for education, occupation, and experience (figure 3-34). Although the initial salary gap for racial and ethnic minorities is smaller than for women, less of this initial salary gap is explained by differences in education, occupation, and experience. Among those whose highest degree is at the bachelor’s level, after controlling for education, occupation, and experience, more than half of the initial salary gap among racial and ethnic minorities persists, compared to less than half of the initial salary gap persisting among women. In comparison, among those with a master’s or doctoral degree, the salary gap across racial and ethnic groups is significantly attenuated: after controlling for these factors, the salary gap is only 5% for those at the master’s degree level and only 4% for those at the doctorate level.
Effects of Demographic and Other Factors on Salary Differences
Salaries vary by factors beyond education, occupation, and experience. For example, marital status, the presence of children, parental education, and other personal characteris-tics are often associated with salary differences. These dif-ferences reflect a wide range of issues, both voluntary and involuntary, including, but not limited to, factors affecting individual career- and education-related decisions, differ-ences in how individuals balance family obligations and ca-reer aspirations, productivity and human capital differences among workers that surveys do not measure, and possible ef-fects of employer prejudice or discrimination. Salaries also differ across regions, partly reflecting differences in the cost of living across geographic areas.
However, adding measures of personal and family char-acteristics that may affect compensation24 to education, oc-cupation, and experience results in only marginal changes in the estimated salary differences between men and women compared with estimates that account for education, occupa-tion, and experience alone. Women who are similar to men along all of these dimensions receive salaries that are 11% (among bachelor’s degree holders) to 8% (among doctoral degree holders) less than their male counterparts (figure 3-33). The salary difference among racial and ethnic groups largely disappears among advanced degree holders, but a significant amount of the difference remains among bach-elor’s degree holders (figure 3-34).
The analysis of salary differences suggests that attributes related to human capital (fields of education and occupation, employment sector, and experience) are much more impor-tant than socioeconomic and demographic attributes in ex-plaining the salary differences observed among S&E highest degree holders by sex and across racial and ethnic groups. Nonetheless, the analysis also shows that measurable differ-ences in human capital do not entirely explain income differ-ences between demographic groups.25
Salary Differences among Recent GraduatesSalary differences among recent S&E graduates warrant
particular attention. Employment metrics of recent graduates are important indicators of current conditions in the labor market, particularly for young people considering S&E ca-reers. Salary differences among recent S&E graduates, par-ticularly across racial and ethnic groups, are substantially narrower than in the population of S&E degree holders as a whole. This suggests that recent cohorts of S&E highest degree holders are much closer to earnings parity than their older counterparts. For example, in 2010, among recent graduates who attained their highest degree in or after 2005, minorities working full time earned 7% (among those whose S&E highest degree was at the bachelor’s or doctorate level) to 8% (among those whose S&E highest degree was at the master’s level) less than Asians and whites. These salary dif-ferences are substantially higher, ranging from 14% to 22%, among all S&E highest degree holders (regardless of gradu-ation year) (figure 3-34). After accounting for differences in education, occupation, and experience, the salary differ-ences for recently graduated minorities relative to whites and Asians are almost attenuated among bachelor’s degree holders (a 3% salary gap remains) and completely attenuated among advanced degree holders. In contrast, when all S&E highest degree holders (regardless of graduation cohort) are included in the analysis, a significant amount of the salary gap remains unexplained by these human capital attributes, particularly among bachelor’s degree holders (figure 3-34).
After controlling for differences in education, employ-ment, demographic, and socioeconomic attributes, the gender salary gap among recent graduates is not com-pletely attenuated, but it is lower. After controlling for these factors, women earn about 5% to 9% less than men among recent graduates, compared with about 8% to 11% less among all S&E highest degree holders (regardless of graduation cohort).
Immigration and the S&E WorkforceThe industrialized nations of the world have long benefit-
ted from the inflow of foreign-born scientists and engineers and the S&E skills and knowledge they bring. S&E skills are more easily transferrable across international borders than many other skills, and many countries have made it a nation-al priority to attract international talent in S&E (NSB 2008). A large proportion of workers employed in S&E fields in the United States are foreign born. This section presents data on foreign-born scientists and engineers in the U.S. economy, including recent indicators of migration to the United States and the rate at which foreign-born recipients of U.S. doc-toral degrees remain in the United States after earning their degree (stay rates). Data from various sources, including the Census Bureau, the U.S. Citizenship and Immigration Services (USCIS), and NSF (SESTAT and SED) are dis-cussed to study the immigrant S&E workforce in the United

3-52 ♦ Chapter 3. Science and Engineering Labor Force
States. This section ends with a discussion of the global mi-gration patterns of high-skill workers.
“Foreign-born” is a broad category, ranging from long-term U.S. residents with strong roots in the United States to recent immigrants who compete in global job markets and whose main social, educational, and economic ties are in their countries of origin. When interpreting data on for-eign-born workers, the range of individuals in this category should be kept in mind. Both the number and proportion of foreign-born workers employed in S&E occupations in the United States have risen over time (table 3-27). Nationally representative survey data, such as SESTAT and ACS, al-though collected in different ways, yield broadly consistent estimates of the number of foreign-born scientists and engi-neers in the United States. In 2011, foreign-born individuals accounted for 21% of workers employed in nonacademic S&E occupations in the United States, which is higher than their representation in the overall population (13%). Among college-educated workers in nonacademic S&E occupa-tions, the proportion of foreign-born individuals is higher: 26%, which is up from 22% in 2000 (table 3-27).
Characteristics of Foreign-Born Scientists and Engineers
Compared to the entire college-educated workforce, col-lege graduates employed in S&E occupations are dispro-portionately foreign born. Among SESTAT respondents employed in S&E occupations in 2010, 27% were foreign born. Among all college-educated workers (regardless of occupational category) in 2010, 15% were foreign born. In general, foreign-born workers employed in S&E occupa-tions tend to have higher levels of education than their U.S. native-born counterparts. Among individuals employed in S&E occupations, 19% of foreign-born scientists and en-gineers have a doctorate, compared to 10% of U.S. native-born scientists and engineers in these occupations. In most
S&E occupations, the higher the degree level, the greater the proportion of the workforce who are foreign born (figure 3-35). This relationship is weakest among social scientists and strongest among computer and mathematical scientists and engineers. In 2010, at the bachelor’s degree level, the
Figure 3-35Foreign-born scientists and engineers employed in S&E occupations, by highest degree level and broad occupational category: 2010
Percent
SOURCE: National Science Foundation, National Center for Science and Engineering Statistics, Scientists and Engineers Statistical Data System (SESTAT) (2010), http://sestat.nsf.gov.
Science and Engineering Indicators 2014
0 10 20 30 40 50 60
Computer andmathematical
scientists
Biological,agricultural,
and environmentallife scientists
Physical andrelated scientists
Social andrelated scientists
Engineers
Bachelor’s
Doctorate
Master’s
Table 3-27Foreign-born workers in S&E occupations, by education level: Selected years, 2000–11(Percent)
EducationDecennial
census SESTAT ACS SESTAT ACS SESTAT ACS ACS SESTAT ACS ACS
All college educateda ..... 22.4 22.6 24.2 23.8 25.3 24.6 24.9 25.2 27.4 26.5 26.2Bachelor’s .................. 16.5 16.4 17.7 17.3 18.1 17.2 18.4 18.3 20.1 19.0 19.0Master’s ..................... 29.0 29.4 32.0 31.7 33.5 32.7 32.7 33.4 34.9 35.0 34.3Doctorate ................... 37.6 36.4 37.8 36.6 41.8 37.8 40.9 41.6 41.5 44.2 43.2
ACS = American Community Survey; SESTAT = Scientists and Engineers Statistical Data System.
a Includes professional degrees not broken out separately.
NOTES: The data from the ACS and the Decennial Census include all S&E occupations except postsecondary teachers because these occupations are not separately identifiable in the 2000 Census or ACS data files. SESTAT 2006 and 2008 data do not include foreign workers who arrived in the United States after the 2000 Decennial Census and also did not earn an S&E degree in the United States.
SOURCES: National Science Foundation, National Center for Science and Engineering Statistics, SESTAT (2003–10), http://sestat.nsf.gov; Census Bureau, 2000 Decennial Census Public Use Microdata Sample (PUMS), and ACS (2003, 2006, 2008, 2009, 2010, 2011).
Science and Engineering Indicators 2014
200620032000
2008 20102009 2011
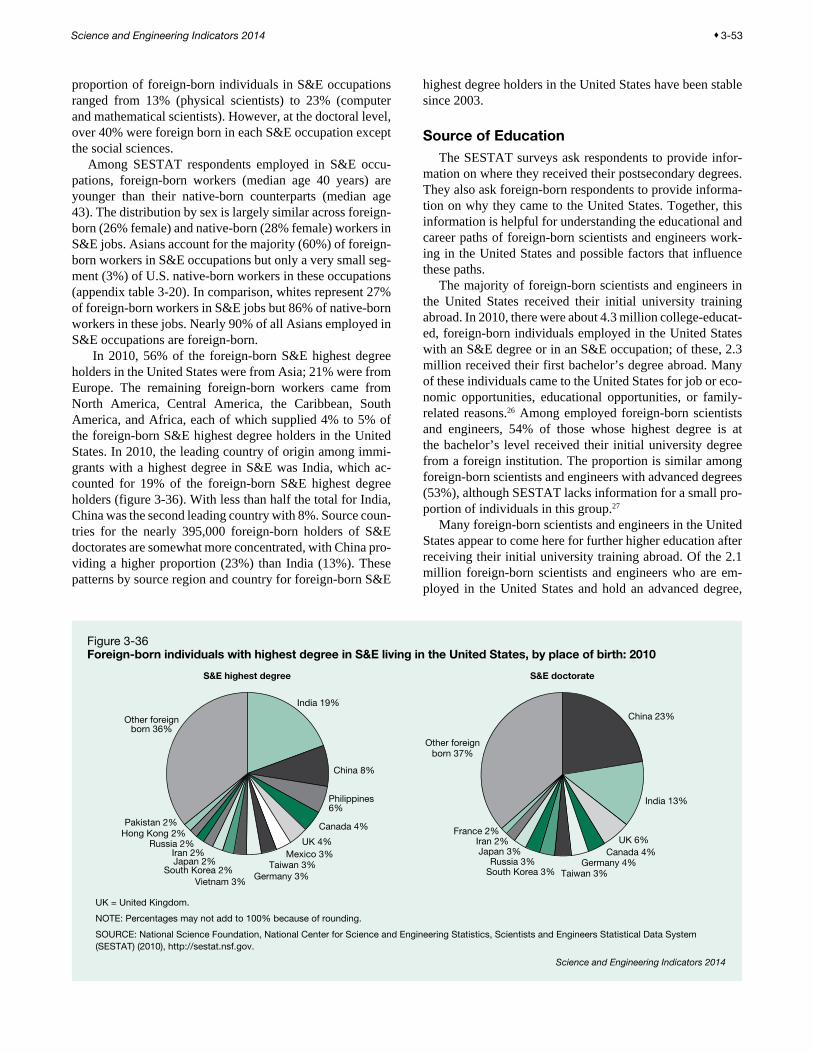
Science and Engineering Indicators 2014 ♦ 3-53
proportion of foreign-born individuals in S&E occupations ranged from 13% (physical scientists) to 23% (computer and mathematical scientists). However, at the doctoral level, over 40% were foreign born in each S&E occupation except the social sciences.
Among SESTAT respondents employed in S&E occu-pations, foreign-born workers (median age 40 years) are younger than their native-born counterparts (median age 43). The distribution by sex is largely similar across foreign-born (26% female) and native-born (28% female) workers in S&E jobs. Asians account for the majority (60%) of foreign-born workers in S&E occupations but only a very small seg-ment (3%) of U.S. native-born workers in these occupations (appendix table 3-20). In comparison, whites represent 27% of foreign-born workers in S&E jobs but 86% of native-born workers in these jobs. Nearly 90% of all Asians employed in S&E occupations are foreign-born.
In 2010, 56% of the foreign-born S&E highest degree holders in the United States were from Asia; 21% were from Europe. The remaining foreign-born workers came from North America, Central America, the Caribbean, South America, and Africa, each of which supplied 4% to 5% of the foreign-born S&E highest degree holders in the United States. In 2010, the leading country of origin among immi-grants with a highest degree in S&E was India, which ac-counted for 19% of the foreign-born S&E highest degree holders (figure 3-36). With less than half the total for India, China was the second leading country with 8%. Source coun-tries for the nearly 395,000 foreign-born holders of S&E doctorates are somewhat more concentrated, with China pro-viding a higher proportion (23%) than India (13%). These patterns by source region and country for foreign-born S&E
highest degree holders in the United States have been stable since 2003.
Source of Education The SESTAT surveys ask respondents to provide infor-
mation on where they received their postsecondary degrees. They also ask foreign-born respondents to provide informa-tion on why they came to the United States. Together, this information is helpful for understanding the educational and career paths of foreign-born scientists and engineers work-ing in the United States and possible factors that influence these paths.
The majority of foreign-born scientists and engineers in the United States received their initial university training abroad. In 2010, there were about 4.3 million college-educat-ed, foreign-born individuals employed in the United States with an S&E degree or in an S&E occupation; of these, 2.3 million received their first bachelor’s degree abroad. Many of these individuals came to the United States for job or eco-nomic opportunities, educational opportunities, or family-related reasons.26 Among employed foreign-born scientists and engineers, 54% of those whose highest degree is at the bachelor’s level received their initial university degree from a foreign institution. The proportion is similar among foreign-born scientists and engineers with advanced degrees (53%), although SESTAT lacks information for a small pro-portion of individuals in this group.27
Many foreign-born scientists and engineers in the United States appear to come here for further higher education after receiving their initial university training abroad. Of the 2.1 million foreign-born scientists and engineers who are em-ployed in the United States and hold an advanced degree,
Figure 3-36Foreign-born individuals with highest degree in S&E living in the United States, by place of birth: 2010
UK = United Kingdom.
NOTE: Percentages may not add to 100% because of rounding.
SOURCE: National Science Foundation, National Center for Science and Engineering Statistics, Scientists and Engineers Statistical Data System (SESTAT) (2010), http://sestat.nsf.gov.
Science and Engineering Indicators 2014
India 19%
China 8%
Philippines 6%
Canada 4%UK 6%
Taiwan 3%Germany 3%
Vietnam 3%
Mexico 3%
Other foreignborn 36%
China 23%
India 13%
Russia 3%Canada 4%
Taiwan 3% Germany 4%
South Korea 3%
Iran 2% Japan 3%
S&E highest degree S&E doctorate
Other foreignborn 37%
South Korea 2% Japan 2% Iran 2%
Russia 2% Hong Kong 2% Pakistan 2%
France 2% UK 4%

3-54 ♦ Chapter 3. Science and Engineering Labor Force
two-thirds completed their highest degree in the United States, divided almost evenly between those who received their first bachelor’s degree abroad (671,000) and those who received their first bachelor’s degree in the United States (647,000). Almost one-fourth of foreign-born scientists and engineers with an advanced degree (472,000) received both their initial university degree and advanced (highest) degree abroad. In contrast, only a small number of foreign-born sci-entists and engineers (35,000) received their first bachelor’s degree in the United States and their highest degree abroad.
The information provided by foreign-born scientists and engineers on factors that influenced their migration to the United States reinforces the patterns seen in the migration data. Among those who obtained their initial university de-gree abroad but their highest degree in the United States, the most commonly cited reason for coming to the United States was educational opportunities (27%). Family-related rea-sons (9%) and job/economic opportunities (7%) were cited by much smaller proportions. In comparison, among those who received both degrees abroad, the most commonly cited reasons for coming to the United States were job/economic opportunities (29%) and family-related reasons (23%), fol-lowed by scientific or professional infrastructure (11%), and educational opportunities (10%).
Among the foreign-born doctorate holders employed in the United States, 58% received this degree from a U.S. institution and 83% (of those for whom SESTAT contains information on first bachelor’s degree) received their initial university degree from a foreign institution.
New Foreign-Born Workers During the 2007–09 economic downturn, two indica-
tors—the number of temporary work visas issued by the U.S. government in visa classes for high-skill workers and the stay rates of foreign-born U.S. doctorate recipients—showed evidence that the volume of new foreign-born workers en-tering the U.S. S&E workforce might be declining. Recent data, however, indicate that this period of decline may be temporary. In addition to these two indicators, this section discusses characteristics of workers with temporary work visas and country profiles of new foreign-born workers.
Temporary VisasThe number of temporary work visas issued for high-skill
workers provides an indication of new immigrant workers entering the U.S. labor force.28 After several years of growth, the largest classes of these temporary visas declined during the recent economic downturn (figure 3-37). Data since the downturn, however, suggest that growth has resumed in re-cent years. Despite the increases in the issuance of temporary visas since fiscal year (FY) 2009, the numbers have not yet reached the recent highs seen in FY 2007, before the begin-ning of the economic downturn (figure 3-37). A decline in the issuance of these visas, particularly H-1B visas, also occurred around the more mild recession in 2001.
H-1B visas account for a significant proportion of for-eign-born high-skill workers employed by U.S. firms on temporary visas. This type of visa is issued to individuals who seek temporary entry into the United States in a spe-cialty occupation that requires professional skills. It is is-sued for up to 3 years with the possibility of an extension to 6 years. In 2012, the United States issued nearly 136,000 H-1B visas, up 23% from the recent low in 2009 (110,000) but still down from the recent peak of about 154,000 issued in 2007 (figure 3-37).
Issuance of visas in other temporary work categories that usually contain large numbers of high-skill workers also rose since 2009; however, the H-1B visa category has shown continued increase since 2009, unlike the J-1 and L-1 cat-egories (figure 3-37).
Characteristics of H-1B Visa RecipientsAlthough H-1B visas are not issued exclusively for scien-
tists and engineers, the majority of H-1B visa recipients work in S&E or S&E-related occupations (appendix table 3-21). However, precise counts of H-1B visas issued to individu-als in these occupations cannot be obtained because USCIS does not classify occupations with the same taxonomy used by NSF. In 2011, workers in computer-related occupations as classified by USCIS were the most common recipients of H-1B visas, accounting for almost half (48%) of new H-1B visas issued. The total number of newly initiated H-1B vi-sas for workers in computer-related fields increased signifi-cantly between 2010 and 2011, following a steep decline between 2008 and 2009 during the economic downturn. The
Figure 3-37Temporary work visas issued in categories with many high-skilled workers: FYs 1991–2012Thousands
NOTE: J-1 exchange visitor visa is used for many different skill levels.
SOURCE: U.S. Department of State, Nonimmigrant Visa Issuances by Visa Class and by Nationality and Nonimmigrant Visas by Individual Class of Admission, http://www.travel.state.gov/visa/ statistics/nivstats/nivstats_4582.html (accessed 12 April 2013).
Science and Engineering Indicators 2014
1991 1994 1996 1998 2000 2002 2004 2006 2008 2010 20120
50
100
150
200
250
300
350
400
J-1 (exchange visitors)
H1-B
L-1 (intracompany transferee)

Science and Engineering Indicators 2014 ♦ 3-55
proportion of H-1B recipients who worked in computer sci-ences was considerably lower in the earlier part of the 2000s. For example, in 2002, only 25% of H-1B visa recipients worked in computer-related fields (NSB 2012).
H-1B visa recipients tend to possess advanced degrees. In FY 2011, 55% of new H-1B visa recipients had an advanced degree, including 39% with master’s degrees, 5% with pro-fessional degrees, and 12% with doctorates (DHS USCIS 2012). The degree distribution differs by occupations. In FY 2009, for example, the vast majority of mathematical and physical scientists (83%) and life scientists (87%) with H-1B visas held advanced degrees; 44% of mathematical and physical scientists and 61% of life scientists with H-1B visas had doctorates (NSB 2012).
In 2011, 53% of new H-1B visa recipients were from India, and another 10% were from China (DHS USCIS 2012). H-1B visa recipients are relatively young. In 2011, 46% of new H-1B visa recipients were between the ages of 25 and 29, and another 25% were between the ages of 30 and 34 (DHS USCIS 2012).
Table 3-28 shows salaries paid to new recipients of H-1B visas by occupation group. These starting salaries, taken from final visa application forms sent to USCIS, are differ-ent from H-1B salaries that firms report on their applications to the Department of Labor, which are filed much earlier in the H-1B process. The relatively low median salaries
for workers in life sciences may reflect the common use of H-1B visas to hire individuals for relatively low-paying postdoc positions.
Short-Term Stay Rates for U.S. S&E Doctorate Recipients
Among doctorate recipients, the period immediately after earning their doctorate is a pivotal point that can substan-tially affect long-term career trajectories. During this period, foreign-born doctorate recipients who remain in the United States may set themselves on a path to long-term residency.
At the time they receive their doctorates, foreign-born students at U.S. universities report whether they intend to stay in the United States and whether they have a firm of-fer to work in the United States (either a postdoc or a job) the following year.29 These responses provide estimates of short-term stay rates.30
Most foreign-born noncitizen recipients of U.S. S&E doctorates plan to stay in the United States after gradua-tion. At the time of doctorate receipt, 75% of foreign-born recipients of U.S. S&E doctorates, including those on both temporary and permanent visas, plan to stay in the United States, and 48% have either accepted an offer of postdoc study or employment or are continuing employment in the United States (figure 3-38). The proportion of foreign-born S&E doctorate recipients planning to stay in the United States has risen over time. In 1991, 68% of foreign students who earned S&E doctorates at U.S. universities reported that they planned to stay in the United States after graduation, Table 3-28
Annual salaries for new H-1B visa recipients, by occupation: FY 2011(Dollars)
Occupation Median Mean
Administrative specializations ............ 55,000 67,000Architecture, engineering,
and surveying ................................. 72,000 79,000Art ....................................................... 45,000 54,000Computer-related occupations .......... 64,000 70,000Education ............................................ 46,000 56,000Entertainment and recreation ............. 35,000 43,000Law and jurisprudence ....................... 85,000 106,000Life sciences ....................................... 47,000 56,000Managers and officials nec ................ 81,000 103,000Mathematics and physical sciences ... 70,000 74,000Medicine and health ........................... 57,000 93,000Miscellaneous professional,
technical, and managerial ............... 70,000 82,000Museum, library, and archival
sciences .......................................... 48,000 58,000Religion and theology .......................... 36,000 41,000Social sciences .................................... 65,000 78,000Writing ................................................ 43,000 51,000
nec = not elsewhere classified.
SOURCE: Department of Homeland Security (DHS), U.S. Citizenship and Immigration Services; Characteristics of H-1B Specialty Occupation Workers, Fiscal Year 2011 Annual Report to Congress, http://www.uscis.gov/USCIS/Resources/Reports%20and%20Studies/H-1B/h1b-fy-11-characteristics.pdf, accessed 20 December 2012.
Science and Engineering Indicators 2014
Figure 3-38Plans of foreign recipients of U.S. S&E doctoral degrees at graduation to stay in the United States, by year of doctorate: 1991–2011Number
NOTE: Data include doctorate recipients on temporary and permanent visas.
SOURCE: National Science Foundation, National Center for Science and Engineering Statistics, special tabulations (2013) of the Survey of Earned Doctorates (SED) (1991–2011).
Science and Engineering Indicators 2014
1991 1993 1995 1997 1999 2001 2003 2005 2007 2009 20110
2,000
4,000
6,000
8,000
10,000
12,000
14,000
16,000
Plans to stay
Firm plans to stay
Recipients

3-56 ♦ Chapter 3. Science and Engineering Labor Force
and 37% said that they had firm offers for postdoc study or employment. Throughout the 1980s, these proportions were about 50% and 33%, respectively (NSB 2012).
During the latter part of the decade 2000–09, a period marked by the economic downturn and financial crisis, both the percentage of foreign-born S&E doctorate recipients re-porting plans to stay in the United States and the percentage of those reporting firm offers to stay declined slightly (fig-ure 3-38). The overall number of foreign-born S&E doctor-ate recipients also declined in 2009 and 2010. Although the numbers have since risen in 2011, the levels remain below the recent peaks seen in 2008.
Overall, S&E short-term stay rates reflect the high short-term stay rates in computer and mathematical sciences, the biological and related sciences, the physical sciences, and engineering (appendix table 3-22). Between 2008 and 2011, the short-term stay rates in these four fields ranged from 77% to 83%, as measured by reports of intentions to stay in the United States. However, the short-term stay rates for foreign-born U.S. S&E doctorate recipients in health fields (71%) were somewhat lower, and those in the social scienc-es (57%) were substantially lower.
Stay rates vary by place of origin. Between 2008 and 2011, the vast majority of U.S. S&E doctorate recipients from China (86%) and from India (87%) reported plans to stay in the United States, and close to 60% of these indi-viduals reported accepting firm offers for employment or postdoc research in the United States (appendix table 3-22). U.S. S&E doctorate recipients from Japan, South Korea, and Taiwan were less likely than those from China and India to stay in the United States (figure 3-39). About half of U.S. S&E doctorate recipients from Europe had firm plans to stay in the United States after graduation (appendix table 3-22). In North America, the percentage of U.S. S&E doc-torate recipients who had definite plans to stay in the United States was higher for those from Canada than for those from Mexico (appendix table 3-22).
Among U.S. S&E doctorate recipients from the two top countries of origin, China and India, the proportions report-ing plans to stay in the United States have declined since the early part of the decade of the 2000s (appendix table 3-22).
Long-Term Stay Rates for U.S. S&E Doctorate Recipients
Long-term stay rates indicate the degree to which foreign-born recipients of U.S. S&E doctorates enter and remain in the U.S. labor force to pursue their careers. For a particular cohort of foreign-born noncitizen S&E doctorate recipients, the proportion of that cohort that pays federal taxes a given number of years after receiving their degrees is an indica-tor of the cohort’s long-term stay rate.31 Estimates of short-term stay rates are derived from data on reported intentions to stay in the United States within the year after graduation. Stay rates over the short term can be compared with those over a longer duration to analyze how stated intentions for
the period immediately after graduation compare with actual behavior some years later.
Stay rate data include foreign-born noncitizen recipients of U.S. S&E doctorates who were on either a permanent or a temporary visa at the time they received their doctorates. For the 2001 and 2006 graduating cohorts, stay rate data are avail-able separately for permanent and temporary visa holders. Within these cohorts, stay rates are particularly stable over time among individuals who received their doctorates while on a permanent visa (figure 3-40). Temporary residents, who account for the vast majority of noncitizen recipients of U.S. S&E doctorates, have lower stay rates than do permanent residents, and their stay rates decline with additional years
Figure 3-39Plans of foreign recipients of U.S. S&E doctoral degrees at graduation to stay in the United States, by place of origin and year of doctorate: 1998–2001 and 2008–11
NOTES: Data re�ect proportions of each group reporting �rm commitment to postgraduation employment in the United States. Data include doctorate recipients on temporary and permanent visas. Data for China include Hong Kong.
SOURCE: National Science Foundation, National Center for Science and Engineering Statistics, special tabulations (2013) of Survey of Earned Doctorates (SED).
Science and Engineering Indicators 2014
Brazil
Mexico
Japan
Taiwan
Canada
South Korea
France
Italy
Germany
Turkey
China
India
Iran
1998–2001
2008–11
0 20 40
Percent
60 80

Science and Engineering Indicators 2014 ♦ 3-57
since degree. For example, among foreign-born U.S. S&E doctorate recipients from the 2001 cohort, those who were on a temporary visa at the time they earned their degree had a 2-year stay rate in 2003 that was 16 percentage points low-er than those with a permanent visa. This difference grew wider over time, reaching almost 26 percentage points by 2011, as stay rates for temporary visa holders fell while stay rates for permanent residents changed little.
The stay rates within the entire 2001 and 2006 cohorts of foreign-born noncitizen recipients of U.S. S&E doctorates
fell with additional years since graduation (Finn 2014); this was a result of the declining stay rates among temporary visa holders, who accounted for nearly 90% of all noncitizen U.S. S&E doctorate recipients in these cohorts. The 2001 co-hort had a stay rate after 2 years of 73%; after 10 years, this rate declined by 8 percentage points. The 2006 cohort had a 2-year stay rate of 74%, which declined to 68% after 5 years. In comparison, among the cohort of foreign-born U.S. S&E doctorate recipients who earned their degrees in 1995, stay rates were relatively stable as additional years passed since graduation. The 1995 cohort had a 2-year stay rate of 65%, which dropped to 61% after 16 years (Finn 2014). Stay rate data for the 1995 cohort, however, are not separately avail-able for permanent and temporary residents. Data from earli-er and subsequent years suggest that temporary visa holders accounted for the vast majority of foreign-born noncitizen recipients of U.S. S&E doctorates in 1995 (Finn 2012); as a result, temporary residents likely played an important role in the overall stability of the stay rate within this cohort.
In recent years, long-term stay rates have fluctuated with-in a fairly narrow range, neither increasing nor declining consistently (table 3-29). Among U.S. S&E doctorate recipi-ents with a temporary visa at graduation, 5-year stay rates rose in the latter part of the decade of the 2000s after declin-ing for several years around the 2007–09 economic down-turn. While figure 3-40 shows the stay rate data annually for fixed cohorts (2001 and 2006 graduating cohorts), table 3-29 presents data on 5-year stay rates during the 2001–11 period. Data for each year reflect the stay rate in that year for the cohort that received their doctorates 5 years earlier. The 5-year stay rate rose to 66% in 2011, close to the recent high level seen in 2005 (67%).
The trends in the 5-year stay rates vary across source countries (table 3-29). Among foreign-born recipients from China (the largest source country) who were temporary resi-dents at the time they received their U.S. S&E doctorates,
Figure 3-40Stay rates for U.S. S&E doctorate recipients with permanent or temporary visas at graduation, by selected year of doctorate: 2003–11Percent
SOURCE: Finn M. 2014 (forthcoming). Stay Rates of Foreign Doctoral Recipients from U.S. Universities: 2011. Oak Ridge, TN: Oak Ridge Institute for Science and Education.
Science and Engineering Indicators 2014
2003 2004 2005 2006 2007 2008 2009 2010 201140
50
60
70
80
90
100
2001 graduates, permanent visa
2001 graduates, temporary visa
2006 graduates,permanent visa
2006 graduates,temporary visa
Table 3-29Five-year stay rates for U.S. S&E doctorate recipients with temporary visas at graduation, by selected country/region/economy: 2001–11(Percent)
Country/region/economy 2001 2003 2005 2007 2009 2011
All countries/regions/economies ............................................. 58 64 67 63 62 66China .................................................................................... 98 93 95 94 89 85India ..................................................................................... 89 90 89 83 79 82Europe ................................................................................. 53 63 67 67 60 62Canada ................................................................................ 66 63 60 56 53 55South Korea ......................................................................... 22 36 44 42 42 42Japan ................................................................................... 24 39 41 33 40 38Taiwan .................................................................................. 41 48 52 43 37 38Mexico ................................................................................. 31 22 32 33 35 39Brazil .................................................................................... 26 26 31 32 33 37
NOTE: Data for each year reflect the stay rate in that year for the cohort that received their doctoral degrees 5 years earlier.
SOURCE: Finn M. 2014 (forthcoming). Stay Rates of Foreign Doctoral Recipients from U.S. Universities: 2011. Oak Ridge, TN: Oak Ridge Institute for Science and Education.
Science and Engineering Indicators 2014

3-58 ♦ Chapter 3. Science and Engineering Labor Force
the 5-year stay rate declined in 2011, continuing the trend since before the economic downturn. However, even with this decline, rates remain higher than those of other major locations. Foreign-born U.S. S&E doctorate recipients from other major source countries/economies, like India and Taiwan, saw slight increases in the 5-year stay rate between 2009 and 2011, although their stay rate overall declined be-tween 2001 and 2011. Among foreign-born recipients of U.S. S&E doctorates from South Korea who were on a tem-porary visa at the time they received their doctorate, stay rates remained stable between 2007 and 2011 after doubling during the first half of the decade.
Data from the 2006 cohort suggest that among tempo-rary visa holders receiving U.S. S&E doctorates, stated in-tentions to stay in the United States (short-term stay rates) are reasonable indicators of stay rates some years later (Finn 2014). Among temporary residents who received their U.S. S&E doctorate in 2006 and reported definite plans to stay in the United States within the year after graduation, 94% were in the United States 1 year later and 80% remained 5 years later. Among the 2006 cohort of temporary residents who re-ported plans to stay in the United States (as opposed to firm employment offers), 86% were in the United States 1 year later and 72% remained 5 years later. A number of factors are likely to affect how precisely short-term intentions to stay in the United States predict actual behavior some years later. Among these are overall economic conditions and job opportunities in the United States, comparable conditions in the doctorate recipient’s country of origin, and family-related and other personal considerations.
High-Skill Migration Worldwide No worldwide or internationally comparable data exist
on the migration of workers in S&E occupations or with college-level S&E degrees. Docquier and Rapoport (2012) compiled and analyzed data on international migration to OECD countries by educational attainment in 1990 and 2000 (see also Docquier, Lowell, and Marfouk 2009; Docquier and Marfouk 2006). They defined high-skill migrants as the total number of foreign-born individuals, age 25 and over, with some postsecondary education living in an OECD country. They gathered data for nearly 200 source countries (which included OECD and non-OECD countries), all but a handful of which are independent nations. More recent and comprehensive data on global high-skill migration patterns are not currently available. However, the flow of migration historically has been from developing to developed nations, and the OECD data for the 1990 to 2000 period confirm this pattern. As R&D activity expands in developing countries, press reports suggest increased movement in the opposite direction; however, systematic and recent data do not exist to address that pattern.
The data on migration to OECD countries indicate sev-eral patterns in international migration of individuals age 25 and older:
♦ Between 1990 and 2000, the total number of immigrants (regardless of skill level) in OECD countries increased from about 42 million to about 59 million.
♦ Globally, OECD countries account for the vast major-ity of high-skill immigrants. The migration rate among high-skill individuals to the OECD nations changed only slightly between 1990 and 2000 (rising from 5.1% to 5.5%). Nonetheless, because worldwide education levels are rising, the proportion of high-skill individuals among those who immigrated to OECD countries rose during this period, from 30% to 35%.
♦ Rates of legal emigration were much greater among high-skill individuals (5.5% in 2000) than among those with less education (1.3% in 2000).
♦ In countries that the World Bank classifies as low income, the gap in emigration rates between high- and low-skill groups (7.6% and 0.3%, respectively, in 2000) was espe-cially large. In comparison, the rates of high- and low-skill emigration rates were similar in countries that the World Bank classifies as high income (3.9% and 3.6%, respec-tively, in 2000).
♦ Between 1990 and 2000, the proportion of women among high-skill migrants rose, partly because of the worldwide increase in the proportion of individuals with some post-secondary education who are women.
♦ In 2000, the countries estimated to have the largest num-ber of high-skill emigrants living in OECD countries were the United Kingdom (1.5 million), the Philippines (1.1 million), India (1.0 million), Mexico (0.9 million), and Germany (0.9 million) (figure 3-41). The proportion of high-skill emigrants who are women varied considerably across source countries (figure 3-41; see also Docquier, Lowell, and Marfouk 2009). In a more limited study covering six major destination
countries (United States, Canada, Australia, Germany, United Kingdom, and France), Defoort (2008) concluded that worldwide emigration rates for high-skill persons be-tween 1975 and 2000 were stable in a large number of coun-tries. Stable rates of emigration, however, would produce an increase in the total number of high-skill emigrants due to rising levels of worldwide education and skill.
Regarding high-skill migration to the United States, col-lege-educated foreign-born workers in the United States are disproportionately found in S&E occupations and dispropor-tionately have advanced degrees (see “Characteristics of the Foreign-Born Scientists and Engineers”). However, current international data do not enable researchers to assess whether and how migration rates globally or to OECD countries vary among different categories of high-skill workers.

Science and Engineering Indicators 2014 ♦ 3-59
Global S&E Labor ForceThe rising emphasis on developing S&E expertise and
technical capabilities has been a global phenomenon. S&E work is not limited to developed economies; it occurs throughout the world. Such work, however, is concentrated in developed nations, where a significant portion of R&D also takes place. The availability of a suitable labor force is an important determinant of where businesses choose to locate S&E work (Davis and Hart 2010), and concentrations of existing S&E work, in turn, spawn new employment op-portunities for workers with relevant S&E knowledge and
skills. As a result, governments in many countries have made increased investments in S&E-related postsecondary education a high priority. At the same time, high-skill work-ers, such as those educated or employed in S&E fields, are increasingly mobile, and the number that leave their native countries to pursue education and career goals is growing. In recent years, many nations, recognizing the value of high-skill workers for the economy as a whole, have changed their laws to make it easier for such workers to immigrate. These changes indicate an accelerating competition for globally mobile talent (Shachar 2006).
Data on the global S&E workforce, however, are very limited, which makes it difficult to analyze the precise size and characteristics of this specialized workforce. Unfortunately, the internationally comparable data that exist are limited to establishment surveys that provide only ba-sic information about workers in S&E occupations or with training in S&E disciplines. In contrast, SESTAT includes far more data on members of the U.S. S&E labor force than is available in other national statistical systems. In addition, although surveys that collect workforce data are conducted in many OECD member countries, they do not cover several countries—including Brazil, India, and Israel—that have high and rising levels of science and technology capability, and they do not provide fully comparable data for China.
This section provides information about the size and growth of workforce segments whose jobs involve R&D in nations for which relevant data exist.
Size and Growth of the Global S&E Labor Force
Although comprehensive data on the worldwide S&E workforce do not exist, OECD data covering significant, internationally comparable segments of the S&E workforce provide strong evidence of widespread, though uneven, growth in the world’s developed nations. OECD countries, which include most of the world’s highly developed nations, compile data on researchers from establishment surveys in member and selected non-member countries. These surveys generally use a standardized occupational classification that defines researchers as “professionals engaged in the conception or creation of new knowledge, products, pro-cesses, methods and systems and also in the management of the projects concerned” (OECD 2002:93). Because this definition can be applied differently when different nations conduct surveys, international comparisons should be made with caution. OECD also reports data on a broader measure of all personnel employed directly in R&D. In addition to researchers, the data on total R&D personnel include those who provide direct services to R&D such as clerical and ad-ministrative staff employed in R&D organizations.
OECD reports an estimated increase in the number of researchers in its member countries from 2.8 million in 1995 to 4.2 million in 2007. OECD also publishes esti-mates for seven non-member economies, including China and Russia; adding these to the OECD member total for
Figure 3-41Top countries of origin of foreign-born persons residing in OECD countries and having at least a tertiary education, age 25 years or more, by sex: 2000
OECD = Organisation for Economic Co-operation and Development; UK = United Kingdom.
NOTE: Tertiary education is roughly equivalent in U.S. terms to individuals who have earned at least technical school or associate’s degrees and includes all degrees up to the doctorate.
SOURCE: Docquier F, Lowell B, Marfouk A. 2009. A gendered assessment of highly skilled emigration. Population and Development Review 35(2):297–321, http://onlinelibrary.wiley.com/doi/10.1111/ j.1728-4457.2009.00277.x/abstract (accessed 22 January 2013).
Science and Engineering Indicators 2014
Thousands of emigrants
UK
Philippines
India
Mexico
Germany
China
Korea
Canada
Vietnam
Poland
United States
0 200 400 600 800 1,000 1,200 1,400 1,600
Female Male

3-60 ♦ Chapter 3. Science and Engineering Labor Force
2007 yields a worldwide estimate of 6.3 million research-ers. However, numerous uncertainties affect this estimate, including, but not limited to, lack of coverage of countries with significant R&D enterprise, as well as methodological inconsistencies over time and across countries. For example, some non-member countries that engage in large and grow-ing amounts of research (e.g., India, Brazil) are omitted en-tirely from these totals. In addition, for some countries and regions, including the United States and the European Union (EU; see glossary for member countries), OECD estimates are derived from multiple national data sources and not from a uniform or standardized data collection procedure. For example, China’s data after 2008 are collected in ac-cordance with OECD definitions and standards; compared to China’s estimate for 2008, these data yield estimates of about 440,000, 382,000, and 274,000 fewer researchers in 2009, 2010, and 2011, respectively.
Despite these limitations for making worldwide esti-mates of the number of researchers, the OECD data are a reasonable starting point for estimating the rate of world-wide growth. For most economies with large numbers of re-searchers, growth since the mid-1990s has been substantial (figure 3-42). China, whose pre-2009 data did not entirely correspond to the OECD definition, reported about triple the number of researchers in 2008 compared with 1995. South Korea doubled its number of researchers between 1995 and 2006 and continued to grow strongly between 2007 and 2011. The United States and the EU experienced steady growth but at a lower rate; the number of researchers grew 36% in the
United States between 1995 and 2007 and 65% in the EU between 1995 and 2010. Exceptions to the overall worldwide trend included Japan (which experienced little change) and Russia (which experienced a decline, especially early in the period; see also Gokhberg and Nekipelova 2002). Trends in full-time equivalent R&D personnel were generally parallel to those for researchers in those cases for which both kinds of data are available (appendix table 3-23).
OECD also estimates the proportion of researchers in the workforce. In OECD’s most recent estimates, small econo-mies in Scandinavia (Denmark, Finland, Norway, Sweden) report that between 1% and 2% of their employed workforce are researchers; small economies in East Asia (Singapore, Taiwan) report that about 1% of their workforce are research-ers (appendix table 3-24). Among economies with more than 200,000 researchers, OECD’s latest estimates are that re-searchers make up the highest proportions of the workforce in Japan (1.0%), South Korea (1.2%), and the United States (0.95%). Although China reports a large number of research-ers, they are a much smaller percentage of its workforce (0.17%) than in OECD member countries.
Several Asian economies have shown marked and con-tinuous increases in the percentage of their workforce em-ployed as researchers. These include China, South Korea, Singapore, and Taiwan (appendix table 3-24). In the United States and Japan, where growth occurred at all, it took place mostly between the mid-1990s and the early 2000s (figure 3-43). Patterns and trends in the proportion of the workforce
Figure 3-42Estimated number of researchers in selected countries/regions: 1995–2011Thousands
EU = European Union.
NOTES: Data are not available for all countries/regions for all years. Researchers are full-time equivalents. Before 2009, counts for China were not consistent with Organisation for Economic Co-operation and Development (OECD) standards.
SOURCE: OECD, Main Science and Technology Indicators (2013/1 and earlier years), http://www.oecd.org/sti/msti.htm.
Science and Engineering Indicators 2014
1995 1997 1999 2001 2003 2005 2007 2009 2011
0
200
400
600
800
1,000
1,200
1,400
1,600
1,800
United States
EU
Japan
South Korea
China
Russia
Figure 3-43Researchers as a share of total employment in selected countries/regions: 1995–2011Per thousand
EU = European Union.
NOTES: Data are not available for all countries/regions for all years. Researchers are full-time equivalents per thousand total employment. Before 2009, counts for China were not consistent with Organisation for Economic Co-operation and Development (OECD) standards.
SOURCE: OECD, Main Science and Technology Indicators (2013/1 and earlier years), http://www.oecd.org/sti/msti.htm.
Science and Engineering Indicators 2014
1995 1997 1999 2001 2003 2005 2007 2009 20110
2
4
6
8
10
12
14
United States
EU
Japan
South Korea
Russia
China
Science and Engineering Indicators 2014 ♦ 3-61
classified as R&D personnel are generally similar to those for researchers.
The proportion of female researchers varies considerably across OECD economies. According to the most recent es-timates for the selected OECD countries for which data by sex are available, Japan (14% women) and South Korea (17% women) have a significant imbalance among researchers. By comparison, Turkey, Sweden, Spain, and Poland are more balanced with women representing between 35% and 40% of researchers.
R&D Employment Abroad by U.S. CompaniesR&D jobs located abroad in U.S.-owned companies are
an indicator of global engagement by U.S. companies in the world’s S&E workforce. Data from NSF’s Business R&D and Innovation Survey (BRDIS) provide an overview of R&D employment in the business sector and enable com-parisons between domestic and foreign R&D employment in companies located in the United States (both U.S.- and foreign-owned) that have R&D activity. These data identify employment as either domestic or foreign on the basis of the job’s location and not on the basis of the company’s owner-ship, the employee’s citizenship, or the employee’s place of birth. Chapter 4 includes a detailed analysis of BRDIS data on R&D employment abroad by U.S. companies.
ConclusionThe S&E labor force may be defined in a variety of ways.
At its core are individuals in S&E occupations, but those with S&E degrees who are employed in a variety of oth-er jobs also play a role. Many more individuals hold S&E degrees than work in S&E occupations. Indicative of a knowledge-based economy, many of those in non-S&E oc-cupations report that their work nonetheless requires at least a bachelor’s degree level of S&E knowledge and skills. This suggests that the application of S&E knowledge and techni-cal expertise is widespread across the U.S. economy and not just limited to S&E occupations.
In both the United States and the rest of the world, the S&E workforce has experienced strong growth over time. During the 2007–09 economic downturn, S&E employment remained more resilient in the United States than overall employment. Policymakers with otherwise divergent per-spectives agree that jobs involving S&E are good for work-ers and good for the economy as a whole. These jobs pay more, even when compared to jobs requiring similar levels of education and comparably specialized skills. Although S&E workers are not totally exempt from joblessness, work-ers with S&E training or in S&E occupations are less often exposed to periods of unemployment.
Innovation based on S&E R&D is globally recognized as an important vehicle for a nation’s economic growth and competitive advantage. As such, it is not surprising that growing numbers of workers worldwide are engaged in re-search. Growth has been especially marked in rapidly devel-oping economies, such as China and South Korea, that have either recently joined the ranks of the world’s developed economies or are poised to do so. Mature developed econo-mies in North America and Europe have maintained slower growth whereas the number of researchers in the struggling Japanese economy has been stagnant.
The demographic composition of the S&E workforce in the United States is changing. The baby boom portion of the S&E workforce continues to age into retirement. However, increasing proportions of scientists and engineers are post-poning retirement to somewhat later ages. At the same time, members of historically underrepresented groups (e.g., women, blacks, Hispanics) have played an increasing role in the U.S. S&E labor force, although this has been more the case in some fields (e.g., life sciences and social sciences) than in others (e.g., computer and mathematical sciences, physical sciences, and engineering). Despite the recent in-creases in S&E participation by women and by racial and ethnic minorities, both groups remain underrepresented in the U.S. S&E workforce compared to their overall labor force participation. For example, women account for slight-ly more than one-fourth of all workers employed in S&E occupations in the United States despite representing half of the college-educated workforce.
The United States has remained an attractive destination for foreign students and workers with advanced S&E train-ing. In the wake of the 2001 recession, there were increases in both temporary work visas and stay rates of foreign recipi-ents of S&E doctorates. Although declines occurred during the 2007–09 economic downturn—a period marked by rising unemployment in the United States among workers in S&E as well as in other occupations—growth has since resumed.
In today’s dynamic marketplace, where information flows rapidly and technology is always evolving, labor market conditions change fast. Numerous factors—such as global competition, demographic trends, aggregate eco-nomic activities, and S&E training pathways and career op-portunities—will affect the availability of workers equipped with S&E expertise as well as the kinds of jobs that the U.S. economy generates in the future. As a result, comprehensive and timely analysis of current labor force and demographic trends will play a critical role in providing the information needed to understand the dynamic S&E landscape both in the United States and globally.

3-62 ♦ Chapter 3. Science and Engineering Labor Force
Notes1. The standard definition of the term labor force is a
subset of the population that includes both those who are employed and those who are not working but seeking work (unemployed); other individuals are not considered to be in the labor force. When data refer only to employed per-sons, the term workforce is used. For data on unemployment rates by occupation, calculations assume that unemployed individuals are seeking further employment in their most recent occupation.
2. The SOC is used by federal statistical agencies to clas-sify workers into occupational categories for the purpose of collecting, calculating, and disseminating data. Detailed information on the SOC is available at http://www.bls. gov/SOC/.
3. Despite the limitations of this subjective measure, variations among occupations in the proportions of workers who say that they need this level of S&E technical expertise are in accordance with common sense. For example, among postsecondary teachers of physics, 95% said that their job required at least a bachelor’s degree level of knowledge in engineering, computer sciences, mathematics, or the natural sciences. Among postsecondary teachers of business com-merce or marketing, 83% said that their job required at least this level of expertise in other fields such as health, busi-ness, or education. Among the SESTAT population whose occupation is secretary/receptionist/typist, fewer than 10% said that their job required bachelor’s level S&E expertise of any kind, and 12% said that their job required at least this level of expertise in other fields such as health, business, or education.
4. Estimates of the size of the S&E workforce vary across the example surveys because of differences in the scope of the data collection (SESTAT surveys collect data from in-dividuals with at least a bachelor’s degree); because of the type of survey respondent (SESTAT surveys collect data from individuals, OES collects data from establishments, and ACS collects data from households); or because of the level of detail collected on an occupation, which aids in clas-sifying a reported occupation into a standard occupational category. All of these differences can affect the estimates. For example, the SESTAT estimate of the number of work-ers in S&E occupations includes postsecondary teachers of S&E fields; however, postsecondary teachers in ACS are grouped under a single occupation code regardless of field and are therefore not included in the ACS estimate of the number of workers in S&E occupations.
5. Among those with doctorates in an S&E field, life sci-ences and social sciences were the most common fields, fol-lowed by physical sciences, engineering, and computer and mathematical sciences.
6. The data on S&E employment level for 1960 are cal-culated using the Census Bureau’s 1960 Decennial Census microdata, adjusted by the Integrated Public Use Microdata Series (IPUMS) from the University of Minnesota’s Minnesota Population Center (http://www.ipums.org).
The data for 2011 are calculated using the 2011 American Community Survey (ACS) public use microdata sample (PUMS) files from the Census Bureau (http://www.cen-sus.gov/acs/www/data_documentation/public_use_micro-data_sample/). S&E employment levels for 1960 and 2011 include workers at all education levels and do not include S&E postsecondary teachers. Although the 1960 Decennial Census data allow for separate identification of S&E post-secondary teachers, the 2011 ACS data aggregate all post-secondary teachers into one occupation code and therefore do not allow for separate identification of S&E postsecond-ary teachers. For 1960, including S&E postsecondary teach-ers would increase the number of workers employed in S&E occupations to nearly 1.2 million. See appendix table 3-1 for a list of S&E occupations in the 1960 Decennial Census and 2011 ACS.
7. Many comparisons using Census Bureau data on oc-cupations are limited to looking at all S&E occupations except postsecondary teachers (i.e., nonacademic S&E oc-cupations) because the Census Bureau aggregates all post-secondary teachers into one occupation code. NSF surveys of scientists and engineers and some BLS surveys collect data on postsecondary teachers by field.
8. The data on self-employment from SESTAT include those who report being self-employed or employed by a business owner in either an unincorporated or incorporated business, professional practice, or farm. As a result, the data may capture both self-employed individuals in their own businesses as well as those whose principal employer is a business owner. This is a major reason why the SESTAT estimate of self-employed workers in S&E occupations is higher than those from other surveys (e.g., the Census Bureau’s ACS).
9. Employment in the federal government is largely lim-ited to those with U.S. citizenship. In the competitive civil service, only U.S. citizens and nationals may be appointed; however, in the excepted service or the Senior Executive Service, certain noncitizens who meet specific employabil-ity requirements may be employed. Many federal workers with S&E employment are in occupations that, nationwide, include relatively large concentrations of foreign-born per-sons, some of whom are not U.S. citizens, rendering them ineligible for many federal jobs.
10. This list does not include the National Institutes of Health, which is a part of the Department of Health and Human Services (DHHS). DHHS accounted for 5% of total federal S&E employment in 2012.
11. The other 10 activities are used to define four addi-tional broad categories of primary/secondary work activi-ties, including teaching; management and administration; computer applications; and professional services, produc-tion workers, or other work activities not specified.
12. Social scientists were exceptions. In 2010, the dif-ference in R&D activity rates between social scientists with doctorates and social scientists with bachelor’s degrees was not statistically significant.

Science and Engineering Indicators 2014 ♦ 3-63
13. The patent activity rate is the proportion who reported having been named as an inventor on a patent application in the previous 5 years.
14. Although SESTAT respondents were allowed to pro-vide more than one reason for participating in work-related training, the data presented in this section are on the most important reason for participating in such training.
15. The Business Cycle Dating Committee of the National Bureau of Economic Research is generally the source for de-termining the beginning and end of recessions or expansions in the U.S. economy. See http://www.nber.org/cycles/reces-sions.html for additional information.
16. The Bureau of Labor Statistics civilian unemployment rate for persons 16 years and over, not seasonally adjusted, is available at http://data.bls.gov/timeseries/LNU04000000 (accessed 4 December 2012).
17. Social scientists were exceptions. The change in the unemployment rate from 2006 to 2010 among social scien-tists was not statistically significant.
18. The CPS is the source of the official unemployment rate.
19. Although the formal job title is often postdoc fellow-ship or research associate, titles vary among organizations. This chapter generally uses the shorter, more commonly used, and best understood name, postdoc. A postdoc is gen-erally considered a temporary position that individuals take primarily for additional training—a period of advanced pro-fessional apprenticeship—after completion of a doctorate.
20. NSF is currently developing a data collection strat-egy as part of its Early Career Doctorates Project (ECDP) to gather in-depth information about postdoc researchers and other early career doctorates. The ECDP will collect infor-mation related to educational achievement, professional ac-tivities, employer demographics, professional and personal life balance, mentoring, training and research opportunities, and career paths and plans for individuals who earned their doctorate in the past 10 years and are employed in an aca-demic institution or a research facility.
21. In this chapter, American Indian or Alaska Native, Asian, black, Native Hawaiian or Other Pacific Islander, white, and more than one race refer to individuals who are not of Hispanic origin. Hispanics may be any race.
22. Salary differences represent estimated percentage dif-ferences in women’s reported full-time annual salary rela-tive to men’s reported full-time annual salary as of October 2010. Coefficients are estimated in an ordinary least squares regression model using natural log of full-time annual salary as the dependent variable. This estimated percentage differ-ence in earnings differs slightly from the observed difference in median earnings by sex because the former addresses dif-ferences in mean earnings rather than median.
23. Included are 20 SESTAT field of degree categories (out of 21 S&E fields), 38 SESTAT occupational catego-ries (out of 39 categories), 6 SESTAT employment sector categories (out of 7), years since highest degree, years since highest degree squared, Carnegie classification of school
awarding highest degree, and private/public status of post-secondary institution awarding highest degree.
24. In addition to the education- and employment-related variables, the following indicators are included: nativity and citizenship, marital status, disability, number of children liv-ing in the household, geographic region (classified into nine U.S. Census divisions), and whether either parent holds a bachelor’s or higher level degree. The sex regression con-trols for racial and ethnic minority status, and the race and ethnicity regression controls for sex.
25. The regression analysis addresses major factors that affect differences in earnings but does not attempt to cover all possible sources of difference. For a more detailed dis-cussion on the topic, see Blau and Kahn (2007), Mincer (1974), Polachek (2008), and Xie and Shauman (2003).
26. When asked about the most important reason for coming to the United States, many foreign-born scientists and engineers who obtained their initial university degree abroad cited family-related reasons (24%), job or economic opportunities (23%), and educational opportunities (14%).
27. For an additional 15% (about 321,000) of foreign-born employed SESTAT respondents who hold an advanced degree, SESTAT lacks information on first bachelor’s de-gree, including the country in which they received their bachelor’s degree. Nearly three-fourths of these individuals received their highest degree from a foreign institution. The vast majority of foreign-born advanced degree holders for whom SESTAT contains information on first bachelor’s de-gree and who received their advanced degree abroad also received their initial university education abroad. It is there-fore highly likely that a significant portion of the group for whom SESTAT is missing first bachelor’s degree informa-tion also received this degree abroad.
28. For all types of temporary work visas, the actual num-ber of individuals using them is less than the number issued. For example, some individuals may have job offers from employers in more than one country and may choose not to foreclose any options until a visa is certain.
29. This question is part of the Survey of Earned Doctorates (SED), which is administered to individuals re-ceiving research doctoral degrees from all accredited U.S. institutions. For information on the SED, see http://www.nsf.gov/statistics/srvydoctorates/. The information on plan to stay or definite commitment to stay reflects intentions within the year after graduation as reported by the doctorate recipient around the graduation date. As such, any changes in intentions after survey completion are not captured.
30. Many foreign recipients of U.S. doctorates who re-port that they plan to stay in the United States the year af-ter graduation may do so using their student (F-1) visa and never obtain a new visa that would permit a longer stay. Student visas permit an additional 12-month stay in the United States after graduation if a student applies for op-tional practical training (OPT). OPT refers to paid or unpaid work that is performed at least 20 hours a week and that is related to a student’s field of study. Starting in April 2008,

3-64 ♦ Chapter 3. Science and Engineering Labor Force
those earning a degree in science, technology, engineering, and mathematical (STEM) fields could apply for an exten-sion of their OPT to a total of 29 months. Data from the Department of Homeland Security’s Student and Exchange Visitor Information System show that 75.6% of students with F-1 visas completing a doctorate in any field between 2004 and 2009 had applied for OPT.
31. Tax data that are used for estimating stay rates are reported by tax authorities in aggregate forms for groups of individuals in order to protect confidentiality of individual tax payers.
GlossaryEuropean Union (EU): As of June 2013, the EU com-
prised 27 member nations: Austria, Belgium, Bulgaria, Cyprus, Czech Republic, Denmark, Estonia, Finland, France, Germany, Greece, Hungary, Ireland, Italy, Latvia, Lithuania, Luxembourg, Malta, the Netherlands, Poland, Portugal, Romania, Slovakia, Slovenia, Spain, Sweden, and the United Kingdom. Croatia joined the EU in July 2013. Unless otherwise noted, OECD data on the EU include all 28 members; data on the EU from other sources are limited to the 27 nations that were members as of June 2013.
Involuntarily out of field (IOF) employment: Employ-ment in a job not related to the field of one’s highest degree because a job in that field was not available. The IOF rate is the proportion of all employed individuals that report IOF employment.
Labor force: A subset of the population that includes both those who are employed and those who are not work-ing but seeking work (unemployed); other individuals are not considered to be in the labor force.
Organisation for Economic Co-operation and Development (OECD): An international organization of 34 countries headquartered in Paris, France. The member coun-tries are Australia, Austria, Belgium, Canada, Chile, Czech Republic, Estonia, Denmark, Finland, France, Germany, Greece, Hungary, Iceland, Ireland, Israel, Italy, Japan, Korea, Luxembourg, Mexico, the Netherlands, New Zealand, Norway, Poland, Portugal, Slovak Republic, Slovenia, Spain, Sweden, Switzerland, Turkey, United Kingdom, and United States. Among its many activities, the OECD compiles social, economic, and science and technology statistics for all mem-ber and selected non-member countries.
Postdoc: A temporary position awarded in academia, in-dustry, government, or a non-profit organization, primarily for gaining additional education and training in research af-ter completion of a doctorate.
Scientists and Engineers Statistical Data System (SESTAT): A system of three surveys conducted by the National Science Foundation that measure the education-al, occupational, and demographic characteristics of the S&E workforce. The three surveys are the National Survey
of College Graduates (NSCG), the Survey of Doctorate Recipients (SDR), and the National Survey of Recent College Graduates (NSRCG).
Stay rate: The proportion of foreign recipients of U.S. S&E doctoral degrees who stay in the United States after receiving their doctorate.
Tertiary education: Roughly equivalent in U.S. terms to individuals who have earned at least technical school or as-sociate’s degrees, including all degrees up to the doctorate.
Workforce: A subset of the labor force that includes only employed individuals.
ReferencesBlau F, Kahn L. 2007. The gender pay gap: Have wom-
en gone as far as they can? Academy of Management Perspectives 21:7–23.
Carlino G, Chatterjee S, Hunt R. 2001. Knowledge Spillovers And The New Economy of Cities.Working Papers 01-14. Federal Reserve Bank of Philadelphia. http://ideas.repec.org/p/fip/fedpwp/01-14.html.
Davis T, Hart DM. 2010. International cooperation to man-age high-skill migration: The case of India-U.S. relations. Review of Policy Research 27(4):509–26.
Defoort C. 2008. Long-term trends in international migra-tion: An analysis of the six main receiving countries. Population-E 63(2):285–318.
Department of Homeland Security (DHS), U.S. Citizenship and Immigration Services (USCIS). 2012. Characteristics of H-1B Specialty Occupation Workers, Fiscal Year 2011 Annual Report to Congress. http://www.uscis.gov/USCIS/Resources/Reports%20and%20Studies/H-1B/h1b-fy-11-characteristics.pdf. Accessed 19 March 2013.
Docquier F, Lowell B, Marfouk A. 2009. A gendered as-sessment of highly skilled emigration. Population and Development Review 35(2):297–321.
Docquier F, Marfouk A. 2006. International migration by educational attainment, 1990–2000. In Ozden C, Schiff M, editors, International Migration, Remittances and the Brain Drain. New York: Palgrave Macmillan. pp. 151–200.
Docquier F, Rapoport H. 2012. Globalization, brain drain and development. Journal of Economic Literature 50(3): 681–730.
Finn M. 2012. Stay Rates of Foreign Doctoral Recipients from U.S. Universities: 2009. Oak Ridge, TN: Oak Ridge Institute for Science and Education.
Finn M. 2014 (forthcoming). Stay Rates of Foreign Doctoral Recipients from U.S. Universities: 2011. Oak Ridge, TN: Oak Ridge Institute for Science and Education.
Glaeser EL, Saiz A. 2003. The Rise of the Skilled City. NBER Working Papers 10191, National Bureau of Economic Research, Inc.

Science and Engineering Indicators 2014 ♦ 3-65
Gokhberg L, Nekipelova E. 2002. International migra-tion of scientists and engineers in Russia. In OECD, International Mobility of the Highly Skilled. Paris: OECD. pp. 177–188.
Mincer J. 1974. Schooling, Experience and Earnings. New York: Columbia University Press.
National Institutes of Health (NIH). 2012. Biomedical Research Workforce Working Group Report. http://acd.od.nih.gov/Biomedical_research_wgreport.pdf. Accessed 13 May 2013.
National Science Board (NSB). 2008. Science and Engineering Indicators 2008. Two volumes. Arlington, VA: National Science Foundation (volume 1, NSB 08-01; volume 2, NSB 08-01A). Available at http://www.nsf.gov/statistics/seind08/.
National Science Board (NSB). 2010. Science and Engineering Indicators 2010. Arlington, VA: National Science Foundation (NSB 10-01). Available at http://www.nsf.gov/statistics/seind10/.
National Science Board (NSB). 2012. Science and Engineering Indicators 2012. Arlington, VA: National Science Foundation (NSB 12-01). Available at http://www.nsf.gov/statistics/seind12/.
National Science Foundation, National Center for Science and Engineering Statistics (NSF/NCSES). 2013a. Graduate Students and Postdoctorates in Science and Engineering: Fall 2010. Detailed Statistical Tables NSF 13-314. Arlington, VA. Available at http://www.nsf.gov/statistics/nsf13314/.
National Science Foundation, National Center for Science and Engineering Statistics (NSF/NCSES). 2013b. Part-Time Graduate Enrollment in Science and Engineering in 2011 Grew at a Higher Rate than Full-Time Enrollment. NSF 13-328, Heuer R, Einaudi, P. Arlington, VA. Available at http://www.nsf.gov/statistics/infbrief/nsf13328/.
Office of Management and Budget. 2009. Update of Statistical Area Definitions and Guidance on Their Uses. OMB Bulletin No. 10.02. http://www.whitehouse.gov/sites/default/files/omb/assets/bulletins/b10-02.pdf. Accessed 26 June 2011.
Organisation for Economic Co-operation and Development (OECD). 2002. Frascati Manual. Paris: OECD.
Polachek S. 2008. Earnings over the life cycle: The Mincer earnings function and its applications. Foundations and Trends in Microeconomics 4(3):165–272.
Sauermann H, Roach M. 2012. Science PhD career pref-erences: Levels, changes, and advisor encouragement. PLoS ONE 7(5): e36307. http://www.plosone.org/ar-ticle/info:doi/10.1371/journal.pone.0036307#references. Accessed 30 April 2013.
Shachar A. 2006. The race for talent: Highly skilled mi-grants and competitive immigration regimes. New York University Law Review 81(1):148–206.
Stephan P, Levin S. 1992. Striking the Mother Lode in Science: The Importance of Age, Place, and Time. New York: Oxford University Press.
Wyatt I. 2010. Evaluating the 1996–2006 employment pro-jections. Monthly Labor Review (September):33–69.
Xie Y, Shauman K. 2003. Women in Science: Career Processes and Outcomes. Cambridge Massachusetts: Harvard University Press.

3-66 ♦ Chapter 3. Science and Engineering Labor Force