science & innovation in japan
TRANSCRIPT

11
Science & Innovation in Japanfor Global Sustainable Development
Session 2: Capitalisation of Science to Socioeconomic ValuesInternational Conference on Global Innovation Ecosystem
Kyoto, 8-9 September 2006
Director of Science Technology and Industry,OECD
Nobuo TANAKA
22
The importance of innovation
Innovation is the key driver of economic growth - new and improved products, processes and services account for the bulk of economic growth since the Industrial Revolution.
Innovation is of growing importance to economic activity in OECDcountries – global competition is forcing all countries to upgrade their economic activity and move up the value chain.
A growing number of countries has recognised the importance of innovation, e.g.:– Lisbon strategy in the EU– Policy strategies in the US, Japan and Korea to strengthen
innovation– Growing policy focus outside the OECD, notably in China.
Innovation has become more important to economic policy making –e.g. OECD Going for Growth report.
33Going for Growth 2006
44
Going for Growth 2006
550.6
0.40.1
0.20.5
0.30.21.5
0.20.2
2.70.31.40.1
0.4
1.330.8
4.72.829.6
5.50.8
1.00.68.30.9
42.13.6
0.016.80.81.6
100
0 1 2 3 4
Mexico (2001)Poland
Slovak Repub lic
Greece (2001)Turkey (2002)
Portugal (2002)HungarySpainIreland (2002)
New Zealand
Italy (2002)Czech RepublicAus tralia (2002)Luxem bourg (2000)
NorwayNetherlands (2002)
EU-25
United KingdomCanadaEU-15France
Aus triaTotal OECD
Belg iumDenm ark (2002)Germ anySwitzerland (2000)Un ited States
KoreaIce land
JapanFin landSweden
%
Share of total OECD R&D expenditure , 2003 or latest
available year
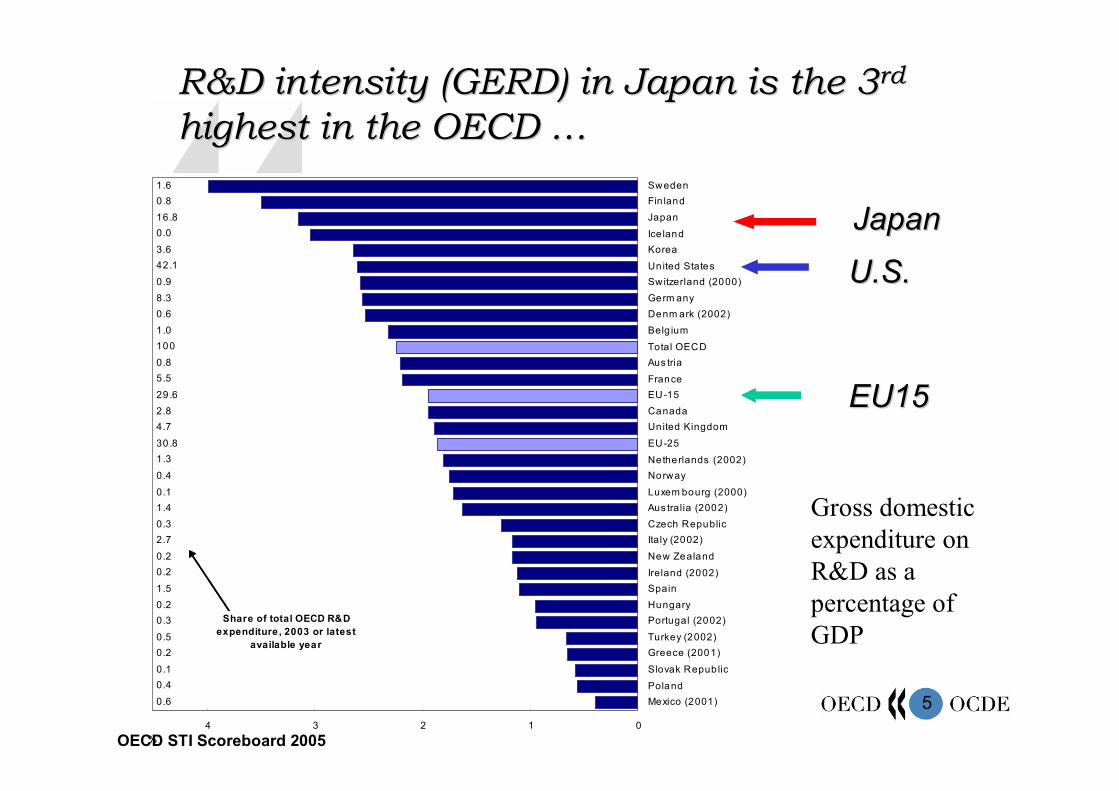
Gross domestic expenditure on R&D as a percentage of GDP
OECD STI Scoreboard 2005
R&D intensity (GERD) in Japan is the 3R&D intensity (GERD) in Japan is the 3rdrd
highest in the OECD highest in the OECD ……
JapanJapan
U.S.U.S.
EU15EU15

66
Investment in R&D has been increasing, Investment in R&D has been increasing, reflecting improved economic environment reflecting improved economic environment and growth of knowledge intensive and growth of knowledge intensive industriesindustries……
Trends in R&D Intensity(1) by area, 1991-2004 (as % of GDP)
77
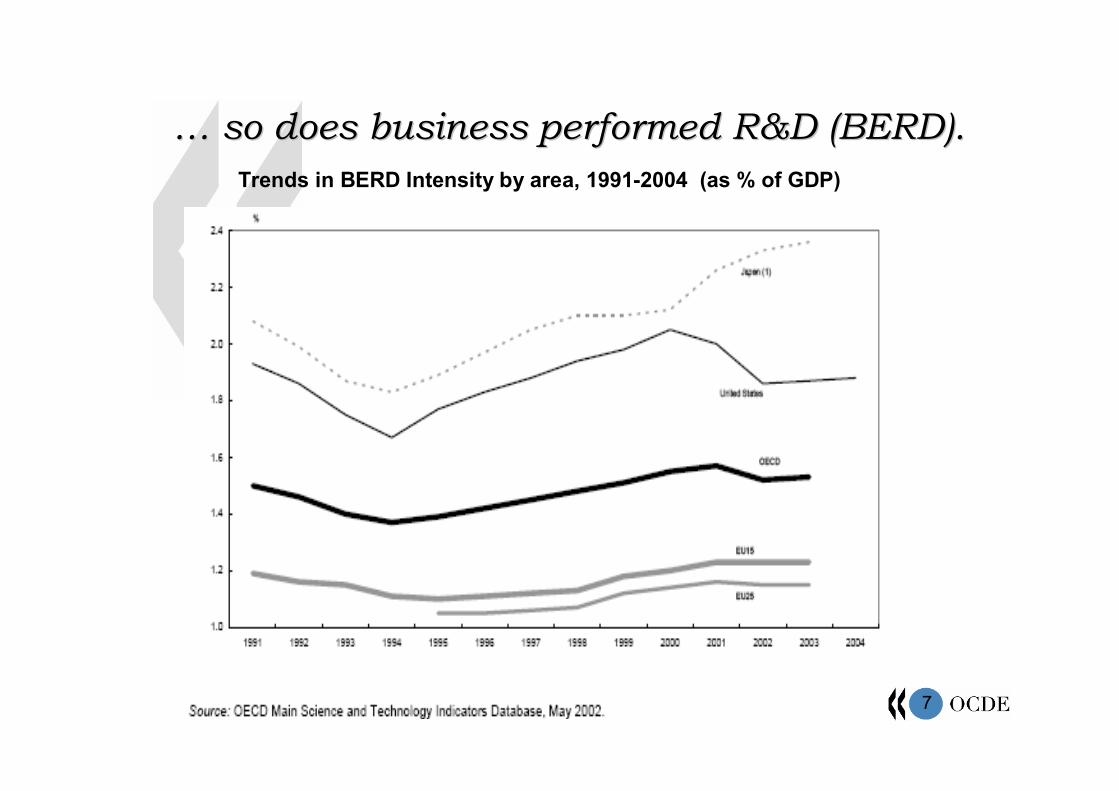
…… so does business performed R&D (BERD).so does business performed R&D (BERD).Trends in BERD Intensity by area, 1991-2004 (as % of GDP)
88
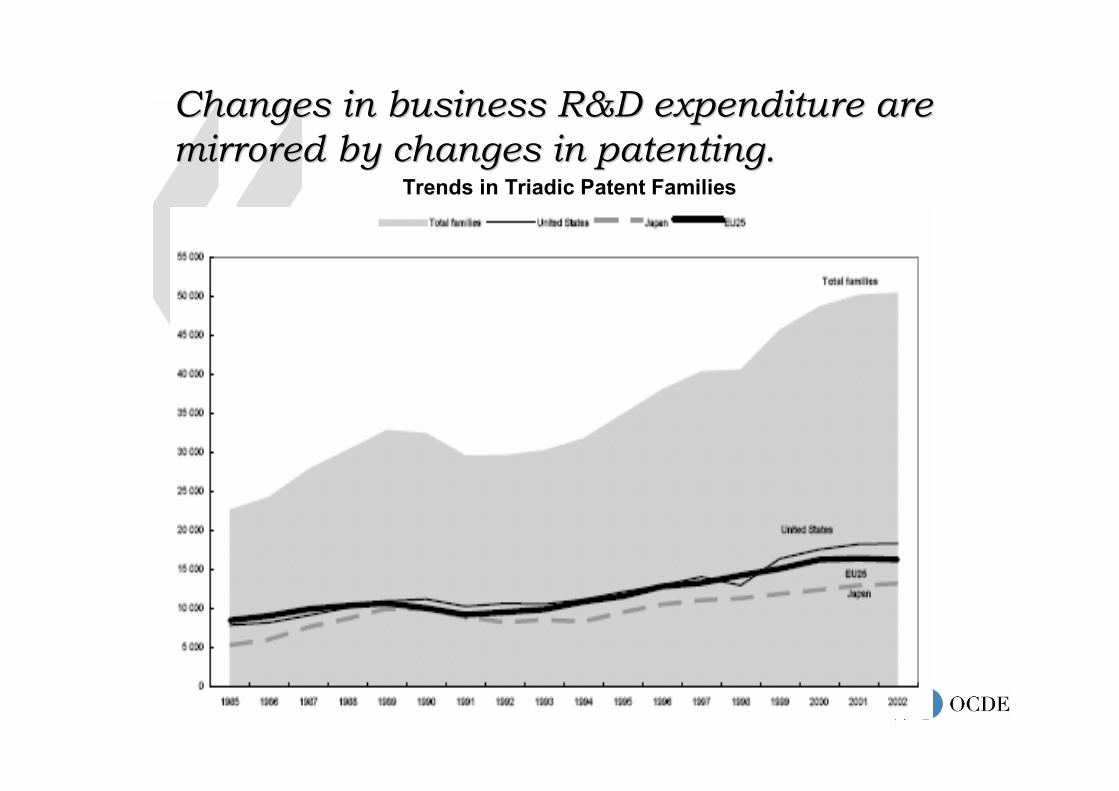
Changes in business R&D expenditure are Changes in business R&D expenditure are mirrored by changes in patenting.mirrored by changes in patenting.
Trends in Triadic Patent Families
99
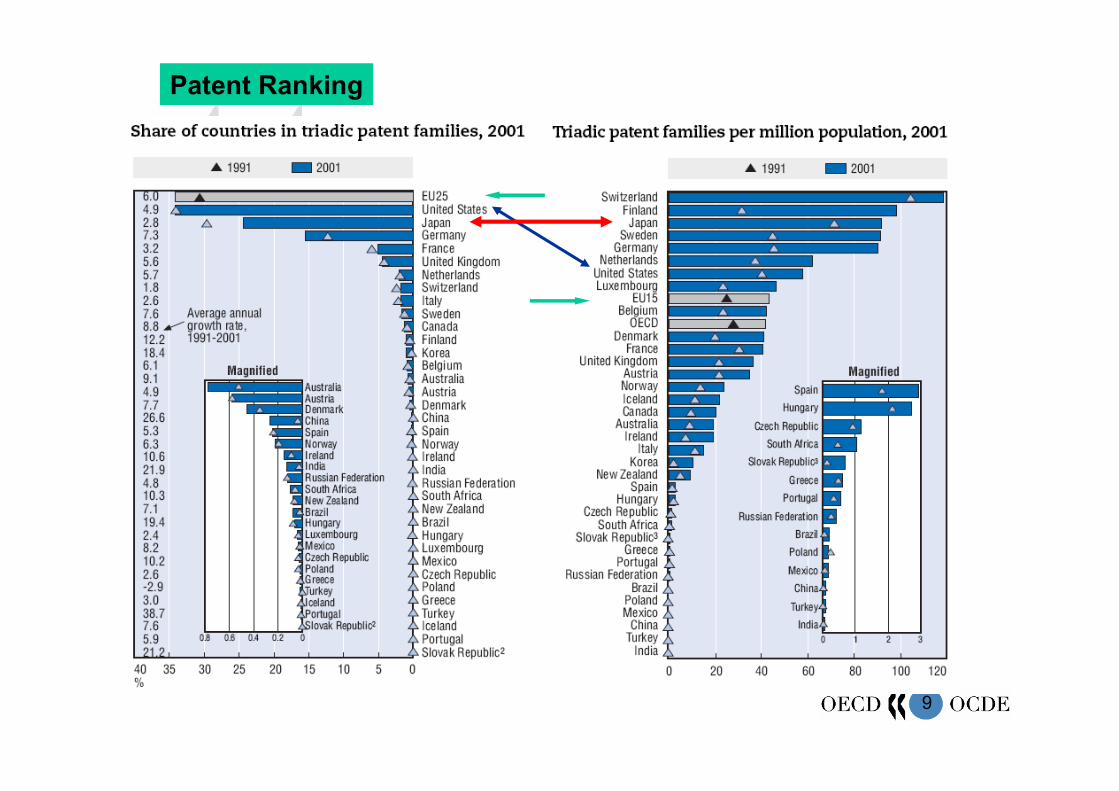
Patent Ranking
1010
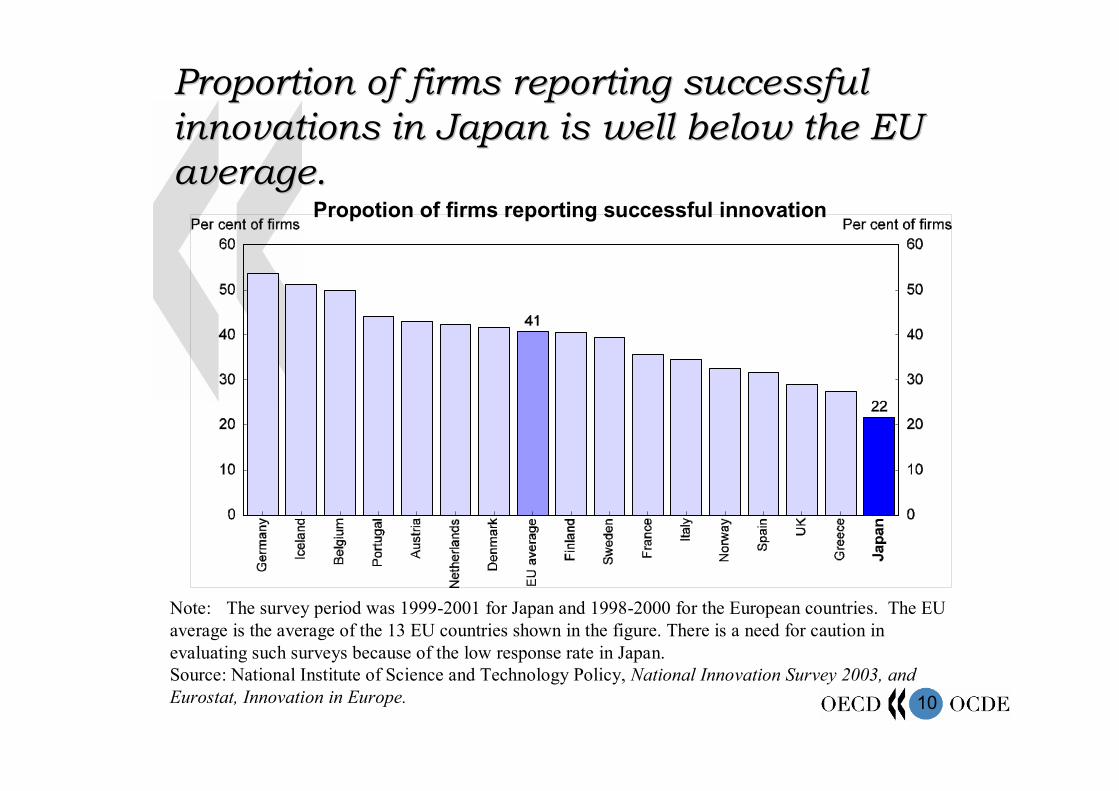
Proportion of firms reporting successful Proportion of firms reporting successful innovations in Japan is well below the EU innovations in Japan is well below the EU average.average.
Propotion of firms reporting successful innovation
Note: The survey period was 1999-2001 for Japan and 1998-2000 for the European countries. The EU average is the average of the 13 EU countries shown in the figure. There is a need for caution in evaluating such surveys because of the low response rate in Japan.Source: National Institute of Science and Technology Policy, National Innovation Survey 2003, and Eurostat, Innovation in Europe.
1111
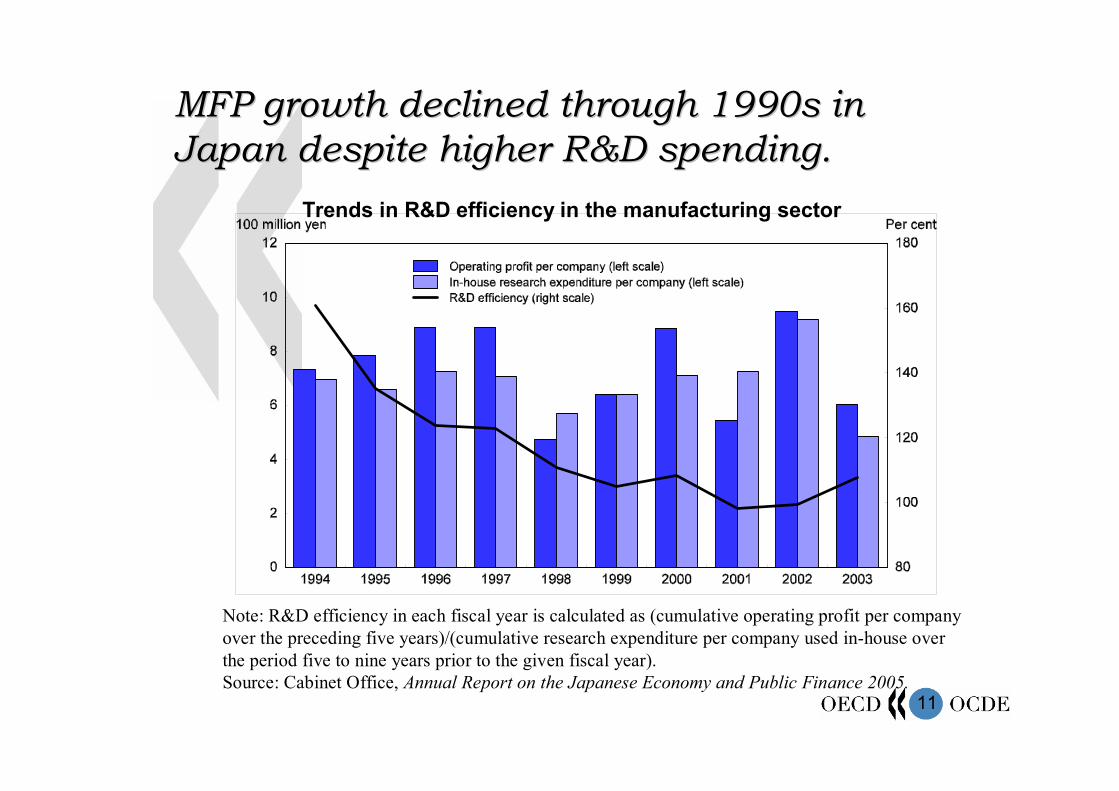
MFP growth declined through 1990s in MFP growth declined through 1990s in Japan despite higher R&D spending.Japan despite higher R&D spending.
Trends in R&D efficiency in the manufacturing sector
Note: R&D efficiency in each fiscal year is calculated as (cumulative operating profit per company over the preceding five years)/(cumulative research expenditure per company used in-house over the period five to nine years prior to the given fiscal year). Source: Cabinet Office, Annual Report on the Japanese Economy and Public Finance 2005.
1212
Key Issue for Japan:
How to extract economic values from high level of R&D investment in Japan
How to modify closed and self-contained innovation system in Japan
1313
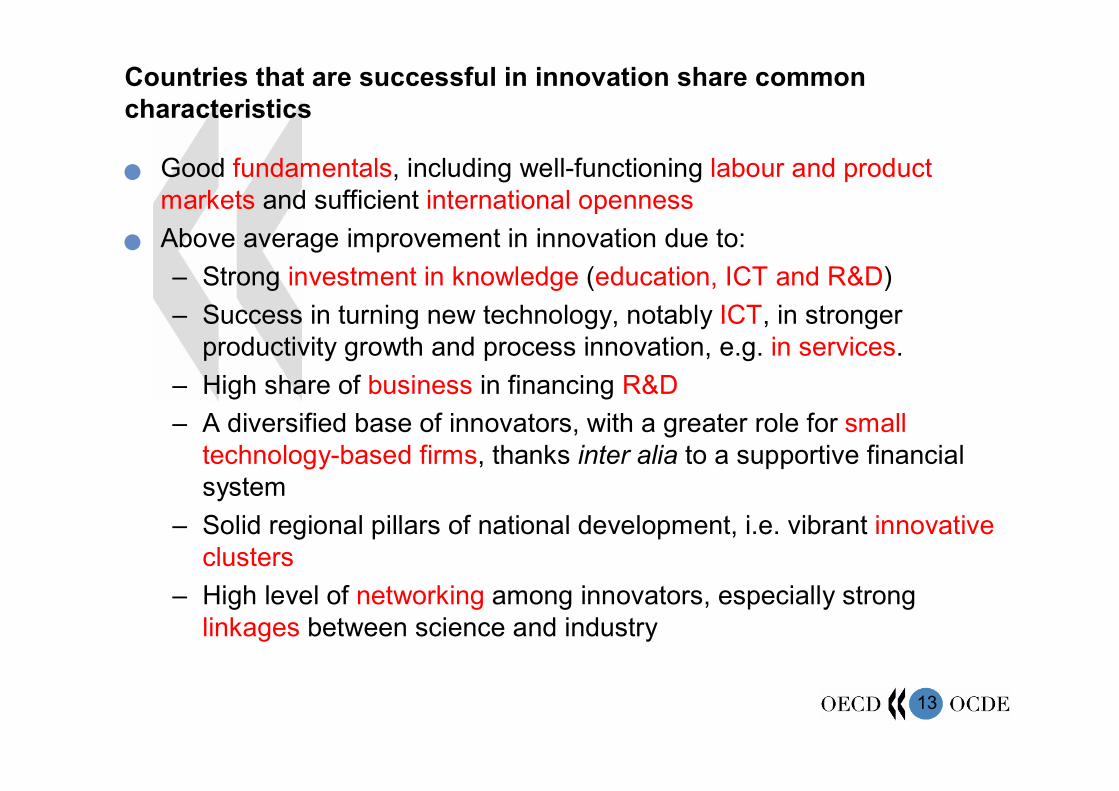
Countries that are successful in innovation share common characteristics
Good fundamentals, including well-functioning labour and product markets and sufficient international openness
Above average improvement in innovation due to:– Strong investment in knowledge (education, ICT and R&D)– Success in turning new technology, notably ICT, in stronger
productivity growth and process innovation, e.g. in services.– High share of business in financing R&D– A diversified base of innovators, with a greater role for small
technology-based firms, thanks inter alia to a supportive financial system
– Solid regional pillars of national development, i.e. vibrant innovative clusters
– High level of networking among innovators, especially strong linkages between science and industry
1414
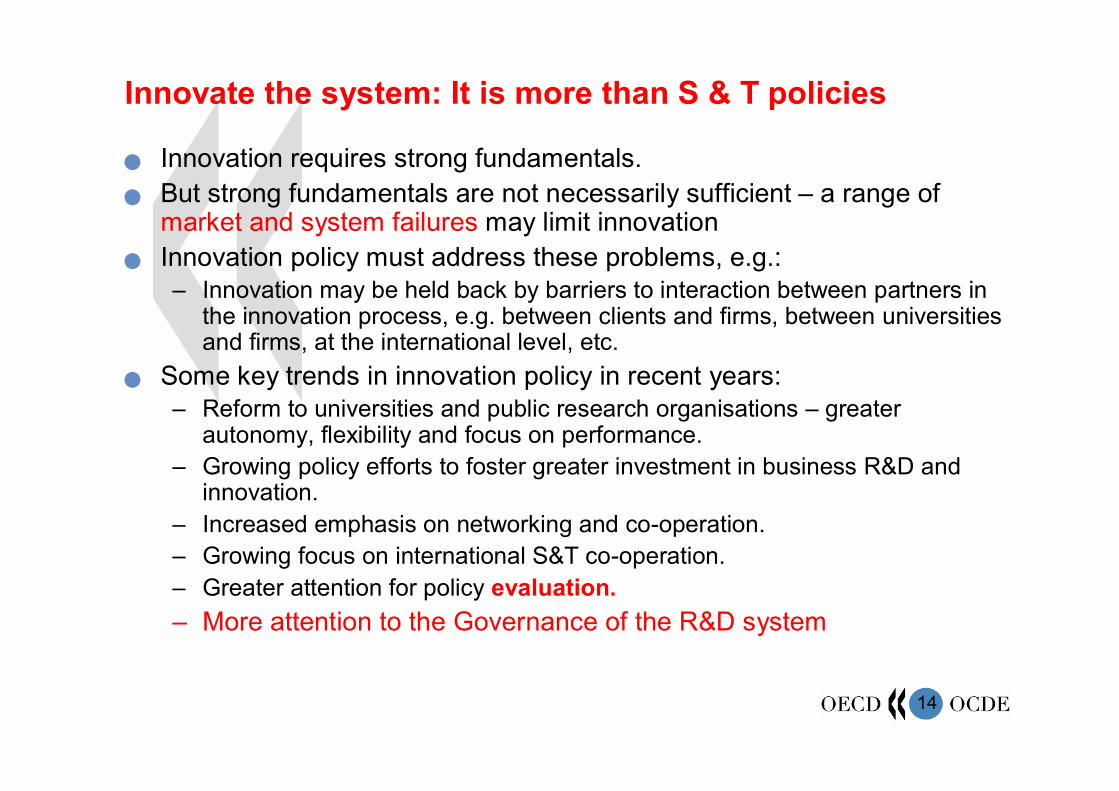
Innovate the system: It is more than S & T policies
Innovation requires strong fundamentals. But strong fundamentals are not necessarily sufficient – a range of
market and system failures may limit innovation Innovation policy must address these problems, e.g.:
– Innovation may be held back by barriers to interaction between partners in the innovation process, e.g. between clients and firms, between universities and firms, at the international level, etc.
Some key trends in innovation policy in recent years:– Reform to universities and public research organisations – greater
autonomy, flexibility and focus on performance.– Growing policy efforts to foster greater investment in business R&D and
innovation.– Increased emphasis on networking and co-operation.– Growing focus on international S&T co-operation.– Greater attention for policy evaluation.– More attention to the Governance of the R&D system
1515
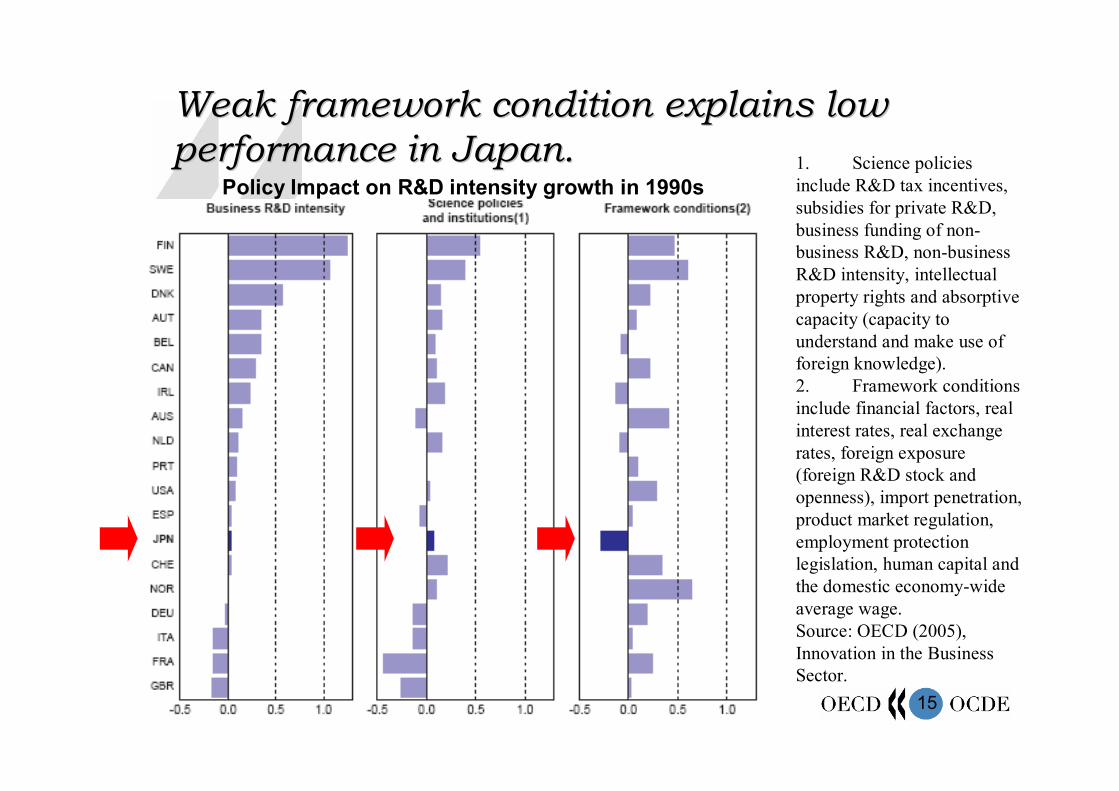
Weak framework condition explains low Weak framework condition explains low performance in Japan.performance in Japan.
Policy Impact on R&D intensity growth in 1990s1. Science policies include R&D tax incentives, subsidies for private R&D, business funding of non-business R&D, non-business R&D intensity, intellectual property rights and absorptive capacity (capacity to understand and make use of foreign knowledge).2. Framework conditions include financial factors, real interest rates, real exchange rates, foreign exposure (foreign R&D stock and openness), import penetration, product market regulation, employment protection legislation, human capital and the domestic economy-wide average wage.Source: OECD (2005), Innovation in the Business Sector.
1616
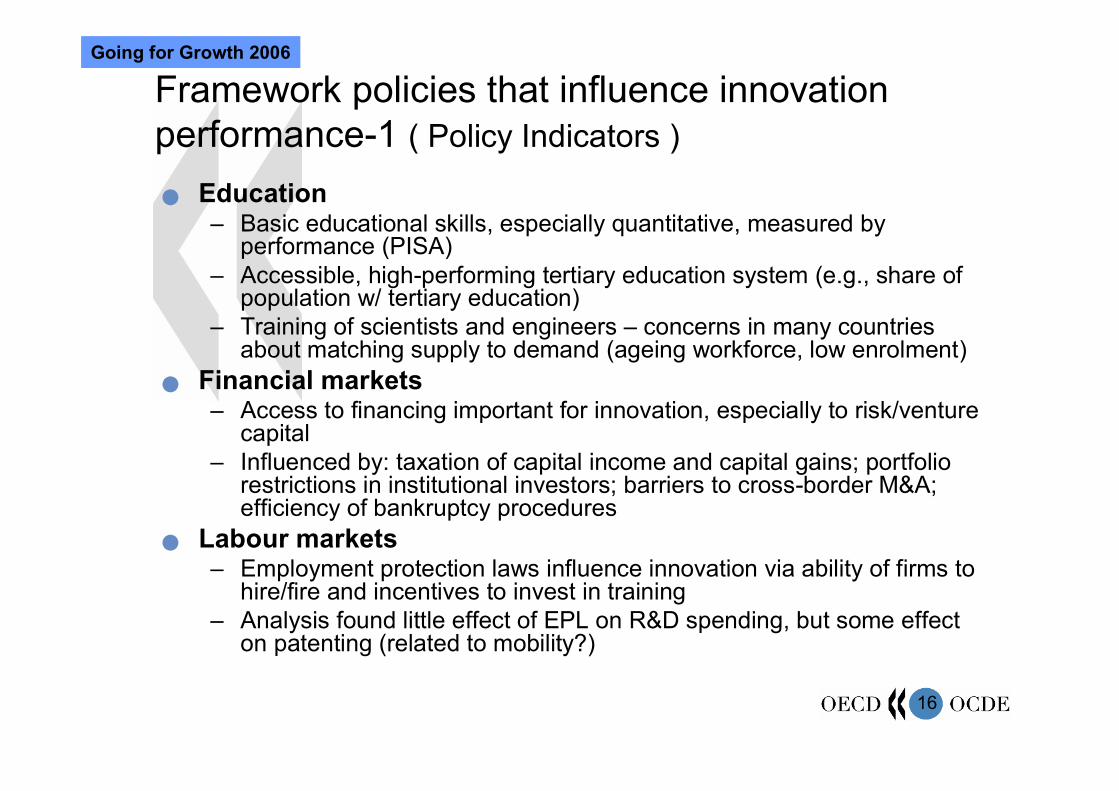
Framework policies that influence innovation performance-1 ( Policy Indicators )
Education– Basic educational skills, especially quantitative, measured by
performance (PISA)– Accessible, high-performing tertiary education system (e.g., share of
population w/ tertiary education)– Training of scientists and engineers – concerns in many countries
about matching supply to demand (ageing workforce, low enrolment) Financial markets
– Access to financing important for innovation, especially to risk/venture capital
– Influenced by: taxation of capital income and capital gains; portfolio restrictions in institutional investors; barriers to cross-border M&A; efficiency of bankruptcy procedures
Labour markets– Employment protection laws influence innovation via ability of firms to
hire/fire and incentives to invest in training – Analysis found little effect of EPL on R&D spending, but some effect
on patenting (related to mobility?)
Going for Growth 2006
1717
300 350 400 450 500 550 600
Hong Kong-ChinaFinlandKorea
NetherlandsLiechtenstein
JapanCanada
BelgiumMacao-ChinaSw itzerland
AustraliaNew Zealand
Czech Rep.Iceland
DenmarkFrance
SwedenAustria
GermanyIreland
Slovak Rep.Norway
LuxembourgPoland
HungarySpainLatvia
USARussian Fed
PortugalItaly
GreeceSerbia
TurkeyUruguayThailandMexico
IndonesiaTunisiaBrazil
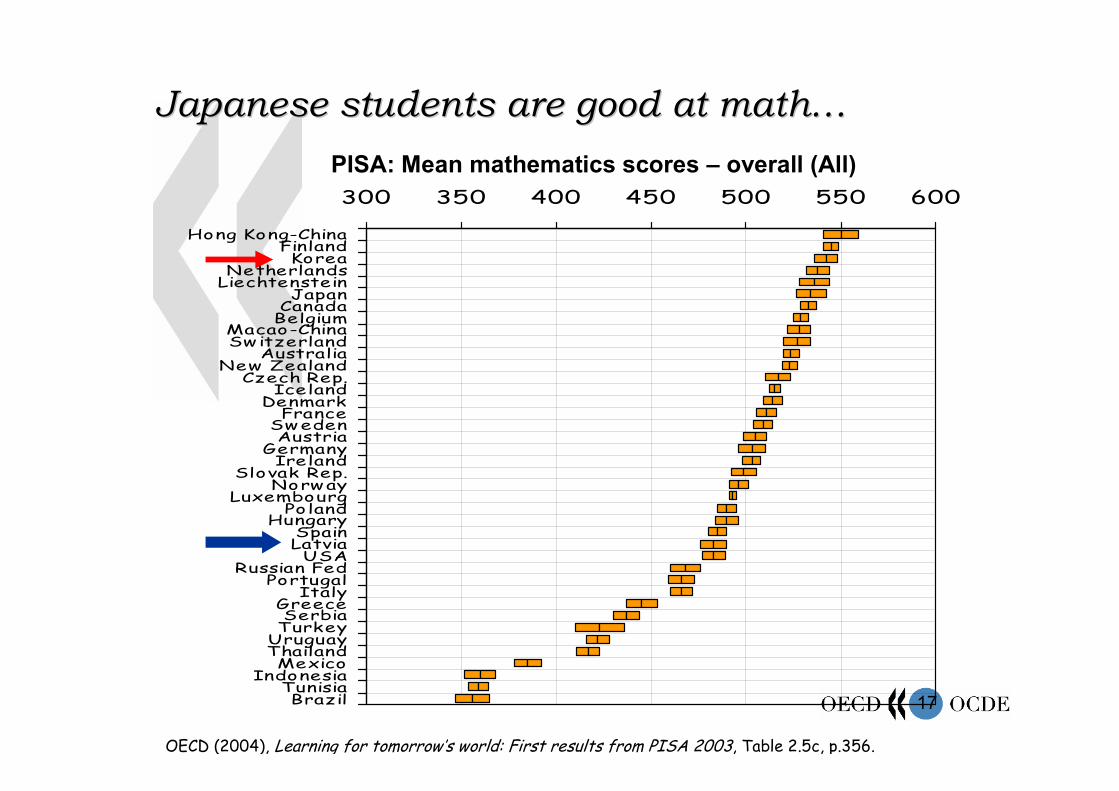
OECD (2004), Learning for tomorrow’s world: First results from PISA 2003, Table 2.5c, p.356.
PISA: Mean mathematics scores – overall (All)
Japanese students are good at mathJapanese students are good at math……

1818
TOEFL CBT Score Means
100 150 200 250 300
SingaporeIndia
PakistanPhilippines
SriLankaBangladesh
MalaysiaNepal
AzerbaijanKazakhstanKyrgyzstan
TajikistanHongKongUzbekistan
IndonesiaMyanmar
TurkmenistanChina
S.KoreaAfganistan205
VietnamLaos
MacauTaiwan
ThailandCambodia
MongoliaJapan
N.Korea
Asi
an C
ount
ries
1999-002003-04
Ex. France=236, Italy=217, Germany=253 (2003-4)
TOFEL CBT Score Means
……but weak in English.but weak in English.
1919
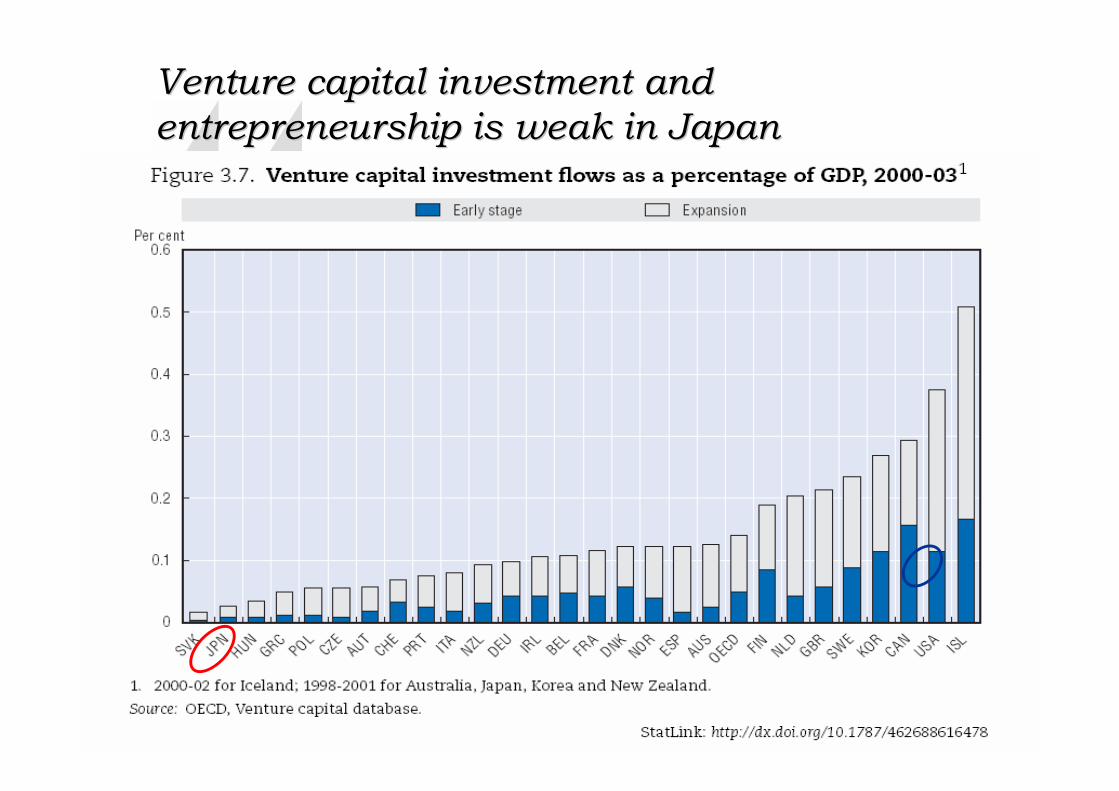
Venture capital investment and Venture capital investment and entrepreneurship is weak in Japanentrepreneurship is weak in Japan
2020
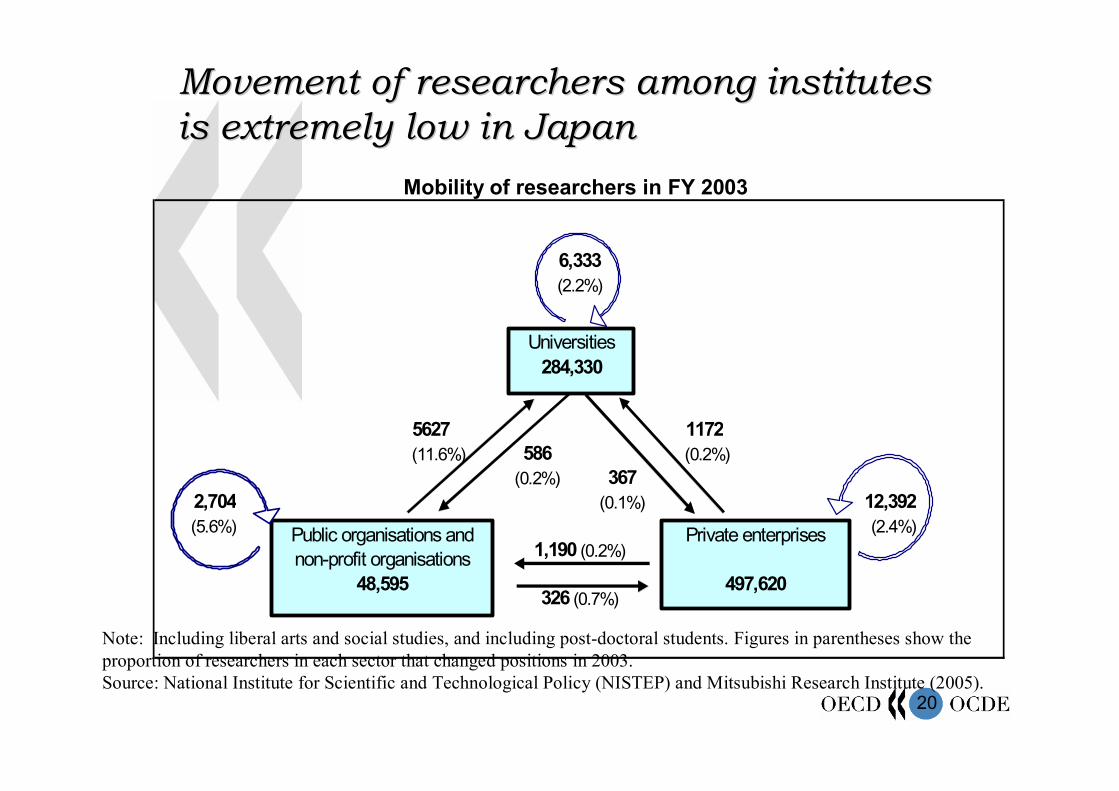
5627 1172(11.6%) 586 (0.2%)
(0.2%) 3672,704 (0.1%) 12,392(5.6%) (2.4%)
326 (0.7%)
6,333(2.2%)
1,190 (0.2%)
Universities284,330
Public organisations andnon-profit organisations
48,595
Private enterprises
497,620
Note: Including liberal arts and social studies, and including post-doctoral students. Figures in parentheses show the proportion of researchers in each sector that changed positions in 2003.Source: National Institute for Scientific and Technological Policy (NISTEP) and Mitsubishi Research Institute (2005).
Movement of researchers among institutes Movement of researchers among institutes is extremely low in Japanis extremely low in Japan
Mobility of researchers in FY 2003
2121
Framework policies that influence innovation performance-2 ( Policy Indicators )
Openness and restrictions on FDI– Foreign R&D makes large contribution to productivity growth– Multiple channels: FDI, international mobility of human resources,
participation of foreign firms/researchers in R&D programmes, etc.
– Openness influenced by FDI regulations and active support for mobility and engagement in international networks of innovation where appropriate.
Product market competition and IPR– Strong PMR encourages investments in innovation to stay ahead
of competitors, but can weaken firm’s ability to appropriate returns– Strong IPR can enable firms to appropriate returns from
investment in innovation, but can foster monopoly positions– Issue is striking appropriate balance: stronger IPR with pro-
competition PMR is used in many well-performing countries; reverse in under-performing countries
– IPR measures must ensure quality of patents and promote diffsion(e.g., through licensing, research access).
Going for Growth 2006
2222
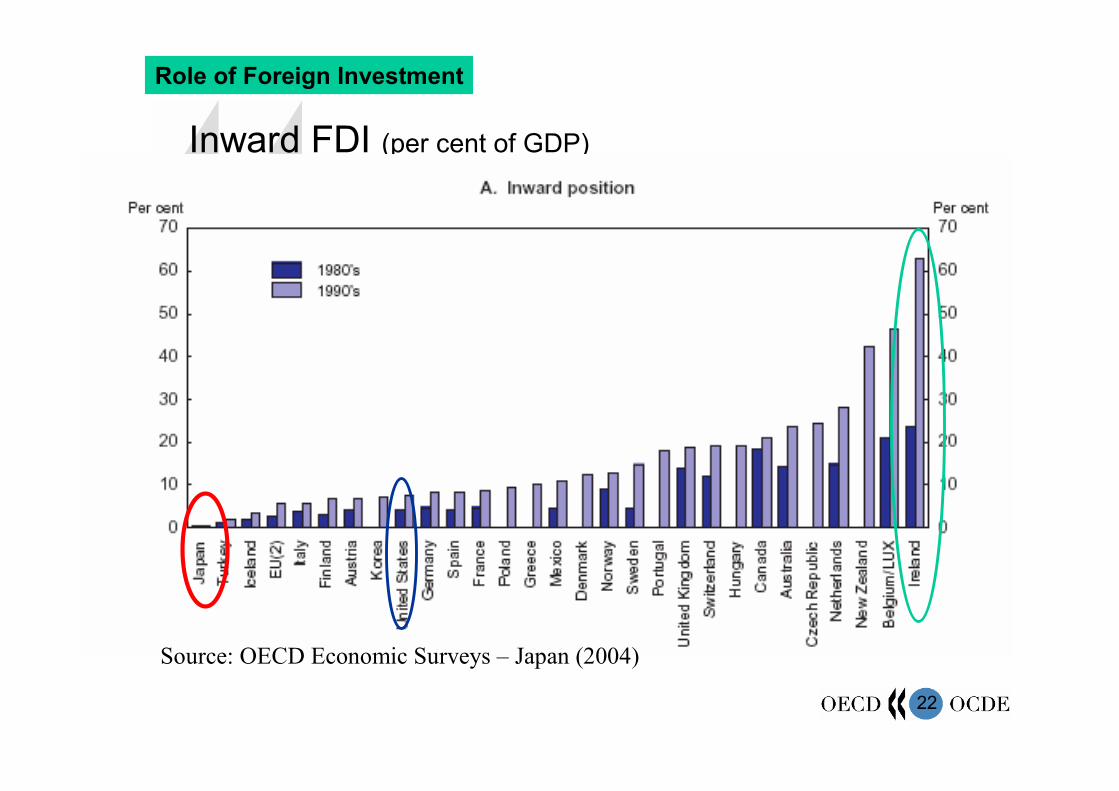
Inward FDI (per cent of GDP)
Source: OECD Economic Surveys – Japan (2004)
Role of Foreign Investment
2323
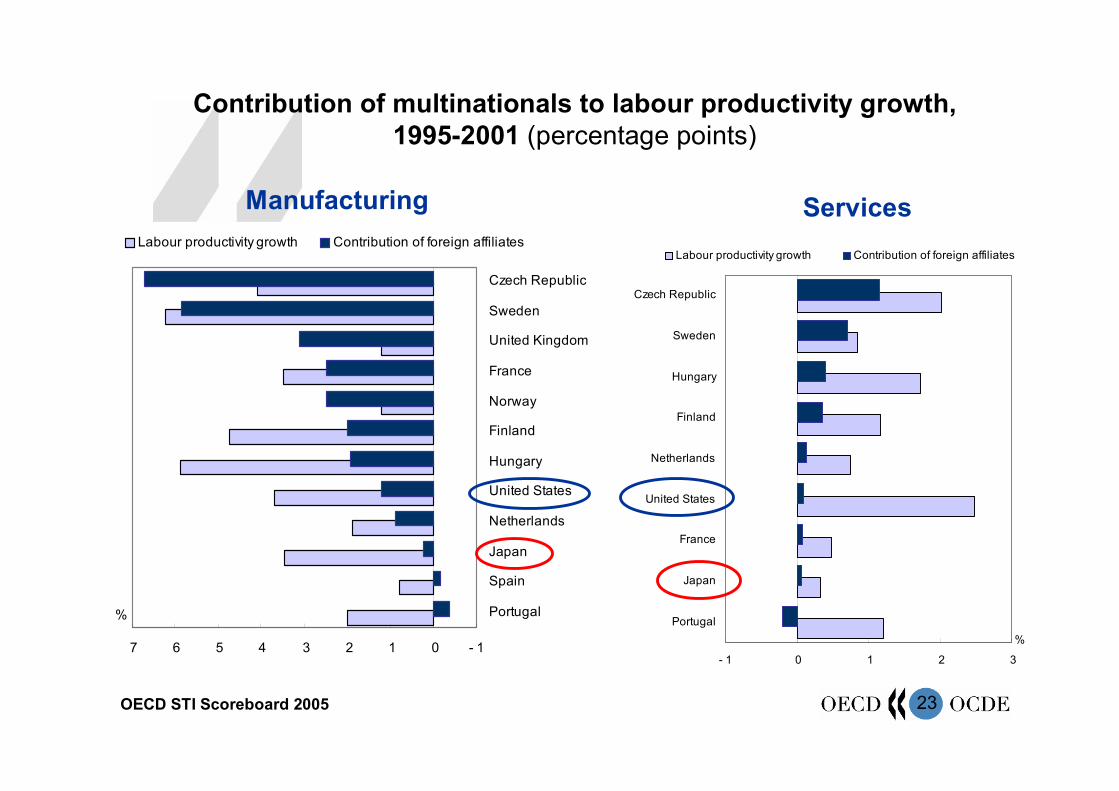
Contribution of multinationals to labour productivity growth, 1995-2001 (percentage points)
- 1 0 1 2 3 4 5 6 7
Portugal
Spain
Japan
Netherlands
United States
Hungary
Finland
Norway
France
United Kingdom
Sweden
Czech Republic
%
Labour productivity growth Contribution of foreign affiliates
- 1 0 1 2 3
Portugal
Japan
France
United States
Netherlands
Finland
Hungary
Sweden
Czech Republic
%
Labour productivity growth Contribution of foreign affiliates
Manufacturing Services
OECD STI Scoreboard 2005
2424
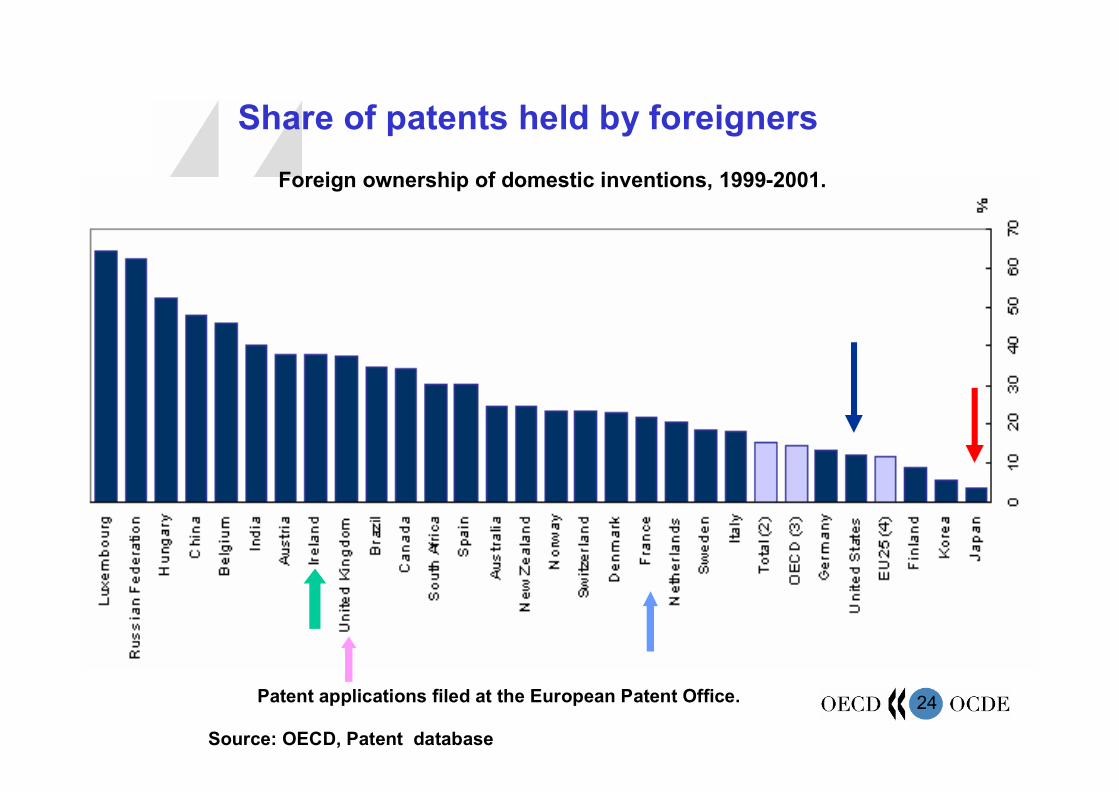
Foreign ownership of domestic inventions, 1999-2001.
Patent applications filed at the European Patent Office.
Share of patents held by foreigners
Source: OECD, Patent database
2525
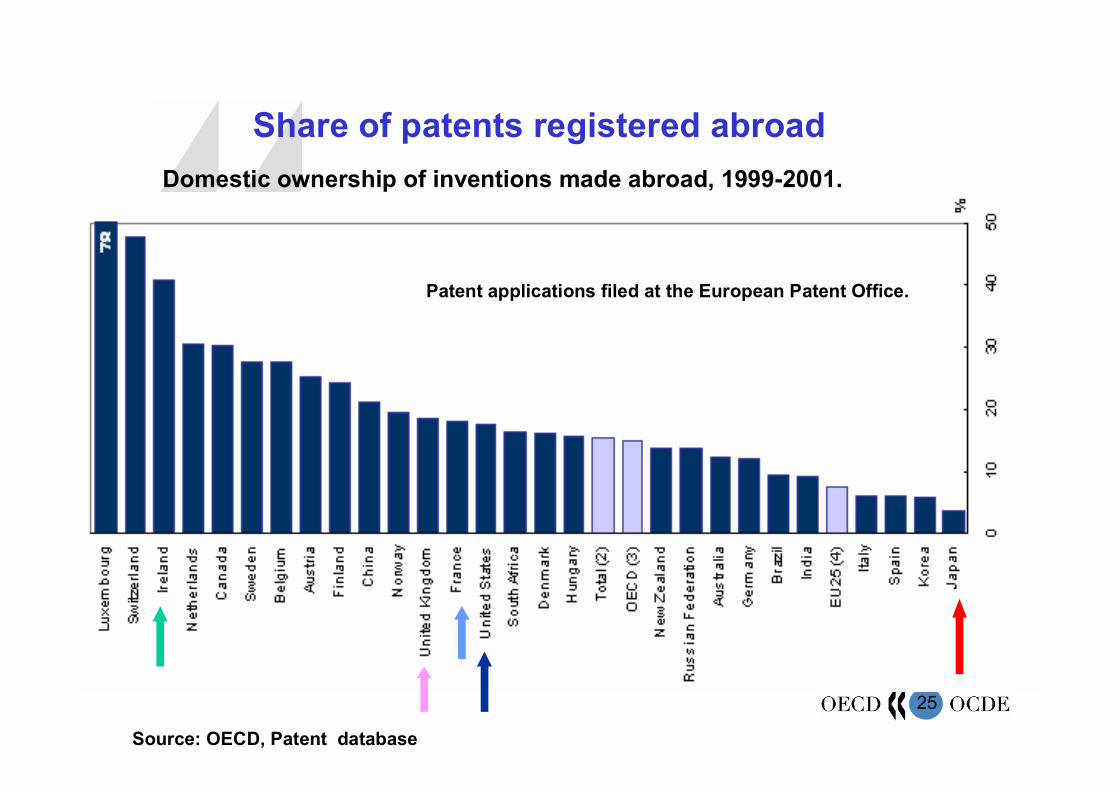
Domestic ownership of inventions made abroad, 1999-2001.
Patent applications filed at the European Patent Office.
Share of patents registered abroad
Source: OECD, Patent database
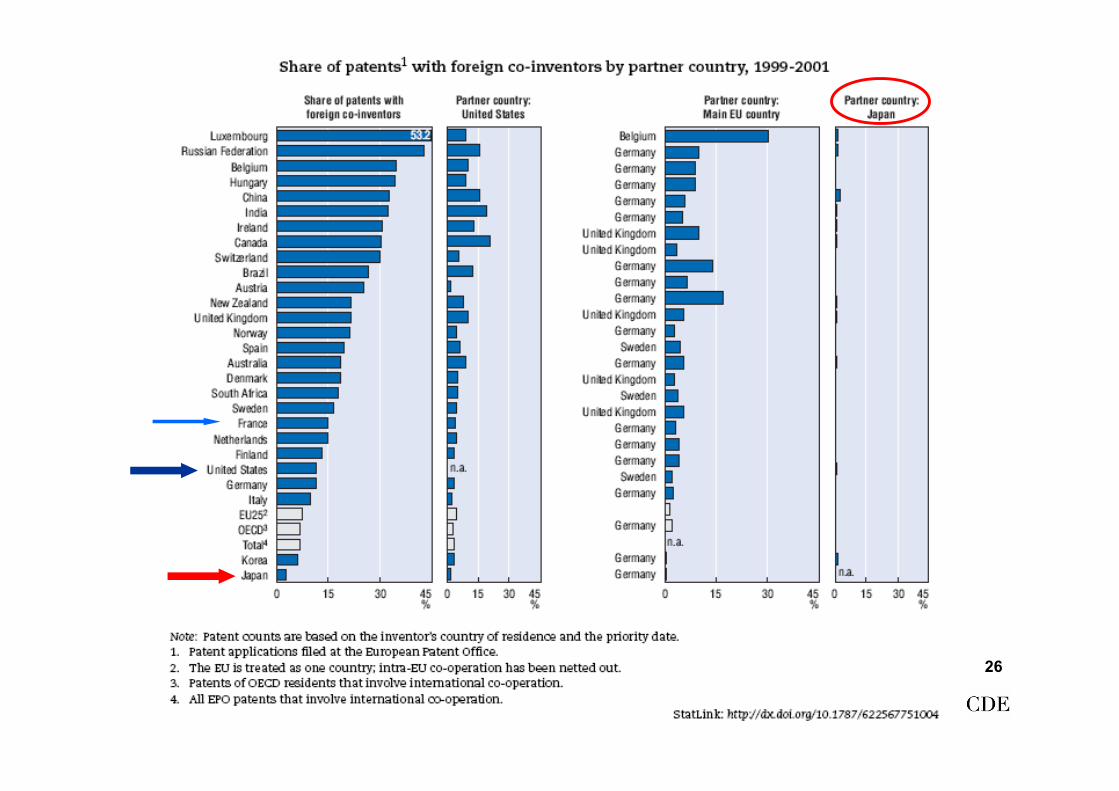
2626
26

2727
Highly skilled MigrantsImmigrants as a % of highly skilled native population
Emigrants as a % of highly skilled in the country of origin
Main Destinations
OECD STI Scoreboard 2005
27
2828
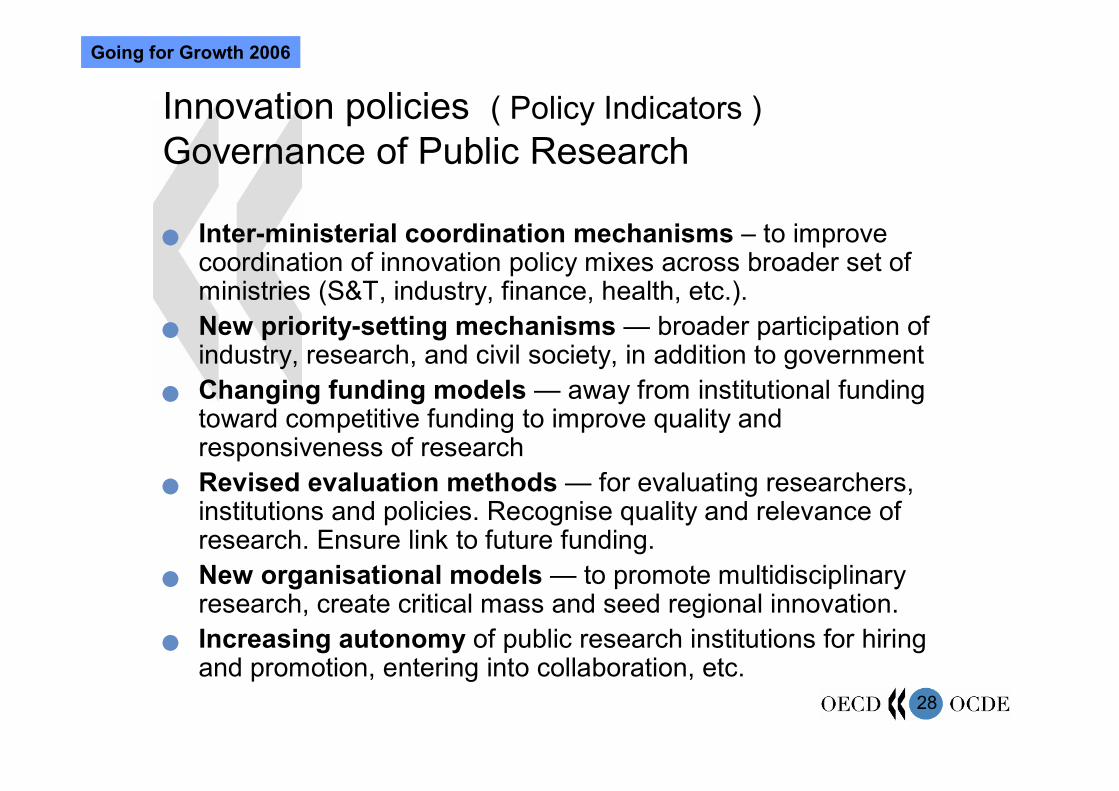
Innovation policies ( Policy Indicators )Governance of Public Research
Inter-ministerial coordination mechanisms – to improve coordination of innovation policy mixes across broader set of ministries (S&T, industry, finance, health, etc.).
New priority-setting mechanisms — broader participation of industry, research, and civil society, in addition to government
Changing funding models — away from institutional funding toward competitive funding to improve quality and responsiveness of research
Revised evaluation methods — for evaluating researchers, institutions and policies. Recognise quality and relevance of research. Ensure link to future funding.
New organisational models — to promote multidisciplinary research, create critical mass and seed regional innovation.
Increasing autonomy of public research institutions for hiring and promotion, entering into collaboration, etc.
Going for Growth 2006
2929
Innovation policies ( Policy Indicators )Industry-Science Linkage
Importance to innovation– Improve match between public research and industry needs– Facilitate transfer of knowledge/technology to industry
Multiple channels– Informal: publications, hiring of university graduates– Formalised: licensing of inventions, spin-offs from public research
organisations, collaborative research, public/private partnerships Policy measures
– Reforms governing the ownership of IPR resulting from publicly funded research.
– Funding for commercialisation of public-sector technology and/or support of technology transfer offices
– Establishment of public/private partnerships to share cost, risks and jointly determine objectives
Going for Growth 2006
3030
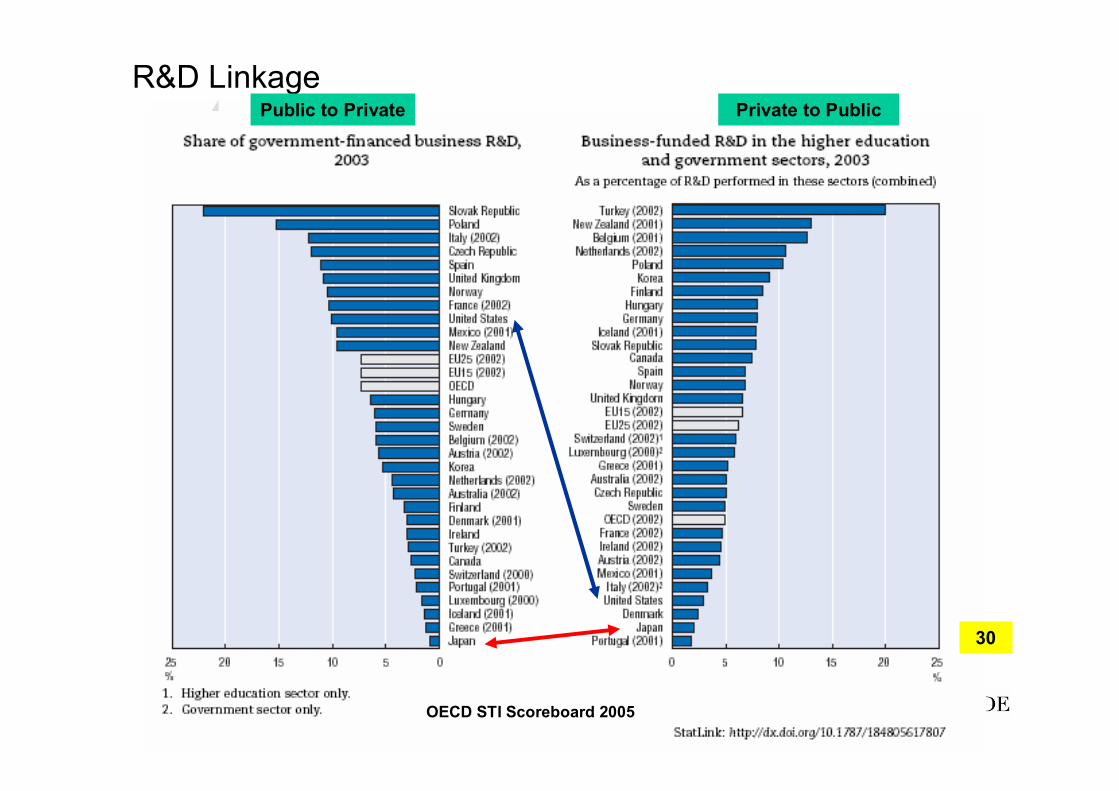
R&D Linkage
30
Public to Private Private to Public
OECD STI Scoreboard 2005
3131
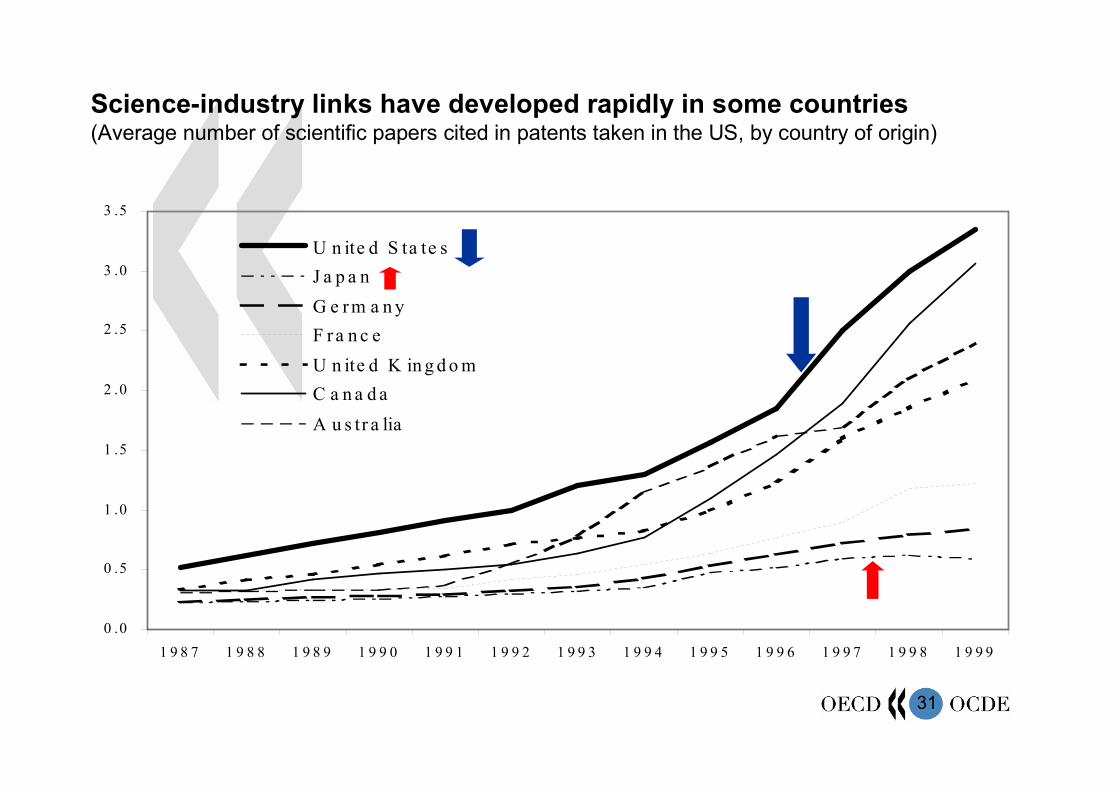
Science-industry links have developed rapidly in some countries(Average number of scientific papers cited in patents taken in the US, by country of origin)
0 .0
0 .5
1 .0
1 .5
2 .0
2 .5
3 .0
3 .5
1 9 8 7 1 9 8 8 1 9 8 9 1 9 9 0 1 9 9 1 1 9 9 2 1 9 9 3 1 9 9 4 1 9 9 5 1 9 9 6 1 9 9 7 1 9 9 8 1 9 9 9
U n ite d S ta te sJ a p a nG e r m a n yF r a n c eU n ite d K in g d o mC a n a d aA u s tr a lia
3232
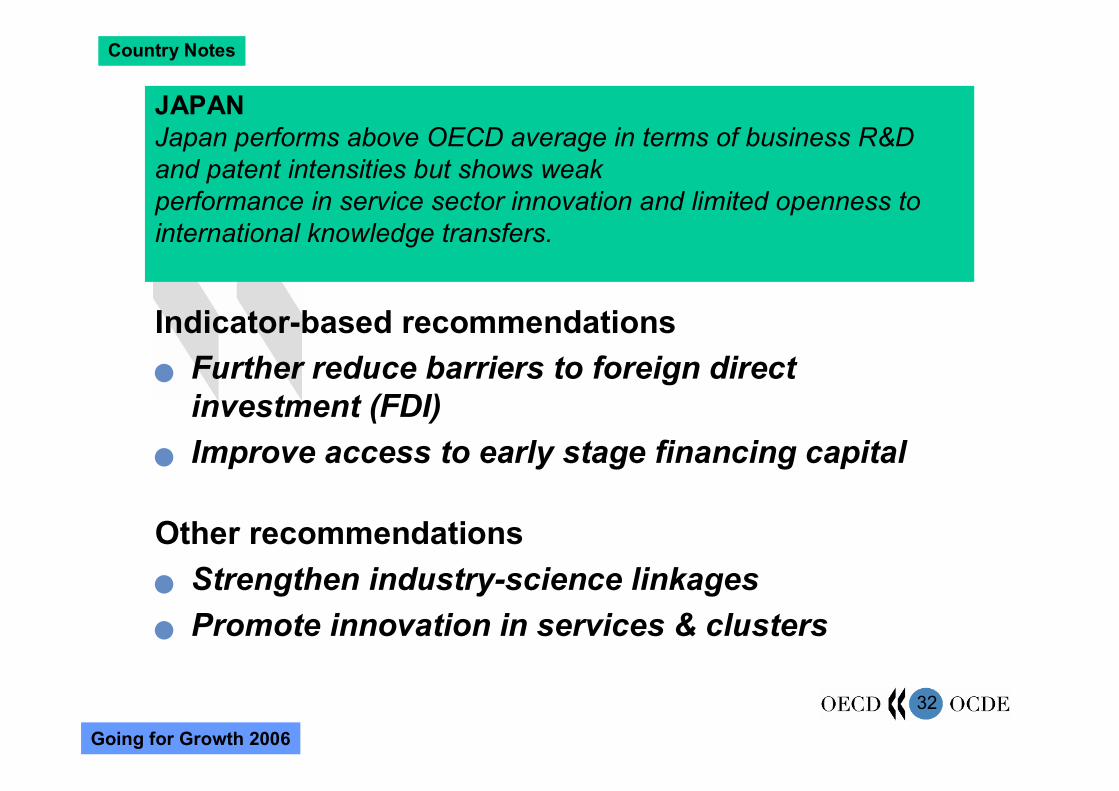
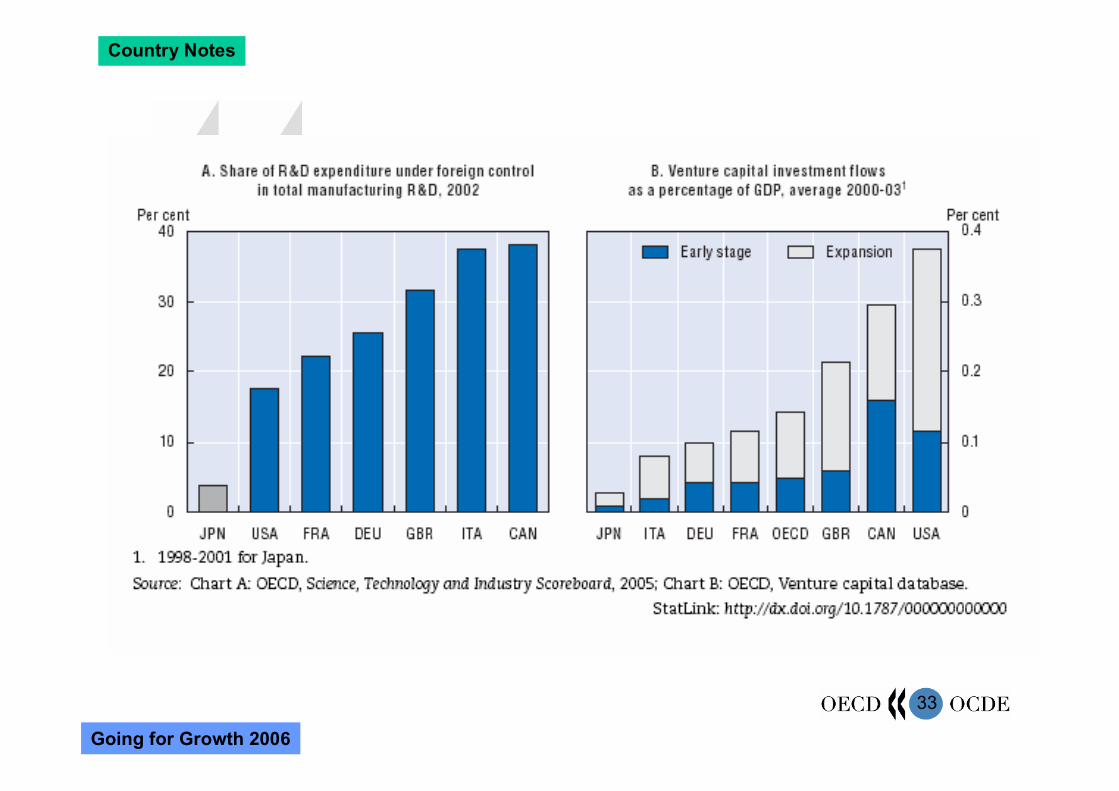
JAPANJapan performs above OECD average in terms of business R&D and patent intensities but shows weakperformance in service sector innovation and limited openness tointernational knowledge transfers.
Indicator-based recommendations Further reduce barriers to foreign direct
investment (FDI) Improve access to early stage financing capital
Country Notes
Other recommendations Strengthen industry-science linkages Promote innovation in services & clusters
Going for Growth 2006
3333
Country Notes
Going for Growth 2006
3434
Key Issue for Japan:
How to extract economic values from high level of R&D investment in Japan
Market Institution Building for Intellectual Asset-based Management
How to modify closed and self-contained innovation system in Japan
3535
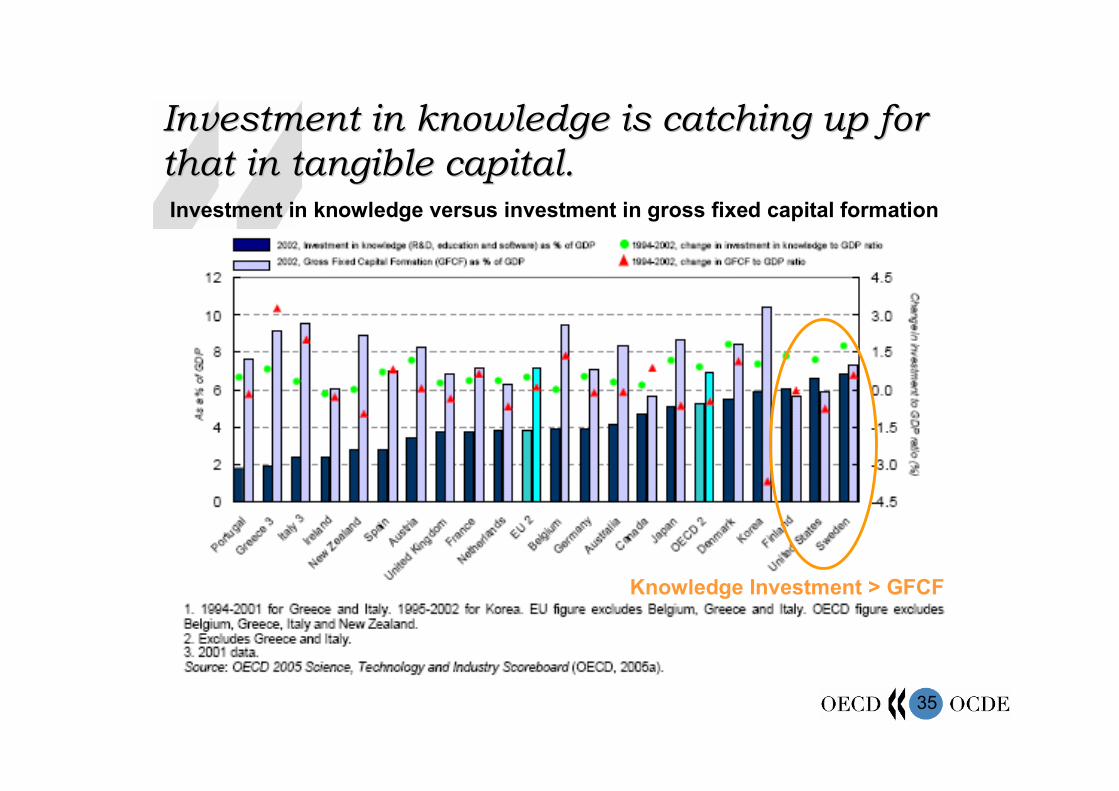
Investment in knowledge is catching up for Investment in knowledge is catching up for that in tangible capital.that in tangible capital.Investment in knowledge versus investment in gross fixed capital formation
Knowledge Investment > GFCF
3636
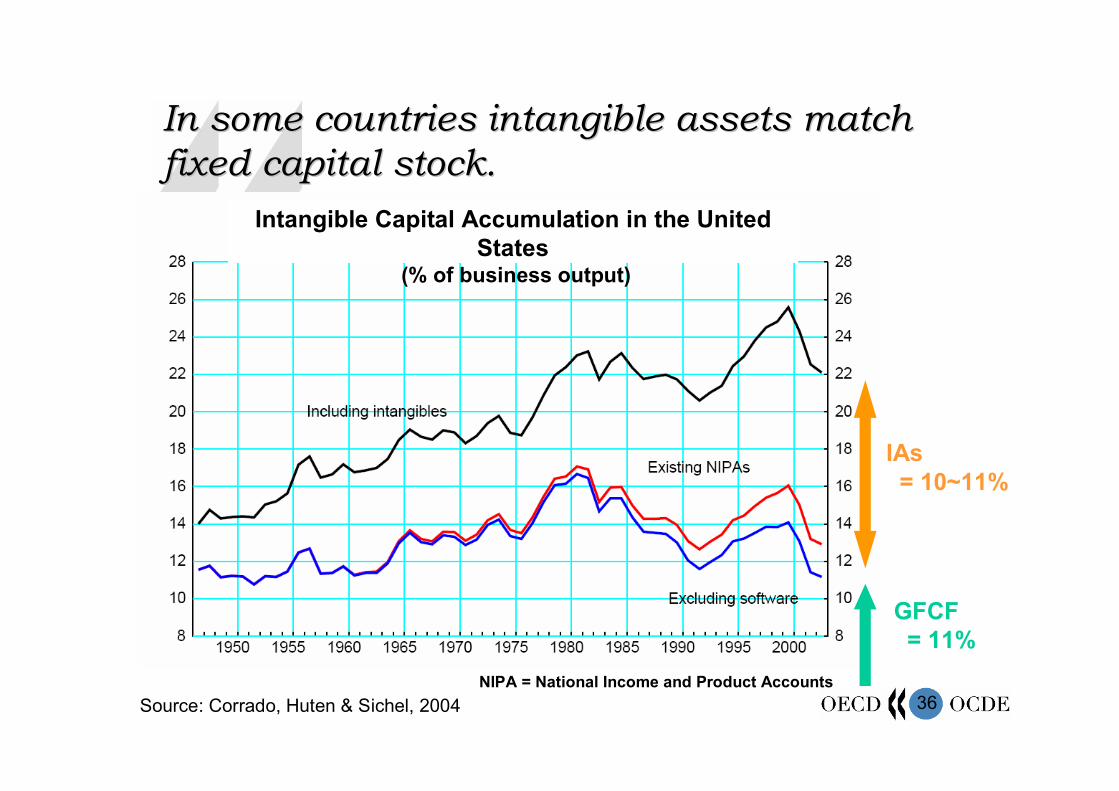
In some countries intangible assets match In some countries intangible assets match fixed capital stock.fixed capital stock.
Intangible Capital Accumulation in the United States
(% of business output)
IAs= 10~11%
GFCF= 11%
Source: Corrado, Huten & Sichel, 2004NIPA = National Income and Product Accounts
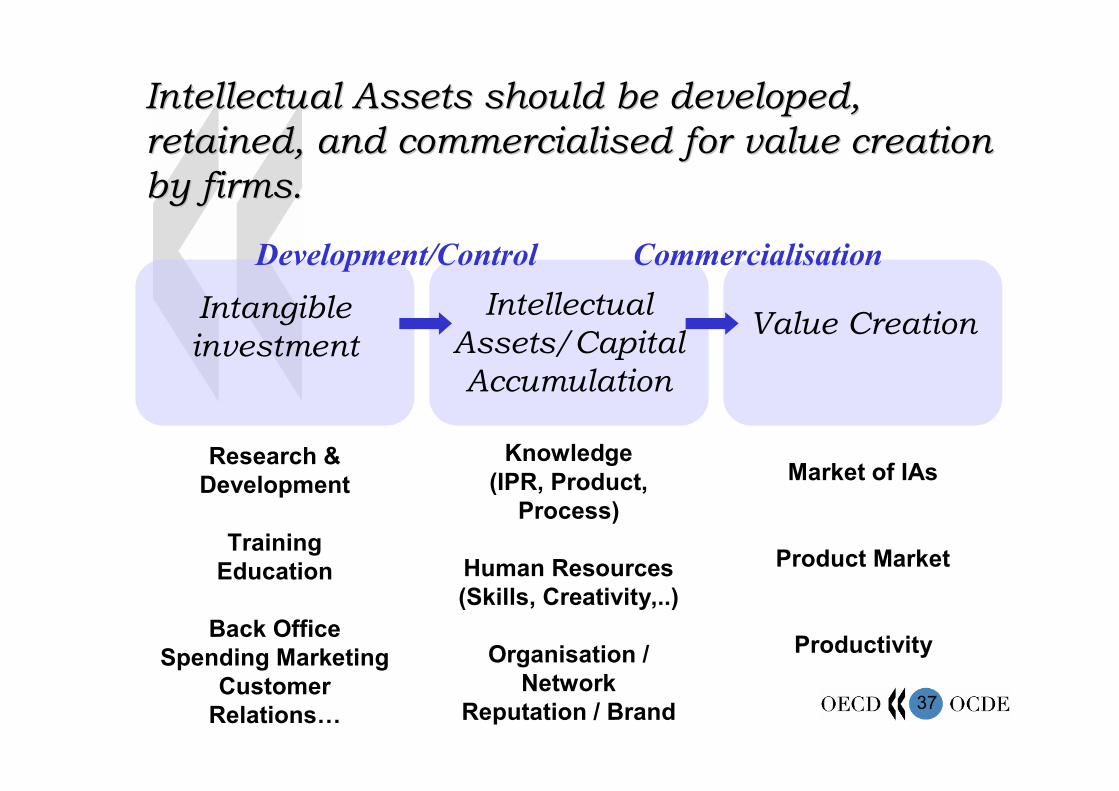
3737
Intangible investment
Research & Development
Training Education
Back Office Spending Marketing
Customer Relations…
Intellectual Assets/Capital Accumulation
Knowledge(IPR, Product,
Process)
Human Resources(Skills, Creativity,..)
Organisation / Network
Reputation / Brand
Value Creation
Market of IAs
Product Market
Productivity
Development/Control Commercialisation
Intellectual Assets should be developed, Intellectual Assets should be developed, retained, and commercialised for value creation retained, and commercialised for value creation by firms.by firms.
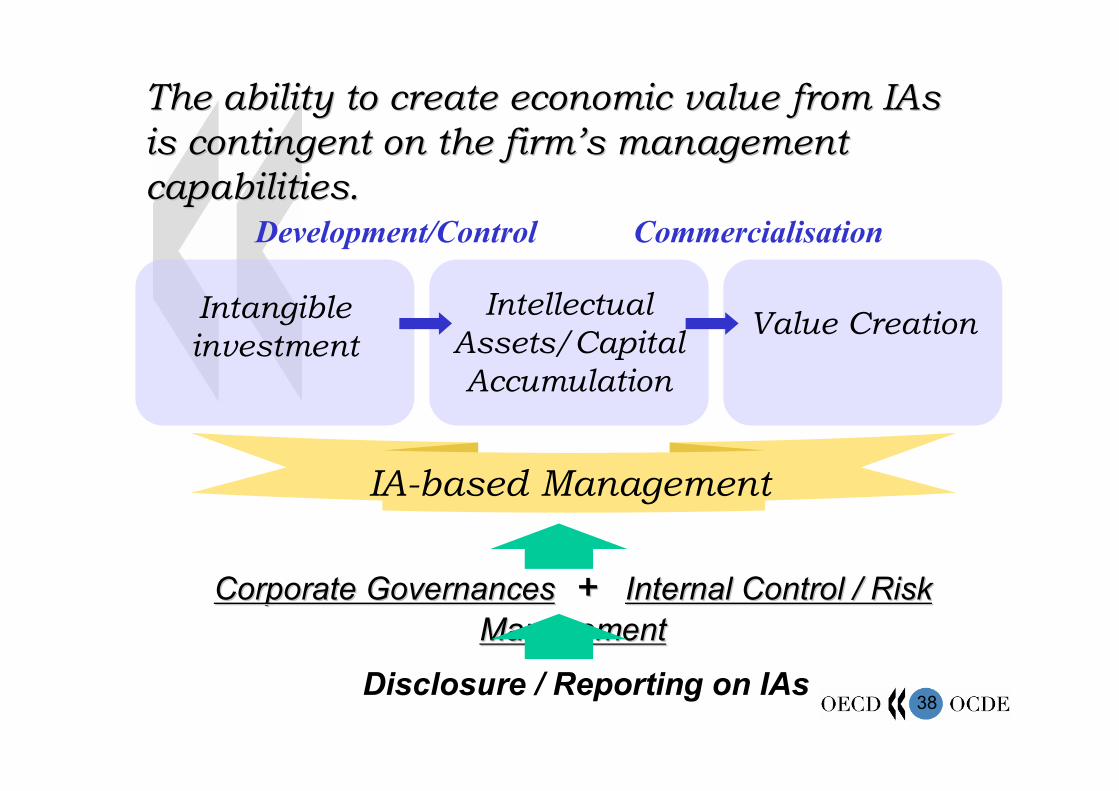
3838
Intangible investment
Intellectual Assets/Capital Accumulation
Value Creation
Development/Control Commercialisation
The ability to create economic value from The ability to create economic value from IAsIAsis contingent on the firmis contingent on the firm’’s management s management capabilities.capabilities.
IA-based Management
Corporate GovernancesCorporate Governances ++ Internal Control / Risk Internal Control / Risk ManagementManagement
Disclosure / Reporting on IAs
3939
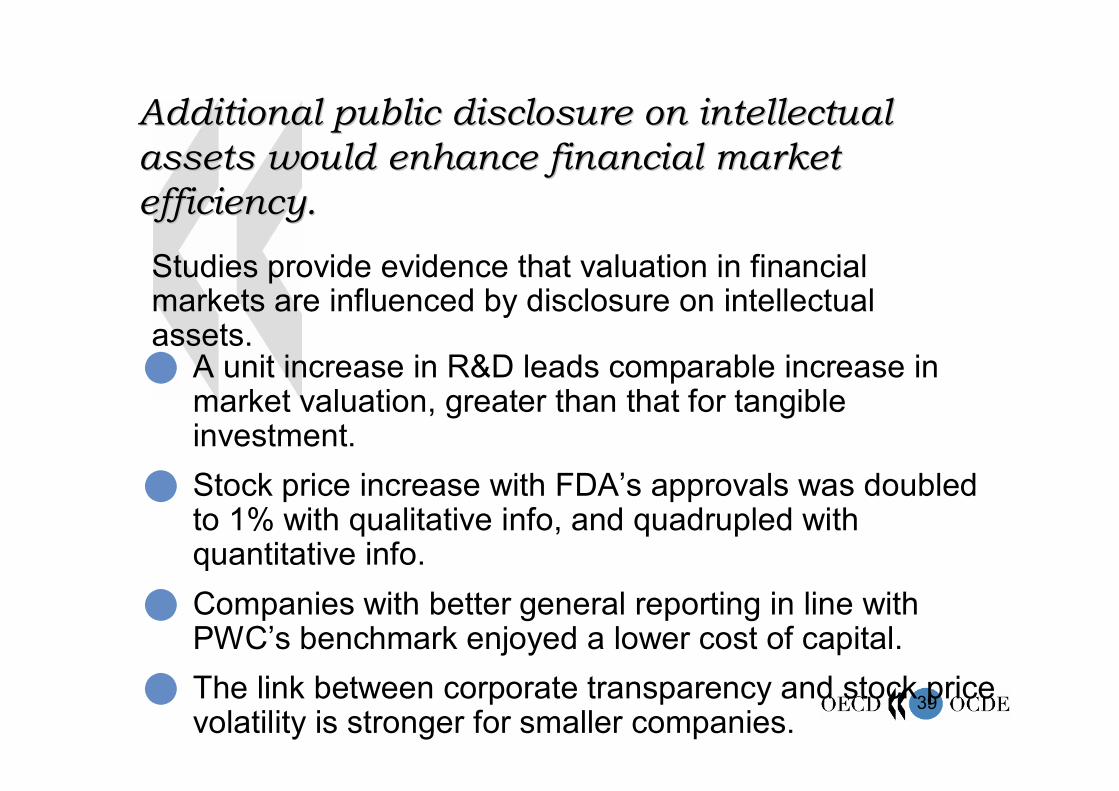
Additional public disclosure on intellectual Additional public disclosure on intellectual assets would enhance financial market assets would enhance financial market efficiency. efficiency.
A unit increase in R&D leads comparable increase in market valuation, greater than that for tangible investment.
Stock price increase with FDA’s approvals was doubled to 1% with qualitative info, and quadrupled with quantitative info.
Companies with better general reporting in line with PWC’s benchmark enjoyed a lower cost of capital.
The link between corporate transparency and stock price volatility is stronger for smaller companies.
Studies provide evidence that valuation in financial markets are influenced by disclosure on intellectual assets.
4040
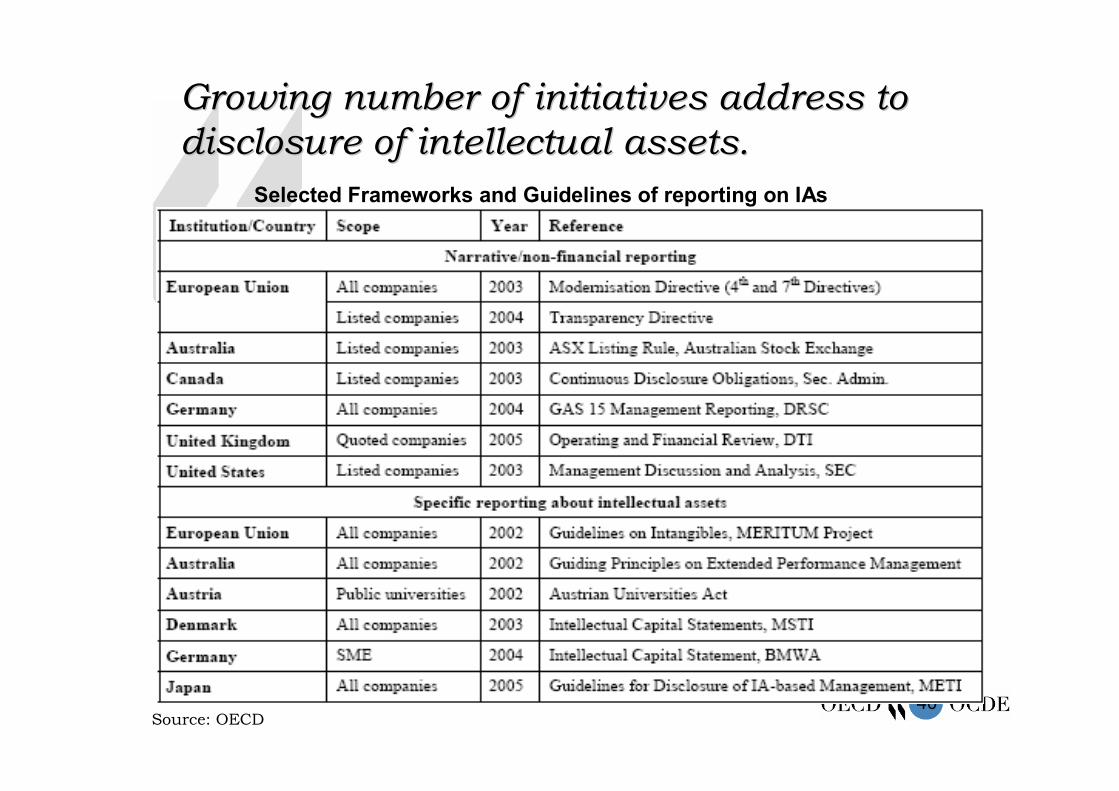
Growing number of initiatives address to Growing number of initiatives address to disclosure of intellectual assets.disclosure of intellectual assets.
Selected Frameworks and Guidelines of reporting on IAs
Source: OECD
4141
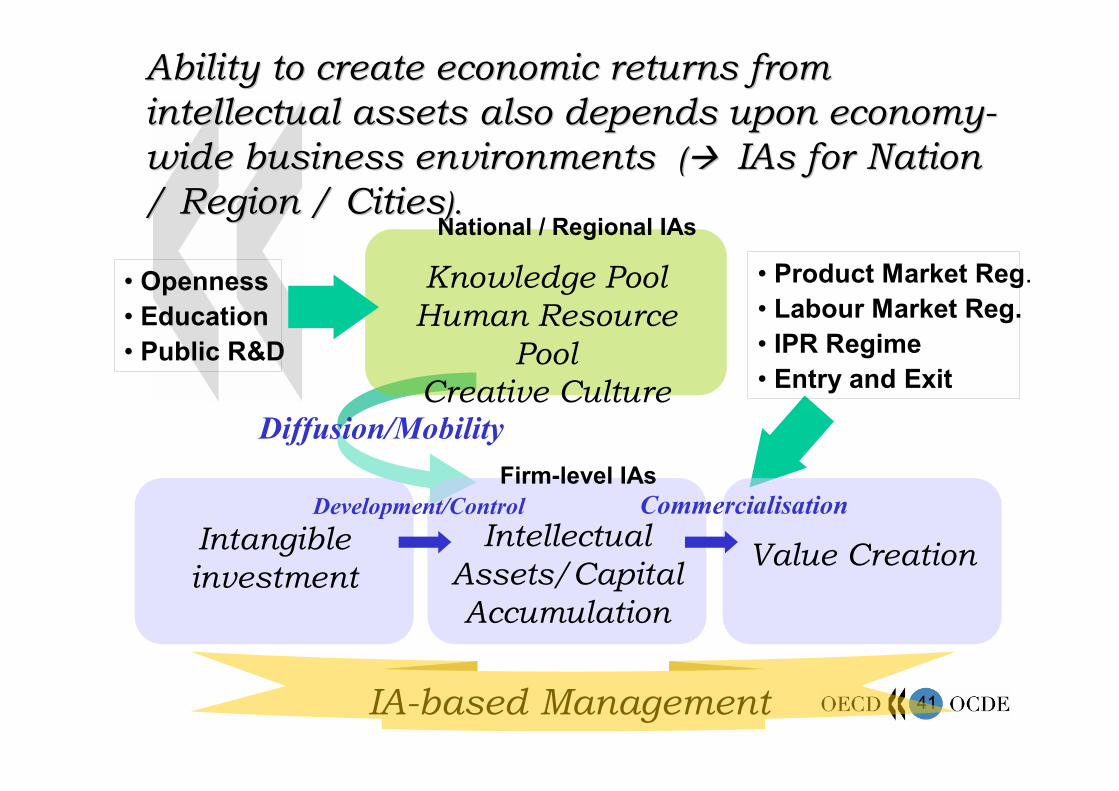
Intangible investment
Intellectual Assets/Capital Accumulation
Value Creation
Diffusion/Mobility
Commercialisation
Ability to create economic returns from Ability to create economic returns from intellectual assets also depends upon economyintellectual assets also depends upon economy--wide business environments wide business environments (( IAsIAs for Nation for Nation / Region / Cities/ Region / Cities).).
IA-based Management
• Product Market Reg.• Labour Market Reg.• IPR Regime• Entry and Exit
• Openness• Education• Public R&D
Knowledge PoolHuman Resource
PoolCreative Culture
National / Regional IAs
Development/ControlFirm-level IAs
4242
Key Issue for Japan:
How to extract economic values from high level of R&D investment in Japan
How to modify closed and self-contained innovation system in Japan
Further opening of Japanese Economy especially its Innovation System
4343
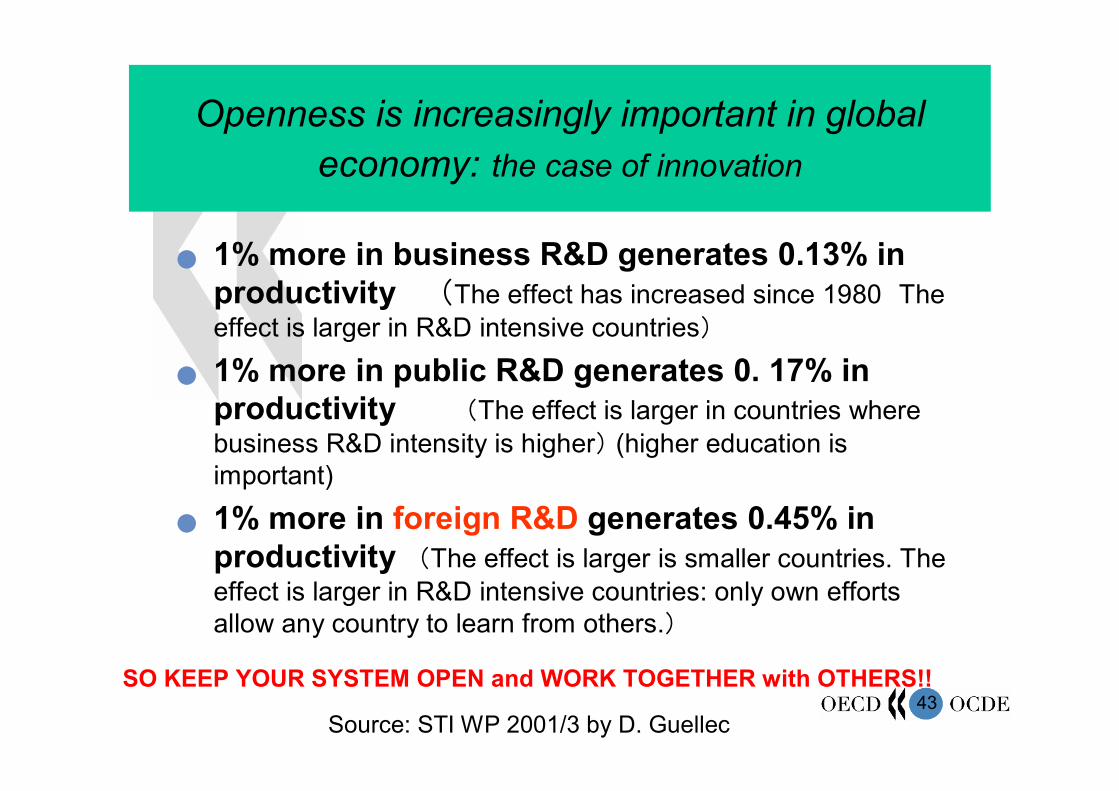
Openness is increasingly important in global economy: the case of innovation
Source: STI WP 2001/3 by D. Guellec
SO KEEP YOUR SYSTEM OPEN and WORK TOGETHER with OTHERS!!
1% more in business R&D generates 0.13% in productivity (The effect has increased since 1980 The effect is larger in R&D intensive countries)
1% more in public R&D generates 0. 17% in productivity (The effect is larger in countries where business R&D intensity is higher) (higher education is important)
1% more in foreign R&D generates 0.45% in productivity (The effect is larger is smaller countries. The effect is larger in R&D intensive countries: only own efforts allow any country to learn from others.)
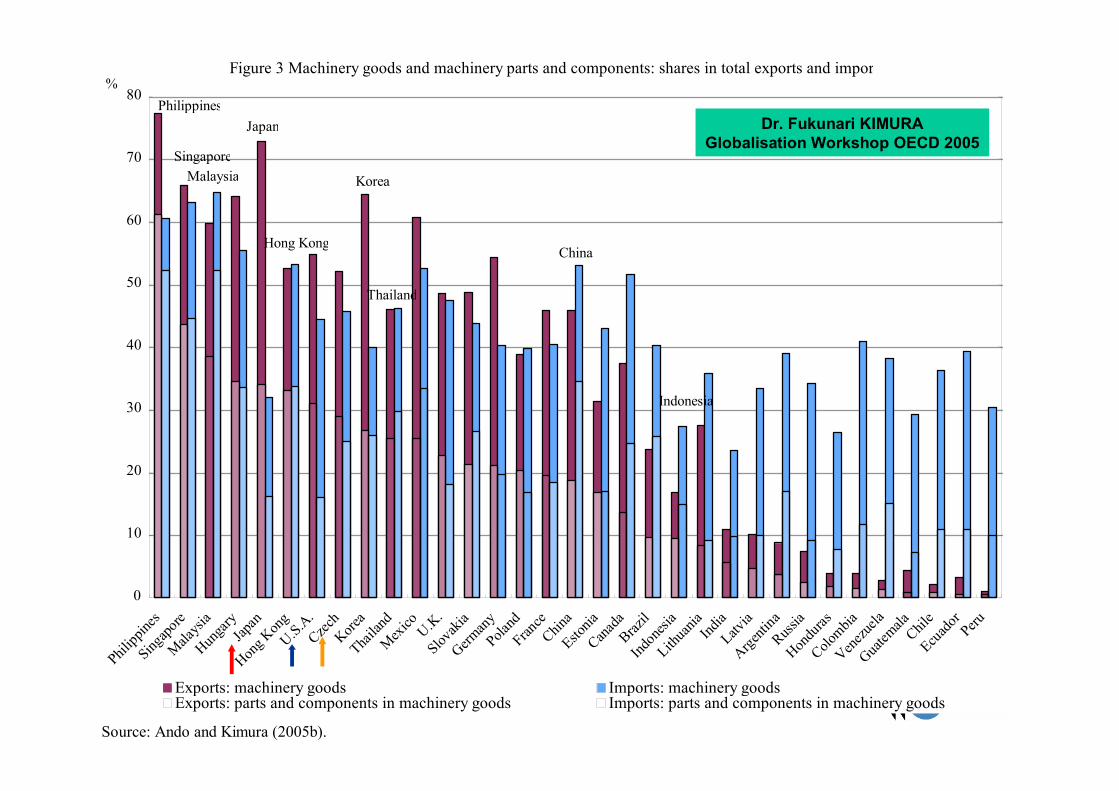
4444Source: Ando and Kimura (2005b).
Figure 3 Machinery goods and machinery parts and components: shares in total exports and imports in 2003
Japan
Thailand
Hong Kong
Korea
SingaporeMalaysia
Philippines
China
Indonesia
0
10
20
30
40
50
60
70
80
Philipp
ines
Singapo
re
Malaysi
a
Hunga
ryJap
an
Hong K
ongU.S.A
.Czec
hKore
a
Thaila
nd
Mexico U.K
.
Slovaki
a
German
yPola
ndFran
ceChin
a
Estonia
Canada
Brazil
Indon
esia
Lithua
nia IndiaLatv
ia
Argenti
naRuss
ia
Hondu
ras
Colombia
Venezu
ela
Guatem
alaChil
e
Ecuado
rPeru
%
Exports: machinery goods Imports: machinery goodsExports: parts and components in machinery goods Imports: parts and components in machinery goods
Dr. Fukunari KIMURAGlobalisation Workshop OECD 2005
4545
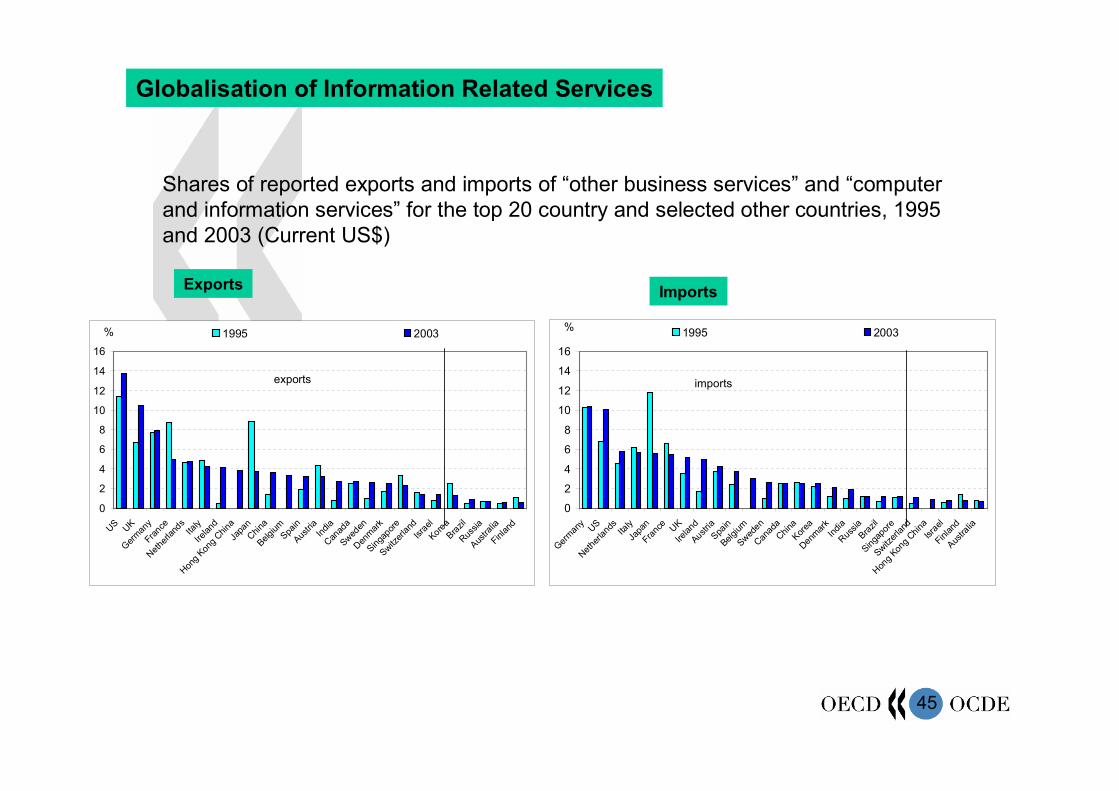
Shares of reported exports and imports of “other business services” and “computer and information services” for the top 20 country and selected other countries, 1995 and 2003 (Current US$)
0
2
4
6
8
10
12
14
16
Germany US
Netherlan
ds ItalyJa
pan
France UK
Irelan
d
AustriaSpa
in
Belgium
Sweden
Canada
ChinaKore
a
Denmark Ind
ia
Russia
Brazil
Singap
ore
Switzerl
and
Hong K
ong C
hinaIsr
ael
Finlan
d
Austra
lia
1995 2003%
imports
0
2
4
6
8
10
12
14
16
US UK
Germany
France
Netherlan
dsIta
ly
Irelan
d
Hong Kon
g Chin
aJa
panChin
a
Belgium
Spain
Austria
India
Canad
a
Sweden
Denmark
Singapore
Switzerl
andIsr
ael
KoreaBrazil
Russia
Austra
lia
Finlan
d
1995 2003
exports
%
Exports Imports
Globalisation of Information Related Services

4646
Restructuring or Boneyard:
The Need for SpeedWhile restructuring our Company in the 1980s, we spent much
of our time talking about the accelerating pace of change: in world politics, in technology, in product introduction and in the increasing demands of customers. We don’t have to do that anymore. Change is in the air. Newspapers and networks hammer it home daily. GE people today understand that pace of change, the need for speed, and the absolute necessity of moving more quickly in everything we do, from inventory turnover, to product development cycles, to afaster response to customer needs. They understand that slow-and-steady is a ticket to the boneyard in the 1990s.
“To Our Share Owners” (1990 Annual Report ) of GE
Conclusion