schrienreihe logisk der technischen universität berlin band 39
TRANSCRIPT

Schriftenreihe Logistik der Technischen Universität Berlin Band 39
Hrsg.: Frank Straube, Helmut Baumgarten, Raimund Klinkner
Universitätsverlag der TU Berlin
Feng Ding
Developing E-commerce Logistics in Cross-border Relation


Feng Ding Developing E-commerce Logistics
in Cross-border Relation

The scientific series Schriftenreihe Logistik der Technischen Universität Berlin is edited by: Prof. Dr.-Ing. Frank Straube, Prof. Dr.-Ing. Raimund Klinkner, Prof. Dr.-Ing. Dr. rer. pol. h.c. Helmut Baumgarten

Schriftenreihe Logistik der Technischen Universität Berlin | 39
Feng Ding Developing E-commerce Logistics
in Cross-border Relation
Universitätsverlag der TU Berlin

Bibliographic information published by the Deutsche Nationalbibliothek The Deutsche Nationalbibliothek lists this publication in the Deutsche Nationalbibliografie; detailed bibliographic data are available on the Internet at http://dnb.dnb.de.
Universitätsverlag der TU Berlin, 2018 http://verlag.tu-berlin.de
Fasanenstr. 88, 10623 Berlin, Germany Tel.: +49 (0)30 314 76131 / Fax: -76133 E-Mail: [email protected]
Zugl.: Berlin, Techn. Univ., Diss., 2017 Zugl.: Shanghai, Tongji Univ., Diss., 2017 Gutachter: Prof. Dr.-Ing. Frank Straube (TU Berlin) Gutachter: Prof. Dr. Jiazhen Huo (Tongji Universität, Shanghai) Gutachter: Prof. Axel Werwatz (TU Berlin) Gutachter: Prof. Dr. Yanting Li (Shanghai Jiao Tong Universität, Shanghai) Gutachter: Prof. Dr. Qiang Su (Tongji Universität, Shanghai) Gutachter: Prof. Dr. Yongrui Duan (Tongji Universität, Shanghai) Die Arbeit wurde am 23. November 2017 an der Tongji Universität, Shanghai (China) unter Vorsitz von Prof. Dr.-Ing. Frank Straube und Prof. Dr. Jiazhen Huo erfolgreich verteidigt.
This work – except for quotes, figures and where otherwise noted – is licensed under the Creatice Commons Licence CC BY 4.0 http://creativecommons.org/licenses/by/4.0/
Print: docupoint GmbH Layout/Typesetting: Feng Ding
ISBN 978-3-7983-2972-0 (print) ISBN 978-3-7983-2973-7 (online)
ISSN 1865-3170 (print) ISSN 2197-0564 (online)
Published online on the institutional Repository of the Technische Universität Berlin: DOI 10.14279/depositonce-6615 http://dx.doi.org/10.14279/depositonce-6615

Abstract
V
ABSTRACT
Cross-border e-commerce (CBE) is a type of international e-commerce similar to
cross-border e-retailing. With the support of advanced technology, growing demand
and advantageous policy, an increasing amount of people is shopping online across
the borders, especially in China. CBE is booming globally, but also facing challenges.
Culture and consumer behavior, laws and regulations, product and marketing issues,
payment conditions and logistics limitations were identified as the main obstacles to
its success. Thereinto, logistics-related issues are the strongest concern in the industry,
due to the requirement of long distance transport in CBE, which makes long
transportation time, high shipping cost and bad return service increasingly prominent.
The traditional logistics system is not sufficient to manage the new challenges. In
order to improve customer service and reduce costs, the implementation of e-logistics
system is necessary. However, many enterprises do not know how to develop
e-logistics effectively and lack competitive logistics strategy in cross-border relation.
The factors affecting the implementation of cross-border e-logistics (CBEL) are
highly complex. Previous researches have provided various single factors or focused
on one particular factor, ignoring the bigger picture. Meanwhile, plenty of studies on
the topic of either e-commerce or logistics have been published over the last two
decades, but the development of CBEL is a joint effort carried out by both topics that
few studies focused on. This is still an area that requires more in-depth study and
investigation. Therefore, the aim of this thesis is to fill this gap, identify the current
situation of CBE and e-logistics, point out the key factors affecting CBEL
implementation and propose a conceptual framework to support formulating
competitive strategies in cross-border relation. It contributes to both theory and
practice. In order to achieve this purpose, both empirical methods and theoretical
methods were used, including case study, questionnaire survey, expert interview,
systematic literature review, factor analysis and game theory.
The contents and contributions of this thesis are briefly presented as follows:
Firstly, 21 initial influencing factors were found after systematic literature review.
Then, through an exploratory factor analysis with principal component extraction and
varimax rotation, a conceptual framework with 6 key factors composed of 19
indicators was constructed. Thereinto, the external factors are the “Government” and

Abstract
VI
“Consumer”, which represent the social environment and determine the development
direction of enterprise; the internal factors include “Company”, “Product”, “Operation”
and “Partnership”, which are organization condition and determine the strategy
formulation of the enterprise. The rest of chapters will be closely linked around this
framework and reveal the implications of these factors.
Secondly, considering the external factors, a trilateral game model was used to clearly
understand the relationship between the government, merchant and consumer for the
development of CBEL. As an organizer, the government plays a key leading role. And
in order to improve the effectiveness of regulation, the government should form and
prefect incentive mechanisms not just rely on subsidies and penalty, while invest
special fund to improve infrastructure construction preferentially.
Thirdly, according to the business nature and the product features of case enterprises,
a general normative decision model based on internal factors “Company” and
“Product”, was presented to help CBE merchants match the appropriate “logistics
strategy” to the possible “logistics problem” in CBE.
Fourthly, a game model was built to analyze that how differentiation of internal
factors “Product” and “Operation” affect the competitive strategy making. And the
optimal pricing and service level under centralized and decentralized decision were
formulated. The equilibrium solution revealed that product competition tends to
homogeneity and service competition tends to heterogeneity by the impact of
consumer preferences. “Price-war” has been unable to meet the needs of market
competition in CBE, and merchants must strive to improve the logistics service level.
Fifthly, a dual-channel supply chain consisting of overseas supplier, e-retailer and
logistics service provider (LSP) was constructed. Trading off on internal factors
“Operation” and “Partnership”, the optimal inventory strategy under centralized and
decentralized managed, the optimal transportation strategy under LSPs cooperation
and non-cooperation, were obtained through the equilibrium solution and the
numerical analysis. For the sustainable growth of profit, supplier and merchant should
form an alliance and jointly manage the inventory, meanwhile, the appropriate
contract need to be formulated to ensure benefits and risks sharing in the entire
cross-border supply chain. And when merchant outsources cross-border transportation,
should choose different LSPs according to phases or channels, so that prevent lose the
initiative in service pricing.

Abstract
VII
Finally, the Walmart Global Store at JD.com platform in China market was chosen as
case study, the development of their CBEL strategy verified the rationality and
applicability of the framework found in this thesis.
The e-logistics in cross-border relation is still a new topic and deserves to explore and
further study. This framework provides academics and practitioners a clear knowledge
of where the field currently stands and the type of research that is needed to advance.
Key words: cross-border e-commerce; e-logistics; conceptual framework;
competitive strategy; game theory

Catalogue
VIII
Catalogue
ABSTRACT .................................................................................................................. V
Catalogue .................................................................................................................. VIII
List of Figures .............................................................................................................. XI
List of Tables ............................................................................................................. XIII
List of Abbreviations................................................................................................. XIV
1. Introduction ................................................................................................................ 1 1.1 Research Definition ............................................................................................................. 1
1.1.1 Cross-border E-commerce ....................................................................................... 1 1.1.2 Merchant in Cross-border E-commerce ................................................................. 12 1.1.3 E-commerce Logistics ............................................................................................ 14 1.1.4 E-logistics in Cross-border Relations ..................................................................... 21
1.2 Research Motivation and Question ................................................................................... 23 1.3 Research Method ............................................................................................................... 24
1.3.1 Systematic Literature Review ................................................................................ 24 1.3.2 Case Study .............................................................................................................. 25 1.3.3 Factor Analysis ....................................................................................................... 26 1.3.4 Game Theory .......................................................................................................... 27
1.4 Research Content .............................................................................................................. 28
2. A Conceptual Framework of Developing CBEL ..................................................... 32 2.1 Literature review ............................................................................................................... 32
2.1.1 Company ................................................................................................................ 35 2.1.2 Product ................................................................................................................... 37 2.1.3 Government ............................................................................................................ 38 2.1.4 Market .................................................................................................................... 40 2.1.5 Technology ............................................................................................................. 40 2.1.6 Operation ................................................................................................................ 41 2.1.7 Partnership ............................................................................................................. 45
2.2 Questionnaire Survey ........................................................................................................ 47 2.2.1 Introduction and Report ......................................................................................... 47 2.2.2 Comparative Analysis ............................................................................................ 51
2.3 Factor Analysis .................................................................................................................. 56 2.3.1 Introduction and Procedure .................................................................................... 56 2.3.2 Analysis and Result ................................................................................................ 58
2.4 Conceptual Framework ..................................................................................................... 63
3. Game Model and Strategy between Behavior Subjects of CBEL ........................... 66 3.1 Behavior Subjects of CBEL .............................................................................................. 66
3.1.1 Organizer-Government........................................................................................... 66

Catalogue
IX
3.1.2 Implementer-Merchant ........................................................................................... 67 3.1.3 Pusher-Consumer ................................................................................................... 68
3.2 Bilateral Game between Subjects ...................................................................................... 69 3.2.1 Hypothesis and Parameter ...................................................................................... 69 3.2.2 Merchant to Merchant ............................................................................................ 70 3.2.3 Merchant to Consumer ........................................................................................... 71
3.3 Trilateral Game between Subjects ..................................................................................... 73 3.3.1 Hypothesis and Parameter ...................................................................................... 73 3.3.2 Payoff Matrix and Model Strategy ......................................................................... 75 3.3.3 The Analysis of Mixed-Strategy Equilibrium ........................................................ 78 3.3.4 Recommendation.................................................................................................... 81
4. A Decision Model of E-logistics Strategy in CBE ................................................... 82 4.1 Logistics Problem in Cross-border Relation ..................................................................... 82 4.2 Logistics Strategy in Cross-border Relation ..................................................................... 84 4.3 Case Analysis Based on Survey Data ................................................................................ 86
4.3.1 Logistics Problem Matrix ....................................................................................... 87 4.3.2 Logistics Strategy Matrix ....................................................................................... 92
4.4 Decision Model for Strategy Selection Process ................................................................ 94
5. Competitive Strategy Based on Product and Service Differentiation ...................... 97 5.1 Study Premises and Theoretical Basis .............................................................................. 97
5.1.1 Differentiation Strategy .......................................................................................... 97 5.1.2 Consumer Utility .................................................................................................... 98
5.2 Competitive Strategy under Product Differentiation ......................................................... 99 5.2.1 Hypothesis and Parameter ...................................................................................... 99 5.2.2 Optimal Strategy in Centralized Decision ............................................................ 103 5.2.3 Optimal Strategy in Decentralized Decision ........................................................ 105 5.2.4 Comparative Analysis .......................................................................................... 106
5.3 Competitive Strategy under Service Differentiation ....................................................... 110 5.3.1 Hypothesis and Parameter .................................................................................... 110 5.3.2 Optimal Strategy in Centralized Decision ............................................................ 113 5.3.3 Optimal Strategy in Decentralized Decision ........................................................ 115 5.3.4 Comparative Analysis .......................................................................................... 116
5.4 Numerical Analysis ......................................................................................................... 120 5.4.1 Product Differentiation ......................................................................................... 120 5.4.2 Service Differentiation ......................................................................................... 122
6. Competitive Strategy for Inventory and Transportation in CBE ........................... 124 6.1 Inventory Strategy ........................................................................................................... 124
6.1.1 Hypothesis and Parameter .................................................................................... 124 6.1.2 Centralized Managed Inventory ........................................................................... 126 6.1.3 Decentralized Managed Inventory ....................................................................... 128 6.1.4 Numerical Analysis .............................................................................................. 130

Catalogue
X
6.2 Transportation Strategy ................................................................................................... 133 6.2.1 Hypothesis and Parameter .................................................................................... 134 6.2.2 Cooperation between LSPs (LC) .......................................................................... 137 6.2.3 Non-cooperation between LSPs (LN) .................................................................. 138 6.2.4 Equilibrium Analysis and Inference ..................................................................... 139 6.2.5 Conclusions and Recommendations ..................................................................... 141
7. Case Study ............................................................................................................. 143 7.1 The Effect of External Factors ........................................................................................ 143
7.1.1 Measures of the Chinese Government ................................................................. 143 7.1.2 Performances of the Chinese Consumers ............................................................. 145
7.2 The Effect of Internal Factors ......................................................................................... 147 7.2.1 Development of Walmart ..................................................................................... 148 7.2.2 Development of JD.com ....................................................................................... 149 7.2.3 Cooperation between Walmart and JD.com ......................................................... 152
8. Conclusions and Prospects ..................................................................................... 155 8.1 Synopsis and Contribution Value .................................................................................... 155 8.2 Limitations and Future Research .................................................................................... 163
Reference ................................................................................................................... 165
Appendix 1. Initial Influencing Factors for Developing CBEL ................................ 174
Appendix 2. Questionnaire ........................................................................................ 177
Appendix 3. General Information of Case Enterprises in Survey ............................. 181
Appendix 4. Complexity of Logistics Problems and Strategy in Case Enterprises...183
Acknowledgement ..................................................................................................... 186

List of Figures
XI
List of Figures
Figure 1 Definition of CBE in Thesis ............................................................................................... 2 Figure 2 Import Flow of CBE ........................................................................................................... 2 Figure 3 Global Cross-border B2C Volume (in $ billions) ............................................................... 3 Figure 4 Cross-border B2C E-commerce Sales in Europe (in € billion) ........................................... 3 Figure 5 Foreign Trade Volume and CBE GMV in China (in¥trillion) ........................................... 4 Figure 6 Trade Flows between China and EU in 2013 ..................................................................... 4 Figure 7 Reasons for Consumer Ordering Abroad ............................................................................ 6
Figure 8 Free Trade Zones in China .................................................................................................. 6 Figure 9 Free Trade Area in Europe .................................................................................................. 7 Figure 10 Competition in CBE Transferred from Product to Service ............................................. 12 Figure 11 Definition and Example of CBE Merchants in Thesis .................................................... 13 Figure 12 Retail Logistics in E-commerce ...................................................................................... 14 Figure 13 Definition of E-logistics in Thesis .................................................................................. 15 Figure 14 Process of E-procurement ............................................................................................... 15 Figure 15 E-procurement models .................................................................................................... 15
Figure 16 Description of a General E-fulfillment Flow .................................................................. 16 Figure 17 Functions of a Fulfillment Center ................................................................................... 18 Figure 18 Process of Procurement and Fulfillment in Different E-retailers.................................... 20 Figure 19 Logistics Strategies in CBE ............................................................................................ 22 Figure 20 Abductive Research Process ........................................................................................... 28 Figure 21 Research Process of Thesis ............................................................................................. 29 Figure 22 Structure of Thesis .......................................................................................................... 31 Figure 23 Distribution of Publishing Year in Systematic Literature Review .................................. 33
Figure 24 Frequency Distribution of Scale’s Total Factor Score .................................................... 53 Figure 25 Conceptual Framework of Developing CBEL ................................................................ 63 Figure 26 Trilateral Game Tree between Subjects in CBEL Developing ........................................ 74 Figure 27 Classification of Logistics’ Problems ............................................................................. 83 Figure 28 Structure of E-logistics System in Thesis ....................................................................... 84 Figure 29 Six E-logistics Strategies in CBE ................................................................................... 84 Figure 30 Problem Matrix of Case Enterprises ............................................................................... 87 Figure 31 Logistics Problem – Logistics Strategy Matrix of Case Enterprises .............................. 92 Figure 32 Decision Model for Strategy Selection Process .............................................................. 94
Figure 33 Supply Chain Structure in Product Differentiation Model ........................................... 100 Figure 34 Demand within Various Price Range under Different Product Valuation ..................... 102 Figure 35 Supply Chain Structure in Service Differentiation Model ............................................ 111 Figure 36 Impact of Product Differentiation on Total Profits under Same Service ...................... 120 Figure 37 Impact of Product Differentiation on Total Profits under Different Service in CD ...... 121

List of Figures
XII
Figure 38 Impact of Product Differentiation on Total Profits under Different Service in DD ...... 121 Figure 39 Impact of Service Differentiation on Total Profits ........................................................ 122 Figure 40 Impact of Service Cost Coefficient on Total Profits under Different Service in CD .... 123 Figure 41 Impact of Service Cost Coefficient on Total Profits under Different Service in DD .... 123 Figure 42 Supply Chain Structure in Centralized Managed Inventory Mode ............................... 126 Figure 43 Supply Chain Structure in Decentralized Managed Inventory Mode ........................... 128 Figure 44 Impact of Demand Uncertainty on Inventory in CMI .................................................. 130 Figure 45 Impact of Demand Uncertainty on Inventory in DMI .................................................. 131
Figure 46 Comparison of Total Inventory between CMI and DMI ............................................... 131 Figure 47 Impact of Demand Uncertainty on Profit in CMI ......................................................... 132 Figure 48 Impact of Demand Uncertainty on Profit in DMI ......................................................... 132 Figure 49 Comparison of Total Profit between CMI and DMI ..................................................... 133 Figure 50 Supply Chain Structure in Transportation Strategy Model ........................................... 136 Figure 51 Development of Chinese Government’s Policy for CBE ............................................. 143 Figure 52 FTZs and CBE Comprehensive Pilots in China ........................................................... 145 Figure 53 Top 10 Product Categories in China’s CBE ................................................................. 146 Figure 54 CBE Satisfaction and Concern Matrix of Chinese Consumer ...................................... 147
Figure 55 Development of Walmart’s E-commerce in China ....................................................... 149 Figure 56 JD’s Fulfillment Centers in China ................................................................................ 150 Figure 57 Walmart’s CBEL model in China ................................................................................. 153 Figure 58 Order Distribution of Walmart Global in China ........................................................... 153 Figure 59 Walmart Global’s CBEL Strategy in China .................................................................. 154 Figure 60 Overview of Thesis ....................................................................................................... 162

List of Tables
XIII
List of Tables
Table 1 List of Studies Mentioned CBE Barriers .............................................................................. 7 Table 2 Composition of E-fulfillment in Literatures ....................................................................... 16 Table 3 Searching Results of Systematic Literature Review .......................................................... 33 Table 4 Research Methodologies Used in Systematic Literature Review ....................................... 33 Table 5 Field Report of Questionnaire Distribution ........................................................................ 49 Table 6 Statistics of Participants’ Job Title in Survey ..................................................................... 50 Table 7 Statistics of Enterprises’ Size in Survey ............................................................................. 50
Table 8 Statistics of Industries’ Proportion in Survey ..................................................................... 50 Table 9 Statistics of Retailers’ Type in Survey ................................................................................ 51 Table 10 Statistics of Product Source in Survey ............................................................................. 51 Table 11 Statistics of Storage Location in Survey........................................................................... 52 Table 12 Statistics of Transportation Mode in Survey .................................................................... 52 Table 13 Descriptive Statistics of Chinese Participants on Factors ................................................ 53 Table 14 Descriptive Statistics of German Participants on Factors ................................................ 54 Table 15 Top 10 Factors between Enterprises in China and Germany ............................................ 55
Table 16 KMO and Bartlett’s Test of Factor Analysis .................................................................... 58 Table 17 Total Variance Explained of Factor Analysis ................................................................... 59 Table 18 Rotated Component Matrix of Factor Analysis ................................................................ 60 Table 19 Component Score Coefficient Matrix of Factor Analysis ................................................ 61 Table 20 Index System of Developing CBEL ................................................................................. 62 Table 21 Parameters in Bilateral Game Model ............................................................................... 70 Table 22 Payoff Matrix of Bilateral Game between Merchants ...................................................... 70 Table 23 Payoff Matrix of Bilateral Game between Merchant and Consumer ............................... 72
Table 24 Parameters in Trilateral Game Model .............................................................................. 75 Table 25 Payoff Matrix of Government, Merchant and Consumer ................................................. 76 Table 26 Logistics Problem Evaluation in Five-Level Scale .......................................................... 83 Table 27 Proportion of “M/H” and “H” Logistics Problems in Case Enterprises ........................... 90 Table 28 Number of Case Enterprises in Different Logistics Problem ........................................... 91 Table 29 Number of Commodity in Different Logistics Problem ................................................... 91 Table 30 Benchmark for CBEL Strategy Selection ......................................................................... 96 Table 31 Parameters in Product Differentiation Model ................................................................. 100 Table 32 Parameters in Service Differentiation Model ................................................................. 110
Table 33 Parameters in Inventory Strategy Model ........................................................................ 125 Table 34 Parameter Assignment in Inventory Model .................................................................... 130 Table 35 Parameters in Transportation Strategy Model ................................................................ 135

List of Abbreviations
XIV
List of Abbreviations
3PL Third Party Logistics
AVG Average
B2B Business to Business
B2C Business to Customer
B2B2C Business to Business to Customer
C2C Customer to Customer
CBE Cross-border E-commerce
CBEC Cross-border E-commerce Community
CBEL Cross-border E-commerce Logistics
CD Centralized Decision
CMI Centralized Managed Inventory
CSF Critical Success Factor
C&M Click-and-Mortar
DC Distribution Center
DD Decentralized Decision
DMI Decentralized Managed Inventory
EDI Electronic Data Interchange
EFA Exploratory Factor Analysis
ERP Enterprise Resource Planning
EU European Union
E-commerce Electronic Commerce
E-fulfillment Electronic Fulfillment
E-logistics E-commerce Logistics
E-marketplace E-commerce Marketplace
E-procurement Electronic Procurement
E-retailer E-commerce Retailer
E-retailing E-commerce Retailing
FTZ Free Trade Zone

List of Abbreviations
XV
GMV Gross Merchandise Volume
ICT Information and Communication Technology
Info. Information
IOIS Internet-based Inter-organizational Information Systems
IT Information Technology
JD.com JingDong.com
KMO Kaiser-Meyer-Olkin
LSP Logistics Service Provider
Mgmt. Management
No. Number
O2O Online-to-Offline
PCA Principal Component Analysis
PIF Initial Influencing Factors
RFID Radio Frequency Identification
QED Quod Erat Demonstrandum
SCM Supply Chain Management
SEM Structural Equation Modeling
SMEs Small and Medium Enterprises
SLR Systematic Literature Review
Std. Dev Standard Deviation
TOE Technology Organization Environment
XML Extended Markup Language
YHD Yihaodian.com
VAT Value Added Tax
VMI Vendor Managed Inventory


Chapter 1 Introduction
1
1. Introduction
The introduction is aim to attract attention and raise interest to the area of research. In
this chapter, an overview of this thesis will be presented, including definition,
motivation, question, method and expect outcome. The structure of thesis and the
relevance between each chapter will be explained in the end.
1.1 Research Definition
1.1.1 Cross-border E-commerce
1.1.1.1 Object Definition
The consumer online shopping from merchants located in different areas or countries,
the transaction though internet, and deliver/receive the goods via cross-border
logistics, is the common definition of cross-border e-commerce (Hereinafter referred
to as CBE) (Accenture, 2012). In addition, the CBE defined by Wang (2014, P.141) is
an international e-commerce that international business transacting among different
countries, making deals and transactions through an e-commerce platform, and
delivering goods through cross-border planning and management agreements. Liu et
al. (2015, P.15) defined CBE as a transaction realized in different areas or country by
using Internet or platform with related information. Two main points can be
concluded in those definitions: transacting in different countries and using
information and communication technology (ICT). Based on above, this research
specifically focuses on the CBE studies using Cross-border E-commerce Community
(CBEC)’s definition:
International ecommerce is called cross-border ecommerce, when consumers buy
online from merchants, located in other countries and jurisdictions. Online trade
between consumers and merchants which share one common language and border or
which make use of the same currency are not always perceived as cross-border by
consumers. EU neighbors which speak a common language, united by SEPA, are just
one example.
Nowadays, CBE is almost equal to cross-border e-retailing (iResearch, 2015a), which
is synonymous with business-to-consumer (B2C) transaction (Rajavel, 2015).
However, unlike a strict B2C e-commerce, CBE needs to integrate the activities along
with the logistics value chain, and the transaction is often from overseas supplier via
Developing E-commerce Logistics in Cross-border Relation
2
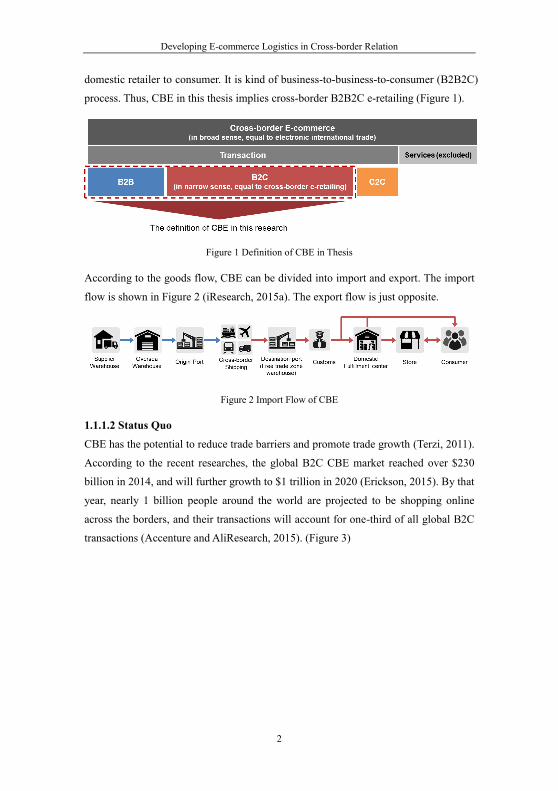
domestic retailer to consumer. It is kind of business-to-business-to-consumer (B2B2C)
process. Thus, CBE in this thesis implies cross-border B2B2C e-retailing (Figure 1).
Figure 1 Definition of CBE in Thesis
According to the goods flow, CBE can be divided into import and export. The import
flow is shown in Figure 2 (iResearch, 2015a). The export flow is just opposite.
Figure 2 Import Flow of CBE
1.1.1.2 Status Quo
CBE has the potential to reduce trade barriers and promote trade growth (Terzi, 2011).
According to the recent researches, the global B2C CBE market reached over $230
billion in 2014, and will further growth to $1 trillion in 2020 (Erickson, 2015). By that
year, nearly 1 billion people around the world are projected to be shopping online
across the borders, and their transactions will account for one-third of all global B2C
transactions (Accenture and AliResearch, 2015). (Figure 3)

Chapter 1 Introduction
3
Figure 3 Global Cross-border B2C Volume (in $ billions)
The booming is especially in some developed countries due to superior infrastructure
and regulation for e-commerce. Because of a well-established cross-border shopping
tradition, more than 25% online shoppers in European Union (EU) have made
purchases from other countries (PRNewswire, 2015), and the sales of B2C CBE in
Europe will up to €116 billion in 2018 (Statista, 20151). (Figure 4)
Figure 4 Cross-border B2C E-commerce Sales in Europe (in € billion)
In the short term, CBE revenue will be concentrated in developed countries
(UNCTAD, 2015), nevertheless in the long run, after the overcome of some IT
limitations, a leapfrog development is expected by developing countries (Panagariya,
2000). For instance, in China, the gross merchandise volume (GMV) of CBE is
expected to contribute over 20% of total foreign trade volume in 2017 (Liu et al.,
1 In this statistics, B2C E-commerce turnover includes online travel, digital downloads and event tickets; excludes online gaming and financial services.

Developing E-commerce Logistics in Cross-border Relation
4
2015). China will become the largest CBE market by 2020 (Accenture and
AliResearch, 2015). (Figure 5)
Figure 5 Foreign Trade Volume and CBE GMV in China (in¥trillion)
In addition, the CBE between China and Europe is also developing rapidly. 32% of
European survey respondents believe CBE to and from China has become more
accessible (Payvision, 2015). Nowadays, China is the No.1 source of merchandise
imports into the EU (Figure 6). As China’s most important trading partner in the EU
by far, Germany is particularly well placed to benefit from an intensification of
bilateral trade (Deutsche Bank, 2014). Therefore, the comparative study between
Germany and China is particularly important and worthy for the development of CBE.
Figure 6 Trade Flows between China and EU in 2013

Chapter 1 Introduction
5
1.1.1.3 Main Driver
The prosperity of CBE can be mainly attributed to the following drivers:
(1) Advanced Technology
Globalization refers to the growing volume and variety of cross-border transactions in
goods and services through the rapid and widespread diffusion of technology
(Pounder, 2013). The fast paced internet has brought a large growth of online
shopping users (Okamura, 2006). The combination of Internet and foreign trade
supported the CBE development (AliResearch, 2015). The developed ICT, on the one
hand, makes it easier for consumers to shop online cross invisible borders (Alkadi et
al., 2004; Payvision, 2015), such as convenient cross-border payment (CNNIC, 2015)
and growing usage of smart mobile (Marceux, 2015). On the other hand, it reduces
marketing costs and administration expenditures while enables company to reach
dispersed markets (Burinskiene, 2012; Grant and Bakhru, 2004; Shama, 2005).
Therefore, international business market is expanded by advanced e-commerce
technologies (Shewmake and Sapp, 2000; Hwang, 2006; Panagariya, 2000).
(2) Growing Demand
In an era of e-commerce and international businesses, a company’s operational model
must be build based on the customers’ requirements (Lee et al., 2010). The lack of
products’ availability and better prices in foreign market are still the most cited
triggers for cross-border online shopping. In addition, the pursuit of better quality
products is another important reason for emerging countries’ consumers purchasing
frequently from abroad (DHL, 20132; Forrester, 20143) (Figure 7). In China, current
gradually liberalization of birth policy will prompt the growth of baby’s birth, while
domestic milk powder and food safety problems will increase the demand of overseas
baby products (Analysys, 2015).
2 Source from DHL Global Mail 2013, surveyed 7289 global distance online shopping consumers. 3 The result is based on the survey of 9006 global online shoppers.

Developing E-commerce Logistics in Cross-border Relation
6
Figure 7 Reasons for Consumer Ordering Abroad
(3) Advantageous policy
Trade liberalization increased exports of goods and services to new markets, for
instance, the establishment of European Free Trade Agreement and China Free Trade
Area. Previously, such trade was not feasible due to the net effect of import tariffs
made being competitive in foreign markets improbable (Pounder, 2013). The
advantageous policies will open up markets for trades, including those from
developing countries (Nielson and Morris, 2001). The Chinese government introduced
a series of favorable policies for CBE (Analysys, 2015; CECRC, 2015), established
several free trade zones (FTZ) to lower the duties and concise customs clearance
procedures (PwC, 2015). Up to now, the total number of FTZs has reached 11, they
are Shanghai, Tianjin, Fujian, Guangdong, Liaoning, Zhejiang, Henan, Hubei,
Sichuan, Shaanxi and Chongqing (CRIENGLISH, 2016) (Figure 8).
Figure 8 Free Trade Zones in China

Chapter 1 Introduction
7
Similar to FTZ, all member states of the EU form a customs territory (the European
Customs Union) where unified customs arrangements are applied, that is European
Free Trade Agreement (Figure 9). Goods imported into the EU are subject to EU-wide
import regulations, customs tariffs and customs procedures. Once goods have been
imported into the EU, no further customs duties must be paid within the customs
territory - even if the goods cross internal borders of member states (GTAI, 2015).
Individual postal products (online procurement) which are sent from Non-EU and the
total value below 22 euros are admitted free of import duties. The others need to pay a
19% VAT according to customs regulations of EU Member States (ZOLL, 2015).
Figure 9 Free Trade Area in Europe
1.1.1.4 Confronted Barrier
Along with the development opportunities, CBE is also facing barriers. After an
extensive complete review of the latest studies (Table 1), the six categories were
identified, which are culture & consumer, marketing, product, laws & regulations,
payment and logistics.
Table 1 List of Studies Mentioned CBE Barriers
Author/Institution Year Culture & Consumer Marketing Product Laws &
regulations Payment Logistics
Accenture 2012 x x x x x
Adyen 2015 x
Carlton Mansfield 2015 x x
Colliers 2015 x
DHL 2013 x x x x

Developing E-commerce Logistics in Cross-border Relation
8
Author/Institution Year Culture & Consumer Marketing Product Laws &
regulations Payment Logistics
DHL 2015a x x x x
DHL 2015b x
Ecommerce Europe 2015 x x
Forrester 2014 x x x x
Froelich, I. 2014 x x x x x
Gordon, J. 2014 x
IPC 2010 x x x x
iResearch 2015 x x x
JLL 2013 x
Kommerskollegium 2012 x x x x
Landmark global 2015a x x
McDermott, K. 2015 x x x x
Paypal 2013 x
Paypal 2014a x x
Paypal 2014b x x x
Pitney Bowes 2010 x x x x
Tentinet 2015 x x x x x
UNCTAD 2015 x x
van Heel et al. 2014 x
(1) Culture and Consumer
At first, the flows of information and goods cross borders and encounter cultural
differences along the way. The typical difference is language, which can change the
distribution culture of that market and hinder consumers’ consumption from abroad
(Youngdahl and Loomba, 2000). Secondly, consumer behaviors are different
according to countries, more information about commodities preferences, delivery and
online payment options of foreign consumer, are especially needed. Finally, the
merchants’ reputation is showed to be an important factor during decision making
with most consumers concerning about the reliability of international delivery and
online payments.
(2) Marketing
Commonly e-commerce businesses struggle to find adequate information about
foreign market operation. For brands that are relatively unknown in target markets,

Chapter 1 Introduction
9
the cost of building brand awareness turns to be high, such as advertising through
multi-channel. Additionally, global markets place businesses have been continuously
extending their operations overseas, posing a threat to domestic e-commerce
enterprises (Liu et al., 2015).
(3) Product
Consumers lack of trust towards cross-border sellers is frequently cited as one of the
challenges due to fake and counterfeit goods, which are most commonly observed in
emerging markets. Additionally, due to the high standardization, popularity and
profitability, some commodities such as computer, communication and consumer
electronic products are very suitable for cross-border e-commerce, resulting in a
serious homogenization of competition.
(4) Law and Regulation
Different laws and regulations between countries limit the ability of cross-border
business, such as data privacy and return police. The customers can unconditionally
return online purchase within 7 days after received in Germany, but only 7 days in
China. Furthermore, when consumers choose purchase abroad, duties must be
considered taking into account the total cost. High tariffs, taxation limits and VAT
thresholds often reduce cross-border purchasing intentions.
(5) Payment
In order to make buying online more attractive to consumers from target markets,
e-retailers have to be familiar with local payment preferences. For example, in Russia,
it is still very common to pay in cash upon receipt of the goods, whereas this rarely
happens in Western countries. Moreover, the unavailability to use local currency,
complex conversion systems, exchange rate fluctuations and additional depreciation
also harder cross-border shopping and increase the consumers’ costs. Lastly is the lack
of effective surveillance system. Fraud and non-payment result in enormous losses for
e-commerce merchants, while customers worry about misuse of payment data and
disclosure of personal information.
(6) Logistics
First, the basic logistics’ infrastructure, such as highways, railways and also
warehouses, are considered underdeveloped in some countries. The outdated customs
system and complicated clearance procedures are general problem for all international

Developing E-commerce Logistics in Cross-border Relation
10
trade. The extra costs incurred cam make the operation of small e-retailers unfeasible.
Once the CBE delivery requires long distances through different countries, extensive
time and untimely delivery, uncertain or non-delivery, are observed as the largest
obstacles in the delivery process. Besides, difficulties are also cited regarding specific
requirements from different countries, e.g. incompatible addressing systems. For the
same reason, long distance shipping in cross-border e-commerce generates higher
costs compared to domestic delivery. Moreover, delivery information allows
customers to take control over receiving or collecting their goods, limited
transparency and different information systems make tracking online orders of
international transportation more difficult. Finally, infeasible and inefficient
international return processes result in customer dissatisfaction.
In order to overcome these barriers, a need for cooperation between all involved
parties - government, merchant and service provider is called (McDermott, 2015;
Reynolds, 2001).
(1) Government’s support
Government has the ability and obligation to promote the development of CBE, which
represents the profit of the public and has more direct and mandatory influence.
- Investment in logistics’ infrastructure. The settlement of FTZ can simplify
clearance procedures, reduce administrative interventions and relax restrictions
on investment, which could boost the cross-border sales.
- Positive legislation for facilitating customs clearance and combating counterfeit
products can increase the enthusiasm of cross-border purchase.
(2) Merchants’ Localization
Different cultures and policies from different countries lead inevitably to specific
consumer behavior, such as payments and goods preference. Merchants need to take
local characteristics into account when designing CBE operations. The following
points can be considered as feasible localization solutions.
- Add local-language website (Alkadi et al., 2004). English version is already
standard in Europe. Some European merchants even set up a webpage in
Chinese.
- Extend Local payment options. Globally, credit card is widely popular, but some
countries have distinctly local preferences, such as AliPay in China, Sofort in
Chapter 1 Introduction
11
Germany and cash in Eastern European markets. It is critical to consider the local
payment set-up in order to improve customer satisfaction.
- Use the local popular channels. If brands are relatively unknown in a new market,
the usage of local social media and search engine, are effective methods for
image awareness improving fleetly (Froelich, 2014).
- Set up domestic service center. The establishment of call centers in target market,
aligned with after-sale services can support companies maintaining similar
service levels as they are used to in domestic market (Ecommerce Europe, 2015).
(3) Service provider’s assistant
If merchants do not have the ability or the capital to develop localization strategies,
cooperating with third party service providers might access to international markets
easily and rapidly. The right partners can support CBE merchants in the following
aspects:
- Payment service. Simplify the process of currency conversion and tax calculation,
establish connections with multiple payment options, improve security and
reduce fraud (Froelich, 2014).
- Marketing service. Understand local consumers and legal issues, find potential
products, view pricing in preferred currencies, support check out online with the
payment customers prefer (Pitney Bowes, 2010).
- Logistics service. Provide global coverage, delivery speed/consistency and
competitive costs. In addition, LSPs can support calculating taxes and duties,
filling out paperwork and simplifying cross-border returns (Forrester, 2014).
1.1.1.5 Development Tendency
In view of the opportunities and challenges encountered in e-commerce, the CBE will
develop towards the following trends:
(1) From product competition to service competition
In the early days of cross-border e-commerce, merchants are primarily competing in
products. With the development of internet technology and supply chain optimization,
this competition is turning to service level (Figure 10) (Analysys, 2015). Because the
products in CBE often require long distance transport. Those capable to provide
convenient and fast service will reach competitive advantage and consumers’ loyalty

Developing E-commerce Logistics in Cross-border Relation
12
Figure 10 Competition in CBE Transferred from Product to Service
(2) One-stop service
Brand merchants or those with larger online volumes often have their own fulfillment
facilities. However, for small and medium enterprises (SMEs), there is a demand for
integrated solutions, such as global online marketplace (Forrester, 2014). Some
provide a full range of one-stop services: payment processing, customer services,
shipping, clearance, return processing and delivery, such as Amazon.com and
Alibaba.com (UNCTAD, 2015).
(3) Omni-channel
Besides pure online retailers, traditional retailers and even producers are also showing
interest in developing international online channels. Meanwhile, mobile commerce
continues to grow, smartphone and tablet are becoming another channel for
cross-border shopping (McDermott, 2015). The ultimate evolution of multi-channel
and cross-channel retail is “Omni-channel” retail, where, consumers are able to access
the retailers from any platform (DHL, 2015b).
1.1.2 Merchant in Cross-border E-commerce
In this research, “Merchant” is referring to the enterprise that sells products directly to
end consumers. It can be a manufacturer, a retailer, and even a service provider. Those
purchase products from abroad or sell products to foreign is called CBE merchant
(Chen, 2004; Turban, 2006). According to the nature of business, they are divided into
two categories: pure player and click-and-mortar.
(1) Pure player:
Pure players are the enterprises that do not maintain physical stores and sell products
directly to consumers only via the internet (Boyer, 2001). They are further
distinguished into following three types on basis of whether purchase, storage and
delivery products by themselves.
Product Demand
Price
Category
Quality
Service Demand Logistics
After Sale
Clearance
Payment
Supply Chain Optimization

Chapter 1 Introduction
13
- Marketplace: these enterprises don’t purchase products, and just provide
platform and online trading service for merchants who want display their goods
for global consumer. Some of them are also not responsible for storage and
delivery which are outsourced to LSPs, such as ebay.com. Others operate
distribute center and provide logistics solution to merchants like Tmall.com.
Their profit mainly come from commission and advertising.
- Self-operation: these enterprises purchase products from supplier firstly, and then
sell to consumer. Some of them even handle the logistics by themselves, such as
Zalando.com and Jumei.com. Their profits mainly depend on price difference.
- Integrated: combine both platform and online retail store, such as Amazon.com
and JD.com.
(2) Click-and-Mortar
The enterprises operate physical store and online store at the same time, is called
“Click-and-Mortar” (Ashworth et al., 2006). It can be traditional retailers use
internet-based electronic commerce to diversify their distribution channel and interact
with consumers, such as Metro. It also can be pure players running physical stores
with offering online services, such as home24.com.
Some representatives of CBE merchants are shown in Figure 11.
Figure 11 Definition and Example of CBE Merchants in Thesis

Developing E-commerce Logistics in Cross-border Relation
14
1.1.3 E-commerce Logistics
1.1.3.1 Object Definition
E-commerce logistics, or e-logistics, is a holistic methodology and strategic planning
of all logistics systems and processes which are necessary for electronic transaction
processing as well as their administrative and operational physical form (Straube,
2004; Viswanadham and Gaonkar, 2001). In simple terms, the definition can be the
application of modern ICTs in logistics process in order to transfer the goods bought
online to the final consumer (Bhuiyan, 2013; Gunasekaran and Ngai, 2003; Islam and
Zunder, 2013).
E-logistics is a specialized part of retail logistics, developed within the part of
distribution logistics (Klumpp and Jasper, 2008). It rebuilds the relationship in supply
chain by breaking the monopoly of wholesalers and distributors (Figure 12). In
traditional retail logistics process, it is a linear flow of products from the suppliers to
the stores and the last mile logistics being performed by consumer himself. In
e-commerce, most retail stores were replenished by direct deliveries from suppliers or
wholesalers. The consumer can select products on online store and be fulfilled with
home delivery (Delfmann et al., 2002; Hesse, 2002; Xing, 2006).
Figure 12 Retail Logistics in E-commerce
However, not merely distribution, e-logistics should involve a wider scope from
producing to delivering a final product to the consumer (Bhuiyan, 2013; Croom, 2005;
Vaidyanathan and Devaraj, 2008). It covers interactive network connections between
producers, retailers, service providers and consumers (Muffatto and Payaro, 2004a;
Płaczek, 2010). Therefore, in this thesis, e-logistics consists of procurement and
fulfillment process, which manage the upstream and downstream relationships
respectively. (Figure 13)

Chapter 1 Introduction
15
ul illm nt
SupplierMerchant
Consumer o u m nt ul illm nt E-
logi
stic
s
Figure 13 Definition of E-logistics in Thesis
1.1.3.2 E-procurement E-procurement is the electronic integration using ICT in the purchasing process (Boer
et al., 2002; Hung et al, 2014; Muffatto and Payaro, 2004a;). It contains all
procurement activities that begin with the initial need identification by users (Corina,
2011; Croom and Brandon-Jones, 2007; Vitkauskaitė and Catautis, 2008). (Figure 14)
Figure 14 Process of E-procurement
Based on the quantity of buyers and sellers in the purchasing process, e-procurement
can be divided into four models (Pavlou and Sawy, 2002; Singh and Thomson, 2002)
(Figure 15). Thereinto, marketplace model brings multiple buyers and sellers together
in a virtual environment (Giménez and Lourenço, 2004; Reynolds, 2001).
Figure 15 E-procurement models

Developing E-commerce Logistics in Cross-border Relation
16
1.1.3.3 E-fulfillment
E-fulfillment refers to employing ICT to manage the order fulfillment process (Lang
and Bressolles, 2013; Muffatto and Payaro, 2004). It is the back end of e-logistics,
sometimes used to describe as act of distribution or crucial part of complete process
between vendor and customer. (Croxton, 2003; Rodriguez and Larsson, 2006; Straube
and Lueck, 2000). More than just “pick, pack and ship”, it integrates people,
processes and technology to meet customer expectation and ensure customer
satisfaction with its quality and functionality (Bayles, 2002; Tarn et al., 2003). The
process begins with point of sales inquiry, including all of the activities from orders
accepted until the product delivered at right time and right place (Isac, 2014; Pyke et
al., 2001; Ricker et al., 1999). The entire e-fulfillment flow can be described in
following. (Figure 16)
Register Login
Select product
Add address payment
Select shipment
Approved
Order Chanel
o
Stockes
ExchangeCancel
Exchange product es
o
RefundOut of stock
Pick and Pack Shipping
TrackingTracing
ReceiveSatisfice
Comlete
Send back
Refund
o
es
Create order
R i in O
ana in T an a tion
ana in a hou
ana in T an po tation
Cu tom R pon
ana inR
Figure 16 Description of a General E-fulfillment Flow
By reviewing the literatures, the main components of e-fulfillment are warehousing,
order processing, pick & pack, shipping and reverse (Table 2).
Table 2 Composition of E-fulfillment in Literatures
Author/ Institution
Purchasing Warehousing Order processing
Pick & pack
Shipping Sales After sales and return
Straube & Lueck x x x x x
Pyke, et al. x x x x x

Chapter 1 Introduction
17
Author/ Institution Purchasing Warehousing Order
processing Pick & pack Shipping Sales After sales
and return Lummus & Vokurka x x x x x x
Croxton,L.K. x x x x
Tarn, et al. x x x x x
Muffatto & Payaro x x x x
Agatz, et al. x x x x
Hung, H.N. x x x x x
Bulger, S. x x x x x
eCommerceMILO x x x x
Isac, C. x x x x
VendorSeek x x x x x
Weber logistics x x x x
These actions are interpenetrating and mutually inclusive, for example, pick & pack
follows order confirmation but can be carried out as same as warehousing in
fulfillment center. Therefore, e-fulfillment processes were grouped into four parts in
this thesis:
(1) Warehousing:
Receive ordered products from supplier and returned products from consumer, check
the quantity and quality of the goods before storage, sort and place goods on shelves
according to specifications and frequency of orders.
(2) Order processing:
Take consumer buying decision through successful data capture and checkout, check
whether in stock when receive order, manage the payment with customer and bank,
pick the correct items, inspect and prepare them for shipment.
(3) Shipping:
Deliver the goods “last mile” from the warehouse or DC to consumers’ address, share
information with LSP, provide consumer delivery status via multi channels.
(4) Reverse:
Manage the products damaged or inappropriate. In case of the former, transfer the
product to the repair center, for the latter, repackage and re-shelves.

Developing E-commerce Logistics in Cross-border Relation
18
It should be noted that the fulfillment center plays a key role in the whole process of
e-fulfillment. It offers a wide range of services and consolidates procurement and
distribution flows (Gudehus and Kotzab, 2012). (Figure 17)
i po alPackages, empties, waste, returns
Reverse flow Return flow
ProcurementOrganisationSchedulingSupply transportsCollection tours
ReplenishmentOrganisationSchedulingDelivery TransportDistribution tours
R i innloading, entrance control, buffer,
un-and repacking
o inLabelling, uality control, change of load carrier, preparation for storing
Sto inInstoring, keeping retrieval
Commi ioninExternal internal orders,
Shipment replenishment orders
i pat hOrder consolidation, compressing,
check out, buffering, loading
a inOne-and multi-way, packages container pallets
Distribution
S
PPLIERS
C
STOMERS
Figure 17 Functions of a Fulfillment Center
The classification of fulfillment models depends on whether the product is distributed
from fulfillment center and from whose fulfillment center (Lummus and Vokurka,
2002; Reynolds, 2001):
(1) From existing fulfillment center
In this model, merchant could distribute goods from one of its current fulfillment
centers utilizing existing facilities for shipping and picking. This approach minimizes
the upfront investment and could be launched quickly. It is well suitable for
self-operation and click-and-mortar merchants. However, this model is hard to
simultaneously execute the different processes required for different consumer groups.
(2) From dedicated e-fulfillment center
Another alternative is to acquire or establish own dedicated fulfillment centers. This
model can help merchant yield and measure the delivery costs and times required for
one-item shipments. And it is very suitable for pure player due to reduction of
delivery costs for low-margin items, such as book and computer. However, this model
needs high up-front investment and inventory-carrying costs.

Chapter 1 Introduction
19
(3) From third-party fulfillment center
In order to accommodate unpredictable demand better, merchant can lease the skills
and facilities from third party rather than owning them. Marketplaces often cooperate
with LSP due to their robust and professional capability. The primary drawback of this
model is that few existing LSPs can accommodate a wide range of products. Multiple
fulfillment centers also increase costs and required stock levels.
(4) From supplier direct to the consumer (Drop shipping)
In this model, merchant forwards the orders to supplier or distributor who will directly
ship products to consumer. The merchant acts as a sales intermediary and owns the
consumer database, while the supplier owns the products and pays sales commission.
This model is mainly used in merchant offering a wide range or generalized base of
products. The advantages include flexibility, lower inventory and facility costs. But
the merchant will give up much control over the fulfillment process, so that cannot
ensure service quality and reliability. In order to be successful with this model, the
value chain relationships must be equitable, and merchants own integrating
Web-front-end operations technology to synchronize deliveries from many points
must be in place.
(5) From existing offline stores
For traditional retailers, another possible model is to ship from existing offline stores.
This model can avoid additional facilities and share inventories for both online and
offline. But adding direct shipping capability at every store may be cost prohibitive,
and increasing the complexity of the information system integration.
1.1.3.4 E-logistics Strategy
Different merchants implement distinctive process of procurement and fulfillment.
Self-operation purchases products and fulfill orders by themselves. Marketplace
doesn’t own products, and the order could be fulfilled by LSP directly from supplier.
Click-and-mortar allows consumer pick up online order at offline store (Cai, 2010;
Fernie and Sparks, 2009). (Figure 18)

Developing E-commerce Logistics in Cross-border Relation
20
Supplier Supplier Supplier
Consumer Consumer Consumer
Click Mortar&
Supplier Supplier Supplier
Consumer Consumer Consumer
Marketplace LSP
Supplier Supplier Supplier
Consumer Consumer Consumer
Self-operation
Figure 18 Process of Procurement and Fulfillment in Different E-retailers
Therefore, in the face of different circumstances, merchants can implement the
following logistics strategy (Interlog, 2010; Masters, 2013; Wallenburg et al., 2011).
(1) In-house:
When logistics activities are critical to an enterprise’s success, they always are carried
out in-house. Merchants can purchase products by themselves in order to ensure the
quality of goods, and provide consumer logistics service through existing
infrastructure so that guarantee the timeliness of delivery. Self-operation and
click-and-mortar generally adopt this strategy.
(2) Outsourced:
When logistics’ perceived value to the focal business strategy is low. Thus the choice
to spin off the logistics function is logical. In order to focus on core businesses,
merchants can hand over control of partial even whole logistics process to LSP. In this
way, they can reduce costs and increase flexibility. Outsourcing service is
characterized by a long-term orientation and becomes an increasingly popular and
effective strategy, particularly suitable for pure-player.
(3) Drop shipping:
When the capabilities and resources for developing logistics core competence are not
available within the enterprise, while the logistics is not a critical success factor in the
decision calculus, then fully outsource the function to a capable LSP is the best choice.
In this strategy, merchants are only responsible for the online transaction, and then
transfer the consumer order to the supplier, who is in charge of order fulfillment.
Since the merchants never took possession of the product, does not incur any of the
costs associated with storing or purchasing the product. The idea of drop-shipping
packages directly to the end user is appealing to marketplace looking to streamline the
delivery process.

Chapter 1 Introduction
21
(4) Integrated:
Mixing the above strategies in different parts of logistics process forms the integrated
strategy. It is not a simple “and/or” solution between in-house or outsourced. The
decision regarding how merchant will handle its logistics obligations rests mainly
with its willingness to form partnerships with third parties and its ability to oversee
partner relationships.
1.1.4 E-logistics in Cross-border Relations
The characteristics of e-commerce decide that its competition should launch in the
global scope, therefore, e-logistics should be extended to be internationalized logistics
(Shi and Ruan, 2008). Cross-border e-commerce logistics or cross-border e-logistics
(Hereinafter referred to as CBEL) is defined as an international logistics and supply
chain system to fulfill the rise of CBE. And overseas warehouse and FTZ are main
storage models mentioned in most studies:
(1) Overseas warehouse:
Warehouse located in foreign countries and regions is called overseas warehouse,
where CBE merchants could stock in advance and then directly ship and distribute to
consumer when receive orders, gather order goods firstly and then send them together
to the destination. This solution can greatly reduce the inventory holding cost for
merchants (Meng and Zhang, 2014; Wu and Dou, 2015).
(2) Free trade zone:
It is an economic region launched or approved registration by the national customs,
where goods can be storage beforehand for a long time under customs’ supervision
and management. With this solution, CBE merchants can benefit from the large-scale
shipping, provide fast delivery and convenient return for consumer just like domestic
fulfillment (Wan et al., 2014).
Based on these two storage models, the CBEL strategies are mainly divided into the
following three categories. (Figure 19)

Developing E-commerce Logistics in Cross-border Relation
22
Overseas Supplier LSP Customs Clearance Consumer
Overseas Supplier
Overseas Supplier
Overseas Supplier
Overseas Supplier
Overseas Warehouse
LSP
Customs Clearance
Customs Clearance
FT Fulfillment
Center
Fulfillment Center
Consumer
Consumer
Consumer
Consumer
Consumer
Consumer
Cross-borderShipping
Cross-borderShipping
Cross-borderShipping
i t mail
oo oll tion
Bon impo t
Figure 19 Logistics Strategies in CBE
(1) Direct mail
Products will be directly shipped from overseas supplier. Airlift is the most common
transportation mode. Using this model merchant can easily operate logistics and avoid
additional inventory costs. But meanwhile, high shipping cost and hard to return are
main disadvantages. This model is suitable for marketplace, or SMEs to sell long-tail
products.
(2) Goods collection
This model is similar to direct mail, but firstly, merchants gathered the orders during
the same period into overseas warehouse, and then ship them together. The advantage
is to reduce the shipping cost because of scale effect. However, this model requires
high ability of overseas warehouse management, multimodal transportation and
information systems. Therefore, it is suitable for large self-operation enterprise and
click-and-mortar.
(3) Bonded import
In this model, merchants can stock abundant goods in FTZ warehouse beforehand
through cheap ocean shipping, then delivery goods by local distribution when receive
order. The transportation cost of this model is the lowest, and the delivery speed is the
fastest. However, good ability of demand forecasting is required due to pre-inventory.
Otherwise it will result in higher inventory costs and shortage costs. This model is
particularly suitable for hot-selling products.
No matter CBE merchants choose which logistics model, the implementation of
e-logistics in cross-border relation is not an isolated act of a single enterprise. The best

Chapter 1 Introduction
23
way is to seek assistant from LSPs, which is an acceptable cost-effective manner to
ship to international destinations (Fernie and Sparks, 2009; Rao and Young, 1994;
Reynolds, 2001). Like for direct mail, the major services provider for cross-border
shipping into China are international express carrier, postal parcel and shipping agent,
their usage rate respectively are 69.1%, 66.9% and 54.7% (iResearch, 2015b).
1.2 Research Motivation and Question
Under e-commerce age, marketing is no longer the emphasis among many mature
merchants (Ricker et al., 1999). The logistics-related issues were shown to be still the
biggest concern in many studies (Pitney Bowes, 2010). Some researchers believe that
logistics may impede the successful development of global-businesses and also
international e-commerce (JLL, 2013; Xu et al., 2002). As in table 1 before, 92%
studies mentioned logistics as a main barrier in CBE. Specifically, long transportation
time (64%), bad return service (50%), and high shipping cost (36%) are key problems.
The major reason is due to the changes in consumption patterns caused by the rise of
e-commerce and globalization. The traditional system is not sufficient to manage the
new challenges (Delfmann et al., 2002; IPC, 2010). Logistics systems should be
designed to meet the following requirements: small, diverse and high frequency
pickups; deliveries at different locations; different packaging; different schedules;
stringent customer service requirements (Hu, 2015; Samiee, 2008; Tarn et al., 2003).
The logistical in cross-border is proving to be complex and costly. In order to improve
the logistics’ efficiency in CBE, the implementation of e-logistics system is necessary
(Islam and Zunder, 2013). However, many enterprises do not know how to implement
e-logistics in cross-border relation. They still applied old models to new business and
lack an effective logistics strategy (Reynolds, 2001; Ricker et al., 1999). Meanwhile,
plenty of studies and researches on the topic of either e-commerce or logistics have
been published over the last two decades, but the development of CBEL is a joint
effort carried out by both topics that few studies focused on (Ho et al., 2006). This is
still an area that requires more in-depth study and investigation. Therefore, the aim of
this thesis is to fill this gap, and provide value both in theory and practice.
The key research question (RQ) in this thesis is:
How to develop an effective and competitive CBEL?

Developing E-commerce Logistics in Cross-border Relation
24
More specifically, three sub-questions were addressed as follow:
RQ1: What is the current situation of CBE and e-logistics?
- What are the drivers, barriers and trends of CBE?
- What are the definition and structure of e-logistics in CBE?
This question is the origin of this thesis. By answering it, clear where the field
currently stands and the type of research that is needed to advance, hackle e-logistics
strategies in CBE and reveal existing problems of CBEL developing.
RQ2: What factors affect the development of CBEL?
- What are the key factors and the relationship between each other?
- What’s the different between China and Germany?
This question is the basis of the entire thesis. By answering it, construct a conceptual
framework to present key factors which affect the development of CBEL, and
understand the comparison in different countries.
RQ3: How to formulate competitive strategy of e-logistics in cross-border relation?
- How to adopt an appropriate strategy for problem in CBEL?
- How to develop the strategy with considering the impact of these factors?
This question is practicability of this thesis. Based on the framework, formulate the
comprehensive logistics strategy to solve problem in CBEL developing and increase
the competitive advantage of enterprises.
1.3 Research Method
In order to solve the above research questions, both theoretical method and empirical
method were adopted in this thesis.
1.3.1 Systematic Literature Review
Research can be understood as systematic investigation to develop theories, provide
evidences and solve problems. When start a research, we can either undertake new
research or learn from what others have already studied. No matter what kinds of, the
significance and found will inevitably be judged in relation to other people’s research
and their findings. Therefore, researchers need to “map and assess the existing
intellectual territory” that will enhance subject knowledge and help to clarify research
question further. This process is called “literature review” (Tranfield et al., 2003).

Chapter 1 Introduction
25
Traditional literature reviews summarize what is known on a topic of interest, and
provide details on the typically present research findings. However, sometimes the
review author didn’t explain the criteria used to identify, or ignore the other
potentially relevant studies because of unaware. If the including studies are not
explicit, it is not possible to assess the appropriateness and consistency of the result,
also not possible to interpret the meaning of the review findings (Angela et al., 2013).
In contrast, systematic literature review uses a more rigorous and well-defined
approach (Ryan, 2010). A systematic review is a literature review that is designed to
locate, appraise and synthesize the best available evidence related to a specific
research question to provide informative and evidence-based answers. It is considered
the best way to synthesize the findings of several studies investigating the same
questions, and help to develop a good understanding and insight into relevant previous
research and the trend that have emerged.
Systematic reviews often proceed through a number of following stages (Angela et al.,
2013; Gough et al., 2012; Khalid et al., 2003): framing questions for a review;
literature searching; quality assessment and data extraction; analysis and synthesis;
interpreting the findings. The literature sources are very wide and can be divided into
three categories (Mark et al., 2009):
- Primary literature sources: including published sources such as reports, white
papers and planning documents, else unpublished manuscript sources such as
letters, memos and committee minutes.
- Secondary literature sources: such as books and journals which are aimed at a
wider audience. They are easier to locate than primary literature.
- Tertiary literature sources: also called “search tools”, such as indexes and
abstracts which are designed either to help to locate primary and secondary
literature or to introduce a topic.
In this thesis, systematic literature review was mainly used for identifying, evaluating
and synthesizing existing research related to CBE and e-logistics in Chapter 1 and
Chapter 2.
1.3.2 Case Study
Case study is a strategy for doing research which involves an empirical investigation
of a particular contemporary phenomenon within its real-life context using multiple
Developing E-commerce Logistics in Cross-border Relation
26
sources of evidence (Robson, 2002). And it can be classified into following three
types (Zaidah, 2007; Pamela and Susan, 2008; Yin, 2013):
- Exploratory: this case study sets to explore any phenomenon in which the
intervention being evaluated has no clear, fieldwork and data collections are
frequently undertaken prior to defining the final questions and hypotheses. It is
often considered a prelude to prepare an initial framework of the study, usually
focus on “what” questions, such as “What are the ways of increasing sales?”
- Descriptive: this case study is used to present a complete description of a natural
phenomenon within its context. It begins with a theory to support the description
of the phenomenon and to point the right direction of data collection. Research
questions here can again focus on “what”, such as “What have been the effects of
a particular sales activity?”
- Explanatory: this case study tests the data and finds out the cause-effect
relationships in real-life, in order to explain why or how the thing happens or
happened. It is more likely to answer “How” or “Why” questions, such as “Why
did a particular promotion activity lead to increased sales?”.
In this thesis, case study was mainly used to collect experts’ scores on influencing
factors in Chapter 2; generalize the logistics problems and strategies of case
enterprises in Chapter 4; verify the rationality and practicability of the framework in
Chapter 8.
1.3.3 Factor Analysis
Factor analysis is a statistical technique, which is used to examine the relationships
between variables and measure the extent of sharing common variance. It is
sometimes termed a “data reduction” technique because the method is frequently used
to determine if the information could be extracted in a few underlying components or
condensed relevant variables into groups from a large initial set of observed variables
(Janssens et al., 2008).
Approaches to factor analysis can be grouped into two different types, “exploratory
factor analysis” (EFA) and “confirmatory factor analysis” (CFA). In the case of EFA,
the researcher may have only a vague idea at best as to how many factors are included
in the set of variables being studied. In addition, they may not have strong
expectations as to which observed variables will be associated with which factors. The

Chapter 1 Introduction
27
EFA is thus used to gain an understanding of how variables might be related and
discover the likely underlying factor structure. Factors in EFA are typically defined as
uncorrelated to one another. The CFA is more sophisticated. The researcher has
expectations as to the true number of underlying factors and can apply different types
of tests to determine if the hypothesized structure is correct (Child, 2006).
In this thesis, exploratory factor analysis was mainly used to group the meaningful
factors together and sort out the key factors affecting the development of CBEL in
Chapter 2.
1.3.4 Game Theory
Game theory is the study of the ways in which interacting choices of economic agents
produce outcomes with respect to the preferences (or utilities) of those agents, where
the outcomes in question might have been intended by none of the agents. Simply said,
the content of game theory is the analysis of a very wide spectrum of decision
influencing situations. In some respects, game theory is the science of strategy, or at
least the optimal decision-making of independent and competing actors in a strategic
setting (Sawyer, 2012; Sláviková, 2015). Especially in mathematical economics and
business, it is used to understand a large collection of economic behaviors, including
behaviors of government, firms, markets, and consumers (Myerson, 1997; Shapiro,
1989).
A strategic game consists of the following elements (Osborne and Rubinstein, 2011):
- A finite set N (the set of players)
- For each player i N a nonempty set iA (the set of actions available to
player i )
- For each player i N a preference relation ia on j N jA A (the
preference relation of player i ).
- Under a wide range of circumstances, the preference relation ia of player i in
a strategic game can be represented by a payoff function iu , also called a utility
function.
A game theorist typically uses these elements, along with a solution concept of their
choosing, to deduce a set of equilibrium strategies for each player such that, when
these strategies are employed, no player can profit by unilaterally deviating from their
strategy (Rasmusen, 2007). A common assumption is that players act rationally.

Developing E-commerce Logistics in Cross-border Relation
28
In non-cooperative games, the most commonly used solution concept in game theory
is that of Nash equilibrium. This notion captures a steady state of the play of a
strategic game in which each player holds the correct expectation about the other
players’ behavior and acts rationally. Each represents a best response to the other
strategies. If all the players are playing the strategies in Nash equilibrium, they have
no unilateral incentive to deviate, since their strategy is the best they can do given
what others are doing. When the players’ choices are not deterministic, the notion of
mixed strategy Nash equilibrium is designed to model a steady state in which either
one outcome occurs or a set of outcomes occur with known probability. A mixed
strategy Nash equilibrium of a strategic game is Nash equilibrium of its mixed
extension. It follows that every action in the support of any player’s equilibrium
mixed strategy yields that player the same payoff.
In this thesis, game theory was mainly used to formulate logistics competitive strategy
in cross-border relation from Chapter 3 to Chapter 7.
1.4 Research Content
In order to make the research process more logical and the chapters’ arrangement
more reasonable, an abductive research process was adopted. Abductive reasoning
emphasizes the search for suitable theories to an empirical observation, which call
“theory matching” or “systematic combining” (Kovács and Spens, 2005). This
process starts with a real-life observation and attempts to find a new matching
framework or to extend theory used prior to this observation. Its purpose is to
understand the new phenomenon and to suggest new theory (Figure 20).
Prior theoretical knowledge
Theoretical framework
Theory suggestion
Real life observations case studies
Application of conclusions
Status observation
Deductive Inductive
Theory Matchingor
Systematic Combining
Figure 20 Abductive Research Process
This thesis aims to propose new theory in the area of CBEL by further building on and
developing existing theory on e-commerce and international logistics. Refer to the

Chapter 1 Introduction
29
abductive reasoning process suggested by Purvis et al. (2014, P.105). In this thesis,
stage 1 began with the question presented by the status observation and some prior
theoretical knowledge with regards to the CBE and e-logistics. In stage 2 theory
matching, survey and case study were used to collect observed data in real-life for
constructing a conceptual framework and explore what the main factors that affect the
development of CBEL. Then, based on above, the comprehensive logistics strategy to
increase the competitive advantage of enterprises were presented. Further research
employed a case study in order to test the new theory proposed and assesses its
generalizability in stage 3. (Figure 21)
Chapter 2Conceptual framework
Chapter 4 E-logistics strategy
design in CBE
Chapter Case study
Chapter 3Game model in
CBEL
Chapter 1Theoretical knowledge
Deductive Inductive
Theory Matchingor
Systematic Combining
Chapter Conclusion
Stage 1 Stage 2 Stage 3
Figure 21 Research Process of Thesis
This thesis is composed by 8 chapters (Figure 22) and each chapter will be briefly
introduced as following:
Chapter 1 – Introduction
The introduction is aim to attract attention and raise interest to the area of research. In
this chapter, an overview of this thesis was presented, including definition, motivation,
question and method. At last, the structure of thesis and the relevance between each
chapter were explained.
Chapter 2 – A Conceptual Framework of Developing CBEL
The basis of the entire thesis is to find the main factors affecting the development of
e-logistics in cross-border relation. In this chapter, firstly, a systematic literature
review was used to find initial factors, then a questionnaire was deigned to collect
case enterprises’ data and the factor evaluation from experts. At last, a conceptual
framework was presented through factor analysis, which consists of 6 key factors

Developing E-commerce Logistics in Cross-border Relation
30
including “Government”, “Consumer”, “Company”, “Product”, “Operation” and
“Partnership”.
Chapter 3 – Game Model and Strategy between Behavior Subjects of CBEL
Based on the framework obtained in Chapter 2, “Government” and “Consumer” are
external factors which represent the social environment and determine the
development direction of enterprise. In this chapter, a trilateral game model was used
to clearly understand the relationship between government, merchant and consumer
for the development of CBEL. As an organizer, the government plays a key leading
role for the implementation strategy of e-logistics in cross-border relation.
Chapter 4 – A Decision Model of E-logistics Strategy in CBE
Besides the government’s support, the merchant should also actively seek effective
approach to resolve the problems encountered in the development of CBEL. In this
chapter, based on the survey results, considering internal factors “Company” and
“Product”, a general normative decision model was presented to help merchants adapt
the “logistics strategy” to possible forms of the “logistics problem” in CBE.
Chapter 5 – Competitive Strategy Based on Product and Service Differentiation
When formulate the logistics strategy, in addition to the logistics problems
encountered by self, merchants should also take into account the increasingly fierce
competition between each other. In this chapter, based on consumer utility, a game
model was built to analyze how differentiation of internal factors “Product” and
“Operation” affect the competitive strategy making. Finally, the optimal pricing and
service level under centralized and decentralized decision were formulated.
Chapter 6 – Competitive Strategy for Inventory and Transportation in CBE
Inventory and transportation are the main components of e-logistics, which is difficult
to attain for a single enterprise and requires cooperation between members in whole
supply chain. In this chapter, internal factors “Operation” and “Partnership” were
considered for balancing the relationship between supplier, retailer and LSP in
cross-border relation. The inventory strategies under centralized and decentralized
decision, the transportation strategy under LSPs cooperation and non-cooperation
condition were obtained through the equilibrium solution and the numerical analysis.
Chapter 7 – Case study
In this chapter, the experts in Walmart and JD.com were interviewed to explain how
they operate CBE and implement e-logistics successfully in China’s market. The

Chapter 1 Introduction
31
Walmart Global Store at JD.com Worldwide was chosen as case study to evaluate the
rationality and applicability of the conceptual framework.
Chapter 8 – Conclusion
Identify propositions and conclusions that may lead to better adoption of new practice
with more desirable implementation outcomes. In this chapter, the research results
were summarized to demonstrate the answers of the three research questions. Then,
the limitations of the study were presented and some of which can serve as extensions
for future research.
Research Method
Company ature
Product Type
CBEL Development of Walmart and D com in China
Overall Summary and Outlook
Research Defination
21 Initial Influence Factors
Chapt nt o u tion
Research Question Research Structure
Chapt i ion o l o o i ti St at y
Chapt Con ptual am o
Chapt am o l t n Su t o CB
Chapt i ntiat Comp titi St at y
Chapt Ca Stu y
Chapt Con lu ion
Status Observation
Prior Theoretical nowledge Literature Review,Factor Analysis
Real Life Observations Case Study
Framework Application Game Model
ew nowledge
ey Factors composed of 1 Indicators
Government
ConsumerMerchant
Logistics Cost
Logistics Service
Chapt n nto y an T an po tation St at y
Product Range
Service Quality
2 External Factors 4 Internal Factors
Figure 22 Structure of Thesis

Developing E-commerce Logistics in Cross-border Relation
32
2. A Conceptual Framework of Developing CBEL
When start a research, the existing intellectual territory need to be mapped and
assessed, in order to enhance subject knowledge and help to clarify research questions
further. Learn from what others have already studied that will help to develop a good
understanding and insight into relevant previous research and the trend that have
emerged. The core of thesis is to find the main factors affecting the development of
e-logistics in cross-border relation. In this chapter, firstly, a systematic review was
used to find initial factors, then, in order to group the meaningful factors together,
factor analysis was conducted with the data collected by online questionnaire survey.
2.1 Literature review In order to identify research evidence for the systematic review, searching multiple
electronic databases was chosen. The selected databases were: Elsevier, Emerald,
Taylor and Francis, Springer, ABI, and Inderscience. This study searched for relevant
articles including academic journals, books, book chapters, conference proceedings,
reports, etc. And only considered articles published in English and Chinese in order to
fully analyze without misunderstanding in translating. The searching keywords are
used simultaneously as following:
- “cross-border” or “international” or “global”
- “e-commerce” or “ecommerce” or “electronic commerce”
- “supply chain” or “logistics” or “fulfillment”
The references in the obtained publications and recommendations from other
researchers were also examined to find additional studies.
A total of 582 articles published were found in the initial search (Table 3). Then, three
criteria were developed to screen studies for inclusion in this analysis. First, the topic
of the study must include e-commerce logistics and global supply chain. Second, the
focus of the study must be on the B2C process rather than B2B or C2C. Third, the
emphasis is on consumer product instead of industrial product. The resulting sample
of 73 studies that qualified for our analysis was investigated independently by two
researchers for pertinent information to ensure agreement. All the inconsistencies
(overall agreement >93%) were solved through a discussion and the participation of
the third researcher.

Chapter 2 A Conceptual Framework of Developing CBEL
33
Table 3 Searching Results of Systematic Literature Review
Resource Initial list After title/abstract reading After full text reading
Web of Science 121 43 22
BSC via EBSCO 354 40 15
Extra literature from reference 107 57 36
Total 582 140 73
As shown in Figure 23, the publication does not have a prominent trend, but has been
obvious increasing since 2015.
Figure 23 Distribution of Publishing Year in Systematic Literature Review
Table 4 shows the research methodologies used in the reviewed articles contained in
the database. The proportion of theoretical (48%) and empirical approach (52%) are
almost same.
Table 4 Research Methodologies Used in Systematic Literature Review
Method Total Procedure Tool Num. of articles Theoretical 37
Descriptive study 17 Conceptual modeling 9 Literature review 7 General 5 Systematic 1 Content analysis 1 Mathematical 4 Game theory 2
FANP&PFIGP 1 Analysis of variance 1

Developing E-commerce Logistics in Cross-border Relation
34
Method Total Procedure Tool Num. of articles Empirical 40
Case study 17 Multiple 9 Single 8
Survey 23 Data collection
Questionnaire 17 Interview 11 Focus group 3 Delphi 2 Statistical
analyses Structural equation modelling 6
Experts grading 4 Factor analysis 4 Regression analyses 3 Fuzzy AHP 2 Confirmatory factor analysis 1 SWOT analyses 1
DANP 1 IPA 1 Partial least squares 1
As it is shown, descriptive study (46%) is the most widely used theoretical approach,
followed by conceptual modeling (24%), and literature review (19%). In total, 43% of
the empirical studies were qualitative case studies. Questionnaire survey and
interview have been the main tools for gathering qualitative data for case studies.
Among the statistical methods used, structural equation modeling (SEM) is the most
popular one. It is worth noting that many papers used multiple methodologies.
Although numerous articles on e-commerce and international logistics have been
published over the last two decades, none have thoroughly reviewed nor concluded to
the effect of e-logistics in CBE research. This is due to the fact that it is still a new
topic and deserves to explore and further study (Liu et al., 2015). It is therefore
essential for this fragmented research (investigating just a few varied factors in more
depth, or a range of factors in less depth) to be combined in a more cohesive and
comprehensive manner. Thus, the purpose of this research is twofold. First, intends to
consolidate the existing research efforts concerning the impact towards CBE, global
logistics, and supply chain by providing a systematic literature review that is greater
in breadth and depth than previous studies. The second goal is to comprehensively
analyze the existing literature as it pertains to the past and current trends to reveal
existing literature gaps. Hope that by summarizing the literature and identifying the
gaps, it provides CBEL academics and practitioners a clear knowledge of where the
field currently stands and the type of research that is needed to advance.

Chapter 2 A Conceptual Framework of Developing CBEL
35
With the initial influencing factors identified from the literature review, a focus group
discussion was conducted to filter these factors and organize them into a two-level
hierarchy. The reason for applying the focus group discussion method because it is a
carefully planned discussion designed to obtain perspectives regarding a definite topic;
it was possible to invite and obtain the contribution of participants with known
involvement and expertise. To ensure that a comprehensive and meaningful result
would be derived, a total of 3 focus groups were organized in compliance with the
focus group requirements of knowledgeable, homogeneity and heterogeneity. Each of
which had three to six participants, who had years of substantial work experience and
spread across several major disciplines of e-commerce and logistics operation. They
were asked the following two questions:
- Which factors are fractional but related enough to be combined into one?
- Which factors are similar in nature and can be grouped into categories?
The factors affecting the implementation of CBEL are highly complex, previous
studies provided various single factors or focused on a particular factor. After
systematic synthesized, a two-level hierarchy of factors is comprised of 7 high-level
key dimensions of company, product, country, market, technology, operation and
partnership, and 21 detailed-level factors are constructed as shown in Appendix 1. The
reference following the factors denotes literature in which the factor was originally
been discussed. The relative importance of factors is not represented by the number of
references in which it was discussed.
The result addressed that ICT application and outscoring strategy are the most
mentioned factors. The important component in the setting-up an e-logistics system is
developing a logistics community network with suitable ICTs and outsourcing
strategy (Gunasekaran et al., 2007; Hernandez et al., 2014). In the following sections,
each of factors is explained in more detail.
2.1.1 Company
Nature of business
Industry type and business scope are identified as important determinants for
e-business adoption (Hafeez et al., 2010). Also, the variation of business model
surrounding which party owns the inventory will determine the complexity of the
possible logistics issues (Ghezzi et al., 2012). Pure player can expect the greatest

Developing E-commerce Logistics in Cross-border Relation
36
annual online growth expectations due to the ability to offer a broad range of products
without any physical store operations cost. A marketplace is a crucial driving force for
CBE across the world, where merchants can easily operate an online store without
high investment while utilizing the customer base the e-marketplace has accumulated.
Size of company
A variety of company size has been suggested to impact innovation and technology
adoption. The large company will have capacity to implement new systems and
technologies as well as to enjoy the benefits of economies of scale from adoption (Ho
et al., 2012). However, larger companies are less flexible in implementing new
technology due to internal process and existing complexity. Smaller organizations are
more likely to be innovative because of the flexibility afforded by smaller size and
fewer levels of bureaucracy. But at the same time, they will face higher delivery costs
due to weak bargaining power to negotiate with logistics operators, and generally
suffer from limited resources - financial, technological and human resources
(Patterson et al., 2003).
Human factor
Either manager or staff, employees are the most valuable assets for a company to
ensure smooth operations. This impacts the successful implementation of IT in SCM.
Human resource can be considered as a situational variable whose knowledge, skills,
goals and personalities must be previously evaluated during the recruitment process.
These factors can be improved over time through employee training and development.
A company can fully utilize their strength to capture the opportunities brought on by
the implementation of e-logistics and to make it competitively advantageous to its
competitors. Therefore, well-trained staffs are the backbone of any good company
which is more willing to implement e-logistics system (Ho et al., 2012). Management
support/commitment is another human factor for an enterprise level IT/IS system
implementation, which usually exist across multiple organizations (Gunasekaran and
Ngai, 2004). The commitment of the management can allocate enough financial
support and the deployment of the necessary resources for achieves the project’s
success. In addition, management support will ensure that the project should take
priority and receive constant attention within the organization (Hernandez et al.,
2014). Manley points out that the degree of support for the management of a project
on the part of management will give rise to significant variations in the acceptance or
resistance on the part of involved parties (Hwang and Lu, 2013).

Chapter 2 A Conceptual Framework of Developing CBEL
37
2.1.2 Product
Range of commodity
Offering a wide range of products online is a critical success factor for many
e-commerce retailers. The product range is a very important factor that will
significantly affect logistics complexity and increase management costs. For example,
the greater product range will generate the greater complexity of procurement
network and, as a consequence, the higher procurement costs (Ghezzi et al., 2012).
Property of product
Logistics strategy depends on the specific logistics problem, which has to be fully
analyzed by the merchant in terms of product features (Ghezzi et al., 2012). Within
the literature, product type (either commodity or innovative) is one of factors have
been described as influencing supply chain selection and a key performance measure
in logistics, such as sourcing decisions (Fraering and Prasad, 1999; Lovell et al.,
2005). The properties of the product being moved or stored, such as its value, size,
and typical demand pattern (seasonal or regular) are key drivers of inventory carrying
costs and influence the choice of inventory ownership (Mason et al., 2003).
The factor of product value, physical size/weight and their ratio, generally known as
value density is widely recognized as an important impact on logistical costs within
final product price and logistical performance, such as shipping costs and inventory
complexity (Gunasekaran and Kobu, 2007; Maruntelu, 2008). Customer expectations
are higher for products with a high value density. Because of expensive to inventory
and relatively inexpensive to move, it more centralized inventory holding associated
with higher product value densities (Wanke and Zinn, 2004).
Obsolescence of products is a critical variable analogous to demand variability in
influencing supply chain decision. For example, perishable products are risky to
inventory, therefore it will affect decisions regarding procurement, distribution, and
centralization. The shorter the product lifecycle, the more sensitive to depreciation,
this will generally yield higher than expected inventory-related costs. Goods with
short shelf lives or that are fragile, such as groceries and food, make logistics more
difficult in international trade due to the complexity of the environment (temperature,
humidity, presence of contaminants, etc.) that has to be considered in both warehouse
and delivery management. Food quality is determined by perishables conditions,
which is used to measure the logistics performance (Rao and Young, 1994; Van der
Vorst et al., 2009).

Developing E-commerce Logistics in Cross-border Relation
38
2.1.3 Government
Infrastructure
When analyzing the viability of e-commerce in any country, infrastructures including
electronic network, transportation, public facilities, banking and accounting are major
factors that may be considered (Murillo, 2001). In particular, the unsatisfactory
quality of the transportation and communications infrastructure will obstruct
successful international sourcing and logistical operations (Fraering and Prasad, 1999).
Infrastructure development is likely to act as an external constraint factor within the
global supply chain operating and design (Ibrahim et al., 2015; Lovell et al., 2005).
Healthy e-commerce infrastructure needs to be supported both by advanced
technologies and by a supportive business, regulatory and cultural environment (Ng,
2009).
Tax and tariff
With the globalization of the world economy and the increasing diversity and
environmental issues, global SCM is more complex and has been emphatically
affected compared to domestic SCM as it includes different taxes and duties,
differential exchange rates, trade barriers (Tyan et al., 2003). All of these factors will
influence a firm’s global strategy, component sourcing, factory location and
geography related decisions (Hameri and Hintsa, 2009; Ibrahim et al., 2015; Lovell et
al., 2005). Thereinto, the barriers to trade (tariff and non-tariff barriers) constitute a
significant logistical obstacle in international business (Kawa and Zdrenka, 2016; Xu
et al., 2002). Tariff has direct implications on final price for e-consumers. It increases
the costs of imported goods and discourages sourcing from abroad (Fraering and
Prasad, 1999). Conditions in a country have a very significant impact on the type of
logistics system. An environment with low tariffs will promote a greater flow of
goods between nations.
Currency exchange
Currency exchange rate is also a critical factor that complicates the supply chain
management scenario, such as influence supply chain location decisions (Youngdahl
and Loomba, 2000). Different currencies are important in developing e-commerce
marketing channels across international borders (Boyd et al., 2003). They affect the
ability of a firm to procure abroad (Fraering and Prasad, 1999). When exchange rates
remain stable, due to the minimal risk of sourcing from overseas, an external global

Chapter 2 A Conceptual Framework of Developing CBEL
39
supplier becomes attractive. If exchange rates are volatile (the value of money made
today may be different from money made tomorrow) and there is economic instability,
international firms are exposed to high inventory costs (Xu et al., 2002).
Customs clearance
In CBE logistics, the condition become more complex, shipments often have to be
subjected to additional operations, such as clearing through customs. This prolongs
the delivery fulfillment time, and direct implications for e-consumers satisfaction
(Boyd et al., 2003; Samiee and Walters, 2006; Yang and Shen, 2015). Electronic
customs clearance can improve efficiency, but restricted by technology. The
comprehensive level of international logistics industry in developing countries has a
great gap compared with developed countries (Wang et al., 2015). As organizations
globalize, guidance will be required in the intricacies of customs clearance (Tyan et
al., 2003; Youngdahl and Loomba, 2000).
Law and regulation
The positive policy and regulation in promoting ICT and e-commerce can influence
e-commerce success, such as prevent or delay products’ entry to the market (Wang et
al., 2015). Complex legalities will affect consumers who order items from foreign
companies (Boyd et al., 2003). Sustainable development of modern logistics must rely
on a stable regulatory environment (Shi and Ruan, 2008). The content and execution
of government’s rules and regulations have become the main cause of barriers to
e-commerce policy in logistics and a constraint in ever more complex and global
supply chains operate (Hwang and Lu, 2013; Lovell et al., 2005; Ng, 2009). Laws and
regulations indirectly influence the international logistics performance through
impacting the execution of cross-border payments, technology applications and
electronic clearance. Some emerging markets still lack the relevant laws for the
developing CBEL (Liu et al., 2015), especially for promoting the reverse logistics
concept to companies (Ho et al., 2012). The government should popularize the
e-logistics and e-supply chain knowledge with favorable policies and industrial
information, meanwhile, promote the establishment of a suitable e-logistics system by
providing an information platform and issuing some stimulant policies (Hameri and
Hintsa, 2009; Ibrahim et al., 2015).
Developing E-commerce Logistics in Cross-border Relation
40
2.1.4 Market
Demand variability
The market factor of demand variability and its influence on supply chain design
(which includes inventory levels and locations) are widely discussed in the supply
chain literatures (Lovell et al., 2005). The demand variability is significant and
negative with respect to the logistics strategic decision. In particularly, it impacts on
inventory centralization decisions. Variation of product inventory turnover could lead
to inventory decentralization (Wanke and Zinn, 2004).
Cultural difference
Cultural factors play a significant role in determining the right performance measures
and metrics for effectively managing logistics operations, particularly in a competitive
global economy (Gunasekaran and Kobu, 2007; Murillo, 2001). The flows of
information and goods cross borders and encounter cultural differences along the way.
The typical differences are language and taste, which can change the distribution
culture of that market (Fernie and Sparks, 2009; Youngdahl and Loomba, 2000).
Besides, participants in a global supply chain should not only carefully manage the
cultural differences but also corporate culture compatibility for achieving supply
chain-orientated benefits (Boyd et al., 2013; Ibrahim et al., 2015; Rajaguru and
Matanda, 2013).
2.1.5 Technology
ICT application
ICT is an indispensable tool for setting-up of an e-logistics system and improved
operations of logistics and supply chain systems (Gunasekaran et al., 2007;
Hernandez et al., 2014; Patterson et al., 2003). ICT in e-commerce affect traditional
supply chain practices, such as changed the distribution of consumer goods (Capineri
and Leinbach, 2004), improved the procurement efficiency (Swaminathan and Tayur,
2003), applicable service tracking approach-GPS used to pinpoint shipments in transit
(Hu et al., 2015; Trappey et al., 2004), and supported the implementation of
sustainability (So et al., 2012). ICT is a fundamental support for linking and
integrating both front-end and back-end processing in a supply chain. It increases
efficiencies in supply chain management and strategic business relations, because it
provides all parties (suppliers, intermediaries, and customers) with better and
real-time accessing and information sharing, making logistics services more accurate,

Chapter 2 A Conceptual Framework of Developing CBEL
41
faster and cheaper (Giménez and Lourenço, 2008; Krmac, 2007; Terzi, 2011). Thus,
investing in cost-effective ICT is a key to increasing logistics flexibility and providing
a more effective shopping experience for the customer (Gunasekaran and Kobu, 2007;
Rao, 2000; Zhang, 2005).
The information revolution has enabled firms to develop supply chains globally. ICT
stimulates the globalization of logistics operation. Its applications level had a
significant impact on international logistics (Wang et al., 2015). In global competition,
the companies must accelerate the incorporation of the advanced ICT in business
strategies and in their logistics activities, with partners to establish more effective and
efficient supply chains (Maruntelu, 2008; Van der Vorst et al., 2009). Meanwhile, the
cost of ICT application is increased due to the complexity of booking, cross-border
tracking and other transactions and the global reach of the logistics processes (Rao
and Young, 1994).
In order to overcome the ever-increasing complexity of the systems, the advanced
ICT deepens further and matures, including electronic data interchange (EDI),
wireless and mobile communication technologies, radio frequency identification
(RFID), enterprise resource planning (ERP), extended markup language (XML),
Internet and Web technologies. For high-intensity adoption, multiple tools such as
EDI and ERP, are used to establish only linear links between one buyer and one
supplier (Puschmann and Alt, 2005; Tai et al., 2010; Tanner et al., 2008). However,
implementing and maintaining EDI is costly, only large-sized enterprises can afford it
for recurring volume purchases between frequently trading partners (Croom, 2005;
Kehoe and Boughton, 2001; Tai, 2011). For low-intensity adoption, Web-based
technologies can be used to create a vast network in the supply chain (Hung et al.,
2014; Wagner and Essig, 2006; Wu et al., 2007), which provide SMEs with more
options in selecting and configuring systems, and enable them to achieve higher levels
of performance (Croom and Brandon-Jones, 2007; Saeed et al., 2005).
2.1.6 Operation
Payment
In order to have a successful logistics operation, a company needs to maintain
effective financial flow. Online payment is a common barrier to e-commerce policy in
logistics, and it had a significant impact on international logistics (Ng, 2009). The
existing payment system did not satisfy the need of CBEL, particularly in developing

Developing E-commerce Logistics in Cross-border Relation
42
market (Wang et al., 2015). Therefore, realize local payment preference, provide
multiple payment options, improve security and reduce fraud are the primary targets
for CBE merchants.
Warehouse and inventory management
Warehouse promotes efficiency and quality of CBE logistics. As a buffer in
cross-border supply chain for storage, a warehouse is a transshipment center
connecting suppliers and cross-border inspection points. It can be used to provide
temporary storage before receiving the delivery order from customers, consolidate
products from different sources of suppliers, and provide value-added services such as
packing/repacking and palletization (Lam et al., 2012). Most SMEs choose parcel
direct mail through Universal Postal Union or international express, but it is not
enough in the rush season for shopping. It is a normal phenomenon that expresses
overstocks and blasting warehouse, which make an obstacle to the development of
cross-border electronic commerce logistics. “Overseas warehouse” or “FTZ
warehouse” are preferred when the order volume is big, and aim to reduce cost and
improve timeliness. Through data collected by warehouse management systems such
as inventory levels in supplier/customer and key customer ordering patterns,
companies can determine what to store, where and how much effectively
(Gunasekaran et al., 2007; Mason et al., 2003; Xu et al., 2002).
For logistics companies servicing international e-businesses, proper inventory
management is basic requirements in order to maintain customer loyalty and control
costs. Inventory management is still considered to be the most important managerial
task in logistics operations. Vendor managed inventory (VMI) model has attracted
much interest due to its high-performance result in e-logistics (Ji et al., 2006). There
is a clear benefit in quantifying inventory turnover and delivery time trade-offs when
managing a VMI system. Under the VMI system, the supplier decides on the
appropriate inventory levels for each of the products and the appropriate inventory
policies to maintain these levels, giving the manufacturer greater flexibility in
replenishing without directly involving the retailer (Tyan et al., 2003; Wanke and Zinn,
2004; Zairi and Al-Mashari, 2002).
Sustainability
Sustainability is among the top global concerns. More attention has been given to
sustainability by introducing the notion of “green” as importance in logistics and
Chapter 2 A Conceptual Framework of Developing CBEL
43
SCM fields and firm’s global strategy (Alkhatib et al., 2015; Ibrahim et al., 2015). As
consumers are becoming more environmentally-conscious, retailers’ green strategy is
becoming a more important competitive differentiator, because environmental
initiatives can reduce cost and increase customers’ loyalty (Fernie and Sparks, 2009).
Environmental issues with emission quotas will reshape both how supply chains are
structured and how companies will seek energy efficient transportation solutions
(Hameri and Hintsa, 2009). When design global supply chains, the environmental
influence and approach must be addressed, the demand for sustainability need be
considered. However, it is further complicated in management (Capineri and
Leinbach, 2004; So et al., 2012; Van der Vorst et al., 2009). The implementation of
reverse logistics in return processes that supports product recovery and goods return
to the suppliers will reduce waste. Effective returns management is based on viable
product return policy and to address the rising concern of the public on environmental
issues (Ho et al., 2012). The role of the government should be identified by
establishing regulations or policies to promote the reverse logistics concept to
companies.
One-stop service
One-stop service is fulfillment extended to additional services which can improve
customer satisfaction. Brand merchants or those with larger online volumes often
have their own fulfillment facilities. But for SMEs, there is a demand for a full range
of one-stop services, such as payment processing, customer services, shipping,
customs clearance, return processing and delivery provided by global e-marketplace
(Forrester, 2014; UNCTAD, 2015). One-stop service is also a fulfillment extended to
additional services which can improve customer satisfaction. It requires an integrated
value chain to be linked to a customer-care advocate, so that customers can receive all
of the required services with only one partner (Gunasekaran et al., 2007).
Service capacity
In the age of electronic commerce, the organization of a firm depends on the external
requirement of customers. The quality of logistics service is a key component that
ensures customer satisfaction. Both corporations and researcher are becoming
increasingly aware on the strategic role of logistics service in a firm’s overall success
(Huang et al., 2009). Four indicators were chosen as measurement of e-logistics
service performance: order fulfillment time, flexibility, delivery reliability and return
management.

Developing E-commerce Logistics in Cross-border Relation
44
The order fulfillment time is one of the most important performance indicators for
online customers. It is strongly connected to different features of the online offer. The
products with short shelf-lives, such as some groceries, require shorter delivery times.
Therefore, inventory must be in close proximity to the customer in order to shorten
order fulfillment time. For logistics companies servicing international e-commerce,
timely delivery is basic requirement in order to maintain customer loyalty and control
costs. However, quick delivery cannot be guaranteed due to geographical reasons.
There may then be opportunities for reducing fulfillment times by outsourcing some
process components.
Logistics flexibility is the ability to respond quickly and efficiently in response to
changing customer expectations for inbound and outbound delivery, support, and
services. It is considered to be one of the fundamental factors for successful
implementation of supply chain management initiatives. With logistics flexibility, a
firm can delay commitment, embrace change, and fine tune delivery to meet specific
customer needs without increasing stock levels. Offering flexibility requires the
ability to update the order picking and preparation process on the run. Customers
increasingly care about flexible delivery options in CBE (Jafari, 2015; Zhang, 2005).
Delivery of the right product within the time frame promised to the right place is the
definition of delivery reliability. This is a key performance indicator for well managed
logistics and supply chain. It is also an important requirement in choosing
corresponding logistics service providers. In general, reliability of delivery is even
more critical than the speed of delivery. This is especially true for international
e-commerce. As for the order cycle time, wherein reliabilities, delivery punctuality is
very important for almost 90% of online customers (Ghezzi et al., 2012). Good
delivery reliability not only satisfies the customer but also disposes him to repurchase.
It is a key determinant of consumer e-tailing satisfaction and quality perceptions.
Return is a necessity for the establishment of viable e-commerce business, but also a
nightmare for an e-commerce firm. The request of the European Commission shows
that the 57% of Europeans do not shop online cross-borders because due to concerns
about returning goods (Kawa and Zdrenka, 2016). With the globalization of
e-commerce, the reverse logistics will no longer be just a national problem and
become more global in the future. Overseas delivery will take a significant amount of
time and there is no standard industry return process. It is therefore fundamental to
find the right tradeoff between the quality of returns management and related

Chapter 2 A Conceptual Framework of Developing CBEL
45
operational costs. Consumers are usually responsible for the loss when they receive
problematic goods but return period have already passed with no post-sale service in
their own country for complaints. A well-managed return process can enhance firm’s
competitiveness and customer loyalty.
2.1.7 Partnership
Alliances and cooperation
Strategic alliances and cooperation with supply chain partners, such as suppliers,
retailers, intermediaries and LSPs require the involvement of top management. Firms
must work closely with their key suppliers on product availability, order processing,
transportation, and other logistics issues to ensure high-quality product selection and
quality control for customers (Colton et al. 2010; McGloin and Grant, 1998). Firms
need to establish appropriate relationships with partners and structure stable
management processes ensure operational efficacy (Gunasekaran et al., 2007; Hwang
and Lu, 2013; Samiee, 2008). The degree to which the partners share information,
infrastructure, facilities and technology will depend on the firm’s specific needs. Such
favorable partnerships may emerge if partnering organizations hold similar values,
mutual trust, sincerity, shared risks, and rewards. This will offer a competitive
advantage compared to a firm that may go about this alone (Hernandez et al., 2014;
Ho et al., 2012; Rajaguru and Matanda, 2013).
Companies are globalizing due to the importance of international cooperation and
partnerships (Van der Vorst et al., 2009). With the advancements of global logistics
service industry, a well-established relationship is essential for a business’ success in
today’s global supply chain world. E-commerce requires a global logistics system to
promise efficient and stable flow of goods. This is difficult to attain for a single
enterprise. This requires LSPs to cooperate with each other and to compete mutually
in the premise of efficient and systematic logistics processes (Shi and Ruan, 2008). A
holistic approach to managing supply chain systems through greater coordination of
alliances and maintaining partnership is the core competencies and key strategy in the
global market (Fernie and Sparks, 2009; Gong and Kan, 2013).
Real-time information sharing
The success of such partnerships or alliances mentioned above is determined by the
information sharing (also called visibility) efficiency in real time regarding
opportunities, threats, overall business performance (McGloin and Grant, 1998). This

Developing E-commerce Logistics in Cross-border Relation
46
will lead to developing relatively stronger relational ties amongst supply chain
members. Firms need develop corresponding logistics capabilities in order to facilitate
effective information sharing (Zhang, 2005). Better information sharing between
supply chain parties will result in more controlled procurement and replenishment.
This will significantly reduce logistics costs and inventory, shorten customer response
time, and improve ordering and delivery processes (Giménez and Lourenço, 2008;
Gong and Kan, 2013; Rajaguru and Matanda, 2013). Meanwhile, real-time
communication can enhance interaction and coordination amongst all supply chain
parties (suppliers, carriers, 3PLs, etc.). This will lead to a significant reduction of
variability and costs, and improve the responsiveness of the firm while managing
customers’ expectation by providing transparency about their orders (Trappey et al.,
2004). The flow of returned products through the reverse logistics channels also will
increase the needs for information sharing (Ho et al., 2012; Hsu et al., 2009).
Additionally, a greater physical distance in international supply chains increases the
need for frequent and effective information sharing and exchange. Sharing about
product, technology and market structure with each other can reduce uncertainty
about unforeseen changes. Also, end user preference helps suppliers to improve
current processes and develop better product quality for their international customers
(Jean and Sinkovics, 2010; Samiee and Walters, 2006).
Outscoring strategy
The logistics outscoring strategy is also the core process of e-logistics, which increase
a firm’s logistics capability and performance (Gong and Kan, 2013; Hernandez et al.,
2014; Joong-Kun Cho et al., 2008). The implication of logistics outsourcing is one of
most critical performance measures for successful development and operations of
supply chains (Gunasekaran and Kobu, 2007). The integration of LSPs enables a fast
reaction to unexpected developments and reduces inventory risk, operational costs,
and transportation lead time (Klumpp and Jasper, 2008). The market for logistics
outsourcing has grown steadily and rapidly. This is especially true for e-commerce
companies, since e-commerce shipments require an entirely new distribution
infrastructure to handle a sustainable online business. Besides, some online
commodities involving limited complexity in logistics handling, so that the
international logistics are likely to be outsourced, such as perishable products
(Capineri and Leinbach, 2004; Gunasekaran et al., 2007).

Chapter 2 A Conceptual Framework of Developing CBEL
47
Global trade is a fertile breeding ground for LSPs. With its increasing, firms require
mature and established global supply sources to service their foreign customers
(Samiee, 2008). These trends have created both issues and opportunities for LSPs
including freight forwarders, customhouse brokers, ocean and air carriers, as well as
logistics management companies who characterize themselves as third-party logistics
providers capable of offering bundled services for the movement of international
freight (Rao and Young, 1994). The importance of the LSPs as an integrator between
players in the global distribution and delivering has increased (Hultkrantz and
Lumsden, 2001; Trappey et al., 2004). The success of such integration is determined
by LSPs’ global transportation, warehousing, and information network (Tyan et al.,
2003). The international freight forwarder (IFF) is recognized as a key logistical
intermediary for facilitating cross-border trade (Liu et al. 2015).
The effects of globalization motivate firms to rethink the way they evaluate and select
external partners. And how to select suitable partner become the real challenge and
requires urgent solutions (Alkhatib et al., 2015; Yang and Shen, 2015). This choice
directly impacts the efficiency of international logistics channels since each LSP
possesses different strengths and weaknesses (Banomyong and Supatn, 2011). Wong
(2012, P.602) reviewed previous studies and synthesized six selection criteria:
globalization considerations, relationship building and integration competencies,
operational performance, quality, finance, and information technology. Following the
overall outsourcing trend, the focus is on core competences and the need for “trusted
third parties” in international supply chains (Hameri and Hintsa, 2009).
2.2 Questionnaire Survey
2.2.1 Introduction and Report
In order to collect data for following two purposes:
- Collect case enterprises’ data for the decision model, including their logistics
problems and corresponding logistics strategies.
- Collect experts’ evaluation for the initial influencing factors, which used for
factor analysis.
Based on above literature review, a questionnaire survey was designed (Appendix 2),
which consists of six parts:

Developing E-commerce Logistics in Cross-border Relation
48
(1) General Information:
Collect general data about the company for pre-classification, including company’s
nature and size and products’ origins.
(2) Influencing Factors:
Collect expert scoring (Likert 5-scale: not important, slightly important, moderately
important, important and very important, corresponding to 1-5 points) of initial
factors which affect the development of e-logistics in cross-border relation.
(3) Product and Service:
Collect data of case enterprises for classifying logistics problems based on the product
and service complexity.
(4) Technology and Operation:
Collect data to compare CBEL method between China and Germany.
(5) Partnership and Outsourcing:
Collect data of the partnership choosing, international logistics and supply chain
strategy choosing and LSP selection criteria.
(6) Personal information:
Collect general data about participants, including job title, working year, contact
information and so on.
The content and structure of questionnaire has been optimized through a research
team’s review, and in order to ensure the reliability of the survey, a small-scale
pre-test was conducted before the official distribution.
Reliability means the credibility of the questionnaire, mainly used to test the
consistent, reproducibility and stability of results. The results of a good sample should
always remain the same through repeated measurements of the same thing. The
substandard survey must adjust the question and overall structure. The scientific and
the validity of the questionnaire are the basis of the sample survey. Cronbach’s alpha
is the most commonly used coefficient to measure scale reliability, that is, how closely
related a set of items are as a group. It assesses the reliability of a rating summarizing
a group of test or survey answers which measure some underlying factor (e.g., some
attribute of the test-taker). A score is computed from each testing item and the overall
rating, and then a “scale” is defined by the sum of the scores of all testing items.

Chapter 2 A Conceptual Framework of Developing CBEL
49
Cronbach’s alpha is defined as: 2
12(1 )
1i
KYi
X
KK
(2.1)
In formula 2.1, K is sum of components (K-items or testlets), 2X is the variance of
the observed total test scores, and 2iY is the variance of component i for the current
sample of persons. The coefficient of Cronbach’s alpha is generally in the range 0-1.
The alpha must not be lower than 0.5 (Cronbach, 1951).
A small sample including 20 participants were used to test the reliability of this
questionnaire. The alpha coefficient is 0.895, indicates that the items have relatively
high internal consistency, and the questionnaire has a high degree of reliability (Note
that a reliability coefficient exceeding the cut-off point of 0.70 recommended by
Nunnally (1978) is considered “acceptable” in most social science research).
Pasted the pre-test, “Unipark” was taken as the software for online questionnaire
design and distribution. The Chinese and English versions were produced based on
the same content, so that experts from different countries can understand the
questionnaire more convenient and unambiguous.
The English version URL: http://www.unipark.de/uc/TUB-Tongji/CBE/
The Chinese version URL: http://www.unipark.de/uc/Tongji-TUB/CBE/
The introduction already elaborated that, China and Germany, as the representative of
developing and developed countries, their experience and achievements in CBE hold
a leading position in the world. Therefore, the online questionnaires were sent to total
475 experts in both countries, throughout retail, e-commerce and logistics industry.
Data collection took 8 months from July 2016 to February 2017. Finally, totally 193
replies were received (Table 5).
Table 5 Field Report of Questionnaire Distribution
China Germany Total
Sent 310 165 475
Received 116 77 193
Response rate 37.42% 46.67%
Eliminated invalid questionnaires, the total of 77 Chinese and 57 Germany
participants in different positions were included in following analysis. (Table 6)
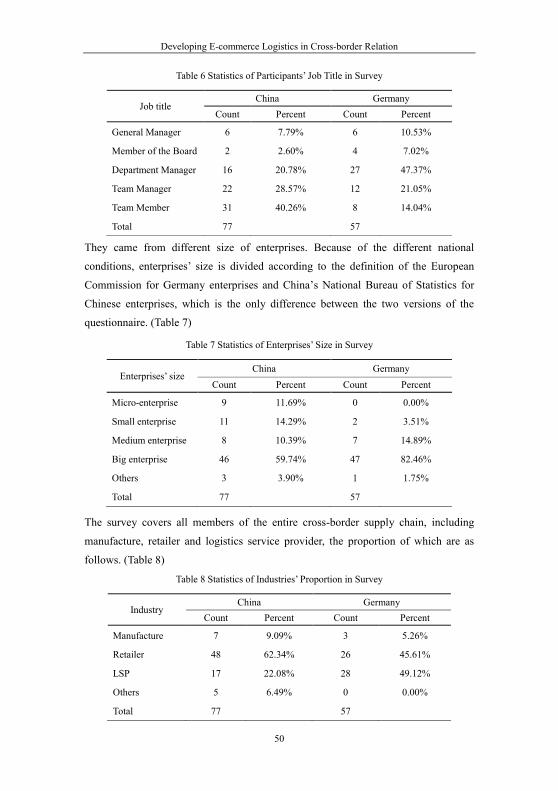
Developing E-commerce Logistics in Cross-border Relation
50
Table 6 Statistics of Participants’ Job Title in Survey
Job title China Germany
Count Percent Count Percent
General Manager 6 7.79% 6 10.53%
Member of the Board 2 2.60% 4 7.02%
Department Manager 16 20.78% 27 47.37%
Team Manager 22 28.57% 12 21.05%
Team Member 31 40.26% 8 14.04%
Total 77 57
They came from different size of enterprises. Because of the different national
conditions, enterprises’ size is divided according to the definition of the European
Commission for Germany enterprises and China’s National Bureau of Statistics for
Chinese enterprises, which is the only difference between the two versions of the
questionnaire. (Table 7)
Table 7 Statistics of Enterprises’ Size in Survey
Enterprises’ size China Germany
Count Percent Count Percent
Micro-enterprise 9 11.69% 0 0.00%
Small enterprise 11 14.29% 2 3.51%
Medium enterprise 8 10.39% 7 14.89%
Big enterprise 46 59.74% 47 82.46%
Others 3 3.90% 1 1.75%
Total 77 57
The survey covers all members of the entire cross-border supply chain, including
manufacture, retailer and logistics service provider, the proportion of which are as
follows. (Table 8)
Table 8 Statistics of Industries’ Proportion in Survey
Industry China Germany
Count Percent Count Percent
Manufacture 7 9.09% 3 5.26%
Retailer 48 62.34% 26 45.61%
LSP 17 22.08% 28 49.12%
Others 5 6.49% 0 0.00%
Total 77 57

Chapter 2 A Conceptual Framework of Developing CBEL
51
Among them, there are 48 retailers from China and 26 retailers from Germany, the
retailers consist of the following types. (Table 9)
Table 9 Statistics of Retailers’ Type in Survey
Retailer’s type China Germany
Count Percent Count Percent
Marketplace 7 14.58% 3 11.54%
Self-operation 13 27.08% 8 30.77%
Integrated 14 29.17% 6 23.08%
Click-and-Mortar 14 29.17% 9 34.62%
Total 48 26
2.2.2 Comparative Analysis
The comparisons between China and Germany are presented in four aspects:
(1) Product Source
Most of cross-border products came from Europe, Asian and North American (Table
10). Especially for German companies, Europe is the No.1 source of supply due to the
convenient trade and location in European Union.
Table 10 Statistics of Product Source in Survey
Product’s origin China Germany
Count Percent Count Percent
Europe 33 42.86% 52 91.23%
North American 27 35.06% 21 36.84%
Latin American 2 2.60% 13 22.81%
Asia & Oceania 47 61.04% 24 42.11%
Africa 1 1.30% 14 24.56%
(2) Storage Location
The China’s enterprises have benefited from the China government’s vigorously
support for CBE, most of them decide to fulfill customer from FTZ warehouse so that
can lower the duties and concise the customs clearance procedures. In contrast,
German enterprises still use domestic warehouse as the main storage location due to
the favorable geographical location with neighboring countries. (Table 11)

Developing E-commerce Logistics in Cross-border Relation
52
Table 11 Statistics of Storage Location in Survey
Warehouse location China Germany
Count Percent Count Percent
Domestic warehouse 20 37.04% 25 78.13%
Overseas warehouse 24 44.44% 9 28.13%
FTZ warehouse 39 72.22% 5 15.63%
Others 2 3.70% 2 6.25%
(3) Transportation Mode
From the types of cross-border transportation, different national conditions can be
clearly perceived. As most of products in China’s CBE need long-distance transport,
such as from Europe and North America, airlift and ocean shipping are main mode of
international transportation while mainly carried by international express and shipping
agents. In contrast, land transportation is the first choice for German enterprises due
to the geographical advantages of cross-border transportation between European
neighbors, and they often are in charge by self. (Table 12)
Table 12 Statistics of Transportation Mode in Survey
International transport China Germany
Count Percent Count Percent
Transportation method
Airlift 41 75.93% 15 46.88%
Ocean shipping 39 72.22% 11 34.38%
Railway 2 3.70% 9 28.13%
Land transportation 5 9.26% 24 75.00%
Others 1 1.85% 2 6.25%
Carrier
Postal parcel 5 10.00% 6 19.35%
International express 21 42.00% 7 22.58%
Shipping agents 34 68.00% 8 25.81%
Self-operation 5 10.00% 11 35.48%
Others 3 6.00% 4 12.90%
(4) Factor Score
As a comprehensive attitude towards the assessment of factors influencing CBEL, for
Chinese and Germany participants, the frequency distribution of the scale is
respectively shown in Figure 24.

Chapter 2 A Conceptual Framework of Developing CBEL
53
Figure 24 Frequency Distribution of Scale’s Total Factor Score
It can be seen from the Figure that the total score of both scale are mainly distributed
on the right side of “Moderately important” (3*21=63), that is, the group attitude
tends to be consistent with the importance of all factors. The mean of the total score
of the Chinese participants’ scale is 80.677 and the standard deviation is 10.1137. The
mean of the total score of the Germany participants’ scale is 76.371 and the standard
deviation is 9.2198. This means that these factors are considered more important in
Chinese participants, but the evaluation relatively more dispersed.
Besides, more detailed similarities and differences can be obtained through the
scoring statistics on initial influencing factors by Chinese participants (Table 13) and
the German participants (Table 14).
Table 13 Descriptive Statistics of Chinese Participants on Factors
No. Factors Not
important (%)
Slightly important
(%)
Moderately important
(%)
Important (%)
Very important
(%) Mean Std.
Dev
1 Human factor 0.00 1.61 16.13 43.55 38.71 4.19 0.76
2 Warehouse and inventory mgmt. 0.00 3.23 19.35 37.10 40.32 4.15 0.84
3 Payment 0.00 3.23 20.97 38.71 37.10 4.10 0.84
4 Property of product 0.00 8.06 19.35 27.42 45.16 4.10 0.98
5 Service capability 0.00 4.84 20.97 35.48 38.71 4.08 0.89
6 Law and regulation 0.00 1.61 32.26 27.42 38.71 4.03 0.88
7 Customs clearance 0.00 3.23 27.42 32.26 37.10 4.03 0.88
8 Real-time info. sharing 0.00 6.45 25.81 30.65 37.10 3.98 0.94
9 Demand variability 0.00 0.00 29.03 46.77 24.19 3.95 0.73

Developing E-commerce Logistics in Cross-border Relation
54
No. Factors Not
important (%)
Slightly important
(%)
Moderately important
(%)
Important (%)
Very important
(%) Mean Std.
Dev
10 Outscoring strategy 0.00 4.84 25.81 45.16 24.19 3.89 0.83
11 Tax and tariff 0.00 8.06 27.42 32.26 32.26 3.89 0.95
12 One-stop service 1.61 4.84 27.42 43.55 22.58 3.81 0.90
13 Cultural difference 0.00 4.84 33.87 38.71 22.58 3.79 0.85
14 ICT application 0.00 4.84 40.32 37.10 17.74 3.68 0.82
15 Range of commodity 0.00 9.68 37.10 30.65 22.58 3.66 0.93
16 Nature of business 0.00 12.90 29.03 38.71 19.35 3.65 0.93
17 Alliance and cooperation 0.00 8.06 37.10 38.71 16.13 3.63 0.85
18 Size of company 0.00 9.68 40.32 33.87 16.13 3.56 0.87
19 Infrastructure 0.00 6.45 43.55 40.32 9.68 3.53 0.76
20 Currency exchange 1.61 8.06 46.77 25.81 17.74 3.50 0.93
21 Sustainability 0.00 16.13 38.71 25.81 19.35 3.48 0.98
Table 14 Descriptive Statistics of German Participants on Factors
No. Factors Not
important (%)
Slightly important
(%)
Moderately important
(%)
Important (%)
Very important
(%) Mean Std.
Dev
1 Cultural difference 0.00 0.00 20.00 25.71 54.29 4.34 0.79
2 Demand variability 0.00 0.00 17.14 54.29 28.57 4.11 0.67
3 Property of product 0.00 5.71 22.86 28.57 42.86 4.09 0.94
4 Customs clearance 0.00 11.43 14.29 37.14 37.14 4.00 0.99
5 Law and regulation 0.00 8.57 20.00 40.00 31.43 3.94 0.92
6 Outscoring strategy 5.71 2.86 25.71 28.57 37.14 3.89 1.12
7 Warehouse and inventory mgmt. 2.86 2.86 17.14 57.14 20.00 3.89 0.85
8 Payment 5.71 2.86 17.14 45.71 28.57 3.89 1.04
9 Service capacity 0.00 8.57 25.71 34.29 31.43 3.89 0.95
10 Real-time info. sharing 0.00 8.57 22.86 42.86 25.71 3.86 0.90

Chapter 2 A Conceptual Framework of Developing CBEL
55
No. Factors Not
important (%)
Slightly important
(%)
Moderately important
(%)
Important (%)
Very important
(%) Mean Std.
Dev
11 Range of commodity 0.00 2.86 37.14 34.29 25.71 3.83 0.84
12 ICT application 0.00 0.00 40.00 40.00 20.00 3.80 0.75
13 Infrastructure 2.86 8.57 22.86 40.00 25.71 3.77 1.02
14 Tax and tariff 0.00 8.57 34.29 37.14 20.00 3.69 0.89
15 Alliance and cooperation 2.86 14.29 37.14 31.43 14.29 3.40 0.99
16 Human factor 0.00 22.86 34.29 34.29 8.57 3.29 0.91
17 Nature of business 5.71 14.29 40.00 34.29 5.71 3.20 0.95
18 Size of company 11.43 11.43 45.71 28.57 2.86 3.00 0.99
19 Sustainability 5.71 22.86 45.71 22.86 2.86 2.94 0.89
20 One-stop service 11.43 22.86 42.86 17.14 5.71 2.83 1.03
21 Currency exchange 14.29 25.71 34.29 22.86 2.86 2.74 1.05
Through the comparison of the mean, it can be seen that the score of Chinese
participants for 21 factors are higher than 3.4, which is relatively higher than German
participants’. It means that Chinese participants are more care about these factors. The
top ten consideration factors of the two countries’ participants are shown in Table 15
by the rank of the mean.
Table 15 Top 10 Factors between Enterprises in China and Germany
No. China Germany
1 Human factor Cultural difference 2 Warehouse and inventory management Demand variability 3 Payment Property of product 4 Property of product Customs clearance 5 Service capability Law and regulation 6 Law and regulation Outscoring strategy 7 Customs clearance Warehouse and inventory management 8 Real-time information sharing Payment 9 Demand variability Service capacity
10 Outscoring strategy Real-time information sharing
The top ten factors scoring by Chinese and German participants are basically the same
but in different order. The most significant difference is that, Chinese companies pay

Developing E-commerce Logistics in Cross-border Relation
56
more attention to the importance of internal factors, such as human factor, while
German companies believe that the impact of external factors more significant, such
as cultural difference.
2.3 Factor Analysis
Although 21 influencing factors were summed up by literature review and analyzed
the importance through the questionnaire survey. However, the data have strong
subjectivity so that the internal relation cannot be found. In order to group the
meaningful factors together and replace most information of the original variable with
fewer independent factor variables, a statistical analysis method, factor analysis was
conducted to sort out the key factor affecting the development of CBEL.
2.3.1 Introduction and Procedure
The starting point is determining the optimal number of factors to extract from the
matrix of correlations among the observed variables (such as responses to
questionnaire items). The most common criteria are based on the increment in
common variance explained by extracting an additional factor. Factor weights are
computed to extract the maximum possible variance, with successive factoring
continuing until there is no further meaningful variance left.
The first factor extracted by the method will explain the greatest amount of common
variance in the set of observed items, and the second factor will be the uncorrelated
(or “orthogonal”) factor that explains the next largest component of common variance,
and so forth. Factor extraction can continues until what the researcher believes is an
optimal number of factors have been extracted. The maximum number of factors can
be extracted is equal to the number of observed variables, but usually the actual
number is much smaller. A widely used stopping point in factor extraction is the point
at which the “eigenvalue” (a mathematical term related to the matrix manipulation
methods employed to extract factors) of a factor to be extracted is no greater than one.
This suggests that the factor explains no more variance among the variables than that
explained by a single variable. Such factors are often associated strongly with only
one observed variable and are likely explaining only the measurement errors in
observed variables.
The principal components analysis (PCA) is widely used method for factors
extraction, due to the fact that this is recommended when the primary objective is to

Chapter 2 A Conceptual Framework of Developing CBEL
57
determine the minimum number of factors necessary to explain or justify the
maximum portion of the variance represented in the series of original variables.
The process of factors extraction can be represented by following mathematical model:
1 11 1 12 2 1 1
2 21 1 22 2 2 2
1 1 2 2
m m
m m
p p p pm m p
x a F a F a Fx a F a F a F
x a F a F a F
KK
...
K
(2.2)
In formula 2.2, a set of p observable random variables, 1 px
,,x
. Suppose for some
unknown constants ija and m unobserved random variables jF (called “common
factors”, because they influence all the observed random variables), where
and 1, ,j m , m p , the i are unobserved stochastic error terms
zero mean and finite variance, which may not be the same for all i . In matrix
terms is X AF . Any solution of the above set of formulas following the
constraints for F is defined as the factors, and A as the factor loading matrix.
Once the optimal number of factors has been determined, examined the table of factor
loadings generated by the analysis to try to interpret the meaning of the factors. The
factor loadings give an idea about how much the variable has contributed to the factor.
The larger the factor loading means the more the variable contributed to that factor.
The observed pattern of factor loadings is generally used as a way of interpreting the
underlying factors. This pattern will depend on a number of decisions made by the
researcher, including the number of factors extracted and the factor extraction
methods specified. Unfortunately, the set of factor loadings produced in EFA is not
determinant, and it is possible to generate only “relative” factor loadings. This means
that the factor loadings can all be systematically transformed in an infinite number of
ways and still explain the same common variance among the observed variables (i.e.,
EFA determines the proportionality among loadings, but not their exact values). To
solve this problem, a second procedure, called “factor rotation”, is normally used after
the initial set of factor loadings has been generated. Factor rotation involves a
systematic transformation of the set of loadings, according to one of many possible
mathematical criteria, to provide optimal differentiation among the factors. Factor
rotation helps the researcher interpret the meaning of each factor.
Varimax rotation is an orthogonal rotation of the factor axes to maximize the variance
of the squared loadings of a factor (column) on all the variables (rows) in a factor
x,...,
...i∈1,..., pwith

Developing E-commerce Logistics in Cross-border Relation
58
matrix, which has the effect of differentiating the original variables by extracted
factor. Each factor will tend to have either large or small loadings of any particular
variable. A varimax solution yields results which make it as easy as possible to
identify each variable with a single factor. This is the most common rotation option.
In summary, an exploratory factor analysis with principal component extraction and
varimax rotation was performed to assess construct validity of the measurement items
in this thesis.
2.3.2 Analysis and Result
To ensure that the process of factorial analysis might be appropriate, before
performing factor analysis, firstly determine whether the variables are suitable for the
analysis. Bartlett test of sphericity was applied for testing the significance level of the
correlation coefficients between variables. The test is significant if the p value is
smaller than 0.05 (Bartlett, 1951); as well as the extent of the adequacy of the sample
Kaiser-Meyer-Olkin (KMO) that compares the magnitudes of the coefficients of the
observed correlation with the magnitude of the partial correlation coefficients. The
KMO measure of sampling adequacy varies between 0 and 1, when the value is closer
to 1, the variables are more suitable for factor analysis. Generally, the indices between
0.70 and 0.80 are considered acceptable (Kaiser, 1974).
After testing, the KMO of 0.725 with p-value of 0.000 indicated the sufficiency of the
data from questionnaire in this thesis (Table 16). It proves that all variables under
these dimensions are suited for factor analysis. Therefore, the validity and reliability
of the sample can be considered reasonable.
Table 16 KMO and Bartlett’s Test of Factor Analysis
Kaiser-Meyer-Olkin Measure of Sampling Adequacy. .725 Bartlett’s Test of Sphericity Approx. Chi-Square 757.455
df 210
Sig. .000
In the results of the principal component analysis with a varimax rotation, the first 6
components with eigenvalues greater than 1 were obtained, and the cumulative
variance explained was 63.967%. It means that the original variables were grouped
into 6 new factors and can explain the 63.967 % of the total variance (Table 17).
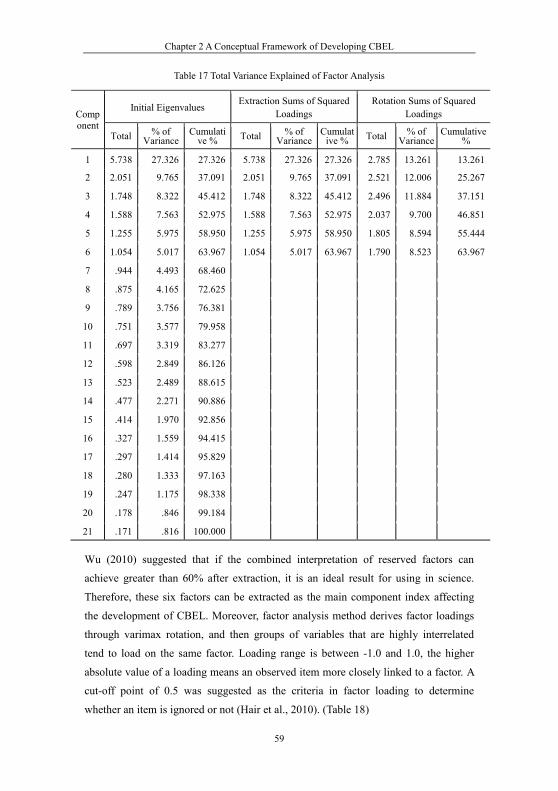
Chapter 2 A Conceptual Framework of Developing CBEL
59
Table 17 Total Variance Explained of Factor Analysis
Component
Initial Eigenvalues Extraction Sums of Squared Loadings
Rotation Sums of Squared Loadings
Total % of Variance
Cumulative % Total % of
Variance Cumulat
ive % Total % of Variance
Cumulative %
1 5.738 27.326 27.326 5.738 27.326 27.326 2.785 13.261 13.261
2 2.051 9.765 37.091 2.051 9.765 37.091 2.521 12.006 25.267
3 1.748 8.322 45.412 1.748 8.322 45.412 2.496 11.884 37.151
4 1.588 7.563 52.975 1.588 7.563 52.975 2.037 9.700 46.851
5 1.255 5.975 58.950 1.255 5.975 58.950 1.805 8.594 55.444
6 1.054 5.017 63.967 1.054 5.017 63.967 1.790 8.523 63.967
7 .944 4.493 68.460
8 .875 4.165 72.625
9 .789 3.756 76.381
10 .751 3.577 79.958
11 .697 3.319 83.277
12 .598 2.849 86.126
13 .523 2.489 88.615
14 .477 2.271 90.886
15 .414 1.970 92.856
16 .327 1.559 94.415
17 .297 1.414 95.829
18 .280 1.333 97.163
19 .247 1.175 98.338
20 .178 .846 99.184
21 .171 .816 100.000
Wu (2010) suggested that if the combined interpretation of reserved factors can
achieve greater than 60% after extraction, it is an ideal result for using in science.
Therefore, these six factors can be extracted as the main component index affecting
the development of CBEL. Moreover, factor analysis method derives factor loadings
through varimax rotation, and then groups of variables that are highly interrelated
tend to load on the same factor. Loading range is between -1.0 and 1.0, the higher
absolute value of a loading means an observed item more closely linked to a factor. A
cut-off point of 0.5 was suggested as the criteria in factor loading to determine
whether an item is ignored or not (Hair et al., 2010). (Table 18)

Developing E-commerce Logistics in Cross-border Relation
60
Table 18 Rotated Component Matrix of Factor Analysis
Variables Component
1 2 3 4 5 6
ICT application .811 .134 .024 -.202 .034 .214
Warehouse and inventory mgmt. .790 .208 .187 .144 .127 -.097
Service capability .773 .149 .104 .283 .066 -.017
Payment .559 .171 .258 -.284 -.202 .244
Alliance and cooperation .120 .741 .239 -.081 .079 -.081
Outscoring strategy .182 .612 -.165 .368 .158 .297
Real-time information sharing .398 .567 .033 .037 .197 .041
One-stop service .223 .495 .079 .315 -.275 .444
Sustainability .261 .483 .227 .302 .251 -.053
Currency exchange .291 .021 .704 .188 .064 .108
Infrastructure .096 .469 .622 .064 -.358 .148
Tax and tariff .076 .307 .613 .030 .153 .282
Customs clearance -.053 -.052 .612 -.108 .321 .142
Range of commodity .023 .035 .114 .748 -.026 .133
Property of product -.132 .328 .129 .693 .010 .367
Nature of business .003 .188 .196 -.068 .766 .110
Size of company .087 .438 .263 .085 .584 -.030
Human factor .266 -.091 .031 .486 .543 .084
Cultural difference .089 .023 .016 .176 .033 .730
Demand variability .019 -.013 .327 .092 .126 .718
It can be seen from table, “One-stop service” and “Sustainability” were dropped out
of the analysis. For the interpretation of factors were considered two aspects:
- In the practical significance, one-stop service and sustainability are not
unimportant, but the relationship with other components is weak, so cannot be
grouped together;
- In the statistical significance, the burdens of 0.4 are considered important and
those of 0.5 or greater are considered practically significant. So the approach that
has taken for this topic was to accept loads greater than or equal to 0.5 to ensure
the maximum significance of the results.
Finally, the characteristic vector corresponding to the six eigenvalues is taken as the
new comprehensive index instead of the original twenty one factors. And according to

Chapter 2 A Conceptual Framework of Developing CBEL
61
the contents and internal relationships, they were defined as: Operation (F1),
Partnership (F2), Government (F3), Product (F4), Company (F5) and Market (F6).
The regression function is used to obtain the factor score which are values on new
scales created for each factor. The factor score coefficients, which are not same as
loadings or coefficients predicting variables from factors, can be found in the
component score coefficient matrix in SPSS (Table 19). These coefficients weight the
observed variable by its relative importance on a given factor in calculating the
estimated value of that factor.
Table 19 Component Score Coefficient Matrix of Factor Analysis
No. Variables Component
1 2 3 4 5 6
v1 Nature of business -.074 .054 -.021 -.162 .465 .102
v2 Size of company -.079 .182 .012 -.059 .304 -.062
v3 Human factor .126 -.210 -.070 .250 .295 .009
v4 Range of commodity -.006 -.110 .039 .441 -.095 -.057
v5 Property of product -.141 .088 -.015 .321 -.062 .098
v6 Infrastructure -.087 .183 .295 -.020 -.320 -.046
v7 Tax and tariff -.083 .058 .238 -.091 .025 .101
v8 Currency exchange .072 -.178 .343 .086 -.062 -.048
v9 Customs clearance -.079 -.120 .299 -.120 .154 .067
v10 ICT application .355 -.061 -.105 -.183 .023 .160
v11 Law and regulation .036 -.076 .288 .182 -.010 -.242
v12 Demand variability -.032 -.129 .077 -.080 .081 .452
v13 Cultural difference .023 -.083 -.099 -.024 .048 .475
v14 Payment .214 -.004 .066 -.225 -.137 .151
v15 Warehouse and inventory mgmt. .321 -.064 .003 .067 .006 -.136
v16 Sustainability .009 .170 .011 .107 .069 -.141
v17 One-stop service .007 .193 -.071 .078 -.213 .186
v18 Service capability .331 -.108 -.037 .154 -.027 -.094
v19 Alliance and cooperation -.103 .418 .019 -.147 -.015 -.122
v20 Outscoring strategy -.023 .291 -.253 .080 .070 .127
v21 Real-time information sharing .075 .256 -.125 -.080 .081 -.017
With the factor score coefficients, the linear combinations of variables for six
principal components are as follows:

Developing E-commerce Logistics in Cross-border Relation
62
1 1 2 21
2 1 2 21
6 1 2 21
0.074* 0.079* 0.075*0.054* 0.182* 0.256*
0.102* 0.062* 0.017*
F v v vF v v v
F v v v
KK
LK
(2.3)
The proportion of the variance to the cumulative variance is taken as the factor weight
of the principal component. The comprehensive factor score formula is expressed as:
1 2 3 4
5 6
1 2 3 4 5 6
(0.13261* 0.12006* 0.11884* 0.09700*0.08594* 0.08523* ) / 0.639670.207 0.188 0.186 0.152 0.134 0.133
F F F F FF F
F F F F F F
(2.4)
The formula 2.4 can be used as a benchmark for the development of CBEL in
different enterprises or different countries.
In summary, instead of the original 21 factors, the results from the EFA indicated that
6 main factors composed of 19 indicators could impact CBE logistics developing,
while 64 percent of influencing factors could be explained (Table 20).
Table 20 Index System of Developing CBEL
Destination Layer
Primary index Factor weight
Secondary index Coefficient
Influencing the development of
e-logistics in cross-border
relation
Operation .207
Application of ICT .355 Service capability .331 Warehouse and inventory mgmt. management
.321 Payment .214
Partnership .188 Alliance and cooperation .418 Outscoring strategy .291 Real-time information sharing .256
Government .186
Currency exchange .343 Customs clearance .299 Infrastructure .295 Law and regulation .288 Tax and tariff .238
Product .152 Range of commodity .441 Property of product .321
Company .134 Nature of business .465 Size of company .304 Human factor .295
Market .133 Cultural difference .475 Demand variability .452

Chapter 2 A Conceptual Framework of Developing CBEL
63
The results of the factor analysis are similar to the classification in previous focus
groups, except the following two points:
- “One-stop service” and “Sustainability” were no longer considered in key factors
because of weak correlation with the rest of the index;
- “ICT Application” was incorporated into “Operation” factor, thus “Technology”
was discarded.
2.4 Conceptual Framework
Based on literature review and factor analysis, a conceptual framework was
constructed in Figure 25. In order to establish meaningful empirical results, the
differences should be conceptualized clearly. Therefore, the key factors are further
divided into external and internal factors. The external factors are the “Government”
and “Market (Consumer)”, which represent the social environment and determine the
development direction of enterprise. The internal factors include “Company”,
“Product”, “Operation” and “Partnership”, which are organization condition and
determine the strategy formulation of enterprise.
o nm nt Currency exchange Customs clearance Infrastructure Law and regulation Taxes and tariff
a t Con um Culture difference Demand variability
Company ature of business Size of company Human factor
o u t Range of commodity Property of product
Op ation ICT application Service capability Warehouse & inventory Mgmt Payment
a tn hip Alliances & cooperation Outscoring strategy Real-time info sharing
Internal
External
DevelopCross-border
E-logisticsReduce operating cost Improve customer service
Figure 25 Conceptual Framework of Developing CBEL

Developing E-commerce Logistics in Cross-border Relation
64
These six key factors should be considered comprehensively. Before the
implementation of CBEL, firms need fully understand the different culture and
demand variability in target market. Conditions in a country have a very significant
impact on the type of logistic system. The well infrastructure, taxes, foreign exchange,
customs clearance, law and regulation supported by government can provide a good
environment for CBEL developing. The nature and size of company, human factor,
the range and property of online product have been indicated as important impacts on
e-logistics selection and logistics costs. The advanced ICT is an indispensable tool for
e-logistics developing in cross-border relations. Because it can improve the
performance of the logistics operations like payment and inventory management, as
well as provide the ability of real-time information sharing between suppliers and
LSPs. Such cooperation improves service capacity, like increasing flexibility and
delivery reliability, reducing order fulfillment times and making return more effective.
Meanwhile, a well-designed outsourcing strategy is essential for CBE success in
today’s global supply chain world. CBEL will enhance firm’s competitiveness and
satisfy global customers, but only in synthetically considering the influence factors, a
company can fully utilize their strength to capture the opportunities brought by the
implementation of e-logistics in CBE.
It is clear that the factors affecting the development of CBEL are highly complex.
Tornatzky et al. (1990) presented “Technology Organization Environment” (TOE)
framework and summed up three aspects of a firm’s context that influence adoption of
the technology innovation, which are technological context, organizational context
and environmental context. Gunasekaran et al. (2007) proposed a framework to help
companies develop an e-logistics system for improving competitiveness. It contains
four dimensions: strategic planning, partnership formation, inventory and information
management. Wang et al. (2015) investigated independent factors affecting
international logistics performance, which are laws and regulations, cross-border
payments, electronic clearance and technology application level. However, previous
studies provided various single factors or focused on a particular factor, but ignoring a
bigger picture.

Chapter 2 A Conceptual Framework of Developing CBEL
65
This framework contains two major extensions of the existing studies:
- The existing frameworks have only considered the effects on e-commerce or
international logistics respectively. This framework enriches the studies by
combine both and through the entire cross-border supply chain.
- None of the existing frameworks classified these factors and investigated the
impacts between them. This framework explicitly incorporates internal and
external influence factors as new antecedents for developing e-logistics in
cross-border relation.

Developing E-commerce Logistics in Cross-border Relation
66
3. Game Model and Strategy between Behavior Subjects of CBEL
Based on the framework obtained in Chapter 2, “Government” and “Consumer” are
external factors which represent the social environment and determine the
development direction of enterprise. In this chapter, a trilateral game model was used
to clearly understand the relationship between government, merchant and consumer.
3.1 Behavior Subjects of CBEL
Broadly speaking, the development of CBEL is not an isolated act of a single
merchant, but a joint action by all the parties involved. In addition to the leading
merchants, consumers, government, supply chain partners and even competitors are
behavior subjects of CBEL. They have different status and goals in the
implementation of CBEL, so that their impacts are not the same.
3.1.1 Organizer-Government
The government is an important external factor, which represents the profit of the
public. The main purpose of the government’s participation in CBEL developing is to
ensure the rational use of resources, and facilitate the sustainable development of
social economy. From a macro point of view, the implementation of CBEL not only
promotes the development of CBE, but also is the organic components of entire social
and economic development. Relative to the scattered and isolated consumers, the
government has more direct and mandatory influence on merchants, like a direct
decision on reassignment of the interests between merchants.
As the policy maker, the society manager, the supervisor and arbitrator between
merchants and consumers, the government has centralized various social forces. It has
the ability and obligation to promote the development of CBEL, and regulate the
irrational behavior in process, so the government plays an organization role of CBEL.
On the one hand, in order to prevent the counterfeit from “gray channel” and tax
evasion, the government can strengthen the supervision of merchants’ logistics
activities and personal agents’ procurement by enacting laws and regulations. On the
other hand, the government can make incentive policies to promote the transactions
through CBEL channel, for example, give subsidy to the merchants who implemented
CBEL and tax relief for the products circulated through CBEL channels. In addition,

Chapter 3 Game Model and Strategy between Behavior Subjects of CBEL
67
the government should take the responsibility for infrastructure construction,
standardization and popularization of CBEL.
In the process of supervising, the government also faces the problem of information
asymmetry. In order to realize the cost information and CBEL implementing effort of
merchants, the government usually use sample investigation, in which the typicality
of the selected merchants will influence the information authenticity. It is also a
matter that whether merchants are willing to provide real information even if they are
representative. Moreover, the object of supervision is not only the merchants, but also
their supply chain partners, competitors and even consumers. The diversification of
the objects will further increase the difficulty of supervision. Therefore, under
information asymmetry, how the government adopts reasonable supervision measures
to promote the development of CBEL, which is the problem that needs to be solved.
In addition, for avoiding punishment or obtaining more benefits, some merchants
possibly take rent-seeking on the government supervision department. The purpose is
to take “free ride”. The rent-seeking action will undoubtedly affect the effective of
government regulation and make the government’s decision-making process more
complicated. Therefore, what strategies the government should adopt to prevent the
merchants’ free-ride behavior or the corruption in government, is also the problem
need to be addressed.
3.1.2 Implementer-Merchant
The production, distribution and exchange of any commodities are inseparable from
the merchant, which is the most active economic subject. Any merchants engaged in
physical objects production, circulation and consumption are likely to directly or
indirectly take logistics activities. Therefore, the merchant is the direct implementer of
CBEL, playing an irreplaceable role.
Need to be particularly stressed that the merchants here are not specifically refers to
the professional logistics enterprises. Productive merchants or circulation merchants
are also possible the implementer as long as they are engaged in CBE and
logistics-related activities. Moreover, the subjects should consider all the merchants in
the supply chain rather than a separate one due to logistics activities spanned all areas
from procurement to fulfillment. And the linkage between the various subjects in the
field is a necessary condition for the development of CBEL.

Developing E-commerce Logistics in Cross-border Relation
68
In the case of information asymmetry, consumer behavior may be rational or irrational.
When facing the different choices of consumers, how merchants price the logistics
service and generate the CBEL strategy, which are obviously not simple questions.
Meanwhile, merchants have to consider the behavior of competitors. If competitors’
logistics are more attractive, own market will shrink and trapped in a passive position.
Therefore, when study the implementation of CBEL, it has to involve the interest
conflict between merchants and the interest coordination between individual and
entire supply chain.
In addition, whether the merchants choose to implement CBEL will be directly
affected by government supervision. When the government supervises or don’t, as
well as in different regulatory efforts, the merchants are likely to take different
logistics modes. In turn, the government will also take different policy measures
based on merchants’ logistics decision.
3.1.3 Pusher-Consumer
On the surface, the consumers are passive recipients of final products or services.
However, when a variety of alternative products exist in market, consumers have
more self-choice right, their value orientation and performance will directly affect the
company’s sales. Therefore, in the perfectly competitive market, the activities of
merchant are guided by consumer behavior.
In CBE, while concerning about the product quality, consumers began to consciously
choose a more secure and efficient logistics services, because the products often
require long distance transport. The implementation of CBEL is becoming one of the
consumer focuses. Hence, consumers participate in the development of CBEL
because they want to obtain a guaranteed product and service. They can use the
“currency votes” to determine the success or failure of merchants’ logistics operation,
so that become the impeller of CBEL.
Consumers often face a dilemma when purchasing. On the one hand, consumers are
rational, and pay attention to the actual effect of purchasing, so they require the unit
currency utility of the payment equal to the marginal utility of product or service. On
the other hand, because of information asymmetry, consumers do not have sufficient
ability to identify whether merchant implement CBEL or don’t, so that they are often
reluctant to take risks to choose expensive CBEL service. Therefore, the pricing

Chapter 3 Game Model and Strategy between Behavior Subjects of CBEL
69
problem of CBEL service is actually a kind of dynamic game process between
merchant and consumer under information asymmetry condition.
The role of pusher is also reflected in the function of its social supervision. On the one
hand, the consumer’s aspirations can be transmitted through the social organization,
civil society or the media to the merchant, so that directly affect the merchant’s
logistics decision-making. On the other hand, consumer’s public opinion may also
affect the government’s policy decision-making, and indirectly affect the merchant’s
implementation process of CBEL. Moreover, as the third-party, consumers play a
unique supervisory role to prevent rent-seeking behavior between merchants and the
government. By reporting “irrational” behavior of local government departments, the
effectiveness of government work can be improved.
3.2 Bilateral Game between Subjects
In this section, through the simple game between merchants, between the consumer
and merchant, the economic effects and strategy selection of merchants in CBEL
implementation were dynamically analyzed.
3.2.1 Hypothesis and Parameter
In order to focus on the nature of the research problem and simplify the model
calculation, the following assumptions are put forward:
- The merchants sell the same product. That is, the sales price and procurement
cost are same between merchants.
- The government does not supervise. That is, the government neither punishes nor
subsidizes.
- Game subjects are rational. That is, the parties pursue their own profit
maximization.
- Static game under incomplete information. That is, the parties can not accurately
know each other’s strategy.

Developing E-commerce Logistics in Cross-border Relation
70
The parameters in the model are presented as follows (Table 21):
Table 21 Parameters in Bilateral Game Model
Notation Representation
P The product price.
C The procurement cost of merchant.
iL The logistics cost. 1L is the cost of merchant who implement CBEL (hereafter called merchant 1), 2L is the cost of merchant who use traditional logistics (hereafter called merchant 2). Because the implementation of CBEL needs more investment, so 1 2L L .
iU The consumer utility from products purchasing. 1U is the utility by purchasing from merchant 1, 2U is the utility by purchasing from merchant 2. Because the implementation of CBEL can provide better service, so 1 2U U .
3.2.2 Merchant to Merchant
The game between merchants is a typical prisoner’s dilemma. In the absence of
government’s supervision and incentives, each merchant makes own optimal strategy
based on the prediction for competitors’ behavior. In this way, the final Nash
equilibrium is always the worst of the overall utility. The payoff matrix can be simply
described as follows (Table 22):
Table 22 Payoff Matrix of Bilateral Game between Merchants
Game strategy Merchant 1
CBEL Traditional
Merchant 2 CBEL A: 1 1,P C L P C L B: 2 1,P C L P C L
Traditional C: 1 2,P C L P C L D: 2 2,P C L P C L
The analysis of the strategy matrix is as follows:
- Scenario A: If merchant 1 implemented CBEL, and the merchant 2 implemented
also with the same level. They obtained general profits 1P C L .
- Scenario B: If merchant 1 used traditional logistics, but merchant 2 implemented
CBEL. At this point, consumer may not care about what kind of logistics, or they
choose logistics services only based on own judgments due to information
asymmetry. So the merchants obtained profit respectively, the profit of merchant
1 was 2P C L , the profit of merchant 2 was 1P C L , because of 1 2L L ,

Chapter 3 Game Model and Strategy between Behavior Subjects of CBEL
71
so 2 1P C L P C L . Merchant 2 obtained lower, means merchant will
suffer losses due to the implementation of CBEL.
- Scenario C: Similar to scenario B.
- Scenario D: If both merchants used traditional logistics, they obtained general
profit 2P C L .
The analysis of strategy selection is as follows:
- When merchant 1 implemented CBEL, if merchant 2 did the same that will get
just general profit, but use traditional logistics can get excess profits higher than
general level. Hence, the optimal strategy for merchant 2 is to choose traditional
logistics.
- When merchant 1 used traditional logistics, if merchant 2 did the same that will
get general profit, but implement CBEL will make profit below the general level.
Hence, the optimal strategy for merchant 2 is also to choose traditional logistics.
Therefore, no matter how merchant 1 to choose, the optimal strategy of merchant 2 is
always to use the traditional logistics. Since the relationship between merchants is
symmetrical, and vice versa. In this typical prisoner’s dilemma game, the Nash
equilibrium between merchants is scenario D, that is, both of them choose the
traditional logistics. The initial intention of implementing CBEL will have to give up
due to the betrayal of other side. There are two main reasons for this result, on the one
hand, information asymmetry leads to “adverse selection” of consumer; on the other
hand, lack of supervisor and incentives leads to “free ride” taken by the merchant
used the traditional logistics.
3.2.3 Merchant to Consumer
The logistics costs are always converted into the logistics services price. Because the
implementation of CBEL needs more investment, the CBEL service price will be
higher than the traditional logistics service. Consumers are willing to pay higher price
for better service, but they cannot identify such differences between services due to
information asymmetry. And if the price is the only signal, the merchants with the
traditional logistics can change the “logistics service price” to take the “free ride”.
The payoff matrix can be simply described as follows (Table 23):

Developing E-commerce Logistics in Cross-border Relation
72
Table 23 Payoff Matrix of Bilateral Game between Merchant and Consumer
Game strategy Merchant
CBEL Traditional
Consumer Purchase A: 1 1 1,P C L U L B: 2 2 1,P C L U L
Non-purchase C: 0 , 0 D: 2 2 2,P C L U L
The analysis of the strategy matrix is as follows:
- Scenario A: If consumers think that the merchant have implemented CBEL, and
can obtain more reliable products and better services, then they are willing to pay
1L and obtained the utility 1 1U L ; meanwhile, the merchant is indeed
implemented, so the logistics cost was 1L , the profits was 1P C L .
- Scenario B: The merchant used traditional logistics, but raised the logistics
services price to 1L by promoting false information to mislead consumers.
Consumers believe this false signal due to information asymmetry, so that the
merchant didn’t spend any extra cost to take the “free ride”. Then, the consumers
obtained the utility was 2 1U L , the merchant obtained the profit was
2P C L .
- Scenario C: The merchant implemented CBEL, the logistics service price was
1L , but the consumers do not believe and are only willing to pay 2L . In this
case, the transaction will not occur, so that the interests of both sides are 0.
- Scenario D: If the consumers think that the merchant used traditional logistics,
and the merchant is indeed used, then the consumers paid the price 2L and
obtained the utility 2 2U L , the merchant invested the logistics costs 2L and
obtained the profit 2P C L .
The analysis of the strategy selection is as follows:
When the consumer chooses the “purchase” strategy, because of 1 2L L , so
2 1P C L P C L , the optimal strategy for the merchant is to choose the
traditional logistics. And if the consumer chooses the “non-purchase” strategy,
because of 2 0P C L , the optimal choice of merchant is still to choose the
traditional logistics. So no matter how consumer to choose, as long as the information
asymmetry exists, the optimal balance strategy for merchant is always to take the
traditional logistics. Similarly, because of 1 2L L , so 2 2 2 1U L U L , the optimal
Chapter 3 Game Model and Strategy between Behavior Subjects of CBEL
73
balance strategy for consumer is “non-purchase”. Therefore, the final Nash
equilibrium of game between merchant and consumer is scenario D, that is, the
merchant chooses traditional logistics and consumers choose “non-purchase”. So, the
merchant does not have any incentive to implement CBEL, and consumers also have
no reason to encourage the merchant to implement. This is further revealed that, if
consumers just rely on the price signal to identify the merchant’s logistics strategy,
will result in many merchants taking “free ride”.
3.3 Trilateral Game between Subjects
From the results of bilateral game in last section, it is difficult to promote the
development of CBEL only by the merchants and consumers. Hence, when the market
regulations are not effective, as the organizer, it is necessary for the government to
supervise and motivate through some administrative or economic means. Therefore,
the study on the behavior of subjects in CBEL developing should be a mixed game
between government, merchant and consumer. Besides, with the development of
information technology, the market is no more a completely “black box” today,
consumers can lean of the merchant behavior via various channels.
3.3.1 Hypothesis and Parameter
In order to focus on the nature of the research problem and simplify the model
calculation, the following assumptions are put forward:
- Game subjects are rational. That is, merchant and consumer pursue their own
profit maximization, and the government pursues the greatest social profit.
- Dynamic game under complete information. That is, all parties know each
other’s strategy.
- The parties engage the game in following order: “government - merchant -
consumer”. That is, firstly, the government formulates the supervision policies,
then the merchant determines the logistics strategy, at last, the consumer makes
the purchase option.
In order to promote the development of CBEL, on the one hand, government can
ratify special funds used for infrastructure construction and propaganda; one the other
hand, fiscal and tax regulatory means can be introduced, such as offering tax
exemption to merchant who implemented CBEL, practicing more aggressive random

Developing E-commerce Logistics in Cross-border Relation
74
inspection and tax evasion penalty on the consumers who purchased through postal
parcel. In this model, the two strategies of government are respectively called active
regulation 1ga and prudent regulation 2ga , so the strategy space of government is
1 2,g g gA a a ,and the probability of strategy implementation is gp and 1 gp .
The merchant has two strategies, implement CBEL 1ma and use traditional logistics
2ma , so the strategy space of merchant is 1 2,m m mA a a , and the probability of
strategy implementation is mp and 1 mp . The consumer has two strategies as well,
either purchase products through CBEL 1ca or through traditional logistics 2ca , so
the strategy space of consumer is 1 2,c c cA a a , and the probability of strategy
implementation is cp and 1 cp .
In order to a present the game process more intuitively between government,
merchant and consumer, the following game tree was constructed (Figure 26):
G
M M
C C C C
1 2 3 4 5
1 ,c ca p 2 ,1c ca p
1 ,m ma p 2 , 1m ma p
1 ,c ca p
1 ,m ma p 2 , 1m ma p
1 ,g ga p 2 , 1g ga p
2 ,1c ca p
Figure 26 Trilateral Game Tree between Subjects in CBEL Developing
According to the hypothesis above, the trilateral game model was formulated as:
, ( ) , ( )n nG N A R
- The set of players: , ,N g m c , respectively represent government,
merchant and consumer;
- The set of actions available to players: 1 2, ,n n nA a a n N ;
- The set of utility function to players: ( ) , ,n j j nn Nu a a A A A
;
- The set of probability distributions, as the mixed strategy of players:

Chapter 3 Game Model and Strategy between Behavior Subjects of CBEL
75
2
1 21
( ) , 0, 1n n n ni nii
A p p p p
Hereinafter referred to as ;
- The expected payoff function of players: ,( ) ( ( ))ni
j
n n a n ja A n N
u p u a
The parameters in the model are presented as follows.
Table 24 Parameters in Trilateral Game Model
Notation Representation
T The effective investment of government in active regulation, such as the cost of infrastructure construction and propaganda. It is equal to the total revenue of merchant and consumer from successfully implementing CBEL.
The proportion of the merchant’s profit from the effective investment of government. Therefore, under the active regulation, the merchant can obtain the additional profit
T , and the consumer can obtain (1 )T .
W The increased social welfare from government successfully promoting the CBEL, such as the growth of import and export trade.
B The government subsidy for the merchant who implemented CBEL, such as tax exemption. In order to emphasize the government’s long-term deployment of the active regulation strategy, assumed B T .
F The government penalty for the consumer who purchased via traditional logistics channels, such as the tax evasion penalty.
iR The profit of merchant. 1R is the profit when merchant implemented CBEL, 2R is the benefit when merchant used traditional logistics.
iC The logistics cost of merchant. 1C is the cost when merchant implemented CBEL,
2C is the cost when merchant used traditional logistics. Because investing in new systems requires more resources, so 1 2C C .
iU The utility of the consumer. 1U is the utility of purchasing through CBEL, 2U is the utility of purchasing through traditional logistics. Since CBEL provides more reliable products and better service, so 1 2U U .
3.3.2 Payoff Matrix and Model Strategy According to the game tree model, the following payoff matrix of government,
merchant and consumer can be obtained (Table 25):

Developing E-commerce Logistics in Cross-border Relation
76
Table 25 Payoff Matrix of Government, Merchant and Consumer
No.( j ) Action Profile ( ija ) Payoff
( )g g ju a ( )m mju a ( )c cju a
1 1 1 1( , , )g m ca a a W T 1 1R C T 1 (1 )U T
2 1 1 2( , , )g m ca a a T 1C T 0
3 1 2 1( , , )g m ca a a T 2C 0
4 1 2 2( , , )g m ca a a T 2 2R C 2U
5 2 1 1( , , )g m ca a a W B 1 1R C B 1U
6 2 1 2( , , )g m ca a a B 1C B 0
7 2 2 1( , , )g m ca a a 0 2C 0
8 2 2 2( , , )g m ca a a F 2 2R C 2U F
Note: in different combinations of actions, the payoff function of government, merchant and consumer are respectively marked as ( )g g ju a , ( )m mju a , ( )c cju a
When a player’s expected values of each strategy choice is equal, the mixed-strategy
Nash Equilibrium is achieved, because no matter which strategy is chosen, the payoff
is the same. Therefore, the mixed strategy equilibrium solution is obtained as follow:
(1) When the merchant implemented the strategy 1ma with the probability mp , and
the consumer implemented the strategy 1ca with the probability cp . The profit of
government under active regulation 1ga can be expressed as follow:
1 1 2 3 4( ) (1 ) ( ) (1 ) ( ) (1 )(1 ) ( )( ) (1 )( ) (1 ) ( ) (1 )(1 )( )
g m c g m c g m c g m c g
m c m c m c m c
u p p u a p p u a p p u a p p u ap p W T p p T p p T p p T
(3.1)
The profit of government under prudent regulation 2ga can be expressed as follow:
2 5 6 7 8( ) (1 ) ( ) (1 ) ( ) (1 )(1 ) ( )( ) (1 ) ( ) (1 )(1 )
g m c g m c g m c g m c g
m c m c m c
u p p u a p p u a p p u a p p u ap p W B p p B p p F
(3.2)
When the expected profits under two strategies are same, the game can achieve a
balanced state, so due to 1 2g gu u can obtained:

Chapter 3 Game Model and Strategy between Behavior Subjects of CBEL
77
* m mc
m
T F p F p BpF p F
(3.3)
(2) When the government implemented the strategy 1ga with the probability gp , and
the consumer implemented the strategy 1ca with the probability cp . The profit of
merchant implementing CBEL strategy 1ma can be expressed as follow:
1 1 2
5 6
1 1 1
1 1 1
( ) (1 ) ( )(1 ) ( ) (1 )(1 ) ( )
( ) (1 )( )(1 ) ( ) (1 )(1 )( )
m g c m g c m
g c m g c m
g c g c
g c g c
u p p u a p p u ap p u a p p u a
p p R C T p p C Tp p R C B p p C B
(3.4)
The profit of merchant using traditional logistics 2ma can be expressed as follow:
2 3 4
7 8
2 2 2
2 2 2
( ) (1 ) ( )(1 ) ( ) (1 )(1 ) ( )
( ) (1 )( )(1 ) ( ) (1 )(1 )( )
m g c m g c m
g c m g c m
g c g c
g c g c
u p p u a p p u ap p u a p p u a
p p C p p R Cp p C p p R C
(3.5)
When the expected profits under two strategies are same, the game can achieve a
balanced state, so due to 1 2m mu u can obtained:
* 1 2 1 2 2c cg
B C C p R R p RpB T
(3.6)
(3) When the government implemented the strategy 1ga with the probability gp , and
the merchant implemented the strategy 1ma with the probability mp . The utility of
consumer purchasing through CBEL strategy 1ca can be expressed as follow:
1 1 3 5 7
1 1
( ) (1 ) ( ) (1 ) ( ) (1 )(1 ) ( )( (1 ) ) (1 )
c g m c g m c g m c g m c
g m g m
u p p u a p p u a p p u a p p u ap p U T p p U
(3.7)
The utility of consumer purchasing through traditional logistics 2ca can be expressed
as follow:
2 2 4 6 8
2 2
( ) (1 ) ( ) (1 ) ( ) (1 )(1 ) ( )(1 ) (1 )(1 )( )
c g m c g m c g m c g m c
g m g m
u p p u a p p u a p p u a p p u ap p U p p U F
(3.8)

Developing E-commerce Logistics in Cross-border Relation
78
When the expected profits under two strategies are same, the game can achieve a
balanced state, so due to 1 2c cu u can obtained:
2*
1 2
gm
g g g
U p F Fp
U U p T p T p F F
(3.9)
In summary, the mixed-strategy equilibrium solution of the trilateral game for
implementing CBEL was addressed as follow:
* 1 2 1 2
2*
1 2
*
* * *
(1 ) ( )
(1 )(1 ) (1 )
(1 )(1 )
, , [0 , 1]
c cg
gm
g g
m mc
m
g m c
B p R p R C CpB T
U p Fp
U U p T p FT p F p Bp
p Fp p p
(3.10)
3.3.3 The Analysis of Mixed-Strategy Equilibrium
(1) The analysis of consumer’s equilibrium
The first derivative of the *cp versus T is:
* 1(1 )
c
m
pT p F
(3.11)
Because [0,1]mp , so * 0cp T , *cp is the monotonic increasing function of
T . That means, consumers are more willing to purchase through CBEL channel with
the increase of government’s effective investment. This further proves that
government’s active regulation effectively motivates consumer to purchase through
CBEL channel.
The first derivative of the *cp versus B is:
*
(1 )c m
m
p pB p F
(3.12)
Because [0,1]mp , so * 0cp B , *cp is the monotonic decreasing function of
B . That means, the government’s prudent regulation cannot motivate consumers to
purchase through CBEL channel. On the contrary, the consumers are more willing to

Chapter 3 Game Model and Strategy between Behavior Subjects of CBEL
79
purchase through traditional logistics channel with the increase of government’s
subsidy for merchant.
The first derivative of the *cp versus F is:
*
2(1 )c m
m
p p B TF p F
(3.13)
When 0mp B T , so * 0cp F , *cp is the monotonic increasing function of F ;
when 0mp B T , so * 0cp F , *cp is the monotonic decreasing function of F .
Hence, there is no strict monotony between *cp and F , their relationship depends
on the effective investment T under government’s active regulation and the
government’s subsidies for merchant B under government’s prudent regulation. This
further proves that, when government’s effective investment is insufficient while the
incentive mechanism is still imperfect, increase the penalty for consumers cannot
effectively motivate them to purchase through CBEL channel.
In summary, for government, by improving the tax policies, such as appropriate
subsidies B for the merchants, and by increasing the effective investment T , such
as infrastructure construction, can motivate consumers to purchase via CBEL channel.
Further analysis can obtain * *c cp T p B , which shows that T has more
influence on consumer’s decision making.
(2) The analysis of merchant’s equilibrium
The first derivative of the *mp versus F is:
*1
21 2
(1 )[ (1 ) ]( )
g gm
g g g
p U p TpF U U p T p T p F F
(3.14)
Because [0,1], [0,1]gp , so * 0mp F , *mp is the monotonic decreasing
function of F . That means, the government’s prudent regulation cannot produce
positive incentives to the merchant. On the contrary, the merchant is more willing to
use traditional logistics with the increase of government’s penalty for consumer.
The first derivative of the *mp versus T is:
*2
21 2
(1 )[ +(1 ) ]( )
gm
g g g
U p FpT U U p T p T p F F
(3.15)

Developing E-commerce Logistics in Cross-border Relation
80
Because [0,1], [0,1]gp , so * 0mp T , *mp is the monotonic increasing
function of T . That means, the merchant is more willing to implement CBEL with
the increase of the effective investment under government’s active regulation.
The first derivative of the *mp versus is:
*2
21 2
[ (1 ) ]( )
g gm
g g g
p T U p FpU U p T p T p F F
(3.16)
Because [0,1]gp , so * 0mp , *mp is the monotonic increasing function of
. That means, if the government increases the proportion of the merchant’s profit in
the effective investment, which can promote the merchant to implement CBEL.
In summary, if the merchants can obtain more extra profit from government, they are
more willing to implement CBEL. On the one hand, the government should improve
infrastructure to reduce the operation cost of merchant; on the other hand, the
government should strengthen the promotion efforts to motivate consumers to
purchase through CBEL channels.
(3) The analysis of government’s equilibrium
The first derivative of the *gp versus T is:
*1 2 1 2 2
2
( )( )
g c cp b B C C p R R p RT B T
(3.17)
Because 1, B T , so 0B T ; *1 2 1 2 2( ) / ( ) 0g c cp B C C p R R p R B T ,
so 1 2 1 2 2 0c cB C C p R R p R , then * 0gp T , *gp is the monotonic
increasing function of T . That means, with the growth of the effective investment,
the government is more willing to implement the active regulation.
The first derivative of the *gp versus is:
*1 2 1 2 2
2
( )( )
g c cp B C C p R R p R TB T
(3.18)
Because 1 2 1 2 2 0c cB C C p R R p R , so * 0gp , *gp is the monotonic
increasing function of . That means, the government offers more profit for
merchant from effective investment, which will increase the probability of active
regulation implementation.

Chapter 3 Game Model and Strategy between Behavior Subjects of CBEL
81
In summary, if the merchant can obtain more extra profit, they will actively
implement the CBEL, and then the successful implementation will increase the social
welfare, so the government will invest more on infrastructure construction to promote
the development of CBEL. Thus, the active regulation creates a positive circulation.
3.3.4 Recommendation
Based on the mixed-strategy equilibrium solution of trilateral game, the following
suggestions need to be taken into consideration when promote the implementation of
CBEL, so that the effectiveness of the government regulation can be improved:
(1) Form and prefect the incentive mechanism.
Raise the subsidies B for merchants who implemented CBEL; strengthen the
supervision and the punishment F for consumers who purchased via traditional
logistics channel, which will not increase the efficiency of the government regulation.
When a proper incentive mechanism is absent (i.e. 0mp B T ), even if the
government increases the investment to develop infrastructure construction and
motivate consumers to purchase via CBEL channel, the actual result will be
counterproductive.
(2) Emphasize the sustainability development of CBEL.
The prudent regulation could promote the development of CBEL but just in a short
term, the sustainable development cannot solely rely on the subsidies and penalty.
Relatively, by the equilibrium solution analysis, the active regulation could effectively
increase the merchant’s implementing probability *mp and the consumers’
purchasing probability *cp . Therefore, the focus of the government regulation should
be shifted to infrastructure construction, propaganda and popularization.
(3) Priority to improve the infrastructure construction of CBEL.
In the case of the effective investment F unchanged, if government increases the
proportion of the merchant’s profit , so that can motivate the merchant to
implement CBEL. Therefore, in order to reduce the operation cost for the merchants,
the government should prioritize to perfect the infrastructure construction. This has
proved to be a good way to improve the efficiency of government regulation.

Developing E-commerce Logistics in Cross-border Relation
82
4. A Decision Model of E-logistics Strategy in CBE
In addition to the government’s active guidance and support, merchants should also
actively seek effective approach for resolving the problems encountered in the
development of CBEL. In this chapter, based on the survey data of case enterprises,
considering internal factors “Company” and “Product”, a general normative decision
model was presented, which can help merchants adapt the “logistics strategy” to
possible forms of the “logistics problem” in CBE.
4.1 Logistics Problem in Cross-border Relation
As asserted by many studies in the field of supply chain network design, the logistics
problem can be described on the basis of two main groups of factors whose values
affect the choice of logistics strategy (Ghezzi, et al. 2012).
(1) Product factors.
Drivers of product complexity are those factors of physical goods which most impact
on logistical performance. They were selected on the importance ascribed to them in
Chapter 2 literature review, including product range, value density, durability and
product-specific needs.
(2) Service factors.
These factors represent the complexity of the logistics problem in terms of service
level expectations. They were also selected from literature review in Chapter 2,
including order fulfillment time, punctuality, flexibility and returns rates.
Referring the rating approach of Ghezzi et al. (2012, P.6), a five-level scale was used
to assess the level of the complexity of each factor (L = Low, L/M = Low/Medium, M
= Medium, M/H = Medium/High, H = High). The objective is to assess the
complexity of the logistics problem as a combination of the complexity of eight
factors. (Table 26)

Chapter 4 A Decision Model of E-logistics Strategy in CBE
83
Table 26 Logistics Problem Evaluation in Five-Level Scale
Group Factor Level of complexity
L L/M M M/H H
Product features
Product range [ items] 0<x≤1000 1000<x ≤10000
10000<x ≤20000
20000<x 100000
x>100000
Value density [€/kg] x≤10 10<x≤20 20<x≤100 100<x≤200 x>200
Durability [months] x>24 12<x≤24 6<x≤12 1<x≤6 x≤1
Product specific needs [qualitative]
L L/M M M/H H
Logistics service
Order fulfillment time [days]
x>35 21<x≤35 14<x≤21 7<x≤14 x≤7
Flexibility [qualitative] L L/M M M/H H
Delivery Reliability [%]
x≤80 80%<x≤85% 85%<x≤90% 90%<x≤95% x>95%
Returns rate [%] x≤5% 5%<x≤10% 10%<x≤20% 20%<x≤40% x>40%
According to the overall complexity of the two groups’ factors, the logistics problems
can be classified in four main clusters on the matrix, “Product-Side Complexity”,
“Service-Side Complexity”, “High-Complexity” and “Relatively Easy”, where the
levels of the complexity of the different drivers were combined. (Figure 27)
Figure 27 Classification of Logistics’ Problems
- “Product-Side Complexity”. In this cluster, the product complexity is higher than
the service complexity.
- “Service-Side Complexity”. In this cluster, the service complexity is higher than
the product complexity.

Developing E-commerce Logistics in Cross-border Relation
84
- “High-Complexity”. In this cluster, both the product complexity and the service
complexity are high.
- “Relatively Easy”. In this cluster, both the product complexity and the service
complexity are low.
4.2 Logistics Strategy in Cross-border Relation
Consistent with the definition in Chapter 1, an e-logistics system consists of
e-procurement and e-fulfillment process and can be expressed as following (Figure
28), wherein, e-procurement only considered logistics actives in purchasing.
Figure 28 Structure of E-logistics System in Thesis
Referred to Lummus and Vokurka (2002, P.51), six e-logistics strategies in CBE were
identified based on who is in charge of which part of logistics’ activities. (Figure 29)
Figure 29 Six E-logistics Strategies in CBE
Chapter 4 A Decision Model of E-logistics Strategy in CBE
85
“Merchant” mentioned in strategy is the enterprise that sells products directly to end
consumers. It can be a manufacturer, a retailer, and even a service provider.
(1) “Full in-house” strategy.
This strategy is the most integrated model from the logistics point of view. The overall
process is managed internally by the merchants, even the overseas warehouse,
international transportation and reverse logistics. The enterprises use this strategy in
order to guarantee the reliability of the supply and delivery efficiency, but should have
strong operational capacity and financial strength.
(2) “Merchant managed” strategy.
In this strategy, the merchants purchase or produce products and carry out all other
activities by themselves except international logistics and reverse, which is
outsourced to LSP. Some merchants are also responsible for end delivery within a
certain scope under their capacity. This strategy is suitable for the enterprises who do
not own international transportation capacity.
(3) “Supplier managed” strategy.
In this strategy, suppliers maintain a majority of inventory, while the merchants carry
storage for a limited number of items (usually a few hundred) in order to sell them at
a very competitive price or to increase the service level (reduce the response time).
Some items are managed according to the consignment stock policy (i.e., products are
at the merchant warehouse and are managed through the “payment-upon-sales”
formula). Whereas, shipping and reverse are carried out by LSPs.
(4) “Drop-shipping” strategy.
In this strategy, the merchants do not own products and have no inventory (and no
warehouse). They collect consumer orders from own websites and then issue large
aggregated replenishment orders to suppliers (ordering-upon-sales formula). All the
warehousing activities (e.g. storing, picking, preparation and assembly) are fulfilled at
the supplier’s warehouse when receiving orders from merchant. Most of the
marketplaces use this strategy. The difference with respect to the “Supplier-managed”
model is that the picking and assembling of orders are carried out by the supplier
rather than by the merchant.

Developing E-commerce Logistics in Cross-border Relation
86
(5) “LSP managed” strategy.
In this strategy, the merchants just play as a messenger of information, and only
participate in order processing. It will commission the LSPs to purchase products and
aggregated replenishment from suppliers. LSPs are involved in all physical logistics
activities. If the merchants receive a multi-supplier order (i.e., an order made up of
items provided by different suppliers), then the orders are assembled at LSP’s transit
point in order to deliver them together. SMEs and marketplaces can use this strategy
to significantly reduce fixed costs and operating costs.
(6) “Full outsourced” strategy.
All other activities are carried out by the LSPs, with the exception of order processing
which is shared by merchant. This strategy will be used in specific situation, for
example, the LSPs launch online market and operate by themselves, or enterprises
have their own logistics subsidiary.
Among these strategies, “Merchant managed”, “Supplier managed” and “LSP
managed” belong to Hybrid mode. The biggest difference is the ownership of stock,
and the model of “Supplier managed” can be taken as a variant of VMI.
In conclusion, the strategies are based on two dimensions: the structure of logistics
and the operation of logistics. On the structure dimension, the strategies are classified
as centralized or decentralized. In a centralized structure, all e-logistics processes are
operated in a central site, usually a distribution or fulfillment center. In a decentralized
structure, e-logistics components are located at different sites. On the operation
dimension, the strategies are either self-operated when the enterprises have ability to
control the whole logistics process, or outsourced to third parties or partners.
4.3 Case Analysis Based on Survey Data
In this section, use the survey results to present how case enterprises adopt logistics
strategy to solve logistics problem in CBE. The introduction already elaborated that,
China and Germany, as the representative of developing and developed countries,
their experience and achievements in CBE hold a leading position in the world.
Therefore, the high-level managers in 71 leading CBE merchants who have built their
success by implementing efficient and effective logistics strategies were survived,
wherein, 43 retailers and 6 manufacturers in China, 21 retailers and 1 manufacture in
Germany (Appendix 3). The case enterprises cover the main product industries - i.e.,

Chapter 4 A Decision Model of E-logistics Strategy in CBE
87
fashion, consumer electronics, groceries, beauty and care, and include two major
types of e-commerce business: pure player and click-and-mortar. Their complexity
levels of each driver in product features and logistics services were reported in
Appendix 4.
4.3.1 Logistics Problem Matrix
In order to display more intuitive, the logistics problems of all cases were plotted on
the matrix based on complexity of Product features-Logistics service (Figure 30).
E-marketplace Self-operation e-retailer Integrated e-retailer
Click & Mortar Manufacturer
Low Low-Medium Medium Medium-High High
Low
Low
-M
ediu
mM
ediu
mM
ediu
m-
Hig
hH
igh
12
1
21
11
33
25
2
3
1
22
13
30 2
Product features
Logi
stic
s se
rvic
e le
vel
1
2
3 4
5
31
32
2
3420
2
3 14
24
35 3
40
4 23
4441
2
10
1
1
3
3
1
3 12
20
4
1
1
10
125
15
14
21
1
42
5
1
4 Relatively Easy
1 High Complexity3 Service-side Complexity
2 Product-side Complexity
White Shape—Chinese enterprises Gray Shape—German companies
1143 13
15
1
Figure 30 Problem Matrix of Case Enterprises
The similarities and differences among each cluster were elaborated in following.
(1) Cluster 1: “High complexity”
In this cluster, both German and Chinese enterprises are faced with Medium/high
product complexity and service complexity.
Developing E-commerce Logistics in Cross-border Relation
88
For German enterprises, this cluster describes the logistics problem for e-commerce
vendors in the fashion industry. The product-side complexity is high due to a broad
product range (tens of thousands of items) and a high value density (up to a few
thousand Euros per kg for the luxury brand of apparel) and short-lived durability
(fashion effect). With regard to the logistics service level, European consumers are
demanding for short fulfillment time because of the convenient transportation and
trade in EU, and the acceptable time is usually within one week. In addition, the high
return rate of the fashion industry has also contributed to the service complexity, due
to size mismatches or consumers just changing their minds.
For Chinese enterprises, besides fashion, groceries and baby products also have
complex characteristics as well. The most obvious aspects are numerous consumer
goods categories and perishable foods. The special needs in warehousing and
transportation for them are very high, such as temperature and humidity. As
for the logistics service level, in addition to the expectations of the short fulfillment
time, Chinese consumers have very high demand for delivery reliability due to the
inconvenience of exchange and return in cross-border transport.
(2) Cluster 2: “product-side complexity”
In this cluster, the complexity of product is greater than the complexity of the service.
There are more German enterprises in this field than in China.
For German enterprises, the Medium/High product complexity is the result of a broad
product range, high value goods and a short of durability. For example, the case of
consumer electronics industry, who offers more than 50000 different items, the value
of which can reach thousands of Euros per kg; some kinds of organic care products
face a potentially high risk of obsolescence. With regard to the customer service level,
although consumers still have a high demand for short fulfillment time and high
flexibility, the return rate of such products (< 5%) is far lower than fashion (> 40%),
thus the service complexity is decreased.
For Chinese enterprises, most of the products in this cluster are luxury and jewelry
which belong to fashion industry. Not as for groceries, Chinese consumers are ready
to accept comparatively long delivery time if they find exactly and valuable products
they are looking for. Some products are even in anti-season promotions, which no
hurry to use.
Chapter 4 A Decision Model of E-logistics Strategy in CBE
89
(3) Cluster 3: “service-side complexity”
In this cluster, the distribution of enterprises is relatively concentrated. The number of
enterprises has increased. The product complexity is below medium level.
For German enterprises, the complexity of the logistics problems is still due to fashion
industry, challenging service requirements in terms of short fulfillment time, high
flexibility and return. The product complexity is usually medium or low since some
items (e.g., accessories and luggage) might have not wide range, or not high
requirement for storage and transportation, while the lifetime can be long.
For Chinese enterprises, the complexity of the product features is not high, baby
products and personal care products account a large proportion of sales in this cluster,
which have relatively long using time and easy storage environment. Some of them
are highly targeted products in a small scope, such as baby nutrition and
cosmeceuticals. In contrast, the requirement for cross-border transportation is still the
main reason of the high complexity of the service. For example, many Chinese
consumers have high willingness to buy milk powder and baby nappies from overseas.
Fast and reliable delivery is their expectation.
(4) Cluster 4: “Relatively easy”
Because this cluster has a variety of combinations where gathered a large number of
enterprises, the induction is in accordance with product features rather than the
country. It contains most of the commodities mentioned before, but the logistics
problems are less critical than in other cluster due to a comparatively narrower
product range (e.g. fashion industry, consumer electronic industry), a comparatively
longer durability (e.g. groceries) and average service level requirements (e.g. beauty
and care industry). So the complexity is Medium in both the product and service
aspects. For the household and housewares industry, the service requirements are not
demanding (a return rate is lower than 10% and no specific requirements for other
performance). For OTC drugs and dietary supplements industry, the product feature
complexity has been rated as Low/Medium because the complexity is related to only a
few drivers (e.g., the high value density). This is a comparative judgment and does not
mean that these problems are trivial in an absolute sense.
In conclusion, through the statistics and analysis of case studies, the logistics problem
in cross-border e-commerce can be generalized and discriminated from the following
three perspectives:

Developing E-commerce Logistics in Cross-border Relation
90
(1) Condition of Nation
From the Table 27 can be obtained, German enterprises have higher product and
service complexity. On the one hand, German merchants could manage broader
products and perishable items because of predominant geological environment in the
EU. On the other hand, with the well-developed logistics technology, German
merchants could provide faster transport, more flexible delivery and more convenient
return to consumer. In contrast, China’s CBE often needs to take long distances,
especially for imports from Europe and North America. Therefore, Chinese
consumers can accept longer delivery period, generally within 2-weeks (iResearch,
2016). Meanwhile, Chinese customers are demanding on high delivery reliability due
to the uncertainty and time-consuming in long-distance transport. For the same reason,
very few Chinese merchants’ sale perishable products and accept the return of CBE
products.
Table 27 Proportion of “M/H” and “H” Logistics Problems in Case Enterprises
Cases
Product complexity Service complexity
Product range
Value density Durability Specific
needs Fulfillm-ent time Flexibility Delivery
reliability Return rates
Germany 45% 32% 55% 18% 95% 68% 14% 32%
China 27% 31% 16% 35% 82% 43% 73% 2%
(2) Nature of Company
From the Table 28 can be obtained, for e-marketplace, either the product features or
the logistics service is not easy, because a wide range of merchants settled in the
platform, it is difficult to control the quality of product and service. On the contrary,
click-and-mortar has sufficient supply, can leverage synergies with the offline channel
(since it is a traditional player), so the logistics problem is not complex except the
outsourced delivery needed to pay attention. For self-operation enterprises, which are
in charge of inventory and delivery by themselves, can achieve a high demand of
logistics services and respond quickly to customer needs. But on the other hand, the
risk of managing the inventory internally could be high. Finally, for integrated
enterprises, because they have both characteristics of marketplace and self-operation,
the complexity of logistics problems is varied and depends on the product sales and
the company size.

Chapter 4 A Decision Model of E-logistics Strategy in CBE
91
Table 28 Number of Case Enterprises in Different Logistics Problem
Cases High complexity Product-side complexity
Service-side complexity
Relatively easy
E-marketplace 2 3 5 0
Self-operation e-retailer 5 0 6 6
Integrated e-retailer 5 3 2 8
Click-and-Mortar 0 3 5 12
Manufacturer 0 0 2 4
(3) Property of Commodity
From the Table 29 can be obtained, because of short-lived durability (seasonality) and
high return rate (more than 40%), fashion industry contributed to both product-and
service complexity. Meanwhile, groceries were in a “high complexity” due to the risk
of obsolescence, so that they require for special needs in logistics (such as
temperature and humidity) and short fulfillment time. As the same, fast and reliable
delivery is customers’ expectation for baby products in CBE, but their characteristics
were comparatively simple, thus the “service-side complexity” is more serious. On
the contrary, customers can accept longer delivery time for consumer electronics
while their return rate is much lower, so that most of them concentrated in
“product-side complexity” because of broad product range (tens of thousands) and
high value density (up to a few thousand Euros per kg). By contrast, in “Relatively
easy”, the logistics problems are less critical due to narrower product range, longer
durability and lower service requirements, such as beauty and personal care,
housewares and home furnishings.
Table 29 Number of Commodity in Different Logistics Problem
Cases High complexity
Product-side complexity
Service-side complexity
Relatively easy
Fashion 5 4 5 3
Groceries 4 2 2 2
Baby products 2 1 7 1
Consumer electronics 1 5 1 3
Beauty and personal care 1 2 4 7
Housewares and home furnishings 1 1 2 5

Developing E-commerce Logistics in Cross-border Relation
92
4.3.2 Logistics Strategy Matrix
In order to better represent the relationships between logistics problems and the
logistics strategies, a matrix was used to group the 71 case studies according to the
type of problem and strategy (Figure 31).
Full in-house Merchant managed
Supplier managed Drop-shipping LSP managed
Rel
ativ
ely
easy
Serv
ice-
side
C
ompl
exity
Prod
uct-s
ide
Com
plex
ityH
igh
Com
plex
ity
E-logistics strategy
Logi
stic
s P
robl
em
Full outsourced
12
42
15
3
4
32 3420
24 233 44
101
3
41
21
5
1
11
33
25
21
22
13
302
12 5
312
1424 3533
40
2
1
3
1
3 12 14
1
2
4
5
10
15
1 20
1
121
E-marketplace Self-operation e-retailer Integrated e-retailer Click & Mortar Manufacturer
White Shape—Chinese enterprises Gray Shape—German companies
111
1
43
13
Figure 31 Logistics Problem – Logistics Strategy Matrix of Case Enterprises
Some general observations can be made upon an examination of the figure.
(1) For “High complexity” problem
The logistics strategy is straightforward for logistics problem with significant
complexity in both product and service. In view of the high complexity problem, the
“Self-operation” enterprise and “Integrated” enterprise will operate procurement and
delivery by themselves in order to ensure product quality and efficient fulfillment.
Chinese enterprises adopted “Merchant managed” to control all logistics activities
except reverse, meanwhile outscored international transportation to LSP. In contrast,
Germany enterprises are also responsible for reverse reflecting the attention on the
sustainability and developed transportation technology in Europe, that’s “Full
in-house” strategy. Because of without products owning, when facing complex
Chapter 4 A Decision Model of E-logistics Strategy in CBE
93
logistics problems (e.g. perishable product storage and cold chain transport), the
e-marketplace will commission a professional LSP to operate warehousing and
shipping (even pre-purchase and replenishment), so that increase the service level.
(2) For “Product-side complexity”
The adoption of the strategy for “product-side complex” is obviously. Two strategies
have been used, which are the “Supplier managed” and the “Drop-shipping”. In these
strategies, the supplier carries out main warehouse activities and outsources delivery
to LSP. As platform without product owning, the e-marketplace should focus on all
those critical success factors that provide the customer with an excellent online
shopping experience (i.e., the design of the website, online marketing, the design of
the ordering process, etc.). The integrated enterprise and click-and-mortar may carry
storage for a limited number of items in order to sell them at a very competitive price
and ensure a quick response to customer needs.
(3) For “Service-side complexity”
For logistics problems with significant complexity in service, the choice of the
logistics strategy is not as straightforward as the two previous types. But the “LSP
managed” strategy seems to be still the best fit for e-marketplace, just as the analysis
in “High complexity”. Most Chinese enterprises still adopt “Merchant managed”.
Others with strong financial and operational capacity might also want to manage the
international logistics and reverse process internally, so they use “Full in-house”
model for a selection of customers who are willing to pay for the additional service,
for example, consumers can purchase online and return offline in click-and-mortar.
(4) For “Relatively easy”
In the other cases, there is no single best logistics strategy for “Relatively easy”
problem. The merchant has many degrees of freedom in designing the best solution
(reasonable service at the lowest possible cost). The product features and services
level will play a key role in determining the logistics strategy. On the one hand, when
service side is more complex, most critical activities should be managed by the
merchant. “Full in-house” and “Merchant managed” strategies (the most used) have
been adopted. If merchant’s bargaining power is strong, suppliers even own the
inventory at the merchant’s warehouse in order to reduce the risk for the seller. On the
other hand, the risk of managing the inventory internally could be high because
product side is more complex. Then the merchant should focus on all those critical
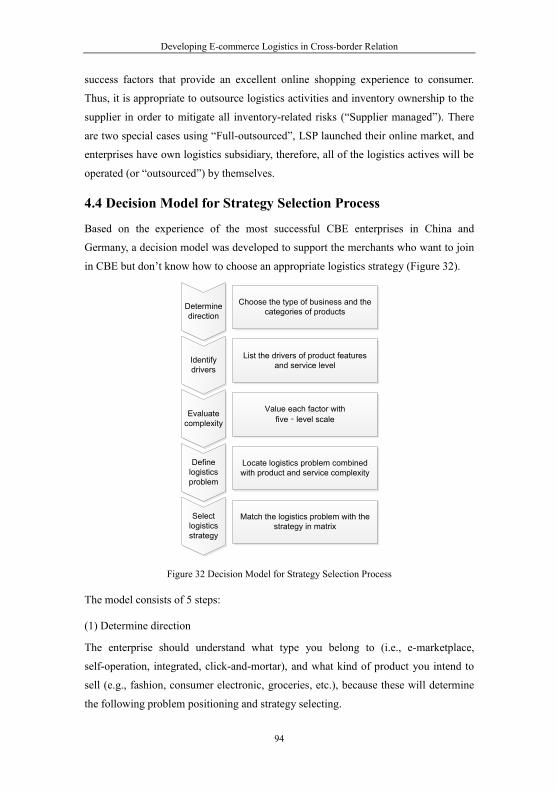
Developing E-commerce Logistics in Cross-border Relation
94
success factors that provide an excellent online shopping experience to consumer.
Thus, it is appropriate to outsource logistics activities and inventory ownership to the
supplier in order to mitigate all inventory-related risks (“Supplier managed”). There
are two special cases using “Full-outsourced”, LSP launched their online market, and
enterprises have own logistics subsidiary, therefore, all of the logistics actives will be
operated (or “outsourced”) by themselves.
4.4 Decision Model for Strategy Selection Process
Based on the experience of the most successful CBE enterprises in China and
Germany, a decision model was developed to support the merchants who want to join
in CBE but don’t know how to choose an appropriate logistics strategy (Figure 32).
Choose the type of business and the categories of products
List the drivers of product features and service level
alue each factor with five‐level scale
Locate logistics problem combined with product and service complexity
Match the logistics problem with the strategy in matrix
Determine direction
Identify drivers
Evaluate complexity
Select logistics strategy
Define logistics problem
Figure 32 Decision Model for Strategy Selection Process
The model consists of 5 steps:
(1) Determine direction
The enterprise should understand what type you belong to (i.e., e-marketplace,
self-operation, integrated, click-and-mortar), and what kind of product you intend to
sell (e.g., fashion, consumer electronic, groceries, etc.), because these will determine
the following problem positioning and strategy selecting.

Chapter 4 A Decision Model of E-logistics Strategy in CBE
95
(2) Identify drivers
Collect the data in terms of the product features (i.e., range, value density, durability,
special needs) and the logistics service (i.e., fulfillment time, flexibility, reliability,
return) according to the list of drivers proposed before. These factors will directly
affect what kind of logistics problems you are facing, so the data need to be as
realistic and objective as possible.
(3) Evaluate complexity:
Value the complexity of each factor according to the five-level scale (L = Low, L/M =
Medium/Low, M = Medium, M/H = Medium/High, H = High). As some of the
assignments are subjective evaluations, this step should involve the experts from
different departments (e.g., operations department, logistics department, product
department, etc.) to avoid deviations.
(4) Define logistics problem:
Assess the combined complexity values of product features and logistics service, then
plotted them on the problem-matrix. According to their position on the matrix, find
your logistics problem belongs to which cluster (i.e., “High-Complexity”,
“Product-side Complexity”, “Service-side Complexity” and “Relatively Easy”).
(5) Select logistics strategy:
In final stage, integrate the nature of business and the type of the logistics problem,
then match the reasonable logistics strategies in accordance with the relations
identified in problem-strategy matrix. For instance, if the problem is “Service-side
Complexity” and it is e-marketplace, a suitable logistics strategy is the “LSP
managed”. If the logistics problem is “Relatively Easy”, thus the operation capability
of the enterprise has to be taken into account in order to make the best choice between
the “Full in-house”, “Merchant managed” and “Supplier managed”.
The function of the first 4 is to accurately address logistics problems, whereas the aim
of the fifth is to support the identification of the best logistics strategy. Moreover, the
following table can be used as a quick reference standard (Table 30). The gray cell is
on behalf of this situation does not appear in the analysis, but can-do inference
according to the similar circumstances.

Developing E-commerce Logistics in Cross-border Relation
96
Table 30 Benchmark for CBEL Strategy Selection
Case
High complexity Product-side complexity
Service-side complexity
Relatively easy
Product-side higher
Service-side higher
Product-side higher
Service-side higher
Marketplace Drop- shipping
LSP- managed
Drop- shipping
LSP- managed
Drop- shipping
LSP- managed
Self-operation Merchant managed/
Full in-house
Merchant managed/
Full in-house
Merchant managed/
Full in-house
Merchant managed/
Full in-house
Merchant managed/
Full in-house
Merchant managed/
Full in-house
Integrated Supplier managed
Merchant managed
Supplier managed
Merchant managed
Supplier managed
Merchant managed
Click&Mortar Supplier managed
Merchant managed/
Full in-house
Supplier managed
Merchant managed/
Full in-house
Supplier managed
Merchant managed/
Full in-house
The model proposed a guideline to decide when to in-source or outsource the logistics
processes, and which part should be outsourced. When the merchants face
“Service-side complexity”, they should manage the whole logistics process internally,
while outsource them seems an effective and efficient solutions for “Product-side
complexity”. Moreover, the merchant should be aware that despite being a very
appealing solution (no inventory and no operations), the “LSP managed” model might
be critical when the customer service level is crucial. The “Full in-house” model
increases control in terms of service level, but it might be costly.

Chapter 5 Competitive Strategy Based on Product and Service Differentiation
97
5. Competitive Strategy Based on Product and Service Differentiation
When formulate the logistics strategy, in addition to the logistics problems
encountered by self, merchants should also take into account the increasingly fierce
competition between each other. Although the commodity is a factor influencing the
selection of logistics strategy, consumers are also increasingly demanding good
logistics services due to long-distance transportation in CBE. Therefore, only those
merchants that stand out in the dual competition of “Product” and “Operation”, can
attract more consumers. In this chapter, a game model was used to analyze how
product and logistics service differentiation impact the formulation of competitive
strategy, the optimal pricing and service level in centralized and decentralized
decision were obtained after model solved.
5.1 Study Premises and Theoretical Basis
5.1.1 Differentiation Strategy
Differentiation has been widely concerned in the early studies, especially the product
differentiation. Hotelling (1929) and Chamberlin (1965) revealed how the companies
choose their own position in the product space to buffer the impact from the price
competition. Porter (1980) made the concept of product differentiation more and more
widely accepted by scholars, he thought the cost advantage and the differential
operation are two forms of competitive advantage, and proposed a general
competitive strategy, including cost leadership, differentiation and focus. In fact, the
three components are not absolutely isolated, such as the “cost leadership” can also
achieve the differentiation of product performance, price, brand and other aspects in
the enterprise competition; and the “differentiation” can also control and reduce the
cost through providing different levels of products or services; and the “focus” is
specific implementation of above two strategies. Therefore, the “cost leadership” and
the “focus” can be regarded as an extension of the “differentiation” strategy.
The utility of the product is reflected in meeting the specific needs of the consumer.
The consumer demand is not only the product itself, but also includes the services
provided by the merchant. Therefore, in a broad sense, the goods in the market are a
binary combined of product and service. Merchants should also pay attention to the

Developing E-commerce Logistics in Cross-border Relation
98
quality of service. The impeccable services not only provide an additional value for
customers, but also bring a good reputation for merchants thereby enhancing the
market competitiveness. And the service differentiation competition can influence the
consumer preferences thereby impacting the market demand, especially when
merchants sell homogeneous products, a slight improvement in services sometimes
lead to customer’s higher willingness-to-pay. Existing studies indicated that
consumers are willing to pay for the promotions of services, such as higher price for
faster delivery. Hence, combined with product, service will inevitably become an
important way to obtain the advantage in differentiation competition. Moreover, the
service differentiation can be formed through the implementation of CBEL, which is
also treated as strategic thinking and become an important component of competitive
strategy. Therefore, the CBE merchants are facing the dual-competition consists of
product and service quality. But not as a clearer definition of product value, the
service value is often a complex concept, since in which consumer can obtain
multi-attribute, including core and certain ancillary services.
Because CBE usually needs to take long-distance transport, consumers often expect
the products can be delivered to the destination at the right time with the lowest cost.
Therefore, the role of logistics services in the competition is gradually valued by CBE
merchants. In order to focus on the impact of CBEL on the formulation of competitive
strategy, in the following analysis, the services provided by CBE merchants only
consider the logistics service.
5.1.2 Consumer Utility
The difference in the product and the service is essentially the difference of consumer
feeling, when consumers perceive the price or service different from other competing
products, the differentiation is achieved. Thus, the differentiation is a function of
consumer preferences. The study on differentiation strategy can be carried out from
the consumer utility.
Some consumers have a higher sensitivity on price, the changes of product price have
a greater impact on their effectiveness; rather, other consumers are more sensitive on
service, changes in service level have a greater impact on their utility. Hence, the
consumers in CBE market can be classified as: price-sensitive and service-sensitive,
the differences are reflected in the perception of product price and service level. The
same product or service brings different utility to different consumers, so the utility

Chapter 5 Competitive Strategy Based on Product and Service Differentiation
99
function should have a parameter represent the consumer type. Meanwhile, the
different products or services also bring different effects to the same consumer, so the
utility function should also have a parameter that reflects a degree of differentiation of
products and services. In the following sections, the completive strategy was divided
into product differentiation model and service differentiation model.
Based on the principle of maximizing utility, consumers make purchase decision
according to the sum of the positive effects of the product and the service. Consumers
are willing to buy the product if and only if the total utility of purchase behavior is
greater than the negative effect of the payment. Therefore, the market demand is
affected by both competitor’s product pricing and service strategy. In order to
maximize profits, merchants should optimize the price-service decision in this
dual-competition environment. However, the provision of high-quality products or
high-level services requires merchants to invest more costs. In the market price
competition, the excessive pursuit of increasing products quality and services level
will bring the profit falling risk to merchants. So in the real business activities, the
merchants should balance the value-added creation and the increasing cost, and
trade-off the use of product differentiation and service differentiation in competitive
strategy formulation.
5.2 Competitive Strategy under Product Differentiation
5.2.1 Hypothesis and Parameter
Consider a dual-channel cross-border supply chain consists of one overseas supplier
and two CBE merchants, one implemented CBEL (Hereinafter referred to as
merchant 1), another used traditional logistics (Hereinafter referred to as merchant
2). In order to focus on the price and service competition and simplify the model
calculation, the following assumptions are put forward:
- Two merchants order a certain degree of difference products from the supplier,
that is, the products sold by two merchants have a certain degree of
substitutability.
- Consumers are rational, they will buy products from the merchant where they
feel can get more utility.
- Without loss of generality, both merchants face the unit market demand and only
consider the logistics service cost, other costs are assumed to be zero.

Developing E-commerce Logistics in Cross-border Relation
100
The parameters in the model are presented as follows (Table 31):
Table 31 Parameters in Product Differentiation Model
Notation Representation
ip The product price of merchant. 1p is the price of merchant 1, 2p is the price of merchant 2.
v The basic product valuation of consumer, and [0,1]v .
is The logistics service level provided by merchant. 1s is the service level of merchant 1, 2s is the service level of merchant 2.
( )iC s The costs function of logistics service. Refer the definition of cost function in economic principles, 2( ) ( 2)i iC s s , is the service cost coefficient. 1C is the service cost of merchant 1, 2C is the service cost of merchant 2.
The degree of product differentiation between merchants, and [0,1] . When 0 , represents the products completely different, there is no alternative; when 1 , represents the products completely homogeneous.
The sensitivity of the consumer on the product price, and [0,1] .
The sensitivity of the consumer on the service level, and [0,1] .
iD The market demand function. 1D is the market demand of merchant 1, 2D is the market demand of merchant 2.
i The profit function. 1 is the profit of merchant 1, 2 is the profit of merchant 2.
iU The consumer utility from product purchasing. 1U is the utility of purchasing from merchant 1, 2U is the utility of purchasing from merchant 2.
This kind of cross-border supply chain can be constructed as follow (Figure 33):
Overseas Supplier
Merchant 1CBEL
Merchant 2Traditional
Consumer
1 1p s 2 2p s
vv
Figure 33 Supply Chain Structure in Product Differentiation Model
Referring to the model of Chen and Yang (2014, P.287), the utility of consumer
purchasing from the merchant 1 is:

Chapter 5 Competitive Strategy Based on Product and Service Differentiation
101
1 1 1U v p s (5.1)
The utility of consumer purchasing from the merchant 2 is:
2 2 2U v p s (5.2)
Consumers are rational. They decide to purchase if the utility is greater than zero.
When facing two different channels, they will choose the channel where can obtain
more utility, that is, the consumer behavior follows 1 2max( , ,0)U U . Defined the
product valuation as 1 2 3, ,v v v under three critical conditions 1 2 1 2=0 , =0 , =U U U U :
1 1 1
2 22
1 2 1 23
( ) ( )1
v p sp sv
p p s sv
(5.3)
Defined the differences between the critical values as:
1 2 1 21 1 2
1 2 1 22 3 1
( ) ( )
( ) ( )1
p p s sv v v
p p s sv v v
(5.4)
When 1 2v v , so 1 0v , get 1 2 1 2( ) ( ) 0p p s s , so 2 0v , obtain
3 1 2v v v ; when 1 2v v , so 1 0v , get 1 2 1 2( ) ( ) 0p p s s , so 2 0v ,
obtain 3 1 2v v v .
There are four situations:
(1) When 1 0U or 2 0U , means 1v v or 2v v , the consumers don’t make
purchase either in merchant 1 or in merchant 2, because the utility is below zero;
(2) When 1 2U U and 1 0U , means 3v v and 1v v , the consumers tend to
purchase from merchant 1, because can obtain higher utility, while no one
purchase from merchant 2;
(3) When 1 2U U and 2 0U , means 3v v and 2v v , the consumers tend to
purchase from merchant 2, because can obtain higher utility, while no one
purchase from merchant 1;
(4) When 1 2 0U U , means 3=v v and 1 2max ,v v v , purchasing from
merchant 1 or merchant 2 makes no difference, because the utilities are same.

Developing E-commerce Logistics in Cross-border Relation
102
Therefore, under different product valuation, the demand of merchants in various
price ranges can be expressed as follow three scenarios (Figure 34):
1 2v v
1 2 3, 1v v v
1 2 3, 1v v v
Purchase from Merchant 1
Purchase from Merchant 2
ot purchase
0 11v 2v3v
ot purchase
0 11v2v 3v
Purchase from Merchant 1ot purchase
0 11v2v 3v
Purchase from Merchant 2
Figure 34 Demand within Various Price Range under Different Product Valuation
(1) If 1 2v v , so 3 1v v , no one purchase from merchant 2, the demand is 2 0D .
When 1[ ,1]v v , consumers purchase from merchant 1, the demand is 1 11D v ;
when 1[0, ]v v , no purchase behavior. Therefore, the price range meets the
following conditions:
2 1 21
( )p s sp
(5.5)
(2) If 1 2v v and 3 1v , no one purchase from merchant 1, the demand is 1 0D .
When 2[ ,1]v v , consumers purchase from merchant 2, the demand is
2 21D v ; when 2[0, ]v v , no purchase behavior. Therefore, the price range
meets the following conditions:
1 21 2
1 ( )s sp p
(5.6)
(3) If 1 2v v and 3 1v . When 3[ ,1]v v , consumers purchase from merchant 1,
the demand is 1 31D v ; when 2 3[ , ]v v v , consumers purchase from merchant
2, the demand is 2 3 2D v v . Therefore, the price range meets the following
conditions:
2 1 2 1 21 2
( ) 1 ( )p s s s sp p
(5.7)

Chapter 5 Competitive Strategy Based on Product and Service Differentiation
103
The aim of this study is to formulate the competitive strategies under the
differentiation of products and services. Therefore, the first two scenarios will not be
included in the following discussion because they are single channel problem. To sum
up, in the third scenario, the demand function of merchant 1 and merchant 2 are:
1 2 1 21
1 2 1 22
( ) ( )11
( ) ( )(1 )
p p s sD
p p s sD
(5.8)
In order to explore the competitive strategy under product differentiation, assumed
that merchants provide the same level of service, that is, the logistics services
including fulfillment time, reliability, flexibility, after-sales service provided by
merchant 2 have no difference with merchant 1, so 1 2s s s . The utility of
consumer purchasing from merchants respectively are:
1s 1 2 2, sU v p s U v p s (5.9)
The demand functions of merchants respectively are:
1 2 1 21 2
( ) ( ) (1 )11 (1 )s sp p p p sD D
, (5.10)
The profits of merchants respectively are:
21 1 21 1 1 1 1
21 1 2 12 2 2 2
( ) 11 2
( ) (1 ) 1(1 ) 2
s s
s s
p p pp D C p s
p p p p sp D C s
(5.11)
The total profit of CBE merchants is:
21 1 2 1 1 2 11 2
(1 ) ( ) (1 )1 (1 )s s s
p p p p p p p s s
(5.12)
5.2.2 Optimal Strategy in Centralized Decision
In centralized decision (Hereinafter referred to as CD), CBE merchants aim to
maximize the total profit of cross-border supply chain s , they cooperated with each
other closely and develop sales strategies together.

Developing E-commerce Logistics in Cross-border Relation
104
The first derivative of the versus 1 2,p p are:
1 2 1 2
1 2
2 ( ) 2 ( )11 (1 )
s sp p p p sp p
, (5.13)
Then the Hessian Matrix of this optimal problem under second-order conditions is:
2 21 12 2
1 (1 )
H
(5.14)
The order principal minor determinant can be solved as: 2
1 22 4,
1 (1 )H H
(5.15)
Because [0,1] , so 1 20 , 0H H , the Hessian Matrix is negative-definite.
Thus, exist an optimal pricing strategy * *1 2( , )p p , can make the total profit of CBE
merchants to the maximum. Their value can be obtained by simultaneous solution of
1 20 , 0s sp p .
Therefore, the optimal pricing strategies of merchants respectively are:
* *1 2
12 2
s sp p
, (5.16)
Put * *1 2,p p into 1 2, ,s s s , can obtain the profit of merchant 1, merchant 2 and
the total in CD with homogeneous services:
2
1
2 2
2
2 2
1 s 24( 2 )
4(1 2 s) ( 4 )
4
cs
cs
cs
s
s s
s
(5.17)
Solving the first order equation 0cs s , can obtain the service strategy in CD
with homogeneous services:
24cs
(5.18)
s

Chapter 5 Competitive Strategy Based on Product and Service Differentiation
105
5.2.3 Optimal Strategy in Decentralized Decision
In decentralized decision (Hereinafter referred to as DD), the merchants develop
strategies respectively aim to maximize own profit. It is a dynamic game in oligopoly
market, or called Stackelberg game. As the assumption in Chapter 3, the merchant 1
implemented CBEL is leader, the merchant 2 used traditional logistics is follower. The
parties engage the game in following order: firstly, the merchant 1 makes strategy to
maximize own profit, and then the merchant 2 makes profit level according to the
pricing of merchant 1. However, the merchant 1 knows the behavior of merchant 2,
so the merchant 1 will make final strategy according to the merchant 2’s reaction
function based on own pricing. The inverse-deducing method was used to calculate
the optimal solution of the model.
Solving the first order equation 2 2 0s p , can obtain the pricing that maximize
the profit of merchant 2:
12
(1 )2
p sp
(5.19)
Then, put 2p into the profit function of merchant 1, can obtain:
221 1
1( 2) (2 )(1 ) 1
2(1 ) 2sp p s s
(5.20)
Solving the first order equation 1 1 0s p , can obtain the optimal pricing *1p that
maximize the profit of merchant 1:
(5.21)
Then, put into , can obtain the optimal pricing *2p of merchant 2:
*2
[ (4 ) 2 ](1 )4 (2 )
sp
(5.22)
Finally, put * *1 2,p p into , can obtain the profit of merchant 1, merchant
2 and the total in DD with homogeneous services:
*1
(2 )(1 )2 (2 )
sp
*1p 2p
1 2, ,s s s

Developing E-commerce Logistics in Cross-border Relation
106
21 1 5
15
2 2 22 2 5
25
2 22 3 4 5
5
8 (1 ) (2 )]2
4 (1 ) 4 [ (4 ) ]2
4 4 ( 2 )2
ds
ds
ds
s A s A AA
s A s A AA
A s A s A AA
(5.23)
In the formula 5.23,
1
2
32
42
5
(1 )(2 )(1 )(4 )(1 )(8 3 )(1 )(16 4 )8 (2 )
AAAAA
(5.24)
Because [0,1] , so 1 5A A are all greater than 0.
Solving the first order equation 0ds s , can obtain the optimal service in DD
with homogeneous services:
32
5 4
22
d AsA A
(5.24)
5.2.4 Comparative Analysis
5.2.4.1 The impacts on the service level
When the merchants provide homogeneous services, the deference of service level
between CD and DD can be expressed as:
2 21
2 25 4
[8 (3 ) ](4 )(2 )
c d As s sA A
(5.25)
Because [0,1] , 0 , 0c ds s , so 2 25 44 0 , 2 0A A . When
218 (3 ) 0A , thus c ds s , means that the service level in CD is higher
than in DD; when 218 (3 ) 0A , thus c ds s , means that the logistics
service in DD has higher level. Therefore, when merchants provide the same logistics
service in CBE, the service level will be affected by consumer behavior ( , ),
operation cost ( ) and product attribute ( ). This further proves that the CBE
merchants should consider these factors synthetically when generate service strategy.
~

Chapter 5 Competitive Strategy Based on Product and Service Differentiation
107
In CD, the first derivatives of the cs versus , , , are:
2 2
2 2 2 2
2 3
2 2 2 2
4 (4 + ), ,(4 ) (4 )
4 ,(4 ) (4 )
c c
c c
s s
s s
(5.26)
In DD, the first derivatives of the ds versus , , , are:
23 5 3 4 52 2 2 2
5 4 5 42 2
3 5 6 72 2 2 2
5 4 5 4
4 2 ( 2 )(2 ) (2 )
4 8 (4 )(2 ) (2 )
d d
d d
A A A A As sA A A A
A A A As sA A A A
, ,
,
(5.27)
In the formula 5.27,
62 2
7
(2 )(6 )(1 ) (32 24 5 )
AA
(5.28)
Because [0,1] , so 6 70 , 0A A .
The following conclusions can be drawn:
(1) 0 , 0c ds s
Whether in CD or DD, the service level s will decrease with the increase of
consumer’s price-sensitivity . This is because when consumers are more sensitive
to the product price, they will be attracted by lower prices. Thus, no matter
implemented CBEL or traditional logistics, the merchant tends to take low price
competition strategy thereby ignored service. The reduction of investment in logistics
service eventually leads to a decline in service level.
(2) 0 , 0c ds s
Whether in CD or DD, the service level s will increase with the increase of
consumer’s service-sensitivity . This is because when consumers are more
sensitive to the service level, they will pay attention to the utility from service. Thus,
no matter implemented CBEL or traditional logistics, the merchant tends to improve
the service level in order to attract more consumers.
(3) <0 , 0c ds s
Whether in CD or DD, the service level s will decrease with the increase of the
service cost coefficient . This is because when the service cost coefficient is high

Developing E-commerce Logistics in Cross-border Relation
108
(i.e. the input-output ratio of service cost is low), means the merchants need to invest
more to maintain the same service level. Therefore, the service level is bound to be
decreased when the merchant reduces the investment in logistics services.
(4) 0 , 0c ds s
Whether in CD or DD, the service level s will increase with the decrease of product
differentiation . This shows that when merchants’ product converge in the market,
the product price is not enough to determine the consumer’s purchase behavior. The
consumers will choose the merchant with higher service level, so the service
differentiation can provide more competitive advantages for CBE merchants.
5.2.4.2 The impacts on the total profit of CBE merchants
When the merchants provide homogeneous services, the deference of total profit
between CD and DD can be expressed as:
2 2 2
2
4 4 (3 ) (4 )16 (2 )
c ds s s
s s
(5.29)
Because [0,1] ,so 0s . This means that the total profit of CBE merchants in
CD is greater than in DD. It proves that, when the merchants form alliance and
generate the sales strategy together, that will bring bigger profits for the entire
cross-border supply chain.
In centralized model, the first derivatives of the cs versus , , , are:
2 2 2 2 22
2 2
( 2 ) , , ,4 2 4
c c c cs s s ss s s s ss
(5.30)
In decentralized model, the first derivatives of the ds versus , , , are:
2 22 3 4 3 4
25 5
2 2 2 22 6 8 9
25
(4 4 ) (2 )2
4(4 4 )
d ds s
d ds s
A s A s A s A s AA A
s A A s AsA
,
,
(5.31)
In the formula 5.31,
82 3
9
(2 )(2 )(2 )(32 48 34 7 )
AA
(5.32)
Because [0,1] , so 8 90 , 0A A .

Chapter 5 Competitive Strategy Based on Product and Service Differentiation
109
The following conclusions can be drawn:
(1) 0 , 0c ds s
Whether in CD or DD, the total profit of CBE merchants s will decrease with the
increase of consumer’s price-sensitivity . This is because when consumers are
more sensitive to the product price, they will be attracted by lower prices. Thus no
matter implemented CBEL or traditional logistics, the merchant tends to take low
price competition strategy, which will result in a decline in the total profit. Therefore,
both government and merchant should actively guide consumers to pay more attention
to the quality of services, in order to avoid the adverse “price war”.
(2) 0 , 0c ds s
Whether in CD or DD, the total profit of CBE merchants s will increase with the
increase of consumer’s service-sensitivity . This is because when consumers are
more sensitive to the service level, they will pay attention to the utility from service.
Thus no matter implemented CBEL or traditional logistics, the merchant tends to
improve the service level in order to attract more consumers, which lead to a rise in
the total profit.
(3) = 0c ds s
Whether in CD or DD, the total profit of CBE merchants s will decrease with the
increase of the service cost coefficient . This is because when the input-output ratio
of service cost is low, merchants need invested more to maintain the same service
level, which will result in a decline in the total profits. Therefore, in order to help
merchant reduce the cost, government should provide merchants a certain amount of
subsidies and improve the infrastructure construction, which can promote the
sustainable development of CBEL.
(4) 0 , 0c ds s
Whether in CD or DD, the total profit of CBE merchants s will increase with the
decrease of product differentiation . Therefore, in order to improve profits,
merchants should actively narrow the product differences with competitor. In reality,
more and more vertical e-retailers expand the category and gradually become the
integrated e-retailer. However, when the product homogenization becomes increasing
serious in CBE, the advantage of service differentiation will be highlighted for
merchants, who provide a better logistics services can stand out from the competition.

Developing E-commerce Logistics in Cross-border Relation
110
5.3 Competitive Strategy under Service Differentiation
5.3.1 Hypothesis and Parameter
Consider a dual-channel cross-border supply chain consists of one overseas supplier
and two CBE merchants, one is self-operation (Hereinafter referred to as merchant
1), and another is marketplace (Hereinafter referred to as merchant 2). Because
merchant 2 only provide service, it also can be regarded as the direct sale channel of
overseas supplier. In order to explore the competitive strategy under service
differentiation and simplify the model calculation, proposed the following:
- The products in dual-channel are homogeneous. This means the product sold by
merchant 1 is same as sold through merchant 2.
- Consumers are rational, they will buy products from the merchant where they
feel can get more utility.
- Without loss of generality, both merchants face the unit market demand and only
consider the logistics service cost, other costs are assumed to be zero.
The parameters in the model are presented as follows (Table 32):
Table 32 Parameters in Service Differentiation Model
Notation Representation
ip The product price of merchant. 1p is the price of merchant 1, 2p is the price of merchant 2.
v The basic product valuation of consumer, and [0,1]v
is The logistics service level provided by merchant. 1s is the service level of merchant 1, 2s is the service level of merchant 2.
( )iC s The costs function of logistics service. Refer the definition of cost function in economic principles, 2( ) ( 2)i iC s s , is the service cost coefficient. 1C is the service cost of merchant 1, 2C is the service cost of merchant 2.
i The channel preference (loyalty) of consumers. 1 is probability of purchasing from merchant 1, 2 is the probability of purchasing from merchant 2, without loss of generality, assume 1 2 .
The sensitivity of the consumer on the product price, and [0,1]
The sensitivity of the consumer on the service level, and [0,1]
iD The market demand function. 1D is the market demand of merchant 1, 2D is the market demand of merchant 2.
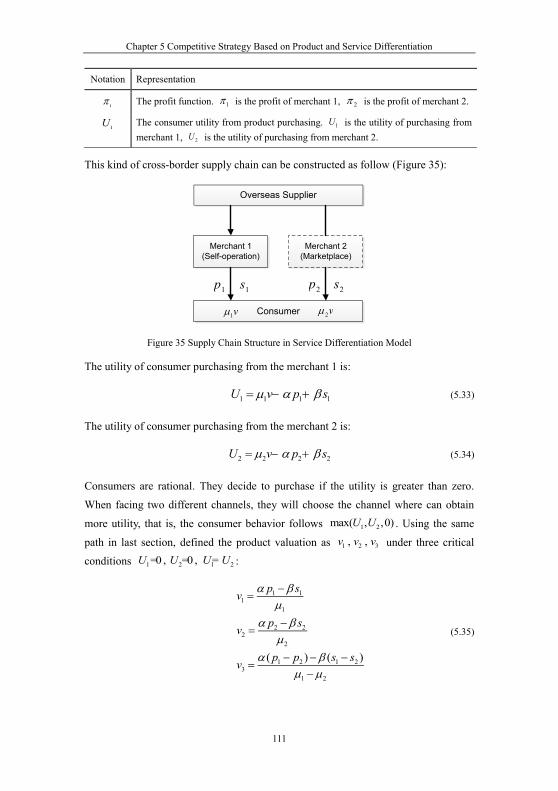
Chapter 5 Competitive Strategy Based on Product and Service Differentiation
111
Notation Representation
i The profit function. 1 is the profit of merchant 1, 2 is the profit of merchant 2.
iU The consumer utility from product purchasing. 1U is the utility of purchasing from merchant 1, 2U is the utility of purchasing from merchant 2.
This kind of cross-border supply chain can be constructed as follow (Figure 35):
Overseas Supplier
Merchant 1Self-operation
Merchant 2Marketplace
Consumer
1 1p s 2 2p s
2v1v
Figure 35 Supply Chain Structure in Service Differentiation Model
The utility of consumer purchasing from the merchant 1 is:
1 1 1 1U v p s (5.33)
The utility of consumer purchasing from the merchant 2 is:
2 2 2 2U v p s (5.34)
Consumers are rational. They decide to purchase if the utility is greater than zero.
When facing two different channels, they will choose the channel where can obtain
more utility, that is, the consumer behavior follows 1 2max( , ,0)U U . Using the same
path in last section, defined the product valuation as 1 2 3, ,v v v under three critical
conditions 1 2 1 2=0 , =0 , =U U U U :
1 11
1
2 22
2
1 2 1 23
1 2
( ) ( )
p sv
p sv
p p s sv
(5.35)

Developing E-commerce Logistics in Cross-border Relation
112
Defined the differences between the critical values as:
2 1 1 2 2 1 1 21 1 2
1 2
2 1 1 2 2 1 1 22 3 1
1 1 2
( ) ( )
( ) ( )( )
p p s sv v v
p p s sv v v
(5.36)
When 1 2v v , so 1 0v , get 2 1 1 2 2 1 1 2( ) ( ) 0p p s s , so 2 0v , obtain
3 1 2v v v ; when 1 2v v , so 1 0v , get 2 1 1 2 2 1 1 2( ) ( ) 0p p s s , so
2 0v , obtain 3 1 2v v v .
Under different product valuation, the demand of merchants in various price ranges
can be expressed as follow three scenarios:
(1) If 1 2v v , so 3 1v v , no one purchase from merchant 2, the demand is 2 0D .
When 1[ ,1]v v , consumer purchases from merchant 1, the demand is
1 11D v ; when 1[0, ]v v , no purchase behavior. Therefore, the price range
meets the following conditions:
1 2 2 1 1 21
2
( )p s sp
(5.37)
(2) If 1 2v v and 3 1v , no one purchase from merchant 1, the demand is 1 0D .
When 2[ ,1]v v , consumer purchases from merchant 2, the demand is
2 21D v ; when 2[0, ]v v , no purchase behavior. Therefore, the price range
meets the following conditions:
1 2 1 21 2
( )s sp p
(5.38)
(3) If 1 2v v and 3 1v . When 3[ ,1]v v , consumer purchases from merchant 1,
the demand is 1 31D v ; when 2 3[ , ]v v v , consumer purchases from merchant
2, the demand is 2 3 2D v v . Therefore, the price range meets the following
conditions:
1 2 2 1 1 2 1 2 1 21 2
2
( ) ( )p s s s sp p
(5.39)
The aim of this study is to formulate the competitive strategies under the
differentiation of products and services. So the first two scenarios will not be included
in the following discussion because they are single channel problem. To sum up, in
the third scenario, the demand function of merchant 1 and merchant 2 can be
respectively expressed as:

Chapter 5 Competitive Strategy Based on Product and Service Differentiation
113
1 2 1 21
1 2
2 1 1 2 2 1 1 22
2 1 2
( ) ( )1
( ) ( )( )
p p s sD
p p s sD
(5.40)
Because self-operation merchant is possible to control own logistics, compared to the
marketplace can provide a higher service level, so 1 2s s . The degree of service
differentiation between merchants is 1 2s s s . In order to facilitate the calculation
and highlight the impact of service differentiation, assumed that the logistics service
of merchant 2 is the industry average, consumers can only perceive the increased
service utility from services differentiation s provided by the merchant 1.
Therefore, the utility of consumer purchasing from merchants respectively are:
1 1 1 2 2 2,g gU v p s U v p (5.41)
The demand functions of merchants respectively are:
1 2 2 1 1 2 21 2
1 2 2 1 2
( ) ( )1( )g g
p p s p p sD D
, (5.42)
The profits of merchants respectively are:
21 1 2 11 1 1 1 1
1 2
2 2 1 1 2 2 22 2 2 2
2 1 2
( ) ( )2
( )( )
g g
g g
p p p p sp D C p s
p p p p sp D C
(5.43)
The total profit of CBE merchants is:
21 2 2 1 1 2 2 21 2
2
( ) ( ) ( )2g g g
p p s p p p p s s
(5.44)
In the formula 5.44, 1 2 1 2, =p p p .
5.3.2 Optimal Strategy in Centralized Decision
In centralized decision, the CBE merchants aim to maximize the total profit of
cross-border supply chain g , they cooperated with each other closely and develop
sales strategies together.

Developing E-commerce Logistics in Cross-border Relation
114
The first derivative of the g versus 1 2,p p are:
2 1 1 2 2
1 2 2
2 ( )21 ,g g p p sp sp p
(5.45)
Then the Hessian Matrix of this optimal problem under second-order conditions is:
1
2
2 2
22H
(5.46)
The order principal minor determinant can be solved as:
1 22
2
,2 4H H
(5.47)
Because 1 2 , so 0 , then 1 20 , 0H H , the Hessian Matrix is
negative-definite. Thus, exist an optimal pricing strategy * *1 2( , )p p , can make the
total profit of CBE merchants to the maximum. Their value can be obtained by
simultaneous solution of 1 20 , 0g gp p .
Therefore, the optimal pricing strategy of merchants respectively are:
* *1 21 22 2
sp p
, (5.48)
Put * *1 2,p p into 1 2, ,g g g ,can obtain the profit of merchant 1, merchant 2 and
the total in CD: 2
1 1 21g
22g
2
2 21
24
4(2
+ (2 ) ( )( )
( )() 2 )4
c
c
cg
s s
s
s s
(5.49)
Solving the first order equation 0cg s , can obtain the optimal service
differentiation in CD:
22cs
(5.50)

Chapter 5 Competitive Strategy Based on Product and Service Differentiation
115
5.3.3 Optimal Strategy in Decentralized Decision
In decentralized model, assumed that merchant 2 is the leader in game, merchant 1 is
follower, which is consistent with the actual situation. Many self-operation retailers
struggled to obtain official authorization of some brands, while some brands are
hardly to be settled in large platform. The parties engage the game in following order:
firstly, the merchant 2 makes strategy to maximize owns profit, and then the merchant
1 makes profit level according to the pricing of merchant 2. However, the merchant 2
knows the behavior of merchant 1, so the merchant 2 will make final strategy
according to the merchant 1’s reaction function based on own pricing. The
inverse-deducing method was used to calculate the optimal solution of the model.
Solving the first order equation 1 1 0g p , can obtain the pricing that maximize
the profit of merchant 1:
21 2
p sp
(5.51)
Then, put 1p into the profit function of merchant 2, can obtain:
22 2 2 1 2
22
( ) (2 )2g
p s p
(5.52)
Solving the first order equation 2 2 0g p , can obtain the optimal pricing *2p
that maximize the profit of merchant 2:
* 22
1 2
( )2 (2 )
sp
(5.53)
Then, put *2p into 1p , can obtain the optimal pricing *
1p of merchant 1:
* 1 2 1 21
1 2
(4 3 ) (4 )4 (2 )
sp
(5.54)
Finally, put * *1 2,p p into 1 2, ,g g g , can obtain the profit of merchant 1,
merchant 2 and the total in DD:

Developing E-commerce Logistics in Cross-border Relation
116
2 22 2 3 3 1
1g 21
22g
12
2 2 2
2
2 24 5
1
26 1
2
) +2 ( )( )
)
) +2 ( )(
( 816
(8
( 816
)
d
d
dg
s s
s
B B B B BB
BB B B B
Bs s
(5.55)
In the formula 5.55,
1 1 2
2 1 2
3 1 22 2
4 1 1 2 22 2
5 1 1 2 22 2
6 1 1 2 2
244 316 416 20 516 20 7
BBBBBB
(5.56)
Because 1 2 , so B1~B6 are all greater than 0.
Solving the first order equation 0dg s , can obtain the optimal service
differentiation in DD:
52 2
1 68d Bs
B B
(5.57)
5.3.4 Comparative Analysis
5.3.4.1 The impacts on the service level
When the merchants provide homogeneous services, the deference of service
differentiation between CD and DD can be expressed as:
7
2 22
8
2( )2c d BsB B
s (5.58)
In the formula 5.58, 2
2 21
7
8 6
28
BB B B
(5.59)
Because 1 2 , 0 , 0c ds s , so 7 80 , 0B B .When 22 2 0B ,
thus c ds s , means that the service differentiation in CD is larger than in DD;
When 22 2 0B , thus c ds s , means that the service level in DD has
larger differentiation. Therefore, the service differentiation will be affected by
Chapter 5 Competitive Strategy Based on Product and Service Differentiation
117
consumer behavior ( 1 2 , ,, ) and operation cost ( ). This further proves that
the CBE merchants should consider these factors synthetically when generate service
strategy.
In CD, the first derivatives of the cs versus 1 1, , , , are:
2 2 27 7 7
2
3 3 2
1 22
27
2
7
2 ( ), , ,
(2 + ) 2 ( )
c c c
c c
B B Bs s s
sB
sB
,
(5.60)
In DD, the first derivatives of the ds versus 1 1, , , , are:
2 2 2 2 29 1 1 2 10 1 1
1 22 2 2 2 2 2
1 5 5 1
2 2
6
8 8
2 2 28
1 5
8 8
( 64 ( ) ) ( 64 ( ) ),
8 ( ) (8 ) 8 ( ), ,
d d
d d d
B B
B B
B B B Bs s
B B B B B B Bs s sB
(5.61)
In the formula 5.61:
2 2 1 24 3
9 3 34
12 110 3 22
2 [ (8 5 3 )2 (24
]23 )
B B BB B B
(5.62)
Because 1 2 , so 9 100 , 0B B .
The following conclusions can be drawn:
(1) 1 0cs , 1ds uncertainty
In CD, the service differentiation s will decrease with the increase of the consumer
preference 1 for merchant 1. This means that, when consumers prefer to buy
products from self-operation merchant, who don’t need to provide higher
differentiated services, while advertising and brand power are the key to attract
consumers and maintain their loyalty. But in DD, the positive or negative of
1ds is according to 2 2
9 1 1 264 ( )B B . This proves that, the
relationship between s and 1 is affected by the comprehensive factors, merely
increase the degree of service differentiation is not necessarily able to improve own
competitiveness.
(2) 2 0cs , 2ds uncertainty
In CD, the service differentiation s will increase with the increase of the consumer
preference 2 for merchant 2. This means that, when consumers prefer to buy

Developing E-commerce Logistics in Cross-border Relation
118
products through marketplace merchant, in order to avoid the price competition, the
self-operation merchant can get competitive advantage only by providing better
service. But in DD, the positive or negative of 2ds is according to
2 2 210 1 164 ( )B B . This also proves that, the relationship between s and
2 is affected by the comprehensive factors, merely increase the degree of service
differentiation is not necessarily able to improve own competitiveness.
(3) 0 , 0c ds s
Whether in CD or DD, the service differentiation s will decrease with the increase
of consumer’s price-sensitivity . This is because when consumers are more
sensitive to the product price, they will be attracted by lower prices. Both
self-operation and marketplace tend to take low price competition strategy thereby
ignored service quality, which is bound to result in convergence of service level.
(4) 0 , 0c ds s
Whether in CD or DD, the service differentiation s will increase with the increase
of consumer’s service-sensitivity . This is because when consumers are more
sensitive to the service level, they will pay attention to the utility from service.
Therefore, the merchants can attract more consumers by adopting service
differentiation, which is also an effective way to avoid price competition.
(5) <0 , 0c ds s
Whether in CD or DD, the service differentiation s will decrease with the increase
of the service cost coefficient . This is because when the input-output ratio of
service cost is low, the merchants need invested more to maintain the same service
level. Therefore, the logistics service will gradually converge as merchants reduce the
cost of service input.
5.3.4.2 The impacts on the total profit of CBE merchants
When the merchants provide homogeneous product, the deference of total profit
between CD and DD can be expressed as:
2 2 2 22 1 1 2 2 2 3
21
[(4 ) 2 ( ) ]16
c dg g g
B s B sB
(5.63)
Because 1 2 , so 0g . This means that the total profit of CBE merchants in
CD is greater than in DD. It proves that, when the merchants form alliance and

Chapter 5 Competitive Strategy Based on Product and Service Differentiation
119
generate the sales strategy together, that will bring bigger profits for the entire
cross-border supply chain.
In CD, the first derivatives of the cg versus , , , s are:
22
2
27
[( ) ] ( ),4 2
( ) ,2 2
c cg g
c cg g
s s s
B sss
(5.64)
In DD, the first derivatives of the cg versus , , , s are:
2 2 26 5 2 2 1
21
25 6 5 8
2 21 1
2
[ ( ) 2 ( 2 )( ) ]16
( ) ( ), ,8 2 8
dg
d d dg g g
B s B s B BB
s B B s B B ssB s B
(5.65)
Because 1 2 1 2, s s , so 0, 0s .
The following conclusions can be drawn:
(1) 0 , 0c dg g
Whether in CD or DD, the total profit of CBE merchants g will decrease with the
increase of consumer’s price-sensitivity . This is because when consumers are
more sensitive to the product price, they will be attracted by lower prices. Thus no
matter self-operation merchant or marketplace tends to take low price competition
strategy, which will result in a decline in the total profit. Therefore, both government
and merchant should actively guide consumers to pay more attention to the quality of
services, in order to avoid the adverse “price war”.
(2) 0 , 0c dg g
Whether in CD or DD, the total profit of CBE merchants g will increase with the
increase of consumer’s service-sensitivity . This is because when consumers are
more sensitive to the service level, they will pay attention to the utility from service.
Thus, no matter implemented CBEL or traditional logistics, the merchant tends to
improve the service level in order to attract more consumers, which lead to a rise in
the total profit.

Developing E-commerce Logistics in Cross-border Relation
120
(3) = 0c dg g
Whether in CD or DD, the total profit of CBE merchants g will decrease with the
increase of the service cost coefficient . This is because when the input-output ratio
of service cost is low, the merchants need invested more to maintain the same service
level, which will result in a decline in the total profits. Therefore, in order to help
merchant reduce the cost, government should provide merchants a certain amount of
subsidies and improve the infrastructure construction, which can promote the
sustainable development of CBEL.
(4) cg s uncertainty, d
g s uncertainty
In CD, the positive or negative of cg s is according to 7B s ; In DD,
the positive or negative of dg s is according to 5 8B B s . This proves
that, no matter in CD or DD, the relationship between g and s is affected by
consumer behavior ( 1 2 , ,, ) and operation cost ( ). Therefore, the CBE
merchants should consider these factors synthetically when generate service strategy,
merely increase the degree of service differentiation is not necessarily beneficial to
cross-border supply chain, and even bring negative effects.
5.4 Numerical Analysis
In order to display the impact of product differentiation and service differentiation on
cross-border supply chain intuitively, the parameters are assigned with a certain value.
5.4.1 Product Differentiation
(1) Assign 0.5 0.5 0.6 1s , , , , the impact of product differentiation on
the total profits of cross-border supply chain is shown in Figure 36:
Figure 36 Impact of Product Differentiation on Total Profits under Same Service
Centralized Decision Decentralized Decision

Chapter 5 Competitive Strategy Based on Product and Service Differentiation
121
Whether in CD or DD, the total profit will decrease with the increase of product
differentiation, and the profit attenuation in CD is less than in DD. In addition, keep
the product differentiation unchanged, cross-border supply chain has more profits in
CD.
(2) Assign 0.5 0.5 0.6 {0.3,0.7}s , , , , in CD, the impact of product
differentiation on the total profits of cross-border supply chain is shown in Figure 37:
Figure 37 Impact of Product Differentiation on Total Profits under Different Service in CD
In CD, the total profit will decrease with the increase of product differentiation, and
the profit attenuation at low service level is less than at high service level. In addition,
keep the product differentiation unchanged, cross-border supply chain has more
profits at high service level.
(3) Assign 0.5 0.5 0.6 {0.3,0.7}s , , , , in DD, the impact of product
differentiation on the total profits of cross-border supply chain is shown in Figure 38:
Figure 38 Impact of Product Differentiation on Total Profits under Different Service in DD
With low Service With high Service
With low Service With high Service

Developing E-commerce Logistics in Cross-border Relation
122
In DD, the total profit will decrease with the increase of product differentiation, and
the profit attenuation at low service level is less than that at high service level. The
product differentiation at the intersection of the two curves is set as * , when *[0, ] , the supply chain with the higher service level can obtain more profit;
when *[ ,1] , on the contrary, the supply chain with the lower service level can
obtain more profit.
5.4.2 Service Differentiation
(1) Assign 1 20.7 0.3 0.6 0.4 1 , , , , , the impact of service
differentiation on the total profits of cross-border supply chain is shown in Figure 39:
Figure 39 Impact of Service Differentiation on Total Profits
Whether in CD or DD, the total profit function has a inflection point *s . When*s s , the total profit will increase with the increase of service differentiation;
when *s s , the total profit will decrease with the increase of service
differentiation. In addition, keep the service differentiation unchanged, cross-border
supply chain obtains more profits in CD.
(2) Assign 1 20.7 0.3 0.5 0.5 {0.3,0.7}s , , , , , the impact of service
cost coefficient on the total profits of cross-border supply chain in CD is shown in
Figure 40, in DD is shown in Figure 41:
Centralized Decision Decentralized Decision

Chapter 5 Competitive Strategy Based on Product and Service Differentiation
123
Figure 40 Impact of Service Cost Coefficient on Total Profits under Different Service in CD
Figure 41 Impact of Service Cost Coefficient on Total Profits under Different Service in DD
Whether in CD or DD, the total profit will decrease with the increase of service cost
coefficient, and the profit attenuation at low service differentiation is less than at high
service differentiation. In addition, keep the service cost coefficient unchanged,
cross-border supply chain obtain more profits at high service differentiation.
With low Service With high Service
With low Service With high Service

Chapter 6 Competitive Strategy for Inventory and Transportation in CBE
124
6. Competitive Strategy for Inventory and Transportation in CBE In Chapter 4 can be obtained, the classification of logistics strategy is based on who is
in charge of inventory and transportation, which are the main components of
e-logistics. However, the complexity of CBEL is difficult to attain for a single
enterprise, it requires cooperation between members in cross-border supply chain.
Nowadays, more and more enterprises assign their logistics demand to LSP (Cho, et al,
2008), wherein, warehousing and transportation are the most frequently outsourced
logistics activities (Landmark global, 2015b). In this chapter, internal factors
“Operation” and “Partnership” were considered for balancing the relationship
between supplier, retailer and LSP. The optimal inventory strategy in centralized and
decentralized managed, the optimal transportation strategy under LSPs cooperation
and non-cooperation were formulated in cross-border relation.
6.1 Inventory Strategy
6.1.1 Hypothesis and Parameter
As mentioned in Chapter 1, the bonded import and the direct mail are two main
CBEL models. Considering a cross-border supply chain consists of one overseas
supplier and one CBE retailer, there are two kinds of inventory operation modes:
(1) Centralized Managed Inventory (Hereinafter referred to as CMI).
In this mode, only the retailer has inventory and it orders from the supplier to meet the
demand for both bonded channel and direct channel, that is, the retailer implements a
duel-channel strategy.
(2) Decentralized Managed Inventory (Hereinafter referred to as DMI).
In this mode, retailer and supplier hold inventory independently, the demand of
bonded channel is met by retailer, and the supplier meets the direct channel needs.
In order to focus on the competitive strategy of inventory and simplify the model
calculation, the following assumptions are put forward:
- There are two types of consumers in the market: one is time-sensitive, who
prefer to buy products from bonded channel for shorter receipt times; another is
quality-sensitive, who prefer to buy products from direct channel for more
reliable product source.

Developing E-commerce Logistics in Cross-border Relation
125
- There is no channel transfer in the market. Consumers are loyal and choose to
wait when out of stock in channel.
- Homogeneous products are sold in two channels. Consumers face the same
product price, so that the price will no longer decide the consumer preference.
According to the differentiated competitive strategy formulated in Chapter 5,
the channel’s competitive advantage reflected by the level of service.
The parameters in the model are presented as follows (Table 33):
Table 33 Parameters in Inventory Strategy Model
Notation Representation
iD The market demand function. 1D is the market demand of bonded channel, 2D is the market demand of direct channel, 1D and 2D are independent random variables. The total demand of cross-border supply chain is 1 2D D D .
( )if The distribution density functions of demand. 1( )f is the distribution density function of bonded channel, 2 ( )f is the distribution density function of direct channel.
( )iF The cumulative distribution functions of demand. 1( )F is the cumulative distribution function of bonded channel, 2 ( )F is the cumulative distribution function of direct channel. The inverse function of both exist and monotonically increasing, which can be express as 1( )iF .
p The retail price per unit product.
w The wholesale price per unit product.
c The production or purchase cost per unit product in supplier.
v The residual value of the unsold product, and meet the conditions: w c v .
ig The shortage cost per unit product. 1g is the shortage cost of bonded channel, 2g is the shortage cost of direct channel.
ih The inventory holding cost per unit product. 1h is the inventory cost of bonded channel, 2h is the inventory cost of direct channel.
it The order fulfillment cost per unit. 1t is the fulfillment cost of bonded channel, 2t is the fulfillment cost of direct channel. Because the bonded channel can use ocean shipping for advancing stock with scale advantages, so 1 2t t .
iQ The product inventory. 1Q is the inventory of bonded channel, 2Q is the inventory of direct channel. The total inventory of cross-border supply chain is 1 2Q Q Q .
jiR The total revenue in different models. In CMI: c
rR and drR is the revenue of retailer
in CMI and DMI, csR and d
sR is the revenue of supplier in CMI and DMI.

Chapter 6 Competitive Strategy for Inventory and Transportation in CBE
126
Notation Representation
jiK The total cost in different models. In CMI, c
rK is the cost of retailer, csK is the
cost of supplier; In DMI: drK is the cost of retailer, d
sK is the cost of supplier. j
i The profit function, equals to j j ji i iR K .
In the following, based on the profit maximization, the optimal inventory was
conducted in two kinds of inventory managed mode.
6.1.2 Centralized Managed Inventory
In this mode, the supplier is just as product source, the demand for bonded channel is
met by the retailer’s FTZ warehouse, and the demand for direct channel is met by the
retailer’s overseas warehouse. Therefore, only the retailer makes stock decision, then
the supplier produces or purchases according to the retailer’s order needs. This kind of
cross-border supply chain can be constructed as follow (Figure 42):
Overseas Supplier
FT Warehouse
Consumer1D 2D
1p Q
w
Overseas Warehouse
2p Q
Retailerw
Figure 42 Supply Chain Structure in Centralized Managed Inventory Mode
In CMI, the total revenues of retailer include the sales revenue through dual-channel
and the residual value of the unsold products. It can be expressed as:
1 1 2 2 1 1 2 2(min[ , ] min[ , ]) (max[ ,0] max[ ,0])crR p Q D Q D v Q D Q D (6.1)
The total cost of the retailer include the ordering cost of the dual-channel, the
inventory holding cost, the shortage cost and the order fulfillment cost. It can be
expressed as:
1 1 1 2 2 2 1 1 1
2 2 2 1 1 1 2 2 2
max[ ,0] max[ ,0] max[ ,0]max[ ,0] min[ , ] min[ , ]
crK w Q h Q D h Q D g D Q
g D Q t Q D t Q D
(6.2)

Developing E-commerce Logistics in Cross-border Relation
127
Therefore, the profit of retailer can be expressed as:
1 1 1 2 2 2 1 1 1
2 2 2 1 1 1 2 2 2
( ) min[ , ] ( ) min[ , ] ( ) max[ ,0]( ) max[ ,0] max[ ,0] max[ ,0]
c c cr r rR K
p t Q D p t Q D v h Q Dv h Q D g D Q g D Q w Q
(6.3)
The profit of the supplier is the difference between the wholesale revenues and the cost of production or purchase. It can be expressed as:
( )c c cs s sR K w c Q (6.4)
Then, put the distribution density of demand into cr , can obtain the retailer’s profit
function are: 1 2
1 2
1 2
1 2
1 1 1 1 2 2 2 20 0
1 1 1 2 2 20 0
1 1 1 2 2 2
( )[ ( ) ( ) ] ( )[ ( ) ( ) ]
( ) ( ) ( ) ( ) ( ) ( )
( ) ( ) ( ) ( )
Q Qcr Q Q
Q Q
Q Q
p t xf x dx Q f x dx p t xf x dx Q f x dx
v h Q x f x dx v h Q x f x dx
g x Q f x dx g x Q f x dx w Q
(6.5)
The retailer’s optimal inventory should meet the first-order conditions:
1 1 1 1 1 1 1 1 11
2 2 2 2 2 2 2 2 22
( )[1 ( )] ( ) ( ) [ ( ) 1] 0
( )[1 ( )] ( ) ( ) [ ( ) 1] 0
cr
cr
p t F Q v h F Q g F Q wQ
p t F Q v h F Q g F Q wQ
(6.6)
Solving the above equation can obtain the optimal inventory strategy of the bonded
channel and the direct channel, they are expressed separately as:
* 1 11 1
1 1 1
* 2 22 2
2 2 2
( )
( )
p g t wF Qp g h t v
p g t wF Qp g h t v
(6.7)
Therefore, in CMI, the optimal inventory of retailer is:
1 21 1 2 21 2
1 1 1 2 2 2
( ) ( )cr
p g t w p g t wQ F Fp g h t v p g h t v
(6.8)
The optimal production or purchase volume for supplier is: c cs rQ Q

Chapter 6 Competitive Strategy for Inventory and Transportation in CBE
128
6.1.3 Decentralized Managed Inventory
In this mode, retailer and supplier hold inventory to satisfy the consumers in different
channels. The retailer orders from supplier to meet the demand of the bonded channel.
For direct channel, the retailer is just responsible for “customer acquisition”. Once the
orders are generated, the retailer delivers the order information to the supplier, which
is responsible for online order fulfillment. The both sides obtain their respective
income through the revenue generated by online orders, assumed that the retailer can
get a benefit from the supplier with the distribution ratio ( 0 1 ). This kind of
cross-border supply chain can be constructed as follow (Figure 43):
Overseas Supplier
RetailerFT Warehouse
Consumer1D 2D
1p Q 2p Q
w
Figure 43 Supply Chain Structure in Decentralized Managed Inventory Mode
In DMI, the total revenues of retailer include the sales revenue through bonded
channel, the distributed benefit from supplier’s sales in direct channel and the residual
value of the unsold products. It can be expressed as:
1 1 2 2 1 1min[ , ] min[ , ] max[ ,0]drR p Q D p Q D v Q D (6.9)
The total cost of the retailer include the ordering cost of the bonded channel, the
inventory holding cost, the shortage cost and the order fulfillment cost of bonded
channel. It can be expressed as:
1 1 1 1 1 1 1 1 1 1max[ ,0] min[ , ] max[ ,0]drK w Q h Q D t Q D g D Q (6.10)
Therefore, the profit of retailer can be expressed as:
1 1 1 2 2 1 1 1
1 1 1 1
( ) min[ , ] min[ , ] ( ) max[ ,0]max[ ,0]
d d dr r rR K p t Q D p Q D v h Q D
g D Q w Q
(6.11)

Developing E-commerce Logistics in Cross-border Relation
129
The total revenues of supplier include the wholesale revenues of bonded channel, the
distributed revenue of sales in direct channel and the residual value of the unsold
products. It can be expressed as:
2 2 1 2 2(1 ) min[ , ] max[ ,0]dsR p Q D w Q v Q D (6.12)
The total cost of the supplier includes the production or purchase cost, the inventory
holding cost, the shortage cost and the order fulfillment cost of direct channel. It can
be expressed as:
2 2 2 2 2 2 2 2 2max[ ,0] min[ , ] max[ ,0]dsK c Q h Q D t Q D g D Q (6.13)
Therefore, the profit of supplier can be expressed as:
2 2 2 1 2 2 2
2 2 2 2
[(1 ) ] min[ , ] ( ) ( ) max[ ,0]max[ ,0]
d d ds s sR K p t Q D w c Q v h Q D
g D Q c Q
(6.14)
Then, put the distribution density of demand into dr and d
s , can obtain the profit
function of retailer and supplier respectively are:
1 2
1 2
1
1
2
2
2
1 1 1 1 2 2 20 0
1 1 1 1 1 1 10
2 2 2 2 10
2 2 2 20
( )[ ( ) ( ) ] [ ( ) ( ) ]
( ) ( ) ( ) ( ) ( )
[(1 ) ] [ ( ) ( ) ] ( )
( ) ( ) ( ) (
Q Qdr Q Q
Q
Q
Qds Q
Q
p t xf x dx Q f x dx p xf x dx Q f x dx
v h Q x f x dx g x Q f x dx w Q
p t xf x dx Q f x dx w c Q
v h Q x f x dx g x Q
2
2 2 2) ( )Q
f x dx cQ
(6.15)
The optimal inventory of retailer and supplier should meet the first-order conditions:
1 1 1 1 1 1 1 1 11
2 2 2 2 2 2 2 2 22
( )[1 ( )] ( ) ( ) [ ( ) 1] 0
[(1 ) ] [1 ( )] ( ) ( ) [ ( ) 1] 0
dr
ds
p t F Q v h F Q g F Q wQ
p t F Q v h F Q g F Q cQ
(6.16)
Solving the above equation can obtain the optimal inventory strategy of retailer and
supplier, they are expressed separately as:
* 1 11 1
1 1 1
* 2 22 2
2 2 2
( )
(1 )( )(1 )
p g t wF Qp g h t v
p g t cF Qp g h t v
(6.17)

Chapter 6 Competitive Strategy for Inventory and Transportation in CBE
130
Therefore, in DMI, the optimal inventory of retailer is:
1 1 11
1 1 1
( )dr
p g t wQ Fp g h t v
(6.18)
The optimal inventory of supplier is:
1 *2 2( )d d
s rQ Q F Q (6.19)
6.1.4 Numerical Analysis
Because the optimal inventory is the form of implicit function, it is difficult to
observe the influence of parameters on the inventory strategy. In order to obtain more
intuitive results, the parameters are assigned with a certain value (Table 34). The
purpose of numerical analysis is to study the optimal inventory and the profit under
the different variance, that is, under the different demand uncertainty environment.
Table 34 Parameter Assignment in Inventory Model
c w v p 1h 2h 1g 2g 1t 2t
4 5 3 10 0.2 2 1 2 1 0.5 1
Refer to the parameter assignment from Xia and Huang (2007, P.73), assumed that the
bonded channel demand, the direct channel demand and the total demand respectively
follow the normal distribution with a mean of 200,200 and 400, expressed as:
D1 ~ N (200, σ12), D2 ~ N (200, σ2
2), D ~ N (400, σ12+σ2
2)
6.1.4.1 The Impact of Demand Uncertainty on Inventory
(1) In centralized managed inventory mode (Figure 44)
Figure 44 Impact of Demand Uncertainty on Inventory in CMI

Developing E-commerce Logistics in Cross-border Relation
131
With the increase of demand uncertainty, the retailer tends to increase inventory in
order to prevent out of stock, which leads to more inventory costs. Therefore, retailer
is required to accurately forecast market demand before ordering products from
suppliers.
(2) In decentralized managed inventory mode (Figure 45)
Figure 45 Impact of Demand Uncertainty on Inventory in DMI
With the increase of demand uncertainty, both retailer and supplier tend to increase
inventory in order to prevent out of stock, wherein, supplier’s inventory increases
more than retailer’s, because supplier needs to invest more cost for information
collection, product promotion and order fulfillment in direct channel due to away
from the target market. As in CMI, both retailer and supplier need to accurately
predict the market demand before determining their inventory level.
(3) The total inventory of cross-border supply chain (Figure 46)
Figure 46 Comparison of Total Inventory between CMI and DMI
Inventory of Retailer Inventory of Supplier
Total Inventory in CMI Total Inventory in DMI

Chapter 6 Competitive Strategy for Inventory and Transportation in CBE
132
Under the same demand uncertainty level, because centralized management has
stronger risk resilience, the total inventory of the cross-border supply chain in CMI is
lower than in DMI. Therefore, if supplier wants to launch a direct mail channel, it
should align with the retailer to jointly manage the inventory, and share the benefits
and risks of the entire cross-border supply chain.
6.1.4.2 The Impact of Demand Uncertainty on Profit
(1) In centralized managed inventory mode (Figure 47)
Figure 47 Impact of Demand Uncertainty on Profit in CMI
With the increase of demand uncertainty, the retailer’s profits decreased while the
supplier’s profits increased. The reason is that the retailer operated the total inventory
for the dual-channel, so more stock is required under higher demand uncertainty. It
increases the retailer’s inventory cost while provides supplier more orders.
(2) In decentralized managed inventory mode (Figure 48)
Figure 48 Impact of Demand Uncertainty on Profit in DMI
Profit of Retailer Profit of Supplier
Profit of Retailer Profit of Supplier

Developing E-commerce Logistics in Cross-border Relation
133
With the increase of demand uncertainty, the profits of both retailer and supplier are
reduced, because the growth of inventory will inevitably lead to increased inventory
costs. And the retailer is more affected by the demand uncertainty, because the FTZ
warehouse is far away from the product origin, resulting in higher inventory holding
cost and shortage cost.
(3) The total profit of cross-border supply chain (Figure 49)
Figure 49 Comparison of Total Profit between CMI and DMI
The total profit of cross-border supply chain has no significantly difference between
CMI mode and DMI mode. But comparatively, the supplier can obtain more profit in
DMI mode, because some consumers move from retailer to direct channel, which
increased supplier’s profit significantly. Therefore, in order to avoid price
competition, an appropriate contract should be formulated between supplier and
retailer to share the benefits and risks of the entire cross-border supply chain.
6.2 Transportation Strategy
The transportation referred here includes two parts: international transportation and
local distribution. A great physical distance in CBE needs efficient and stable flow of
goods. But this is difficult to attain for a single enterprise, and requires merchants to
cooperate with LSPs, especially for SMEs. As an integrator between players in the
global distribution and delivery, the importance of the LSPs has increased. With the
advancements of global players in the logistics service, a well-designed outsourcing
strategy is essential for CBE success in today’s global supply chain world.
Based on the survey result, “quality and reliability”, “service performance” and “price”
are top three criteria, which are most need to be considered for selecting LSPs. The
Total Profit in CMI Total Profit in DMI

Chapter 6 Competitive Strategy for Inventory and Transportation in CBE
134
price is always a key factor in choosing a partner, because the logistics cost will be
added in the final commodity prices and affect the customer’s choice. A high logistics
price will reduce the purchase intention of price-sensitive consumers. And compare
with the simple cost reduction, CBE merchants also need to concern a more complex
service competition. As the goods need to go through long distance, the reliability and
effectiveness of transportation is also important or even more for CBE.
Gronroos (1996, P.30) considered the quality of service as a measure of the degree
and the success of outsourcing, and validated it by empirical evidence. Wilding and
Juriado (2004, P.628) also found that the most important factor in logistics
outsourcing strategies is service-related business through survey and interview with
more than 300 consumer goods companies in Europe. Dumrongsiria et al. (2008,
P.718) believe that the price and the service are the determinants of consumer
shopping options.
Most of the previous research used questionnaire survey and other empirical methods
to explore the impact of logistics services on outsourcing strategy, but lack of
systematic combing and mathematical proof for the relationship between cost and
service. In this section, based on the revenue management theory, the influence of
logistics service on pricing and profit will be analyzed by game model. The optimal
transportation outsourcing strategy in CBE under service and cost competition will be
conducted. The results will help merchants to develop a reasonable logistics
outsourcing strategy and improve the service level of CBEL.
6.2.1 Hypothesis and Parameter
Consider a dual-channel cross-border supply chain consists of one CBE merchant
and two logistics service providers. The merchant sells the same product by two
LSPs’ service. In order to focus on the price and service competition and simplify
the model calculation, the following assumptions are put forward:
- The market is open and transparent, the competition under the complete
information.
- Merchant and LSPs are rational and pursue profit maximization.
- In addition to the logistics service costs, other costs are zero.
- Merchant is the leader of this Stackelberg game, who makes decision according
to the LSPs’ response function.

Developing E-commerce Logistics in Cross-border Relation
135
The parameters in the model are presented as follows (Table 35):
Table 35 Parameters in Transportation Strategy Model
Notation Representation
p The product price of merchant.
it The service price quoted by LSPs. 1t is the service price of LSP 1; 2t is the service price of LSP 2.
is The service level provided by LSPs. 1s is the service level of LSP 1; 2s is the service level of LSP 2.
ic The service cost paid by LSPs. 1c is the service cost of LSP 1; 2c is the service cost of LSP 2. The service cost formula is 2( ) / 2c s s , means that the cost of services will accelerate rise with the improvement of service levels, which is consistent with commercial practices.
The service cost coefficient. Because the LSPs are in the same market, and face the same external environment, so their service cost coefficients are same.
Consumer preference coefficient for LSP 1, and [0,1] , so for LSP 2 is 1- . The coefficient depicts the satisfaction of the consumer to the LSP, which affected by brand awareness and service level perceived by consumer.
a Basic market demand.
1 The coefficients of self-price sensitiveness of the demand, which means the reduction from the base demand per unit of self-price increase.
2 The coefficient of cross-price sensitivity, reflecting the degree of competition between two LSPs and the migration rate if consumers perceive that there is a difference between prices.
The impact strength of prices on demand, equal to 1 2/ .
1 The coefficients of self-service sensitiveness of the demand, which means the reduction from the base demand per unit of self-service increase.
2 The coefficient of cross-service sensitivity, reflecting the degree of competition between two LSPs and the migration rate if consumers perceive that there is a difference between services
The impact strength of services on demand, equal to 1 2/ .

Chapter 6 Competitive Strategy for Inventory and Transportation in CBE
136
The cross-border supply chain model was constructed as below (Figure 50):
CBE Merchant
LSP 1 LSP 2
Consumer 1
1 1( )s p t
p
2 2( )p t s
Figure 50 Supply Chain Structure in Transportation Strategy Model
Because the merchant sells the same product through two LSPs, so the demand is
only related to logistics price and service level. Referred the linear demand function
constructed by Giri and Maiti (2014, P.134), the market demand of two LSPs can be
expressed as following:
1 1 1 2 2 1 1 2 2
2 1 2 2 1 1 2 2 1(1 )D a t t s sD a t t s s
(6.20)
Where, , , 0i ia . As can be seen, iD decreases with the increase of 1 and 2 ,
increases with the increase of 2 and 1 . That is, the demand of self-channel will
decrease with the increase of self-price and rival’s service level, and increase with the
reducing of self-price and rival’s service level. In addition, 1 2 1 2, , so 1, 1 , means the impact from self-channel is greater than the other channels.
These are consistent with the real situation.
The profit function of CBE merchant is:
1 2( )m p D D (6.21)
The profit function of LSPs is:
i i i it D c (6.22)
The profit function of whole cross-border supply chain is:
2 2
1 1[( ) ]m i i i i ii i
p t D c
(6.23)

Developing E-commerce Logistics in Cross-border Relation
137
Next, under prices and services competition, the case of LSPs in cooperation
(Hereinafter referred to as LC) and non-cooperation (Hereinafter referred to as LN)
condition will be analyzed separately.
6.2.2 Cooperation between LSPs (LC)
If LSP1 choose to cooperate with LSP 2, which can be considered that two LSPs form
an alliance in order to obtain greater benefits in cross-border supply chain, where the
total profit of the LSPs is: 2
1( )s i i i
it D c
(6.24)
Firstly, consider the LSPs’ logistics price decision, solve the first derivative of it :
1 1 2 2 1 1 2 21
1 2 2 1 1 2 2 12
2 2
=(1 ) 2 2
s
s
a t t s st
a t t s st
(6.25)
In order to maximize the profits, let 0s it , solve the simultaneous equations
can obtain the optimal logistics prices in LC scenario:
* 1 1 2 2 21 2
* 1 2 2 1 12 2
( )2
( )2
c
c
s K s K at
s K s K at
(6.26)
In formula 6.26,
1 22 2 2
1 2
1 1 1 2 2
2 2 1 1 2
KK
(6.27)
Put *ict into iD can get optimal demand *
icD :
* 1 1 2 21
* 2 1 1 22
2(1 )
2
c
c
a s sD
a s sD
(6.28)

Chapter 6 Competitive Strategy for Inventory and Transportation in CBE
138
Then put *icD into m , can obtain the profit of the merchant in LC scenario:
1 2[ ( ) ]2
cm
p a s s
(6.29)
In formula 6.29, 1 2 .
6.2.3 Non-cooperation between LSPs (LN)
In this scenario, there is no cooperation between LSPs, they make decision
independently. Merchant and LSPs maximize their own interests respectively.
Firstly, consider the LSPs’ logistics price decision, solve the first derivative of it :
11 1 2 2 1 1 2 2
1
21 2 2 1 1 2 2 1
2
2
=(1 ) 2
a t t s st
a t t s st
(6.30)
In order to maximize the profits, let 0i it , solve the simultaneous equations
can obtain the optimal logistics prices in LN scenario:
* 1 3 2 4 2 51 2 2
1 2
* 1 4 2 3 1 52 2 2
1 2
( )4
(2 )4
n
n
s K s K a Kt
s K s K a Kt
(6.31)
In formula 6.32,
3 1 1 2 2
4 2 1 1 2
5 1 2
22
2
KKK
(6.32)
Put *int into iD can get optimal demand *
inD :
* 1 1 3 2 4 2 51 2 2
1 2
* 1 1 4 2 3 1 52 2 2
1 2
[ ( )]4
[ (2 )]4
n
n
s K s K a KD
s K s K a KD
(6.33)
Then put *inD into m , can obtain the profit of the merchant in LN scenario:
1 1 2
1 2
[ ( ) ]2
nm
p a s s
(6.34)

Developing E-commerce Logistics in Cross-border Relation
139
6.2.4 Equilibrium Analysis and Inference
Proposition 1 There is a positive correlation between logistics price it and services
level is provided by self-channel.
Demonstration:
The first derivatives of the self-price versus self-service in LC scenario are:
* *1 2 1 1 2 2
2 21 2 1 22( )c ct t
s s
(6.35)
The first derivatives of the self-price versus self-service in LN scenario are:
* *1 2 1 1 2 2
2 21 2 1 2
24
n nt ts s
(6.36)
Because 1 2 1 20, 0 , so * 0i it s , no matter in LC or LN scenario, *it
increase as is increase, QED.
Proposition 2 Service level js of competitor will produce spillover effects on own
logistics price it , and the effect depends on and .
Demonstration:
(1) In LC scenario
The first derivatives of the self-price versus competitor-service are as following:
* *1 2 2 1 1 2
2 22 1 1 22( )c ct t
s s
(6.37)
The threshold value of spillover effect can be calculated: * , there are two cases:
When *1 c , it and js are negative correlation, because * *1 2 2 10, 0c ct s t s ;
When *1 c , it and js are positive correlation, because * *1 2 2 10, 0c ct s t s .
(2) In LN scenario
The first derivatives of the self-price versus competitor-service are as following:
* *1 2 2 1 1 2
2 22 1 1 2
24
n nt ts s
(6.38)

Chapter 6 Competitive Strategy for Inventory and Transportation in CBE
140
The threshold value of spillover effect can be calculated: * 2 , there are two cases:
When *1 n , it and js are negative correlation, because * *1 2 2 10, 0n nt s t s ;
When *1 n , it and js are positive correlation, because * *1 2 2 10, 0n nt s t s .
QED
Proposition 3 There is a positive correlation between demand iD and services level
is provided by self-channel.
Demonstration:
The first derivatives of the self-demand versus self-service in LC scenario are as
following: * *1 2 1
1 2 2c cD D
s s
(6.39)
The first derivatives of the self-demand versus self-service in LN scenario are as
following: * *1 2 1 1 1 2 2
2 21 2 1 2
(2 )4
n nD Ds s
(6.40)
Because 1 2 1 20, 0 , so * 0i iD s , no matter in LC or LN scenario, *iD increase as is increase, QED.
Proposition 4 There is a negative correlation between demand iD and services level
js provided by competitor-channel in LC scenario, but exist spillover effects in LN
scenario, and the effect depends on and .
Demonstration:
(1) In LC scenario
The first derivatives of the self-price versus competitor-service are as following:
* *1 2 2
2 1 2c cD D
s s
(6.41)
Because 2 0 , so * 0i jD s , iD decrease as js increase, QED.
(2) In LN scenario
The first derivatives of the self-price versus competitor-service are as following:

Developing E-commerce Logistics in Cross-border Relation
141
* *1 2 1 2 1 1 2
2 22 1 1 2
( 2 )4
n nD Ds s
(6.42)
The threshold value of spillover effect can be calculated: * 2 , there are two cases:
When *1 n , iD and js are negative correlation, because * *1 2 2 10, 0n nD s D s ;
When *1 n , iD and js are positive correlation, because * *1 2 2 10, 0n nD s D s .
QED
Proposition 5 The merchant’s profit m is positively related to the LSPs’ service
level is .
Demonstration:
The first derivatives of the merchant’s profit versus LSPs’ service in LC scenario are:
1 2
1 2
( )2
c cm m p
s s
(6.43)
The first derivatives of the merchant’s profit versus LSPs’ service in LN scenario are:
1 1 2
1 2 1 2
( )2
n nm m p
s s
(6.44)
Because 1 2 1 20, 0 , so 0m is , no matter in LC or LN scenario,
m increase as is increase, QED.
Proposition 6 The profit of merchant in LC scenario is lower than in LN scenario.
Demonstration:
The difference between the profit of merchant in the case of LSPs cooperation and
non-cooperation are as following:
2 1 2
1 2
[ ( ) ]4 2
c nm m m
p a s s
(6.45)
Because 1 2 1 20, 0 , so 0m , QED.
6.2.5 Conclusions and Recommendations
Through the analysis of equilibrium solution, the following conclusions can be
obtained.
Chapter 6 Competitive Strategy for Inventory and Transportation in CBE
142
(1) Improve service level in self-channel will attract more service-sensitive
consumers, but also means more investment. It will result in the growth of logistics
price, which is bound to lose the price-sensitive customers.
(2) Because it exits spillover effects, improving service level in self-channel will not
necessarily decline the competitor’s logistics price and market demand, it is mainly
depending on the impact degree of price and service. In other words, the logistics
price or service level, which one customers pay more attention to.
(3) The profit of CBE merchant will increase with the LSPs’ service improved.
However, when the LSPs are in alliance or transportation outsourced only to one
LSP, the merchant will lose the initiative in service pricing and result in profit
decline.
Therefore, when merchants and LSPs make transportation strategy in cross-border
relation, the following points should be noted:
(1) “Price-war” has been unable to meet the requirement of market competition.
Enterprises must strive to improve the service level, while trading off between price
and service, so that it is conducive to the sustainable growth of profits.
(2) When outsourcing CBE transportation, merchants should choose different LSPs
based on phases or channels. For example, when considering the international
transportation or direct channel, merchants can cooperate with technologically
advanced, perfect network and well-known international LSPs, such as DHL, UPS,
FedEx, etc.; when considering domestic distribution, they should choose local LSPs
who are more familiar with the local situation.

Chapter 7 Case Study
143
7. Case Study
The analysis of the previous chapters already indicated that the impacts of internal
factors and external factors on the development of CBEL are various. These factors
should be taken into account when enterprises formulate e-logistics strategies in
cross-border relation. In this chapter, the Walmart Global Store at JD.com Worldwide
in China market will be chosen as case study to evaluate the rationality and
applicability of the framework proposed in this research.
7.1 The Effect of External Factors
In the framework, the external factors are “Government” and “Consumer”, which
represent the social environment and determine the development direction of CBEL.
7.1.1 Measures of the Chinese Government
The analysis in Chapter 3 has revealed that, the government’s supports include policy
formulation and infrastructure construction, which are the indispensable measures for
the development of CBE and CBEL.
The development process of Chinese government’s is shown in Figure 51.
Figure 51 Development of Chinese Government’s Policy for CBE
It can be seen, a series of favorable policies for CBE and CBEL have been
promulgated continuously from the beginning of 2000, wherein, mainly include:

Developing E-commerce Logistics in Cross-border Relation
144
China’s State Council:
- Minimize administrative intervention in the e-commerce market;
- Require to strengthen international cooperation in e-commerce;
- Cultivate a number of public platforms and foreign trade companies, which can
provide comprehensive service such as customs clearance, warehousing and
financing for CBE;
- Encourage CBE enterprises to expand marketing channels through overseas
warehouses, experience stores, etc.
China’s General Administration of Customs:
- Confirm the standard procedure of cross-border bonded imports, which is
“integration of three orders” (goods order, logistics order, and payment order);
- Give the preferential tax policies for CBE, the tax on goods through bonded
import is lower than the general import trade;
- Customs of all localities maintain all-work-all-the-time, and the paper
declaration is gradually changed to electronic information system. For imported
goods transferred via third-party, no longer required the credentials by transit
customs, so that increase the efficiency of customs clearance.
- Fight against the non-standard behavior in bonded import, such as scalping and
tax evasion;
- Ratify the construction of 11 FTZs (Shanghai, Tianjin, Chongqing, Fujian,
Guangdong, Liaoning, Zhejiang, Henan, Hubei, Sichuan and Shaanxi) and 12
CBE comprehensive pilot cities (Shanghai, Tianjin, Chongqing, Hefei,
Zhengzhou, Guangzhou, Chengdu, Dalian, Ningbo, Qingdao, Shenzhen, Suzhou)
(Figure 52).

Chapter 7 Case Study
145
Figure 52 FTZs and CBE Comprehensive Pilots in China
China’s General Administration of Quality Supervision:
- Launch “Negative list” management mode to improve import efficiency;
- Issue new policies such as construction of designated port, decentralization of
authority, monitoring safety risk of product quality;
- Strengthen the regulation of cosmetics and food, especially for infant formula;
require the establishment of bonded cold chain.
China’s Administration of Foreign Exchange:
- CBE merchants can use domestic bank cards or Alipay to receive payment orders,
and pay foreign partners through qualified third-party agencies or directly
through bank with cross-border payment business;
- Increase the single transaction limit of cross-border online shopping from 10,000
to 50,000 yuan.
It is precisely because the China the government’s positive initiatives on CBE and
CBEL, the GMV of China’s CBE import is expected to reach 1.9 trillion yuan in 2018
and contribute about 20% of total import. This confirms the role of the government as
an important external factor (Chapter 2) and a powerful organizer (Chapter 3).
7.1.2 Performances of the Chinese Consumers
The consumer performance determines the market demand and the effect of CBEL
implementation, which is particularly evident in competitive strategy formulation in
Chapter 5 and 6.

Developing E-commerce Logistics in Cross-border Relation
146
The conditions of Chinese cross-border online shoppers are as follows:
- Product attribute: they prefer to purchase products with high security and quality
requirements, such as cosmetics, mother & baby supplies, food and health care
products. The Products from North America, Asia and Europe are most popular
(Figure 53).
Figure 53 Top 10 Product Categories in China’s CBE
- Customer attribute: they are mainly distributed at the age from 20 to 40. And
74.6% of them hold a bachelor degree or above, 25% of them earn more than 10
thousand yuan per month, 66.5% of them have kids. They are mainly
concentrated in developed regions of Southeastern coastal. Guangdong and
Shanghai accounted for 25% of total shoppers.
- Purchasing channel: they learn about and visit CBE sites mainly via “Shopping
Guide Sites”. 60.8% of them purchase from “global channel” of domestic
merchants such as JD.com, because of convenient payment, easy order tracking,
fast delivery and effective return. 44.9% of them purchase from global online
marketplaces such as Amazon.com, due to high reputation, guaranteed goods
quality and lower price.
- Purchasing reason: 60.7% of them think the quality of foreign products is more
assured, 58.6% of them think the prices is lower, and 52.0% of them think the
desired products are not sold interiorly.
- Satisfaction and concern: the most demand point for cross-border online shopper
are the delivery speed and return convenience, which with a high degree of
concern but still need to improve (Figure 54).
0%
5%
10%
15%
20%
25%
30%
35%
40%
45%
50%
Cosmetics&
PersonalCare
Mother &Baby
Food &HealthCare
Apparels Electronics Houseware&
Grocery
Bags &Suitcases
Sports &Outdoors
HouseholdAppliances
Toys &Gifts

Chapter 7 Case Study
147
Figure 54 CBE Satisfaction and Concern Matrix of Chinese Consumer
- Payment options: 71.8% of them use third-party payment platforms, 55.7% of
them use credit card, and 52.3% of them use online banking.
- Logistics options: 57.2% of them use local express company, 54.8% of them use
international express company, 54.5% of them use postal parcel, and 36.6% of
them use transit company. In addition, 15.6% of goods are delivered within a
week, 38.5% of goods within two weeks and 26.4% within three weeks.
Consumer preferences are mainly reflected in the impact on channel demand. More
consumers purchasing means more profits, which is also the purpose of competitive
strategy formulation. This confirms the role of the consumer as a non-negligible
external factor (Chapter 2) and a direct pusher (Chapter 3).
7.2 The Effect of Internal Factors
Besides the impact of government and consumer, the merchants are the ultimate
implementer of CBEL. Under such a favorable external environment in China,
considering internal factors “Company”, “Product”, “Operation” and “Partnership”
how Walmart (traditional retailer) and JD.com (e-retailer) develop strategy in
cross-border relation will be displayed as follows.

Developing E-commerce Logistics in Cross-border Relation
148
7.2.1 Development of Walmart
Walmart Stores, Inc. was founded by American retail legend Mr. Sam Walton in
Arkansas in 1962. Over the past 50 years, the company has become one of the most
recognized global brands and now the largest retailer in the world. Each week, more
than 250 million customers and members visit Walmart’s nearly 11,500 stores under
more than 70 banners in 28 countries and e-commerce websites in 11 countries. The
fiscal revenue of year 2016 is approximately $482.1billion.
In 1996, Walmart entered the Chinese market and opened its first hypermarket and
Sam’s Club in Shenzhen. Up to 31 Dec, 2016, Walmart has been operating 439 retail
units covering 189 cities nationwide, as well as running 9 distribution centers and 11
fresh products distribution centers located in Shenzhen, Beijing, Tianjin, Jiaxing,
Shanghai, Hangzhou, Guangzhou, Chengdu, Wuhan, Shenyang, Xiamen, Kunming
and Taiyuan.
Since the end of 2010, Walmart began to pay attention to e-commerce and gradually
become click-and-mortar retailer owned offline and online channels. In 2010, Sam’s
Club’s online store (www.samsclub.cn) was opened and can provide direct delivery
service in cities where the Sam’s Club stores located. In 2011, Walmart reached an
agreement with Yihaodian (hereinafter referred to as YHD) for extending online
platform. In 2012, Sam’s Club’s online store started to provide chilled and frozen
foods with same-day-delivery service in specific cities. In 2014, mobile channel is
included in Walmart’s multi-channel strategy, Sam’s Club App was launched,
“Walmart” mobile shopping APP was also launched successively in next year.
2015 is an important milestone of the development of Walmart’s e-commerce, mainly
in the following two aspects:
(1) Walmart strengthened the integration between the channels, opened hypermarket
online-to-offline (O2O) platform “Walmart To Go” in Shenzhen, which accept
multiple online and offline e-payment options. At the same year, Walmart launched
CBE service “Walmart Global Shop” on its mobile App and offered over 200 items.
Walmart promised to guarantee the authenticity and price advantages of these
products while offer the same return and refund services at its physical stores.
(2) Walmart increased the investment in online channel, taken full ownership of YHD.
However, it didn’t help much to strengthen its competitive edge over players in the
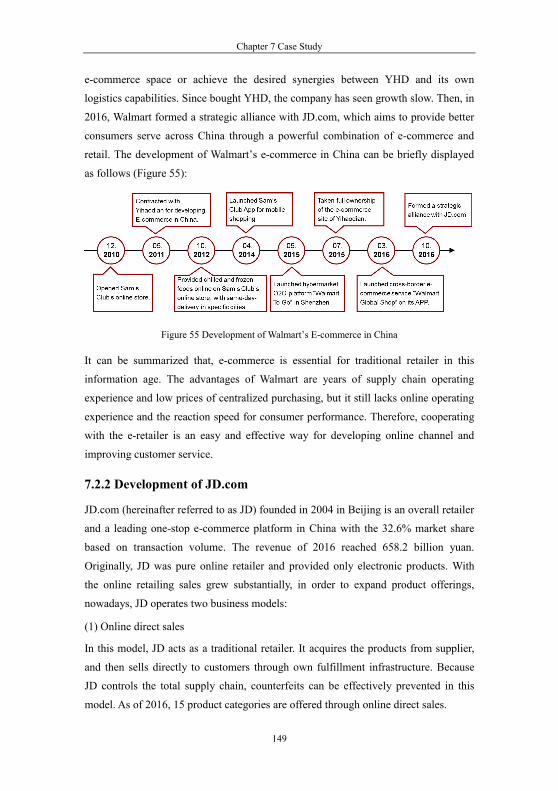
Chapter 7 Case Study
149
e-commerce space or achieve the desired synergies between YHD and its own
logistics capabilities. Since bought YHD, the company has seen growth slow. Then, in
2016, Walmart formed a strategic alliance with JD.com, which aims to provide better
consumers serve across China through a powerful combination of e-commerce and
retail. The development of Walmart’s e-commerce in China can be briefly displayed
as follows (Figure 55):
Figure 55 Development of Walmart’s E-commerce in China
It can be summarized that, e-commerce is essential for traditional retailer in this
information age. The advantages of Walmart are years of supply chain operating
experience and low prices of centralized purchasing, but it still lacks online operating
experience and the reaction speed for consumer performance. Therefore, cooperating
with the e-retailer is an easy and effective way for developing online channel and
improving customer service.
7.2.2 Development of JD.com
JD.com (hereinafter referred to as JD) founded in 2004 in Beijing is an overall retailer
and a leading one-stop e-commerce platform in China with the 32.6% market share
based on transaction volume. The revenue of 2016 reached 658.2 billion yuan.
Originally, JD was pure online retailer and provided only electronic products. With
the online retailing sales grew substantially, in order to expand product offerings,
nowadays, JD operates two business models:
(1) Online direct sales
In this model, JD acts as a traditional retailer. It acquires the products from supplier,
and then sells directly to customers through own fulfillment infrastructure. Because
JD controls the total supply chain, counterfeits can be effectively prevented in this
model. As of 2016, 15 product categories are offered through online direct sales.

Developing E-commerce Logistics in Cross-border Relation
150
(2) Online marketplace
In this model, third-party sellers offer products to customers over JD online
marketplace and pay JD commissions on their sales. As of 2016, there are over
120,000 third-party sellers in JD marketplace, including manufacturers, distributors
and resellers. Meanwhile, JD leverages own nationwide fulfillment infrastructure to
offer third-party sellers additional value-added services, including delivery services or
a combination of warehousing and delivery services. In order to keep away
counterfeits, in this model, JD has strict criteria for merchant approval, and strict
one-strike policy: any merchant found selling counterfeits will be permanently banned
from the site and imposed harsh financial penalties.
In 2007, JD made a strategic decision to build and operate own nationwide fulfillment
infrastructure and proprietary logistics network, due to the underdevelopment of
third-party fulfillment services in China in terms of both warehousing and logistics
facilities and last-mile delivery services. This strategy makes it a uniquely strong
player in China’s online retail industry by providing superior customer experience.
The following points can help to understand the general condition of JD’s logistics
(all data are counted as of 31 December 2016):
- Established fulfillment centers in seven major cities in China: Shenyang, Beijing,
Shanghai, Wuhan, Guangzhou, Chengdu and Xi’an (Figure 56). Each of them
consists of between 11 and 32 warehouses for normal-sized items, 1 to 2
warehouses for bulky items, and associated sorting centers and related facilities.
Figure 56 JD’s Fulfillment Centers in China

Chapter 7 Case Study
151
- Established front distribution centers in another 25 major cities in China. Each of
them consists of 1 to 2 warehouse stocking products that are in high demand with
high turnover.
- Operate 256 warehouses with an aggregate gross floor area of approximately 5.6
million square meters in 54 cities. The annual inventory turnover days were 38.
- Operate 6,906 delivery stations and pickup stations in 2,655 counties and
districts across China. Provide same-day and next-day delivery in 1,410 counties
and districts across China.
- Maintain cooperation arrangements with a number of third-party couriers to
deliver products to those areas not covered by JD’s fulfillment infrastructure,
particularly in smaller and less developed areas. And also use third-party service
providers to ship products from JD’s fulfillment centers or front distribution
centers to delivery stations or to deliver bulky item products.
- Has 123 sea lines and 108 air lines in its international supply chain, cooperated
with numbers of professional and efficient LSPs, such as DHL, Dimerco,
Kuehne & Nagel, Agility, APL.
- Operated “JD self-bonded warehouse” in 7 cities: Guangzhou, Shanghai, Ningbo,
Hangzhou, Tianjin, Tianjin, Chongqing.
In April 2015, JD launched a CBE platform – “JD Worldwide”, which can offered
authentic imported products from over 70 countries and regions, covering more than
18,400 brands. At the same time, enabled “joybuy.com” to provide exported products
for foreign consumer. Various global or local payment methods can be used for sales
outside of China, such as credit card, PayPal or Yandex money. Third-party courier
services are used to ship to addresses outside of China, such as UPS, DHL and EMS.
The cost of delivery is calculated and charged based on the shipping method,
destination country/region and the combined package size and product weight.
It can be summarized that, logistics is significant for e-retailer to improve consumer
satisfaction. The advantages of JD are unrivalled nationwide logistics network and
sophisticated data-driven delivery technologies, but it still lacks international
operating experience and extensive product range. Therefore, cooperating with
third-party sellers is an easy and effective way of reducing operating costs and
expanding the categories.

Developing E-commerce Logistics in Cross-border Relation
152
7.2.3 Cooperation between Walmart and JD.com
When realizing the strengths of each other, Walmart and JD.com decide to form a
strategic alliance so that can expand the breadth and convenience of online shopping
options for consumers across China through a powerful combination of e-commerce
and retail.
Under the agreement, Walmart acquires a 5% stake of JD, while JD takes the
ownership of YHD platform assets, including the brand, website and app. Walmart
will continue to operate the direct sales business of YHD and serve as a seller on the
YHD platform. In addition, they agreed to several strategic partnerships, including
CBE and O2O services in China:
- Open exclusive Sam’s Club Flagship Store on JD.com, and offer same and next
day delivery through JD’s nationwide warehousing and delivery network.
- Open exclusive Walmart Global Flagship Store on JD Worldwide, and expand
the availability of Walmart imported products across China.
- Connect with JDDJ to provide 2-Hour grocery delivery from Walmart stores in
select cities.
Both companies will leverage their supply chain to extend the range of import goods
in order to meet the growing demands from increasingly affluent and quality-oriented
Chinese consumers. The deal is a win-win game, especially for Walmart. The
partnership with JD will definitely broaden Walmart’s consumer base beyond its
current city-scope and will let the company leapfrog its expansion. This is mainly
manifested in two aspects: on the one hand, expand Walmar’s opportunity in
e-commerce by access to JD’s online traffic; on the other hand, Walmart will be listed
as a preferred retailer by JD, which is expected to drive traffic to its brick-and-mortar
stores in China.
In summary, the alliance offers a fresh start to Walmart’s struggling retail business in
China, especially for CBE business. Currently, Walmart Global Store operates two
models of CBEL (Figure 57):
(1) Bonded import
The popular categories, such as Mom&Baby products, cosmetics and personal care,
will be pre-stock in FTZ warehouse, especially before the hot season, such as online
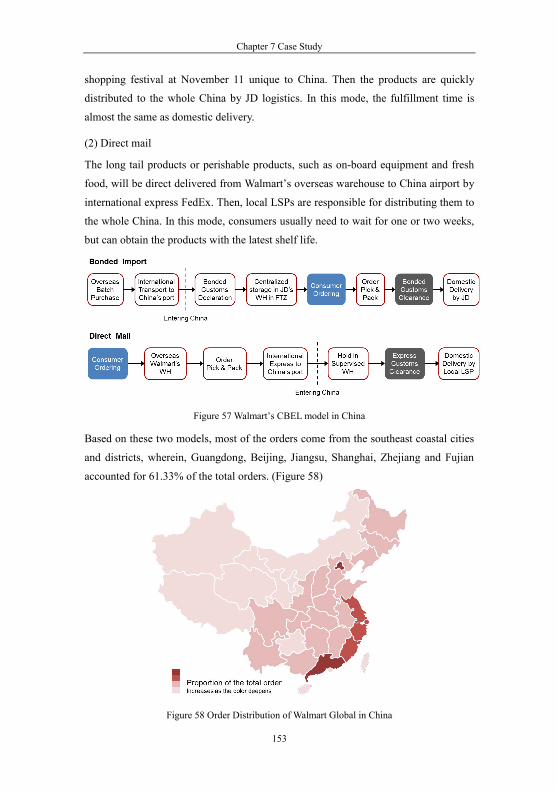
Chapter 7 Case Study
153
shopping festival at November 11 unique to China. Then the products are quickly
distributed to the whole China by JD logistics. In this mode, the fulfillment time is
almost the same as domestic delivery.
(2) Direct mail
The long tail products or perishable products, such as on-board equipment and fresh
food, will be direct delivered from Walmart’s overseas warehouse to China airport by
international express FedEx. Then, local LSPs are responsible for distributing them to
the whole China. In this mode, consumers usually need to wait for one or two weeks,
but can obtain the products with the latest shelf life.
Figure 57 Walmart’s CBEL model in China
Based on these two models, most of the orders come from the southeast coastal cities
and districts, wherein, Guangdong, Beijing, Jiangsu, Shanghai, Zhejiang and Fujian
accounted for 61.33% of the total orders. (Figure 58)
Figure 58 Order Distribution of Walmart Global in China

Developing E-commerce Logistics in Cross-border Relation
154
Considering this situation, Walmart has also developed two CBEL strategies. For
bonded import channel, Walmart stock products centralized in JD’s FTZ warehouse at
Guangzhou, which aims to use JD’s powerful e-logistics capability to improve
customer service. However, Guangzhou located in China’s southernmost, from where
to fulfillment the whole China will result in high logistics cost. Therefore, for direct
mail channel, Walmart used FedEx for international transportation and outsourced
domestic distribution to local LSP in Shanghai. (Figure 59)
Figure 59 Walmart Global’s CBEL Strategy in China
To sum up, the development of Walmart and JD.com in China and their CBEL
strategy verified the rationality and applicability of the framework proposed in this
research very well. Based on the vigorous support by Chinese government and the
online shopping enthusiasm of Chinese consumers (External Factors), Walmart
decided to turn from traditional retailer into click-and-mortar (Company Factor), and
formed a strategic alliance with JD.com (Partnership Factor) for integrating online
and offline (Logistics Strategy Decision) and extending category (Product
Competition Strategy). Walmart Global Store operated different channels (Inventory
Strategy) for different goods (Product Factor). For boned import channel, they rely on
excellent JD e-logistics (Service Competition Strategy) to improve customer service.
And for direct mail channel, in order to reduce logistics cost (Operation Factor), they
outsourced international transportation and domestic distribution respectively to
international express and local LSP (Transportation Strategy).

Developing E-commerce Logistics in Cross-border Relation
155
8. Conclusions and Prospects In this chapter, the results of all chapters were consolidated to answer research
questions presented at the beginning. Propositions and conclusions that may lead to
better adoption of this new practice with more desirable implementation outcomes
were identified. At last, the limitations of the study and guides the direction of future
research were pointed out.
8.1 Synopsis and Contribution Value
With the booming development of CBE, the requirements for logistics services
quality continue to increase. Because the products in CBE often require long distance
transport, the fulfillment time, reliability and flexibility of CBEL become the focus of
consumer concern. In order to improve logistics service and reduce the cost,
e-logistics, the application of modern ICTs in logistics process, need to be
implemented in cross-border relation.
The overall aim of this thesis is to develop a conceptual framework for answering the
key question: How to develop an effective and competitive CBEL? More specifically,
three sub-questions are finally answered in the end, and the corresponding chapter
results are explained as follows.
(1) What is the current situation of CBE and e-logistics?
This question is the origin of this thesis. In order to map and assess the existing
intellectual territory about CBE and e-logistics, 24 recent research reports were
systematically reviewed in Chapter 1. The advanced technology, the growing demand
and the advantageous policy, are main drivers for CBE booming globally. Meanwhile,
culture and consumer behavior, laws and regulations, product and marketing issues,
payment conditions and logistics limitations were identified as the main obstacles to
its success.
Among these obstacles, the logistics-related issues were showed to be the strongest
concern in the industry, because the products in CBE often require long distance
transport, wherein, long transportation time, bad return service and high shipping cost
are increasingly prominent. In order to improve logistics service and reduce operation
cost, e-logistics, the application of modern ICTs in logistics process, needs to be
implemented in cross-border relation, which consists of e-procurement and
e-fulfillment. And based on the goods shipped from overseas warehouse or FTZ

Chapter 8 Conclusions and Prospects
156
warehouse, three main CBEL models are adopted currently: direct mail, goods
collection and bonded import.
The challenge facing in CBE can’t be solved unilaterally. It needs all parties perform
their duties and cooperate whole heartedly. The governments and organizations should
release a series of favorable policies for CBE developments, as well as the great
investments in infrastructure. The merchants need take localization efforts and have
cultural sensitivity, but when lack of adequate information about foreign market
operations, cooperating with third party service providers who are familiar with local
regulations and consumer’s behavior is an effective solution.
(2) What factors affect cross-border e-logistics developing?
This question is the basis of the entire thesis. In order to find the main factors
affecting the implementation of e-logistics in cross-border relation. In Chapter 2,
firstly, 21 initial factors were found by systematic reviewing 582 articles; secondly,
they are preliminary classified into 7 groups including company, product, country,
market, technology, operation and partnership by a focus group discussion. Then a
two-level hierarchy comprised of 7 high-level key dimensions and 21 detailed-level
were constructed.
However, the results summed up by literature review and focus groups have strong
subjectivity. In order to group the meaningful factors together and replace most of the
information of the original variable with fewer independent factor variables, a
questionnaire survey was designed to collect data for factor analysis and distributed to
the case enterprises in China and Germany. The top ten factors scoring by Chinese
and German participants are basically the same except the sequence, but Chinese
enterprises think the internal influences are more important, such as human factor,
while German enterprises believe that the impact of external influences more
significant, such as cultural difference.
Based on the survey data, a conceptual framework was formed with the six key
factors composed of nineteen indicators through an exploratory factor analysis with
principal component extraction and varimax rotation. In the framework, the external
factors are the “Government” and “Consumer”, which represent the social
environment and determine the direction of enterprise; the internal factors include
“Company”, “Product”, “Operation” and “Partnership”, which are organization
condition and determine the strategy formulation of the enterprise.

Developing E-commerce Logistics in Cross-border Relation
157
(3) How to formulate a competitive strategy of cross-border e-logistics?
Firstly, Chapter 3 indicated how external factors affect enterprise strategy design.
Broadly speaking, developing CBEL is not an isolated act of a single enterprise, but a
joint action by all the parties involved. Thus, a trilateral game model was used to
clearly understand the relationship between government, merchant and consumer.
Because they have different status and goals in the implementation of CBEL, their
impacts are not the same. As an organizer, the government plays a key leading role
and has two main strategies: one is prudent regulation based on fiscal and tax
regulatory supervision, such as offering tax exemption to merchant who implemented
CBEL, taking more strict checks and tax evasion penalty on the consumers who used
postal parcel; another is active regulation based on special funds investment, such as
improving infrastructure construction, increasing publicity and promotion efforts.
According to the mixed-strategy equilibrium solution of the trilateral game, the
following suggestions need to be taken into consideration when promote the
development of CBEL, so that the effectiveness of the government regulation can be
improved:
- Form and prefect the incentive mechanism. Raise the subsidies for merchants
who implemented CBEL, and strengthen the supervision for consumers who
purchased via traditional logistics channel, will not increase the efficiency of the
government regulation. When a proper incentive mechanism is absent, even if
the government increases the investment to develop infrastructure construction
and motivate consumers to purchase via CBEL channel, the actual result will be
counterproductive.
- Emphasize the sustainable development of CBEL. The prudent regulation can
promote the development of CBEL but just in a short term, the sustainable
development cannot solely rely on the subsidies and penalty. Relatively, by the
equilibrium solution analysis, the active regulation could effectively increase the
merchant’s implementing probability and the consumers’ purchasing probability.
Therefore, the focus of the government regulation should be shifted to
infrastructure construction, propaganda and popularization.
- Priority to improve the infrastructure construction of CBEL. In the case of the
effective investment unchanged, if government increases the proportion of the
merchant’s profit, so that can motivate the merchant to implement CBEL.

Chapter 8 Conclusions and Prospects
158
Therefore, in order to reduce the operation cost for the merchants, the
government should prioritize to perfect the infrastructure construction. This has
proved to be a good way to improve the efficiency of government regulation.
Secondly, in addition to the support from the government, the merchant should also
actively seek effective approach for resolving the problems encountered in the
development of CBEL. In Chapter 4, based on the survey data of case enterprises,
considering internal factors “Company” and “Product”, a general normative decision
model was presented, which can help merchants adapt the “logistics strategy” to
possible forms of the “logistics problem” in CBE.
The logistics problems were described according to two groups of factors: the product
features and the logistics services. Combined the overall complexity of them, the
logistics problems matrix was classified into four clusters: “Product-Side
Complexity”, “Service-Side Complexity”, “High-Complexity” and “Relatively Easy”.
Then, according to who will be in charge of which part of logistics’ activities, the
logistics strategies were classified into “Full in-house”, “Merchant managed”,
“Supplier managed”, “Drop-shipping”, “LSP managed” and “Full outsourced”. Based
on “logistics problem-strategy matrix”, the decision model contains 5 steps:
- Determine direction: understand what types of enterprises you belong to, and
what kind of product you intend to sell.
- Identify drivers: collect the realistic and objective data about the product features
and the logistics service, referring to the list of drivers proposed before.
- Evaluate complexity: involve the experts from different departments to value the
complexity of each factor according to the five-level scale.
- Define logistics problem: assess the combined complexity values of product
features and logistics service and plot them on the problem-matrix. According to
their position, find the logistics problem belongs to which cluster.
- Select logistics strategy: in final stage, integrate the nature of business and the
type of the logistics problem, match the reasonable logistics strategies in
accordance with the relations identified in problem-strategy matrix.
Thirdly, besides the logistics problems encountered by self, the merchants should also
take into account the increasingly fierce competition between each other. In addition,
they are also facing the dual competition of product and service in CBE. Because of

Developing E-commerce Logistics in Cross-border Relation
159
long distance transportation in CBE, the consumer demand is not only product itself,
but also good logistics services. In Chapter 5, based on consumer utility, a game
model was used to analyze how differentiation of internal factors “Product” and
“Operation” impact the formulation of competitive strategy. Finally, the optimal
pricing and service level in centralized and decentralized decision were generated.
And the following conclusions can be obtained through the equilibrium solution and
the numerical analysis:
- Whether in centralized or decentralized decision, the service level and total profit
in cross-border supply chain are negatively related to the product price
sensitivity of consumer, the service cost coefficient of merchant, the degree of
product differentiation between merchants, but positively related to the service
level sensitivity of consumer.
- Keeping the product differentiation unchanged, cross-border supply chain can
obtain more profit in centralized decision with a higher level of service. However,
there exist spillover effects in decentralized decision, when the product
differentiation is great than the threshold value, the result is exactly the opposite,
and the supply chain with a lower level of service can get more profits.
- Whether in centralized or decentralized decision, the degree of service
differentiation between merchants are negatively related to the product price
sensitivity of consumer, the service cost coefficient of merchant, but positively
related to the service level sensitivity of consumer. And its relationships with the
consumer channel preferences and the total profit of cross-border supply chain
were affected by the combination of factors. Merely increase the degree of
differentiation is not necessarily able to improve own competitiveness and
benefit for cross-border supply chain, even disutility.
- Keeping the service differentiation unchanged, cross-border supply chain can
obtain more profit in centralized decision. And keeping the service cost
coefficient unchanged, whether in centralized or decentralized decision, higher
service differentiation can create more profits for cross-border supply chain.
Fourthly, the complexity of CBEL is difficult to attain for a single enterprise, it
requires cooperation between members in cross-border supply chain. Nowadays, more
and more enterprises assign their logistics demand to LSP, wherein, the main
components of e-logistics, warehousing and transportation are the most frequently

Chapter 8 Conclusions and Prospects
160
outsourced logistics activities. In Chapter 6, overseas supplier, CBE retailer and LSPs
tradeoff between cost and service in the dual-channel supply chain, internal factors
“Operation” and “Partnership” were considered for making competitive inventory and
transportation strategy in cross-border relation.
The optimal inventory strategy in centralized and decentralized managed were
obtained. And the following conclusions can be also generated through the
equilibrium solution and the numerical analysis:
- In the centralized managed inventory mode, only the retailer own inventory and
order from the supplier to meet the demand for both bonded channel and direct
channel, that is, the retailer implements a duel-channel strategy. With the
increase in demand uncertainty, retailer tends to add inventory in order to prevent
out of stock, which leads to two consequences, on one hand, retailer loses profits
due to the growth of inventory cost; on the another hand, supplier obtains more
profits because of the growth of orders. So retailers are required to accurately
forecast market demand before ordering products from suppliers.
- In the decentralized managed inventory mode, retailer and supplier hold
inventory independently, the demand of bonded channel is met by retailer, and
meantime, supplier meet the demand of direct channel. With the increase of
demand uncertainty, both retailer and supplier will lose their profit due to the
growth of inventory. And retailer is more affected by uncertainty, because the
FTZ warehouses are always far from the products’ origin, the inventory cost and
shortage cost of bonded channel are higher than direct channel. As with
centralized mode, both retailer and supplier need to accurately predict the market
demand before determining their inventory level.
- Under the same demand uncertainty level, because centralized management
has stronger risk resilience, the total inventory of the cross-border supply
chain is lower than in decentralized managed inventory mode. Therefore, if
suppliers want to launch a direct mail channel, they should align with the
retailers to jointly manage the inventory. However, the interests of merchants
will be damaged when suppliers operate direct channel, in order to avoid price
competition, an appropriate contract should be formulated to ensure sharing of
the benefits and the risks between suppliers and retailers.

Developing E-commerce Logistics in Cross-border Relation
161
Then, the optimal transportation strategy under LSPs cooperation and
non-cooperation condition was obtained. And the following conclusions can be also
generated through the equilibrium solution and the numerical analysis:
- Improve logistics service level in self-channel will attract more
service-sensitive consumers, but also means more investment. It will lead to
the growth of logistics prices, which is bound to drain the price-sensitive
customers.
- Because of spillover effects, improving logistics service level in self-channel
will not necessarily decline the competitor’s logistics price and market
demand, it is mainly depends on the impact degree of price and service. In
other words, the logistics price or service level, which one customers pay more
attention to.
- The profit of merchant’s will increase as the LSPs’ service level improved.
However, when the LSPs are in alliance or transportation outsourced only to
one LSP, the merchant will lose the initiative in service pricing and result in
profit decline. Hence, when outsourcing CBE transportation, merchants should
choose different LSPs based on phases or channels. For example, for
international transportation or direct channel, merchants can cooperate with
technologically advanced, perfect network and well-known international LSPs,
such as DHL, UPS, FedEx, etc.; but when considering domestic distribution,
they should choose local LSPs who are more familiar with the local situation.
Finally, the Walmart Global Store at JD.com Worldwide in China market was chosen
as case study, their CBEL strategy verified the rationality and applicability of the
framework proposed in this research. The analysis of the previous chapters already
indicated that the impacts of internal factors and external factors on the development
of CBEL are various. These factors should be taken into account when enterprises
formulate e-logistics strategies in cross-border relation. Based on the vigorous support
by Chinese government and the online shopping enthusiasm of Chinese consumers
(External Factors), Walmart decided to turn from traditional retailer into
click-and-mortar (Company Factor), and formed a strategic alliance with JD.com
(Partnership Factor) for integrating online and offline (Logistics Strategy Decision)
and extending category (Product Competition Strategy). Walmart Global Store
operated different channels (Inventory Strategy) for different goods (Product Factor).

Chapter 8 Conclusions and Prospects
162
For boned import channel, they rely on excellent JD e-logistics (Service Competition
Strategy) to improve customer service. And for direct mail channel, in order to reduce
logistics cost (Operation Factor), they outsourced international transportation and
domestic distribution respectively to international express and local LSP
(Transportation Strategy).
So far, all the research questions were perfectly answered. And all chapters and
contents are closely linked around the framework for developing e-logistics in
cross-border relation (Figure 60).
o nm nt Currency exchange Customs clearance Infrastructure Law and regulation Taxes and tariff
Con um a t Culture difference Demand variability
Company ature of business Size of company Human factor
o u t Range of commodity Property of product
Op ation ICT Application Service capability Warehouse & inventory Mgmt Payment
a tn hip Alliances & cooperation Outscoring strategy Real-time info sharing
Internal
External
DevelopCross-border
E-logisticsReduce operating cost Improve customer service
Logistics Strategy Decision Model
Product and Service Competition Strategy
Inventory and Transportation Strategy
Game Model between Sub ects in
Cross-border E-logistics
hant
Figure 60 Overview of Thesis
The factors affecting the development of CBEL are highly complex, previous studies
provided various single factor or focused on a particular factor, but ignoring the
bigger picture. Meanwhile, numerous articles on e-commerce and international
logistics have been published over the last two decades, none have thoroughly
reviewed nor concluded to the implementation of e-logistics in cross-border
e-commerce research. The framework proposed in this research contains two major
extensions of the existing studies.

Developing E-commerce Logistics in Cross-border Relation
163
- The existing frameworks have only considered the effects on e-commerce or
international logistics respectively. This proposed framework enriches the studies
by combine both and through the entire cross-border supply chain.
- None of the existing frameworks classified these factors and investigated the
impacts between them. This proposed framework explicitly incorporates internal
and external influence factors as new antecedents for developing e-logistics in
cross-border relation.
It provides academics a clear knowledge of where the field currently stands and the
type of research that is needed to advance. In addition, the outcomes of this thesis
have also practical significances.
- Revealed existing problems of CBEL developing.
- Found out the key factors affecting CBEL developing.
- Formulated the comprehensive CBEL strategy to support enterprises increase the
competitive advantage in CBE.
8.2 Limitations and Future Research
As with any other piece of research, the present thesis is subject to a number of
limitations, some of which can serve as extensions for future research.
- The references for literature review in Chapter 2 are limited to the articles
published as of the end of 2016. E-commerce is developing rapidly, future
research should base on the latest articles, which can be searched by more
databases and keyword combinations.
- The questionnaire survey in Chapter 2 is limited to its range and region.
Although many international merchants have been included, only German and
Chinese enterprises were involved finally due to the convenient geographical
environment. An extension to include other countries and more experts will be
the object of future research.
- The result of factor analysis in Chapter 2 is limited to the number of samples.
With the increase in the number of samples, the results of the factor analysis are
more stable. In view of the limited number of participants in this survey and the
hierarchy of factors, a multi criteria decision making for ranking different
alternatives such as analytical hierarchy process (AHP), can be integrated with
the factor analysis for more reliable results in subsequent studies.

Chapter 8 Conclusions and Prospects
164
- The definition and classification of logistics problems and logistics strategies in
Chapter 4 are limited to the reference factors. Subsequent studies can expand the
factors considered, or replaced by other factors with greater impact. In addition,
“flash sales” enterprises can be considered in future researh, which focus on the
end-of-season or unsold products offered only to club members through sale
Campaigns lasting just a few days.
- The game models used for competitive strategies in Chapter 3, Chapter 5 and
Chapter 6 are limited to the hypothesis. All of them were based on complete
information under a single game. In the case of information asymmetry, the
repeated game among the participants is the direction of future research. In
addition, dual-channel model in Chapter 5 and Chapter 6 only considered
two-oligopoly in cross-border supply chain. Subsequent studies can involve
multi-party competition.
- The validation of the framework in Chapter 7 is limited to one case study.
Whether the framework is applicable to other types of merchant in other
countries remains to be verified in subsequent studies.
Reference
165
Reference Accenture. (2012), European Cross-border E-commerce: The Challenge of Achieving Profitable
Growth, Dublin: Accenture Publications.
Accenture and AliResearch. (2015), The prospect for the global cross-border B2C e-commerce market, Beijing: AliResearch Publications.
Adyen. (2015), Cross-Border Payments-Opportunities and Best Practices For Going Global, San Francisco: Adyen Publications.
Agatz, N.A.H., Fleischmann, M. and Nunen, J.A.E.E.V. (2008), “E-fulfillment and multi-channel distribution: a review”, European Journal of Operational Research, Vol.187 No.2, pp.339-356.
Alkadi, I., Alkadi, G. and Zhu, Z. (2004), “Growth of international franchising through E-commerce”, Human Systems Management, Vol.23, pp.269-273.
AliResearch. (2015), “Internet +” Report, Beijing: Alibaba group.
Analysys. (2015), The research report of China’s cross-border import e-commerce market, Beijing: Analysys Ltd. Publications.
Angela, B., Gemma, C. and Rumona, D. (2013), Doing a Systematic Review: A Student’s Guide, London: SAGE Publications.
Ashworth, C.J., Schmidt, R.Ä., Pioch, E.A., and Hallsworth, A. (2006), “An approach to sustainable ‘fashion’ e-retail: a five-stage evolutionary strategy for ‘clicks-and-mortar’ and ‘pure-play’ enterprises”, Journal of Retailing & Consumer Services, Vol.13 No.4, pp.289-299.
Bartlett, M.S. (1951), “A further note on tests of significance in factor analysis”, British Journal of Psychology, Vol.4, pp.1-2.
Bayles, D.L. (2002), “E-Logistics and E-Fulfillment: Beyond the Buy Button”, UNCTAD WORKSHOP, CURAÇAO, 25-27 June 2002.
Bhuiyan, M.N.K. (2013), “Application of E-SCM Strategies to Enhance Efficiency and Effectiveness in the Clothing Retail Sector”, Industrial Engineering Letters, Vol.3 No.10, pp.11-21.
Boer, L.D., Harink, J., and Heijboer, G. (2002), “A conceptual model for assessing the impact of electronic procurement”, European Journal of Purchasing & Supply Management, Vol.8 No.1, pp.25-33.
Boyer, K.K. (2001), “E-operations: a guide to streamlining with the internet”, Bus Horizon, Vol.44 No.1, pp.47-54.
Bulger, S. (2013), “What is Order Fulfillment?”, eFulfillment Service Blog, available at: http://www.efulfillmentservice.com/2013/01/what-is-order-fulfillment/ (accessed 15 January 2013)
Burinskiene, A. (2012), “International trade and e-commerce in the practice of enterprises activity”, European Journal of Biochemistry, Vol.270 No.6, pp.3026-3035.
Cai, G. (2010), “Channel Selection and Coordination in Dual-Channel Supply Chains”, Journal of Retailing, Vol.86 No.1, pp.22-36.
Carlton Mansfield. (2015), Research on Cross-Border-E-Commerce Free Trade Zone, Hongkong.

Reference
166
Chamberlin, T.C. (1965), “The method of multiple working hypotheses: with this method the dangers of parental affection for a favorite theory can be circumvented”, Science, Vol.148 No.3671, pp.754.
Chen, L.D., Gillenson, M.L. and Sherrell, D.L. (2004), “Consumer acceptance of virtual stores: A theoretical model and critical success factors for virtual stores”, Database for Advances in information systems, Vol.359 No.2, pp.8-31.
Chen, J. and Yang, Y. (2014), “Service Cooperation Policy in a Dual-Channel Supply Chain under Service Differentiation”, American Journal of Industrial and Business Management, Vol.4 No.6, pp.284-294.
Child, D. (2006), The essentials of factor analysis (3rd ed.), New York: Continuum International Publishing Group.
CECRC. (2016), The monitoring report of China’s e-commerce market data in 2015, Hang Zhou: China Ecommerce Research Center.
Cho, J.J., Ozment, J. and Sink, H. (2008), “Logistics capability, logistics outsourcing and firm performance in an e-commerce market”, International Journal of Physical Distribution & Logistics Management, Vol.38 No.5, pp.336-359.
CNNIC. (2015), The statistic report of China Internet network development state, Beijing: China Internet Network Information Center.
Colliers. (2015), Crossing Borders, Changing Times:A new model for international e-commerce has strong implications for China’s bonded logistics property market, Shanghai: Colliers international Publications.
Corina, P.S. (2011), “The role of the e-procurement in the purchasing process”, Annals of the University of Oradea Economic Science, Vol.1 No.2, pp.687-691.
CRIENGLISH. (2016), “China decides to add 7 new free trade zones”, available at: http://www.scio.gov.cn/32618/Document/1489719/1489719.html (accessed 1 September 2016).
Cronbach, L.J. (1951), “Coefficient Alpha and Internal Structure of Tests”, Psychometrika, Vol.16 No.3, pp.297-334.
Croom, S.R. (2005), “The impact of e-business on supply chain management”, International Journal of Operations & Production Management, Vol.25 No.1, pp.55-73.
Croom, S. and Brandon-Jones, A. (2007), “Impact of e-procurement: Experiences from implementation in the UK public sector”, Journal of Purchasing & Supply Management, Vol.13 No.4, pp.294-303.
Croxton, L.K. (2003), “The Order Fulfillment Process”, International Journal of Logistics Management, Vol.14 No.1, pp.19-32.
Delfmann, W., Albers, S. and Gehring, M. (2002), “The impact of electronic commerce on logistics service providers”, International Journal of Physical Distribution & Logistics Management, Vol.32 No.3, pp.203-222.
Deutsche Bank. (2014), China-EU relations: Gearing up for growth, Frankfurt am Main.
DHL. (2013), Shop the world!: Consumer attitudes towards global distance selling, Bonn: Deutsche Post AG Publications.
DHL. (2015a), Cross border E-commerce: An operator’s perspective, Königswinter: DHL Publications.
DHL. (2015b), Insight on E-Commerce & Collaboration, Brussels: DHL Publications.

Reference
167
Dumrongsiri, A., Fan, A. and Jain, A. (2008), “A supply chain model with direct and retail channels”, European Journal of Operational Research, Vol.187 No.3, pp.691-718.
Ecommerce Europe. (2015), e-Logistics: A need for integrated European solutions, Brussels: Ecommerce Europe Publications.
eCommerceMILO. (2013), “Understanding E-Commerce Fulfillment”, available at: http://www.ecommercemilo.com/2013/07/understanding-e-commerce-fulfillment.html (accessed 15 July 2013).
Erickson, J. (2015), “Cross-Border E-Commerce To Reach $ 1 Trillion In 2020”, Alizila, available at: http://www.alizila.com/cross-border-e-commerce-to-reach-1-trillion-in-2020/ (accessed 11 June 2015).
Fernie, J. and Sparks, L. (2009), Logistics & Retail Management - Emerging issues and new challenges in the retail supply chain (3rd ed.), London: Kogan Page Ltd.
Forrester. (2014), Seizing The Cross-Border Opportunity Businesses Can Go Global, Cambridge: Forrester Publications.
Froelich, I. (2014), Preparing your organization for cross-border ecommerce, Amsterdam: Payvision Publications.
GTAI. (2016), “Customs and Import Arrangements”, Germany Trade & Invest, available at: http://www.gtai.de/GTAI/Navigation/EN/Invest/Investment-guide/The-tax-system/customs.html (accessed 11 March 2016).
Ghezzi, A., Mangiaracina, R. and Perego, A. (2012), “Shaping the e-commerce logistics strategy: a decision framework”, International Journal of Engineering Business Management, Vol.4 No.1, pp.1-13.
Giménez, C. and Lourenço, H.R. (2004), “E-Supply chain management: Review, implications and directions for future research”, UPF Economics and Business Working Paper, No.769, pp.1-46.
Giri, B.C. and Maiti, T. (2014), “Service competition in a supply chain with two retailers under service level sensitive retail price and demand”, International Journal of Management Science and Engineering Management, Vol.9 No.2, pp.133-146.
Gudehus, T. and Kotzab, H. (2012), Comprehensive Logistics (2nd ed.), Heidelberg: Springer.
Gunasekaran, A. and Ngai, E.W.T. (2003), “The successful management of a small logistics company”, International Journal of Physical Distribution & Logistics Management, Vol.33No.9, pp.825-842.
Gunasekaran, A., Ngai, E.W.T. and Cheng, T.C.E. (2007), “Developing an E-Logistics System: A Case Study”, International Journal of Logistics: Research & Applications, Vol.10 No.4, pp.333-349.
Gunasekaran, A. and Kobu, B. (2007), “Performance measures and metrics in logistics and supply chain management: a review of recent literature (1995-2004) for research and applications”, International Journal of Production Research, Vol.45 No.12, pp.2819-2840.
Gough, D., Oliver, S. and Thomas, J. (2012), An Introduction to Systematic Reviews, California: SAGE Publications Ltd, 2012.
Gordon, J. (2014), EU-China E-Commerce Development, Europe: Europe China Research and Advice Network Publications.
Grant, M.R. and Bakhru, B. (2004), “The limitations of internationalization in e-commerce”, European Business Journal, Vol.16 No.3, pp.95-104.

Reference
168
Gronroos, R.A. (1996), “The Value Concept and Relationship Marketing”, European Journal of Marketing, Vol.30 No.2, pp.19-30.
Hafeez, K.; Keoy, K.H.A.; Zairi, M.; Hanneman, R. and Koh, S.C. Lenny. (2010), “E-supply chain operational and behavioural perspectives: an empirical study of Malaysian SMEs”, International Journal of Production Research, Vol.48 No.2, pp.525-546.
Hair, J.F., Black, W.C., Babin, B.J. and Anderson, R.E. (2010), Multivariate data analysis, Upper Saddle River: Prentice Hall.
Hesse, M. (2002), “Shipping news: the implications of electronic commerce for logistics and freight transport”, Resources, Conservation & Recycling, Vol.36 No.3, pp.211-240.
Hernandez, R.L., Cervera, C.M., Flores, J.L.M. and Arroyo, J.C. (2014), “Critical success factors for the implementation of an e-logistics system: An exploratory study”, Journal of Strategic and International Studies, Vol.4 No.3, pp.5-12.
Ho, G.T.S., Choy, K.L. and Lam, C.H.Y. (2012), “Factors influencing implementation of reverse logistics: a survey among Hong Kong businesses”, Measuring Business Excellence, Vol.16 No.3, pp. 29-46.
Hotelling, H. (1929), “Stability in competition”, Economic Journal, Vol.39 No.153, pp.41-57.
Hu, Y.C., Chiu, Y.J., Hsu, C.S. and Chang, Y.Y. (2015), “Identifying Key Factors for Introducing GPS-Based Fleet Management Systems to the Logistics Industry”, Mathematical Problems in Engineering, Vol.8, pp.1-14.
Huang, Y.K., Kuo, Y.W. and Xu, S.W. (2009), “Applying importance-performance analysis to evaluate logistics service quality for online shopping among retailing delivery”, International Journal of Electronic Business Management, Vol.7 No.2, pp.128-136.
Hultkrantz, O. and Lumsden, K. (2001), “E-commerce and Consequences for the Logistics Industry”, In: Seminar on “The Impact of E-commerce on Transport”, Paris, 5-6 June 2001, pp.1-6.
Hung, H.N. (2012), “Operations in an e-commerce company: how your operations affect your service level”, available at: http://www.slideshare.net/hynohun/operations-in-an-ecommerce-company-how-your-operation-affect-your-service-level (accessed 22.07.2012)
Hung, W.H., Lin, C.P., Tai, Y.M., Ho, C.F. and Jou, J.J. (2014), “Exploring the impact of web-based e-procurement on performance: organisational, interorganisational, and systems perspectives”, International Journal of Logistics Research & Applications, Vol.17 No.3, pp.200-215.
Hwang, W., Jung, H.S. and Salvendy, G. (2006), “Internationalisation of e-commerce: a comparison of online shopping preferences among korean, turkish and us populations”, Behaviour & Information Technology, Vol.25 No.1, pp.3-18.
Interlog. (2010), “Logistics Outsourcing”, Service Supply Chain Benchmark Study, available at: http://interlog.wbresearch.com/logistics-outsourcing-ml (accessed 15 June 2010).
IPC. (2010), Cross-Border E-Commerce Report, Belgium: International Post Corporation Publications.
iResearch. (2015a), 2014 China CBE Report (1st ed.), Shanghai: iResearch Publications (05 January 2015).
iResearch. (2015b), China Cross-border Online Shoppers Report (1st ed.), Shanghai: iResearch Publications (4 May 2015).
iResearch. (2016), 2016 China’s Cross-border Online Shoppers Report, Shanghai: iResearch Publications (1 April 2016).

Reference
169
Isac, C. (2014), “E-fulfillment-a new challenge for electronic business”, Annals of the University of Petroşani Economics, Vol.14 No.1, pp.121-128.
Islam, D.M.Z. and Zunder, T.H. (2013), “Issues of eLogistics Applications For Varying Stakeholders: Findings From An Online Survey”, European Transport Research Review, Vol.5, pp.65-78.
Janssens, W., Wijnen, K., Pelsmacker, P.D. and Kenhove, P.V. (2008), Marketing Research with SPSS, New York: Prentice Hall.
JD.com. (2015), “Annual report 2016”, Jingdong.com, available at: https://ir.jd.com/phoenix.zhtml?c=253315&p=irol-reportsannual (accessed 1 May 2017).
JLL. (2013), E-commerce boom triggers transformation in retail logistics, New York: JLL Publications
Kaiser, H.F. (1974), “An index of factorial simplicity”, Psychometrika, Vol.39 No.1, pp.31-36.
Kawa, A. and Zdrenka, W. (2016), “Conception of integrator in cross-border e-commerce”, LogForum, Vol.12 No.1, pp.63-73.
Kehoe, D.F. and Boughton, N.J. (2001), “New paradigms in planning and control across manufacturing supply chains-the utilisation of Internet technologies”, International Journal of Operations & Production Management, Vol.21 No.5/6, pp.582-593.
Khalid, S.K., Regina, K., Jos, K. and Gerd, A. (2003), “Five steps to conducting a systematic review”, Journal of the royal society of medicine, Vol.96 No.3, pp.118-121.
Klumpp, M. and Jasper, A. (2008), “Success Factors for Retail Logistics in an E-Commerce-Environment”, Sineuropean Engineering Research Journal, Vol.1, pp.163-168.
Kommerskollegium. (2012), E-commerce-New Opportunities, New Barriers, Sweden: Kommerskollegium Publications.
Kovács, G. and Spens K.M. (2005), “Abductive reasoning in logistics research”, International Journal of Physical Distribution & Logistics Management, Vol.35 No.2, pp.132-144.
Lam, C.H.Y., Choy, K.L., Ho, G.T.S. and Chung, S.H. (2012), “A hybrid case-GA-based decision support model for warehouse operation in fulfilling cross-border orders”, Expert Systems with Applications, Vol.39 No.8, pp.7015-7028.
Landmark global. (2015a), “White paper-CBE: Rethinking distribution networks”, available at: http://landmarkglobal.com/trends-insights/cross-border-e-commerce-3/(accessed 13 July 2015).
Landmark global. (2015b), “Outsourcing e-commerce logistics: pros and cons”, available at: http://landmarkglobal.com/trends-insights/outsourcing-e-commerce-logistics-pros-and-cons/ (accessed 20 November 2015).
Lang, G. and Bressolles, G. (2013), “Economic Performance and Customer Expectation in e-Fulfillment Systems: A Multi-Channel Retailer Perspective”, Supply Chain Forum: An International Journal, Vol.14 No.1, pp.16-26.
Lee, C.H., Huang, S.Y., Barry, F.B. and Kao, L. (2010), “Business performance and customer relationship management: The effect of IT, organisational contingency and business process on Taiwanese manufacturers”, Total Quality Management & Business Excellence, Vol.21 No.1, pp.43-65.
Liu, X., Chen, D. and Cai, J. (2015), “The Operation of the Cross-Border e-commerce Logistics in China”, International Journal of Intelligent Information Systems, Vol.4 No.2, pp.15-18.
Lummus R.R. and Vokurka R.J. (2002), “Making the right e-fulfillment decision”, Production and Inventory Management Journal, Vol.43 No.1/2, pp.50-55.

Reference
170
Mark, S., Philip, L. and Adrian, T. (2009), Research methods for business students (5th ed.), London: Pearson Education Limited.
Masters, D. (2013), “3 E-commerce Fulfillment Options: Which One is Right for Your Business?””, available at: http://business.tutsplus.com/articles/3-E-commerce-fulfillment-options-which-one-is-right-for-your-business--fsw-42537 (accessed 10 September 2013).
McDermott, K. (2015), Key Business Drivers and Opportunities in Cross-Border Ecommerce, Amsterdam: Payvision Publications.
Meng, L., Zhang, B.M. (2014), “The Development of Logistics Industry in the Cross-border E- commerce Environment”, Logistics engineering and management, Vol.36 No.11, pp.110-113.
Muffatto, M. and Payaro, A. (2004a), “Integration of web-based procurement and fulfillment: a comparison of case studies”, International Journal of Information Management, Vol.24 No.4, pp.295-311.
Muffatto, M. and Payaro, A. (2004b), “Implementation of e-procurement and e-fulfillment processes: a comparison of cases in the motorcycle industry”, International Journal of Production Economics, Vol.89 No.3, pp.339-351.
Myerson, R.B. (1997), Game Theory: Analysis of Conflict, Cambridge: Harvard University Press.
Nielson, J. and Morris, R. (2001), “E-commerce and trade: resolving dilemmas”, OECD Observer, Vol.224, pp.37-39.
Nunnally, J.C. (1978), Psychometric theory (2nd ed.), New York: McGraw-Hill.
Okamura, J. (2006), “Worldwide via the Web”, Multichannel Merchant (Penton Media, Inc.), Vol.2 No.2, pp.31-32.
Osborne, M.J., Rubinstei, A. (2011), A Course in Game Theory, Cambridge: The MIT Press.
Pamela, B. and Susan, J. (2008), “Qualitative Case Study Methodology: Study Design and Implementation for Novice Researchers”, The Qualitative Report, Vol.13 No.4, pp.544-559.
Panagariya, A. (2000), “E-Commerce, WTO and Developing Countries”, World Economy, Vol.23 No.8, pp.959-978.
Pavlou, P.A., Sawy, O.A.E. (2002), “A classification scheme for B2B exchanges and implications for interorganizational eCommerce”, in: Business to Business Electronic Commerce: Challenges and Solutions, IRM Press.
Paypal. (2013), Modern Spice Routes-The Cultural Impact and Economic Opportunity of Cross-Border Shopping, San Jose: Paypal Publications.
Paypal. (2014a), Unlocking the cross-border trade opportunity, San Jose: Paypal Publications.
Paypal. (2014b), Cross-Border Research 2014-Global snapshot, San Jose: Paypal Publications.
Pitney Bowes. (2010), Time to Get Serious About Cross-Border Ecommerce, Stamford: Pitney Bowes Publications.
Płaczek, E. (2010), “New challenges for logistics providers in the e-business era”, LogForum, Vol.6 No.2, pp.39-47.
Porter, M.E. (1980), “Competitive strategy: techniques for analyzing industries and competitors”, Social Science Electronic Publishing, Vol.2, pp.86-87.
Pounder, P. (2013), “A Review of Supply Chain Management and Its Main External Influential Factors in the global market economy Supply Chain”, Supply Chain Forum, Vol.14 No.3, pp.42–50.

Reference
171
PRNewswire. (2015), “Global Cross-Border B2C E-Commerce 2015”, available at: http://www.prnewswire.com/news-releases/global-cross-border-b2c-e-commerce-2015-300156055.html (accessed 7 October 2015).
Puschmann, T. and Alt, R. (2005), “Successful use of e-procurement in supply chains”, Supply Chain Management: An International Journal, Vol.10 No.2, pp.122-133.
Purvis, L., Gosling, J. and Naim, M.M. (2014), “The development of a lean, agile and leagile supply network taxonomy based on differing types of flexibility”, International Journal of Production Economics, Vol.151 No.1, pp.100-111.
PwC. (2015), China to open up its import tariff and importation policies for consumer products, Hong Kong: PwC Publications.
Pyke, D. F., Johnson, M. E., and Desmond, P (2001), “E-fulfillment: it’s harder than it looks”, Supply Chain Management Review, Vol.5 No.1, pp.26-32.
Rajavel, N. (2015), “E-tailing in India: opportunities and challenges”, International journal of management and social science research review, Vol.1 No.8, pp.143-148.
Rao, K. and Young, R.R. (1994), “Global supply chains: factors influencing outsourcing of logistics functions”, International Journal of Physical Distribution & Logistics Management, Vol.24 No.6, pp.11-19.
Rasmusen, E. (2007), Games and Information: An Introduction to Game Theory (4th ed.), Hoboke: Wiley-Blackwell.
Reynolds, J. (2001), Logistics & Fulfillment for E-business, New York: CMP books.
Ricker, R.F. and Kalakota, R. (1999), “Order fulfillment: The Hidden Key to E-commerce Success”, Supply Chain Management Review, Vol.11 No.30, pp.60-70.
Robson, C. (2002), Real World Research: a resource for social scientists and practitioner-researchers (2nd ed.), Oxford: Blackwell.
Rodriguez, C.A. and Larsson, A. (2006), “Logistic Order-Fulfillment in E-commerce-A case study of pure-plays and click-and-mortars in the B2C market”, Master thesis, Luleå University of Technology.
Ryan, G. (2010), Guidance notes on planning a systematic review, NUI Galway: James Hardiman Library.
Saeed, K.A., Malhotra, M.K., and Grover, V. (2005), “Examining the impact of interorganizational systems on process efficiency and sourcing leverage in buyer–supplier dyads”, Decision Sciences, Vol.36 No.3, pp.365-396.
Sawyer, R.K. (2012), Explaining creativity: the science of human innovation, New York: Oxford University Press.
Shama, A. (2005), “An empirical study of the international marketing strategies of e-commerce companies”, Thunderbird International Business Review, Vol.47 No.6, pp. 695-709.
Shapiro, C. (1989), “Theory of Business Strategy”, RAND Journal of Economics, Vol.20 No.1, pp.125-137.
Shewmake, B. and Sapp, G. (2000), “Bringing down the international barriers”, Infoworld. Vol.22 No.18, pp.30.
Singh, M. and Thomson, D. (2002), “eProcurement Model for B2B Exchanges: An Australian Example”, in: 15th Bled Electronic Commerce Conference eReality: Constructing the eEconomy, Bled, Slovenia, June 17-19, 2002.

Reference
172
Sláviková, G., BoČková, K.H. and PorubČanová, D. (2015), “Use of game theory in economy and management with the focus on Czech environment”. Advances in Business and Economic Development, Vol.1 No.1, pp.106-144.
Statista. (2015), “Domestic and cross-border B2C e-commerce sales in Europe from 2013 to 2018 (in billion euros)”, available at: http://www.statista.com/statistics/292928/dom-estic-and-cross-border-b2c-e-commerce-sales-europe/ (accessed 31 July 2015).
Straube, F. and Lueck, A. (2000), “Strategiesfor e-fulfillment – Changes in the logistics value chain”, in: B. Stanford-Smith & P.T. Kidd (Eds.), E-business – Key issues, applications, technologies, Amsterdam: IOS Press, pp. 436-440.
Straube, F. (2004), e-Logistik, Berlin-Heidelberg-New York: Spring.
Tanner, C., Wölfle, R., Schubert, P. and Quade, M. (2007), “Current trends and challenges in electronic procurement: an empirical study”, Electronic Markets, Vol.18 No.1, pp.6-18.
Tarn,M.J., Razi, M.A., Wen, H.J. and Jr, A.A.P. (2003), “E-fulfillment: the strategy and operational requirements”, Logistics Information Management, Vol.16 No.5, pp.350-362.
Tai, Y.M. (2011), “Exploring the performance impact of web-based direct procurement systems: from the perspective of process integration”, WSEAS Transactions on Information Science and Applications, Vol.9 No.8, pp.380-390.
Tai, Y.M., Ho, C.F. and Wu, W.H. (2010), “The performance impact of implementing Web-based e-procurement systems”, International Journal of Production Research, Vol.48 No.18, pp.5397-5414.
Tentinet. (2015), 2015 Chinese cross-border e-commerce report, Shenzhen: Tentinet.
Terzi, N. (2011), “The impact of E-commerce on international trade and employment”, Procedia - Social and Behavioral Sciences, Vol.24, pp.745-753.
Tranfield, D., Denyer, D. and Smart, P. (2003), “Towards a methodology for developing evidence-informed management knowledge by means of systematic review”, British Journal of Management, Vol.14 No.3, pp.207-222.
Turban, E., King, D., Lee, J. and Viehland, D. (2006), Electronic Commerce A managerial perspective, Upper Saddle River: Prentice Hall.
UNCTAD. (2015), “Information economy report 2015 - Unlocking the potential of E-commerce for Developing Countries”, New York: UNCTAD Publications.
Vaidyanathan, G. and Devaraj, S. (2008), “The role of quality in e-procurement performance: An empirical analysis”, Journal of Operations Management, Vol.26 No.3, pp.407-425.
van Heel, B., Lukic, V. and Leeuwis, E. (2014), “Cross-Border E-Commerce Makes the World Flatter”, available at: https://www.bcgperspectives.com/content/articles/transportati-on_travel_tourism_retail_cross_border_ecommerce_makes_world_flatter/ (accessed 18 September 2014)
VendorSeek.com (2016), “What is the Fulfillment Process?”, available at: http://www.vendorseek.com/supply-chain-fulfillment-warehousing/fulfillment-and-distribution/what-is-fulfillment-process (accessed 15 January 2016).
Vitkauskaitė, E. and Catautis, R. (2008), “E-procurement perspectives in construction sector SMEs”, Journal of Civil Engineering and Management, Vol.14 No.4, pp.287-294.
Viswanadham, N. and Gaonkar, R. (2001), “E-logistics: trends and opportunities”, available at: http://lcm.csa.iisc.ernet.in/nv/Download/Vis.WP4.pdf (accessed 23 March 2015).
Voyageone. (2015), Strategies to drive cross-border E-commerce growth in China, Shanghai: Voyageone Publications.
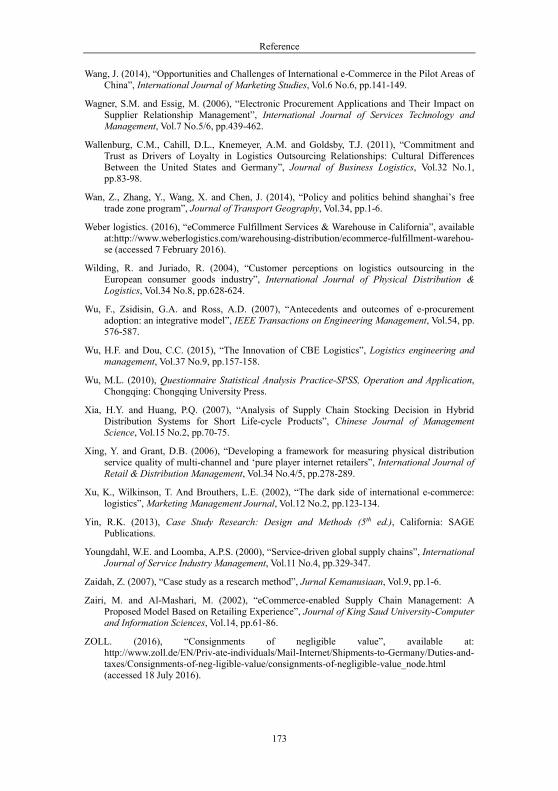
Reference
173
Wang, J. (2014), “Opportunities and Challenges of International e-Commerce in the Pilot Areas of China”, International Journal of Marketing Studies, Vol.6 No.6, pp.141-149.
Wagner, S.M. and Essig, M. (2006), “Electronic Procurement Applications and Their Impact on Supplier Relationship Management”, International Journal of Services Technology and Management, Vol.7 No.5/6, pp.439-462.
Wallenburg, C.M., Cahill, D.L., Knemeyer, A.M. and Goldsby, T.J. (2011), “Commitment and Trust as Drivers of Loyalty in Logistics Outsourcing Relationships: Cultural Differences Between the United States and Germany”, Journal of Business Logistics, Vol.32 No.1, pp.83-98.
Wan, Z., Zhang, Y., Wang, X. and Chen, J. (2014), “Policy and politics behind shanghai’s free trade zone program”, Journal of Transport Geography, Vol.34, pp.1-6.
Weber logistics. (2016), “eCommerce Fulfillment Services & Warehouse in California”, available at:http://www.weberlogistics.com/warehousing-distribution/ecommerce-fulfillment-warehou-se (accessed 7 February 2016).
Wilding, R. and Juriado, R. (2004), “Customer perceptions on logistics outsourcing in the European consumer goods industry”, International Journal of Physical Distribution & Logistics, Vol.34 No.8, pp.628-624.
Wu, F., Zsidisin, G.A. and Ross, A.D. (2007), “Antecedents and outcomes of e-procurement adoption: an integrative model”, IEEE Transactions on Engineering Management, Vol.54, pp. 576-587.
Wu, H.F. and Dou, C.C. (2015), “The Innovation of CBE Logistics”, Logistics engineering and management, Vol.37 No.9, pp.157-158.
Wu, M.L. (2010), Questionnaire Statistical Analysis Practice-SPSS, Operation and Application, Chongqing: Chongqing University Press.
Xia, H.Y. and Huang, P.Q. (2007), “Analysis of Supply Chain Stocking Decision in Hybrid Distribution Systems for Short Life-cycle Products”, Chinese Journal of Management Science, Vol.15 No.2, pp.70-75.
Xing, Y. and Grant, D.B. (2006), “Developing a framework for measuring physical distribution service quality of multi-channel and ‘pure player internet retailers”, International Journal of Retail & Distribution Management, Vol.34 No.4/5, pp.278-289.
Xu, K., Wilkinson, T. And Brouthers, L.E. (2002), “The dark side of international e-commerce: logistics”, Marketing Management Journal, Vol.12 No.2, pp.123-134.
Yin, R.K. (2013), Case Study Research: Design and Methods (5th ed.), California: SAGE Publications.
Youngdahl, W.E. and Loomba, A.P.S. (2000), “Service-driven global supply chains”, International Journal of Service Industry Management, Vol.11 No.4, pp.329-347.
Zaidah, Z. (2007), “Case study as a research method”, Jurnal Kemanusiaan, Vol.9, pp.1-6.
Zairi, M. and Al-Mashari, M. (2002), “eCommerce-enabled Supply Chain Management: A Proposed Model Based on Retailing Experience”, Journal of King Saud University-Computer and Information Sciences, Vol.14, pp.61-86.
ZOLL. (2016), “Consignments of negligible value”, available at: http://www.zoll.de/EN/Priv-ate-individuals/Mail-Internet/Shipments-to-Germany/Duties-and-taxes/Consignments-of-neg-ligible-value/consignments-of-negligible-value_node.html (accessed 18 July 2016).

Appendix 1. Initial Influencing Factors for Developing CBEL
174
Appendix 1. Initial Influencing Factors for Developing CBEL
Classification Factors References Num. of articles
Company Nature of business Ghezzi et al. (2012), Hafeez et al. (2010) 2
Size of company Kawa and Zdrenka (2016), McGloin and Grant (1998), Hafeez et al. (2010), Ho et al. (2012), Hu et al. (2015), Patterson et al. (2003)
6
Human factor Gunasekaran and Ngai (2004), Hernandez et al. (2014), Ho et al. (2012), Hwang and Lu (2013)
4
Product Range of commodity Ghezzi et al. (2012) 1
Property of product Fraering and Prasad (1999), Ghezzi et al. (2012), Gunasekaran and Kobu (2007), Lovell et al.(2005), Maruntelu (2008), Mason et al. (2003), Rao and Young (1994), Wanke and Zinn (2004), Van der Vorst et al. (2009)
9
Government Infrastructure Fraering and Prasad (1999), Ibrahim et al. (2015), Lovell et al.(2005), Murillo (2001), Ng (2009), Xu et al. (2002), Wong (2006)
7
Tax and tariff Boyd et al. (2003), Fraering and Prasad (1999), Hameri and Hintsa (2009), Ibrahim et al. (2015), Kawa and Zdrenka (2016), Loomba (2000), Lovell et al.(2005), Tyan et al. (2003), Youngdahl and Xu et al. (2002)
9
Currency exchange Boyd et al. (2003), Fraering and Prasad (1999), Ibrahim et al. (2015), Lovell et al.(2005), Tyan et al. (2003), Xu et al. (2002), Youngdahl and Loomba (2000)
7
Customs clearance Boyd et al. (2003), Kawa and Zdrenka (2016), Lam et al. (2012), Samiee and Walters (2006), Tyan et al. (2003), Wang et al. (2015), Yang and Shen (2015), Youngdahl and Loomba (2000)
8
Law and regulation Boyd et al. (2003), Hameri and Hintsa (2009), Ho et al.(2012), Hwang and Lu (2013), Ibrahim et al. (2015), Kawa and Zdrenka (2016), Lam et al. (2012), Liu et al.(2015), Lovell et al.(2005), Ng (2009), Shi and Ruan (2008), Sun et al. (2008), Wang et al. (2015), Wong (2006), Xu et al. (2002)
15

Appendix 1. Initial Influencing Factors for Developing CBEL
175
Classification Factors References Num. of articles
Market Demand variability Lovell et al.(2005), Wanke and Zinn (2004) 2
Cultural difference Boyd et al. (2003), Fernie and Sparks (2009), Gunasekaran and Kobu (2007), Ibrahim et al. (2015), Murillo (2001), Samiee and Walters (2006), Rajaguru and Matanda (2013), Wong (2012), Youngdahl and Loomba (2000)
9
Technology ICT application Capineri and Leinbach (2004), Chen et al. (2009), Dey (2014), Giménez and Lourenço (2008), Gunasekaran and Kobu (2007), Gunasekaran and Ngai (2004), Gunasekaran et al. (2007), Hafeez et al. (2010), Hernandez et al. (2014), Hu et al. (2015), Hultkrantz and Lumsden (2001), Jean and Sinkovics (2010), Kawa and Zdrenka (2016), Krmac (2007), Lee et al. (2010), Maruntelu (2008), Mason et al. (2003), McGloin and Grant (1998), Murphy and Daley (2000), Pansy et al. (2015), Patterson et al. (2003), Pounder (2013), Rajaguru and Matanda (2013), Ranganathan et al. (2004), Rao (2000), Rao and Young (1994), Rodríguez (2006), Samiee and Walters (2006), So et al. (2012), Swaminathan and Tayur (2003), Tai et al. (2010), Terzi (2011), Trappey et al. (2004), Van der Vorst et al. (2009), Wang et al. (2015), Wu (2012), Xu et al. (2002), Zairi and Al-Mashari (2002), Zhang (2005), Żurek (2015)
40
Operation Payment Ng (2009), Wang et al. (2015), Yang and Shen (2015) 3
Warehouse and inventory mgmt.
Gunasekaran et al. (2007), Ji et al. (2006), Lam et al. (2012), Mason et al. (2003), Tyan et al. (2003), Wanke and Zinn (2004), Xu et al. (2002), Zairi and Al-Mashari (2002)
8
Sustainability Alkhatib et al. (2015), Capineri and Leinbach (2004), Fernie and Sparks (2009), Hameri and Hintsa (2009), Ho et al. (2012), Ibrahim et al. (2015), So et al. (2012), Van der Vorst et al. (2009)
8
One-stop service Gunasekaran et al. (2007), Kawa and Zdrenka (2016) 2
Service capacity Capineri and Leinbach (2004), Colton et al. (2010), Ghezzi et al. (2012), Giménez and Lourenço (2008), Gunasekaran and Kobu (2007), Hsu et al. (2009), Jafari (2015), Kawa and Zdrenka (2016), Klumpp and Jaspe (2008), Murillo (2001), Rao and Young (1994), Wang (2014), Xu et al. (2002), Zhang (2005), Żurek (2015)
15

Appendix 1. Initial Influencing Factors for Developing CBEL
176
Classification Factors References Num. of articles
Partnership Alliance and cooperation
Colton et al. (2010), Fernie and Sparks (2009), Gong and Kan (2013), Gunasekaran et al. (2007), Hernandez et al. (2014), Ho et al. (2012), Hwang and Lu (2013), McGloin and Grant (1998), Rajaguru and Matanda (2013), Samiee (2008), Shi and Ruan (2008), Tai et al. (2010), Van der Vorst et al. (2009)
13
Real-time info. sharing
Gong and Kan (2013), Gunasekaran et al. (2007), Hafeez (2010), Ho et al. (2012), Hsu et al. (2009), Jean and Sinkovics (2010), McGloin and Grant (1998), Patterson et al. (2003), Rajaguru and Matanda (2013), Rao (2000), Samiee and Walters (2006), Sun et al. (2008), Zhang (2005)
13
Outscoring strategy Alkhatib et al. (2015), Banomyong and Supatn (2011), Capineri and Leinbach (2004), Gong and Kan (2013), Gunasekaran and Kobu (2007), Gunasekaran et al. (2007), Hameri and Hintsa (2009), Hernandez et al. (2014), Hultkrantz and Lumsden (2001), Liu et al. (2015), Ji et al. (2006), Joong-Kun Cho et al. (2008), Kawa and Zdrenka (2016), Klumpp and Jaspe (2008), Murphy and Daley (2000), Rao and Young (1994), Samiee (2008), Trappey et al. (2004), Tyan et al. (2003), Wong (2012), Xu et al. (2002), Yang and Shen (2015), Ye et al. (2014)
23

Appendix 2. Questionnaire
177
Appendix 2. Questionnaire
Dear participants,
We are grateful for your participation in this survey. Hereby, your 15 minutes to fill out this questionnaire will help us advance logistics research. We also hope you will benefit from the survey results. Please rest ensured that all your comments will be treated anonymously
“International ecommerce is called cross-border ecommerce, when consumers buy online from merchants, located in other countries and jurisdictions.” (Cross-Border Ecommerce Community)
In a narrow sense, cross-border e-commerce (CBE) is almost equal to cross-border electronic retailing (e-retailing) by business-to-consumer (B2C) transaction, which is the definition in this research. The following Figure shows the flow of import logistics. The export flow is just opposite to that.
Currently, long delivery time, high shipping cost, unsatisfied return service are the main challenges of CBE logistics. In order to be successful in CBE, enterprises have to seek new e-logistics solution. As such, the following survey “Developing a CBE logistics system” has been compiled to assess that how to set up an e-logistics system in cross-border relations and make it efficient.
A framework will be found in the end, which can support the members of the global supply chain in developing and evaluating their global logistics network, better understanding the main determinants for e-logistics system success and adapting the optimal “logistics strategy” in CBE.
Section 1: General information
What industry does your business belong to?
□ Manufacturer □ Retailer □ Logistics service provider □ Others ______________
If you are retailer, please choose your type.
□ E-marketplace (as a platform, e.g. ebay)
□ Self-operation e-retailer (as an online retail store, e.g. Zalando)
□ Integrated e-retailer (as both a platform and a retailer, e.g. Amazon)
□ Click-and-Mortar (own offline store and online shop, e.g. Tesco)
□ Others ________________
Please indicate the size of your company. This division is based on the definition of the European Commission.
□ Micro size company (The number of employees < 10, and annual turnover ≤ 2 Million €)
□ Small size company (The number of employees < 50, and annual turnover ≤ 10 Million €)
□ Medium size company (The number of employees < 250, and annual turnover ≤ 50 Million €)
□ Large size company (The number of employees ≥ 250, and annual turnover > 50 Million €)
□ Others ________________
What are your products’ origins (Global operations)? (Multiple choice)
□ Europe □ North America □ Latin America □ Asia & Oceania □ Africa □ Specific region________

Appendix 2. Questionnaire
178
Who are your main suppliers and their proportion? (Multiple choice)
□ Manufacturer_____ □ Wholesaler_____ □ Retailer_____ □ Personal seller_____ □ Self-produce_____
Section 2: Influencing factors
E-logistics is a holistic methodology and strategic planning of all logistics systems and processes with the application of modern information and communication technology (ICT). It comprises e-procurement and e-fulfillment, which is an interactive network from producing to delivering a final product to the consumer. Apply an e-logistics system effectively in CBE can achieve: (1) Reducing operating costs; (2) Meeting product delivery deadlines; (3) Improving customer services. The following survey is about which factors you think as important determinants and affecting successful implementation of an e-logistics system in CBE.
Please indicate the importance of each factor. The relative importance of factors is not represented by their sequence.
Factors Not important
Slightly important
Moderately important Important Very
important 1) Nature of business e.g. marketplace (ebay), self-operation (Amazon), click-and-mortar
(Walmart). 1 2 3 4 5
2) Size of company e.g. large company and SMEs could obtain different levels of support
from financial, technological and human resources. 1 2 3 4 5
3) Human factor e.g. knowledge, skills, goals and personalities of staffs; prior support
from top management and across multiple organizations. 1 2 3 4 5
4) Range of commodity e.g. single commodity (Zalando, appeal), comprehensive commodity
(Amazon). 1 2 3 4 5
5) Property of product e.g. category, value density, obsolescence, specific needs for logistics. 1 2 3 4 5
6) Infrastructure e.g. electronic network, transportation and communications, banking. 1 2 3 4 5
7) Tax and tariff 1 2 3 4 5
8) Currency exchange 1 2 3 4 5 9) Customs clearance e.g. the convenience and complexity of process, transparency of
information, clearance fees. 1 2 3 4 5
10) Law and regulation e.g. consumer’s interest, e-commerce, customs, import-export,
environmental protection. 1 2 3 4 5
11) Demand variability of online product e.g. due to seasonality or consumer preferences. 1 2 3 4 5
12) Cultural difference e.g. consumer preferences on product, payment, delivery; corporate
culture. 1 2 3 4 5
13) Application of information and communication technology (ICT) e.g. the type of ICT (ERP or Web-based), the cost of ICT. 1 2 3 4 5
14) Payment e.g. payment options, payment security, timeliness. 1 2 3 4 5
15) Warehouse and inventory management e.g. warehouse location (domestic, overseas, free trade zone);
inventory model (centralized, decentralized, VMI). 1 2 3 4 5
16) Sustainability e.g. recyclable packaging, reverse logistics, clean energy usage. 1 2 3 4 5
17) One-stop service e.g. global online marketplaces provide integrated solutions for SMEs,
such as Amazon.com and Alibaba.com. 1 2 3 4 5

Appendix 2. Questionnaire
179
18) Service capacity e.g. order fulfillment time, flexibility, reliability and return management. 1 2 3 4 5
19) Alliance and cooperation e.g. strategic alliance and cooperation with supply chain partners, such as
suppliers, retailers, intermediaries and LSPs. 1 2 3 4 5
20) Real-time information sharing e.g. sharing product, technology, market with partners, sharing order and
delivery status with customers in real-time. 1 2 3 4 5
21) Outscoring strategy e.g. in-house, full outsourced, drop-shipping; LSPs type and selection
criteria. 1 2 3 4 5
Section 3: Product and service (If you provide products online, please fill out this section)
Which commodities are sold on your webpage? And please indicate the sorting according to the revenue.
□ Fashion □ Beauty and personal care □ Housewares and home furnishings □ Consumer Electronics □ Toys
□ OTC drugs and dietary supplements □ Groceries □ Household and consumer appliances □ Others__________
The following items about product and service performance, please select the corresponding mean. If you sell variety of commodities, please fill out the top one category.
Product
Product range [items] □ x≤1000 □ 1000<x≤10000 □ 10000<x≤20000 □ 10000<x≤100000 □ x>100000 Value density [€/kg] □ x≤10 □ 10<x≤20 □ 20<x≤100 □ 100<x≤200 □ x>200 Durability [months] □ x>24 □ 12<x≤24 □ 6<x≤12 □ 1<x≤6 □ x≤1
Product specific needs □ Low □ L/M □ Medium □ M/H □ High
Service
Order fulfillment time [days] □ x≤7 □ 7<x≤14 □ 14<x≤21 □ 21<x≤35 □ x>35 Flexibility [qualitative] □ Low □ L/M □ Medium □ M/H □ High Delivery reliability [%] □ x>95% □ 90%<x≤95% □ 85%<x≤90% □ 80%<x≤85% □ x≤80
Returns [%] □ x≤5% □ 5%<x≤10% □ 10%<x≤20% □ 20%<x≤40% □ x>40%
Section 4: Technology and Operation
Which inventory management models do you use? (Multiple choice)
□ Vendor Managed Inventory (VMI)
□ Jointly Managed Inventory (JMI)
□ Collaborative Planning, Forecasting and Replenishment (CPFR)
□ Drop-shipping (doesn’t keep goods in stock, transfers customer orders to supplier and has it shipped directly to the customer)
□ Others___________
Where do you store the goods in order to fulfill foreign customers? (Multiple choice)
□ Domestic warehouse □ Overseas warehouse □ Free trade zone warehouse □ Others___________
What types of cross-border transportation do you employ? (Multiple choice)
□ Airlift □ Ocean shipping □ Railway □ Land transportation □ Others___________
Which “last mile” services do you provide to customers? (Multiple choice)
□ Home delivery □ Pick at pack station □ Pick at store □ Pick at neighbor □ Others___________

Appendix 2. Questionnaire
180
Section 5: Partnership and Outsourcing Which is your global logistics and supply chain strategy? (choose the closest)
Full in-house Merchant managed Supplier managed Drop-shipping LSP managed Full outsourced Supplier Merchant LSP Supplier Merchant LSP Supplier Merchant LSP Supplier Merchant LSP Supplier Merchant LSP Supplier Merchant LSP
Purchasing X X X X X X Warehousing X X X X X X X X
Order processing X X X X X X X X Shipping X X X X X X X X Reverse X X X X X X X
□ □ □ □ □ □
Who is responsible for your international shipping? (Multiple choice)
□ Postal parcel □ International express □ Shipping agents □ Self-operation □ Others________
Which criteria are used to select your partners (logistics service provider)? (Multiple choice)
□ Global operational abilities □ Relationship building and integration competencies □ Quality and reliability
□ Service performance □ Information technology □ Flexibility and compatibility □ Geographical location
□ Financial measures □ Sustainability measures □ Management and organization □ Cost/price
□ Others______________
Personal info:
What is your job title? (Choose the closest)
□ General Manager □ Member of the Board □ Department Manager □ Team Manager □ Team Member
Where would you position your job responsibilities in your company?
□ General Management □ Procurement □ Sales & Marketing □ Operation
□ Production and R&D □ Logistics □ Human Resources □ Others______________
How long have you been working in this area? (Number of years) ______________________________
If you are interested in the results of this online survey, please type your e-mail address.
_______________________________________________________________________________________________
If you are interested in a further interview of experts, you can enter your contact details in the following line.
________________________________________________________________________________________________
Additional
What is the biggest challenge in today’s CBE logistics operations?
Any comments on how to improve the efficiency of the logistics system in CBE?

181
Appendix 3. General Information of Case Enterprises in Survey
Country Case No. Industry Type Main product
GERMANY 1 Retailer Click&Mortar Beauty and personal care GERMANY 2 Retailer Click&Mortar Consumer Electronics GERMANY 3 Retailer Self-operation e-retailer Fashion GERMANY 4 Retailer Integrated e-retailer Groceries GERMANY 5 Retailer Self-operation e-retailer Consumer Electronics GERMANY 6 Retailer Click&Mortar Fashion GERMANY 7 Retailer Integrated e-retailer Consumer Electronics GERMANY 8 Retailer Integrated e-retailer Fashion GERMANY 9 Retailer Self-operation e-retailer Beauty and personal care GERMANY 10 Retailer E-marketplace Consumer Electronics GERMANY 11 Retailer Click&Mortar Fashion GERMANY 1 Manufacturer Household and consumer appliances GERMANY 12 Retailer Self-operation e-retailer Fashion GERMANY 13 Retailer Click&Mortar Fashion GERMANY 14 Retailer Self-operation e-retailer Housewares and home furnishings GERMANY 15 Retailer Click&Mortar Housewares and home furnishings GERMANY 16 Retailer E-marketplace Housewares and home furnishings GERMANY 17 Retailer Integrated e-retailer Fashion GERMANY 18 Retailer Self-operation e-retailer Groceries GERMANY 19 Retailer Click&Mortar Beauty and personal care GERMANY 20 Retailer Click&Mortar Consumer Electronics GERMANY 21 Retailer E-marketplace Fashion
CHINA 1 Retailer Click&Mortar Beauty and personal care CHINA 2 Retailer E-marketplace Fashion CHINA 1 Manufacturer Household and consumer appliances CHINA 2 Manufacturer Housewares and home furnishings CHINA 3 Retailer Integrated e-retailer Beauty and personal care CHINA 4 Retailer Self-operation e-retailer Toys and baby products CHINA 5 Retailer Self-operation e-retailer Housewares and home furnishings CHINA 6 Retailer Self-operation e-retailer Toys and baby products CHINA 7 Retailer Click&Mortar Beauty and personal care CHINA 8 Retailer Click&Mortar Groceries CHINA 3 Manufacturer Beauty and personal care CHINA 9 Retailer Integrated e-retailer Groceries CHINA 10 Retailer E-marketplace Fashion CHINA 11 Retailer Self-operation e-retailer OTC drugs and dietary supplements CHINA 12 Retailer Self-operation e-retailer Toys and baby products

182
Country Case No. Industry Type Main product
CHINA 13 Retailer Integrated e-retailer Consumer Electronics CHINA 14 Retailer Integrated e-retailer Beauty and personal care CHINA 4 Manufacturer Fashion CHINA 15 Retailer E-marketplace Groceries CHINA 5 Manufacturer Household and consumer appliances CHINA 16 Retailer Self-operation e-retailer Fashion CHINA 17 Retailer Self-operation e-retailer Fashion CHINA 18 Retailer Integrated e-retailer Books CHINA 19 Retailer Integrated e-retailer Groceries CHINA 20 Retailer Click&Mortar Toys and baby products CHINA 21 Retailer Integrated e-retailer Toys and baby products CHINA 22 Retailer Click&Mortar Beauty and personal care CHINA 23 Retailer Self-operation e-retailer Beauty and personal care CHINA 24 Retailer Integrated e-retailer Housewares and home furnishings CHINA 25 Retailer Integrated e-retailer Housewares and home furnishings CHINA 26 Retailer Click&Mortar Groceries CHINA 27 Retailer Self-operation e-retailer Beauty and personal care CHINA 28 Retailer Click&Mortar Beauty and personal care CHINA 29 Retailer Self-operation e-retailer Beauty and personal care CHINA 30 Retailer Click&Mortar OTC drugs and dietary supplements CHINA 31 Retailer Click&Mortar Housewares and home furnishings CHINA 32 Retailer Click&Mortar Beauty and personal care CHINA 33 Retailer Click&Mortar Fashion CHINA 34 Retailer Click&Mortar Toys and baby products CHINA 35 Retailer Integrated e-retailer Groceries CHINA 36 Retailer E-marketplace Groceries CHINA 37 Retailer Integrated e-retailer Fashion CHINA 38 Retailer E-marketplace Toys and baby products CHINA 39 Retailer Integrated e-retailer Consumer Electronics CHINA 40 Retailer Self-operation e-retailer Beauty and personal care CHINA 41 Retailer E-marketplace OTC drugs and dietary supplements CHINA 42 Retailer Integrated e-retailer Toys and baby products CHINA 43 Retailer Integrated e-retailer Toys and baby products CHINA 44 Retailer E-marketplace Toys and baby products
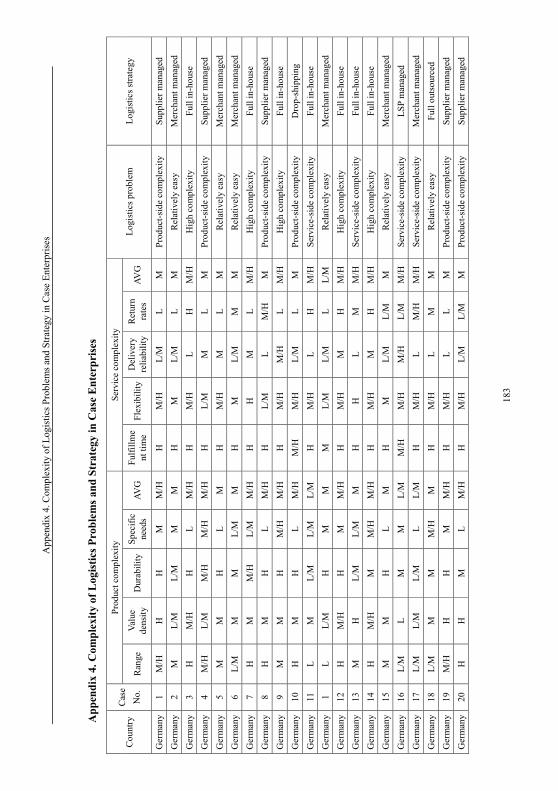
App
endi
x 4.
Com
plex
ity o
f Log
istic
s Pro
blem
s and
Stra
tegy
in C
ase
Ente
rpris
es
18
3
App
endi
x 4.
Com
plex
ity o
f Log
istic
s Pro
blem
s and
Str
ateg
y in
Cas
e E
nter
p ris
es
Cou
ntry
C
ase
No.
Prod
uct c
o mpl
exity
Se
rvic
e co
mpl
e xity
Logi
stic
s pro
blem
Lo
gist
ics s
trate
gy
Ran
ge
Valu
e de
nsity
D
urab
ility
Sp
ecifi
c ne
eds
AVG
Fu
lfillm
ent
tim
e Fl
exib
ility
D
eliv
ery
relia
bilit
y R
etur
n ra
tes
AVG
Ger
man
y 1
M/H
H
H
M
M
/H
H
M/H
L/
M
L M
Pr
oduc
t-sid
e co
mpl
exity
Su
pplie
r ma n
aged
Ger
man
y 2
M
L/M
L/
M
M
M
H
M
L/M
L
M
Rel
ativ
ely
easy
M
erch
ant m
anag
ed
Ger
man
y 3
H
M/H
H
L
M/H
H
M
/H
L H
M
/H
Hig
h co
mpl
exity
Fu
ll in
-hou
se
Ger
man
y 4
M/H
L/
M
M/H
M
/H
M/H
H
L/
M
M
L M
Pr
oduc
t-sid
e co
mpl
exity
Su
pplie
r man
aged
Ger
man
y 5
M
M
H
L M
H
M
/H
M
L M
R
elat
ivel
y ea
sy
Mer
chan
t ma n
aged
Ger
man
y 6
L/M
M
M
L/
M
M
H
M
L/M
M
M
R
elat
ivel
y ea
sy
Mer
chan
t ma n
aged
Ger
man
y 7
H
M
M/H
L/
M
M/H
H
H
M
L
M/H
H
igh
com
plex
ity
Full
in-h
ouse
Ger
man
y 8
H
M
H
L M
/H
H
L/M
L
M/H
M
Pr
oduc
t-sid
e co
mpl
exity
Su
pplie
r ma n
aged
Ger
man
y 9
M
M
H
M/H
M
/H
H
M/H
M
/H
L M
/H
Hig
h co
mpl
exity
Fu
ll in
-hou
se
Ger
man
y 10
H
M
H
L
M/H
M
/H
M/H
L/
M
L M
Pr
oduc
t-sid
e co
mpl
exity
D
rop-
ship
ping
Ger
man
y 11
L
M
L/M
L/
M
L/M
H
M
/H
L H
M
/H
Serv
ice-
side
com
ple x
ity
Full
in-h
ouse
Ger
man
y 1
L L/
M
H
M
M
M
L/M
L/
M
L L/
M
Rel
ativ
ely
easy
M
erch
ant m
anag
ed
Ger
man
y 12
H
M
/H
H
M
M/H
H
M
/H
M
H
M/H
H
igh
com
plex
ity
Full
in-h
ouse
Ger
man
y 13
M
H
L/
M
L/M
M
H
H
L
M
M/H
Se
rvic
e-si
de c
ompl
e xity
Fu
ll in
-hou
se
Ger
man
y 14
H
M
/H
M
M/H
M
/H
H
M/H
M
H
M
/H
Hig
h co
mpl
exity
Fu
ll in
-hou
se
Ger
man
y 15
M
M
H
L
M
H
M
L/M
L/
M
M
Rel
ativ
ely
easy
M
erch
ant m
a nag
ed
Ger
man
y 16
L/
M
L M
M
L/
M
M/H
M
/H
M/H
L/
M
M/H
Se
rvic
e-si
de c
ompl
e xity
LS
P m
anag
ed
Ger
man
y 17
L/
M
L/M
L/
M
L L/
M
H
M/H
L
M/H
M
/H
Serv
ice-
side
com
ple x
ity
Mer
chan
t ma n
aged
Ger
man
y 18
L/
M
M
M
M/H
M
H
M
/H
L M
M
R
elat
ivel
y ea
sy
Full
outs
our c
ed
Ger
man
y 19
M
/H
H
H
M
M/H
H
M
/H
L L
M
Prod
uct-s
ide
com
plex
ity
Supp
lier m
a nag
ed
Ger
man
y 20
H
H
M
L
M/H
H
M
/H
L/M
L/
M
M
Prod
uct-s
ide
com
plex
ity
Supp
lier m
a nag
ed

App
endi
x 4.
Com
plex
ity o
f Log
istic
s Pro
blem
s and
Stra
tegy
in C
ase
Ente
rpris
es
18
4
Ger
man
y 21
M
L/
M
M
L/M
M
H
M
H
M
/H
M/H
Se
rvic
e-si
de c
ompl
exity
LS
P m
anag
ed
Chi
na
1 L/
M
L M
/H
M/H
M
M
M
L/
M
L/M
L/
M
Rel
ativ
ely
easy
Su
pplie
r ma n
aged
Chi
na
2 H
H
L
M
M/H
H
M
/H
L L
M
Prod
uct-s
ide
com
plex
ity
Dro
p-sh
ippi
ng
Chi
na
1 L/
M
M/H
L
M
M
M/H
M
L
L L/
M
Rel
ativ
ely
easy
M
erch
ant m
a nag
ed
Chi
na
2 L
L M
L
L/M
H
H
L
L M
R
elat
ivel
y ea
sy
Full
in-h
ouse
Chi
na
3 L/
M
M
L/M
H
M
M
/H
M/H
L/
M
M
M
Rel
ativ
ely
easy
Su
pplie
r ma n
aged
Chi
na
4 M
L/
M
L/M
M
/H
M
H
M/H
M
/H
L/M
M
/H
Serv
ice-
side
com
ple x
ity
Full
in-h
ouse
Chi
na
5 L
M
L/M
H
M
H
M
/H
M/H
L/
M
M/H
Se
rvic
e-si
de c
ompl
exity
Fu
ll in
-hou
se
Chi
na
6 M
/H
M/H
L/
M
M
M
H
M/H
M
/H
L M
/H
Serv
ice-
side
com
ple x
ity
Full
in-h
ouse
Chi
na
7 M
M
L/
M
L L/
M
H
M
M
L M
R
elat
ivel
y ea
sy
Full
in-h
ouse
Chi
na
8 M
L/
M
M
M/H
M
H
L
M/H
L
M
Rel
ativ
ely
easy
Fu
ll ou
tsou
r ced
Chi
na
3 M
/H
H
L M
M
H
M
H
L
M/H
Se
rvic
e-si
de c
ompl
e xity
M
erch
ant m
a nag
ed
Chi
na
9 M
M
H
H
M
/H
H
M/H
H
L
M/H
H
igh
com
plex
ity
Mer
chan
t ma n
aged
Chi
na
10
M/H
H
L/
M
M
M/H
M
/H
M
H
M
M/H
H
igh
com
plex
ity
LSP
man
aged
Chi
na
11
L/M
M
L
L L/
M
M/H
M
M
/H
L M
R
elat
ivel
y ea
sy
Mer
chan
t ma n
aged
Chi
na
12
L L/
M
L/M
L/
M
L/M
H
H
H
L
M/H
Se
rvic
e-si
de c
ompl
e xity
M
erch
ant m
a nag
ed
Chi
na
13
L H
L
L/M
L/
M
M
L/M
M
/H
L/M
M
R
elat
ivel
y ea
sy
Mer
chan
t ma n
aged
Chi
na
14
L/M
M
M
M
/H
M
M/H
M
M
/H
L M
R
elat
ivel
y ea
sy
Supp
lier m
a nag
ed
Chi
na
4 M
M
M
/H
L M
H
M
H
M
M
/H
Serv
ice-
side
com
ple x
ity
Mer
chan
t ma n
aged
Chi
na
15
M
L H
H
M
/H
H
L L/
M
L L/
M
Prod
uct-s
ide
com
plex
ity
Dro
p-sh
ippi
ng
Chi
na
5 L
L/M
M
M
L/
M
M/H
L/
M
M/H
L/
M
M
Rel
ativ
ely
easy
Fu
ll in
-hou
se
Chi
na
16
L H
L
L/M
L/
M
H
M
M
L M
R
elat
ivel
y ea
sy
Mer
chan
t ma n
aged
Chi
na
17
M/H
M
/H
M/H
M
/H
M/H
L/
M
M/H
M
/H
M/H
M
/H
Hig
h co
mpl
exity
M
erch
ant m
a nag
ed
Chi
na
18
L L/
M
L/M
L/
M
L/M
H
L/
M
H
L M
R
elat
ivel
y ea
sy
Mer
chan
t ma n
aged
Chi
na
19
M/H
M
/H
L/M
H
M
/H
H
M/H
H
L/
M
M/H
H
igh
com
plex
ity
Mer
chan
t ma n
aged

App
endi
x 4.
Com
plex
ity o
f Log
istic
s Pro
blem
s and
Stra
tegy
in C
ase
Ente
rpris
es
18
5
Chi
na
20
L/M
M
L/
M
M/H
M
H
M
H
L
M/H
Se
rvic
e-si
de c
ompl
exity
M
erch
ant m
anag
ed
Chi
na
21
M
M
M
H
M/H
M
H
M
/H
L/M
M
/H
Hig
h co
mpl
exity
M
erch
ant m
a nag
ed
Chi
na
22
L M
L/
M
L/M
L/
M
M/H
L/
M
L L/
M
L/M
R
elat
ivel
y ea
sy
Mer
chan
t ma n
aged
Chi
na
23
L M
/H
H
L/M
M
M
/H
H
H
L M
/H
Serv
ice-
side
com
plex
ity
Mer
chan
t ma n
aged
Chi
na
24
M
M
L/M
M
M
M
L/
M
M
L L/
M
Rel
ativ
ely
easy
M
erch
ant m
a nag
ed
Chi
na
25
L L
L L/
M
L H
L/
M
M/H
L/
M
M
Rel
ativ
ely
easy
M
erch
ant m
a nag
ed
Chi
na
26
M/H
M
L/
M
M
M
M/H
M
M
/H
L/M
M
R
elat
ivel
y ea
sy
Mer
chan
t ma n
aged
Chi
na
27
L/M
L
L/M
M
/H
L/M
H
M
L/
M
L M
R
elat
ivel
y ea
sy
Mer
chan
t man
aged
Chi
na
28
L/M
M
L/
M
M/H
M
M
/H
M/H
M
/H
L M
R
elat
ivel
y ea
sy
Full
in-h
ouse
Chi
na
29
L M
L/
M
M
L/M
H
M
/H
H
L M
/H
Serv
ice-
side
com
ple x
ity
Mer
chan
t ma n
aged
Chi
na
30
L M
M
L/
M
L/M
L/
M
M/H
M
/H
L M
R
elat
ivel
y ea
sy
Mer
chan
t ma n
aged
Chi
na
31
L L
L L
L L/
M
L H
L
L/M
R
elat
ivel
y ea
sy
Full
in-h
ouse
Chi
na
32
L/M
L
L/M
M
L/
M
H
M
H
L M
/H
Serv
ice-
side
com
ple x
ity
Full
in-h
ouse
Chi
na
33
H
H
L L
M
H
M
M/H
L
M
Rel
ativ
ely
easy
Su
pplie
r man
aged
Chi
na
34
L M
/H
L/M
M
/H
M
H
M/H
H
L
M/H
Se
rvic
e-si
de c
ompl
e xity
M
erch
ant m
a nag
ed
Chi
na
35
M/H
M
L/
M
L M
M
M
M
L
M
Rel
ativ
ely
easy
Su
pplie
r ma n
aged
Chi
na
36
H
M
L/M
M
/H
M/H
H
M
/H
H
L M
/H
Hig
h co
mpl
exity
LS
P m
anag
ed
Chi
na
37
L M
H
L
M
H
L H
L
M
Rel
ativ
ely
easy
M
erch
ant m
anag
ed
Chi
na
38
M/H
M
M
M
M
H
M
/H
H
L M
/H
Serv
ice-
side
com
ple x
ity
LSP
man
aged
Chi
na
39
H
M/H
M
M
M
/H
M
M
M
L/M
M
Pr
oduc
t-sid
e co
mpl
exity
Su
pplie
r man
aged
Chi
na
40
M/H
M
/H
L M
M
M
/H
L/M
H
L
M
Rel
ativ
ely
easy
M
erch
ant m
a nag
ed
Chi
na
41
L/M
M
/H
M
L/M
M
H
M
H
L
M/H
Se
rvic
e-si
de c
ompl
e xity
LS
P m
anag
ed
Chi
na
42
L M
H
H
M
/H
H
H
H
L M
/H
Hig
h co
mpl
exity
M
erch
ant m
a nag
ed
Chi
na
6 L
L L/
M
M
L/M
H
H
H
L
M/H
Se
rvic
e-si
de c
ompl
e xity
M
erch
ant m
a nag
ed
Chi
na
43
M
M
M
L/M
M
M
/H
H
H
L M
/H
Serv
ice-
side
com
ple x
ity
LSP
man
aged

186
Acknowledgement
The completion of thesis is attributed to many people’s patient guidance and constant
encouragement. It is the result of all joint efforts and would have been a far more pallid
thing without the generosity and support from many members. I would like to express
my gratitude to all those who help me in many ways during the writing of this thesis.
First of all, I want to extend my heartfelt gratitude to my supervisors, Professor Huo
Jiazhen in Tongji University and Professor Frank Straube in Technischen Universität
Berlin, whose conscientious academic spirit and modest, open-minded personality
inspire me both in academic study and daily life. Without their enlightening suggestions
and instructions, it would be a tough task for me to finish this thesis.
Also, I am deeply indebted to all the other tutors and teachers in both of Universities
that greatly broadened my horizon and enriched my knowledge in my study. Their
inspirational and conscientious teaching has provided me with a solid foundation to
accomplish this paper and will always be of great value for my future career and
academic research.
I own my heartfelt thanks to my friends, especially those in Germany. For the past two
years’ study in Berlin, I really had a fulfilling life here. Not only have I met many
knowledgeable colleagues, but also truthful friends. Their persistent encouragement,
gives me much help and advice during the whole process of my writing.
Sincerely thanks to the experts who participated in my survey and interview, especially
those in Walmart and Jingdon, who have put considerable time and effort into their
comments on the draft, which has made my accomplishments possible. My gratitude
also goes to the authors and scholars whose books and articles have enlightened me in
the entire process of finishing thesis.
Last but not least, I would like to express deep thanks to my beloved family for their
generous love, support and patience. My parents whose care and understanding make
me want to be a better person. My parents-in-law, whose all kinds of practical help and
great confidence motivate me to move on. To my wife I am most indebted for her
continuous encouragement and loving considerations towards my study for these years.
They are a firm basis for the composing of this thesis. I love them forever.

Schriftenreihe Logistik der Technischen Universität Berlin Hrsg.: Frank Straube, Raimund Klinkner, Helmut Baumgarten ISSN 1865-3170 (print) ISSN 2197-0564 (online)
01: Mayer, Axel: Modularisierung der Logistik. Ein Gestaltungsmodell zum Management von Komplexität in der industriellen Logistik. - 2007. - XVIII, 264 S., zahlr. Abb. ISBN 978-3-7983-2054-3 vergriffen
02: Thom, Alexander: Entwicklung eines Gestal-tungsmodells zum Management von Risiken in Produktionsnetzwerken. Ein Beitrag zum Risikomanagement in der Logistik. - 2008. - XX, 239 S., zahlr. Abb. ISBN 978-3-7983-2975-8 EUR 5,00
03: Bogatu, Christian: Smartcontainer als Ant-wort auf logistische und sicherheitsrelevante Herausforderungen in der Lieferkette. Aus-wirkungen und Handlungs-empfehlungen für die Wertschöpfungskette der Logistik. - 2008. - XXIV, 286 S., zahlr. Abb. ISBN 978-3-7983-2074-1 EUR 5,00
04: Beckmann, Thomas: Emerging Market Sourcing. Eine empirische Untersuchung zu Erfolgsfaktoren in der Beschaffung aus Wachs-tumsmärkten. - 2008. -XI, 221 S. ISBN 978-3-7983-2096-3 EUR 5,00
05: Dietman, Nils von: Airport Performance Measurement. Kennzahlensystem zur Analyse und Bewertung von Flughafenprozessen. - 2008. - XXI, 204 S., zahlr. Abb. u. Tab. ISBN 978-3-7983-2103-8 EUR 5,00
06: Hildebrand, Wolf-Christian: Management von Transportnetzwerken im containerisierten Seehafenhinterlandverkehr. - 2008. - XVI, 234 S., zahlr. Abb. ISBN 978-3-7983-2102-1 EUR 5,00
07: Wilmking, Niklas: Logistikmanagement in China. Eine empirische Untersuchung zur Stra-tegieentwicklung von Logistikdienstleistern. - 2009. - VIII, 247 S., zahlr. Abb. ISBN 978-3-7983-2130-4 EUR 5,00
08: Vogeler, Stefan: Entwicklung eines Vor-gehensmodells zur Implementierung der RFID-Technologie in logistischen Systemen am Beispiel der Bekleidungswirtschaft. - 2009. - XI, 227 S., zahlr. Abb. ISBN 978-3-7983-2156-4 EUR 5,00
09: Doch, Stefan Alexander: Logistische Leistungsdifferenzierung im Supply Chain Management. Theoretische und empirische Entwicklung eines Gestaltungsansatzes für die Differenzierung der logistischen Leistungser-stellung produzierender Unternehmen zur Erfüllung individueller Kundenwünsche. - 2009. - X, 271 S., zahlr. Abb. ISBN 978-3-7983-2157-1 vergriffen
10: Bensel, Philipp: Geschäftsmodelle von Logistikdienstleistern im Umfeld des Ubiquitous Computing. - 2009. - XIV, 247 S. ISBN 978-3-7983-2166-3 EUR 5,00
11: Bohn, Michael: Logistik im Kontext des ausländischen Markteintritts. Entwicklung von Gestaltungsempfehlungen für den auslän-dischen Markteintritt unter besonderer Berück-sichtigung der Erfolgskomponente Logistik. - 2009. - XVIII, 334 S., zahlr. Abb. u. Tab. ISBN 978-3-7983-2179-3 EUR 5,00
12: Sommer-Dittrich, Thomas: Wandlungs-fähige Logistiksysteme in einer nachhaltigen Kreislaufwirtschaft. - 2010. - 215 S., zahlr. Abb. u. Tab. ISBN 978-3-7983-2200-4 EUR 5,00
13: Kerner, Jürgen Andreas: Beschaffung im Eigenmarkengeschäft des Bekleidungshandels. Ein theoretischer und fallstudienbasierter Beitrag zur Lösung ausgewählter Probleme der Prozess-planung. - 2010. - XX, 207 S.. ISBN 978-3-7983-2212-7 EUR 5,00
14: Fürstenberg, Frank: Der Beitrag service-orientierter IT-Architekturen zu integrierten Kontraktlogistikdienstleistungen. - 2010. - XVIII, 244 S., zahlr. Abb. ISBN 978-3-7983-2227-1 EUR 5,00
15: Fendt, Thomas: Introducing Electronic Supply Chain Collaboration in China – Evidence from Manufacturing Industries. - 2010. - XII, 219, 53 S., Anh. ISBN 978-3-7983-2243-1 EUR 5,00

16: Franke, Peter D.: Internationalisierung der Kontraktlogistik. Entwicklung eines Instrumen-tariums zur Länderselektion. - 2011. - XV, 217 S., zahlr. Abb. u. Tab.
ISBN 978-3-7983-2296-7 EUR 5,00
17: Tentrop, Friedrich: Entwicklung eines inte-grierten Gestaltungsansatzes der Produktions-logistik. - 2011. - XV, 227 S., zahlr. Abb.
ISBN 978-3-7983-2317-9 EUR 5,00 18: Nagel, Arnfried: Logistik im Kontext der
Nachhaltigkeit. Ökologische Nachhaltigkeit als Zielgröße bei der Gestaltung logistischer Netz-werke. - 2011. - XV, 228 S., zahlr. Abb. u. Tab.
ISBN 978-3-7983-2383-4 EUR 5,00 19: Grig, Roman: Governance-Strukturen in
der maritimen Transportkette. Agentenbasierte Modellierung des Akteursverhaltens im Extended Gate. - 2012. - XVI, 373 S.
ISBN 978-3-7983-2384-1 EUR 5,00
20: Keßler, Martin: Gestaltung von Logistik-netzwerken für die humanitäre Versorgung in Entwicklungsländern Afrikas. - 2012. - XIV, 355 S. ISBN 978-3-7983-2426-8 (print) EUR 5,00 ISBN 978-3-7983-2427-5 (online)
21: Schwarz, Jennifer Rebecca: Humanitäre Logistik für die Versorgungsproblematik in Subsahara-Afrika. Aufbau von Logistikkapa-zität durch Wissenstransfer. - 2012. - XVIII, 336 S. ISBN 978-3-7983-2444-2 (print) EUR 5,00 ISBN 978-3-7983-2445-9 (online)
22: Rief, Daniel: Markteintritt in China. Flexibilität und Integration als Erfolgsfaktoren in einer dynamischen und komplexen Markt-umgebung. - 2013. - XIX, 235 S.
ISBN 978-3-7983-2482-4 EUR 20,90
23: Richter, Markus: Nutzenoptimierter RFID-Einsatz in der Logistik. Eine Handlungsem- pfehlung zur Lokalisierung und Bewertung der Nutzenpotenziale von RFID-Anwendungen. - 2013. - XIX, 235 S.
ISBN 978-3-7983-2523-4 (print) EUR 21,90 ISBN 978-3-7983-2524-1 (online) 24: Huynh, Thu Hang: Beitrag zur Systematisie-
rung von Theorien in der Logistik. - 2013. - XVII, 429 S.
ISBN 978-3-7983-2610-1 (print) EUR 21,90 ISBN 978-3-7983-2611-8 (online)
25: Fontius, Jörn: Megatrends und Ihre Implikationen für die Logsitik. Ableitung von Wirkungszusammenhängen. - 2013. - XVII, 217 S.
ISBN 978-3-7983-2634-7 (print) EUR 12,50 ISBN 978-3-7983-2635-4 (online) 26: Ouyeder, Ouelid: Strategien für eine nach-
haltige Lieferantenentwicklung für die Be-schaffung aus Emerging Markets. - 2013. - X, 279 S.
ISBN 978-3-7983-2658-3 EUR 21,50 27: Steffens, Anja: Logistische Wandlungs-
befähiger. Entwicklung eines kontextbasierten Gestaltungsmodells für die industrielle Logistik. - 2014. - XIII, 284 S.
ISBN 978-3-7983-2682-8 EUR 15,50 28: Siegmann, Julian B.: Prozessinnovationen
bei Logistikdienstleistungsunternehmen. - 2015. - xxxviii, 245 S.
ISBN 978-3-7983-2737-5 (print) EUR 15,50 ISBN 978-3-7983-2738-2 (online)
29: Keitel, Sebastian: Auswirkungen disaggre-
gierter Regulierung auf die Kapazität von Verkehrssektoren. Eine wettbewerbstheoretische und empirische Untersuchung am Beispiel des Luftverkehrssektors. - 2015. - IX, 252 S.
ISBN 978-3-7983-2749-8 (print) EUR 15,50 ISBN 978-3-7983-2750-4 (online) 30: Campos, Juliana Kucht: Integrated Frame-
work for Managing Sustainable Supply Chain Practices. - 2015. - xii, 121 S.
ISBN 978-3-7983-2783-2 (print) EUR 10,50 ISBN 978-3-7983-2784-9 (online) 31: Spiegel, Timo U.:Technologieorientiertes
Service Engineering in der Kontraktlogistik. Konzeption eines Gestaltungsmodells für die systematische Entwicklung technologiebasierter Logistikdienstleistungen. - 2016. - x, 295 S.
ISBN 978-3-7983-2807-5 (print) EUR 15,50 ISBN 978-3-7983-2808-2 (online)
32: Figiel, Anna: Transportmanagement in der
schnelldrehenden Konsumgüterindustrie. Entwicklung eines Gestaltungsansatzes zur Integration von Transport und Logistik. - 2016. - XVIII, 227 S.
ISBN 978-3-7983-2816-7 (print) EUR 14,50 ISBN 978-3-7983-2817-4 (online)

33: Durach, Christian F.: A Theoretical and Practical Contribution to Supply Chain Robustness. Developing a Schema for Robustness in Dyads. - 2016. - viii, 183 S. ISBN 978-3-7983-2812-9 (print) EUR 13,50 ISBN 978-3-7983-2813-6 (online)
34: Blome, Hendrik: Logistische Optionen für eine nachhaltige Versorgung von Subsahara-Afrika. Ein Beitrag zur Humanitären Logistik. - 2016. - XVII, 315 S. ISBN 978-3-7983-2840-2 (print) EUR 16,50 ISBN 978-3-7983-2841-9 (online)
35: Kucht Campos, Juliana: A methodology for planning sustainable supply chain initiatives. - 2016. - xviii, 326 S. ISBN 978-3-7983-2860-0 (print) EUR 16,50 ISBN 978-3-7983-2861-7 (online)
36: Wutke, Sebastian: Entwicklung eines Gestal-tungsmodells zur Berücksichtigung von Nach-haltigkeit bei der Ausschreibung und Vergabe logistischer Leistungen im Straßengüter-verkehr. - 2017. - X, 299 S. ISBN 978-3-7983-2862-4 (print) EUR 15,50 ISBN 978-3-7983-2863-1 (online)
37: Schöder, Dustin: Technisch-wirtschaftliche Bewertung des Einsatzes von batterieelektri-schen Nutzfahrzeugen in der Distribution von Konsumgütern. - 2017. - XV, 287 S. ISBN 978-3-7983-2920-1 (print) EUR 15,50 ISBN 978-3-7983-2921-8 (online)
38: Roy, Daniel Thomas: Industrie 4.0 – Gestal-tung cyber-physischer Logistiksysteme zur Unterstützung des Logistikmanagements in der Smart Factory. - 2017. - XVI, 204 S. ISBN 978-3-7983-2944-7 (print) EUR 14,50 ISBN 978-3-7983-2945-4 (online)

Dev
elop
ing
E-co
mm
erce
Log
istic
s in
Cros
s-bo
rder
Rel
ation
Universitätsverlag der TU Berlin
Universitätsverlag der TU Berlin
ISBN 978-3-7983-2972-0 (print)ISBN 978-3-7983-2973-7 (online)
Schriftenreihe Logistik der Technischen Universität Berlin Band 39
Through a structured literature review and an exploratory factor analysis, this thesis presents a conceptual framework with 6 key factors composed of 19 indicators, including government, consu-mer, company, product, operation and partnership, which affecting the development of e-logistics in cross-border relation. Then, a comprehensive competitive strategy is generated based on the framework, including government policy, logistics strategy selection, differentiated product, dual-channel inventory and transport. Finally, Walmart and JD.com in China market are chosen as case study, the development of their cross-border e-logistics strategy verify the rationality and applica-bility of the framework found in this thesis.
Fe
ng D
ing
39
Developing E-commerce Logistics in Cross-border Relation
9 783798 329720I S B N 9 7 8 - 3 - 7 9 8 3 - 2 9 7 2 - 0 http://verlag.tu-berlin.de
Feng Ding
Developing E-commerce Logistics in Cross-border Relation
Hrsg.: Frank Straube, Helmut Baumgarten, Raimund Klinkner
Umschlag_Logistik_39_Entwurf.indd 1 10.04.2018 08:24:43