school of fusion reactor technology erice, july 26th - august 1st 2004 a low carbon economy sergio...
Post on 19-Dec-2015
216 views
TRANSCRIPT

School of Fusion Reactor Technology Erice, July 26th - August 1st 2004
A LOW CARBON ECONOMY
SERGIO LA MOTTA
ENEA
CLIMATE PROJECT

School of Fusion Reactor Technology Erice, July 26th - August 1st 2004
OUTLINE
• MOTIVATIONS FOR MOVING TOWARDS A LOW CARBON ECONOMY;
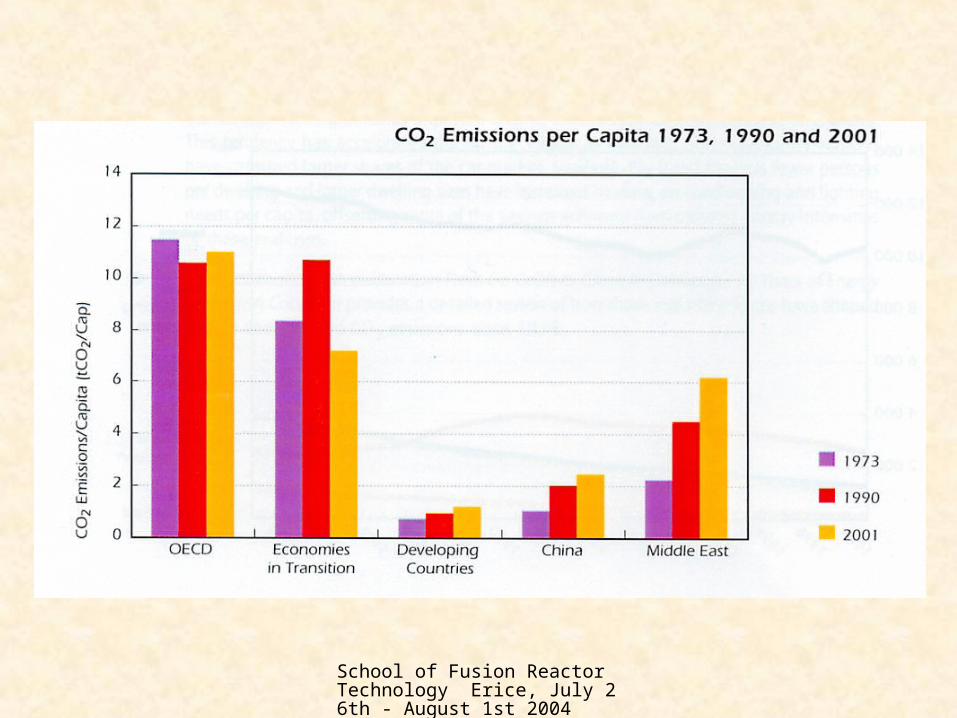
• ENERGY AND CO2 EMISSIONS STATISTICS (WHERE ARE WE NOW?);
• CO2 EMISSIONS DRIVING FORCES;• IPCC REFERENCE SCENARIOS (WHERE ARE
WE LIKELY TO GO?);• IPCC CO2 CONCENTRATION STABILIZATION
SCENARIOS (WHERE SHOULD WE GO?);• CONCLUSIONS.
School of Fusion Reactor Technology Erice, July 26th - August 1st 2004
WHERE THERE IS A WILL THERE IS A WAY!
WHY GOING TOWARDS A LOW CARBON ECONOMY?
School of Fusion Reactor Technology Erice, July 26th - August 1st 2004
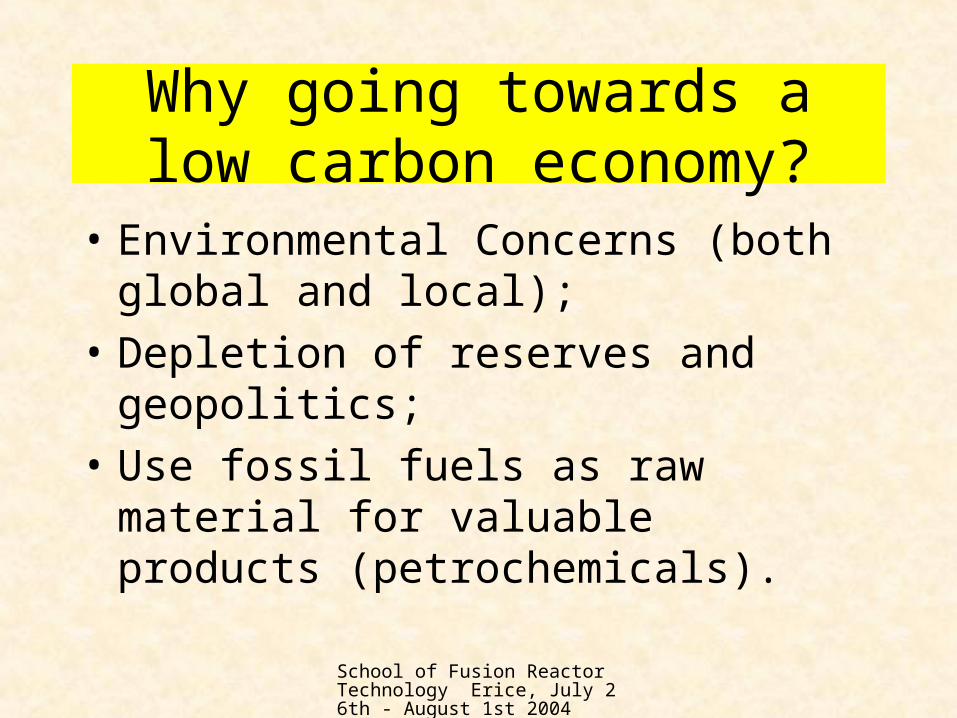
Why going towards a low carbon economy?
• Environmental Concerns (both global and local);
• Depletion of reserves and geopolitics;
• Use fossil fuels as raw material for valuable products (petrochemicals).
School of Fusion Reactor Technology Erice, July 26th - August 1st 2004
School of Fusion Reactor Technology Erice, July 26th - August 1st 2004
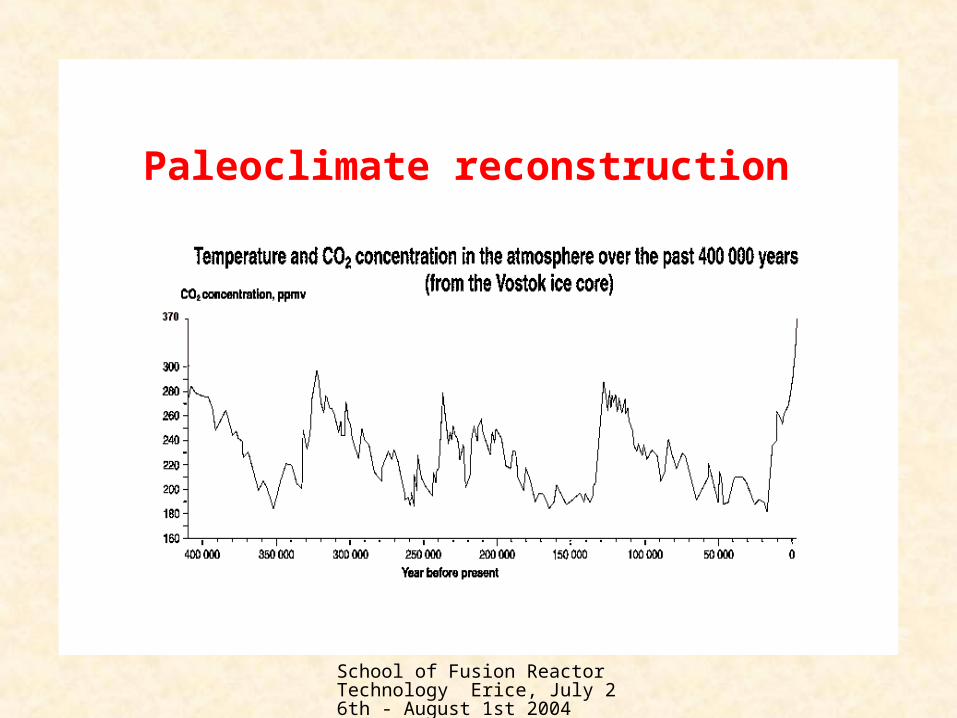
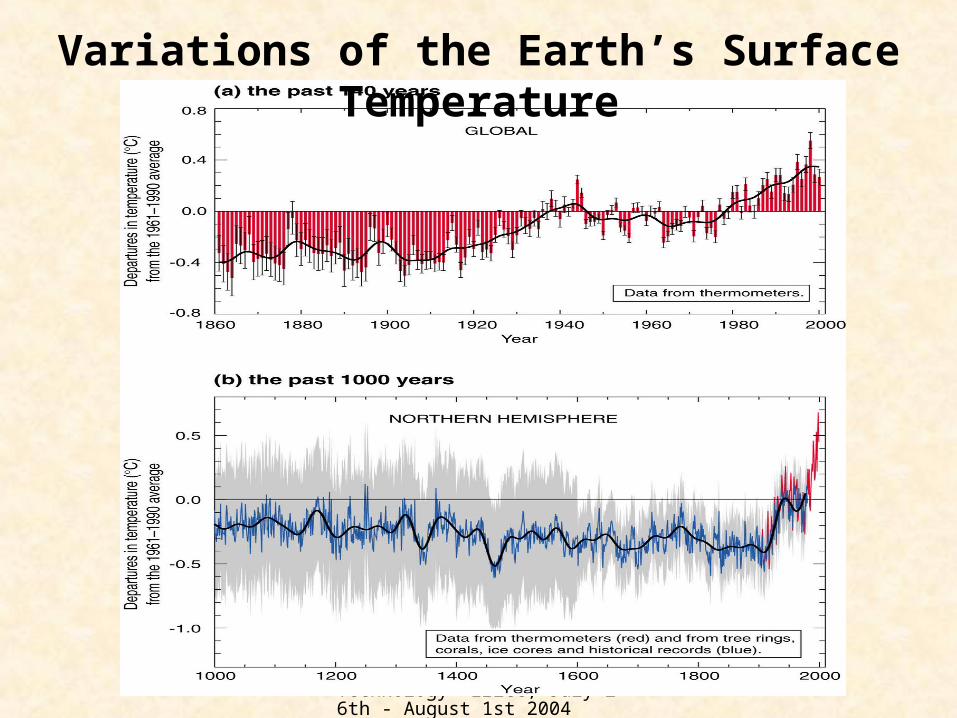
Paleoclimate reconstruction

School of Fusion Reactor Technology Erice, July 26th - August 1st 2004
Paleoclimate reconstruction
School of Fusion Reactor Technology Erice, July 26th - August 1st 2004
Variations of the Earth’s Surface Temperature

School of Fusion Reactor Technology Erice, July 26th - August 1st 2004
UNFCCC: art. 2
The ultimate objective of the Convention is to achieve stabilization of GHG concentration in the atmosphere at a level that should prevent dangerous anthropogenic interference with the climate system. Such a level should achieved in a timeframe sufficient to allow ecosystems to adapt naturally to climate change.
School of Fusion Reactor Technology Erice, July 26th - August 1st 2004
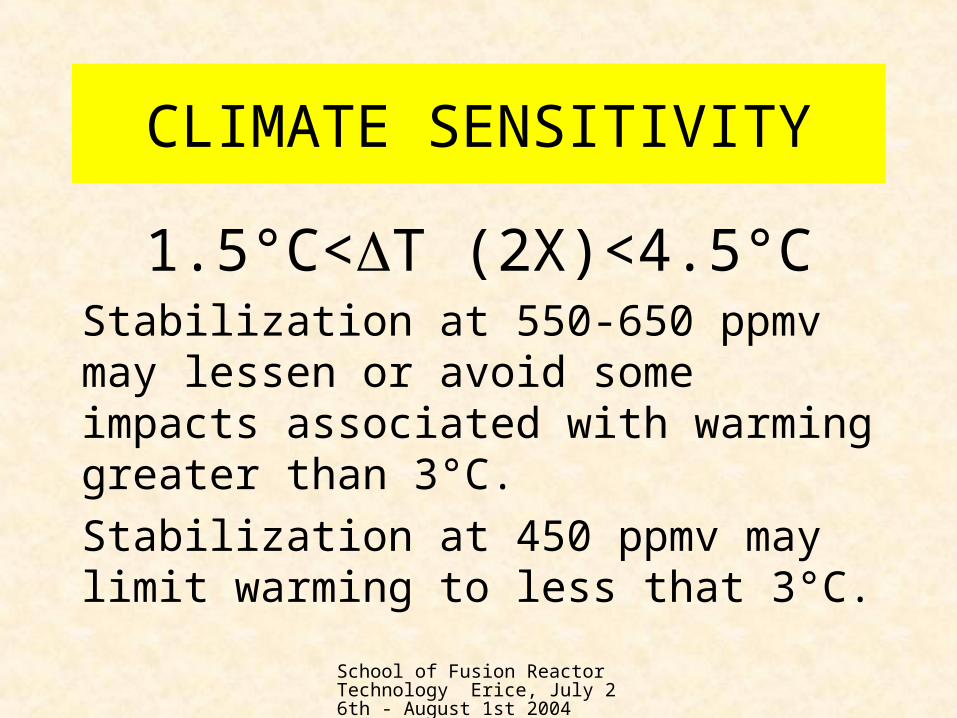
CLIMATE SENSITIVITY
1.5°C<T (2X)<4.5°CStabilization at 550-650 ppmv may lessen or avoid some impacts associated with warming greater than 3°C.
Stabilization at 450 ppmv may limit warming to less that 3°C.

School of Fusion Reactor Technology Erice, July 26th - August 1st 2004
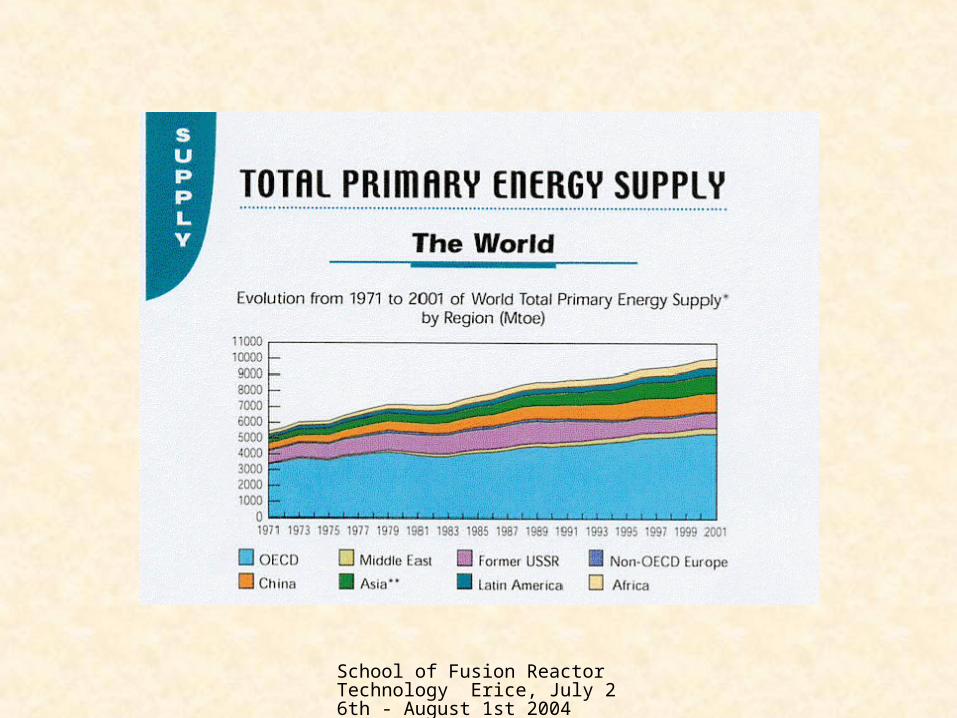
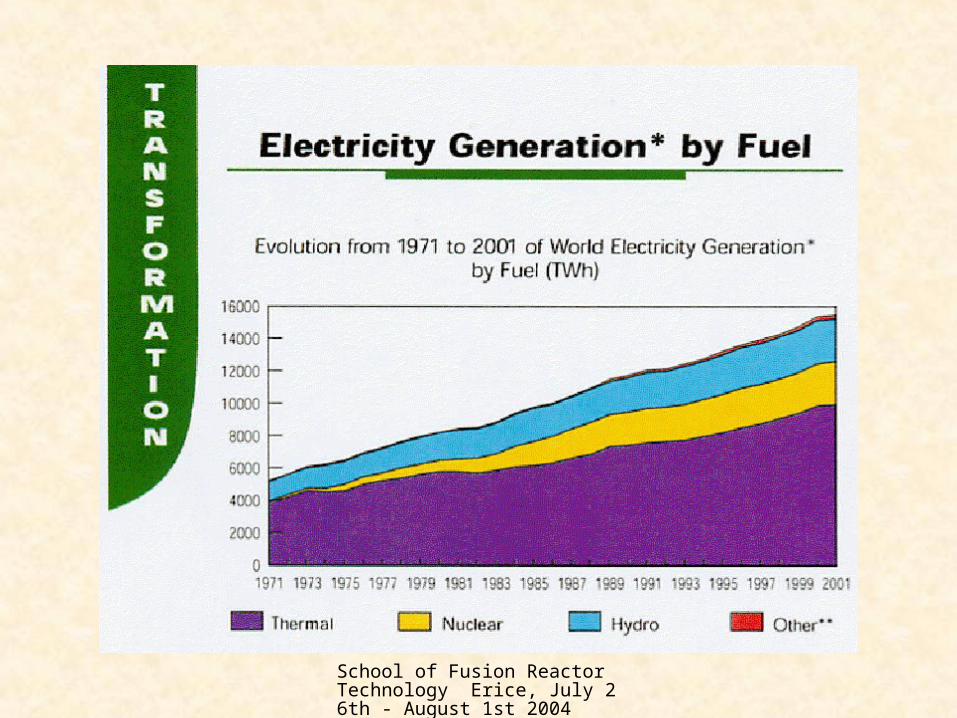
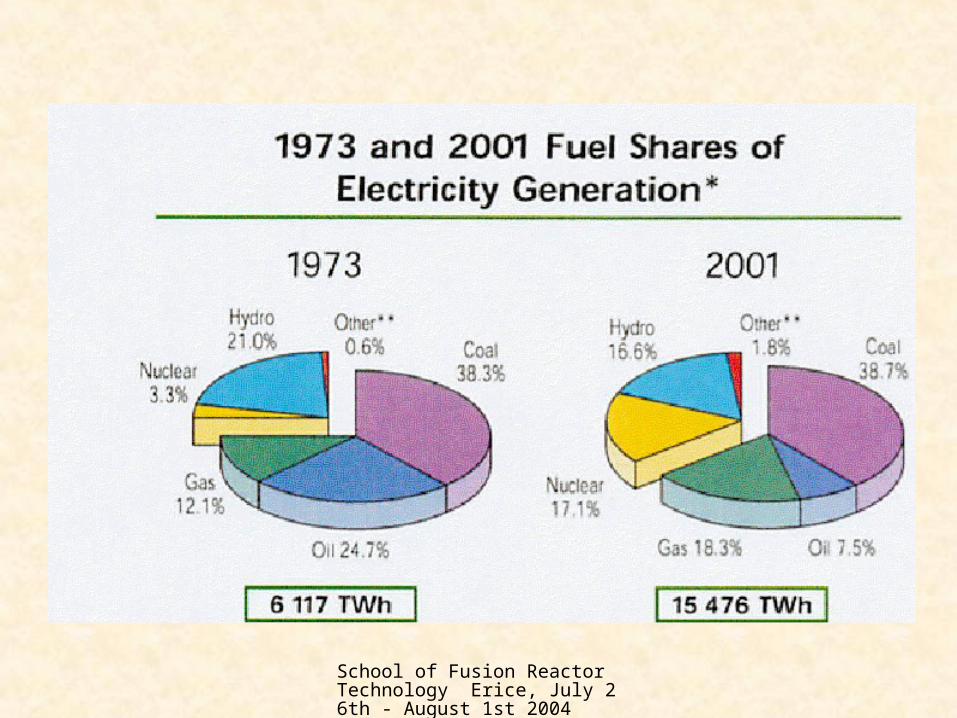
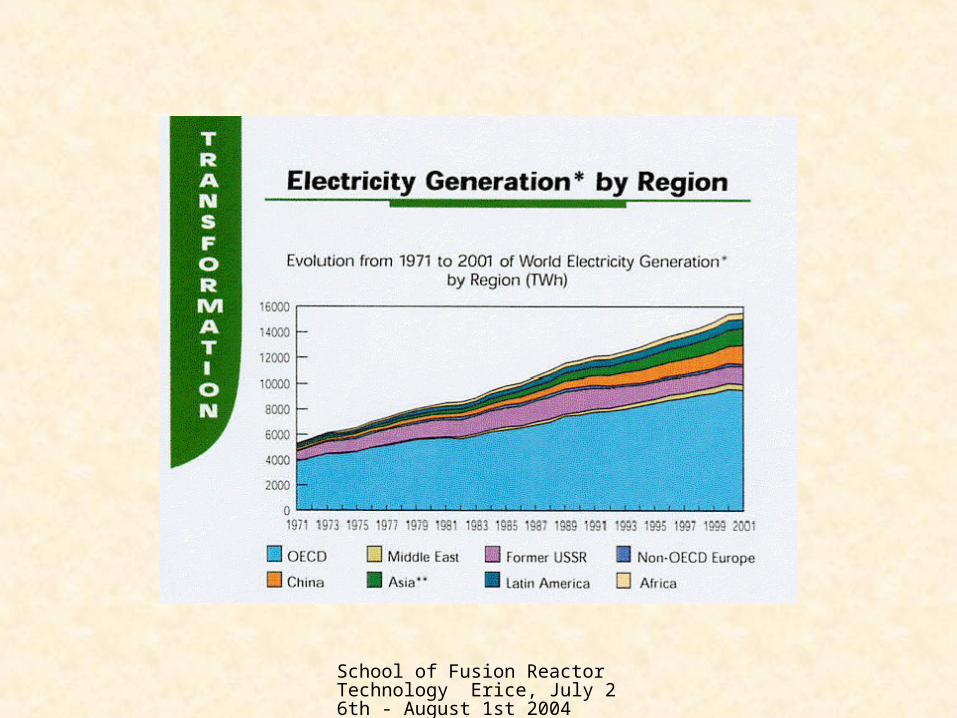
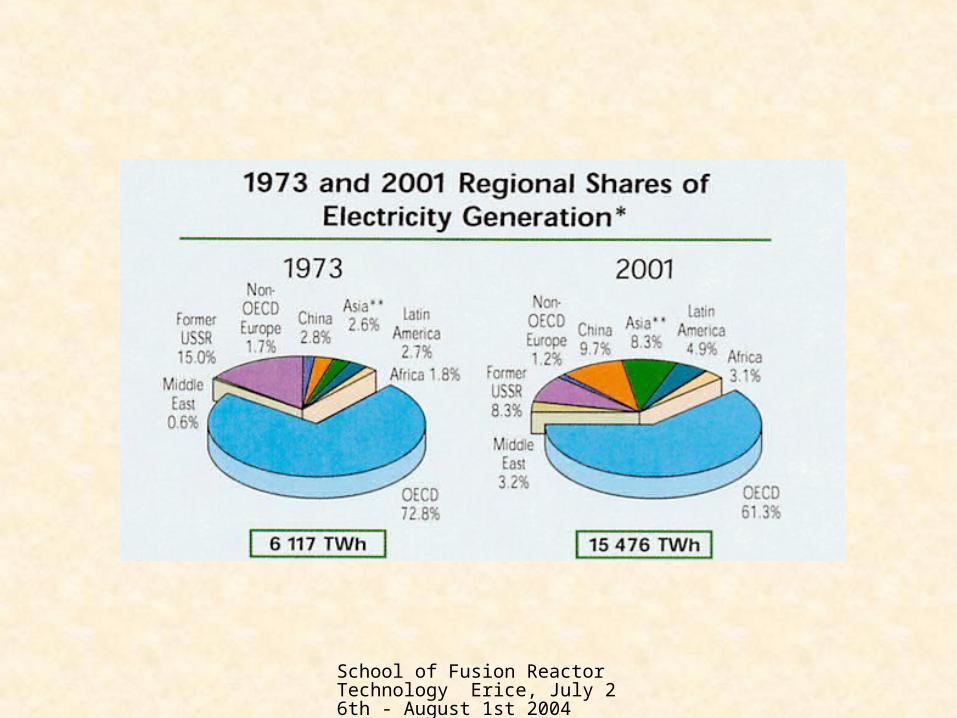
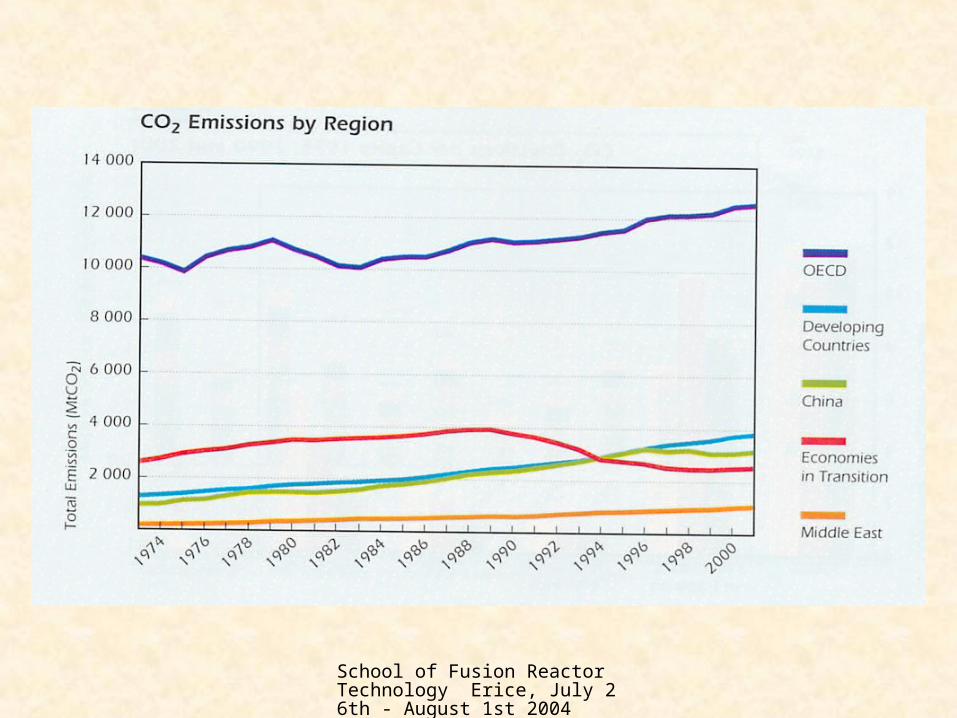
WHERE ARE WE NOW?

School of Fusion Reactor Technology Erice, July 26th - August 1st 2004
Source: IEA - Key World Energy Statistics 2003

School of Fusion Reactor Technology Erice, July 26th - August 1st 2004
School of Fusion Reactor Technology Erice, July 26th - August 1st 2004

School of Fusion Reactor Technology Erice, July 26th - August 1st 2004
School of Fusion Reactor Technology Erice, July 26th - August 1st 2004
School of Fusion Reactor Technology Erice, July 26th - August 1st 2004
School of Fusion Reactor Technology Erice, July 26th - August 1st 2004
School of Fusion Reactor Technology Erice, July 26th - August 1st 2004
School of Fusion Reactor Technology Erice, July 26th - August 1st 2004
School of Fusion Reactor Technology Erice, July 26th - August 1st 2004
School of Fusion Reactor Technology Erice, July 26th - August 1st 2004
WHAT ARE THE MAIN DRIVING FORCES FOR CO2
EMISSIONS?
The KAYA Identity …to start with

School of Fusion Reactor Technology Erice, July 26th - August 1st 2004
POPPOP
GDP
GDP
ENERGY
ENERGY
COCO 2
2
Kaya Identity
Carbon
Intensity
Energy
Intensity
Per-capita
Income

School of Fusion Reactor Technology Erice, July 26th - August 1st 2004
Kaya Factor Unit of Measure Driving Factor Policies
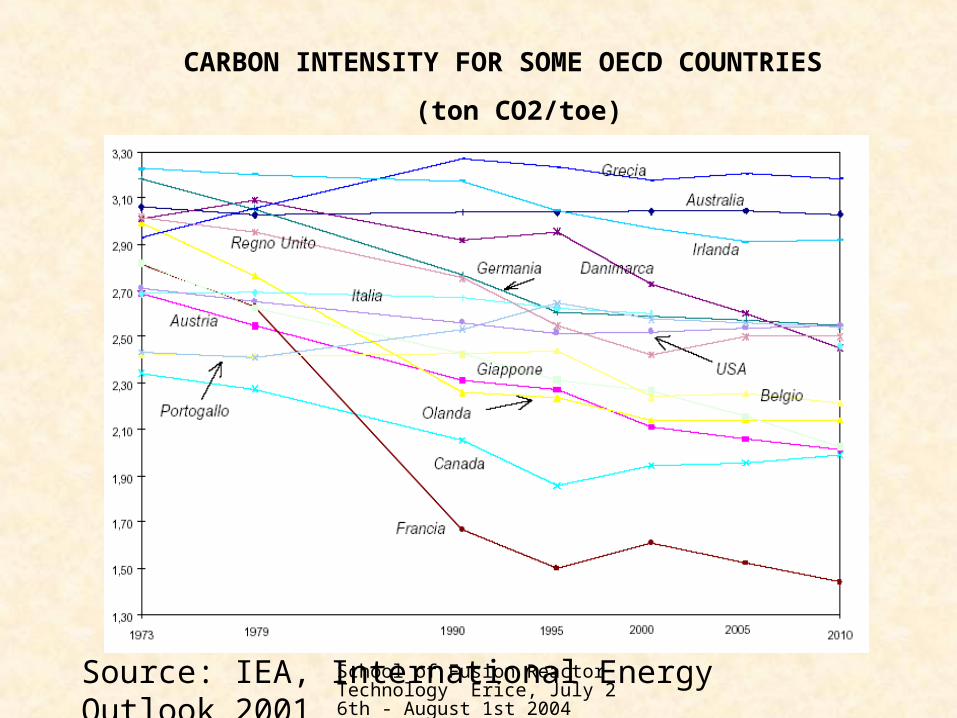
CO2/Energy (Carbon Intensity)
tonCO2/ toe Energy Mix Less Carbon Emitting Fuels
Energy/GDP (Energy Intensity)
toe/Monetary Unit
Economic Structure
Diffusion of Energy Efficient Technologies
Energy Saving
GDP/POP (per-capita Income)
Monetary Unit/POP
Socio-Economic Factors
Economic Policies
POP (Population) Inhabitants
Socio-Economic and Cultural Factors
Demographic Policies
KAYA FACTORS AND CO2 EMISSIONS
School of Fusion Reactor Technology Erice, July 26th - August 1st 2004
CARBON INTENSITY FOR SOME OECD COUNTRIES
(ton CO2/toe)
Source: IEA, International Energy Outlook 2001

School of Fusion Reactor Technology Erice, July 26th - August 1st 2004
Oil Production (Mt) and Price ($ 2002/bar.)
0
500
1,000
1,500
2,000
2,500
3,000
3,500
4,000
1960
1962
1964
1966
1968
1970
1972
1974
1976
1978
1980
1982
1984
1986
1988
1990
1992
1994
1996
1998
2000
2002
0.00
10.00
20.00
30.00
40.00
50.00
60.00
70.00
80.00
Oil Prices

School of Fusion Reactor Technology Erice, July 26th - August 1st 2004
ENERGY INTENSITY FOR SOME OECD COUNTRIES (toe/’90US$1000)

School of Fusion Reactor Technology Erice, July 26th - August 1st 2004
PER CAPITA INCOME (US$ 95/PERSON)
-
5,000
10,000
15,000
20,000
25,000
30,000
35,000
40,000
45,00019
70
1972
1974
1976
1978
1980
1982
1984
1986
1988
1990
1992
1994
1996
1998
Australia
Austria
Belgium
Canada
Denmark
France
Germany
Ireland
Italy
Japan
Netherlands
Portugal
United Kingdom
United States
School of Fusion Reactor Technology Erice, July 26th - August 1st 2004
-
50
100
150
200
250
300
1970
1972
1974
1976
1978
1980
1982
1984
1986
1988
1990
1992
1994
1996
1998
Australia
Austria
Belgium
Canada
Denmark
France
Germany
Greece
Ireland
Italy
Japan
Netherlands
Portugal
United Kingdom
United States
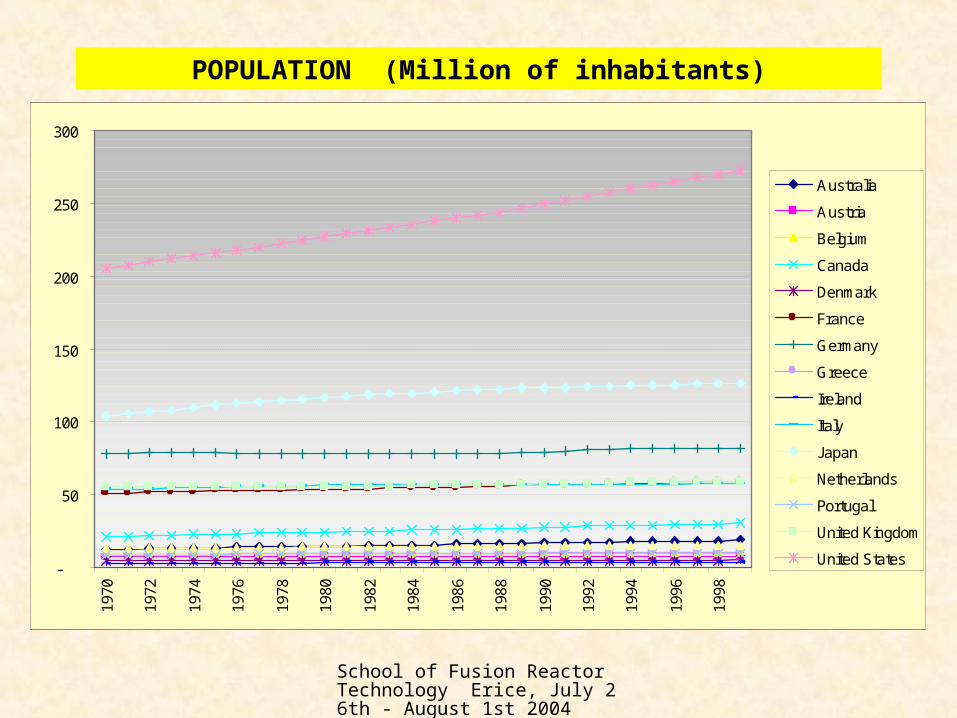
POPULATION (Million of inhabitants)
School of Fusion Reactor Technology Erice, July 26th - August 1st 2004
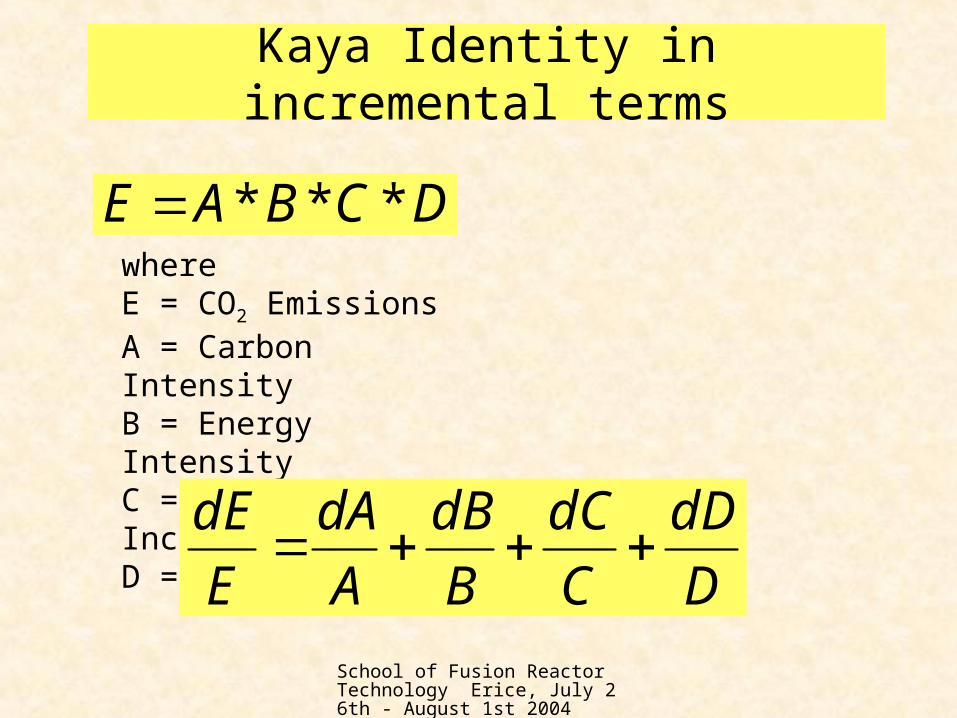
Kaya Identity in incremental terms
DCBAE ***whereE = CO2 EmissionsA = Carbon IntensityB = Energy Intensity C = Per-capita Income D = Population
D
dD
C
dC
B
dB
A
dA
E
dE
School of Fusion Reactor Technology Erice, July 26th - August 1st 2004
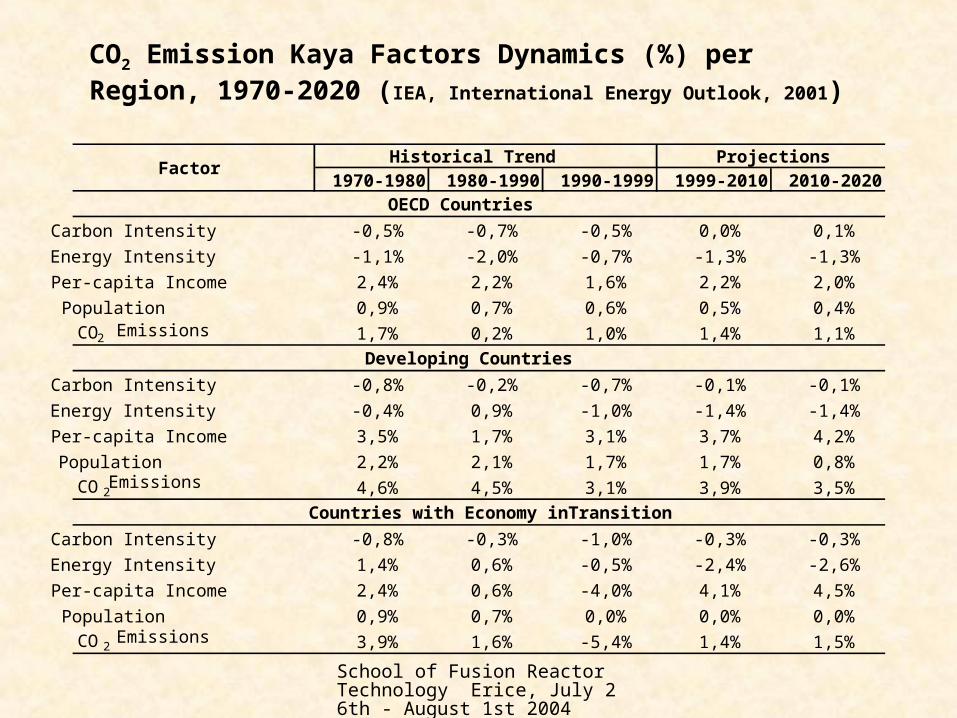
CO2 Emission Kaya Factors Dynamics (%) per Region, 1970-2020 (IEA, International Energy Outlook, 2001)
1970-1980 1980-1990 1990-1999 1999-2010 2010-2020
Carbon Intensity -0,5% -0,7% -0,5% 0,0% 0,1%
Energy Intensity -1,1% -2,0% -0,7% -1,3% -1,3%
Per-capita Income 2,4% 2,2% 1,6% 2,2% 2,0%
Population 0,9% 0,7% 0,6% 0,5% 0,4%
CO2 1,7% 0,2% 1,0% 1,4% 1,1%
Carbon Intensity -0,8% -0,2% -0,7% -0,1% -0,1%
Energy Intensity -0,4% 0,9% -1,0% -1,4% -1,4%
Per-capita Income 3,5% 1,7% 3,1% 3,7% 4,2%
Population 2,2% 2,1% 1,7% 1,7% 0,8%
CO 2 4,6% 4,5% 3,1% 3,9% 3,5%
Carbon Intensity -0,8% -0,3% -1,0% -0,3% -0,3%
Energy Intensity 1,4% 0,6% -0,5% -2,4% -2,6%
Per-capita Income 2,4% 0,6% -4,0% 4,1% 4,5%
Population 0,9% 0,7% 0,0% 0,0% 0,0%
CO 2 3,9% 1,6% -5,4% 1,4% 1,5%
Countries with Economy inTransition
FactorHistorical Trend Projections
OECD Countries
Developing Countries
Emissions
Emissions
Emissions

School of Fusion Reactor Technology Erice, July 26th - August 1st 2004
WHERE ARE WE GOING?
WHAT ARE SCENARIOS AND WHAT IS THEIR PURPOSE?

School of Fusion Reactor Technology Erice, July 26th - August 1st 2004
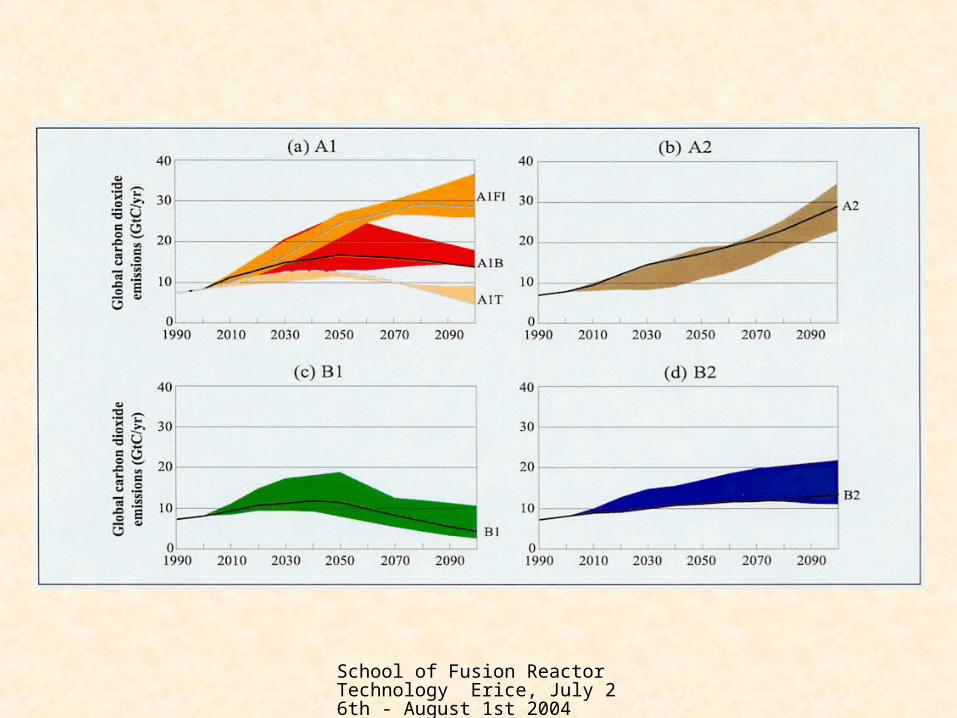
IPCC SPECIAL REPORT ON EMISSIONS SCENARIOS

School of Fusion Reactor Technology Erice, July 26th - August 1st 2004
School of Fusion Reactor Technology Erice, July 26th - August 1st 2004
The A1 storyline and scenario
Describes a future world of:
• Very rapid economic growth;
• Global population that peaks in mid-century and declines thereafter;
• Rapid introduction of new and more efficient technologies
• Convergence among regions.

School of Fusion Reactor Technology Erice, July 26th - August 1st 2004
The A1 storyline and scenario
A1 scenarios develops into three groups that describe alternative directions of technological change in the energy system. The three A1 groups are:
• Fossil intensive (A1FI);
• Non fossil energy sources (A1T);
• Balance across all sources (A1B).

School of Fusion Reactor Technology Erice, July 26th - August 1st 2004
The A2 storyline and scenario
It describes a very heterogeneous world:
• Continuous increase in global population;
• Economic development is primarily regionally oriented;
• Per capita economic growth and technological change are more fragmented and slower that in A1 scenario.
School of Fusion Reactor Technology Erice, July 26th - August 1st 2004
The B1 storyline and scenario
The B1 storyline and scenario family describes a convergent world with the same global population dynamics as in A1 storyline, but with rapid changes in in economic structures towards a service and information economy.

School of Fusion Reactor Technology Erice, July 26th - August 1st 2004
The B2 storyline and scenario
It describes a world in which the emphasis is on local solutions to economic, social and environmental sustainabilty. It is a world of intermediate level of economic development, and less rapid and more diverse technological change than in B1 and A1 storylines.

School of Fusion Reactor Technology Erice, July 26th - August 1st 2004
School of Fusion Reactor Technology Erice, July 26th - August 1st 2004

School of Fusion Reactor Technology Erice, July 26th - August 1st 2004
IPCC CO2 CONCENTRATION STABILIZATION SCENARIOS
WHERE SHOULD WE GO?

School of Fusion Reactor Technology Erice, July 26th - August 1st 2004

School of Fusion Reactor Technology Erice, July 26th - August 1st 2004
Sector Historic emissions Historic C annual Potential emission Potential emissionin 1990 (MtC/yr) growth rate in reductions in 2010 reductions in 2020
1990-1995 (%) (MtC/yr) (MtC/yr)
Buildings 1650 1.0 700-750 1000-1100Transport 1080 2.4 100-300 300-700Industry 2300 0.4 300-500 700-900
Most reductions are available at negative net direct costs
Estimates of potential global greenhouse gas emission reduction in 2010 and in 2020
Source: IPCC 2001
School of Fusion Reactor Technology Erice, July 26th - August 1st 2004
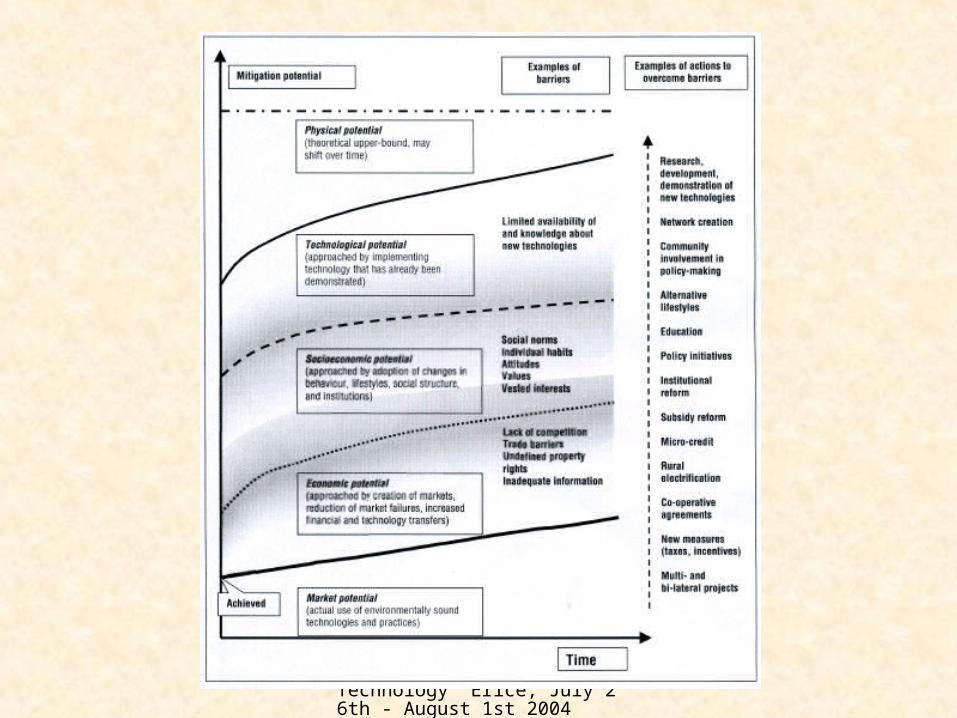
BARRIERS TO IMPLEMENTATION
School of Fusion Reactor Technology Erice, July 26th - August 1st 2004

School of Fusion Reactor Technology Erice, July 26th - August 1st 2004
COSTS OF IMPLEMENTATION

School of Fusion Reactor Technology Erice, July 26th - August 1st 2004
• Actions taken to abate CO2 emissions imply the use of economic resources and divert these resources from other alternative uses.
• Assessing the costs of these actions should ideally consider the total value that the society attaches to the goods and services forgone because of the diversion of resources to climate protection.
• In some case, the sum of benefits and costs will be negative, meaning that society gains from undertaking the mitigation action.
COSTS OF IMPLEMENTATION
School of Fusion Reactor Technology Erice, July 26th - August 1st 2004
• Policies aimed at mitigating CO2 emissions can yield other social benefit and costs, the so called ancillary or co-benefits and costs. For example, reducing carbon emissions in many cases will result in the simultaneous reduction in local and regional air pollution.
• Cost for ton of CO2 emissions avoided are unevenly distributed among sectors and among Countries;
COSTS OF IMPLEMENTATION

School of Fusion Reactor Technology Erice, July 26th - August 1st 2004
CONCLUSIONS
• The current level of CO2 emissions seems to be not sustainable for the climate system;
• IPCC reference scenarios show that a CO2 concentration stabilization will unlike be seen;
• IPCC CO2 concentration stabilization scenarios show that it is possible achieve stabilization by means of the diffusion of known technological options;
School of Fusion Reactor Technology Erice, July 26th - August 1st 2004
• The associated costs depend on the level of CO2 concentration stabilization.
• A number of co-benefits are associated with CO2 emission mitigation policies.
• The process towards a low carbon economy will be not easy to implement, hence the need for an Institution to steer it.
CONCLUSIONS