school of engineering and sciences · the school of engineering and sciences ... precalculus with...
TRANSCRIPT

2016-17 School Accountability Report Card for School of Engineering and Sciences Page 1 of 12
School of Engineering and Sciences
7345 Gloria Dr. • Sacramento, CA 95831 • 916.395.5040 • Grades 7-12 Jim Hays, Principal
2016-17 School Accountability Report Card
Published During the 2017-18 School Year
Sacramento City Unified School District
5735 47th Avenue Sacramento, CA 95824
(916) 643-7400 www.scusd.edu
District Governing Board
Jay Hansen President, Area 1
Jessie Ryan, 1st VP, Area 7
Darrel Woo 2nd VP, Area 6
Ellen Cochrane, Area 2
Christina Pritchett, Area 3
Michael Minnick, Area 4
Mai Vang, Area 5
Sara Nguyen, Student Member
District Administration
Jorge Aguilar Superintendent
Lisa Allen Deputy Superintendent
Chad Sweitzer Instructional Assistant
Superintendent
Tu Moua-Carroz Instructional Assistant
Superintendent
Olga L. Simms Instructional Assistant
Superintendent
Mary Hardin Young Instructional Assistant
Superintendent
----
----
School Description Our Mission: The School of Engineering and Sciences provides open access to a rigorous academic and technical course sequence. We insist on high levels of learning for all students with the ultimate goal of increasing the diversity of the science and engineering workforce living and working in Sacramento. The School of Engineering and Sciences (SES) is one of Sacramento City Unified School District’s small, career-themed schools designed through the assistance of the Bill and Melinda Gates Foundation. The School opened with grades 7 and 9 in 2007 and now holds over 500 7 through 12th graders. The school moved to its brand new location in January 2010. Students have the opportunity to participate in sports and Student Government, and High School CIF Athletic programs are open to students at their home comprehensive high school. As a industry-themed school, we have adopted a school structure and instructional techniques that allow our students to better learn about and experience careers in the fields of engineering and science. All students at SES take an engineering course each year in addition to the standard academic core courses (ELA, Math, History, etc). These engineering courses expose students to various types of engineering, help them develop marketable job skills, and serve as a platform for many of the school’s integrated unit projects. Integrated unit projects are a particular form of project-based learning in which groups of students are asked to solve a real world problem using information and skills from their core courses, including engineering. Students complete 4 integrated units each year ranging from science fair to green technology to EV cars. Students have the opportunity to participate in many extra curricular activities, such as competitive sports, FIRST robotics and student government. The adult leadership will provide an environment for a student that is safe, orderly and conducive to purposefully engaged learning. Students will focus on unique course work and mentorships aligned to their personal goals. Students have numerous opportunities to interact with professionals in a variety of scientific fields of study through career explorations and regional study tours. Regional science competitions are a part of the comprehensive activities program. Students will also have the opportunity to enroll in early college coursework at California State University Sacramento while enrolled in high school. The School of Engineering and Sciences is proud of the many existing partnerships between the School and the community organizations and businesses.

2016-17 School Accountability Report Card for School of Engineering and Sciences Page 2 of 12
About the SARC By February 1 of each year, every school in California is required by state law to publish a School Accountability Report Card (SARC). The SARC contains information about the condition and performance of each California public school. Under the Local Control Funding Formula (LCFF) all local educational agencies (LEAs) are required to prepare a Local Control and Accountability Plan (LCAP), which describes how they intend to meet annual school-specific goals for all pupils, with specific activities to address state and local priorities. Additionally, data reported in an LCAP is to be consistent with data reported in the SARC. • For more information about SARC requirements, see the California
Department of Education (CDE) SARC Web page at http://www.cde.ca.gov/ta/ac/sa/.
• For more information about the LCFF or LCAP, see the CDE LCFF Web page at http://www.cde.ca.gov/fg/aa/lc/.
• For additional information about the school, parents/guardians and community members should contact the school principal or the district office.
2016-17 Student Enrollment by Grade Level
Grade Level Number of Students
Grade 7 128
Grade 8 110
Grade 9 88
Grade 10 72
Grade 11 60
Grade 12 48
Total Enrollment 506
2016-17 Student Enrollment by Group
Group Percent of Total Enrollment
Black or African American 19.2
American Indian or Alaska Native 0.4
Asian 18.8
Filipino 2
Hispanic or Latino 38.1
Native Hawaiian or Pacific Islander 1.8
White 15.4
Two or More Races 4.3
Socioeconomically Disadvantaged 69
English Learners 9.5
Students with Disabilities 7.3
Foster Youth 0.2
A. Conditions of Learning State Priority: Basic The SARC provides the following information relevant to the State priority: Basic (Priority 1): • Degree to which teachers are appropriately assigned and fully
credentialed in the subject area and for the pupils they are teaching; • Pupils have access to standards-aligned instructional materials; and • School facilities are maintained in good repair.
Teacher Credentials
School of Engineering and Sciences 15-16 16-17 17-18
With Full Credential 25 21 20
Without Full Credential 1 1 1
Teaching Outside Subject Area of Competence 0 1 0
Sacramento City Unified School District 15-16 16-17 17-18
With Full Credential ♦ ♦ 1628
Without Full Credential ♦ ♦ 79
Teaching Outside Subject Area of Competence ♦ ♦ 14
Teacher Misassignments and Vacant Teacher Positions at this School
School of Engineering and Sciences
15-16 16-17 17-18
Teachers of English Learners 0 0 0
Total Teacher Misassignments 0 0 0
Vacant Teacher Positions 1 1 0
* “Misassignments” refers to the number of positions filled by teachers who lack legal authorization to teach that grade level, subject area, student group, etc. Total Teacher Misassignments includes the number of Misassignments of Teachers of English Learners.

2016-17 School Accountability Report Card for School of Engineering and Sciences Page 3 of 12
Quality, Currency, Availability of Textbooks and Instructional Materials (School Year 2017-18) Textbooks and instructional materials are reviewed and then piloted across the district. Subsequent adoption by the Board of Education is consistent with the cycle of textbook approval by the State, California School Board. Textbooks are chosen for their alignment with California Content Standards, California Frameworks, and appropriateness for Sacramento City Unified School District students. Textbook sufficiency data is collected annually.
Textbooks and Instructional Materials
Year and month in which data were collected: December 2016
Core Curriculum Area Textbooks and Instructional Materials/Year of Adoption
Reading/Language Arts Holt Handbook: first course (English 7) Holt Literature and Language Arts: first course (English 7) Holt Handbook: second course (English 8) Holt Literature and Language Arts: second course (English 8) Holt Handbook -3rd course (English 9) Holt Literature and Language Arts - 3rd course (English 9) Holt Handbook - 4th course (English 10) Holt Literature and Lanuage Arts - 4th course (English 10) Hold Handbook - 5th course (English 11) Holt Literature and Language Arts - 5th course (English 11) Holt Handbook - 6th course (English 12) Holt Literature and Language Arts - 6th course (English 12)
The textbooks listed are from most recent adoption: Yes
Percent of students lacking their own assigned textbook: 0%
Mathematics CCSS Integrated Pathway: Mathematics I, Walch Education Mathematics 2012 Algebra and Trigonometry, Structure and Method, Book 2, McDougal Littell Advanced Algebra 2000 Algebra 2, McDougal Littell Advanced Algebra 2001 Geometry: Measuring Reasoning, McDougal Littell Geometry 2004 Algebra 2 (California Edition), Pearson Prentice Hall Algebra 2 and/or Adv. Geometry 2004 Introduction To Statistics and Data Analysis, AP Ed. Brooks/Cole Statistics 2010 Precalculus with Unit-Circle Trigonometry, 4th ed., David Cohen, Thomson Brooks/Cole Pre Calculus 2006 Precalculus 3rd ed., Robert Blitzer, Pearson Prentice Hall Pre Calculus 2007 Precalculus with Limits 5th ed., Larsen, Hostetler and Edwards, Houghton Mifflin Pre Calculus 2008 Algebra and Trigonometry with Analytic Geometry, 9th Edition, Brooks and Cole Advanced Pre Calculus 1997 Calculus: Graphical, Numerical, Algebraic, 3rd ed (AP Edition) Pearson Prentice Hall Calculus AB or BC 2007 Calculus: Single Variable with Vector Functions, 1st ed. Thomson Brooks/Cole Calculus AB or BC 2007 Calculus of a Single Variable, 8th Edition, Houghton Mifflin Calculus AB or BC 2006
The textbooks listed are from most recent adoption: Yes
Percent of students lacking their own assigned textbook: 0%

2016-17 School Accountability Report Card for School of Engineering and Sciences Page 4 of 12
Textbooks and Instructional Materials
Year and month in which data were collected: December 2016
Core Curriculum Area Textbooks and Instructional Materials/Year of Adoption
Science Invitation to Psychology. Prentice Hall Psychology AP 2008 Psychology, 7th Ed., Worth Psychology 2004 Holt Earth Science, Holt, Rinehart and Winston Physical Science 2006 Biology: The Dynamics of Life, Glencoe Biology/Biophysical Science 2005 Modern Biology, Holt, Reinhart, and Winston Biology/Biophysical Science 2002 Biology, Prentice Hall Biology/Biophysical Science 2004 BSCS Biology: A Molecular Approach, 8th Edition, Glencoe Molecular Biology 2001 BSCS Biology: A Molecular Approach, 9th Edition, Glencoe Molecular Biology 2006 Biology, 8th ed. (AP) Pearson, Benjamin Cummings Biology AP 2008 Chemistry, Matters and Change, Glencoe/McGraw-Hill Chemistry 2005 Holt Modern Chemistry, Holt, Rinehart and Winston Chemistry 2006 Chemistry: The Central Science, 11th Edition, Prentice Hall Chemistry AP 2008 Chemistry, 7th ed, (AP Edition), Houghton Mifflin Chemistry AP 2007 Chemistry in the Community, Freeman Chemistry 2000 Conceptual Physics, 9th Edition, (Addison Wesley) Physics 2002 Physics: Principles and Problems, Glencoe/McGraw-Hill Physics 2005 Physics, 6th Edition, John Wiley and Son, Inc. Physics 2007 Hole’s Essentials of Human Anatomy and Physiology, 8th Edition, McGraw-Hill Human Anatomy and Physiology 2003
The textbooks listed are from most recent adoption: Yes
Percent of students lacking their own assigned textbook: 0%
History-Social Science World Geography, McDougal Littell Geography 2006 World Cultures and Geography, McDougal Littell Geography SDAIE 2003 World Geography and Cultures, Globe Fearon Geography SDAIE 2002 Human Legacy, Holt World History 2008 World History, 5th ed. Duiker and Spielvogel, Thomson Wadsworth World History AP 2007 American Anthem Modern American History, Holt, Rinehart and Winston U.S. History 2007 The American Journey: A History of the United States, Prentice Hall U.S. History AP 2001 Magruder’s American Government, Pearson Prentice Hall U.S. Government 2005 American Government, 9th Edition, Houghton Mifflin U.S. Government AP 2004 Economics Principles in Action, Pearson Prentice Hall Modern Economics 2007
The textbooks listed are from most recent adoption: Yes
Percent of students lacking their own assigned textbook: 0%
Foreign Language Visions, Levels Basic and A,Student Workbooks, Levels Basic and A, Heinle & Heinle English Language Development 2003 Visions, Levels Basic and B and C,Student Workbooks, Levels Basic and B and C, Heinle & Heinle English Language Development 2003
The textbooks listed are from most recent adoption: Yes
Percent of students lacking their own assigned textbook: 0%
Health Percent of students lacking their own assigned textbook: 0%
Visual and Performing Arts Percent of students lacking their own assigned textbook: 0%
Science Laboratory Equipment N/A
The textbooks listed are from most recent adoption: N/A
Note: Cells with N/A values do not require data.
School Facility Conditions and Planned Improvements (Most Recent Year) The main campus was built in 2010. This school has permanent classrooms which include a multipurpose room, science wing, and an administrative building. The school shares a public library (RWGPL) and a park field (Sojourner Truth) with the community at large.

2016-17 School Accountability Report Card for School of Engineering and Sciences Page 5 of 12
The district takes great efforts to ensure that all schools are clean, safe, and functional. District maintenance staff ensures that the repairs necessary to keep the school in good repair and working order are completed in a timely manner. A work order process is used to ensure efficient service and that emergency repairs are given the highest priority. The district governing board has adopted cleaning standards for all the schools in the district. A summary of these standards is available at the school office, or at the district operations office. The principal works directly with the custodial staff to develop cleaning schedules to ensure a clean and safe school. The State Legislature established the Deferred Maintenance Fund (DMF) in 1980 to assist districts in maintaining facilities and sites. The District has participated in the Deferred Maintenance Program since its inception. The program requires both the local district and the State of California to share equally in the cost of major deferred maintenance projects, with the maximum contribution from the State limited to approximately one-half of one percent of the District’s General Fund and Adult Education Fund operating budgets. For fiscal years 2008-09 through 2012-13, the Deferred Maintenance Program has been included in the State’s Tier III Flexibility Program. Therefore, DMF funds received by the District are deposited in the General Fund, and are unrestricted. Due to state budget cuts for 2010-11 these unrestricted funds have not been designated to deferred maintenance purposes. The funds were used as part of the Tier III recommendations approved by the Board on the May 6, 2010 Board Meeting.
School Facility Good Repair Status (Most Recent Year) Year and month in which data were collected: 7/31/17
System Inspected Repair Status Repair Needed and
Action Taken or Planned Good Fair Poor
Systems: Gas Leaks, Mechanical/HVAC, Sewer
X
Interior: Interior Surfaces
X
Cleanliness: Overall Cleanliness, Pest/ Vermin Infestation
X
Electrical: Electrical
X
Restrooms/Fountains: Restrooms, Sinks/ Fountains
X
Safety: Fire Safety, Hazardous Materials
X
Structural: Structural Damage, Roofs
X
External: Playground/School Grounds, Windows/ Doors/Gates/Fences
X
Overall Rating Exemplary Good Fair Poor
---------- X
2016-17 School Accountability Report Card for School of Engineering and Sciences Page 6 of 12
B. Pupil Outcomes
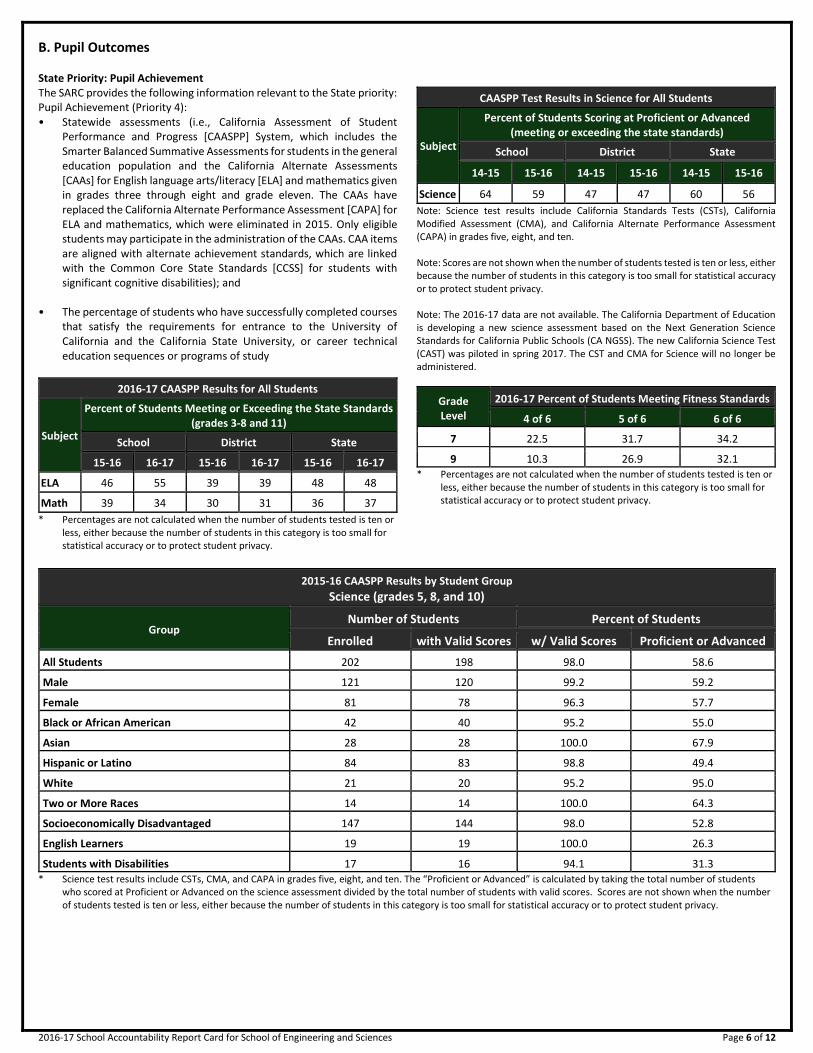
State Priority: Pupil Achievement The SARC provides the following information relevant to the State priority: Pupil Achievement (Priority 4): • Statewide assessments (i.e., California Assessment of Student
Performance and Progress [CAASPP] System, which includes the Smarter Balanced Summative Assessments for students in the general education population and the California Alternate Assessments [CAAs] for English language arts/literacy [ELA] and mathematics given in grades three through eight and grade eleven. The CAAs have replaced the California Alternate Performance Assessment [CAPA] for ELA and mathematics, which were eliminated in 2015. Only eligible students may participate in the administration of the CAAs. CAA items are aligned with alternate achievement standards, which are linked with the Common Core State Standards [CCSS] for students with significant cognitive disabilities); and
• The percentage of students who have successfully completed courses
that satisfy the requirements for entrance to the University of California and the California State University, or career technical education sequences or programs of study
2016-17 CAASPP Results for All Students
Subject
Percent of Students Meeting or Exceeding the State Standards (grades 3-8 and 11)
School District State
15-16 16-17 15-16 16-17 15-16 16-17
ELA 46 55 39 39 48 48
Math 39 34 30 31 36 37
* Percentages are not calculated when the number of students tested is ten or less, either because the number of students in this category is too small for statistical accuracy or to protect student privacy.
CAASPP Test Results in Science for All Students
Subject
Percent of Students Scoring at Proficient or Advanced (meeting or exceeding the state standards)
School District State
14-15 15-16 14-15 15-16 14-15 15-16
Science 64 59 47 47 60 56
Note: Science test results include California Standards Tests (CSTs), California Modified Assessment (CMA), and California Alternate Performance Assessment (CAPA) in grades five, eight, and ten. Note: Scores are not shown when the number of students tested is ten or less, either because the number of students in this category is too small for statistical accuracy or to protect student privacy. Note: The 2016-17 data are not available. The California Department of Education is developing a new science assessment based on the Next Generation Science Standards for California Public Schools (CA NGSS). The new California Science Test (CAST) was piloted in spring 2017. The CST and CMA for Science will no longer be administered.
Grade Level
2016-17 Percent of Students Meeting Fitness Standards
4 of 6 5 of 6 6 of 6
---7--- 22.5 31.7 34.2
---9--- 10.3 26.9 32.1 * Percentages are not calculated when the number of students tested is ten or
less, either because the number of students in this category is too small for statistical accuracy or to protect student privacy.
2015-16 CAASPP Results by Student Group
Science (grades 5, 8, and 10)
Group Number of Students Percent of Students
Enrolled with Valid Scores w/ Valid Scores Proficient or Advanced
All Students 202 198 98.0 58.6
Male 121 120 99.2 59.2
Female 81 78 96.3 57.7
Black or African American 42 40 95.2 55.0
Asian 28 28 100.0 67.9
Hispanic or Latino 84 83 98.8 49.4
White 21 20 95.2 95.0
Two or More Races 14 14 100.0 64.3
Socioeconomically Disadvantaged 147 144 98.0 52.8
English Learners 19 19 100.0 26.3
Students with Disabilities 17 16 94.1 31.3 * Science test results include CSTs, CMA, and CAPA in grades five, eight, and ten. The “Proficient or Advanced” is calculated by taking the total number of students
who scored at Proficient or Advanced on the science assessment divided by the total number of students with valid scores. Scores are not shown when the number of students tested is ten or less, either because the number of students in this category is too small for statistical accuracy or to protect student privacy.

2016-17 School Accountability Report Card for School of Engineering and Sciences Page 7 of 12
School Year 2016-17 CAASPP Assessment Results - English Language Arts (ELA) Disaggregated by Student Groups, Grades Three through Eight and Eleven
Student Group Total
Enrollment Number Tested
Percent Tested
Percent Met or Exceeded
All Students 291 289 99.31 54.51
Male 173 171 98.84 49.71
Female 118 118 100 61.54
Black or African American 56 56 100 36.36
American Indian or Alaska Native -- -- -- --
Asian 61 61 100 67.21
Filipino -- -- -- --
Hispanic or Latino 111 110 99.1 51.82
Native Hawaiian or Pacific Islander -- -- -- --
White 38 38 100 65.79
Two or More Races 14 13 92.86 61.54
Socioeconomically Disadvantaged 213 212 99.53 52.13
English Learners 64 64 100 46.88
Students with Disabilities 19 19 100 36.84
Students Receiving Migrant Education Services -- -- -- --
Note: ELA test results include the Smarter Balanced Summative Assessment and the CAA. The “Percent Met or Exceeded” is calculated by taking the total number of students who met or exceeded the standard on the Smarter Balanced Summative Assessment plus the total number of students who met the standard (i.e., achieved Level 3–Alternate) on the CAAs divided by the total number of students who participated in both assessments. Note: Double dashes (--) appear in the table when the number of students is ten or less, either because the number of students in this category is too small for statistical accuracy or to protect student privacy. Note: The number of students tested includes all students who participated in the test whether they received a score or not; however, the number of students tested is not the number that was used to calculate the achievement level percentages. The achievement level percentages are calculated using only students who received scores.
2016-17 School Accountability Report Card for School of Engineering and Sciences Page 8 of 12
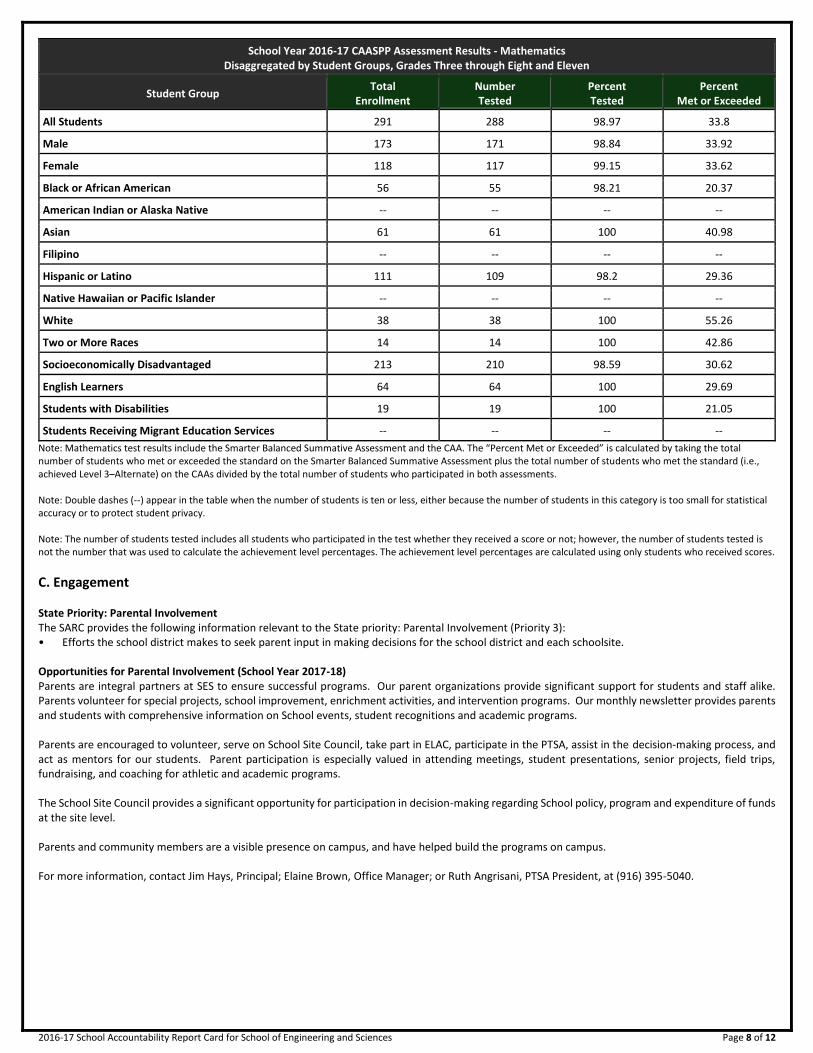
School Year 2016-17 CAASPP Assessment Results - Mathematics Disaggregated by Student Groups, Grades Three through Eight and Eleven
Student Group Total
Enrollment Number Tested
Percent Tested
Percent Met or Exceeded
All Students 291 288 98.97 33.8
Male 173 171 98.84 33.92
Female 118 117 99.15 33.62
Black or African American 56 55 98.21 20.37
American Indian or Alaska Native -- -- -- --
Asian 61 61 100 40.98
Filipino -- -- -- --
Hispanic or Latino 111 109 98.2 29.36
Native Hawaiian or Pacific Islander -- -- -- --
White 38 38 100 55.26
Two or More Races 14 14 100 42.86
Socioeconomically Disadvantaged 213 210 98.59 30.62
English Learners 64 64 100 29.69
Students with Disabilities 19 19 100 21.05
Students Receiving Migrant Education Services -- -- -- --
Note: Mathematics test results include the Smarter Balanced Summative Assessment and the CAA. The “Percent Met or Exceeded” is calculated by taking the total number of students who met or exceeded the standard on the Smarter Balanced Summative Assessment plus the total number of students who met the standard (i.e., achieved Level 3–Alternate) on the CAAs divided by the total number of students who participated in both assessments. Note: Double dashes (--) appear in the table when the number of students is ten or less, either because the number of students in this category is too small for statistical accuracy or to protect student privacy. Note: The number of students tested includes all students who participated in the test whether they received a score or not; however, the number of students tested is not the number that was used to calculate the achievement level percentages. The achievement level percentages are calculated using only students who received scores.
C. Engagement
State Priority: Parental Involvement The SARC provides the following information relevant to the State priority: Parental Involvement (Priority 3): • Efforts the school district makes to seek parent input in making decisions for the school district and each schoolsite. Opportunities for Parental Involvement (School Year 2017-18) Parents are integral partners at SES to ensure successful programs. Our parent organizations provide significant support for students and staff alike. Parents volunteer for special projects, school improvement, enrichment activities, and intervention programs. Our monthly newsletter provides parents and students with comprehensive information on School events, student recognitions and academic programs. Parents are encouraged to volunteer, serve on School Site Council, take part in ELAC, participate in the PTSA, assist in the decision-making process, and act as mentors for our students. Parent participation is especially valued in attending meetings, student presentations, senior projects, field trips, fundraising, and coaching for athletic and academic programs. The School Site Council provides a significant opportunity for participation in decision-making regarding School policy, program and expenditure of funds at the site level. Parents and community members are a visible presence on campus, and have helped build the programs on campus. For more information, contact Jim Hays, Principal; Elaine Brown, Office Manager; or Ruth Angrisani, PTSA President, at (916) 395-5040.

2016-17 School Accountability Report Card for School of Engineering and Sciences Page 9 of 12
State Priority: School Climate The SARC provides the following information relevant to the State priority: School Climate (Priority 6): • Pupil suspension rates; • Pupil expulsion rates; and • Other local measures on the sense of safety. School Safety Plan Sacramento City Unified School District Comprehensive Safe School Plan 2017-2018 Section 1………… Crisis Communication Flow Section 2………….Site Level Emergency Procedures: (a) Lockdown Response (b) Fire (c) Bomb Threat, ATF Bomb Threat Checklist (d) Active Shooter (e) Chemical Accident (f) Severe Weather / Loss of Power (City of Sacramento) Section 3…………Earthquake Emergency Procedures Section 4……. …..Site Level Use of Schools as a Community Shelter ** Section 5…………District Policies Related to Safety and Missing Student Protocol: (a) Board Policy 5021: Custodial & Parent Rights (b) Mandated Child Abuse Reporting (c) Suicide Risk Assessment (d) Missing Student Protocol Section 6…………Bullying Policies and Procedures Section 7…………Dangerous Student Notification / Email Notifications Made by IT Dept. Section 8…………Wellness Plan Section 9…………District Handbook ** To be determined by The American Red Cross and the Office of Emergency Services Section 10……………Component I: Social Climate Component II: Physical Climate/Campus Section 11……………Site Level Incident Command System (ICS) roles and ICS Team Section 12………… ...Site Level Communication Procedures Section 12 (a)………..Emergency Phone Tree Section 13……………Before and After School Programs - Coordinators and Contact Numbers / Days and Hours of Operation on Campus Section 14……………Site Level Safe Ingress & Egress Procedures and Route Maps Section 15....................Site Level Family Reunification Plans Section 15 (a)……….. Reunification Logs Section 16……………(Confidential) Site Level Provisions for Students/Staff With Special Needs Section 16 (a)………..Site Evacuation for Persons With Special Needs Section 17……………School Site Safety Committee Member List and Approval of CSSP Section 18……………Staff / School Handbook Section 19……………Site Map (Please Label Rooms) Section 20……………OPTIONAL-Additional Site-Specific Safety Information The Comprehensive Safe School Plans for the Sacramento City Unified School District are revised annually to ensure the contents of the plans are uniform and updated to address the components set forth in Section 32282 of the 2017 California Education Code. This plan is a work in progress as the Safe Schools Office and the Sacramento Police Department continue to seek the most current information and advice from subject matter experts.

2016-17 School Accountability Report Card for School of Engineering and Sciences Page 10 of 12
Suspensions and Expulsions
School 2014-15 2015-16 2016-17
Suspensions Rate 7.7 6.4 4.3
Expulsions Rate 0.0 0.0 0.0
District 2014-15 2015-16 2016-17
Suspensions Rate 6.1 5.8 6.3
Expulsions Rate 0.0 0.0 0.0
State 2014-15 2015-16 2016-17
Suspensions Rate 3.8 3.7 3.6
Expulsions Rate 0.1 0.1 0.1
D. Other SARC Information
The information in this section is required to be in the SARC but is not included in the state priorities for LCFF.
2017-18 Federal Intervention Program
Indicator School District
Program Improvement Status In PI In PI
First Year of Program Improvement 2012-2013 2008-2009
Year in Program Improvement Year 2 Year 3
Number of Schools Currently in Program Improvement 52
Percent of Schools Currently in Program Improvement 73.2
Academic Counselors and Other Support Staff at this School
Number of Full-Time Equivalent (FTE)
Academic Counselor------- 1.2000
Counselor (Social/Behavioral or Career Development) 0.0000
Library Media Teacher (Librarian) 0.0000
Library Media Services Staff (Paraprofessional) 0.0000
Psychologist------- 0.0000
Social Worker------- 0.0000
Nurse------- 0.0000
Speech/Language/Hearing Specialist 0.0000
Resource Specialist------- 0.0000
Other------- 0.0000
Average Number of Students per Staff Member
Academic Counselor------- 364 * One Full Time Equivalent (FTE) equals one staff member working full time;
one FTE could also represent two staff members who each work 50 percent of full time.
Average Class Size and Class Size Distribution (Secondary)
Average Class Size Number of Classrooms*
1-22 23-32 33+
Subject 2014-15 2015-16 2016-17 2014-15 2015-16 2016-17 2014-15 2015-16 2016-17 2014-15 2015-16 2016-17
English------- ----------
29 29 30 3 10 2 5 4 7 9 13 8
Mathematics ----------
24 24 24 10 2 7 7 8 8 5 12 2
Science------- ----------
32 30 31 12 6 26 10 9 23 6
Social Science ----------
29 28 30 4 4 3 6 6 7 8 8 9
* Number of classes indicates how many classrooms fall into each size category (a range of total students per classroom). At the secondary school level, this information is reported by subject area rather than grade level.
Professional Development provided for Teachers To realize the vision of Sacramento City Unified School District, which is to fully prepare all students for college career and life, it is imperative that the district provides numerous opportunities to expand the professional repertoire of its administrators and teachers. To that end, the district has crafted a high quality professional program that is focused on the ELA and math Common Core State Standards, the Next Generation Science Standards, English Language Learners, Balanced Literacy and Instructional Strategies for Addressing the Needs of Diverse Learners. These areas of focus were derived from needs assessments coupled with the analysis of student learning of specific content and that is ongoing with follow-up opportunities, models effective practices, and uses assessments to guide and monitor progress. The learning opportunities afforded through this program deeply align with the needs of our individual schools, as well as our strategic plan, and connect to every aspect of school practice: thinking curriculum, intentional instructional practices, assessment for learning, and lesson design. These learning experiences, which are offered during the school day and after-school are supported with on-site coaching, are complemented with the required collaborative time built into the school day on Thursdays, which is designated for teachers to engage in collaborative professional learning at their respective school sites. Such communities of practices, under the leadership and guidance of site administrators, afford our teachers the opportunity to deepen their content knowledge, strengthen their instructional repertoire, improve their assessment strategies, and foster a shared sense of

2016-17 School Accountability Report Card for School of Engineering and Sciences Page 11 of 12
responsibility. As a result, every teacher will help to promote and nurture a community of learners in which the individual school staff is not only enriched, but the district as a whole is enhanced.
FY 2015-16 Teacher and Administrative Salaries
Category District Amount
State Average for Districts In Same
Category
Beginning Teacher Salary $43,170 $47,808
Mid-Range Teacher Salary $56,736 $73,555
Highest Teacher Salary $93,113 $95,850
Average Principal Salary (ES) $109,332 $120,448
Average Principal Salary (MS) $111,735 $125,592
Average Principal Salary (HS) $128,526 $138,175
Superintendent Salary $290,000 $264,457
Percent of District Budget
Teacher Salaries 29% 35%
Administrative Salaries 5% 5% * For detailed information on salaries, see the CDE Certificated Salaries &
Benefits webpage at www.cde.ca.gov/ds/fd/cs/.
FY 2015-16 Expenditures Per Pupil and School Site Teacher Salaries
Level Expenditures Per Pupil Average
Teacher Salary Total Restricted Unrestricted
School Site-------
6,263 479 5,784 56,724
District-------
♦ ♦ $5,744 $70,343
State------- ♦ ♦ $6,574 $79,228
Percent Difference: School Site/District 0.7 -19.4
Percent Difference: School Site/ State -12.0 -28.4
* Cells with ♦ do not require data.
Types of Services Funded
Engineering and Sciences has a diverse population that works well together. Students collaborate and work in groups to plan and present their projects. Students are recognized for their academic achievement and social emotional growth by teachers and the Principal through academic awards assemblies each quarter. Students are responsible for planning and implementing a comprehensive activities program which includes School dances, School-wide assemblies, rallies and movie nights. Morning announcements include a short message for social-emotional development in addition to the daily informational component. The small total student enrollment allows teachers and other staff members to know students by name and reinforce students’ connections to their school. Supplemental Services Each district school receives categorical funding to provide supplemental services to assist students reach grade level proficiency and above, master grade level content standards and successfully graduate from high school. Services throughout the district include:
• Class Size Reduction
• Tutoring
• Supplemental instructional materials and books in mathematics, reading/language arts and ELD
• Extended Day/Year/ Summer school
• Enrichment programs
• Access to technology
• AVID/MESA Programs
• Parent Education/Family Nights
• Social Services
• Student/Family Primary Language Support
• Translation for Home-School Communication
• Counseling (academic and career)
• Gifted and Talented Education (GATE)
• Special Education
• 10th Grade Counseling
• Professional Development
• Support Staff, such as instructional assistants, parent advisors, and counselors
• Supplemental Education Services
• School Choice Please check with your child’s principal to receive information regarding the services that are specific to your child’s school.
2016-17 School Accountability Report Card for School of Engineering and Sciences Page 12 of 12
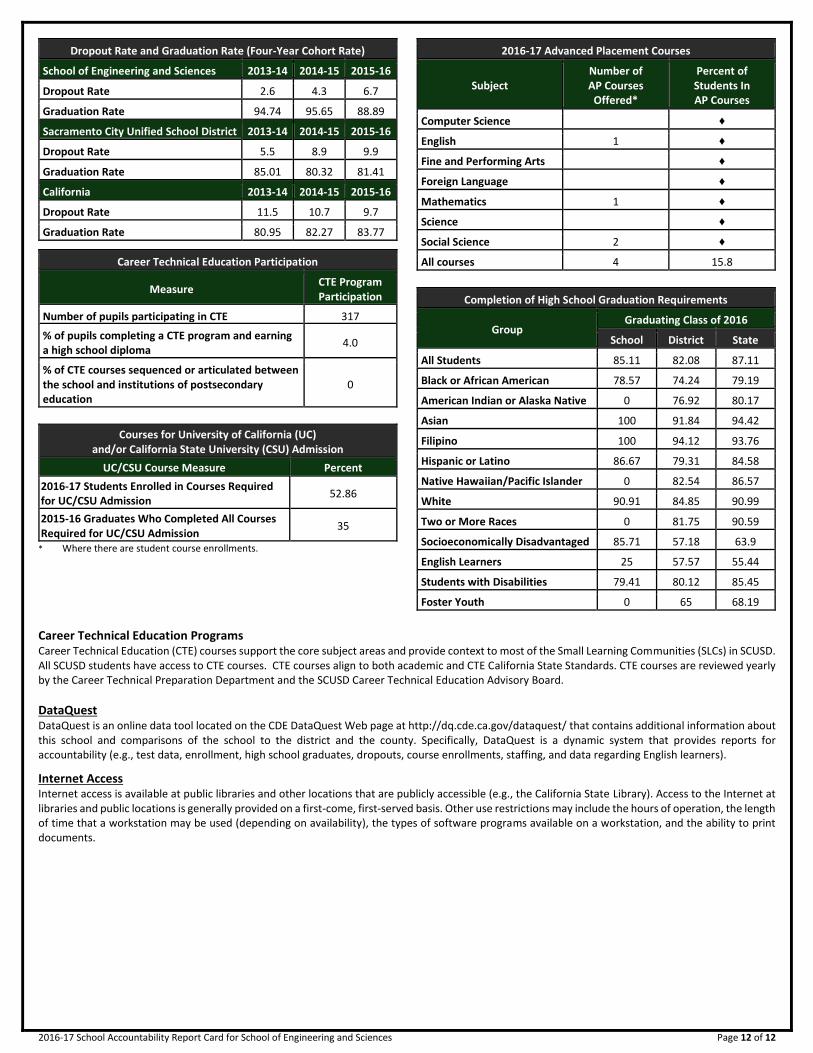
Dropout Rate and Graduation Rate (Four-Year Cohort Rate)
School of Engineering and Sciences 2013-14 2014-15 2015-16
Dropout Rate 2.6 4.3 6.7
Graduation Rate 94.74 95.65 88.89
Sacramento City Unified School District 2013-14 2014-15 2015-16
Dropout Rate 5.5 8.9 9.9
Graduation Rate 85.01 80.32 81.41
California 2013-14 2014-15 2015-16
Dropout Rate 11.5 10.7 9.7
Graduation Rate 80.95 82.27 83.77
Career Technical Education Participation
Measure CTE Program Participation
Number of pupils participating in CTE 317
% of pupils completing a CTE program and earning a high school diploma
4.0
% of CTE courses sequenced or articulated between the school and institutions of postsecondary education
0
Courses for University of California (UC) and/or California State University (CSU) Admission
UC/CSU Course Measure Percent
2016-17 Students Enrolled in Courses Required for UC/CSU Admission
52.86
2015-16 Graduates Who Completed All Courses Required for UC/CSU Admission
35
* Where there are student course enrollments.
2016-17 Advanced Placement Courses
Subject Number of AP Courses
Offered*
Percent of Students In AP Courses
Computer Science ♦
English------- 1 ♦
Fine and Performing Arts ♦
Foreign Language ♦
Mathematics 1 ♦
Science------- ♦
Social Science 2 ♦
All courses 4 15.8
Completion of High School Graduation Requirements
Group Graduating Class of 2016
School District State
All Students 85.11 82.08 87.11
Black or African American 78.57 74.24 79.19
American Indian or Alaska Native 0 76.92 80.17
Asian 100 91.84 94.42
Filipino 100 94.12 93.76
Hispanic or Latino 86.67 79.31 84.58
Native Hawaiian/Pacific Islander 0 82.54 86.57
White 90.91 84.85 90.99
Two or More Races 0 81.75 90.59
Socioeconomically Disadvantaged 85.71 57.18 63.9
English Learners 25 57.57 55.44
Students with Disabilities 79.41 80.12 85.45
Foster Youth 0 65 68.19
Career Technical Education Programs
Career Technical Education (CTE) courses support the core subject areas and provide context to most of the Small Learning Communities (SLCs) in SCUSD. All SCUSD students have access to CTE courses. CTE courses align to both academic and CTE California State Standards. CTE courses are reviewed yearly by the Career Technical Preparation Department and the SCUSD Career Technical Education Advisory Board.
DataQuest DataQuest is an online data tool located on the CDE DataQuest Web page at http://dq.cde.ca.gov/dataquest/ that contains additional information about this school and comparisons of the school to the district and the county. Specifically, DataQuest is a dynamic system that provides reports for accountability (e.g., test data, enrollment, high school graduates, dropouts, course enrollments, staffing, and data regarding English learners).
Internet Access Internet access is available at public libraries and other locations that are publicly accessible (e.g., the California State Library). Access to the Internet at libraries and public locations is generally provided on a first-come, first-served basis. Other use restrictions may include the hours of operation, the length of time that a workstation may be used (depending on availability), the types of software programs available on a workstation, and the ability to print documents.