school of economics and finance...school of economics and finance intraday patterns in fx returns...
TRANSCRIPT

School of Economics and FinanceIntraday Patterns in FX Returns and Order Flow
Francis Breedon and Angelo Ranaldo
Working Paper No. 694 April 2012 ISSN 1473-0278
Intraday patterns in FX returns and order flow
Francis Breedon and Angelo Ranaldo
March 2012
ABSTRACT
Using a comprehensive high-frequency foreign exchange dataset, we present evidence of time-of-day effects in foreign exchange returns through a significant tendency for currencies to depreciate during local trading hours. We confirm this pattern across a range of currencies and time zones. We also find that this pattern is reflected in order flow and suggest that both patterns relate to the tendency of market participants to be net purchasers of foreign exchange in their own trading hours. Data from a single market maker appears to corroborate that interpretation.
Keywords: Foreign Exchange, Microstructure, Order Flow, Liquidity.
JEL-keys: G15
Francis Breedon is at Queen Mary, University of London. Angelo Ranaldo is at the Swiss Institute of Banking and Finance of the University St. Gallen. Corresponding author: [email protected]. We would like to thank Filip Zikes for excellent research assistance and Philip Clarkson and Nicholas Brown of BNP Paribas for their data. We also thank Richard Lyons and seminar participants at the AEA San Francisco, SNB, Oxford-MAN institute and FERC conference at Warwick University for comments.
2
1. Introduction
In this paper, we present evidence of a predictable time‐of‐day pattern in FX order flow1 and returns. As
well as being important in its own right in explaining high‐frequency exchange rate dynamics and trading
behaviour, this effect has important implications for our overall understanding of FX markets. In
particular, if the time‐of‐day pattern in returns is caused by regular patterns in order flow (which is what
our analysis suggests), then our results give support for the downward sloping demand curves derived
from traditional portfolio balance theory where uninformative (and in this case predictable) changes in
net demand have a significant impact on returns. Thus the results presented here make an important
contribution to the growing evidence that order flow in general, and liquidity effects in particular, are
important in FX markets. Recent evidence on liquidity effects has come from a range of sources such as
transaction data (Breedon and Vitale (2010)), institutional flows (Froot and Ramadorai (2005)), events
such as equity index rebalancing (Hau, Massa and Peress (2010)) and more recent intervention studies
(e.g. Fatum and Hutchinson (2003)) and is beginning to overturn the traditional view that these effects
are insignificant (cf., for example, Rogoff (1983)). This intraday pattern gives strong evidence for liquidity
effects since it can be observed in a large sample (rather than one‐off events like index changes) and
seems a clear case of a deterministic trading pattern that cannot be related to private information so its
impact on prices is uncontaminated by information effects. Therefore, our results provide further
evidence of a liquidity effect from order flow in addition to the considerable evidence on the
informational role found in studies such as Evans and Lyons (2005) and Rime et al (2010).
1.1 Previous Literature
Despite an extensive literature on time‐of‐day effects of other aspects of the FX market, such as
volatility (e.g. Ballie and Bollerslev (1991), Andersen and Bollerslev (1998)) and turnover (e.g. Hartmann
(1999), Ito and Hashimoto (2006) ), there are, as far as we know, only two papers on time‐of‐day effects
in returns, Cornett et al (1995) and Ranaldo (2009).2 This gap is all the more surprising given that both
these papers find very similar time‐of‐day patterns in FX returns whereby local currencies tend to
depreciate during their own trading hours and appreciate outside them.
Cornett et al (1995) studies hourly data for US trading hours of FX futures from the IMM (International
Monetary Market ‐ a division of the CME) for the period 1977 to 1991. Looking at the Deutsche mark,
1 Order flow is the net buying pressure for foreign currency and is signed positive or negative according to whether the initiating party in a transaction is buying or selling (Lyons, 2001). 2 The issue of time‐of‐day effect on returns has received more attention in equity markets (cf., for example, Harris (1986), Smirlock and Starks (1986), Yadav and Pope (1992) and Kelly and Clark (2011)). This is slightly surprising, given the comparatively short trading hours and less promising results found in this market. These studies do not consistently find a strong intraday pattern in equity markets except Kelly and Clark (2011) who find a significantly higher close to open returns (relative to open to close) for ETFs.
3
British pound, Swiss franc, Japanese yen and Canadian dollar, all against the US dollar, they find a
significant tendency for the foreign currency to rise during US trading hours, with the majority of that
rise occurring in the first and last two hours of trading. They also find that the foreign currency had a
significant tendency to fall outside US trading hours such that the overall daily returns had no significant
pattern. Ranaldo (2009) uses indicative quotes from the FX spot market to construct hourly data across
the whole 24‐hour trading period. He uses the same exchange rates as in Cornett et al (1995) in addition
to Deutsche mark (euro) against the yen over a more recent period (from 1993 to 2005). He also finds a
statistically significant tendency for the domestic currency to depreciate in its own trading hours.
In this paper, we look in more detail at this phenomenon over the period 1997 to 2007 using data on FX
spot rates and order flow from Electronic Broking Services (EBS) – the main electronic broker for the
major currencies (the dataset obtained from EBS ends in 2007 so unfortunately we cannot study the
recent period of market turbulence). This EBS data gives us two important advantages over the two
studies described above. First, EBS gives data on firm bid and offer prices throughout the trading day,
ensuring a more accurate measure of returns and allowing us to measure precisely the potential trading
profits (for a user of the EBS system at normal market size) from strategies that exploit the predictable
intraday pattern discussed above. Second, our dataset also offers information on trades executed
through EBS, allowing us to track a significant portion of total order flow in the market, and so allows us
to explore the role of order flow in explaining the intraday pattern in returns. We then supplement this
data with more detailed data from a single market maker. Our approach is entirely empirical and we
favour simple models throughout, though the phenomena we discuss here could in principle be
modelled as some form of rational inattention, perhaps incorporating time‐dependence and observation
costs such as in Abel, Eberly and Panageas (2009).
The rest of this paper is organised as follows. Section 2 describes our data and the statistical properties
of the time‐of‐day effect. Section 3 investigates whether this pattern is related to FX order flow. Section
4 corroborates our results using more detailed data provided by a single market maker. Section 5
concludes.
2 Data and time‐of‐day effects
2.1 Data
We employ a detailed transactions data set for the period January 1997 to the beginning of June 2007
from EBS that is the dominant electronic broker. Along with Reuters, the EBS electronic order book has
now effectively displaced voice brokers and direct dealing between traders. In practice EBS has become
dominant in the major currency pairs (EUR/USD and USD/JPY), while Reuters dominates in most of the
minor crosses. In this paper we analyse six crosses (EUR/USD, USD/JPY, GBP/USD, EUR/JPY, USD/CHF
and AUD/USD) in order to give results for a range of different time zones, while focussing mainly on the

4
major crosses in which EBS is dominant3. By combining data from the BIS triennial survey of foreign
exchange turnover with data from Breedon and Vitale (2010) on the relative position of EBS and Reuters
in electronic trading, we estimate that our EBS data covers roughly one half of total turnover in
EUR/USD, USD/JPY, EUR/JPY and USD/CHF and less than 5% of GBP/USD and AUD/USD turnover (where
Reuters dominates).
Over the whole sample we have the number of buy and sell orders and the price at which each trade
was undertaken. We also have data on the best bid and offer available which covers the full sample,
barring a few periods when no trading occurs and none is expected (e.g. Saturday morning GMT). For
most crosses we exclude weekends from our analysis, from Friday 24:00 to Saturday 24:00 GMT, though
in the case of JPY and AUD, the week is extended from Saturday 18:00 GMT to Friday 24:00 GMT.4 For
the main results in this paper we include holidays, except where no trading occurs whatsoever5. For the
purposes of this paper we aggregate the transaction data into hourly data so that we work with the end‐
hour bid and ask prices and the cumulative trades over the hour.
2.2 Time of Day effects
We begin by testing the relationship between both hourly returns and trading session returns and the
time of day for our sample of currencies. Throughout this section we define returns using the prevailing
midquote price at the beginning and end of each hour/trading session. Our initial goal is to confirm the
results of Cornett et al (1995) and Ranaldo (2009), that local currencies tend to depreciate in their own
trading hours and to appreciate outside them, and to establish any hourly patterns that contribute to
that effect. Of course, as an OTC market that trades across several time zones, the foreign exchange
market does not have precise trading hours, though it is clear that traders in particular locations tend to
operate over fairly fixed trading hours. We take futures trading hours (FX futures where possible) as our
guide and find that these opening hours fit well with distinct increases in trading volume that occur
before – and thus are unrelated to – news releases and standard fixings (and so are presumably related
to the initial trading activity of local traders become active). We then convert these hours into New York
time which is the universally accepted reference time zone for OTC FX transactions (i.e. the end of the
trading day is defined as 5pm New York time, and FX option expiry is at 10am). Table 1 presents our
assessment of these hours (note that the results presented below are not substantially affected by the
precise choice of trading times).
3 Although triangular arbitrage prevents EUR/JPY deviating significantly from (EUR/USD)×(USD/JPY), there is still substantial independent midquote variation. 4 These definitions of working time match the main trading activity in the different world regions. Other definitions have been considered and the results remain unchanged. 5 In particular, we checked all the tests both including and excluding periods of no transactions. This control test guarantees that all the patterns are related to the trading activity and all trading rules are tradable.
5
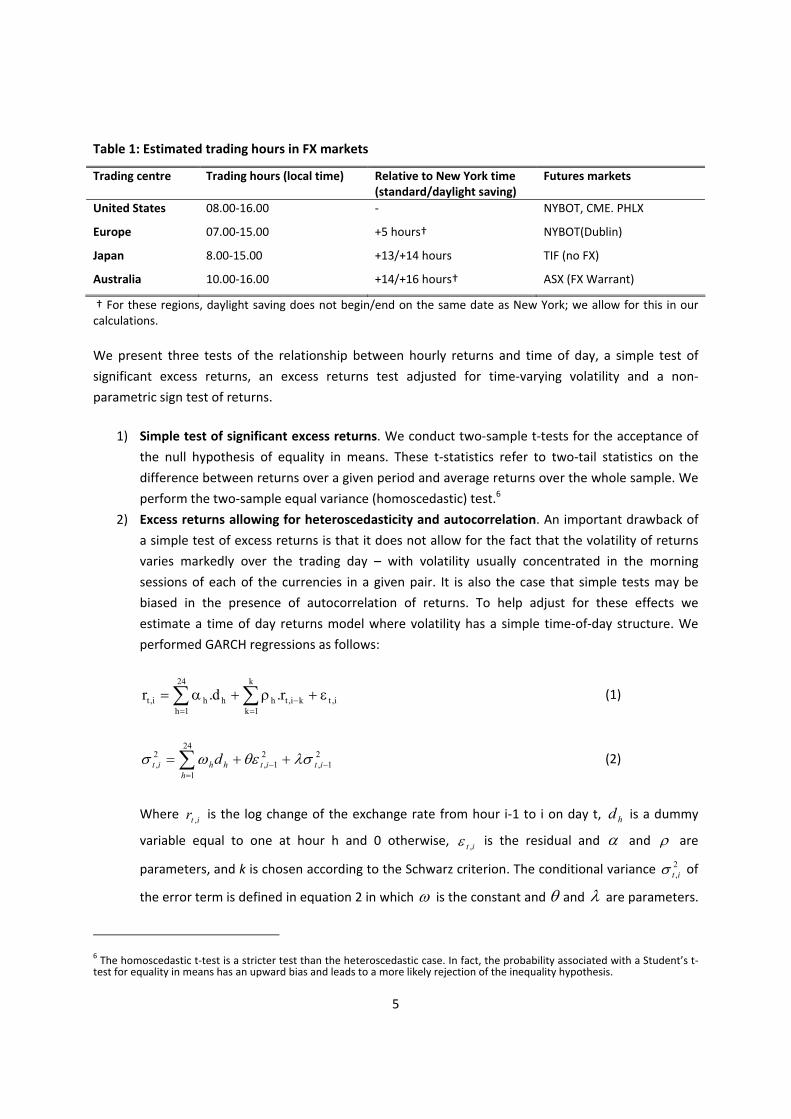
Table 1: Estimated trading hours in FX markets
Trading centre Trading hours (local time) Relative to New York time (standard/daylight saving)
Futures markets
United States 08.00‐16.00 ‐ NYBOT, CME. PHLX
Europe 07.00‐15.00 +5 hours† NYBOT(Dublin)
Japan 8.00‐15.00 +13/+14 hours TIF (no FX)
Australia 10.00‐16.00 +14/+16 hours† ASX (FX Warrant)
† For these regions, daylight saving does not begin/end on the same date as New York; we allow for this in our calculations.
We present three tests of the relationship between hourly returns and time of day, a simple test of
significant excess returns, an excess returns test adjusted for time‐varying volatility and a non‐
parametric sign test of returns.
1) Simple test of significant excess returns. We conduct two‐sample t‐tests for the acceptance of
the null hypothesis of equality in means. These t‐statistics refer to two‐tail statistics on the
difference between returns over a given period and average returns over the whole sample. We
perform the two‐sample equal variance (homoscedastic) test.6
2) Excess returns allowing for heteroscedasticity and autocorrelation. An important drawback of
a simple test of excess returns is that it does not allow for the fact that the volatility of returns
varies markedly over the trading day – with volatility usually concentrated in the morning
sessions of each of the currencies in a given pair. It is also the case that simple tests may be
biased in the presence of autocorrelation of returns. To help adjust for these effects we
estimate a time of day returns model where volatility has a simple time‐of‐day structure. We
performed GARCH regressions as follows:
i,t
k
1kki,th
24
1hhhi,t r.d.r ε+ρ+α= ∑∑
=−
=
(1)
21,
21,
24
1
2, −−
=
++= ∑ itithh
hit d λσθεωσ (2)
Where itr , is the log change of the exchange rate from hour i‐1 to i on day t, hd is a dummy
variable equal to one at hour h and 0 otherwise, it ,ε is the residual and α and ρ are
parameters, and k is chosen according to the Schwarz criterion. The conditional variance 2,itσ of
the error term is defined in equation 2 in which ω is the constant and θ and λ are parameters.
6 The homoscedastic t‐test is a stricter test than the heteroscedastic case. In fact, the probability associated with a Student’s t‐test for equality in means has an upward bias and leads to a more likely rejection of the inequality hypothesis.
6
This GARCH model accounts for three main statistical characteristics of the time series of
intraday returns: autocorrelation, heteroscedasticity and non‐Gaussian errors. We also
experimented with some other specifications such as including a moving average term, but this
did not materially change the model results specification. We present the cumulative value of
the hourly dummies over each trading session and their joint significance in Table 2
3) Sign test. As a simple non‐parametric test of the properties of trading session returns we also
assess the probability of observing positive hourly returns in a given trading session and test the
significance of that probability relative to the share of positives in the whole sample using a
binomial test based on cumulative Bernoulli distribution (we also conducted the Wilcoxon
signed ranks test – results available from the authors).

7
Figure 1: Cumulative returns over an average day 1997‐2007 (New York time)
EUR/USD (base currency EUR) USD/JPY (base currency USD)
EUR/JPY (base currency EUR) GBP/USD (base currency GBP)
USD/CHF(base currency USD) AUD/USD (base currency AUD)
Average annualised log returns cumulated over a trading day. Columns in bold indicate hourly return is significantly different from zero at the 5% level (based on simple t‐test described above). Boxes indicate trading sessions based

8
on futures markets opening hours and dotted line indicates cases where trading session hours vary for a significant period when daylight saving occurs.
Figure 1 presents visual evidence that hourly FX returns do seem to follow significant time‐of‐day
patterns, which, as predicted, show that local currencies tend to depreciate during their own trading
hours. Table 2 tests the trading hours phenomenon more precisely by conducting our tests on
opening‐to‐closing or opening‐to‐opening (for the cases when the opening session of one side of the
currency pair occurs whilst the first market is still open – such as EUR/USD). To understand the
relationship between Figure 1 and Table 2, note that Figure 1 shows cumulative returns, hour‐by‐
hour, over the whole trading day, whilst Table 2 shows returns from the beginning of a trading
session to its end (or beginning of the next trading session in the other location– whichever comes
first). Thus the trading session returns shown in table 2 are approximately comparable to the
cumulative return between the beginning and end of the trading session (or start of next session in
the other location) shown in Figure 1. The comparison is approximate since mismatches in daylight
saving mean that the beginning and end of trading sessions are not always the same when
measured in New York time. So, for example, Figure 1 shows the cumulative return for EUR/USD
from midnight to 8am as ‐0.69 subtracting from this the cumulative return from midnight to 2am of
0.19 gives a return over the European session (2am to 8am NY time) of ‐0.88. Table 2 shows this
figure as ‐0.84 since it adjusts for the slight daylight saving mismatch (due to a longer daylight saving
period in the US).
Table 2: Statistical properties of trading session returns
Trading session Mid‐quote return
GARCH model Dummies
Share positive Trading Strategy return inc. costs
EUR session ‐0.084** ‐0.095** 0.44** 0.06 EUR/USD USD session 0.100** 0.111** 0.53* 0.07 USD session 0.000 0.018 0.50 ‐0.05 USD/JPY JPY session 0.017** 0.029* 0.51 ‐0.13 EUR session ‐0.057** ‐0.040* 0.48** ‐0.42 EUR/JPY JPY session 0.029** 0.041* 0.52 ‐0.05 GBP session ‐0.071** ‐0.066** 0.45** ‐0.12 GBP/USD USD session 0.092** 0.126** 0.55** ‐0.08 USD session ‐0.088** ‐0.105** 0.48 ‐0.02 USD/CHF CHF session 0.095** 0.108** 0.56** ‐0.08 AUD session ‐0.028** ‐0.038* 0.50 ‐0.51 AUD/USD USD session 0.016** 0.023 0.52** ‐0.50
Annualised log returns *,** indicate statistical significance at the 5% and 1% level respectively (t‐test for mid‐quote return, F‐test for GARCH and Binomial Test for share positive). Further details in the text
9
Starting with the simple mid‐quote return, all returns are of the predicted sign and significant except
USD/JPY in the USD session. Although not shown in the table, we find that in all cases the return in the
home session is significantly lower than the return in the foreign session at the 1% level (i.e. the
difference in returns between the two sessions is highly significant).Testing for an intraday pattern after
adjusting for autocorrelation and heteroscedasticity in returns, the results are very similar though less
significant with AUD/USD in the USD session becoming insignificant and a number of session returns
becoming significant at the 5% level rather than the 1% level (though once again the difference between
the two sessions is significant at the 1% level for all cases except USD/JPY). Finally, although not all the
sign tests are individually conclusive the pattern of probabilities is consistent.
The final column of Table 2 shows the returns from a simple open‐to‐close/open‐to‐open trading
strategy including transactions costs. Thus in this case we measure returns using bid and ask prices
rather than the midquotes used in the rest of the table and go short the base currency in its own trading
hours and long in the trading hours of the counter currency. It is worth recalling that on EBS the quoted
bid and ask prices are firm and thus could be transacted at normal size by the interdealer community. As
might be expected, most of these simple time‐of‐day trading strategies are not profitable when trading
costs are included. However, the notable exception is EUR/USD where the significant intraday pattern
combined with narrow spreads in this cross means that this basic strategy has been profitable on
average with Sharpe Ratios of 1.3 and 0.9 respectively for the morning short and afternoon long. This
result is even more surprising when one considers that we have made no allowance for bank holidays or
other simple adjustments that could presumably improve returns7 since we wish to minimise the
possibility of data‐mining biases. Whilst we have no direct evidence on why these intraday excess
returns are not eliminated by dealer trading, there are significant risks associated with holding intraday
positions particularly given the limited capital usually devoted to dealers.
2.3 Stability through time
Since the time‐of‐day phenomenon was first documented some years ago (Cornett et al (1995)), it is
possible that its impact has diminished more recently. Figure 2 shows the significance of the EUR/USD
trading day effect through time by estimating average returns over the European and US trading
sessions year by year. Interestingly, although the returns over each session individually show
considerable variation, the difference in returns between the two sessions remains remarkably stable.
Only in 2004 do we find marginally higher returns in the EUR session than in the USD session in almost
all other years the gap between returns is both significant and of the expected sign. We find similar
stability over time for the other currency pairs.
7 Bank holiday effects seem quite powerful in practice. For example, the dollar has appreciated against the euro (or DM) over the July 4 Federal holiday on 15 of the last 20 occasions. This is presumably due to the absence of US‐based order flow on that day (see Ranaldo (2010) for further analysis).

10
Figure 2: Trading day effect over time (EUR/USD)†
Average annualised log return for each year. *,** indicates difference in average returns between the two sessions is significant at 5% and 1% level respectively using standard t‐test. Black solid borders indicate that returns in that session significantly different from zero at 5% level. †Results based on DEM/USD before 1999.
3 Time of day effects and order flow
In section 2, we saw that all the currencies in our sample displayed a significant tendency to depreciate
in local trading hours and that, in the case of EUR/USD, this tendency could be exploited to generate
trading profits. In this section, we explore the relationship of this effect to order flow.
We measure order flow as buyer‐initiated trades minus seller‐initiated trades on EBS (measured from
the viewpoint of the base currency). Although EBS has a significant advantage over other sources in
terms of market coverage, it is mainly an interdealer trading platform, this implies that our order flow
measure is focused on the activity of dealers (mainly banks) rather than underlying customers such as
investment funds and corporates. However, although EBS is mainly an interdealer trading platform,
underlying customer order flow is a key driver of interdealer flow through ‘hot potato’ trading after a
customer trade. That is to say when a dealer receives a customer trade she will generally lay it off with
other dealers through the interdealer market within a few minutes (see for example Lyons (1997)). One
caveat to note however is that dealers need not lay off customer trades through placing market orders
into the interdealer market (i.e. by initiating trades), they may instead place aggressive limit orders that

11
attract market orders from other dealers. Such trades could weaken the correlation between customer
order flow and our measure. Few papers have addressed this concern though Berger et al (2008)
highlight this point and suggest it may create some slippage between customer trades and interdealer
order flow, but argue that this slippage is of less concern in large datasets such as ours. Fortunately, we
also have data on directly observed customer order flow which we discuss in section 4.
3.1 Time of day effects in FX order flow
Table 3 repeats the time‐of‐day analysis of Table 2, but this time for EBS order flow. Throughout the
table we see a tendency for local currency selling to occur in local trading hours although the effect is
not always significant (perhaps reflecting the incomplete coverage of our order flow data). The one
exception is AUD/USD where both the low market share of EBS coupled with AUD buying by larger Asian
trading centre such as Tokyo and Singapore mean there is more AUD selling recorded on EBS in the USD
session than in the AUD session. Generally, however, we tend to see a strong relationship between
average hourly order flow and average hourly returns (Figure 3).
Table 3: Statistical properties of average trading session order flow Time period Average
Order flow GARCH Model
Share positive Residual returns
EUR session ‐10.42** ‐8.49** 0.457** 0.0098 EUR/USD USD session 20.64** 31.60** 0.522** 0.0004 USD session ‐1.64* ‐1.31 0.496 0.0003 USD/JPY JPY session 2.62 1.55 0.505 0.0003 EUR session ‐6.34** ‐3.15* 0.487* ‐0.0006 EUR/JPY JPY session 0.46 0.14 0.520** 0.0001 GBP session ‐1.58** ‐1.70** 0.483** ‐0.0001 GBP/USD USD session 1.06** 1.70** 0.509* 0.0004 USD session 2.63 10.03* 0.496 ‐0.0005 USD/CHF CHF session 8.77** 9.00** 0.530** ‐0.0002 AUD session ‐1.42 2.69* 0.502 ‐0.0002 AUD/USD USD session ‐2.30* ‐2.17 0.598 0.0000
Average order flow imbalance over trading session in number of trades *,** indicate statistical significance at the 5% and 1% level respectively. For Column 3 ‐ the test is a T‐test for assessing the difference in order flow averages (during country working hours versus the entire sample). Column 4 shows the total trading session effect from a GARCH regression of hourly order flow regressed on constant, AR(1) and dummy variables capturing the hour of the day ‐ the test is a Wald test to assess if coefficients related to the dummy variables of the country working hours are different from zero. Column 5: shows the share of occasions that the average order flow imbalance over the session minus the sample average imbalance is positive, significance is from a binomial test based on cumulative Bernoulli distribution. Column 6: shows residual cumulative mid‐quote returns over the trading session after allowing for the impact of order flow on returns, test is t‐test of whether residual returns over trading session is significantly different from zero.
This result suggests that it is the timing of trades that is largely responsible for the intraday pattern in
returns. A plausible explanation for this pattern of order flow (which we discuss further below) is that
international investment funds tend to conduct currency trades in their own trading hours and that
since they tend to receive net inflows of domestic currency this implies a bias against the local currency
in domestic trading hours. Additionally, Cornett et al (1995) highlight currency of invoicing effects that
lead importers to be net demanders of foreign currency rather than exporters, as imports are more

12
commonly invoiced in foreign currency. Once again the tendency of these trades to be conducted in
local trading hours gives the pattern we observe here.
3.2 The order flow returns relationship
As Figure 3 shows, both FX returns and order flow display a similar intraday pattern. In this section we
describe a simple test we have undertake to see if pattern in order flow can explain the pattern in
returns.

13
Figure 3: Cumulative order flow and returns on an average day (New York time)
EUR/USD USD/JPY
EUR/JPY GBP/USD
USD/CHF AUD/USD
Columns show cumulative order flow in number of trades (right‐hand scale). Line shows cumulative annualised log returns (left‐hand scale). Columns in bold indicate hourly order flow significantly different from zero at the 5% level based on t‐test. Other notes as in Figure 2.
14
To do this we employ the simple model of order flow and returns, like the one proposed by Hasbrouck
(1991), where returns are a function of contemporaneous order flow and lags of both order flow and
returns. Although this kind of model has been criticised both for assuming that contemporaneous
returns do not influence order flow and for not allowing for any cointegrating relationship between
cumulative order flow and the asset price (see for example, Love and Payne (2008)), it is adequate for
our purpose since we simply require a straightforward framework in which to analyse the intraday
pattern of order flow and returns. As is standard in the literature (e.g. Chinn and Moore (2008)), we find
a very strong contemporaneous relationship between order flow and returns with lagged effects
generally far weaker and usually insignificant (details available from the authors). The last column of
table 3 shows the average cumulative residuals of our simple model over each trading session and tests
if they display any residual intraday pattern. The tests confirm that they do not, suggesting that the
intraday pattern in order flow is sufficient to explain the intraday pattern in returns.
4 Evidence from a Single Market Maker
Although order flow data from EBS give us an excellent coverage of the interdealer market, it has limited
information on underlying customer trades and none on the geographical location or identity of the
counterparties. In this section, we look at data from a single market maker in order to address these
limitations.
We are lucky to have access to order flow data from BNP Paribas on both the geographical location and
type of customer orders. Paribas have kindly supplied us with data on the size, sign and counterparty
type and geographical location of all their customer trades over the period January 2005 to May 2007.
Although not a key market maker, BNP Paribas is estimated to be one of the top 15 market makers (in
terms of market share) for corporations, banks and real money accounts (with estimated market shares
of 3.1%, 2.9% and 1.4% respectively), though not for leveraged funds (Euromoney (2008)).
The first 2 rows of table 4 replicate the results from table 3 using the BNP Paribas data (though with
order flow imbalance is expressed in millions of dollars rather than number of trades). These results
confirm the general pattern found in Table 3 with net selling of the local currency occurring in local
trading hours and net buying of the local currency in the foreign trading hours. The two exceptions are
GBP/USD and USD/CHF where there is net sterling selling/dollar buying in US hours and net Swiss franc
buying/dollar selling in Swiss trading hours – though neither is significant. Table 4 also shows a more
detailed analysis of order flow in different trading periods by different location of customer. In each case
it shows average order flow imbalance for customers in a given location over their local trading hours.
This data generally confirms that it is local customers that tend to be net sellers of their local currency in
local trading hours, though this effect is only statistically significant in a few cases. The strongest results
are for USD/JPY, where both US and Asian imbalances are significant. For this breakdown, the only
exception to this selling in local hours pattern is USD/CHF in European trading hours.

15
Table 4: Average order flow imbalance in local trading hours: BNP Paribas data EUR/USD USD/JPY EUR/JPY GBP/USD USD/CHF AUD/USD
Local Session Order Flow ‐1.02 ‐0.31* ‐0.06 ‐0.04 0.23 ‐0.25*
Foreign Session Order flow 0.30 0.83* 0.11* ‐0.02 0.18 0.25*
European‐based order flow ‐0.85 ‐0.30 ‐0.04 ‐0.28
US‐based order flow 0.01 ‐0.20* 0.03 ‐0.06 0.02
Asia/Australasia‐based order flow 0.90* 0.07* ‐0.06*
Average order flow imbalance in millions of dollars. Rows 1 and 2 are average order flow imbalance in a given trading session (local=order flow imbalance in the base currency trading session, foreign=quote currency session) Rows 3 to 5 are for customers of a given geographic location in their own trading hours. * indicates that imbalance is statistically significant at the 5% level based on a difference in means test versus mean imbalance of order flow over whole trading day.
Further analysis by type of customer (available from the authors) shows that banks and investment
funds have the strongest tendency to sell their own currency in local trading hours, while this effect is
not observed in trades by corporations (though the sample of such trades is small). This suggests that
the time‐of‐day pattern in order flow is certainly not restricted to currency of invoicing effects as implied
by Cornett et al (1995). This result is most notable in the case of EUR/USD where investment funds in
particular tend to be net sellers of their own currency at the beginning of each trading session.
5 Conclusion
Although the phenomenon we have outlined here is a relatively straightforward one and our empirical
approach has been a deliberately simple one, our results have wide‐ranging implications. First, we
provide evidence of the importance of order flow in driving FX returns through a mechanism not driven
by asymmetric information. Thus our results give further support to the microstructure approach to FX
in general and the importance of liquidity effects in particular. Second, as a description of intraday
dynamics, our results have implications for portfolio management and the timing of FX trades as well as
for the design of profitable intraday trading rules. Third, our results indicate the kind of mechanism
through which FX dealers can make significant trading profits without any informational advantage and
despite narrow quoted spreads (see for example, Mende and Menkhoff (2006)), in this case by
intermediating between different trading sessions. Of course, we have left a number of important
questions unanswered. For example, why do investors not time their trades more effectively, and could
a more sophisticated trading rule increase the profitability of time‐of‐day trading strategies? We leave
these questions to future research.
16
References
Abel A., Eberly J. and Panageas S. (2009): “Optimal Inattention to the Stock Market with Information Costs and Transactions Costs”, NBER Working Paper No. w15010.
Anderson A. and Bollerslev T. (1998): “Deutsche Mark‐Dollar volatility: intraday activity patterns, macroeconomic announcements and longer run dependences”, Journal of Finance 53, 219‐265.
Baillie, R.T. and Bollerslev, T., (1991): “Intra‐day and inter‐market volatility in foreign exchange rates”, Review of Economic Studies 58, 565–585.
Berger D., Chaboud A., Chernenko S., and Howorka E. (2008) “Order Flow and Exchange Rate Dynamics in Electronic Brokerage System Data”, Journal of International Economics, vol. 75 (May 2008), 93‐109.
Breedon F. and Vitale P. (2010): “An empirical study of liquidity and information effects of order flow on exchange rates”, Journal of International Money and Finance 29, 504‐524.
Chinn M. and Moore M. (2008): “Private Information and a Macro Model of Exchange Rates: Evidence from a Novel Data Set”, NBER WP 14175.
Cornett M., Schwarz T., and Szakmary A. (1995): “Seasonalities and intraday return patterns in the foreign currency futures markets”, Journal of Banking and Finance 19, 843‐869.
Euromoney (2008) “FX poll 2008: FX moves to centre stage” Euromoney Magazine May 4.
Evans M. and Lyons R. (2005): “Meese‐Rogoff Redux: Micro‐Based Exchange‐Rate Forecasting”, American Economic Review Papers and Proceedings 95, 405–414.
Fatum R. and Hutchinson M. (2003): ”Is Sterilised Foreign Exchange Intervention Effective After All? An Event Study Approach”, The Economic Journal 113, 390–411.
Froot K. and Ramadorai T. (2005): “Currency returns, intrinsic value and institutional investor flows”, Journal of Finance 60, 1535‐1566.
Hartmann P. (1999): “Trading volumes and transactions costs in the foreign exchange market: Evidence from daily dollar‐yen spot data”, Journal of Banking and Finance 23, 801‐824.
Harris, L. (1986): “A transaction data study of weekly and intradaily patterns in stock returns”, Journal of Financial Economics 16, 99‐117.
Hau H., Massa, M. and Perress, J (2010): “Do demand curves for currencies slope down? Evidence from the MSCI Global index change”, Review of Financial Studies 23, 1681‐1717.
Ito, T., Hashimoto, Y. (2006): “Intraday seasonality in activities of the foreign exchange markets: Evidence from the electronic broking system”, Journal of the Japanese and International Economics 20, 637‐664.
Kelly, M. and Clark, S. (2011) “Returns in trading versus non‐trading hours: The difference is day and night”, Journal of Asset Management 12, 132‐145
Love, R. and Payne, R. (2008): “The Adjustment of Exchange Rates to Macroeconomic Information: the role of Order Flow”, Journal of Financial and Quantitative Analysis 43, 467‐488.
Lyons R. (1997) “A Simultaneous Trade Model of the Foreign Exchange Hot Potato” Journal of International Economics, May 1997, 275‐298.
Mende A. and Menkhoff L. (2006): “Profits and speculation in intra‐day foreign exchange trading”, Journal of Financial Markets 9, 223‐245.

17
Ranaldo A. (2009): “Segmentation and time‐of‐day patterns in foreign exchange markets”, Journal of Banking & Finance 33, 2199‐2206.
Rogoff K. (1983): “Time‐series studies of the relationship between exchange rates and intervention: a review of the techniques and literature”, Staff Studies 132, Board of Governors of the Federal Reserve System (U.S.).
Rime D., Sarno, L, Sojli, E (2010): “Exchange rate forecasting, order flow and macroeconomic information”, Journal of International Economics 80, 72‐88.
Smirlock M. and Starks L. (1986): “Day‐Of‐The‐Week and Intraday Effects In Stock Returns”, Journal of Financial Economics 17, 197‐210.
Yadav P. and Pope P. (1992): “Intraweek and Intraday Seasonalities in Stock Market Risk Premia: Cash vs. Futures”, Journal of Banking and Finance 16, 233‐270.

This working paper has been produced bythe School of Economics and Finance atQueen Mary, University of London
Copyright © 2012 Francis Breedon and Angelo Ranaldo
School of Economics and Finance Queen Mary, University of LondonMile End RoadLondon E1 4NSTel: +44 (0)20 7882 5096Fax: +44 (0)20 8983 3580Web: www.econ.qmul.ac.uk/papers/wp.htm
All rights reserved