school of chemical technology degree programme of ... · school of chemical technology degree...
TRANSCRIPT

School of Chemical Technology
Degree Programme of Bioproduct Technology
Kimmo Koivula
IMPROVING THE EFFICIENCY OF A BROWN STOCK WASHING LINE
Master’s thesis for the degree of Master of Science in Technology
submitted for inspection, Espoo, 23 September, 2014.
Supervisor Professor Olli Dahl
Instructors M.Sc. Marko Sundqvist
M.Sc. Riku Kopra

Aalto University, P.O. BOX 11000, 00076 AALTO
www.aalto.fi
Abstract of master's thesis
Author Kimmo Koivula
Title of thesis Improving the efficiency of a brown stock washing line
Department School of Chemical Technology
Professorship Environmental Management Code of professorship KM3004
Thesis supervisor Professor Olli Dahl
Thesis advisors M. Sc. Marko Sundqvist, M. Sc. Riku Kopra
Date 18.09.2014 Number of pages 87 Language English
Abstract
The objective of this Master’s thesis was to improve the efficiency of a brown stock
washing line. To improve the efficiency upper level control system and real-time measuring
devices were utilized.
The experimental part of this thesis deals with the introduction and development of an
upper level control system and refractometers, as well as the trials carried out to measure
the performance of the new installations. Furthermore, trials were carried out to find the
optimum values for operation parameters so that the washing line could be operated in an
economically and environmentally sustainable manner. The parameters included were
dilution factor, drum torque, feed consistency and production rate.
The results suggest that by using an upper level control system to control the dilution factor
of the entire brown stock washing line, by real time wash loss measurements as feedback
and by torque control of the washers it is possible to reduce the amount of brown stock
wash loss and simultaneously decrease the amount of used wash water. The obtained
decrease in wash loss and wash water usage significantly lowers the costs resulting in
bleaching plant and evaporation plant, as well as environmental burden.
Keywords Brown stock washing, upper level control, wash loss, refractometer

Aalto-yliopisto, PL 11000, 00076 AALTO
www.aalto.fi
Diplomityön tiivistelmä
Tekijä Kimmo Koivula
Työn nimi Sellun ruskean massan pesulinjan pesutehokkuuden parantaminen
Laitos Kemian tekniikan korkeakoulu
Professuuri Ympäristöasioiden hallinta Professuurikoodi KM3004
Työn valvoja Professori Olli Dahl
Työn ohjaajat Diplomi-insinööri Marko Sundqvist, Diplomi-insinööri Riku Kopra
Päivämäärä 18.09.2014 Sivumäärä 87 Kieli Englanti
Tiivistelmä
Tämän työn tavoitteena oli parantaa sellun ruskean massan pesulinjan tehokkuutta.
Tehokkuuden parantamisen työkaluina käytettiin ylemmän tason säätöä ja reaaliaikaisia
mittalaitteita
Kokeellinen osa keskittyy ylätason säädön ja refraktometrien käyttöönottoon ja
kehittämiseen, sekä suoritettujen koeajojen tuloksiin. Koeajojen tavoitteena oli mitata
uusien laitteiden ja säätöpiirien toimivuutta ja suorituskykyä. Lisäksi koeajojen avulla
pyrittiin löytämään optimaaliset ajoparametrit niin, että pesulinjaa pystyttäisiin ajamaan
kustanustehokkuuden ja ympäristöpäästöjen kannalta kestävällä tavalla. Koeajoissa
muutettavina ajoparametreinä käytettiin laimennustekijää, pesurummun momenttia,
syöttöpainetta ja tuotantonopeutta.
Tulokset osoittavat, että käyttämällä ylemmän tason säätöä koko ruskean massan pesulinjan
laimennustekijän hallintaan, käyttämällä reaaliaikaisia pesuhäviömittäreita
pesuhäviömääritykseen ja momenttisäätöä pesurummun nopeuden säätämiseen, voidaan
ruskean massan pesuhäviötä pienentää ja samanaikaisesti pienentää pesulinjalla käytetyn
pesuveden määrää. Saavutettu vähennys pesuhäviössä ja pesuveden käytössä pienentää
merkittävästi valkaisuvaiheen ja haihduttamon kustannuksia ja pienentää
ympäristökuormaa.
Avainsanat Ruskean massan pesu, ylätason säätö, pesuhäviö, refraktometri

Preface
This thesis was made in co-operation with UPM-Kymmene, Aalto University, K-
Patents and Metso Automation. The experimental part was carried out at the
UPM-Kymmene Kaukas Pulp mill in Lappeenranta between September 2013 and
April 2014.
During the thesis I became more aware of the challenges and possibilities related
to brown stock washing and I experienced and understood the complexity of the
process. I learned a lot and I can only pay tribute to the experts working in the
field; it takes commitment and hard work, and requires creativity.
I express my deep gratitude to the instructor of the thesis M. Sc. Marko Sundqvist
for guidance, support, and inspiring collaboration. I want to thank my second
instructor M. Sc. Riku Kopra for valuable technical advices and guidance in the
academic part of the thesis. I am grateful to Professor Olli Dahl who offered his
wide experience in the field, providing practical ideas and academic advices.
Moreover, my warm thanks go to Esko Kamrat for his help and support with the
measurement technology.
My thanks are extended to the personnel of the brown stock washing line for
sharing their expertise and helping in the development of the control system.
Furthermore, I owe my gratitude to the personnel in the pulp laboratory for their
constant and vitally important help with the analyses.
I hope research will continue active in the field of brown stock washing. There are
many possibilities to tame this savage process.

ABBREVIATIONS AND SYMBOLS
ADt Air dry metric ton
AOX Adsorbable organic halogens
APE Actual Process E-value
BDt Bone dry metric ton
COD Chemical oxygen demand
DF Dilution factor
DR Displacement ratio
DS Dissolved solids
ROI Return on investment
TDS Total dissolved solids
UV Ultra Violet
E Efficiency value
Evap Evaporation
L liquor flow
L0 Unwashed pulp stream
L1 Washed pulp stream
nD Refractive index
R Wash liquor ratio R
S Shower flow
V1 Filtrate stream
V2 Wash liquor stream
W Wash liquor ratio W
X0 Concentration in feed pulp
X1 Concentration in discharge pulp
Y Wash yield
Y1 Concentration of wash filtrate
Y2 Concentration of wash liquor
Consistency
λ Wave length

Table of Contents
1. Introduction ........................................................................................................... 8
2. Brown stock washing .............................................................................................. 9
2.1 Theory ....................................................................................................................... 9
2.2 Evaluating performance .......................................................................................... 13
2.3 Evaluating result...................................................................................................... 18
3. Controlling ........................................................................................................... 28
3.1 DD-washer ............................................................................................................... 28
3.2 Washing line ............................................................................................................ 34
4. Economic analysis................................................................................................. 40
4.1 Cost effectiveness ................................................................................................... 40
4.2 Economic effects on other departments ................................................................ 41
4.3 Investment decision ................................................................................................ 44
5. Summary of literature review ............................................................................... 46
6. Objectives of experimental part ............................................................................ 47
7. Introduction to pulp mill ....................................................................................... 48
8. Materials and methods ......................................................................................... 50
8.1 Refractometers ....................................................................................................... 50
8.2 Upper level control system ..................................................................................... 54
8.3 Analyses .................................................................................................................. 57
8.4 Trial runs ................................................................................................................. 59
9 Results and discussion ........................................................................................... 61
9.1 Composition of liquors ............................................................................................ 61
9.2 Wash loss determination ........................................................................................ 63
9.3 Performance of the installed equipment ................................................................ 67
9.4 Dilution factor control ............................................................................................. 72
9.5 Production rate ....................................................................................................... 78
9.6 Feed consistency ..................................................................................................... 79
9.7 Drum torque ........................................................................................................... 80
9.8 Payback time ........................................................................................................... 81

10 Summary of experimental work ........................................................................... 82
11 Conclusions and proposals for improvements ....................................................... 83
11.1 Upper level control system ................................................................................... 83
11.2 On-line measuring devices .................................................................................... 85
11.3 Brown stock washing line performance................................................................ 87
References ............................................................................................................ 88

8
1. Introduction
Good performance of the brown stock washing line is important for the whole
pulp mill considering the mill’s energy consumption and environmental load, as
well as the pulp quality. In the control of the line various, sometimes
contradictory objectives have to be achieved. These objectives include cleanliness
of pulp, chemical and organic matter recovery, minimum evaporation need for
black liquor and minimum environmental load. The most favourable economic
and environmental result is obtained when the pulp is washed as clean as possible
with as little washing water as possible.
To achieve an effective trade-off between the before mentioned objectives of
brown stock washing, comprehensive and precise control of the washing line is
needed. An effective control requires both proper inline monitoring of the wash
loss and an upper level control system to adjust the water usage and other key
parameters of the whole washing line.
The literature review discusses theory of pulp washing, starting from the
mechanisms and moving on to the evaluation of performance and result, where
different methods to evaluate wash loss are presented and compared. The third
chapter discusses the control of an individual DD-washer and the advanced
control of an entire washing line. The literature review concludes in an economic
analysis of brown stock washing, where cost effectiveness and economic
implications of brown stock washing for the whole pulp mill are discussed. In
addition, the decision to invest on an advanced control system is discussed.
In the experimental part the performance obtained by the installed control system
and inline refractometers was tested. The performance was analysed as dissolved
solids to evaporation and wash loss to bleaching. Effect of operational parameters
such as dilution factor, drum torque and feed consistency on wash loss was tested.
Furthermore, conductivity and dissolved solids were compared as inline wash loss
measurements.

9
2. Brown stock washing
2.1 Theory
Purpose of brown stock washing
The primary purpose of brown stock washing is to remove the impurities from the
pulp and recover the soluble organic matter for energy production and the cooking
chemicals for regeneration. The removal of soluble substances should be done
with as little water as possible and at the same time the pulp should be as clean as
possible. These objectives are somewhat contradictory and the challenge is to
create a compromise which delivers an economic and environmental optimum.
Pulp cleanliness in its introduction to bleaching stage is important from both
economic and environmental aspects. It strongly influences the amount of
bleaching chemicals needed in bleaching stage, as the chemicals are used to
oxidize and extract the unwanted material left in the pulp. The cleaner the pulp is
after washing, the fewer chemicals have to be used. From the environmental point
of view high bleaching chemical consumption is not desirable, since it leads to an
increased load to the environment. Furthermore, dirty pulp in bleaching might
result in the formation of environmentally hazardous compounds. From the
economic point of view, the use of bleaching chemicals is expensive. Moreover,
pulp cleanliness might enhance the quality of the fibres.
Sufficient wash water has to be used in order to achieve adequate pulp cleanliness.
Nevertheless, excess water used in washing stage brings economic burden since
water has to be separated from black liquor by costly evaporation. In addition to
the economic concern, evaporation consumes large quantities of energy which in
turn might lead to environmental stress. (1)

10
Washing mechanisms
The washing process is based on two operations: dilution/extraction and
displacement washing. All pulp washing is based on these two principles.
In dilution/extraction washing, the pulp slurry is first diluted with weaker washing
liquor, then mixed and thickened by filtering or pressing. Dilution/extraction is
done as many times necessary to achieve the required washing result. In theory, to
achieve the same stock slurry concentration as in the washing liquid, an unlimited
number of dilution/extraction phases are needed. The effectiveness of this
mechanism is considered rather poor and it is dependent on the consistencies to
which the pulp is diluted and thickened. (1) (2) (3)
In displacement washing, the black liquor in the pulp mat is displaced with
weaker washing liquor or water. Mixing at the interface of the washing liquid and
black liquor is essential in this method. The lesser the mixing occurs; the better is
the washing result. Figure 1 depicts the principle of ideal displacement washing.
In theory, if no mixing would occur the displacement would take place with 100
percent effectiveness. However, mixing at the interface always takes place to
some degree. Due to the mixing at the interface, more washing liquid and/or more
washing stages have to be used to obtain the desired washing result. Moreover, in
order to be displaced, the solute sorbed onto the fibres would demand more time
to diffuse out of the fibres. (1) (2) (3)
Figure 1. Principle of displacement washing. (4)

11
Multistage and fractional washing
Modern brown stock washing lines are multistage lines. They comprise of several
washers, each of which may consist of various washing stages. Normally pulp
washers are set so, that the washing liquid runs counter current to the pulp stock.
The clean washing liquid is fed to the last washer of washing line, where the pulp
is cleanest. This arrangement, depicted in Figure 2, enables washing of cleanest
pulp with cleanest liquid and dirtiest pulp with dirtiest liquid. The idea of the
counter current washing is to utilize the same washing liquor for washing in all
washers, thus substantially improving the mills water economy and environmental
footprint (3)
Figure 2. Pulp washing using counter current principle. (3)
The same counter current principle is applied in individual multistage washers,
where the washer is divided into sections and the washing liquid contains different
concentrations in every section. The principle is to obtain more washing stages
with the same wash water consumption, thus improving the washing efficiency.
Figure 3 illustrates the principle of a two stage fractional washing, where the
washing liquid is divided in two parts; cleaner and dirtier. The cleaner filtrate of
the second washing stage (2/2) is directed to the cleaner part of the first stage
(1/2). In the same manner the dirtier filtrate of the second stage (2/1) is directed to
the dirtier part of the first stage (1/1). (1) (3) (5)

12
Figure 3. Principle of a two stage fractional washing (3)
Diffusion
In pulp washing there is a certain portion of liquid that is not washable by
physical operation. This is the bound liquid inside fibre voids. The only way
dissolved substances can transfer from inside the fibre to the free liquid outside
the fibre is trough diffusion. Diffusion happens due to a difference in
concentration between the liquid in the fibre void and the free liquid. Diffusion
rate is relative to the concentration difference so that it is faster with larger
concentration differences. (6) (7)
Diffusion rate depends on molecular structure. In brown stock washing diffusion
takes place in fast and slow phase. The small sodium ions diffuse fast
equilibrating the concentration difference in seconds, while large molecules such
as lignin take hours or even days to diffuse. There are a number of factors
affecting diffusion. Diffusion time shortening factors include large concentration
difference, long washing time and storage time, high temperature and small ion
concentration. Kovasin (8) suggests that diffusion has a significant effect only in
Hi-Heat washing. Solely in Hi-Heat washing temperature and delay are high
enough to result in significant diffusion. Figure 4 depicts an experiment on how
diffusion coefficient follows the theoretical Stokes-Einstein equation until 70 °C
and then starts to grow rapidly. It can be seen that between 80 °C and 90 °C the
diffusion coefficient increases by fivefold. (6)

13
Figure 4. The effect of temperature on intrafiber diffusion coefficient. (9)
2.2 Evaluating performance
Brown stock washing performance and washing result have been studied for
decades. At least since the 1950s several mathematical methods have been
developed to define the performance of washing. Many mathematical evaluation
methods have been created, followed by a number of modifications and
adjustments.
Washer performance parameters
When studying washer performance, the washing process is often demonstrated
using a black box model illustrated in figure 5. The model, originally developed
by Nordén, consists of four streams: the inlet and outlet pulp streams, the wash
liquor stream and the filtrate stream. Concentrations of dissolved solids in all four
streams are also defined. L0 and L1 are pulp streams, expressed as tons of
liquor/BDt. V1 and V2 are liquor streams, expressed as tons of liquor/BDt. X and
Y are concentrations, expressed as kg of dissolved solids/BDt. (1)

14
Figure 5 Generalized washing model (1)
Many mathematical indicators have been developed to define the performance of
a washer or a washing line. The most commonly used parameters are presented in
Table 1. Crotogino (1) divides these parameters into three following categories:
1. The amount of wash liquor used
2. The amount of solute removed
3. The efficiency of a pulp washer operating under
standardized inlet and discharge consistencies

15
Table 1. Parameters to study washer performance
Name of
parameter Formula
Parameters for wash liquor usage
Dilution factor, DF DF=V2-L1 (1)
Wash liquor ratio, R R=V2/L1 (2)
Wash liquor ratio, W W=V1/L0 (3)
Parameters for solute removal
Displacement ratio, DR 20
10
YX
XXDR
(4)
Wash yield, Y 00
11
00
111XL
YV
XL
XLY (5)
The amount of wash liquor used to pulp produced is important in terms of
evaporation load and sufficient wash water to achieve required washing loss.
Dilution factor (DF) illustrated in equation 1 is the only wash water parameter
calculated in relation to the pulp produced. Moreover, DF demonstrates the real
load going to evaporation. For displacement washing, DF = 0 means that equal
amount of wash water was used to displace the black liquor from the pulp.

16
The wash liquor ratios R, represented in equation 2 and W, in equation 3 are
defined as liquor balances and remain approximately equal if there is no change in
pulp inlet or outlet consistencies. These two parameters do not take into
consideration the pulp stream, thus making dilution factor the most commonly
used parameter to describe wash liquor usage.
Displacement ratio defined in equation 4 is a parameter determining the ratio of
dissolved solids removed in washing. In an ideal case displacement ratio would be
1, meaning the displacement of all dissolved solid in pulp. DR is not the most
suitable parameter to use when measuring washer efficiency, since the amount of
wash liquor is not considered. Even inefficient washer can achieve high DR, if
large quantity of washing liquid is used. Nevertheless, it can be used to measure
effectiveness, if DF is known. (8)
E-value described in equation 6 indicates washing stage efficiency, taking into
account the used washing liquid. Nordén has defined the parameter as “the
number of ideal mixing stages in series with a complete mixing of underflow and
overflow that is required to achieve the same departing overflow and underflow as
those of the washing stage”. E-value is applicable to any washing operation, since
it makes no reference to the internal functioning of the washing, only to the
internal functioning of the model. (10) (11)
12
21
10
1
0
/ln
ln
LV
YX
YX
L
L
E
(6)
Determining the inlet consistency of a washer has been noted to be difficult in
mill circumstances. As a solution for this a modification of the E-value, EAPE was
created. EAPE defined in equation 7 does not use inlet stock information, thus

17
making it a more suitable parameter for operation in mill site. APE is an
abbreviation of Actual Process E-value.
12
211
11
/1ln
)(
)(1ln
LV
YXL
YYDF
EAPE
(7)
E-value for the entire washing line can be calculated summing individual E-
values, as demonstrated in equation 8.
nn RERERERE ln...lnlnln 2211 (8)
Many measurements and analysis are needed to gather the data required for
performance evaluation. This is challenging especially due to the dynamic
behaviour of the brown stock washing line. There is often not enough data to give
sufficient and reliable information on sudden changes in the process. On-line
washing loss measurements have been used increasingly in order to get real time
information on process conditions and to adjust the process respectively. Methods
to measure process conditions are presented more closely in the following chapter.
Although measurement devices have developed to be more versatile and accurate,
process lag times and instability continue to offer challenges in performance
monitoring.

18
2.3 Evaluating result
Wash loss
In brown stock washing, wash loss indicates the amount of dissolved organic and
inorganic matter, which could not be removed during the washing stage. Many
parameters have been used to evaluate wash loss. The used parameters have
changed during the years, depending on the interest of the industry. Sodium loss
was widely used when recovery of cooking chemicals was the most important
parameter in washing. Sodium loss is a typical indicator to describe the wash loss
in washing. It is a good parameter to describe the cooking chemicals lost, but this
method does not take into consideration organic and other inorganic compounds
in pulp suspension. (12) (13)
When environmental concerns started to rise and O2-stages became more
common, it became increasingly more important to characterize the wash loss in
terms of organic solids. Consequently, chemical oxygen demand (COD) has partly
replaced sodium loss as a washing loss indicator. It is used to express the organic
matter lost in washing, as well as an indicator of bleaching chemical load needed
in bleaching. Subsequently, the COD can be used to assess the organic load to the
environment. (12) (13)
Today inline real time measurements are gaining more popularity in wash loss
evaluation. The measured parameters are mostly Total Dissolved Solids (TDS),
conductivity and dissolved lignin. TDS measures all dissolved material in the
solution, making emphasis on lignin content. Conductivity makes more reference
to inorganic material in a solution, whereas dissolved lignin measurement
measures only lignin. (12) (13)

19
Sodium
In the early years of brown stock washing the recovery of cooking chemicals was
seen as the most important factor of washing due to the rather expensive
chemicals. The amount of sodium in pulp suspension has traditionally been used
as an indicator of washing loss, generally expressed as kg Na2SO4/BDt. Sodium
loss illustrates the amount of sodium escaping from the chemical recovery cycle.
Nevertheless the disadvantage of this method is the fact that it does not consider
lignin and other organic substances. Moreover, the amount of organic substances
cannot be identified with sufficient accuracy, by determining sodium and using a
correlation curve, due to the ever-changing conditions of a washing line. Is to say,
even small changes in conditions change the correlation between sodium and
organic matter. Figure 6 illustrates how the correlation between COD washing
loss and sodium loss can vary between different mills. (14) (12)
Figure 6. Correlation between COD- and sodium based washing loss. (14)

20
Sodium and other inorganic substances in washing line are ionic and represent a
rather good correlation with conductivity. Thus, conductivity is widely used to
measure sodium loss. Furthermore, conductivity measurement is widely made
inline and used to monitor and operate the washing line. Conductivity is affected
by pH, which should be considered in the measurement, more so if there are large
changes in operation conditions or changes in wood species. Moreover,
conductivity is affected by temperature. (13)
Chemical oxygen demand (COD)
As the industry has started to take the environment more into consideration, it has
become important to define the organic washing loss from brown stock washing.
An important disadvantage of organic washing loss is the fact that the organic
substances can be converted to chlorinated organic compounds in first
conventional stage of bleaching and be discharged as harmful AOX (adsorbable
organic halogens). Moreover, organic washing loss increases bleaching chemical
consumption and therefore bleaching cost. To determine the organic wash loss,
chemical oxygen demand is widely used in the industry. COD is expressed as the
amount of oxygen equivalent consumed by a one liter of sample, using a specific
procedure (13). It can be expressed as filtrate COD (mg / ml), or as total COD,
(COD/BDt) which is the COD in both fiber voids and filtrate. (12) (13)
In his study, Botta (15) finds COD as a good indicator, because it depicts the
amount of organic substances, which is increasingly important. As COD levels
from pulp mills effluents are strictly regulated due to environmental reasons, COD
loss is a useful parameter to monitor in washing. However, Viirimaa/Sankari (16)
(17) (18) suggests that many compounds can generate significant COD as
presented in table 2, but only few of them affect bleaching performance or oxygen
delignification response. In continuation, only these few compounds can be called
“real washing loss compounds”, due to the negative effect on bleaching
performance. Table 3 represents the effect of the compounds on D0 stage
responses.

21
Table 2. Experimental COD levels of wash loss compounds. (16)
Table 3. Effect of different washing loss compounds on responses in the D0 stage.
(16)
Furthermore, Sillanpää (12) (19) stated COD as not a good tool to measure
washing loss, and suggest the measurement of lignin instead. Other disadvantages
of COD measurement are its weak repeatability and the rather long time delay
from quite long analysis.

22
Total dissolved solids
Washing loss evaluation based on total dissolved solids (TDS) is simple,
inexpensive and repeatable, when carried out in laboratory. For long it has been
used for troubleshooting and experimental studies. The analysis is made simply by
evaporating a liquor sample to constant dryness and indicating the result as % of
dissolved solids. The laboratory determination is applicable for liquors only. (13)
During recent years, there have been many cases of using a continuous
refractometer to measure TDS wash loss inline. Measurement is based on the
determination of the refractive index (nD) of a process solution. Refractive index
measurement is actually a measurement of the speed of light in a medium. The
index is defined as the ratio of speed of light in vacuum divided by that in the
medium. As the speed of light is highest in vacuum, refractive index is always
higher than 1.
The inline refractometer determines the refractive index of the process solution by
measuring the critical angle of refraction, using a yellow led light source with a
constant wavelength. The relation between the refractive index and the
concentration depends on the solvent and solute, temperature, and wavelength. By
using a monochromatic light source to avoid the wavelength dependency and a
thermometer to compensate the effect of temperature, the effect of dissolved
solids on the refractive index is defined accurately, subsequently determining the
concentration of dissolved solids. (20)
The principle of the refractive index measurement is illustrated in figure 7, where
(L) is the light from the light source, directed to the interface between the prism
(P) and the process solution (S). Two of the prism surfaces (M) bend the light rays
so that they meet the interface at different angles. The reflected rays of light form
an image (ACB), where (C) is the spot of the critical angle ray. The rays at (A) are
totally internally reflected at the process interface, the rays at (B) are partially
reflected and partially refracted into the process solution. So the optical image is
divided into a light area (A) and a dark area (B). The position of the shadow edge

23
(C) indicates the value of the critical angle. The refractive index nD can then be
determined from this spot. (20)
Figure 7. The principle of measuring refractive index (20)
Normally the molecular size of the dissolved solids has a significant effect on the
refractive index per molecular unit. The larger the molecular size, the larger the
refractive index per molecular unit. Lignin has a large molecular size which gives
an accurate correlation with refractive index measured by a refractometer.
Furthermore, in brown stock washing lignin presents a large share of the diluted
compounds in pulp solution, affecting greatly to the measured concentration by a
refractometer. This is an advantage for wash loss determination as recent
investigations suggest the measurement of lignin as a wash loss indicator. (19)
(21)
Kopra et al. (21) have studied the use of a refractometer as a wash loss indicator.
Suggested advantages of this method include the fact that the refractive index is

24
not influenced by particles, bubbles, fibers or color and can therefore be placed in
challenging conditions, even in medium or high consistency lines. As
disadvantage of the method it is suggested that the refractometer does not measure
lignin adhering to the surface of fibers. Figure 8 represents concentration
measured by a refractometer and consistency. From the figure it can be seen that
increased lignin increases consistency measured by refractometer. On the
contrary, conductivity decreases at the same time. Kopra suggest that the behavior
of the conductivity could be a result of the negative charge of lignin tended to be
neutralized by positive ions from the liquid.
Figure 8. The effect of commercial lignin addition on concentration and
conductivity in strong brown stock washing filtrates (250g). (21)
Furthermore, in concentrations used in brown stock washing, the refractometer
output correlates well with COD, thus enabling the creation of a COD output.
Figure 9 represents an experimental correlation of COD and concentration
measured by a refractometer in a brown stock washing line (22). Another
advantage of the refractometer is the wide measuring range, practically from 0 –
100 % concentration. (23)

25
Figure 9. Experimental correlation of COD and concentration measured by a
refractometer. (22)

26
Lignin measurement by light absorbance / transmittance
Another recent method to measure wash loss is an inline sensor utilizing the
strong light absorption of the lignin molecule in the ultraviolet and visible light. A
study group led by Andersson (24) et al. suggest that the output of the
measurement is directly proportional to dissolved lignin and can be quantified as
filtrate kappa number, i.e. the amount of lignin left in the filtrate. Alternatively,
output can be converted to COD, which presents a significant correlation with the
measurement. Light absorbance method has been used to measure lignin content
before but this method, according to the study, enables the measurement in the
presence of pulp fibers. This is due to a new measuring device, where the time
period with fibers in the measurement can be identified and erased from the data
used to calculate the light transmittance and absorbance, as illustrated in figure 10.
Finally, using these values the dissolved lignin concentration is determined. A
disadvantage of this method is that it cannot be used in the most important
washing performance calculations, such as DR or E-value (25).
Figure 10. Principal signal extraction of dissolved lignin sensor. (24)

27
As illustrated in upper chart of figure 11, black liquor light absorbance weakens
significantly as the wave length grows. For this reason the UV region is used in
kappa number measurements, preferably at 280 nm. The inline dissolved lignin
measurement utilizes higher wavelengths, where the absorption is significantly
lower, but still suitable for quantitative determination, claims a study by
Andersson (24). The coefficient r2
is depicted in lower chart of figure 11.
Experimental studies with this measurement have been carried out on pulp after
oxygen delignification. However, more experiments should be performed to
analyse the viability of the method in different concentrations. (24)
Figure 11. Upper: Spectra from black liquor samples. Lower: Correlation coefficient
between the absorbance and lignin content as a function of wavelength, λ. (26)

28
3. Controlling
3.1 DD-washer
Structure and washing phases
The structure of the drum displacer (DD) is depicted in figure 12. The cylindrical
surface of the rotating drum is divided in axial compartments, which act as
washing stages. The bottom of the drum is made of perforated plate, enabling the
black liquor to be displaced by washing liquid. Pulp is fed to the feed zone (2), at
0.2 – 0.6 bar pressure and in 4 – 10% consistency, depending on the process. A
uniform pulp pad is formed in the compartment, as the liquor exists trough the
perforated plates. As the drum rotates, the pulp pad enters the first washing zone
separated by string powered seal bars.
In the washing zone, wash liquid is injected evenly to the pulp from the washer
casing at 0.5 – 1.0 bar. Due to the pressure difference the wash liquid displaces
the black liquor in pulp. DD- washer usually has 1 - 4 washing stages. After the
last washing zone, excess liquid from the washed pulp pad is vacuumed and the
pulp is discharged.

29
Figure 12. Three stage DD-washer: 1.Pulp inlet, 2. Formation of pulp pad, 3. First
washing stage, 4. Second washing stage, 5. Third washing stage, 6. Vacuum stage,
7. Cake discharge, 8. Liquor exit, 9. Liquor from vacuum stage (vacuum container),
10. Wash liquid inlet. /Ahlstrom machinery/ (2)
Every washing stage of the drum receives washing liquid with different
concentration so, that the dirtiest liquid washes the dirtiest pulp in the first stage
and the cleanest liquid washes the cleanest pulp in the last stage. To illustrate the
function of the different stages, COD and dry solids contents in different fractions
of a two stage, three-fraction DD washer are depicted in figure 13. One drum
usually contains 1-4 washing stages, giving the drum significantly higher
performance than a conventional vacuum filter. (2)

30
Figure 13. COD (mg/dm3) and dissolved solids (in brackets, %) contents in different
fractions of a two stage, three-fraction DD washer.
Control of DD-washer
Conventionally the DD-washer is controlled by adjusting key parameters affecting
the washing process. These parameters are defined below.
In a conventional DD-washer control, operators adjust the amount of wash liquid,
pulp inlet pressure and wash liquid pressure, so that these three parameters
maintain a certain balanced state with desired production rate. This makes the
control of the dilution factor (DF) rather tricky. The operator has to optimize
many variables affecting the washing process, leaving the control of just one
parameter problematic.
Due to the importance of the dilution factor there has been a need for a more
sophisticated control method. There are applications utilizing feedforward from
the production rate to adjust the wash water flow and a constant dilution factor.
Additionally other methods for DF adjustment exist today. These will be
discussed more closely in the following chapter, 3.2. (27)

31
Excess use of washing water should be avoided in sake of profitability, as the
excess water will have to be evaporated resulting in high costs. High wash liquid
consumption also raises the wash water pressure, which might result in spill over
of wash liquid through seal bars. Too low wash liquid usage normally results in
higher washing loss. Furthermore, runnability problems such as too high
consistency of the pulp cake may occur. (28)
Conventionally, pulp feed pressure, adjusts the drum rotation speed. When the
feed pressure is raised, the drum starts to rotate faster, and contrariwise. If rotation
speed is too low, the pulp cake in the washer will pack too densely, which
increases the wash liquid pressure. If wash liquid pressure rises above 1 bar, there
is a risk that the washing liquid runs under seal bars and by-passes washing
stages. Furthermore, too low rotation velocity increase drum torque in exceed,
causing the drum to stop as the motor torque limit is surpassed. On the contrary, if
the velocity is too high, the pulp does not have sufficient washing time in the
washer, resulting in high washing loss. Moreover, with not enough time to form
properly in the feed zone, the quality of the pulp cake deteriorates. Figure 14
depicts an experimental result of how displacement ratio deteriorates rapidly when
feed pressure is taken under 20 kPa (29). The figure also hints that increasing the
feed pressure higher than 20 kPa does not enhance displacement ratio.
Figure 14. The effect of feed pressure on displacement ratio. (29)

32
Torque is used as a measurement of drum motor load. If torque is too high it has
to be lowered by lowering the pulp feed pressure, which in hand increments the
drum rotation velocity. Control of the DD-washer drum rotation speed using drum
torque as controlled variable is an alternative to the conventional feed pressure
control. Control of drum torque aims to maintain the pulp mat in a steady
consistency and give a more even formation to the pulp in washing. This should
in turn lead to a more constant washing result. In the approach torque is the
adjustable variable, instead of conventional feed pressure. Karjalainen
implemented the drum torque control in his study and reports steady control of
DD-washers and a possibility to use a higher level feed pressure. (28) (30)
In one application, the drum rotation speed is adapted to production rate and fuzzy
logic is utilized in the control (31). The idea of this approach is to keep the
rotation speed as low as possible to achieve high washing efficiency.
Pulp feed consistency has a great effect on a DD-washer washing performance.
In order to achieve an effective displacement, the pulp must form a uniform cake
in the washer feed zone. Feed consistency plays an important role in the formation
of the cake. If the consistency is too low, the feed flow must be boosted, which
increases the feed pressure and subsequently limits production rate. Another
problem with low feed consistency is the too tightly packed pulp cake, which
deteriorates the washing liquid permeability. On the other hand if the consistency
is too high for the washer, the pulp cake might carry air thus declining the
performance. Also the formation of a uniform pulp cake may fail due to too high
consistency. In this case the pulp mat is left with denser and looser spots,
producing the wash liquid to pass through the loose spots and leaving the dense
spots with less washing. However, for a DD-washer, it is more rare to have too
high of a consistency. (13) (32)
In contemplation of washer capacity, the drum speed and inlet consistency are
critical parameters. The capacity depends on both, drum speed and inlet
consistency as figure 15 illustrates.

33
Figure 15. Effect of drum speed and inlet consistency on drum capacity. (33)
In washing, a higher outlet consistency leads to a lower washing loss and is
therefore desirable. However, the correlation is not linear and the advantage of
higher discharge consistency is greater at systems having lower consistencies.
Table 4 shows a calculated effect of discharge consistency on soda loss. In the
table soda washing loss is presented as a function of discharge consistency and a
constant washing loss of 10 g/l is assumed. It can be seen that washing loss
decreases as discharge consistency increases. This is due to the simple fact that
there is less liquor present in higher discharge consistencies.
Table 4. Effect of discharge consistency on soda loss. A soda consistency of 10 g/l
is assumed. (4)

34
3.2 Washing line
Measurements
Continuous on-line measurements are essential part of the line control. It is
fundamental to know the state of the process in order to control it. It can be said
that if a variable cannot be measured, it cannot be controlled. Real time washing
loss measurements are presented in chapter 2.3. Moreover, many other variables
have to be measured in order construct a reliable and effective washing control
system. These variables include flows, consistencies, tank levels, temperature and
pH. However, these measurements are not discussed more closely in this paper.
(31)
Soft sensors are models used to express parameters that cannot be measured
directly, but have to be calculated or deduced using existing measurements as
inputs. One example is production rate, which is calculated from flow when
consistency is known. Soft sensors are able to provide important process data.
However it should be bared in mind that measurements have certain inaccuracy
and the uncertainty increases when many measurements are to obtain a soft
sensor. Other soft sensors include e.g. conductivity targets, delayed consistency or
rotation speed target. (34) (31)
Control of dilution factor of the washing line
As mentioned, the dilution factor is the single most important factor concerning
washing efficiency. Sufficient wash water should be used to achieve low washing
loss, and high pulp cleanliness, but excess water consumption deteriorates cost
efficiency as the water has to be evaporated later on at the evaporation plant. Due
to the countercurrent liquor flow of modern brown stock washing line, the control
of dilution factor should be adjusted for the whole washing line.

35
There is an optimum operating point for a dilution factor, where the requirements
of other departments are met so that minimum operating cost is achieved. Figure
16 represents an example of an optimum operating point of the dilution factor.
From the figure it can be seen, that if the dilution factor is too high the operating
costs increase due to cost associated in other departments, being mainly higher
energy consumption in evaporation. On the other hand if the DF is too low, costs
resulting in other departments increase again, especially in bleaching stage where
more bleaching chemicals have to be used. As a result, every deviation from the
optimum dilution factor results in higher operating cost. Therefore the lowest
operating cost and the optimal operating conditions are achieved by always
operating the plant at an optimal dilution factor.
Figure 16. Example of an optimum operating point of dilution factor. (35)
The optimum DF depends on the plant equipment and the plant conditions and
therefore each plant and each washing line has an individual optimum DF. If the
operating conditions of the plant would be considered stable, the optimum DF
would be stable as well. In this case it would be rather simple to operate the plant
at optimum dilution factor by using a feedforward from production rate to

36
maintain a constant DF. However this is not the case in practice, as the actual
process conditions are in constant movement. According to Lundqvist (36)
dilution factor must be correctly chosen in relation to the status of the washing
equipment, the properties of the pulp, and the prevailing black liquor conditions
inside the washing plant. In consequence, many control approaches have been
developed to adjust the dilution factor according to the before mentioned process
conditions.
Turner (37) suggests three principles for brown stock washing efficient control.
These principles are described below and illustrated in figure 17.
1. Level control with a feedforward element to decouple loops in order to
eliminate oscillations by changing the washing liquid flows for all
washers simultaneously
2. Dilution factor control using a feedforward from production rate to
maintain a constant dilution factor
3. Conductivity feedback to measure the washing quality and to correct
the dilution factor
Figure 17. Control of dilution factor of the whole washing line. (38)

37
Bender et al. (39) has implemented the use of refractometer and conductivity
meters to measure the solids and soda loss after the last washing stage in a four
washer line. These measurements together with a model based control system
resulted in 10% increase in production. Furthermore, control of defoaming agent
using entrained air tester was intended, but not achieved.
Kopra (21) (40) (23) (29) has studied the use of refractometer to optimize wash
water usage and to analyse the state of an individual washer or the washing line.
The results claim refractive index as a reliable and useful tool to continuously
monitor and control the state of washing. Furthermore, the refractometer has
proved to give valuable on-line results from different stages of the washing, thus
enabling the discovery of the black spots and the development of the washing line.
Rudd (41) has studied the use of neural networks as soft sensors to adjust the
dilution factor. He uses the networks to express mat consistency, mat density and
washing loss of the washer and to adjust the dilution factor according to these
parameters. The objective is to stabilize the process and to decrease the standard
deviation of black liquor solids. Results from an eight-day trial indicate a 25 %
reduction in standard deviation of the black liquor solids.
Production rate changes have been found to be a common reason for disturbances
in washing line. Wash water should be optimized to production rate changes to
achieve the desired DF. It should be bared in mind that the production rate is a
soft sensor, representing an inaccuracy of a certain degree. Usually some level of
damping is required to cut off peaks in production rate. Wasik et al. (35) studied a
dynamic control system during production rate changes. According to the study
results he suggested the use of fuzzy logic in the control strategy to optimize
controller response.

38
Control systems
Many advanced control systems to optimize brown stock washing have been
introduced by different suppliers. They are all more or less based on the above
mentioned criteria of production rate feedforward, washing loss feedback and tank
level control. Figure 18 represents a strategy of a washing optimizer by Metso.
The structure of the different washing optimizers tend to be somewhat similar,
having washer specific controls and additionally an upper level control system to
manage the dilution factor and washing loss of the whole washing line.
Furthermore, some washing line control systems have an option to adapt the line
according to requirements from other departments, e.g. evaporation plant.
Figure 18. Strategy of a washing optimizer by Metso. (30)
Kapanen et al. (31) has studied and described the development and
implementation of several brown stock washing optimization systems. The
systems form from two parts; individual washer optimization and washing line
control. The study results in decreased washing loss and increased discharge
consistency. Furthermore, he concludes that the system makes operator's work

39
easier and eliminates human errors. Additionally, the entire line is more tolerant to
disturbances and recovers from abnormal situations more quickly and effectively.
Environmental control
Effective and controlled water usage in brown stock washing helps to control the
stress caused on the environment. Dilution factor is the key parameter, from
environment perspective as well. Reduced water consumption degreases the water
footprint of the products. Moreover, less water to evaporation means enhancement
of mill’s energy balance, and degreased energy footprint of the products. On the
other hand, if not enough water is used to achieve satisfactory pulp cleanliness,
more bleaching chemicals have to be used resulting in higher burden on the water
body. High washing loss together with high bleaching chemical consumption may
also lead to the formation of notorious AOX. (13)

40
4. Economic analysis
Brown stock washing is one of the key areas when considering the productivity,
cost effectiveness and profitability of a pulp mill. Undoubtedly, a well-controlled
washing department lowers costs in other departments, thus increasing
profitability of the entire mill. Another advantage of effective and optimized
washing is the possibility to increase the plant production due to a steadier
production rate, or/and a controlled dilution factor. When accurate control of the
washing and dilution factor is achieved, the management of the mill can decide on
how they best use the potential. (36)
4.1 Cost effectiveness
The changes in the washing line are strongly reflected to other departments. In
fact, brown stock washing line does not comprise of many direct operational
expenses. Mainly the amount of defoamer to be used can be qualified as direct
cost (42). The importance of the washing to the mills economy derives from the
expenses caused to other departments caused by washing result and water
consumption. The greatest economic effects are created in evaporation as energy
consumption, in bleaching trough bleaching chemical consumption and in
chemical recovery as cooking chemical makeup. There are effects to other
departments as well, which will be addressed below. (35)
As illustrated in figure 14, the optimal dilution factor provides the best economic
result. As a result, an optimum dilution factor could actually be considered as the
ultimate objective of brown stock washing, as pulp cleanliness and chemical
recovery are embedded to the concept. Optimum DF being the objective, the
means to achieve the objective are effective control and operation of the washing
line, enabling a stable but flexible dilution factor in all situations.

41
4.2 Economic effects on other departments
To understand the cost associated with brown stock washing, it has been
suggested that a curve be made on the effect of dilution factor variation on each
department affected. The below addressed effects are presented as cost versus
dilution factor.
Evaporation
Cost of evaporation can be calculated by:
A) Calculating the shower flow using equation 9, where S is the shower flow
(l / BDt), øin is consistency to washing stage and øoutlet is the outlet
consistency of last washer. In here the assumption is made, that the shower
water equals weak black liquor to evaporation plant.
B) Calculating required evaporation with equation 10, where Evap is the
evaporated water / BDt, TDSevap is the total dissolved solids to evaporation
and evap is the concentration after evaporation.
1000*1
DFS
outlet
in
(9)
evap
evapTDSSEvap
(10)
Calculating steam required for the evaporation by using economy factor, which is
approximately equal to the number of effects in evaporation minus 1. Calculation
is done by dividing the evaporated water / BDt by the economy factor.
C) When cost of steam is known per kg, the cost per BDt is calculated simply
by multiplying cost of steam by steam required. (42)

42
By calculating the cost with different dilution factors, a table can be created and a
curve of the effect of dilution factor to the cost of evaporation can be drawn. The
evaporation cost increase linearly as the washing water is increased.
Cooking chemical losses
Costs from lost cooking chemicals decrease exponentially with increasing wash
water flow. When determining chemical loss in washing, a curve of dilution factor
versus chemical loss can be generated empirically. This can be done by varying
the last stage shower flow and measuring the salt cake or sodium loss in the pulp
leaving washing stage. With the curve created, and chemical price known, the cost
of cooking chemical to dilution factor can be determined. (35) (42)
Cost of bleaching chemicals usage
When evaluating the bleaching chemical consumption in relation to dilution
factor, it should first be determined which chemical consumption is associated
with washing efficiency. In general, these chemicals are chemicals used to oxidize
and extract the black liquor solids carried into the bleach plant with the pulp.
Compton (42) suggests that these are oxygen in oxygen delignification, chlorine
and/or chlorine dioxide in the first bleaching stage and caustic in the second stage.
Bleaching chemical costs increase exponentially with increasing wash water flow
(35).
Stromberg (14) has used COD wash loss to predict the chemical consumption in
chlorination bleaching stage. He resulted in 0.4-0.8 kg of active chlorine
consumption to one kilogram of COD, depending on the target kappa number.
Lunn (25)
A mill specific curve for bleaching chemical cost to dilution factor can be
calculated by:
A) Empirically determining the washing loss for a certain dilution factor.
B) Using a constant to express the cost of chemicals per washing loss unit.

43
C) Calculating the cost of the chemical consumption.
D) Repeating the procedure for other dilution factors, constructing a table for
bleaching chemical cost and dilution factor and drawing the curve. (42)
Cost of organic material losses
The loss of black liquor organics in washing results in less organic solids for
energy production in recovery boiler. This may lead to increased need for extra
fuel and thus to increased costs. Compton (42) suggest a rather complex way to
calculate the organic washing loss from the soda loss based on cooking yield,
active alkali application rate and causticizing activity.
Cost of heating shower water
Cost of heating shower water is much dependent on the water flows at observed
mill. For example, if secondary condensate is used, it is already at rather high
temperature, leaving the need for heating small. Controversially, if water is heated
solely for washing, the cost will be large. The calculation to determine the cost of
heating water is somewhat similar to the cost of evaporation and can be done by:
A) Calculating the shower water using equation 9
B) Calculating the heat required for the water temperature rise.
C) Calculating the steam required.
D) Calculating cost of steam at the evaporator.
Additional costs provoked by dilution factor on the washing line include costs of
secondary condensate usage and costs in waste treatment in form of nutrient
chemical cost.

44
Comparison of costs
Compton (42) has made example calculations on the effect of dilution factor.
Figure 19 represents these examples on a DF of 1.5 m3/BDt. The example serves
to give an idea of what might the costs be in relation to each other, but is not to be
taken as a guideline. Operational differences and effect of DF to costs change
largely between different plants. The notable factor is that the largest costs are
situated in bleaching, evaporation and cooking chemical recovery. This is in
correlation with other references e.g. Wasik et al. (35).
Figure 19. Example of an effect of dilution factor 1.5 on costs on different
departments. (42)
4.3 Investment decision
Optimization of a brown stock washing line usually contains capital costs, which
depend on the required new equipment and implementation costs, in term of
mounting and maybe consulting and engineering services. When considering the
feasibility of an optimization project, the most important factor is its profitability
in terms of return on investment. The return on investment (ROI) is always done
before the investment decision and implies the ratio of profits in relation to capital
invested. Equation 11 illustrates the relationship of these factors. (43)
0
5
10
15
20
25
30
35
Bleachingchemicals
Evaporation Saltcake loss Showerwater
heating
Black liquorloss
Wastetreatment
$/B
dt
Example of costs using dilution factor 1.5

45
investment
profitROI (11)
In comparison to the cash flow of an average pulp mill, the investment cost to
carry out a brown stock optimization project is medium or small. Thus the
investment can probably be realized without a need of capital from outside the
company.
In order to calculate the ROI, the expected profits and capital investment have to
be defined first. In a washing optimization project the expected profits can be
calculated by summing up the savings generated by effective control of dilution
factor. These savings come mainly from decreased evaporation steam
consumption, decreased bleaching chemical consumption and increased chemical
recovery rate. Additional savings occur in other departments as presented in
previous chapter. These savings can be taken into account, if their significance
and reliability are seen as sufficient. More profits expectance may come from the
option to increase production rate, but this is largely case dependent. Investment
costs are calculated by summing up the costs of purchased equipment,
engineering, instrumentation and management. (43)
Payback period is another figure to analyse the feasibility of the investment. The
factor is calculated using equation 12, where investment is the total investment
cost and net cash flow is the increased cash flow (44).
flowcash net
investment PeriodPayback (12)

46
5. Summary of literature review
Brown stock washing has an increasingly important role in the chemical pulping
industry, as the environmental concerns have become a more important factor. In
order to meet the increasingly strict regulations, production facilities have a need
to control the wash loss from brown stock washing line to bleaching. Many
strategies to control and measure wash loss have been introduces to washing lines
during last decades. The literature claims the new control strategies have given
pulp washing lines more efficiency and accuracy.
From the economic point of view, the costs saving potential of washing process
has become more viable, as the control strategies have evolved. A steadier and
more flexible control of dilution factor can optimize the water usage of the line so
that each fibre is washed with the same amount of washing liquid. This is
essential for the cost effectiveness of other departments. When dilution factor is
optimized, the washing loss to bleaching stage is controlled and the need for
evaporation is maintained at low level.
Washing loss determination is essential for the control of the line and the
conventional laboratory methods are the solid ground for the determination.
However, during last years the need for accurate on-line measurements has
emerged due to the development of more sophisticated control strategies and the
need to control more accurately the organic substances going to bleaching. Recent
studies using a refractometer propose good results of washing loss determination
and analysis of washing. There have been several applications utilizing online
washing loss measurement and an advanced, multilevel control system.
There is no one solution on washing line optimization, since the optimal dilution
factor and operation parameters are always mill-specific. The most important
advantage of a control system and precise measuring devices is the possibility to
obtain desired results in a mill, let it be enhanced cost effectiveness,
environmental control, quality, or all of them.

47
6. Objectives of experimental part
The present study had two main objectives. First objective was to effectively put
into service the upper level control system and the 7 refractometers on the
washing line. The performance of the investment was observed in terms of wash
loss and concentration of liquor leaving the washing line.
The second objective was to find the optimum values for operation parameters so
that the washing line could be operated in an economically and environmentally
sustainable manner. The parameter values, such as dilution factor, drum torque
and feed consistency were investigated in trials carried out during one month.
Furthermore, the economic viability of the investment on upper level control
system and refractometers was studied. In addition, a comparison of the on-line
wash loss measurements, i.e. conductivity and total dissolved solids measurement
by refractometer.

48
7. Introduction to pulp mill
Kaukas pulp mill is part of the Kaukas integrate, located in Eastern Finland in
Lappeenranta. The integrate produces pulp, coated mechanical paper, timber
products and biodiesel.
The pulp mill has two fiber lines with a total capacity of 700 000 ADt/a of
bleached pulp. Fiber line 1 produces hardwood pulp with a capacity of 300 000
ADt/a. Fiber line 2 has a capacity of 400 000 ADt/a of softwood pulp.
The pulp is cooked in 12 Super-Batch digesters, four of which produce hardwood
pulp and eight softwood pulp. In addition, there is a sawdust digester producing
pulp for the hardwood line.
Brown stock washing line 1
The brown stock washing line consists of three DD washers, a vacuum washer
and two phase oxygen delignification. After the blow pulp tower the pulp is taken
to a precipitator which raises and evens out the consistency before the washers.
Two parallel DD washers follow the precipitator. The DD washers are both four-
stage washers, but they differ some in structure and size. From the DD washers
the pulp is taken to a 2-stage oxygen delignification taking approximately 80
minutes. After the oxygen delignification the pulp moves to a two-stage DD
washer. Sulphuric acid is added to the pulp after it leaved the DD-washers and the
pulp is taken to a tower functioning as A-stage. After the A-stage the pulp runs
through screening. The screening is followed by a vacuum washer, which has its
own wash water circulation. Figure 20 illustrates the structure of fiber line 1,
where the upper part represents brown stock washing line and lower part depicts
bleaching line.

49
Figure 20. Fiber line 1

50
8. Materials and methods
8.1 Refractometers
A total of 8 refractometers were installed in the washing line to measure real time
dissolved solids. The refractometers were supplied by K-patents Oy. Seven of the
refractometers were model PR-23-SD and one was model PR-23-A. Four of the
refractometers were installed in pulp lines and four in liquor lines. Figure 21
represent the installation sites of the refractometers in the washing line and table 4
defines the sites in more detail.
Figure 21. Installation sites of the refractometers at the brown stock washing line.

51
Table 4. Installation sites of the refractometers.
Installation site Number
DD1 & DD2, pulp in 1
DD1, wash filtrate 2
DD2, wash filtrate 3
DD1 & DD2, pulp out 4
DD3, pulp in 5
DD3, wash filtrate 6
DD3, wash liquor from vacuum tank 7
DD3, pulp out 8
Three PR-23 refractometers in liquor lines had “Safe Drive” installation valves
with steam wash to keep the prism clean. The Safe Drive also enabled safe
removal of the sensor during normal operation, which proved to be useful during
the introduction period. Figure 20 represents the installation of the PR-23-SD
refractometer in filtrate leaving DD3. In addition one PR-23-A measurement was
installed in a liquor line. This installation did not have steam wash, but instead a
flow cell and adjustable valves to keep the flow speed high enough to keep the
prism clean. Figure 22 represents the installation of this refractometer.

52
Figure 22. Installation of the PR-23-SD refractometer in filtrate line of DD3.
The four refractometers installed in pulp lines were with solid installation valves,
because the flow of the fibers will keep the prisms clean. Figure 23 represents the
installation of a solid valve PR-23 refractometer.
Figure 23. Installation of the PR-23 refractometer in feed pulp line of DD3.
The deployment of the refractometer number 8 did not succeed due to the fact that
sulfuric acid was added to the MC pump just before the measuring installation site
of the set point. The sulfuric acid affects greatly the refractometers measurement
result because the portion of the dissolved solids from the added sulfuric acid to

53
total dissolved solids of the liquor is large, about 50% or more. To compensate the
effect of sulfuric acid to the measurement a calculation was created to reduce the
amount of dissolved solids caused by the sulfuric acid to the measurement of total
solids. The compensation was not successful due to unpredictable rapid changes
in the flow of the sulfuric acid.
To replace the refractometer number 8 and obtain real time measurement of the
total wash loss of the washing line, another refractometer (7) was installed on the
wash liquor line leaving the vacuum tank of DD3. According to the samples
analyzed in laboratory, this location gives approximately 10-20 percent higher
wash loss compared to the TDS of pulp leaving DD3.
Furthermore, the existing measurements in the washing line were also used to
evaluate the performance and efficiency of the washing. Used measurements
included flow meters, consistency transmitters and conductivity meters. Figure 24
illustrates the existing sites for on-line conductivity measurements. All of the
three conductivity measurements are located in the liquor line leaving vacuum
tank.
Figure 24. Installation sites of the conductivity meters in brown stock washing line.

54
8.2 Upper level control system
The upper level control system was put into service in co-operation with the
system provider. The control system had two principal functions; the dilution
factor control and the DD washer drum rotation speed control.
Conventionally the DD washers have been fed the amount of wash liquor seen
appropriate. DD1 and DD2 have been perceived to require more wash liquor than
DD3 in order provide an appropriate washing result. The higher consumption of
wash liquor for pre O2 washing had led to the constant bypassing of DD3 washer.
As the bypass valve provides the extra water to the washing line, the total dilution
factor of the line has not been controlled.
The dilution factor control of the upper level control system was constructed so
that the dilution factor of DD3 controls the dilution factor of the whole washing
line. This means that in a normal operation the wash liquor circle of the line
would be closed and the DD3 bypass valve and the wash liquor storage emptying
valve would remain closed. Hence, all the wash water entering the washing line
would be utilized in DD3, enabling a higher dilution ratio for the washer and
enhancing the efficiency of the line.
The target for the dilution factor of the whole washing line was given by
operators. A feed forward from production rate to wash water feed in DD3 was
used to maintain the dilution factor steady, while the dilution factors of pre O2
washers i.e. DD1 and DD2 were determined by the wash liquor balance of DD3
wash liquor tank. A feedback was used to tune the dilution factor of the line
according to the stage and condition of the line. The feedback for the dilution
factor consisted of liquor balance, dissolved solids and conductivity.
Refractometers measuring dissolved solids gave feedback to the dilution factor
control in real-time, while conductivity measurements were averaged.

55
The DD washers’ drum rotation speed was based on torque control instead of
conventional feed pressure control. According to the theory, the control of drum
torque could be able to maintain the pulp mat in a steady consistency and give a
more even formation to the pulp in washer. This should in turn lead to a more
constant washing result. The torque control was constructed so, that the operators
set the set point for torque and the drum rotation speed was adjusted to keep the
torque constant. Feed pressure was configured an upper limit. If this limit was
exceeded, the control would automatically change the controlling parameter from
torque to feed pressure and lower the feed pressure to a desired level. After the
feed pressure was under the desired limit the control started to control the torque
anew.
The drum torque seemed to work well, but a problem occurred calling for
enhancement of the control. The drainability properties of the pulp might change
greatly due to change in raw material quality or cooking conditions. If the drum
torque is kept constant and the drainability of the pulp changes, the feed pressure
could change dramatically. During the testing period it was somewhat common
for the feed pressure to drop to an inadequate level, deteriorating rapidly the wash
result. If the pulp had good drainability, the torque could have been significantly
higher than it was set by the set point. This problem was addressed creating a
floating set point for the drum torque.
The idea of the floating set point was that the set point was automatically adjusted
to the optimum level, depending on the pulp properties. The floating set point was
created by first creating a calculator to keep count of the times per hour the feed
pressure exceeds the set upper limit. Then a lower limit and an upper limit were
set for the times the feed pressure exceeds the limit per hour. If the times of
exceedance per hour exceed the upper limit, the torque set point was automatically
decreased a certain amount. On the other hand, if the times of feed pressure
exceedance per hour fell under the lower limit, the torque set point was
automatically increased a certain amount. Figure 25 illustrates the function of the
floating torque set point.

56
Figure 25. A screen capture of the configuration of the floating torque setpoint.
The result of the floating torque set point was a significant enhancement of the
steadiness of the line, especially during process changes. However, sometimes the
pulp drainability changed very rapidly and the floating torque set point could not
react with sufficient promptness, causing the feed pressure to drop to an
inadequate level. To address this problem, a lower limit for feed pressure was set
up. The lower limit of the feed pressure worked in the same manner as the upper
limit, changing controlling parameter from torque to feed pressure and raising the
feed pressure to an adequate level.

57
8.3 Analyses
The analyses were performed in laboratory according to table 5. Analyses were
made during the calibration of the refractometers as well as on the definition of
the chemical situation of the washing line.
Table 5. Analyses carried out in laboratory
Variable Method
Total dissolved solids, standard SFS 3008 (105 °C)
Total dissolved solids, refractometer See description 1
Conductivity SFS EN27888
Consistency SCAN - C17:64
Sodium SCAN - C30:73
COD pulp SCAN - CM 45:91
COD liquor See description 2
Total Organic Carbon SFS - 1484EN
1 Some TDS analyses were made using a laboratory device provided by K-Patents. The
device was used as a quick analyzing tool to see the difference of an operational change
performed in the line. However, all the results presented in this paper have been made
using the standard procedure SFS 3008.
2 COD liquor samples were filtrated by a 10 µm paper and then analyzed in a COD
analyzer as descripted in SCAN – CM 45:91
The refractometers were calibrated in co-operation with the refractometer
supplier. The calibration was performed by taking liquor sample from the
refractometer installation site and analyzing the total dissolved solids in
laboratory. When the installation site was in a pulp line the liquor was squeezed
out in less than five minutes after sampling. After 5 laboratory samples were
carried out, the refractometers were calibrated to match the laboratory values.
During the following months more TDS laboratory analyses were carried out and
the calibration of the refractometers was fine-tuned respectively.

58
In addition, conductivity and liquor COD analyses were made from the
refractometer installation sites during the calibration.
The pulp COD was taken from DD3 cake discharge, where the total COD wash
loss was determined. The COD samples were analyzed 3 to 4 times a day during
washing line trials. Consistency was determined from the cake discharge of each
DD washer.
The performance parameters were created in DNA operation system. The E-value
was calculated as EAPE-value for each three DD-washers using the equation 7 and
placed on the upper level control monitor. Furthermore, traffic lights were placed
on the monitor screen next to the EAPE-value to indicate whether the washer
efficiency was poor, adequate or excellent. Figure 26 demonstrates the efficiency
traffic lights in the monitor screen.
Figure 26. The E-value and the efficiency traffic lights on the operation monitor of
the upper level control.
Displacement ratio was calculated using equation 4 and the calculation was
introduced to the DNA operation system. The DR was not placed on the operation
monitor because it was thought to offer too much information on one screen and
confuse more than actually assist. Instead it was left to gather data in the system to
be utilized in investigation and problem solving situations.

59
8.4 Trial runs
During the trials there were no significant changes in raw material composition,
since the fiber line 1 is used solely to produce hardwood pulp with mainly birch as
wood species. In addition, the percentage of pulp from saw dust digester was kept
as constant as possible during the trials. The washing result of the washing line
was determined from the pulp discharge of DD3 using different wash loss
definition methods. In addition, refractometers were continuously measuring the
total dissolved solids and conductivity meters were measuring the conductivity of
wash filtrate from each DD-washer.
After the upper level control system and the most important refractometers for the
control were put into service the performance of the created upper level control
system with refractometers was tested. In the trial the line was first operated two
weeks in conventional way and then two weeks with the upper level control
system in function. The objective of the trial was to define the total effect of the
investment in terms of wash loss and concentration of wash filtrate leaving the
washing line.
The effect of dilution factor on wash loss and chemical consumption in bleaching
was tested in a three week trial. The dilution factor was first raised to 4.5, then
after the first week it was lowered to 4 and for the third week to 3.5. The objective
was to determine the optimal dilution factor for the washing line and to clarify the
effect of different levels of dilution factor to wash loss.
The effect of production rate on wash loss was examined by first lowering the
rate to minimum operation, then raising it to normal level and at last incrementing
the rate to maximum production. In addition, it was interesting to see how high
production rate could be achieved and how would the line perform in maximum
production.

60
Another trial was carried out to study the effect of DD1 and DD2 feed
consistency on wash loss. The feed consistency was first lowered to 4.3%, then
raised to 5% and at last to 5.7%. The consistency was first changed before
equalization tank, after half an hour from the pulp entering the pre-precipitator
and the pulp leaving the pre-precipitator, which is the feed consistency to DD1
and DD2 washers.
When operating the washers using drum torque control, the effect of drum
torque on wash loss was studied by raising the torque first as high as the feed
pressure limit allows and then step by step lowering it. The objective was to find
out how wash loss is affected by torque both in low and high ends of the torque
scale.
The comparison of viability and effectiveness of on-line measurement methods,
namely conductivity meters and TDS by refractometer, was planned to be tested
in a trial. The comparison would have been made in terms of wash loss and
concentration of wash liquor leaving the washing line. However, the comparison
would have needed a long trial to have reliable results and was not possible inside
the time frame of this study.
The effect of dilution factor on bleaching chemicals consumption and cost was
planned to be tested during the trials. Unfortunately the washing line experienced
serious disturbances during the trials and there was no significant results obtained.
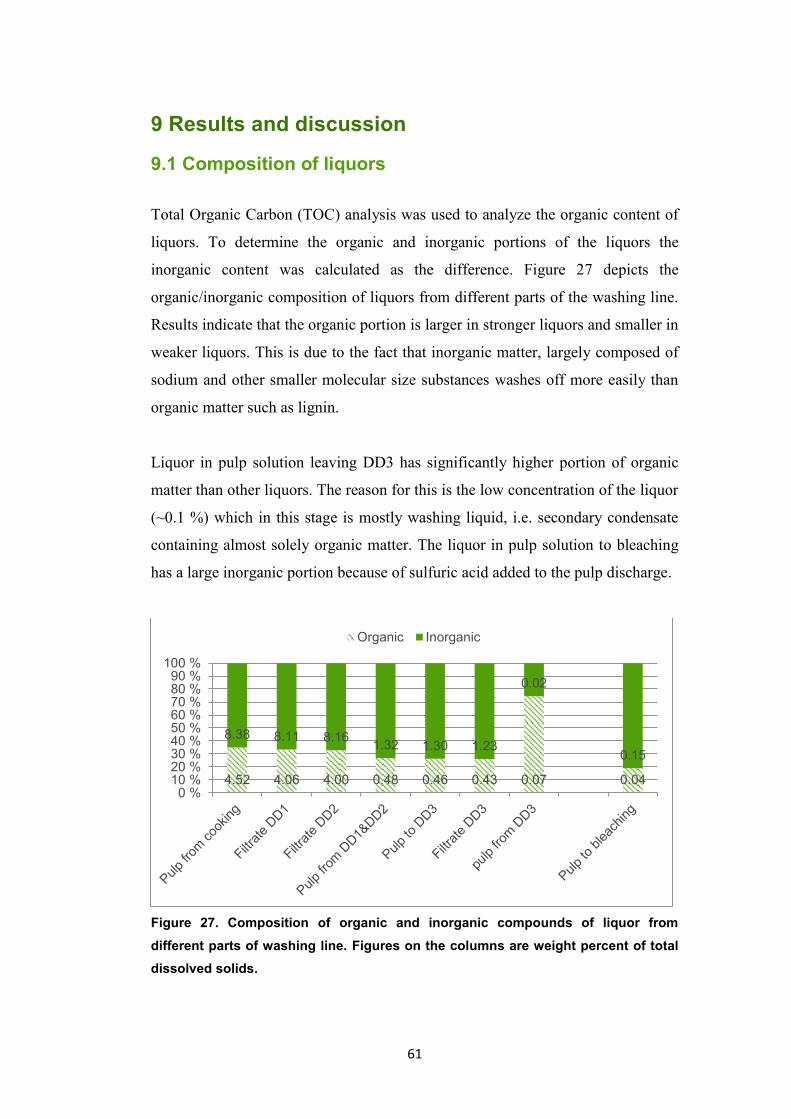
61
9 Results and discussion
9.1 Composition of liquors
Total Organic Carbon (TOC) analysis was used to analyze the organic content of
liquors. To determine the organic and inorganic portions of the liquors the
inorganic content was calculated as the difference. Figure 27 depicts the
organic/inorganic composition of liquors from different parts of the washing line.
Results indicate that the organic portion is larger in stronger liquors and smaller in
weaker liquors. This is due to the fact that inorganic matter, largely composed of
sodium and other smaller molecular size substances washes off more easily than
organic matter such as lignin.
Liquor in pulp solution leaving DD3 has significantly higher portion of organic
matter than other liquors. The reason for this is the low concentration of the liquor
(~0.1 %) which in this stage is mostly washing liquid, i.e. secondary condensate
containing almost solely organic matter. The liquor in pulp solution to bleaching
has a large inorganic portion because of sulfuric acid added to the pulp discharge.
Figure 27. Composition of organic and inorganic compounds of liquor from
different parts of washing line. Figures on the columns are weight percent of total
dissolved solids.
4.52 4.06 4.00 0.48 0.46 0.43 0.07 0.04
8.38 8.11 8.16 1.32 1.30 1.23
0.02
0.15
0 %10 %20 %30 %40 %50 %60 %70 %80 %90 %
100 %
Organic Inorganic
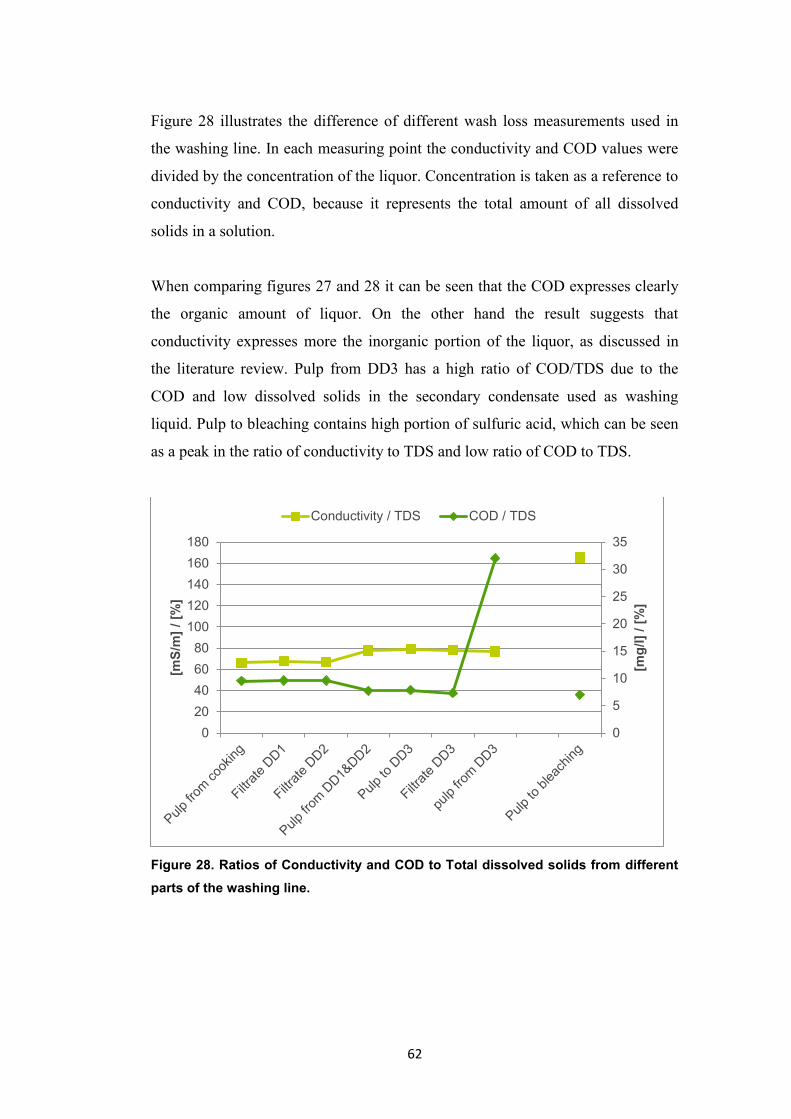
62
Figure 28 illustrates the difference of different wash loss measurements used in
the washing line. In each measuring point the conductivity and COD values were
divided by the concentration of the liquor. Concentration is taken as a reference to
conductivity and COD, because it represents the total amount of all dissolved
solids in a solution.
When comparing figures 27 and 28 it can be seen that the COD expresses clearly
the organic amount of liquor. On the other hand the result suggests that
conductivity expresses more the inorganic portion of the liquor, as discussed in
the literature review. Pulp from DD3 has a high ratio of COD/TDS due to the
COD and low dissolved solids in the secondary condensate used as washing
liquid. Pulp to bleaching contains high portion of sulfuric acid, which can be seen
as a peak in the ratio of conductivity to TDS and low ratio of COD to TDS.
Figure 28. Ratios of Conductivity and COD to Total dissolved solids from different
parts of the washing line.
0
5
10
15
20
25
30
35
0
20
40
60
80
100
120
140
160
180
[mg
/l]
/ [%
]
[mS
/m]
/ [%
]
Conductivity / TDS COD / TDS

63
9.2 Wash loss determination
Figures 29 and 30 represent the correlation of TDS to COD and conductivity to
COD in brown stock washing line concentrations. Both correlation coefficients
are high due to the wide concentration scale (0 – 14%). Nevertheless, the total
dissolved solids measurement had a stronger correlation with COD. The stronger
correlation of TDS suggests that TDS has a stronger correlation with conductivity
when describing the organic matter content of liquor in pulp washing. The higher
variation in conductivity measurement compared to TDS is believed to be the
result of temperature and pH, which affect conductivity and thus might deteriorate
the reliability of the measurement.
Figure 29. Correlation between TDS and COD, both analyzed in laboratory.
y = 9704.3x - 2810.6 R² = 0.996
0
20000
40000
60000
80000
100000
120000
140000
0 2 4 6 8 10 12 14 16
CO
D, m
g/l
TDS, %

64
Figure 30. Correlation between conductivity and COD, both analyzed in laboratory.
Figure 31 illustrates the correlation between TDS measured by a refractometer
and COD. The correlation coefficient is close to the TDS measured in laboratory.
These results suggest a strong correlation of refractometer output and COD and it
is in accordance with the results found from the literature.
Figure 31. Correlation between TDS measured by refractometer and COD.
y = 14.705x - 5743.4 R² = 0.9841
0
20000
40000
60000
80000
100000
120000
140000
0 2000 4000 6000 8000 10000
CO
D, m
g/l
Conductivity, mS/m
y = 10538x - 6934.7 R² = 0.9936
0
20000
40000
60000
80000
100000
120000
140000
0 2 4 6 8 10 12 14 16
CO
D, m
g/l
Concentration, % (refractometer)

65
Figure 32 illustrates that the correlation coefficient between conductivity and
COD is practically zero in narrow concentration scale (3%). This means
conductivity is not a proper indicator of COD in liquors when measurement is
done in washer specific concentrations scale.
Figure 32. Correlation between conductivity and COD with stronger black liquor.
The concentrations of the samples are in between 11.8% and 13.6%.
y = -0.2981x + 121278 R² = 0.0007
105000
110000
115000
120000
125000
130000
135000
7000 7500 8000 8500 9000 9500 10000 10500
CO
D, m
g/l
Conductivity, mS/m

66
In figure 33 the correlations between TDS and COD in stronger liquors are
represented. Correlation is clear but not perfect as black liquor composition may
change rapidly. The concentration range of the samples is about 2%.
Figure 33. Correlation between TDS analyzed by standard method and COD.
Figure 34 represents the correlation of TDS measured by a refractometer and
COD in the same concentration scale used in figure 30. The results indicate that
the refractometer measurement gives a rather strong correlation with narrow,
washer specific concentration differences in samples. The concentration range of
the samples is about 3%.
Figure 34. Correlation between TDS measured by refractometer and COD.
y = 11101x - 20028 R² = 0.6823
105000
110000
115000
120000
125000
130000
135000
12 13 14
CO
D, m
g/l
TDS, %
y = 6004.6x + 47161 R² = 0.7514
105000
110000
115000
120000
125000
130000
135000
10 11 12 13 14
CO
D, m
g/l
TDS, % (refractometer)

67
9.3 Performance of the installed equipment
The results illustrated in table 6 suggest that the introduction of the upper level
control system and refractometers had a significant effect on the performance of
the washing line. Wash loss measured in total COD dropped up to 10 percent at
the same time as the concentration of the washing liquor leaving the washing line
increased 0.4 percent. The production rate was the same in both periods and other
important variables were kept constant as well. The table has two comparable
periods of two weeks. The comparison was later on made with several months’
time frames and proved to give a consistent result. However, the results from
longer periods are not presented here due to non-controlled circumstances.
Table 6. Comparison of wash water usage and wash loss between conventional
and upper level controls
Control system Conventional Upper level
Production ref same
Dilution factor m3/BDt ref -0.1
TDS from liquor leaving the washing line, % ref + 0,4
Wash loss to bleaching, kgCOD/BDt ref -10%
Figure 35 illustrates the effect the upper level control has had on different wash
loss measurements. Wash loss measured by conductivity has experienced the most
significant decrease, while TDS decreased slightly less. This result is consistent
with the theory examined as the conductivity measurement emphasizes the
inorganic portion of total dissolved solids that is easier to wash off than organic
compounds such as lignin.
COD measured as kgCOD/BDt expresses all organic material in the pulp solution,
including non-dissolved portion such as lignin still adhered to the fiber. The non-
dissolved portion cannot be washed away in brown stock washing, leaving the
decrease of kgCOD/BDt wash loss more moderate compared to conductivity and
TDS. The liquor COD was not measured from the baseline period and thus could

68
not be taken into comparison. However, it is supposed that the decrease in wash
loss measured as liquor COD would fall between TDS and kgCOD/BDt.
Figure 35. The effect of utilizing upper level control system on different wash loss
measurements. Laboratory measurements are from DD3 cake discharge.
Figure 36 represents the kgCOD/BDt wash loss from the baseline period where
the washing line was controlled in conventional way and the trial period where the
line was controlled by the upper level control system. Both periods were gathered
during two weeks and the analyses were made in laboratory. In comparison, the
standard deviation of results was smaller when the line was operated using upper
level control. In figures 32 – 35 each point refers to a value of one sample taken
from the cake discharge of DD3.
-35
-28
-10
-40
-35
-30
-25
-20
-15
-10
-5
0
Ch
an
ge, %
Conductivity, mS/m TDS, % COD, kgCOD/BDt

69
Figure 36. Wash loss measured as kgCOD/BDt during conventional and upper level
control. Laboratory measurements from DD3 cake discharge during 2 week period.
Figure 37 illustrates how discharge consistencies changed between two week
periods of conventional control and upper level control. It can be seen from the
curve and lower standard deviation that discharge consistency has maintained
steadier during the upper level control period. The results suggest that dilution
factor and drum rotation speed were adjusted in a successful manner.
10
12
14
16
18
20
22
24
1 2 3 4 5 6 7 8 9 10 11 12 13 14 15 16 17 18 19 20 21 22 23
CO
D, kg
CO
D/B
Dt
Samples
Upper level ConventionalSTD 1.55 1.94

70
Figure 37 Discharge consistencies during conventional and upper level control
periods. Laboratory measurements from DD3 cake discharge during 2 week period.
Figure 38 illustrates how conductivity results have changed during upper level
control and conventional control of the line. The results indicate a steadier
operation and thus steadier wash loss. Figure 39 suggest same results when wash
loss is measured in TDS.
10
12
14
16
18
20
22
1 2 3 4 5 6 7 8 9 10 11 12 13 14 15 16 17 18 19 20 21 22 23 24 25
Dis
ch
arg
e c
on
sis
ten
cy,
%
2 week period
Upper level Conventional
STD 0.55 0.78

71
Figure 38. Conductivity during conventional and upper level control periods.
Laboratory measurements from DD3 cake discharge during 2 week period.
Figure 39. Total dissolved solids during conventional and upper level control
periods. Laboratory measurements from DD3 cake discharge during 2 week period.
10
30
50
70
90
110
130
150
1 2 3 4 5 6 7 8 9 10 11 12 13 14 15 16 17 18 19 20 21 22 23
Co
nd
ucti
vit
y,
mS
/m
Samples
Upper level Conventional
STD 17.14 18.34
0
0.02
0.04
0.06
0.08
0.1
0.12
0.14
0.16
0.18
0.2
1 2 3 4 5 6 7 8 9 10 11 12 13 14 15 16 17 18 19 20 21 22 23
TD
S, %
Samples
Upper level Conventional
STD 0.22 0.23

72
Steadier control is supposed to be a result of automatic control loops of upper
level control as well as unified manner of operation provided by the upper level
system. Differences between the “operation philosophies” of different turns
undeniably decrease the variation of wash loss. The real time measuring devices
enabled immediate response to process changes, which in turn helps to reduce the
fluctuation of wash result. The results suggest that the steadier control contributes
to smaller total wash loss. Another factor affecting the smaller wash loss is
believed to be the torque based control of drum speed, enables the use of higher
torque and higher feed pressure.
9.4 Dilution factor control
Figure 40 depicts the measured dilution factor during 48 hours period. In the
figure dilution factor control is in use until the red vertical line. After the black
dotted line the washer is operated in a conventional way by manually adjusting
the amount of washing liquid. During both periods the production rate varied
between 31 ADt/h and 41 ADt/h. Period between the two lines experienced
process disturbances and cannot be considered reliable.
Figure 40. Effect of dilution factor control on measured dilution factor
Figure 41 from DD3 represents the effect upper level dilution factor control had
on measured wash loss. Solid trend line represents dilution factor based on
measured flows and dotted line expresses the wash loss as conductivity measured
on line. Between the red vertical lines the washer was operated with conventional
control system and on both sides of the line the dilution factor control was in

73
operation. The yellow slashed areas had unusual process disturbances. It can be
seen from the chart that the measured dilution factor varied significantly when
dilution factor control was turned off. Consequently, the wash loss varied more
than with dilution factor control.
Figure 41. Effect of DF control on measured wash loss measured by conductivity
meter.
The columns on figure 42 represent the average TDS wash loss from trial periods
with different dilution factors measured both as standard method and
refractometer. The level of wash loss measured by refractometer appears higher
than the standard method. This is because the laboratory results were taken from
the cake discharge of DD3 while the refractometer was placed at a liquor line
leaving the vacuum container of DD3. At the location of the refractometer the
wash loss is slightly higher compared to the cake discharge. The results suggest
that by increasing dilution factor from 3.5 to 4.5 it is possible to achieve up to 55
percent decrease in TDS wash loss.

74
Figure 42. Wash loss as a function of dilution factor. TDS measured by
refractometer and TDS analyzed in laboratory.
Figures 43 and 44 represents the effect of dilution factor on kgNa2SO4/BDt,
kgCOD/BDt and gCOD/l wash loss. The results are presented as average wash
loss from each trial period. The wash loss measured as kgNa2SO4/BDt suggest a
decrease of 18 percent when dilution factor was dropped from 4.5 to 3.5. The
decrease in liquor COD was 13 percent with the same period of trial.
Figure 43. The effect of dilution factor on kgNa2SO4/BDt wash loss. Laboratory
analysis.
0.00
0.02
0.04
0.06
0.08
0.10
0.12
0.14
4.5 4.0 3.5
Wash
lo
ss T
DS
, %
Dilution factor, m3/ADt
Refractometer
SCAN-N 22:96
0.0
0.5
1.0
1.5
2.0
2.5
3.0
3.5
4.0
4.5
4.5 4.0 3.5
Wash
lo
ss, kg
Na2S
O4/B
Dt
Dilution factor

75
Figure 44. The effect of dilution factor on gCOD/l wash loss
In case of wash loss measured in kgCOD/BDt represented in figure 45, the wash
loss achieved by higher level dilution factor is higher than that of the normal
level. This is believed to be because during the trial period of the 4.5 dilution
factor the kappa number was higher than that of the 3.5 and 4 dilution factor
periods. For the period of 4.5 the kappa number was 11.5, while during the two
other periods it was 10.7 and 10.9. The higher kappa number suggests higher
lignin content i.e. higher COD adhered to the fiber, which could not be washed
off.
0
500
1000
1500
2000
2500
3000
4.5 4.0 3.5
Wash
lo
ss, C
OD
g/l
Dilution factor

76
Figure 45. The effect of dilution factor on kgCOD/BDt wash loss on DD1&DD2
Figure 46 represents the combined effect of dilution factor on wash loss from
DD1 and DD2 washers. The wash loss was obtained by refractometer
measurement (4) and is presented as the amount of dissolved solids per ton of
bone dry pulp. The ratio of kgCOD/BDt to kgDS/BDt in this stage of the washing
is approximately 1.4, which means 100kgDS/BDt equals 140kgCOD/BDt. From
the result it can be stated that an increase in the dilution factor clearly decreases
the wash loss. During the trial a test was performed to decrease the dilution factor
to a lower level until meeting the limit where the wash results collapses. This was
done, but it proofed rather difficult to get data from these attempts because the
circulation of the wash liquor between the washing zones would stop,
deteriorating rapidly the wash result of the whole washer. This happened when
dilution factor was fewer than 2.7 for DD2 and 2.8 for DD1.
The above mentioned DD washers are originally designed to operate on lower
production levels. Nevertheless, the washers proved to have capacity for the
production rate they are running on and even higher. The disadvantage they had
was the wash liquor circulation system which tended to be error-prone and stop
the circulation with high production rate, low dilution factor or high consistency.
0.0
2.0
4.0
6.0
8.0
10.0
12.0
14.0
16.0
18.0
20.0
4.5 4.0 3.5
Wash
lo
ss, kg
CO
D/B
Dt
Dilution factor

77
Figure 46. Effect of dilution factor on kgDS/BDt wash loss from DD1 and DD2.
Figure 47 illustrates the effect of dilution factor on DD3 wash loss measured by
refractometer and expressed as kgDS/BDt. During the trial the production rate
was maintained constant. It can be seen that a higher dilution factor produces
lower wash loss. Moreover, the effect of dilution factor to wash loss is
significantly higher than in case of DD1 and DD2. The dilution factor level is
lower than that of the whole washing line due to washer bypass.
Figure 47. The effect of dilution factor on kgDS/BDt wash loss from DD3.
60
80
100
120
140
160
180
200
2.5 3 3.5 4 4.5 5 5.5
Wash
lo
ss, kg
DS
/BD
t
Dilution factor m3/BDt
0
2
4
6
8
10
12
14
16
18
20
2 2.2 2.4 2.6 2.8 3 3.2 3.4 3.6 3.8
Wash
lo
ss, kg
DS
/BD
t
Dilution factor, m3/BDt

78
9.5 Production rate
Figure 48 represents the effect of production rate on wash loss measured by
refractometer and expressed as kgDS/BDt. The result is measured from DD3.
Dilution factor of the washing line was 3.5m3/BDt during the entire trial. Results
suggest that higher production rate increases washing loss, especially when the
production rate is taken higher than in normal operation.
During the trial the washing line experienced many disturbances. When the
production rate was taken over 1000 ADt/d the DD1 and DD2 wash liquor
circulation system stopped circulating various times. As a consequence the wash
loss increased rapidly and the production rate had to be decreased and increased
again after the wash liquor circulation recovered. One significant reason for the
rapid deterioration of the wash result was thought to be the insufficient capacity of
the pulp feed pump. The pump could not maintain steady feed rate of the pulp
when the production rate or feed consistency was increased.
Figure 48. Effect of production rate as ADt/d to wash loss in kgDS/BDt measured
by refractometer.
6
8
10
12
14
16
850 900 950 1 000 1 050 1 100
Wash
lo
ss, kg
DS
/BD
t
Production rate, ADt/d

79
9.6 Feed consistency
In figure 49 is represented the wash loss from DD1 and DD2 as a function of feed
consistency. The results indicate that by using lower feed consistency a lower
wash loss could be achieved. However, during the trial many process disturbances
occurred deteriorating the reliability of the result. For example, the pulp feed
pump could not maintain a steady feed rate to the washers if the consistency was
increased to a higher level. This caused disturbances and increased the wash loss
when the consistency was higher. The trial should be repeated with more potent
pulp feed pump to assure the correctness of the result.
Figure 49. Wash loss as a function of washer feed consistency.
1.5
1.6
1.7
1.8
1.9
2
2.1
2.2
2.3
2.4
2.5
4 4.5 5 5.5 6
Wash
lo
ss T
DS
, %
Consistency, %

80
9.7 Drum torque
The drum torque control seemed to have a positive effect on the performance of
the washer. Figure 50 illustrates that the higher the torque, the smaller and more
stable is the wash loss. When the torque was taken under 160 kNm the washing
result collapsed resulting in significant increase in wash loss. Experiences during
trials suggested that the level where washing result collapses depends on the stock
properties and could vary greatly.
Figure 50. The effect of drum torque to wash loss. Wash loss is measured by
refractometer and expressed as kgDS/BDt.
0
5
10
15
20
25
30
130.000 140.000 150.000 160.000 170.000 180.000 190.000
Wash
lo
ss, kg
DS
/BD
t
Drum torque, kNm

81
9.8 Payback time
The payback time for the investment on upper level control system and 8
refractometers was calculated according to the results obtained during the
performance trial. The calculation was done by using equation 12. The increased
cash flow was calculated by summing savings from evaporation plant as less
steam used and from bleaching plant as less chemicals consumed. The calculated
payback time fulfilled the objective easily.
Figure 51 represents the portion of saving resulting from less evaporation and less
chemical consumption. It can be seen that at the specific plant savings from
evaporation plant were almost double in comparison to saving from bleaching
plant.
Figure 51. Savings deriving from evaporation and bleaching department.
Evaporation saving Bleaching saving
€
82
10 Summary of experimental work
The results suggest that by using an upper level control system to control the
dilution factor of the entire brown stock washing line, by real time wash loss
measurements as control feedback and by torque control of DD-washers rotation
speed it is possible to reduce the amount of brown stock wash loss and
simultaneously decrease the amount of used wash water. In this work the upper
level control system together with the refractometers were taken into service and
the performance was tested.
Analyses proved that a measurement performed by refractometer expresses the
total dissolved solids of the liquor, while conductivity meters emphasize the
inorganic matter and are more vulnerable to other process changes such as pH and
temperature.
The created “floating torque set point” for the drum torque automatically provides
the DD washer an optimum torque set point for the changing pulp properties. The
floating set point enables a more stable washing result and the use of higher level
feed pressure in the washer.
High drum torque proved to give lower and more stable wash loss. The washing
efficiency collapses when the drum torque falls under certain level. The level
where the washing result collapses varies greatly.
Higher production rate deteriorates the washing efficiency and makes the washing
line more vulnerable to disturbances. This is especially the case with DD1 and
DD2.
The dilution factor of the washing line has a great effect on the washing result.
However, the amount of wash loss varies significantly when evaluated by
different methods to measure wash loss.

83
11 Conclusions and proposals for improvements
11.1 Upper level control system
The created upper level control system proved to enhance washing efficiency of
the washing line. The increased washing efficiency was a result of several factors
including dilution factor control of the whole washing line, drum torque control,
unification of operational philosophies and derived from all these components, the
steadiness of the line- and washing result.
The control of the liquor balance enabled effective utilization of all wash water
fed to the washing line. In the conventional control the DD3 was bypassed
continuously, while in the upper level control the bypassing valve could be closed
entirely. Instead of using the DD3 bypassing valve, all the wash water used in the
line was fed through DD3, thus increasing the dilution factor of the washer
without introducing extra water to the washing line.
The on-line dissolved solids and conductivity feedback for the dilution factor
control maintained the wash loss on a desired level by adjusting the dilution factor
according to process conditions. According to the analyses made it was useful to
use both on-line measurement devices as feedback for the dilution factor control,
as the methods emphasize different substances in the liquor.
Another element was the control of the drum rotation speed based on drum torque.
The torque control proved to maintain the washing consistency higher and
steadier than the conventional feed pressure control, delivering a higher washing
efficiency. The created “floating torque control” automatically set the optimum
torque level for the washer depending on pulp properties. This was seen as a
useful tool, as the pulp properties tended to change significantly.
From the operational point of view the upper level control is more automated
compared to the conventional control, meaning less active operation time and
more ease in surveillance. However, in case of disturbances the operators must be

84
able to make changes to the parameters and do the required trouble-shooting. In
order to achieve the adequate knowledge level, a well-established operator
training is essential for effective operation of the line. Moreover, it would be
useful to train few key users, who could control the fine tuning parameters and
address more complex problems. In addition, more effort should be made to
simplify the upper level control so that it would be easier for the operators to
adopt.
For future study, it would be interesting to construct the upper level control
system with wash result feedback for the dilution factor control from pre O2
washers. In this case post O2 washer wash water feed would follow the wash
liquor balance of pre O2 wash liquor tank surface level. This would supposedly
lead to a more instant response on changes in wash loss starting from the
beginning of the line and, respectively, the control would maintain steady the
wash loss leaving from first wash phase. The faster response in the beginning of
the line would also provide better control of the line in cases of process
disturbances.
Another advantage of this system would be the full utilization of the refractometer
in the pulp line entering the washing line. Using wash liquor feedforward
according to the concentration of the liquor from cooking could help to keep the
liquor concentration of the whole line in a desired level. Moreover, the
concentration of the liquor from cooking tends to vary greatly in relatively short
time periods, especially in batch cooking processes. This somewhat rapid
variation in the concentration could be balanced already in the beginning of the
line.

85
11.2 On-line measuring devices
The installation sites of the refractometers proved to provide enough information
for comprehensive washing line monitor and control. Washer performance
parameters such as the E-value and displacement ratio were calculated
successfully and monitored real-time. The parameters gave important information
on the washer performance and indicated if washer suffered deterioration in
performance.
The deployment of the refractometers went well, excluding the last wash loss
measuring site i.e. refractometer number 8. The sulfuric acid added at the site
factors disabled the use of the measurement. A calculation was created to
compensate the effect of sulfuric acid to the measurement, but the flow was not
stable and thus the compensation was not successful. The refractometers installed
in liquor line dirtied during time and steam washing devises were installed on
them.
In concentration scale of the whole washing line both refractometer and
conductivity correlate strongly with COD. However, when making the
comparison in washer specific concentrations the results suggest that conductivity
measurement is not capable of providing information on the COD level of liquor
in a certain washer. On the other hand, refractometer measurement proved to be a
useful tool to indicate liquor COD changes even washer specifically. However, in
order to obtain the most accurate result the COD/TDS correlation should be
created for each refractometer installation site individually. This is due to the fact
that liquor composition changes depending on the location.
As a wash loss assessment, the conductivity measurement works as a rough
feedback and indicate the direction of the process changes, while refractometer
provides the actual amount of wash loss with good precision even in narrow
concentration scales. Moreover, refractometer provides the possibility to use
performance parameters such as E-value and displacement ratio to continuously

86
monitor and develop washing efficiency. The possibility to install the
measurement in pulp line is another advantage of refractometer. The benefits of
conductivity are simplicity of the measuring device and small capital investment.
The utilization of both measuring devices would produce the most accurate wash
loss measurement and optimum feedback for a dilution factor control due to the
tendency of the methods to measure different substances in the liquor.
According to the analyses made the standard oven drying method appears not
suitable for dissolved solid analysis from secondary condensate due to some
volatile compounds evaporating in the analysis. Therefore, it would be interesting
to monitor the secondary condensate dissolved solids on-line using refractometer.
One of the refractometers was installed in a location where antifoaming agent was
added. The antifoaming agent did not affect the refractometer measurement.
Nevertheless, in further studies it would be interesting to analyze the possible
effect antifoaming agent might have on the dirtying of the prism of the
refractometer. The refractometer had to be cleaned after some process
disturbances because of a small layer of deposit on the surface.

87
11.3 Brown stock washing line performance
The wash result of the brown stock washing line is generally acceptable at the
fiber line 1. The experience and information gathered during the introduction
period and the trials suggest that, in comparison to the conventional control, the
wash water amount, i.e. dilution factor should be decreased in the washing line in
order to achieve the optimum economic and environmental performance. During
the trials this was accomplished. However, longer period trials are recommended
to assess the effect of dilution factor to bleaching chemical consumption.
The trials proved that the DD1 and DD2 tend to encounter problems in the wash
liquor circulation lines, when production rate or feed consistency were increased
too high or when dilution factor was lowered under tolerable limit.
One factor causing disturbances for the above mentioned washers is thought to be
the feed pump, which did not have the capacity to deliver steady flow to the
washers. After the trials the feed pump was updated to a more potent one and it is
suggested that the production rate and feed consistency trials be repeated.

88
References
1. R.H. Crotogino, N.A. Poirier, and T. Trinh. The principles of pulp washing. Tappi
Journal, 1987.
2. Gullichsen, J. & Fogelholm, C-J. Papermaking Science and Technology, Book 6A:
Chemical Pulping. Helsinki : Fapet, 1999.
3. Sixta, H. and Ed Krotcheck, A. Handbook of pulp. Weiheim : WILEY-VCH Verlag GmbH
& CO.KGaA, 2006.
4. R, Santos and P, Hart Brown stock washing, a review of the literature. Tappi journal,
2014, Vol. 13. p. 9-18.
5. Tervola, P., Henricson, J. Mathematical Model of fractional pulp washing and
applications in bleach plant. Atlanta : Tappi press, 1996.
6. Laxen, T. Pesun kemialliset ja fysikaaliset perusteet. Insko, 1986. Painos 30. s I1-I25.
7. Jensen, W. Puukemia, Suomen paperi-insinööriyhdistyksen oppi ja käsikirja I. Turku :
Suomen paperi-insinöörien yhdistys, 1977. p. 446.
8. Kovasin, K. Sellun pesun ja kemikaalikierron laskenta. Sellun pesu mustalipeäprosessin
osana. Espoo : Helsinki University of Technology, 2003. p. 33.
9. Favis, B D, Willis, J M and Goring, D A I. High Temperature Leaching of Lignin from
Unbleached Kraft Pulp Fibres. 1, s.l. : urnal of wood chemistry and technology, 1983, Vol.
3. p. 1-7.
10. H.V, Nordén. Analysis of pulp washing filter, Kemian teollisuus. 4, 1966, Vol. 23. 344.
11. Pekkanen, M. Nordén, H.Review of pulp washing models. 11, Espoo : Paperi ja Puu -
Papper och Trä, 1985.
12. Sillanpää, mervi. Studies on washing in kraft pulp bleaching. Oulu : University of
Oulu, 2005. s. 30-34.
13. Shackford, L.D Unravelin the mystery of washing efficiency determination. p. 419-
488, San Francisco : Tappi pulping conference, 1997.
14. Stromberg, C.B Washing for low bleach chemical consumption. Tappi Journal, 1991,
Vol. 74:10 p. 113-122.
15. Bottan, G. Is COD a wash-out on washing. Pulp & Paper International, 1983, Vol.
35:10, p. 51.

89
16. Viirimaa, M, et al. Identification of the wash loss compounds affecting the ECF
bleaching of softwood kraft pulp. Appita Journal, 2002, Vol. 55:6, p. 484-488.
17. Sankari, M. Effects of some spesific organic wash loss compounds on the oxygen
delignification response of softwood kraft pulp. Oulu : Appita Journal, 2004, Vol. 57:3,
p.228-231.
18. Sankari, Minna, et al. Real wash loss compounds in oxygen delignification of
softwood kraft pulp. Nordic Pulp and Paper Research Journal, 2004, Vol. 19:2, p.264-270.
19. Sillanpää, M. Real wash loss compounds in peroxide bleaching of softwood kraft pulp.
Appita Journal, 2003, Vol. 56:5, p. 397-400.
20. Anon. Process recractometer PR-23, Instruction manual. K-patents Ltd. 2013.
21. Kopra, R, Tirri, T and Dahl, O. Refractive index measurements for brown stock
washing loss - laboratory investigations. Appita Journal, 2008, Vol. 61:5, p.408-412.
22. Helttunen, Jukka. Washing loss on-line measurement in kraft pulping. Espoo :
Master's Thesis, 2007 p. 66-67.
23. Kopra, R, et al. Optimization of wash water usage in brown stock washing. Tappi
Journal, 2011, Vol. 10:9, p. 27-33.
24. Andersson, Niclas. Wilke, Caroline. Biazzo, Tom. Van Fleet, Rick. Germgård, Ulf. A
New Sensonr and a Novel Control Concept for Optimized Fiberline Operation. s.l. : PEERS
Conference, 11(2013)1, p. 190-197.
25. Lunn, R. Bleach plant washing: mill experience in measurement methodology and
cost/benefit analysis. Pulp & Paper Canada, 2001, Vol. 102:3. p. 46-49.
26. Andersson, N. Wilson, D,I. Measurement uncertainty in NIR analysis of black liquor
parameters. Karlstad : Paper and Timber, 2003:7, Vol. 85.
27. Leiviskä, K. Papermaking Science and Technology, Process control. Oulu : Fapet,
1998, pp.72-99.
28. Simo, Karjalainen. The optimization of the DD-washer. Espoo : Helsinki Univeristy of
Technology, Master's Thesis (In Finnish), 2008.
29. Kopra, R, et al. Optimisation of pressure filter performance using refractometer
measurements - Mill investigations. Appita Journal, 2011, Vol. 64:5. p. 49-54.
30. Anon. Washing Optimizer. s.l. : User manual, 2013.
31. Kapanen, J. Kuusisto, A. A new brown stock optimization method for economical pulp
production. Tappsa Journal, 2002.

90
32. Mizell, W. K. Improved pulp washing provides big savings for little expense. Pulp pap,
1996. 70:4 pp. 133 - 135.
33. Kovasin, K and Aittamaa, J.Factors defining the capacity of pulp washers. Paper and
Timber, 85(2003):6. p. 340-346.
34. Märkjärvi, Ilpo. Development of material balance and production rate control for
brown stock washing line. Tampere : Tampere University of Technology, 2005. Master's
Thesis.
35. Wasik, L, S, Mittet, G, R and Nelson, D, J. Controllling brownstock washing during
production rate changes. Tappi Journal, 2000, Vol. 83:3, p.94-101.
36. Lundqvist, S, O. Pulp washing control: Principles and results. Pulp and Paper Canada,
1985, Vol. 86:11. p. 72-76.
37. Turner, P.A, et al. Dynamic behaviour of brown stock washing system. Pulp and
Paper Canada, 1993, Vol. 94:9. p. 37-42.
38. K. Leiviskä. Papermaking Science and Technology. [book auth.] Process Control.
Espoo : Fapet, 1999.
39. Bender, G. Richard, L. Dorn, Walt. Advanced control for brown stock washers. Tappi
Journal, 1988, Vol. 71:12. p.115-118.
40. Kopra, R, Helttunen, J and Tervola, P. Refractive index measurements for brown stock
washing loss - mill investigations. Appita Journal, 2010, Vol. 62:2. p. 131-136.
41. Rudd, J. Using a neural network system for advanced process control. Tappi Journal,
1991, Vol. 74:10. p. 153-159.
42. Compton, R. Economic analysis of brown stock washing systems. Atlanta : Tappi
Press, 1997. p. 257.
43. Diesen, M. Economics of the pulp and paper industry. Papermaking Science and
Technology. FAPET, 1999.
44. Williams, J. R. Financial and Managerial Accounting. [book auth.] McGraw-Hill. p.
1117, 2012.
45. Gullichsen, J. Östman, H. Sorption and diffusion phenomena in pulp washing.
Atlanta : Tappi Journal, 1976, Vol. 59:6.
46. Viirimaa, M. Identification of the wash loss compounds affecting the ECF bleaching of
softwood kraft pulp. Appita Journal, 2002, Vol. 55:6, p.484-488.

91
47. Ala-Kaila, K., Vehmaa, J., Gullichsen, J., Strömberg, B. Leaching of organic material
from kraft pulps. Tappi pulp washing conference, Vancouver, Oct. 7-10 : Tappi press,
1996. p. 147-154.
48. Kovasin, K. Sellun pesun ja kemikaalikierron laskenta. Sellun pesu
mustalipeäprosessin osana. Espoo : Helsinki University of Technology, 2003.
49. H.V, Nordén. Analysis of pulp washing filter, Kemian teollisuus. 4, 1966, Vol. 23. p.
344.