school of bio sciences and technology, vit university ... · encapsulation efficiency and release...
TRANSCRIPT
Indian Journal of Pharmaceutical Education and Research | Vol 50 | Issue 2 | Apr-Jun, 2016 301
Pharmaceutical Research
www.ijper.org
Encapsulation Efficiency and Release of Green Tea Polyphenols from Poly (Lactic Acid)-Poly (Ethylene Glycol) Nanoparticles are Controlled by the ratio of Poly (Lactic Acid)/Poly (Ethylene Glycol)
Ravi Theaj Prakash Upputuri, Sudesh Kumar, Karikalan Kulandaivelu, Abul Kalam Azad Mandal*
School of Bio Sciences and Technology, VIT University, Vellore-632014, Tamil Nadu, INDIA.
ABSTRACTIntroduction: Despite several health benefits of green tea polyphenols (GTP), its use as a therapeutic agent has been constrained by instability, biotransformation and poor bioavailability. Objective: In our study, GTP was encapsulated in nanoparticles prepared from different ratios of poly (lactic acid) (PLA)/poly (ethylene glycol) (PEG). Methods: GTP loaded nanoparticles were synthesized and characterized. In vitro drug GTP release was carried out followed by determining drug release kinetics and the mechanism of release. Results: Nanoparticles of 95-175 nm were observed through AFM, SEM and were further characterized through XRD and FTIR. PLA/PEG ratio influenced the encapsulation efficiency (EE) and release of GTP from PLA-PEG nanoparticles. Nanoparticles prepared from PLA/PEG ratio of 3:1 showed maximum EE at GTP concentration of 12 mg/ml, with optimum ratio of polymer/drug being 8:1. Burst release of GTP was observed till 8 h, followed by sustained release at different pH, temperature and GTP concentrations at a PLA/PEG ratio of 3:1. Most of the release data were fitted into Zero order kinetics with a Fickian release and were not influenced by PLA/PEG ratio. Conclusion: It was observed that PLA-PEG nanoparticulate system at a ratio of 3:1 could be a potent carrier for achieving a sustained release of GTP. All these data indicated that EE and release of GTP from PLA-PEG nanoparticles were controlled by PLA/PEG ratio.
Key words: Green tea polyphenols, Fickian release, Poly (lactic acid), Poly (ethylene glycol), Release kinetics, Sustained release.
DOI: 10.5530/ijper.50.2.11Correspondence AddressDr. Abul Kalam Azad Mandal, School of Bio Sciences and Technology, VIT University,Vellore-632014, INDIA.Phone: +919443758596Email: [email protected]
INTRODUCTIONGreen tea polyphenols (GTP) are best known for their anti cancer and anti oxidant properties and effectiveness against other diseases like cardiovascular and neurodegenerative disorders.1 Despite several studies carried out on the health benefits of GTP, its use as a therapeutic agent is constrained by its low bio-availability, bio-transformation and instability.24 To overcome these limitations, nanotechnology could be adopted to increase bioavailability and protection from biotransformation and instability. Nanoparticles have the potential to protect, control the release and increase the action of these compounds.5 Many studies were carried out using biocompatible and biodegradable polymeric nanoparticles like poly lactic acid
(PLA), poly ethylene glycol (PEG), poly (lactide-co-glycolide) (PLGA), and poly caprolactone (PCL) for the delivery of drugs.6 The applications of PLA-PEG copolymers as biomaterial in drug delivery and tissue engineering have been well characterized. PLA is the backbone of the polymer that provides structural integrity to any scaffold. PEG has long been studied as an attractive biomaterial due to its ability to oppose protein adsorption.7 Introducing PEG into PLA decreases the acidity caused by degradation of the PLA and increases the hydrophilicity of the carriers. PEG may prevent the binding of serum opsonins to the particle surface, thereby reducing the affinity for Reticulo Endothelial System
Submission Date : 21-05-2015Revised Date : 13-08-2015Accepted Date : 16-02-2016
Ravi et al.: Green tea polyphenol loaded PLA-PEG nanoparticles
302 Indian Journal of Pharmaceutical Education and Research | Vol 50 | Issue 2 | Apr-Jun, 2016
(RES). As a result of high water solubility of PEG, the inclusion of hydrophilic PEG segments into the PLA polymers may enhance the diffusivity of water in the PLA-PEG copolymeric carriers.8 This assumption was supported by the observation that PEG coating avoids plasma protein adsorption, thereby minimizing the interaction with phagocytic cells and increasing the blood circulation time.9 Thus, the use of PLA-PEG copolymer as a nano based carrier for the delivery of drugs would serve as better vehicle for controlled and sustained release of drugs.Though several reports are available on application of GTP as a therapeutic agent and the efficiency of using PLA-PEG copolymer as a nano carrier, no reports have been published till date on the encapsulation of GTP in PLA-PEG nanoparticles and optimization of PLA/PEG ratio. Therefore, present study deals with the influence of PLA/PEG ratio on loading, release, release kinetics and mechanism of GTP release from PLA-PEG nanoparticles.
EXPERIMENTALMaterialsPoly (D, L-lactic acid) (PLA), polyethylene glycol (PEG), and green tea polyphenols (GTP) were purchased from Sigma Chemical Co., USA. All other chemicals were obtained from Hi Media, Mumbai which were of analytical grade.
Synthesis of GTP loaded PLA-PEG nanoparticlesPLA-PEG nanoparticles were synthesised by double emulsion solvent evaporation method as reported by Mainardes et al.10 Different quantities of polylactic acid (PLA) and polyethylene glycol (PEG) (25/75, 50/50 and 75/25 mg) were dissolved in 2 ml dichloro methane (DCM) and mixed with 200 µl polyvinyl alcohol (PVA, 0.1% w/v) containing GTP. The mixture was sonicated for 30 s at 55 W to form w/o emulsion. About 4 ml of PVA (0.7% w/v) was added and sonicated for 1 min at 55 W to form w/o/w emulsion. Organic solvent was evaporated at room temperature. Particles were recovered by centrifugation and washed twice with Milli Q water. PLA/PEG at the ratio of 1:3, 1:1 and 3:1 (25/75, 50/50 and 75/25 mg respectively) and GTP from 1 to 15 mg/ml were used in the experiment. Yield of GTP loaded PLA-PEG nanoparticles were calculated using the following formula:
{(weight of polymer GTP)
weight of nano particlesformedYield (%) 100
(Weight of polymer GTP)}
Characterization of PLA-PEG nanoparticlesSize of the particles was determined through dyanamic light scattering, AFM and HR SEM. Surface charge was determined through zeta potential analysis. Incorporation of GTP to PLA-PEG nanoparticles were analysed through FTIR and XRD.
Encapsulation efficiency (EE)The amount of entrapped GTP was calculated by subtracting the unloaded GTP from the initially used total feed. GTP was estimated following the procedure described by Swain and Hillis.11 To 0.5 ml of sample, 0.5 ml Follin Ciocalteu reagent (1 M) and 0.5 ml 35% sodium carbonate was added. On incubation for 30 min in dark, absorbance was measured at 700 nm in a spectro-photometer. To determine the concentration of GTP, the absorbance values were interpolated to the known standard curve for GTP. EE was calculated using the following formula:
{(Amount of initial GTP Amount of freeGTP)EE(%)
Amount of total GTP)
In vitro release of GTP
GTP loaded PLA-PEG nanoparticles were placed in a tube containing 10 ml phosphate buffer saline (PBS) at pH 7.4. At different time intervals, 1 ml from the tube was collected, which was replaced by the same volume of fresh PBS. Collected samples were centrifuged and the supernatant was used to determine the amount of GTP released. Samples were collected from 30 min to 48 h at regular time intervals. Estimation of GTP was carried out by the method of Swain and Hillis.11 Release studies was carried out for different ratios of PLA/PEG for different concentrations of GTP loaded and by varying the release conditions such as pH and temperature.
Mathematical modelling and release kineticsTo study the mechanism of drug release, in vitro release data was fitted to various mathematical models like Zero order, First order, Higuchi, Hixson–Crowell and Korsemeyer-Peppas models.12 The correlation coefficient (R2) was used as an indicator for the best fit for each of the models and release exponent (n) to determine the mechanism of release.
Statistical analysisAll data were subjected to analysis of variance (ANOVA) and presented as mean ± SD. The means were separated by Duncan’s multiple range test (DMRT) at P=0.05.
Ravi et al.: Green tea polyphenol loaded PLA-PEG nanoparticles
Indian Journal of Pharmaceutical Education and Research | Vol 50 | Issue 2 | Apr-Jun, 2016 303
RESULTS AND DISCUSSION
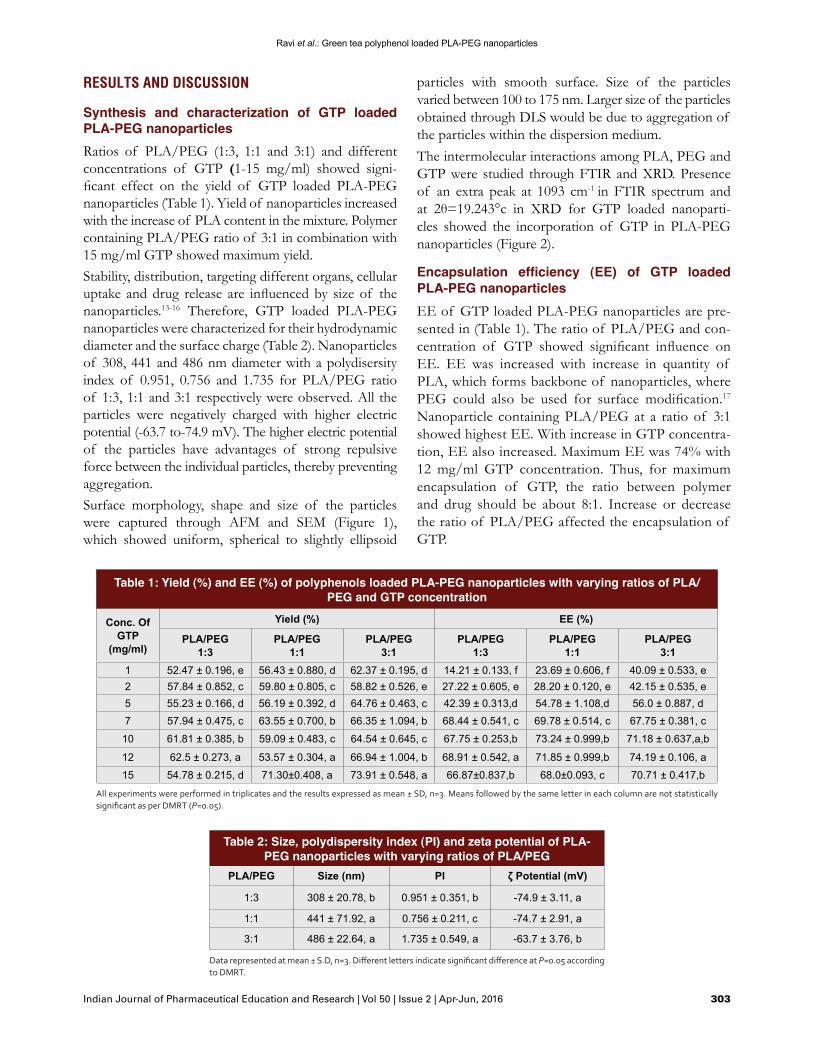
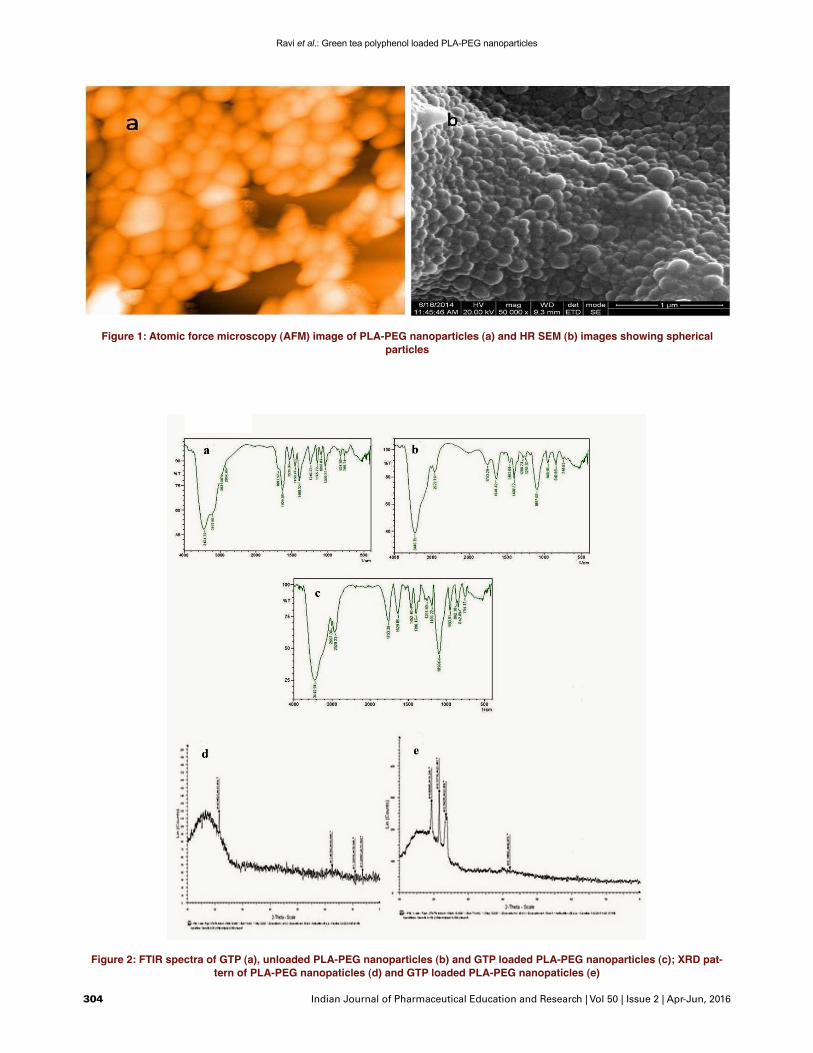
Synthesis and characterization of GTP loaded PLA-PEG nanoparticlesRatios of PLA/PEG (1:3, 1:1 and 3:1) and different concentrations of GTP (1-15 mg/ml) showed signi-ficant effect on the yield of GTP loaded PLA-PEG nanoparticles (Table 1). Yield of nanoparticles increased with the increase of PLA content in the mixture. Polymer containing PLA/PEG ratio of 3:1 in combination with 15 mg/ml GTP showed maximum yield.Stability, distribution, targeting different organs, cellular uptake and drug release are influenced by size of the nanoparticles.1316 Therefore, GTP loaded PLA-PEG nanoparticles were characterized for their hydrodynamic diameter and the surface charge (Table 2). Nano particles of 308, 441 and 486 nm diameter with a polydisersity index of 0.951, 0.756 and 1.735 for PLA/PEG ratio of 1:3, 1:1 and 3:1 respectively were observed. All the particles were negatively charged with higher electric potential (-63.7 to-74.9 mV). The higher electric potential of the particles have advantages of strong repulsive force between the individual particles, thereby preventing aggregation. Surface morphology, shape and size of the particles were captured through AFM and SEM (Figure 1), which showed uniform, spherical to slightly ellipsoid
particles with smooth surface. Size of the particles varied between 100 to 175 nm. Larger size of the particles obtained through DLS would be due to aggregation of the particles within the dispersion medium. The intermolecular interactions among PLA, PEG and GTP were studied through FTIR and XRD. Presence of an extra peak at 1093 cm1 in FTIR spectrum and at 2θ=19.243°c in XRD for GTP loaded nanoparticles showed the incorporation of GTP in PLA-PEG nanoparticles (Figure 2).
Encapsulation efficiency (EE) of GTP loaded PLA-PEG nanoparticlesEE of GTP loaded PLA-PEG nanoparticles are presented in (Table 1). The ratio of PLA/PEG and concentration of GTP showed significant influence on EE. EE was increased with increase in quantity of PLA, which forms backbone of nanoparticles, where PEG could also be used for surface modification.17 Nanoparticle containing PLA/PEG at a ratio of 3:1 showed highest EE. With increase in GTP concentration, EE also increased. Maximum EE was 74% with 12 mg/ml GTP concentration. Thus, for maximum encapsulation of GTP, the ratio between polymer and drug should be about 8:1. Increase or decrease the ratio of PLA/PEG affected the encapsulation of GTP.
Table 1: Yield (%) and EE (%) of polyphenols loaded PLA-PEG nanoparticles with varying ratios of PLA/PEG and GTP concentration
Conc. Of GTP
(mg/ml)
Yield (%) EE (%)
PLA/PEG 1:3
PLA/PEG1:1
PLA/PEG3:1
PLA/PEG 1:3
PLA/PEG 1:1
PLA/PEG3:1
1 52.47 ± 0.196, e 56.43 ± 0.880, d 62.37 ± 0.195, d 14.21 ± 0.133, f 23.69 ± 0.606, f 40.09 ± 0.533, e2 57.84 ± 0.852, c 59.80 ± 0.805, c 58.82 ± 0.526, e 27.22 ± 0.605, e 28.20 ± 0.120, e 42.15 ± 0.535, e5 55.23 ± 0.166, d 56.19 ± 0.392, d 64.76 ± 0.463, c 42.39 ± 0.313,d 54.78 ± 1.108,d 56.0 ± 0.887, d7 57.94 ± 0.475, c 63.55 ± 0.700, b 66.35 ± 1.094, b 68.44 ± 0.541, c 69.78 ± 0.514, c 67.75 ± 0.381, c
10 61.81 ± 0.385, b 59.09 ± 0.483, c 64.54 ± 0.645, c 67.75 ± 0.253,b 73.24 ± 0.999,b 71.18 ± 0.637,a,b
12 62.5 ± 0.273, a 53.57 ± 0.304, a 66.94 ± 1.004, b 68.91 ± 0.542, a 71.85 ± 0.999,b 74.19 ± 0.106, a
15 54.78 ± 0.215, d 71.30±0.408, a 73.91 ± 0.548, a 66.87±0.837,b 68.0±0.093, c 70.71 ± 0.417,b
All experiments were performed in triplicates and the results expressed as mean ± SD, n=3. Means followed by the same letter in each column are not statistically significant as per DMRT (P=0.05).
Table 2: Size, polydispersity index (PI) and zeta potential of PLA-PEG nanoparticles with varying ratios of PLA/PEG
PLA/PEG Size (nm) PI ζ Potential (mV)
1:3 308 ± 20.78, b 0.951 ± 0.351, b -74.9 ± 3.11, a
1:1 441 ± 71.92, a 0.756 ± 0.211, c -74.7 ± 2.91, a
3:1 486 ± 22.64, a 1.735 ± 0.549, a -63.7 ± 3.76, b
Data represented at mean ± S.D, n=3. Different letters indicate significant difference at P=0.05 according to DMRT.
Ravi et al.: Green tea polyphenol loaded PLA-PEG nanoparticles
304 Indian Journal of Pharmaceutical Education and Research | Vol 50 | Issue 2 | Apr-Jun, 2016
Figure 1: Atomic force microscopy (AFM) image of PLA-PEG nanoparticles (a) and HR SEM (b) images showing spherical particles
Figure 2: FTIR spectra of GTP (a), unloaded PLA-PEG nanoparticles (b) and GTP loaded PLA-PEG nanoparticles (c); XRD pat-tern of PLA-PEG nanopaticles (d) and GTP loaded PLA-PEG nanopaticles (e)
Ravi et al.: Green tea polyphenol loaded PLA-PEG nanoparticles
Indian Journal of Pharmaceutical Education and Research | Vol 50 | Issue 2 | Apr-Jun, 2016 305
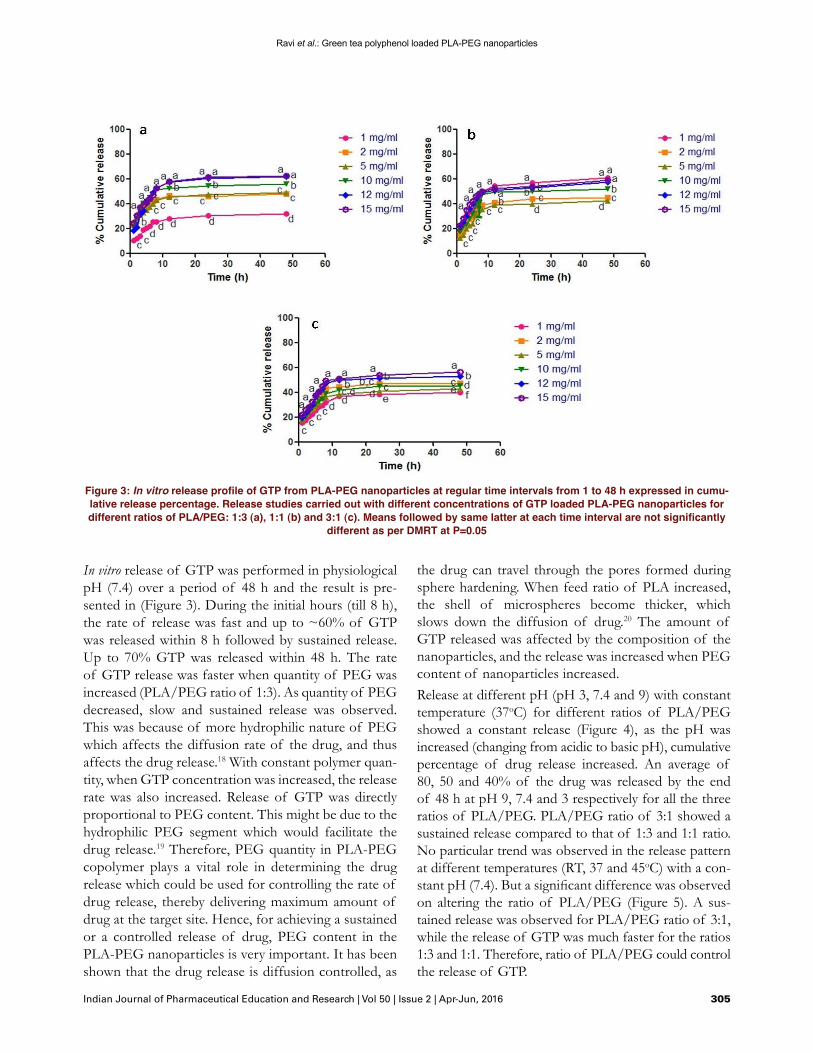
In vitro release of GTP was performed in physiological pH (7.4) over a period of 48 h and the result is presented in (Figure 3). During the initial hours (till 8 h), the rate of release was fast and up to ~60% of GTP was released within 8 h followed by sustained release. Up to 70% GTP was released within 48 h. The rate of GTP release was faster when quantity of PEG was increased (PLA/PEG ratio of 1:3). As quantity of PEG decreased, slow and sustained release was observed. This was because of more hydrophilic nature of PEG which affects the diffusion rate of the drug, and thus affects the drug release.18 With constant polymer quantity, when GTP concentration was increased, the release rate was also increased. Release of GTP was directly proportional to PEG content. This might be due to the hydrophilic PEG segment which would facilitate the drug release.19 Therefore, PEG quantity in PLA-PEG copolymer plays a vital role in determining the drug release which could be used for controlling the rate of drug release, thereby delivering maximum amount of drug at the target site. Hence, for achieving a sustained or a controlled release of drug, PEG content in the PLA-PEG nanoparticles is very important. It has been shown that the drug release is diffusion controlled, as
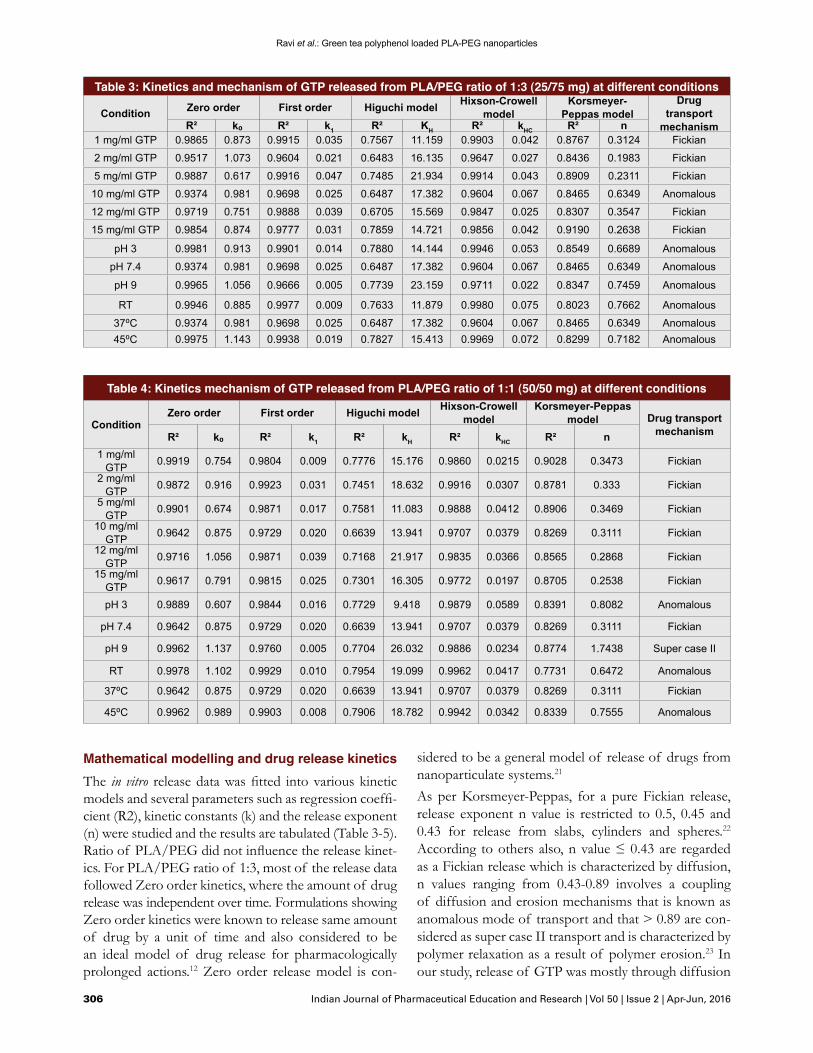
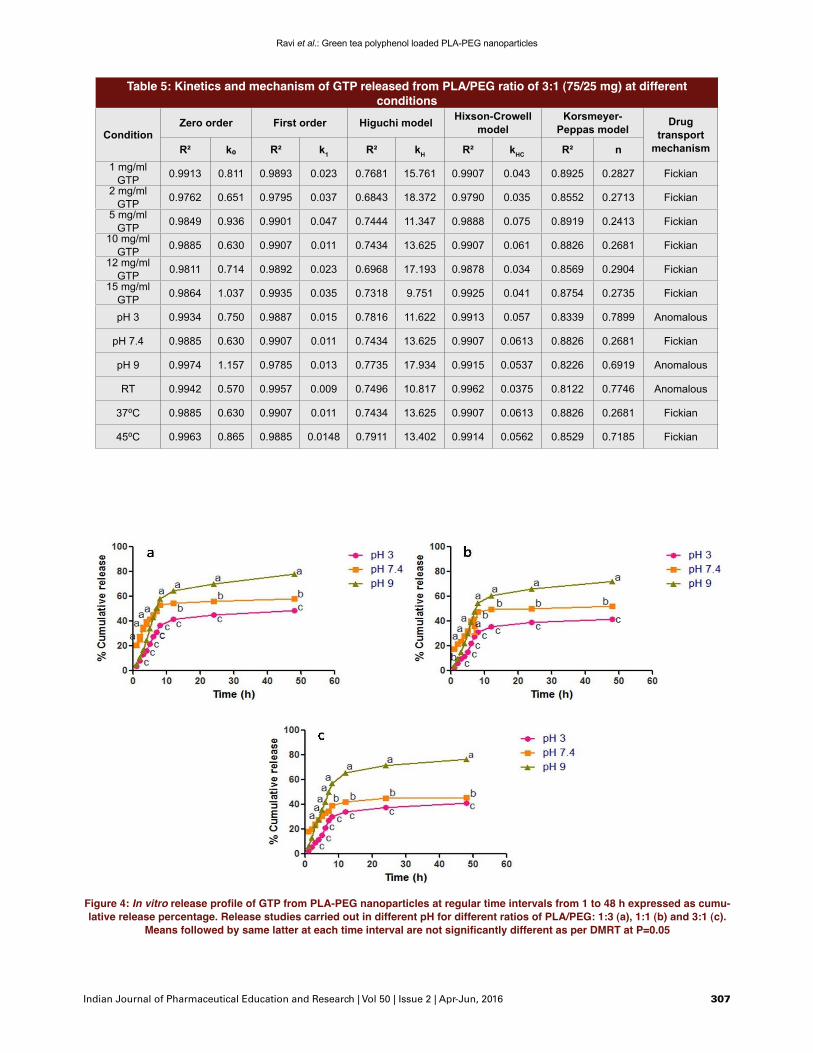
the drug can travel through the pores formed during sphere hardening. When feed ratio of PLA increased, the shell of microspheres become thicker, which slows down the diffusion of drug.20 The amount of GTP released was affected by the composition of the nanoparticles, and the release was increased when PEG content of nanoparticles increased. Release at different pH (pH 3, 7.4 and 9) with constant temperature (37oC) for different ratios of PLA/PEG showed a constant release (Figure 4), as the pH was increased (changing from acidic to basic pH), cumulative percentage of drug release increased. An average of 80, 50 and 40% of the drug was released by the end of 48 h at pH 9, 7.4 and 3 respectively for all the three ratios of PLA/PEG. PLA/PEG ratio of 3:1 showed a sustained release compared to that of 1:3 and 1:1 ratio. No particular trend was observed in the release pattern at different temperatures (RT, 37 and 45oC) with a constant pH (7.4). But a significant difference was observed on altering the ratio of PLA/PEG (Figure 5). A sustained release was observed for PLA/PEG ratio of 3:1, while the release of GTP was much faster for the ratios 1:3 and 1:1. Therefore, ratio of PLA/PEG could control the release of GTP.
Figure 3: In vitro release profile of GTP from PLA-PEG nanoparticles at regular time intervals from 1 to 48 h expressed in cumu-lative release percentage. Release studies carried out with different concentrations of GTP loaded PLA-PEG nanoparticles for different ratios of PLA/PEG: 1:3 (a), 1:1 (b) and 3:1 (c). Means followed by same latter at each time interval are not significantly
different as per DMRT at P=0.05
Ravi et al.: Green tea polyphenol loaded PLA-PEG nanoparticles
306 Indian Journal of Pharmaceutical Education and Research | Vol 50 | Issue 2 | Apr-Jun, 2016
Table 3: Kinetics and mechanism of GTP released from PLA/PEG ratio of 1:3 (25/75 mg) at different conditions
Condition Zero order First order Higuchi model Hixson-Crowell model
Korsmeyer-Peppas model
Drug transport
mechanismR² k₀ R² k1 R² KH R² kHC R² n1 mg/ml GTP 0.9865 0.873 0.9915 0.035 0.7567 11.159 0.9903 0.042 0.8767 0.3124 Fickian
2 mg/ml GTP 0.9517 1.073 0.9604 0.021 0.6483 16.135 0.9647 0.027 0.8436 0.1983 Fickian
5 mg/ml GTP 0.9887 0.617 0.9916 0.047 0.7485 21.934 0.9914 0.043 0.8909 0.2311 Fickian
10 mg/ml GTP 0.9374 0.981 0.9698 0.025 0.6487 17.382 0.9604 0.067 0.8465 0.6349 Anomalous
12 mg/ml GTP 0.9719 0.751 0.9888 0.039 0.6705 15.569 0.9847 0.025 0.8307 0.3547 Fickian
15 mg/ml GTP 0.9854 0.874 0.9777 0.031 0.7859 14.721 0.9856 0.042 0.9190 0.2638 Fickian
pH 3 0.9981 0.913 0.9901 0.014 0.7880 14.144 0.9946 0.053 0.8549 0.6689 Anomalous
pH 7.4 0.9374 0.981 0.9698 0.025 0.6487 17.382 0.9604 0.067 0.8465 0.6349 Anomalous
pH 9 0.9965 1.056 0.9666 0.005 0.7739 23.159 0.9711 0.022 0.8347 0.7459 Anomalous
RT 0.9946 0.885 0.9977 0.009 0.7633 11.879 0.9980 0.075 0.8023 0.7662 Anomalous
37⁰C 0.9374 0.981 0.9698 0.025 0.6487 17.382 0.9604 0.067 0.8465 0.6349 Anomalous45⁰C 0.9975 1.143 0.9938 0.019 0.7827 15.413 0.9969 0.072 0.8299 0.7182 Anomalous
Table 4: Kinetics mechanism of GTP released from PLA/PEG ratio of 1:1 (50/50 mg) at different conditions
ConditionZero order First order Higuchi model Hixson-Crowell
modelKorsmeyer-Peppas
model Drug transport mechanismR² k₀ R² k1 R² kH R² kHC R² n
1 mg/ml GTP 0.9919 0.754 0.9804 0.009 0.7776 15.176 0.9860 0.0215 0.9028 0.3473 Fickian
2 mg/ml GTP 0.9872 0.916 0.9923 0.031 0.7451 18.632 0.9916 0.0307 0.8781 0.333 Fickian
5 mg/ml GTP 0.9901 0.674 0.9871 0.017 0.7581 11.083 0.9888 0.0412 0.8906 0.3469 Fickian
10 mg/ml GTP 0.9642 0.875 0.9729 0.020 0.6639 13.941 0.9707 0.0379 0.8269 0.3111 Fickian
12 mg/ml GTP 0.9716 1.056 0.9871 0.039 0.7168 21.917 0.9835 0.0366 0.8565 0.2868 Fickian
15 mg/ml GTP 0.9617 0.791 0.9815 0.025 0.7301 16.305 0.9772 0.0197 0.8705 0.2538 Fickian
pH 3 0.9889 0.607 0.9844 0.016 0.7729 9.418 0.9879 0.0589 0.8391 0.8082 Anomalous
pH 7.4 0.9642 0.875 0.9729 0.020 0.6639 13.941 0.9707 0.0379 0.8269 0.3111 Fickian
pH 9 0.9962 1.137 0.9760 0.005 0.7704 26.032 0.9886 0.0234 0.8774 1.7438 Super case II
RT 0.9978 1.102 0.9929 0.010 0.7954 19.099 0.9962 0.0417 0.7731 0.6472 Anomalous
37⁰C 0.9642 0.875 0.9729 0.020 0.6639 13.941 0.9707 0.0379 0.8269 0.3111 Fickian
45⁰C 0.9962 0.989 0.9903 0.008 0.7906 18.782 0.9942 0.0342 0.8339 0.7555 Anomalous
Mathematical modelling and drug release kineticsThe in vitro release data was fitted into various kinetic models and several parameters such as regression coefficient (R2), kinetic constants (k) and the release exponent (n) were studied and the results are tabulated (Table 35). Ratio of PLA/PEG did not influence the release kinetics. For PLA/PEG ratio of 1:3, most of the release data followed Zero order kinetics, where the amount of drug release was independent over time. Formulations showing Zero order kinetics were known to release same amount of drug by a unit of time and also considered to be an ideal model of drug release for pharmacologically prolonged actions.12 Zero order release model is con
sidered to be a general model of release of drugs from nanoparticulate systems.21
As per Korsmeyer-Peppas, for a pure Fickian release, release exponent n value is restricted to 0.5, 0.45 and 0.43 for release from slabs, cylinders and spheres.22 According to others also, n value ≤ 0.43 are regarded as a Fickian release which is characterized by diffusion, n values ranging from 0.43-0.89 involves a coupling of diffusion and erosion mechanisms that is known as anomalous mode of transport and that > 0.89 are considered as super case II transport and is characterized by polymer relaxation as a result of polymer erosion.23 In our study, release of GTP was mostly through diffusion
Ravi et al.: Green tea polyphenol loaded PLA-PEG nanoparticles
Indian Journal of Pharmaceutical Education and Research | Vol 50 | Issue 2 | Apr-Jun, 2016 307
Figure 4: In vitro release profile of GTP from PLA-PEG nanoparticles at regular time intervals from 1 to 48 h expressed as cumu-lative release percentage. Release studies carried out in different pH for different ratios of PLA/PEG: 1:3 (a), 1:1 (b) and 3:1 (c).
Means followed by same latter at each time interval are not significantly different as per DMRT at P=0.05
Table 5: Kinetics and mechanism of GTP released from PLA/PEG ratio of 3:1 (75/25 mg) at different conditions
ConditionZero order First order Higuchi model Hixson-Crowell
modelKorsmeyer-
Peppas modelDrug
transport mechanismR² k₀ R² k1 R² kH R² kHC R² n
1 mg/ml GTP 0.9913 0.811 0.9893 0.023 0.7681 15.761 0.9907 0.043 0.8925 0.2827 Fickian
2 mg/ml GTP 0.9762 0.651 0.9795 0.037 0.6843 18.372 0.9790 0.035 0.8552 0.2713 Fickian
5 mg/ml GTP 0.9849 0.936 0.9901 0.047 0.7444 11.347 0.9888 0.075 0.8919 0.2413 Fickian
10 mg/ml GTP 0.9885 0.630 0.9907 0.011 0.7434 13.625 0.9907 0.061 0.8826 0.2681 Fickian
12 mg/ml GTP 0.9811 0.714 0.9892 0.023 0.6968 17.193 0.9878 0.034 0.8569 0.2904 Fickian
15 mg/ml GTP 0.9864 1.037 0.9935 0.035 0.7318 9.751 0.9925 0.041 0.8754 0.2735 Fickian
pH 3 0.9934 0.750 0.9887 0.015 0.7816 11.622 0.9913 0.057 0.8339 0.7899 Anomalous
pH 7.4 0.9885 0.630 0.9907 0.011 0.7434 13.625 0.9907 0.0613 0.8826 0.2681 Fickian
pH 9 0.9974 1.157 0.9785 0.013 0.7735 17.934 0.9915 0.0537 0.8226 0.6919 Anomalous
RT 0.9942 0.570 0.9957 0.009 0.7496 10.817 0.9962 0.0375 0.8122 0.7746 Anomalous
37⁰C 0.9885 0.630 0.9907 0.011 0.7434 13.625 0.9907 0.0613 0.8826 0.2681 Fickian
45⁰C 0.9963 0.865 0.9885 0.0148 0.7911 13.402 0.9914 0.0562 0.8529 0.7185 Fickian
Ravi et al.: Green tea polyphenol loaded PLA-PEG nanoparticles
308 Indian Journal of Pharmaceutical Education and Research | Vol 50 | Issue 2 | Apr-Jun, 2016
(Fickian release) as n value was limited to 0.43 and our particle was spherical.For PLA/PEG ratio of 1:3, release at different pH and temperatures showed anomalous mode of transport, while that with different GTP concentrations followed mostly Fickian release. In case of PLA/PEG ratio of 1:1, both Zero order and First order kinetics were observed. Release mechanism here was dominated by a Fickian release. Super case II transport, with a release exponent of 1.7438 was observed when release was carried out at pH 9, while in case of PLA/PEG ratios of 1:3 and 3:1, anomalous transport was observed at pH 9. In PLA/PEG ratio of 3:1 also, the release pattern was observed to be both Zero order and First order and release mechanism was predominantly a Fickian release.
CONCLUSIONInfluence of PLA/PEG ratio on yield, EE and release of GTP from PLA-PEG nanoparticles has been established. Quantity of PEG used for the development of PLA-PEG nanoparticles played an important role on yield, loading and release of GTP. Lower the PEG content (PLA/PEG ratio of 3:1), higher was the encapsulation efficiency and slower was the release of GTP. A combination of Zero order kinetics and anomalous mode of transport would make PLA-PEG nanopar
ticles an ideal carrier for delivery of GTP and using a lower amount of PEG in the PLA-PEG mixture would result in controlled release of GTP.
ACKNOWLEDGEMENTAuthors would like to thank the management of VIT University for providing the necessary facilities to carry out the work.
CONFILCTS OF INTEREST The authors declare no conflict of interest.
REFERENCES1. Zaveri NT. Green tea and its polyphenolic catechins: Medicinal uses in
cancer and noncancer applications. Life Sci. 2006;78(18):2073-80.2. Zhu QY, Zhang A, Sang T, Huang D, Chen ZY. Stability of green tea catechins.
J Agric Food Chem. 1997;45(12):4624-8. 3. Yang SC, Lu LF, Cai Y, Zhu JB, Liang BW, Yang CZ. Body distribution in mice
of intravenously injected camptothecin solid lipid nanoparticles and targeting effect on brain. J Control Release. 1999;59(3):299-307.
4. Lu H, Meng X, Yang CS. Enzymology of methylation of tea catechins and inhibition of catechol-O-methyltransferase by (−)-epigallocatechin gallate. Drug Metab Dispos. 2003;31(5):572-9.
5. Barras A, Mezzetti A, Richard A. Formulation and characterization of polyphenol-loaded lipid nanocapsules. Int J Pharmaceut. 2009;379(2):270-7.
6. Semete B, Booysen L, Lemmer Y, Kalombo L, Katata L, Verschoor J, et al,. In vivo evaluation of the biodistribution and safety of PLGA nanoparticles as drug delivery systems. Nanomed Nanotechnol. 2010;6(5):662-71.
Figure 5: In vitro release profile of GTP from PLA-PEG nanoparticles at regular time intervals from 1 to 48 h expressed as cumu-lative release percentage. Release studies carried out in different temperatures for different ratios of PLA/PEG: 1:3 (a), 1:1 (b)
and 3:1 (c). Means followed by same latter at each time interval are not significantly different as per DMRT at P=0.05
Ravi et al.: Green tea polyphenol loaded PLA-PEG nanoparticles
Indian Journal of Pharmaceutical Education and Research | Vol 50 | Issue 2 | Apr-Jun, 2016 309
7. Vila A, Gill H, McCallion O, Alonso MJ. Transport of PLA-PEG particles across the nasal mucosa: effect of particle size and PEG coating density. J Control Release. 2004;98(2):231-44.
8. Huang X, Brazel CS. On the importance and mechanisms of burst release in matrix-controlled drug delivery systems. J Control Release. 2001;73(2):121-36.
9. Verrechia T, Spenlehauer G, Bazile DV, Murry-Brelier A, Archimbaud AY, Veillard M. Non-stealth (poly (lactic acid: albumin)) and stealth (poly(lactic acid-polyethylene glycol)) nanoparticles as injectable drugs carriers. J Control Release. 1995;36(1):49-51.
10. Mainardes RM, Khalil NM, Gremiaob MPD. Intranasal delivery of zidovudine by PLA and PLA–PEG blend nanoparticles. Int J Pharmaceut. 2010;395(1):266-71.
11. Swain T, Hillis WE. The phenolic constituents of Prunus domestica I-the quantitative analysis of phenolic constituents. J Sci Food Agric. 1959;10(1):63-8.
12. Costa P, Lobo JMS. Modelling and comparison of dissolution profiles. Eur J Pharm Sci. 2011;13(2):123-33.
13. Duchene D, Ponchel G. Principle and investigation of the bioadhesion mechanism of solid dosage forms. Biomaterials. 1992;13(10):709-14.
14. Lamprecht A, Schafer U, Lehr CM. Size-dependent bioadhesion of micro-and nanoparticulate carriers to the inflamed colonic mucosa. Pharmceut Res. 2001;18(6):788-93.
15. Soppimath KS, Aminabhavi TM, Kulkarni AR, Rudzinski WE. Biodegradable polymeric nanoparticles as drug delivery devices. J Control Release. 2001;70(1):1-20.
16. Shakweh M, Besnard M, Nicolas V, Fattal E. Poly (lactide-co-glycolide) particles of different physicochemical properties and their uptake by Peyer’s patches in mice. Eur J Pharm Biopharm. 2005;61(1):1-13.
17. Essa S, Rabanel JM, Hildgen P. Characterization of rhodamine loaded PEG-g-PLA nanoparticles (NPs): Effect of poly(ethylene glycol) grafting density. Int J Pharmaceut. 2011;411(1):178-87.
18. Chen L, Xie Z, Hu J, Chen X, Jing X. Enantiomeric PLA-PEG block copolymers and their stereo complex micelles used as rifampin delivery. J Nanopart Res. 2006;9(5):777-85.
19. Yang L, Wu X, Liu L, Duan Y, Li S. Novel biodegradable polylactide/poly(ethylene glycol) micelles prepared by direct dissolution method for controlled delivery of anticancer drugs. Pharmaceut Res. 2009;26(10):2332-42.
20. Das GS, Rao GHR, Wilson RF, Chandy T. Controlled delivery of taxol from poly (ethylene glycol)-coated poly (lactic acid) microspheres. J Biomed Mater Res. 2001;55(1):96-103.
21. Luo Y, Zhang L, Xu F. Synthesis, micellization and caffeine drug release kinetics of novel PBMA-b-PNIPAAm block polymer brushes. Chem Engineer J. 2012;189(7):431-42.
22. Martinez A, Iglesias I, Lozano R, Teijon JM, Blanco MD. Synthesis and Characterization of thiolated alginate-albumin nanoparticles stabilized by disulphide bonds. Evaluation as drug delivery systems. Carbohyd Polym. 2011;83(3):1311-21.
23. Arifin DY, Lee LY, Wang C. Mathematical modelling and simulation of drug release from microspheres: Implications to drug delivery systems. Adv Drug Deliver Rev. 2006;58(12):1274-325.
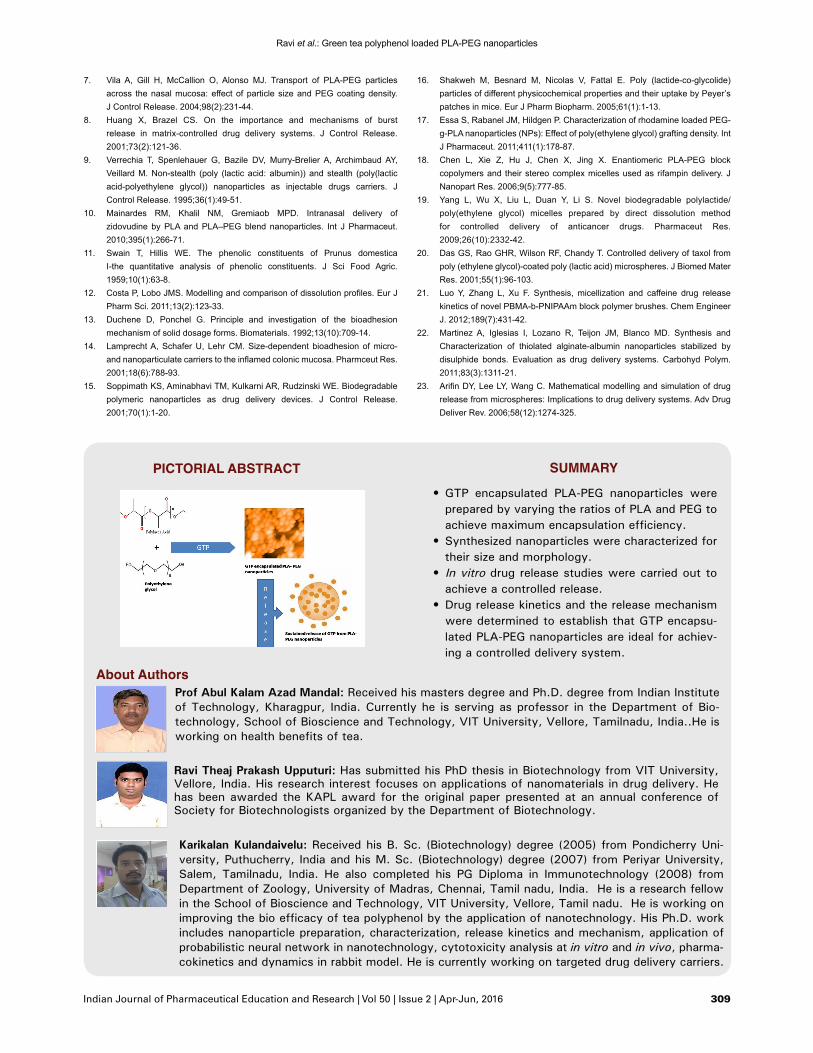
• GTP encapsulated PLA-PEG nanoparticles were prepared by varying the ratios of PLA and PEG to achieve maximum encapsulation efficiency.
• Synthesized nanoparticles were characterized for their size and morphology.
• In vitro drug release studies were carried out to achieve a controlled release.
• Drug release kinetics and the release mechanism were determined to establish that GTP encapsu-lated PLA-PEG nanoparticles are ideal for achiev-ing a controlled delivery system.
Prof Abul Kalam Azad Mandal: Received his masters degree and Ph.D. degree from Indian Institute of Technology, Kharagpur, India. Currently he is serving as professor in the Department of Bio-technology, School of Bioscience and Technology, VIT University, Vellore, Tamilnadu, India..He is working on health benefits of tea.
About Authors
Ravi Theaj Prakash Upputuri: Has submitted his PhD thesis in Biotechnology from VIT University, Vellore, India. His research interest focuses on applications of nanomaterials in drug delivery. He has been awarded the KAPL award for the original paper presented at an annual conference of Society for Biotechnologists organized by the Department of Biotechnology.
Karikalan Kulandaivelu: Received his B. Sc. (Biotechnology) degree (2005) from Pondicherry Uni-versity, Puthucherry, India and his M. Sc. (Biotechnology) degree (2007) from Periyar University, Salem, Tamilnadu, India. He also completed his PG Diploma in Immunotechnology (2008) from Department of Zoology, University of Madras, Chennai, Tamil nadu, India. He is a research fellow in the School of Bioscience and Technology, VIT University, Vellore, Tamil nadu. He is working on improving the bio efficacy of tea polyphenol by the application of nanotechnology. His Ph.D. work includes nanoparticle preparation, characterization, release kinetics and mechanism, application of probabilistic neural network in nanotechnology, cytotoxicity analysis at in vitro and in vivo, pharma-cokinetics and dynamics in rabbit model. He is currently working on targeted drug delivery carriers.
PICTORIAL ABSTRACT SUMMARY