school district of upper freehold … district of upper freehold regional ... is in line with the...
TRANSCRIPT

SCHOOL DISTRICT OF UPPER FREEHOLD REGIONAL
Allentown, New JerseyCounty of Monmouth
COMPREHENSIVE ANNUAL FINANCIAL REPORTFOR THE FISCAL YEAR ENDED JUNE 30, 2016


Upper Freehold Regional School DistrictFinance Department
COMPREHENSIVE ANNUAL FINANCIAL REPORT
OF THE
UPPER FREEHOLD REGIONAL BOARD OF EDUCATION
ALLENTOWN, NEW JERSEY
FOR THE FISCAL YEAR ENDED JUNE 30, 2016
Prepared by


PAGE
Letter of Transmittal 1Organizational Chart 7Roster of Officials 8Consultants and Advisors 9
Independent Auditor's Report 13
REQUIRED SUPPLEMENTARY INFORMATION - PART I
Management's Discussion & Analysis 19
BASIC FINANCIAL STATEMENTS
A. Government-Wide Financial Statements:A-1 Statement of Net Position 35A-2 Statement of Activities 36
B. Fund Financial Statements:Governmental Funds:
B-1 Balance Sheet 43B-2 Statement of Revenues, Expenditures & Changes in Fund Balance 44B-3 Reconciliation of the Statement of Revenues, Expenditures & Changes in Fund
Balance of Governmental Funds to the Statement of Activities 45Proprietary Funds:
B-4 Statement of Net Position 49B-5 Statement of Revenues, Expenditures & Changes in Net Position 50B-6 Statement of Cash Flows 51
Fiduciary Funds:B-7 Statement of Fiduciary Net Position 55B-8 Statement of Changes in Fiduciary Net Position 56
Notes to Financial Statements 59
REQUIRED SUPPLEMENTARY INFORMATION - PART II
C. Budgetary Comparison Schedules:C-1 Budgetary Comparison Schedule - General Fund 95C-2 Budgetary Comparison Schedule - Special Revenue Fund 105
Notes to the Required Supplementary Information:C-3 Budget-to-GAAP Reconciliation 111
INTRODUCTORY SECTION
FINANCIAL SECTION
OUTLINE OF CAFR - GASB #34

REQUIRED SUPPLEMENTARY INFORMATION - PART III
L. Schedules Related to Accounting and Reporting for Pensions (GASB 68) L-1 Schedule of the District’s Proportionate Share of the Net Pension Liability – PERS 117
L-2 Schedule of the District Contributions – PERS 118 L-3 State's Proportionate Share of the Net Pension Liability Associated with the District's – TPAF 119
Notes to the Required Supplementary Information - Part III 123
Other Supplementary Information
D. School Based Budget Schedules Fund:D-1 Combining Balance Sheet N/A
D-2 Blended Resource Fund - Schedule of Expenditures Allocated by Resource Type - Actual N/A
D-3 Blended Resource Fund - Schedule of Blended Expenditures - Budget & Actual N/A
E. Special Revenue Fund:E-1 Combining Schedule of Revenues & Expenditures - Special Revenue Fund - 129
Budgetary BasisE-2 Preschool Education Aid Schedule(s) of Expenditures - Budgetary Basis N/A
F. Capital Projects Fund:F-1 Summary Statement of Project Expenditures N/AF-2 Summary Schedule of Revenues, Expenditures and Changes in Fund Balance -
Budgetary Basis N/AF-2a Schedule of Revenues, Expenditures, Project Balance & Project Status -
Budgetary Basis N/A
G. Proprietary Funds:Enterprise Funds:
G-1 Combining Statement of Net Position 139G-2 Combining Statement of Revenues, Expenses & Changes in Fund Net Position 140G-3 Combining Statement of Cash Flows 141
Internal Service Funds:G-4 Combining Statement of Net Position N/AG-5 Combining Statement of Revenues, Expenses & Changes in Fund Net Position N/AG-6 Combining Statement of Cash Flows N/A
H. Fiduciary Funds:H-1 Combining Statement of Fiduciary Net Position 147H-2 Combining Statement of Changes in Fiduciary Net Position 148H-3 Student Activity Agency Fund Schedule of Receipts & Disbursements 149H-4 Payroll & Payroll Agency Fund Schedule of Receipts & Disbursements 149
I. Long-Term Debt:I-1 Schedule of Serial Bonds 153I-2 Schedule of Obligations Under Capital Leases 155I-3 Debt Service Fund Budgetary Comparison Schedule 156

Financial Trends:J-1 Net Position by Component 161J-2 Changes in Net Position 162J-3 Fund Balances - Governmental Funds 164J-4 Changes in Fund Balance - Governmental Funds 165J-5 Other Local Revenue by Source - General Fund 167
Revenue Capacity:J-6 Assessed Value & Estimated Actual Value of Taxable Property 171J-7 Direct & Overlapping Property Tax Rates 172J-8 Principal Property Taxpayers 173J-9 Property Tax Levies & Collections 174
Debt Capacity:J-10 Ratios of Outstanding Debt by Type 177J-11 Ratios of General Bonded Debt Outstanding 178J-12 Direct & Overlapping Governmental Activities Debt 179J-13 Legal Debt Margin Information 180
Demographic & Economic Information:J-14 Demographic & Economic Statistics 183J-15 Principal Employers 184
Operating Information:J-16 Full-Time Equivalent District Employees by Function/Program 187J-17 Operating Statistics 188J-18 School Building Information 189J-19 Schedule of Required Maintenance 190J-20 Insurance Schedule 191
K-1 Independent Auditor's Report on Internal Control Over Financial Reporting and on Compliance and Other Matters Based on an Audit of Financial Statements Performed in Accordance with Government Auditing Standards 195
K-2 Independent Auditor's Report on Compliance for Each Major Program And Report on Internal Control Over Compliance Required by the Uniform Guidance and New Jersey OMB Circular 15-08 197
K-3 Schedule of Expenditures of Federal Awards, Schedule A 201K-4 Schedule of Expenditures of State Financial Assistance, Schedule B 202K-5 Notes to Schedules of Awards and Financial Assistance 203K-6 Schedule of Findings & Questioned Costs 205K-7 Summary Schedule of Prior Audit Findings 208
SINGLE AUDIT SECTION
STATISTICAL SECTION (unaudited)

restricted and unrestricted net assets are available and have determined that net assets were properly recognized under the policy.
42) We acknowledge our responsibility for the required supplementary information (RSI). The RSI is measured and presented within prescribed guidelines and the methods of measurement and presentation have not changed from those used in the prior period. We have disclosed to you any significant assumptions and interpretations underlying the measurement and presentation of the RSI.
Signature: Signature:
Title: Title:
RESERVED FOR MD&A LETTER
INTRODUCTORY SECTION

This page intentionally left blank.

UPPER FREEHOLD REGIONAL SCHOOL DISTRICT _____________________________________________________________
27 High Street • Allentown, New Jersey 08501 • central office: 609-259-7292 • fax: 609-259-0881
October 28, 2016
The Honorable President and Members of the Board of Education Upper Freehold Regional School District County of Monmouth, New Jersey
Dear Board Members:
The Comprehensive Annual Financial Report (CAFR) of the Upper Freehold Regional School District (the "District") for the fiscal year ended June 30, 2016, is hereby submitted. Responsibility for both the accuracy of the data and completeness and fairness of the presentation, including all disclosures, rests with the management of the Board of Education (the "Board"). To the best of our knowledge and belief, the data presented in this report is accurate in all material respects and is reported in a manner designed to present fairly the financial position and results of operations of the various funds and account groups of the
District. All disclosures necessary to enable the reader to gain an understanding of the District's financial activities have been included.
The comprehensive annual financial report is presented in four sections: introductory, financial, statistical and single audit. The introductory section includes this transmittal letter, the District's organizational chart and a list of principal officials. The financial section includes the basic financial statements and schedules, as well as the auditor's report thereon. The statistical section includes selected financial and demographic information, generally presented on a multi-year basis. The District is required to undergo an annual single audit in conformity with the provisions of Title 2 U.S. Code of Federal Regulations Part 200, Uniform Administrative Requirements, Cost Principles, and Audit Requirements for Federal Awards (Uniform Guidance) and New Jersey OMB’s Circular 15-08, Single Audit Policy for Recipients of Federal Grants, State Grants and State Aid. Information related to this single audit, including the auditor's report on the internal control structure and compliance with applicable laws and regulations and findings and recommendation, are included in the single audit section of this report.
1) REPORTING ENTITY AND ITS SERVICES: The Upper Freehold Regional School District is an independent reporting entity within the criteria adopted by the Governmental Accounting Standards Board (GASB) as established by GASB 23 and GASB 34. All funds and account groups of the District are included in this report. The Upper Freehold Regional School District and all its schools constitute the District's reporting entity.
The District continues to maintain a high quality of education. The Upper Freehold Regional School District is a comprehensive educational organization that provides a full range of programs and services appropriate to grades pre-K through 12. These programs and services include regular, vocational as well as special education services for youngsters with a range of disabilities. The District completed the 2015-2016 school year with an enrollment of 2,296 students, compared to 2,331 students as of June 30, 2015. Enrollment is defined as students on roll and students placed out of District.
RICHARD M. FITZPATRICK, ED.D. Superintendent of Schools
MARK G. GUTERL, MA Assistant Superintendent for Curriculum and Instruction
MARGARET HOM, M.S.B.A. Business Administrator
Board Secretary
PATRICK LEARY, MA, M.Ed. Director of Special Services
MICHAEL B. DEAN, MS Information and Technology Service
Manager
1

Changes in the student average daily enrollment of the District over the last five fiscal years were as follows:
In an effort to promote communication, the District continues to utilize its website as a source of information on a school and District-wide level. The District uses the Alert Now notices sent to the parent community by Dr. Fitzpatrick and attachments, as well as using the parent portal to enable parents and teachers to stay connected with information regarding student attendance, homework, grades, curriculum, and special projects. Information about the budget is communicated through the district’s website and in local presentations throughout the community during the budget review process. The District also produces a calendar with information about all aspects of school life - support services, special events, and closing information. This calendar is available on the District web page and School web pages.
Student Learning Standards
Our District is in line with the New Jersey Student Learning Standards (SLS). The District has an active 5-year curriculum review and revision process to ensure alignment with the New Jersey Core Curriculum Content Standards. The Assistant Superintendent facilitates this process for Curriculum and Instruction along with the members of the District’s Curriculum Council. All curricula and courses of study are approved by the Board of Education and annually adopted at the Reorganizational meeting of the Board.
Staff Development
The Upper Freehold Regional School District provides its teaching staff with multiple opportunities for professional development that support the District’s goals for staff development and the improvement of instruction.
The District provides extensive in-service programs for staff. Staff members are permitted and encouraged to attend workshops outside the District in addition to the in-house programs which are provided. A generous college course reimbursement program both for professional staff and for support staff is funded within the school budget.
Technology
District-wide technology is used to increase productivity, enhance communication, and to enrich curriculum and instruction. It is also used to document the full K-12 curriculum in the form of Curriculum Maps. The District uses a parent alert and notification service which enables the Superintendent to alert all parents via e-mail and phone messages regarding emergency school closings or critical information that must be communicated in a quick efficient manner.
Average Daily EnrollmentFiscal Year Student Enrollment Percent Change
2015-2016 2,296 -1.5% 2014-2015 2,331 -0.2% 2013-2014 2,336 -1.6%2012-2013 2,373 0.8%2011-2012 2,355 1.0%
2

2) ECONOMIC CONDITION AND OUTLOOK: The Upper Freehold Regional School District is comprised of the Borough of Allentown and Upper Freehold Township.
The District has shown a minimal decline in enrollment over the past three (3) years. The District has continued to maintain programs and opportunities for its students despite the need to cut $1.1 million dollars last year to be fully compliant with the 2% CAP restrictions. Despite these economic obstacles the District is committed to its curriculum. The District worked with our demographer to attempt to forecast future growth in the Township. That study showed that our enrollment is stable and we will not see enrollment increasing at the rate in 2011-2012 and 2012-2013. Concerns about over-crowding have been eased with the opening of the Stonebridge Middle School in 2010. The Board has agreed to honor the State of New Jersey option of a 2% tax levy cap, as noted above, which eliminates, as noted above, the requirement for a vote of the Upper Freehold and Allentown communities to approve the proposed budget.
3) MAJOR INITIATIVES: The District continues to develop and implement annual board goals, which are drawn from their 2013-2018 Strategic Plan. The following are the major goals and initiatives of the District as we move forward:
Expand the availability of laptop Chromebooks so that by 2017-2018 all children in Grades 5 – 12 have a personal work station. Newell Elementary School students participated in the National Hour of Code using their programming skills to create computer generated games. Newell Elementary School students participated in Scholastics Summer Reading Challenge and placed 1st in New Jersey and 6th in the world. Newell Elementary School implemented Tools of the Mind curriculum on all of our PreK classes. Newell Elementary School had a goggle initiative for all staff. Newell Elementary School is preparing for the Implementation of Next Generation Science Standards – Committee, writing curriculum. Newell Elementary School participated in Read Across America Day with Author Henry Cole. Reduce class size in all sections Pre-K - 12 to conform to Board of Education Policy 2312. Enhance and support differentiated instruction at all grade levels and with all building administrators. Offer critical number of electives and exploratories at the middle school level to expand options for learning and to offer depth to the curriculum. Expand the K-12 G&T program offerings and the identification of qualified students interested in challenging themselves academically. Recommend enhancements in the Health/PE program that will ensure compliance with state standards and mandates and that promote a lifetime focus on wellness. Monitor the percentage of students successfully completing higher-level math courses at the middle and high school levels. Raise the level of performance in reading and writing for all students, Pre-K-12. Enhance support for students with individualized education plans. We have trained about 25 teachers over the past two years in Orton Gillingham to address dyslexia and other struggling readers. Maximize the introduction of technology using Google Applications for Education. Enhance student achievement in all subjects through the use of curriculum-driven technology, including smart boards, wikis, blogging software simulations and our Chormebook one to one computer initiative. Address the full range of needs identified in the Upper Freehold Regional School District 2013-2018 Strategic Plan.Expand the range of co-curricular, extra-curricular, and student activities for all students in grades Pre K-12.
3

Provide students, teachers, and staff with a healthy and safe school environment. Develop a staffing plan that aligns staffing needs with student enrollment, new course development, and the expansion of programs options in all schools. Continue to expand the existing plan for effective communication with parents and community. Identify community needs and opportunities for students and families served by the Upper Freehold Regional School District. Create service learning projects for all grade levels and school organizations. Expand the number of AP Courses offered at Allentown High School. Continue to promote participation in the Allentown High School CHOICE Academies by resident and CHOICE students. Continue to expand use of volunteers from the community. Promote greater understanding related to our commitment to promoting diversity. Continue to facilitate full implementation of anti-bullying program throughout the district. Enhance articulation and communication about learning goals and promote curriculum connections with the Millstone School District. Work together as colleagues to examine data as the basis for making decisions about curriculum, instructional materials, and teaching techniques. Encourage elementary/middle school PTA to continue to offer numerous school activities, including educational assemblies, book fairs, family nights, as well as content based activities in the sciences, social studies, and humanities. Promote community members and school staff working together to advance excellence in the instruction of talented youth. Use Math and Writing Labs at the high school to reinforce writing and math skills. Provide training for teachers to infuse information literacy and career awareness into the curriculum. Promote Character Education Programs that develop Cooperation, Assertiveness, Respect/Responsibility and traits that build Empathy, and Self-Control. Support the Upper Freehold Regional School District Comprehensive Five-Year Technology Plan to include the expansion of a platform to supports the website, enables online course presentation, and maximizes the integration of Smart Board technology in all classrooms. Offer special education inclusion services throughout the district. Expand TV production electives at AHS taught by a highly trained instructor. Use curriculum maps for all areas of study. K-12 are in place and are revised on an ongoing basis. Continue to support the Child Watch program to offer an extended program for child care. Congratulate the AHS Student Council named first in the state for contributing to the State Student Council Charity. Support the Redbird Robotics team for their success in regional competitions.
4) INTERNAL ACCOUNTING CONTROLS: Management of the District is responsible for establishing and maintaining an internal control system designed to ensure that the assets of the District are protected from loss, theft or misuse and to ensure that adequate accounting data are compiled to allow for the preparation of financial statements in conformity with generally accepted accounting principles (GAAP). The internal control system is designed to provide reasonable, but not absolute, assurance that these objectives are met. The concept of reasonable assurance recognizes that: (1) the cost of a control should not exceed the benefits likely to be derived; and (2) the valuation of costs and benefits requires estimates and judgments by management.
As a recipient of federal and state awards, the District also is responsible for ensuring that an adequate internal control system is in place to ensure compliance with applicable laws and regulations related to those programs. This internal control system is also subject to periodic evaluation by the District's management.
4

As part of the District's single audit described earlier, tests are made to determine the adequacy of the internal control, including that portion related to major federal and state award programs, as well as to determine that the District has complied with applicable laws, regulations, contracts and grants.
5) BUDGETARY CONTROLS: In addition to internal accounting controls, the District maintains budgetary controls. The objective of these budgetary controls is to ensure compliance with legal provisions embodied in the annual appropriated budget approved by the voters of the municipality. Annual appropriated budgets are adopted for the general fund, the special revenue fund and the debt service fund. Project length budgets are approved for the capital improvements accounted for in the capital projects fund. The final budget amount as amended for the fiscal year is reflected in the financial section.
An encumbrance accounting system is used to record outstanding purchase commitments on a line item basis. Open encumbrances at year-end are either canceled or are included as reappropriations of fund balance in the subsequent year. Those amounts to be reappropriated are reported as reservations of fund balance at June 30, 2016.
6) ACCOUNTING SYSTEM AND REPORTS: The District's accounting records reflect generally accepted accounting principles, as promulgated by the GASB. The accounting system of the District is organized on the basis of funds. These funds are explained in "Notes to the Basic Financial Statements", Note 1.
7) DEBT ADMINISTRATION: The District retired $1,960,000 in bond principal. At June 30, 2016, the District had $49,410,000 of outstanding bonds payable. Detail regarding the District’s outstanding bond issues is on Exhibit I-1.
8) CASH MANAGEMENT: The investment policy of the District is guided in large part by state statute as detailed in "Notes to the Basic Financial Statements", Note 2. The District has adopted a cash management plan which requires it to deposit public funds in public depositories protected from loss under the provisions of the Governmental Unit Deposit Protection Act ("GUDPA"). GUDPA was enacted in 1970 to protect governmental units from a loss of funds on deposit with a failed banking institution in New Jersey. The law requires governmental units to deposit public funds only in public depositories located in New Jersey, where the funds are secured in accordance with the Act.
9) RISK MANAGEMENT: The Board carries various forms of insurance, including, but not limited to, general liability, excess liability, automobile liability and comprehensive/collision, hazard and theft insurance on property and contents, and fidelity bonds. A schedule of insurance coverage is found on Exhibit J-20.
The District is a member of the School Alliance Insurance Fund (the "Fund"). The Fund is a risk-sharing public entity risk pool that is both an insured and self-administered group of school districts established for the purpose of providing low-cost insurance coverage to its members. Additional information on the Fund is included in Note 11 to the Basic Financial Statements.
10) OTHER INFORMATION: Independent Audit - State statutes require an annual audit by independent certified public accountants or registered municipal accountants. The accounting firm of Holman Frenia Allison,P.C., was selected by the Board. In addition to meeting the requirements set forth in state statutes, the audit also was designed to meet the requirements of Title 2 U.S. Code of Federal Regulations Part 200, Uniform Administrative Requirements, Cost Principles, and Audit Requirements for Federal Awards (Uniform Guidance) and New Jersey OMB’s Circular 15-08, Single Audit Policy for Recipients of Federal Grants, State Grants and State Aid. The auditor's report on the basic financial statements and combining and individual fund statements and schedules is included in the financial section of this report. The auditor's reports related specifically to the single audit are included in the single audit section of this report.
5

6

7

MEMBERS OF THE BOARD OF EDUCATION
Patricia Hogan, President 2016
Richard Smith, Vice President 2018
Douglas Anthony 2016
Howard Krieger 2018
Tia McLaughlin 2016
Billy Hanson 2017
Patrick Nolan 2017
Timothy Stolzenberger 2017
Kurt Wayton 2017
Michele Anthony 2018
OTHER OFFICIALS
Richard M. Fitzpatrick, ED.D., Superintendent of Schools
Margaret Hom, MSBA, School Business Administrator/Board Secretary
Cherie L. Adams, Esq., Board Attorney
UPPER FREEHOLD REGIONAL SCHOOL DISTRICTALLENTOWN, NEW JERSEY
ROSTER OF OFFICIALS
JUNE 30, 2016
TERM EXPIRES
8

1037 Raymond Boulevard, Suite 900
UPPER FREEHOLD COUNTY REGIONAL SCHOOL DISTRICTALLENTOWN, NEW JERSEY
CONSULTANTS AND ADVISORS
AUDIT FIRM
Rodney R. Haines, CPA, PSA, RMAHolman Frenia Allison, P. C.
680 Hooper Ave, Bldg B, Suite 201Toms River, New Jersey 08753
ATTORNEY
Adams Gutierrez & Lattiboudere, LLCThe Legal Center
Newark, New Jersey 07102
OFFICIAL DEPOSITORY
TD Bank1701 Route 70 East
Cherry Hill, NJ 08003
9

restricted and unrestricted net assets are available and have determined that net assets were properly recognized under the policy.
42) We acknowledge our responsibility for the required supplementary information (RSI). The RSI is measured and presented within prescribed guidelines and the methods of measurement and presentation have not changed from those used in the prior period. We have disclosed to you any significant assumptions and interpretations underlying the measurement and presentation of the RSI.
Signature: Signature:
Title: Title:
RESERVED FOR MD&A LETTER
10

FINANCIAL SECTION
11

This page intentionally left blank.
12

INDEPENDENT AUDITOR’S REPORT
Honorable President and Members of the Board of EducationUpper Freehold Regional School DistrictCounty of MonmouthAllentown, New Jersey 08501
Report on the Financial Statements
We have audited the accompanying financial statements of the governmental activities, the business-type activities, each major fund and the aggregate remaining fund information of the Upper Freehold Regional School District, County of Monmouth, State of New Jersey, as of and for the fiscal year ended June 30, 2016, and the related notes to the financial statements, which collectively comprise the District’s basic financial statements as listed in the table of contents.
Management’s Responsibility for the Financial Statements
Management is responsible for the preparation and fair presentation of these financial statements in accordance with accounting principles generally accepted in the United States of America; this includes the design, implementation, and maintenance of internal control relevant to the preparation and fair presentation of financial statements that are free from material misstatement, whether due to fraud or error.
Auditor’s Responsibility
Our responsibility is to express opinions on these financial statements based on our audit. We conducted our audit in accordance with auditing standards generally accepted in the United States of America; the standards applicable to financial audits contained in Governmental Auditing Standards, issued by the Comptroller General of the United States; and audit requirements as prescribed by the Office of SchoolFinance, Department of Education, State of New Jersey. Those standards require that we plan andperform the audit to obtain reasonable assurance about whether the financial statements are free from material misstatement.
An audit involves performing procedures to obtain audit evidence about the amounts and disclosures in the financial statements. The procedures selected depend on the auditor’s judgment, including the assessment of the risks of material misstatement of the financial statements, whether due to fraud or error. In making those risk assessments, the auditor considers internal control relevant to the District’s preparation and fair presentation of the financial statements in order to design audit procedures that are appropriate in the circumstances, but not for the purpose of expressing an opinion on the effectiveness of the District’s internal control. Accordingly, we express no such opinion. An audit also includes evaluating the appropriateness of accounting policies used and the reasonableness of significant accounting estimates made by management, as well as evaluating the overall presentation of the financial statements.
13
Holman | FreniaAllison, P.C.
HFCertified Public Accountants & Consultants
680 Hooper Avenue, Bldg B, Suite 201, Toms River, NJ 08753 • Tel: 732.797.1333618 Stokes Road, Medford, NJ 08055 • Tel: 609.953.0612
912 Highway 33, Suite 2, Freehold, NJ 07728 • Tel: 732.409.08006 E. Park Street, P.O. Box 614, Bordentown, NJ 08505 • Tel: 609.298.8639
795 Canton Street, Troy, PA 16947 • Tel: 570.297.5090926 Main Street, Suite 103, Rome, PA 18837 • Tel: 570.297.5090
www.hfacpas.com

We believe that the audit evidence we have obtained is sufficient and appropriate to provide a basis for our audit opinions.
Opinions
In our opinion, the financial statements referred to above present fairly, in all material respects, the respective financial position of the governmental activities, the business-type activities, each major fund and the aggregate remaining fund information of the Upper Freehold Regional School District, County of Monmouth, State of New Jersey, as of June 30, 2016, and the respective changes in financial position and, where applicable, cash flows thereof for the year then ended in accordance with accounting principles generally accepted in the United States of America.
Other Matters
Required Supplementary Information
Accounting principles generally accepted in the United States of America require that the management’s discussion and analysis, budgetary comparison information, and the schedules related to accounting and reporting for pensions, as listed in the table of contents be presented to supplement the basic financial statements. Such information, although not a part of the basic financial statements, is required by the Governmental Accounting Standards Board who considers it to be an essential part of financial reporting for placing the basic financial statements in an appropriate operational, economic, or historical context. We have applied certain limited procedures to the required supplementary information in accordance with auditing standards generally accepted in the United States of America, which consisted of inquiries of management about the methods of preparing the information and comparing the information for consistency with management’s responses to our inquiries, the basic financial statements, and other knowledge we obtained during our audit of the basic financial statements. We do not express an opinion or provide any assurance on the information because the limited procedures do not provide us with sufficient evidence to express an opinion or provide any assurance.
Other Information
Our audit was conducted for the purpose of forming opinions on the financial statements that collectively comprise the Upper Freehold Regional School District’s basic financial statements. The introductory section, combining statements and related major fund supporting statements and schedules, and statistical section are presented for purposes of additional analysis, as required by the Division of Administration and Finance, Department of Education, State of New Jersey, and are not a required part of the basic financial statements. The accompanying Schedule of Expenditures of Federal Awards and State Financial Assistance are presented for purposes of additional analysis as required by U.S. Office of Management and Budget Uniform Administrative Requirements, Cost Principles, and Audit Requirements for Federal Awards, Audits of States, Local Governments, and Non-Profit Organizationsand New Jersey OMB’s Circular 15-08, Single Audit Policy for Recipients of Federal Grants, State Grants and State Aid respectively, and are also not a required part of the basic financial statements.
The accompanying combining statements and the Schedule of Expenditures of Federal Awards and State Financial Assistance are the responsibility of management and were derived from and relates directly to the underlying accounting and other records used to prepare the basic financial statements. Such information has been subjected to the auditing procedures applied in the audit of the basic financial statements and certain additional procedures, including comparing and reconciling such information directly to the underlying accounting other records used to prepare the basic financial statements or to the basic financial statements themselves, and other additional procedures in accordance with auditing standards generally accepted in the United States of America. In our opinion, the accompanying
14

combining statements and Schedule of Expenditures of Federal Awards and State Financial Assistance are fairly stated, in all material respects, in relation to the basic financial statements as a whole.
The introductory section and statistical section listed in the table of contents have not been subjected to the auditing procedures applied in the audit of the basic financial statements and, accordingly, we do not express an opinion or provide any assurance on them.
Other Reporting Required by Government Auditing Standards
In accordance with Government Auditing Standards, we have also issued our report dated October 28, 2016 on our consideration of the Upper Freehold Regional School District’s internal control over financial reporting and on our tests of its compliance with certain provisions of laws, regulations, contracts, and grant agreements and other matters. The purpose of that report is to describe the scope of our testing of internal control over financial reporting and compliance and the results of that testing, and not to provide an opinion on internal control over financial reporting or on compliance. That report is an integral part of an audit performed in accordance with Government Auditing Standards in considering Upper Freehold Regional School District’s internal control over financial reporting and compliance.
Respectfully Submitted,
HOLMAN FRENIA ALLISON, P.C.
Rodney R. HainesCertified Public AccountantPublic School Accountant, No. 2198
Toms River, New JerseyOctober 28, 2016
15

restricted and unrestricted net assets are available and have determined that net assets were properly recognized under the policy.
42) We acknowledge our responsibility for the required supplementary information (RSI). The RSI is measured and presented within prescribed guidelines and the methods of measurement and presentation have not changed from those used in the prior period. We have disclosed to you any significant assumptions and interpretations underlying the measurement and presentation of the RSI.
Signature: Signature:
Title: Title:
RESERVED FOR MD&A LETTER
16

REQUIRED SUPPLEMENTARY INFORMATION - PART I
Management's Discussion and Analysis
17

This page intentionally left blank.
18

UPPER FREEHOLD REGIONAL SCHOOL DISTRICT
Management’s Discussion and Analysis For the Fiscal Year Ended June 30, 2016
UNAUDITED
This section of Upper Freehold Regional School District’s annual financial report presents its discussion and analysis of the District’s financial performance during the fiscal year ended June 30, 2016. Please read it in conjunction with the transmittal letter at the front of this report and the District’s basic financial statements, which immediately follow this section.
The Management’s Discussion and Analysis (MD&A) is an element of Required Supplementary Information specified in the Governmental Accounting Standard Board’s (GASB) Statement No. 34 - Basic Financial Statements- and Management’s Discussion and Analysis for State and Local Governments issued in June 1999. Certain comparative information between the current year (2015-2016) and the prior year (2014-2015) is required to be presented in the MD&A.
Financial Highlights
Key financial highlights for the 2015-2016 fiscal year include the following:
General revenues accounted for $30,889,899 of all revenues. Specific revenues in the form of charges for services, operating grants & contributions accounted for $18,883,002 to total revenues of $ 49,772,901.
The school district had $49,947,519 in expenses; $18,883,002 of these expenses were offset by program specific charges for services, grants or contributions.
Total Net Position of governmental activities were $3,876,263. Net Position decreased by $176,862 from July 1, 2015 to June 30, 2016.
The General Fund fund balance at June 30, 2016 is $2,131,952, an increase of $58,514 when compared with the beginning balance at July 1, 2015 of $2,073,438. . .
Using this Comprehensive Annual Financial Report (CAFR)
This annual report consists of a series of financial statements and notes to those statements. These statements are organized so that the reader can understand the Upper Freehold Regional School District as a financial whole, an entire operating entity. The statements then provide an increasingly detailed look at specific financial activities.
The financial section of the annual report consists of four parts – Independent Auditor’s Report, required supplementary information which includes the management’s discussion and analysis (this section), the basic financial statements, and supplemental information. The basic financial
19

statements include two kinds of statements that present different views of the Upper FreeholdRegional School District.
The first two statements are district-wide financial statements that provide both short-term and long-term information about the District’s overall financial status.
The remaining statements are fund financial statements that focus on individual parts of the District, reporting the Upper Freehold Regional School District’s operation in more detail than the District-wide statements.
The governmental funds statements tell how basic services such as regular and special education were financed in short term as well as what remains for future spending.
Proprietary fund statements offer short-term and long-term financial information about the activities that the Upper Freehold Regional School District operates like businesses.
Fiduciary fund statements provide information about the financial relationships in which the District acts solely as a trustee or agent for the benefit of others to whom the resources belong.
The Statement of Net Assets and Statement of Activities provide information about the activities of the whole School District, presenting both an aggregate view of the School District’s finances and a longer-term view of those finances. Fund financial statements provide the next level of detail. For governmental funds, these statements tell how services were financed in the short-term as well as what remains for future spending. In the case of Upper Freehold Regional School District, the General Fund is by far the most significant fund.
The financial statements also include notes that explain some of the information in the statements and provide more detailed data. Figure A-1 summarizes the major features of the Upper Freehold Regional School District financial statements, including the portion of the District activities they cover and the types of information they contain. The remainder of this overview section of management’s discussion and analysis highlights the structure and contents of each of the statements.
Figure A-1 Major Features of the District-Wide and Fund Financial StatementsDistrict-wide Fund Financial StatementsStatements Governmental Funds Proprietary Funds
Scope Entire district (except fiduciary funds)
The activities of the district that are not proprietary or fiduciary, such as specialeducation and building maintenance
Activities the district operates similar to private businesses:Food service fund;Kindergarten Complement program
Required financial statements
Statement of Net Assets
Balance sheet Statement of Net Position
20

Statement of Activities Statement of revenue, expenditures and changes in fund balance
Statement of revenue, expenses and changes in fund Net PositionStatement of cash flows
Accounting Basis and measurement focus
Accrual accounting and economic resources focus
Modified accrual accounting and current financial focus
Accrual account and economic resources focus
Type of asset/liability information
All assets and liabilities, both financial and capital, short-term and long-term
Generally assets excepted to be used up and liabilities that come due during the year or soon thereafter; no capital assets or long-term liabilities included
All assets and liabilities, both financial and capital, and short-term and long-term
Type of inflow/out flow information
All revenues and expenses during year, regardless of when cash is received or paid
Revenues for which cash is received during or soon after the end of the year; expenditures when goods or services have been received and the related liability is due and payable
All revenues and expenses during the year, regardless of when cash is received or paid.
District Wide Statements
The District-wide statements report information about the District as a whole using accounting methods similar to those used by private-sector companies. This basis of accounting takes into account, all of the current year’s revenues and expenses regardless of when cash is received or paid. The Statement of Net Position includes all of the District’s assets and liabilities. All of the current year’s revenues and expenses are accounted for in the Statement of Activities regardless of when cash is received or paid.
The District-wide statements report the School District’s Net Assets and how they have changed. Net Assets – the difference between the District’s assets and liabilities, is one way to measure the District’s financial health or position. Over time, increases or decreases in the District’s Net Assets are an indicator of whether its financial position is improving or deteriorating, respectively. The causes of this change may be the result of many factors, some financial and some not. Non-financial factors include the School District’s property tax base, current laws in New Jersey restricting revenue growth, facility condition, required educational programs and other factors.
In the Statement of Net Assets and the Statement of Activities, the School District is divided into two distinct kinds of activities:
Governmental activities – All of the School District’s programs and services are reported here including, but not limited to, instruction, support services, operation and maintenance of plant facilities, pupil transportation, extracurricular activities, and administration. Aids from the State of New Jersey and from the Federal government along with local Property taxes finances most of these activities.
21
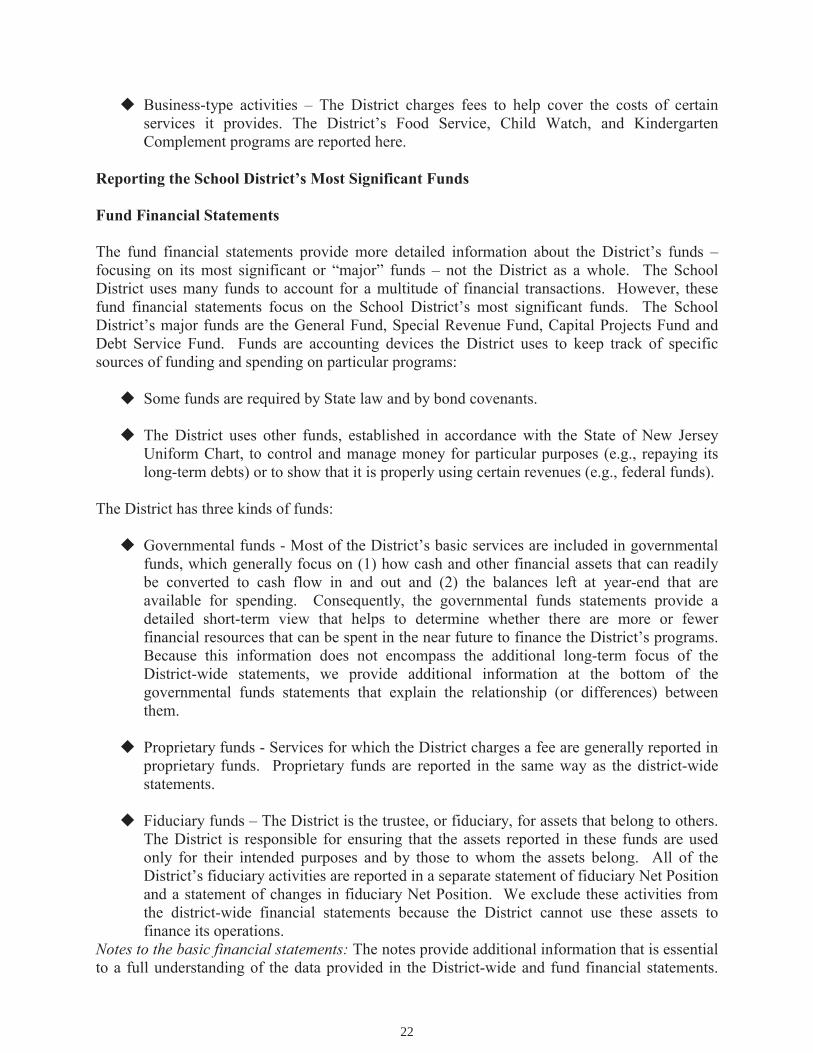
Business-type activities – The District charges fees to help cover the costs of certain services it provides. The District’s Food Service, Child Watch, and Kindergarten Complement programs are reported here.
Reporting the School District’s Most Significant Funds
Fund Financial Statements
The fund financial statements provide more detailed information about the District’s funds –focusing on its most significant or “major” funds – not the District as a whole. The School District uses many funds to account for a multitude of financial transactions. However, these fund financial statements focus on the School District’s most significant funds. The School District’s major funds are the General Fund, Special Revenue Fund, Capital Projects Fund and Debt Service Fund. Funds are accounting devices the District uses to keep track of specific sources of funding and spending on particular programs:
Some funds are required by State law and by bond covenants.
The District uses other funds, established in accordance with the State of New Jersey Uniform Chart, to control and manage money for particular purposes (e.g., repaying its long-term debts) or to show that it is properly using certain revenues (e.g., federal funds).
The District has three kinds of funds:
Governmental funds - Most of the District’s basic services are included in governmental funds, which generally focus on (1) how cash and other financial assets that can readily be converted to cash flow in and out and (2) the balances left at year-end that are available for spending. Consequently, the governmental funds statements provide a detailed short-term view that helps to determine whether there are more or fewer financial resources that can be spent in the near future to finance the District’s programs. Because this information does not encompass the additional long-term focus of the District-wide statements, we provide additional information at the bottom of the governmental funds statements that explain the relationship (or differences) between them.
Proprietary funds - Services for which the District charges a fee are generally reported in proprietary funds. Proprietary funds are reported in the same way as the district-wide statements.
Fiduciary funds – The District is the trustee, or fiduciary, for assets that belong to others. The District is responsible for ensuring that the assets reported in these funds are used only for their intended purposes and by those to whom the assets belong. All of the District’s fiduciary activities are reported in a separate statement of fiduciary Net Positionand a statement of changes in fiduciary Net Position. We exclude these activities from the district-wide financial statements because the District cannot use these assets to finance its operations.
Notes to the basic financial statements: The notes provide additional information that is essential to a full understanding of the data provided in the District-wide and fund financial statements.
22
The notes to the basic financial statements can be found immediately following the fund financial statements.
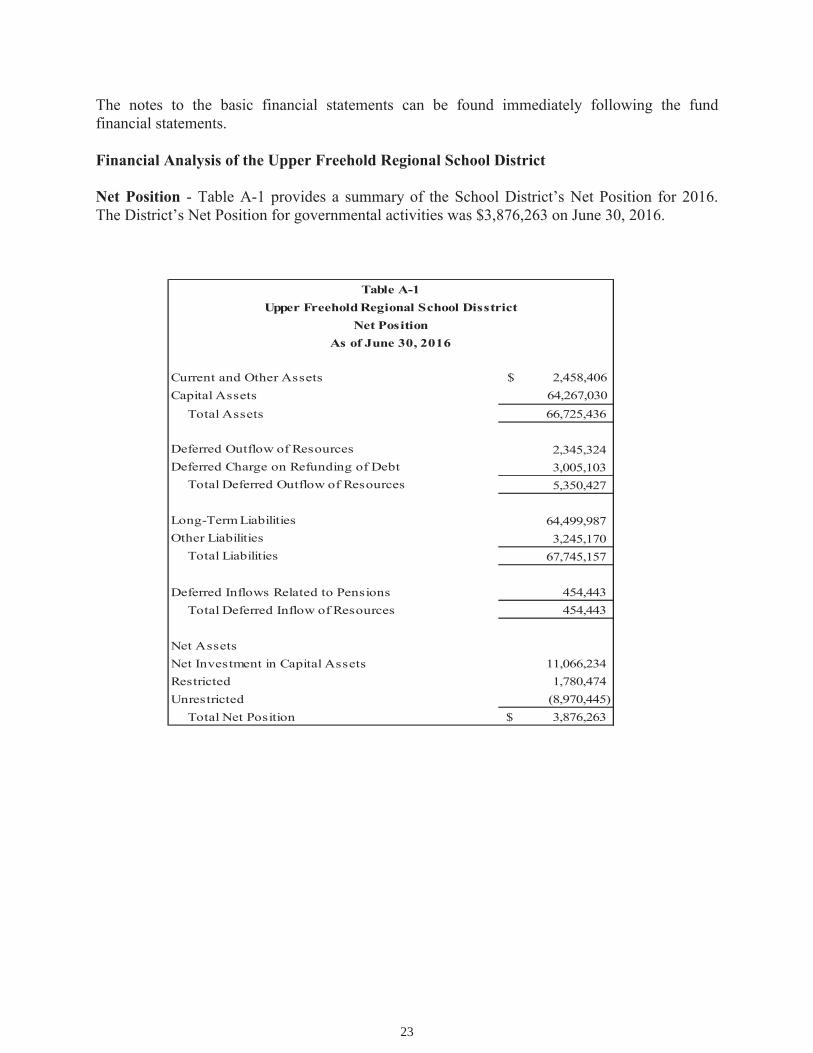
Financial Analysis of the Upper Freehold Regional School District
Net Position - Table A-1 provides a summary of the School District’s Net Position for 2016. The District’s Net Position for governmental activities was $3,876,263 on June 30, 2016.
Current and Other Assets $ 2,458,406 Capital Assets 64,267,030 Total Assets 66,725,436
Deferred Outflow of Resources 2,345,324 Deferred Charge on Refunding of Debt 3,005,103 Total Deferred Outflow of Resources 5,350,427
Long-Term Liabilities 64,499,987 Other Liabilities 3,245,170 Total Liabilities 67,745,157
Deferred Inflows Related to Pensions 454,443 Total Deferred Inflow of Resources 454,443
Net AssetsNet Investment in Capital Assets 11,066,234 Restricted 1,780,474 Unrestricted (8,970,445) Total Net Position 3,876,263$
Table A-1 Upper Freehold Regional School Disstrict
Net PositionAs of June 30, 2016
23

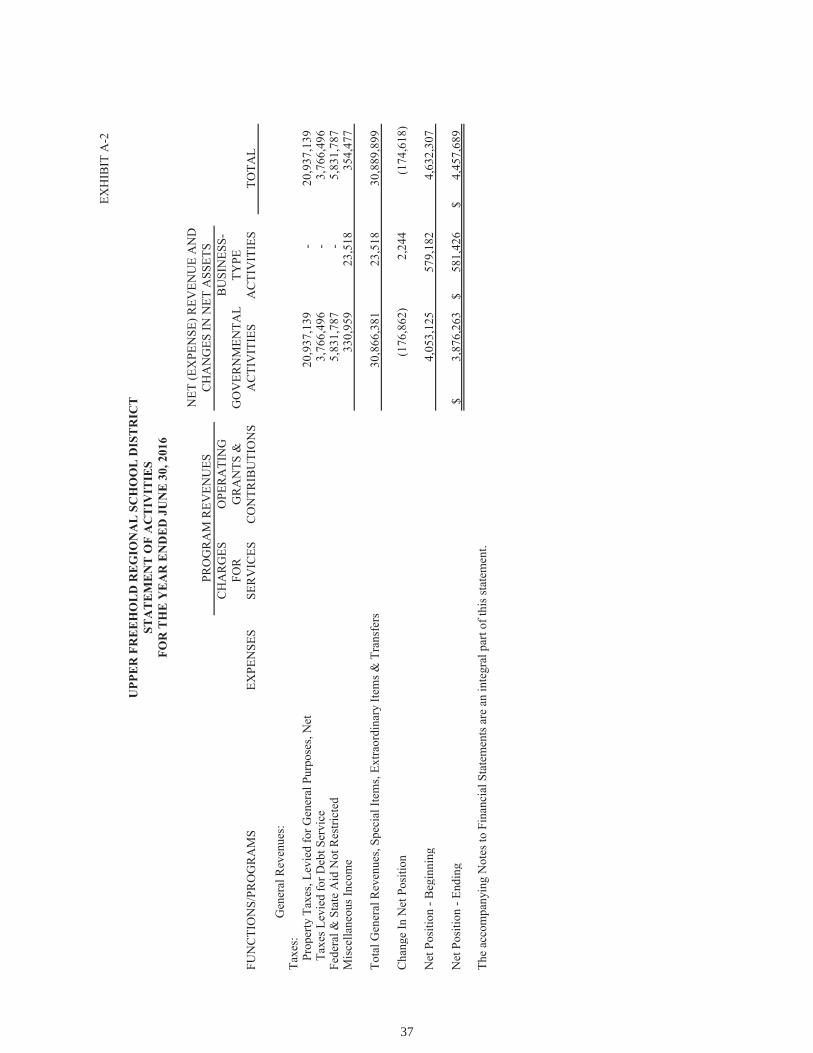
Changes in Net Assets - Table A-2 shows the changes in Net Position from fiscal year 2015 to fiscal year 2016.
Revenues June 30, 2016Program revenues
Charges for services 8,449,419$ Operating grants and contributions 9,389,354
General revenuesProperty taxes 24,703,635 State and Federal Aid 5,831,787 Other charges 330,959
Total revenues 48,705,154$
Expenses Governmental Activities: Instruction: Regular 11,072,993$ Special Education 4,063,510 Other Special Instruction 300,184 Other Instruction 657,355 Support Services: Tuition 967,648 Attendance & Social Work Services 76,783 Health Services 277,086 Student & Instruction Related Services 3,576,920 Educational Media Services/School Library 573,133 Instruction Staff Training 59,412 School Administrative Services 1,350,947 Central Services 425,397 Administrative Information Technology 104,202 Other Administrative Services 498,276 Plant Operations and Maintenance 2,593,238 Pupil Transportation 1,925,126 Unallocated Benefits & Depreciation 15,842,812 Interest and Cost on Long-Term Debt 2,090,121 Unallocated Depreciation 2,170,480 Unallocated Adjustment to Capital Assets 256,393
Total Governmental Activities 48,882,016
Net Increase (Decrease) in Net Position (176,862)$
Table A-2Upper Freehold Regional School District
Change in Governmental Net AssetsFor the year ended June 30, 2016
24

Governmental Activities
The unique nature of property taxes in New Jersey creates legal requirements to annually seek voter approval for the School District operations prior to 2016. Per legislation enacted in 2012, the Board Of Education approved the move of the school election to November. This eliminated the requirement for voter approval on the budget if the proposed tax levy increase does not exceed 2%. The District’s total revenues were $48,705,154. Property taxes made up 50.71% of revenues for governmental activities for the Upper Freehold Regional School District for fiscal year 2016. Federal, state and local grants accounted for another 11.97% of revenue, and Miscellaneous revenue was 0.68%. The total cost of all programs and services was $48,882,016.Instruction not including allocated benefits comprises 33% of District expenses.
Total expenses exceeded revenues, decreasing Net Position by $176,862 from the beginning balance at July 1, 2015.
Instruction expenses include activities directly dealing with the teaching of pupils and the interaction between teacher and student, including extracurricular activities. Pupils and instructional staff include the activities involved with assisting staff with the content and process of teaching to students, including curriculum and staff development. General and business administrative services include expenses associated with the administrative and financial supervision of the District. Operation and maintenance of facilities activities involve keeping the school grounds, buildings and equipment in an effective working condition.
Curriculum and staff development includes expenses related to planning, research, development and evaluation of support services, as well as the reporting of this information internally and to the public.
Pupil transportation includes activities involved with the conveyance of students to and from school, as well as to and from school activities, as provided by state law.
Extracurricular activities includes expenses related to student activities provided by the School District which are designed to provide opportunities for students to participate in school events, public events or a combination of these for the purposes of motivation, enjoyment and skill improvement.
Interest and fiscal charges involve the transactions associated with the payment of interest and other related charges to debt of the School District. Other includes unallocated depreciation and amortization.
Business-Type Activities
Revenue for the District’s business-like activities (food service program) were comprised of changes for services and federal and state reimbursements.
! Food service expenses exceeded revenues by $56,364.
! Charges for services, which are amounts paid by patrons for daily food services,
represent $567,442 of total revenue.
25

! Federal and state reimbursements for meals, including for free and reduced lunches and donated commodities were $79,768 .
The School District’s Funds (Source B-2)
All governmental funds (i.e., general fund, special revenue fund, capital projects fund and debt service fund presented in the fund-based statements) are accounted for using the modified accrual basis of accounting. Total revenues amounted to $43,949720 and expenditures were $44,195,511. Other financing sources were $314,909. The net change in fund balance for the year was an increase of $69,118.
General Fund
The General Fund includes the primary operations of the District in providing educational services to students from grade Pre-K through grade 12 including pupil transportation activitiesand capital outlay projects. The following table A-3 presents a summary of General Fund Revenues. The summary reflects the dollar and percent increase (decrease) from the prior year.
Year Ended June 30, 2016
Year Ended June 30, 2015
Amount of Increase
(Decrease)
Percent Increase
(Decrease)REVENUESLocal sources: Local tax levy 20,937,139$ 20,045,562$ 891,577$ 4.4% Tuition 8,386,715 8,172,799 213,916 2.6% Transportation 62,704 103,123 (40,419) -39.2% Miscellaneous 251,159 368,699 (117,540) -31.9%Total - Local Sources 29,637,717 28,690,183 (947,534) State Sources 9,831,660 9,241,168 590,492 6.4%Total - Govt Sources 9,831,660 9,241,168 590,492 Other Financing Sources:Sale of Fixed Asset - - - Capital Lease 256,000 248,792 7,208 2.9%Cancellation of Prior Years Accounts Payable 58,909 - 58,909 100.0%Transfers out - - - Total Other Financing Sources 314,909 248,792 66,117 Total Revenues 39,784,286$ 38,180,143$ 1,604,143$
The primary source of funding for the District is received from local tax levy that accounted for 52.63 % of total revenues. State aid accounted for 24.71 % of total revenues.
26

The following table A-4 presents a summary of General Fund expenditures. The summary reflects the dollar and percent increases from the prior year.
Table A-4Summary of General Fund Expenditures
For the Year Ended June 30, 2016
Year Ended June 30, 2016
Year Ended June 30, 2015
Amount of Increase/
(Decrease)
Percent Increase/
(Decrease)Current: Regular Instruction 11,072,993$ 10,922,950$ 150,043$ 1.37% Special Education Instruction 3,844,742 3,805,747 38,995 1.02% Other Instruction 657,355 693,370 (36,015) -5.19%Support Services and Undistributed Costs: Tuition 967,648 628,523 339,125 53.96% Attendance 76,783 122,142 (45,359) -37.14% Health Services 277,086 299,459 (22,373) -7.47% Student & Instruction Related Services 3,496,894 3,441,549 55,345 1.61% Educational Media Services/School Library 573,133 547,323 25,810 4.72% Instructional Staff Training 59,412 106,757 (47,345) -44.35% School Administrative Services 1,350,947 1,317,802 33,145 2.52% Central Services 425,397 448,404 (23,007) -5.13% Administrative Information Technology 104,202 113,251 (9,049) -7.99% Other Administrative Services 498,276 568,745 (70,469) -12.39% Plant Operations and Maintenance 3,124,092 3,033,214 90,878 3.00% Pupil Transportation 1,925,126 1,677,027 248,099 14.79% Employee Benefits 10,633,164 9,838,296 794,868 8.08%Capital Outlay 638,522 525,154 113,368 21.59%
Total Expenditures 39,725,772$ 38,089,713$ 1,636,059$ 4.30%
Total General Fund expenditures increased $ 1,616,059 or 4.30% from the previous year.
The Upper Freehold Regional School District values its fund balances as a vehicle for addressing unbudgeted and emergent needs that occur during school year. The amounts of fund balance designated to support the subsequent year’s budgets were $260,272 for the 2016-2017 school year.
General Fund Budgetary Highlights
The School District’s budget is prepared according to New Jersey law, and is based on accounting for certain transactions on a basis of modified accrual and encumbrance accounting. The most significant budgeted fund is the General Fund.
The District’s final budget for the general fund anticipated that expenditures would exceed revenues by the amount of budgeted fund balance. The results for the year show a decrease in expenditures against appropriations.
27

Debt Service Fund
The current year obligations for payment of debt service principal and interest amounted to $3,862,623. $3,766,496 in funding was provided by from the local tax levy, $0.00 was from miscellaneous revenue and $106,731 was received as aid from the state. This increased the fundbalance by $10,604.
Enterprise Funds
The Food Service Fund had Net Position of $318,753 at June 30, 2016. This reflects a decreaseof $56,364 from the prior year’s Net Position.
Capital Asset and Debt Administration
Capital Assets
At the end of 2016, the District had capital assets with a book value of $64,267,030. This consists of a broad range of capital assets, including school buildings, athletic facilities, computer and audio-visual equipment, and administrative offices. (See Table A-5.) Total depreciation expense for the year was $ 2,255,354.
2016 2015
Building & Bldg Improvements 78,926,696$ 78,608,310$ Machinery and Equipment 4,204,618 3,883,137 Land 5,419,448 5,419,448 Total Capital Assets 88,550,762 87,910,895 Less: Accumulated Depreciation (24,283,732) (22,028,378)
Net Capital Assets 64,267,030$ 65,882,517$
Table A-5Upper Freehold Regional School District Capital Assets
Governmental Activities
Long-Term Obligations
At June 30, 2016, the School District had $66,663,129 in outstanding debt. Of this amount, $49,410,000 is for bonds and $561,386 is for capital leases.
At year-end, the District had $49,410,000 in general obligation bonds, a decrease of $1,960,000 from last year – as shown in Table A-6.
The District also has a $477,580 liability for compensated absences. This liability represents the District’s contractual obligation to compensation employees for accumulated unused sick leave entitlements upon retirement.
28

Table A-6Upper Freehold Regional School District
Long Term Debt Schedule
Balance at Balance at Increase/ % Governmental Activity June 30, 2016 June 30, 2015 (Decrease) Chg
General Obligation Bonds Payable 49,410,000$ 51,370,000$ (1,960,000.00)$ -3.8%Capital Lease Payable 561,386 506,572 - 0.0%Compensated Absences 477,580 399,872 - 0.0%Bond preminum 3,098,277 3,322,585 - 0.0%Net Pension Liability 13,115,886 10,203,933 2,911,953 28.5%
TOTAL 66,663,129$ 65,802,962$ 951,953$ 1.45%
For the Future
The Upper Freehold Regional School District is in good financial condition presently. However the district, along with many other public school districts in the state, faces a difficult financial future since the primary sources of funding are property tax revenue and state aid. As a result, the financial well being of the District is tied in large measure to the actions of the state legislature. Significant cuts in state funding and/or restrictions on the growth rate of the local property tax levy could have a substantial impact on the District’s programs and services. The growth rate on local property taxes was capped at 2% beginning with the 2011-2012 school year.
In conclusion, the Upper Freehold Regional School District has committed itself to financial excellence for many years. The School District’s system for financial planning, budgeting, and internal financial controls are well regarded. The School District plans to continue its sound fiscal management practices to meet the challenges of the future.
Contacting the School District’s Financial Management
This financial report is designed to provide our citizens, taxpayers, customers, and investors and creditors with a general overview of the District’s finances and to demonstrate the District’s accountability for the money it receives. If you have questions about this report or need additional financial information, contact Margaret Hom, Secretary to the Board of Education and School Business Administrator at Upper Freehold Regional School District, 27 High Street, Allentown, NJ 08501 or e-mail [email protected].
29

restricted and unrestricted net assets are available and have determined that net assets were properly recognized under the policy.
42) We acknowledge our responsibility for the required supplementary information (RSI). The RSI is measured and presented within prescribed guidelines and the methods of measurement and presentation have not changed from those used in the prior period. We have disclosed to you any significant assumptions and interpretations underlying the measurement and presentation of the RSI.
Signature: Signature:
Title: Title:
RESERVED FOR MD&A LETTER
30

BASIC FINANCIAL STATEMENTS
31

This page intentionally left blank.
32

A. Government-Wide Financial Statements
type activities of the District.internal activities. These Statements distinguish between the governmental and business-
fiduciary activities. Eliminations have been made to minimize the double-counting of District. These Statements include the financial activities of the overall District, except for
The Statement of Net Position and the Statement of Activities display information about the
33

This page intentionally left blank
34

EXHIBIT A-1
BUSINESS-GOVERNMENTAL TYPE
ACTIVITIES ACTIVITIES TOTAL
Cash & Cash Equivalents 2,042,273$ 286,684$ 2,328,957$ Receivables, Net 416,133 22,206 438,339 Inventory - 18,637 18,637 Capital Assets, Net (Note 8) 64,267,030 365,113 64,632,143
Total Assets 66,725,436 692,640 67,418,076
Deferred Outflows Related to Pensions 2,345,324 - 2,345,324 Deferred Charge on Refunding of Debt 3,005,103 - 3,005,103
Total Deferred Outflow of Resources 5,350,427 - 5,350,427
Total Assets and Deferred Outflow of Resources 72,075,863 692,640 72,768,503
Accounts Payable 192,100 8,742 200,842 Accrued Interest Expense 821,763 51 821,814 Intergovernmental Payable 8,854 - 8,854 Unearned Revenue 59,311 33,140 92,451 Noncurrent Liabilities (Note 9): Due Within One Year 2,163,142 25,660 2,188,802 Due Beyond One Year 64,499,987 43,621 64,543,608
Total Liabilities 67,745,157 111,214 67,856,371
Deferred Inflows Related to Pensions 454,443 - 454,443
Total Deferred Inflow of Resources 454,443 - 454,443
Total Liabilities and Deferred Inflows of Resources 68,199,600 111,214 68,310,814
Net Investment in Capital Assets 11,066,234 295,832 11,362,066 Restricted For: Other Purposes 1,780,474 - 1,780,474 Unrestricted (8,970,445) 285,594 (8,684,851)
Total Net Position 3,876,263$ 581,426$ 4,457,689$
The accompanying Notes to Financial Statements are an integral part of this statement.
NET POSITION
LIABILITIES
ASSETS
UPPER FREEHOLD REGIONAL SCHOOL DISTRICTSTATEMENT OF NET POSITION
June 30, 2016
DEFERRED OUTFLOW OF RESOURCES
DEFERRED INFLOW OF RESOURCES
35

EXH
IBIT
A-2
CH
AR
GES
OPE
RA
TIN
GB
USI
NES
S-FO
RG
RA
NTS
&G
OV
ERN
MEN
TAL
TYPE
FUN
CTI
ON
S/PR
OG
RA
MS
EXPE
NSE
SSE
RV
ICES
CO
NTR
IBU
TIO
NS
AC
TIV
ITIE
SA
CTI
VIT
IES
TOTA
L
Gov
ernm
enta
l Act
iviti
es:
In
stru
ctio
n:
R
egul
ar11
,072
,993
$
8,
386,
715
$
-
$
(2
,686
,278
)$
-
$
(2,6
86,2
78)
$
S
peci
al E
duca
tion
4,06
3,51
0
-
518,
952
(3,5
44,5
58)
-
(3
,544
,558
)
Oth
er S
peci
al In
stru
ctio
n30
0,18
4
-
-
(3
00,1
84)
-
(300
,184
)
O
ther
Inst
ruct
ion
657,
355
-
-
(657
,355
)
-
(6
57,3
55)
S
uppo
rt Se
rvic
es &
Und
istri
bute
d C
osts
:
T
uitio
n96
7,64
8
-
-
(9
67,6
48)
-
(967
,648
)
A
ttend
ance
& S
ocia
l Wor
k Se
rvic
es76
,783
-
-
(7
6,78
3)
-
(76,
783)
H
ealth
Ser
vice
s27
7,08
6
-
-
(2
77,0
86)
-
(277
,086
)
S
tude
nt &
Inst
ruct
ion
Rel
ated
Ser
vice
s3,
576,
920
-
80
,026
(3
,496
,894
)
-
(3,4
96,8
94)
E
duca
tiona
l Med
ia S
ervi
ces/
Scho
ol L
ibra
r y57
3,13
3
-
-
(5
73,1
33)
-
(573
,133
)
I
nstru
ctio
nal S
taff
Tra
inin
g59
,412
-
-
(5
9,41
2)
-
(59,
412)
S
choo
l Adm
inis
trativ
e Se
rvic
es1,
350,
947
-
-
(1
,350
,947
)
-
(1,3
50,9
47)
C
entra
l Ser
vice
s42
5,39
7
-
-
(4
25,3
97)
-
(425
,397
)
A
dmin
istra
tive
Info
rmat
ion
Tech
nolo
g y10
4,20
2
-
-
(1
04,2
02)
-
(104
,202
)
O
ther
Adm
inis
trativ
e Se
rvic
es49
8,27
6
-
-
(4
98,2
76)
-
(498
,276
)
P
lant
Ope
ratio
ns &
Mai
nten
ance
2,59
3,23
8
-
-
(2,5
93,2
38)
-
(2
,593
,238
)
Pup
il Tr
ansp
orta
tion
1,92
5,12
6
62,7
04
-
(1,8
62,4
22)
-
(1
,862
,422
)
Una
lloca
ted
Ben
efits
15,8
42,8
12
-
8,68
3,64
5
(7,1
59,1
67)
-
(7
,159
,167
)
I
nter
est a
nd c
ost o
n Lo
ng-T
erm
Deb
t2,
090,
121
-
10
6,73
1
(1
,983
,390
)
-
(1,9
83,3
90)
Una
lloca
ted
Dep
reci
atio
n2,
170,
480
-
-
(2
,170
,480
)
-
(2,1
70,4
80)
Una
lloca
ted
Adj
ustm
ent t
o C
apita
l Ass
ets
256,
393
-
-
(256
,393
)
-
(2
56,3
93)
T
otal
Gov
ernm
enta
l Act
iviti
es48
,882
,016
8,
449,
419
9,
389,
354
(3
1,04
3,24
3)
-
(31,
043,
243)
Bus
ines
s-Ty
pe A
ctiv
ities
:
Food
Ser
vice
703,
574
543,
924
79,7
68
-
(79,
882)
(7
9,88
2)
Chi
ld W
atch
Pro
gram
190,
116
224,
223
-
-
34,1
07
34
,107
K
inde
rgar
ten
Com
plem
ent
161,
603
171,
580
-
-
9,97
7
9,97
7
A
HS
Sum
mer
Pro
gram
s10
,210
24
,734
-
-
14
,524
14,5
24
T
otal
Bus
ines
s-Ty
pe A
ctiv
ities
1,06
5,50
3
964,
461
79,7
68
-
(21,
274)
(2
1,27
4)
Tota
l Prim
ary
Gov
ernm
ent
49,9
47,5
19$
9,41
3,88
0$
9,46
9,12
2$
(31,
043,
243)
(21,
274)
(3
1,06
4,51
7)
PRO
GR
AM
REV
ENU
ESC
HA
NG
ES IN
NET
ASS
ETS
NET
(EX
PEN
SE) R
EVEN
UE
AN
D
UPP
ER
FR
EE
HO
LD
RE
GIO
NA
L S
CH
OO
L D
IST
RIC
TST
AT
EM
EN
T O
F A
CT
IVIT
IES
FOR
TH
E Y
EA
R E
ND
ED
JU
NE
30,
201
6
36
EXH
IBIT
A-2
CH
AR
GES
OPE
RA
TIN
GB
USI
NES
S-FO
RG
RA
NTS
&G
OV
ERN
MEN
TAL
TYPE
FUN
CTI
ON
S/PR
OG
RA
MS
EXPE
NSE
SSE
RV
ICES
CO
NTR
IBU
TIO
NS
AC
TIV
ITIE
SA
CTI
VIT
IES
TOTA
L
PRO
GR
AM
REV
ENU
ESC
HA
NG
ES IN
NET
ASS
ETS
NET
(EX
PEN
SE) R
EVEN
UE
AN
D
UPP
ER
FR
EE
HO
LD
RE
GIO
NA
L S
CH
OO
L D
IST
RIC
TST
AT
EM
EN
T O
F A
CT
IVIT
IES
FOR
TH
E Y
EA
R E
ND
ED
JU
NE
30,
201
6
G
ener
al R
even
ues:
Taxe
s:
Prop
erty
Tax
es, L
evie
d fo
r Gen
eral
Pur
pose
s, N
et20
,937
,139
-
20
,937
,139
Taxe
s Lev
ied
for D
ebt S
ervi
ce3,
766,
496
-
3,76
6,49
6
Fede
ral &
Sta
te A
id N
ot R
estri
cted
5,
831,
787
-
5,83
1,78
7
Mis
cella
neou
s Inc
ome
330,
959
23,5
18
35
4,47
7
Tota
l Gen
eral
Rev
enue
s, Sp
ecia
l Ite
ms,
Extra
ordi
nary
Item
s & T
rans
fers
30,8
66,3
81
23
,518
30,8
89,8
99
Cha
nge
In N
et P
ositi
on(1
76,8
62)
2,
244
(1
74,6
18)
Net
Pos
ition
- B
egin
ning
4,
053,
125
57
9,18
2
4,63
2,30
7
Net
Pos
ition
- En
ding
3,87
6,26
3$
581,
426
$
4,
457,
689
$
The
acco
mpa
nyin
g N
otes
to F
inan
cial
Sta
tem
ents
are
an
inte
gral
par
t of t
his s
tate
men
t.
37

restricted and unrestricted net assets are available and have determined that net assets were properly recognized under the policy.
42) We acknowledge our responsibility for the required supplementary information (RSI). The RSI is measured and presented within prescribed guidelines and the methods of measurement and presentation have not changed from those used in the prior period. We have disclosed to you any significant assumptions and interpretations underlying the measurement and presentation of the RSI.
Signature: Signature:
Title: Title:
RESERVED FOR MD&A LETTER
38

B. Fund Financial Statements
individual fund in a format that segregates information by fund type.The Individual Fund statements and schedules present more detailed information for the
39

This page intentionally left blank
40

Governmental Funds
41

This page intentionally left blank
42

EXHIBIT B-1
SPECIAL DEBT TOTALGENERAL REVENUE SERVICE GOVERNMENTAL
ASSETS & OTHER DEBITS FUND FUND FUND FUNDS
Cash & Cash Equivalents 2,050,507$ -$ 66,189$ 2,116,696$ Accounts Receivable: Federal Aid - 105,991 - 105,991 State Aid 291,037 - - 291,037 Other 12,063 7,042 - 19,105
Total Assets 2,353,607$ 113,033$ 66,189$ 2,532,829$
LIABILITIES & FUND BALANCES
Liabilities: Cash Deficit -$ 74,423$ -$ 74,423$ Accounts Payable 187,081 5,019 - 192,100 Intergovernmental Payable: State - 8,854 - 8,854 Unearned Revenue 34,574 24,737 - 59,311
Total Liabilities 221,655 113,033 - 334,688
Fund Balances: Restricted for: Capital Reserve Account 543,360 - - 543,360 Maintenance Reserve Account 250,000 - - 250,000 Emergency Reserve Account 300,000 - - 300,000 Tuition Reserve Account 100,000 - - 100,000 Excess Surplus 160,000 - - 160,000 Excess Surplus - Designated for Subsequent Year's Expenditures 97,692 - - 97,692 Debt Service Fund - - 66,189 66,189 Committed to: Other Purposes 263,233 - - 263,233 Assigned to: Designated for Subsequent Year's Expenditures 162,580 - - 162,580 Unassigned Fund Balance 255,087 - - 255,087
Total Fund Balances 2,131,952 - 66,189 2,198,141
Total Liabilities & Fund Balances 2,353,607$ 113,033$ 66,189$
Amounts reported for governmental activities in the statement of Net Position (A-1)are different because: Capital assets used in governmental activities are not financial resources and therefore are not reported in the funds. The cost of the assets is $88,550,762 and the accumulated depreciation is $24,283,732. 64,267,030
Deferred outflows and inflows of resources related to pensions and deferred charges or credits on debt refundings are applicable to future reporting periods and, therefore, are not reported in the funds. 1,890,881
Deferred charges on refunding of debt is not recorded in the fund financials but is recorded on the district-wide financials. 3,005,103
Accrued interest payable is not recorded in the fund financial Statements due to the fact that the payables are not due in the period. (821,763)
Long-term liabilities, including net pension liability, bonds payable, compensated absences payable, bond premium and capital leases are not due and payable in the current period and therefore are not reported as liabilities in the funds (See Illustrative Note 9) (66,663,129)
Net Position of Governmental Activities 3,876,263$
The accompanying Notes to Financial Statements are an integral part of this statement.
BALANCE SHEETGOVERNMENTAL FUNDS
UPPER FREEHOLD REGIONAL SCHOOL DISTRICT
June 30, 2016
43

EXHIBIT B-2
SPECIAL DEBT TOTALGENERAL REVENUE SERVICE GOVERNMENTAL
FUND FUND FUND FUNDSRevenues: Local Sources: Local Tax Levy 20,937,139$ -$ 3,766,496$ 24,703,635$ Tuition 8,386,715 - - 8,386,715 Transportation 62,704 - - 62,704 Rents and Royalties 11,018 - - 11,018 Miscellaneous 240,141 20,891 - 261,032
Total Local Sources 29,637,717 20,891 3,766,496 33,425,104
State Sources 9,831,660 28,035 106,731 9,966,426 Federal Sources - 558,190 - 558,190
Total Revenues 39,469,377 607,116 3,873,227 43,949,720
Expenditures: Current Expense: Regular Instruction 11,072,993 - - 11,072,993 Special Education Instruction 3,544,558 518,952 - 4,063,510 Other Special Instruction 300,184 - - 300,184 Other Instruction 657,355 - - 657,355 Support Services: Tuition 967,648 - - 967,648 Attendance 76,783 - - 76,783 Health Services 277,086 - - 277,086 Student & Instruction Related Services 3,496,894 80,026 - 3,576,920 Educational Media Services/School Library 573,133 - - 573,133 Instructional Staff Training 59,412 - - 59,412 School Administrative Services 1,350,947 - - 1,350,947 Central Services 425,397 - - 425,397 Administrative Information Technology 104,202 - - 104,202 Other Administrative Services 498,276 - - 498,276 Plant Operations & Maintenance 3,124,092 - - 3,124,092 Pupil Transportation 1,925,126 - - 1,925,126 Employee Benefits 10,633,164 - - 10,633,164 Capital Outlay 638,522 8,138 - 646,660 Debt Service: Principal - - 1,960,000 1,960,000 Interest & Other Charges - - 1,902,623 1,902,623
Total Expenditures 39,725,772 607,116 3,862,623 44,195,511
Excess/(Deficiency) of Revenues Over/(Under) Expenditures (256,395) - 10,604 (245,791)
Other Financing Sources: Capital Lease Proceeds (Nonbudgeted) 256,000 - - 256,000 Cancellation of prior year accounts payable 58,909 - - 58,909
Total Other Financing Sources 314,909 - - 314,909
Excess/(Deficiency) of Revenues and Other Financing Sources Over/(Under) Expenditures and Other Financing Uses 58,514 - 10,604 69,118 Fund Balances July 1, 2,073,438 - 55,585 2,129,023
Fund Balances June 30, 2,131,952$ -$ 66,189$ 2,198,141$
The accompanying Notes to Financial Statements are an integral part of this statement.
UPPER FREEHOLD REGIONAL SCHOOL DISTRICTGOVERNMENTAL FUNDS
FOR THE FISCAL YEAR ENDED JUNE 30, 2016STATEMENT OF REVENUES, EXPENDITURES AND CHANGES IN FUND BALANCES
44

EXHIBIT B-3
Total Net Change in Fund Balances - Governmental Funds (From B-2) 69,118$
Amounts reported for governmental activities in the statement ofactivities (A-2) are different because:
Capital outlays are reported in governmental funds as expenditures.However, in the statement of activities, the cost of those assets isallocated over their estimated useful lives as depreciation expense.This is the amount by which capital outlays exceeded depreciation in the period:
Depreciation Expense ($2,170,480)Adjustments due to revaluation of capital assets (256,393) Capital Outlays 811,386 (1,615,487)
District pension contributions are reported as expenditures in the governmentalfunds when made. However, they are reported as deferred outflows of resourcesin the Statement of Net Position because the reported net pension liability is measureda year before the District's report date. Pension expense, which is the change in the netpension liability adjusted for changes in deferred outflows and inflows of resources relatedto pensions, is reported in the Statement of Activities.
Pension Expense - PERS Contribution - 2016 502,323 Unfunded TPAF Pension Expense 4,696,525 State Share of Unfunded TPAF Pension Expense (4,696,525) Pension Expense (937,738) (435,415)
Repayment of bond principal is an expenditure in the governmentalfunds, but the repayment reduces long-term liabilities in the statementof net position and is not reported in the statement of activities. 1,960,000
Repayment of lease principal is an expenditure in the governmentalfunds, but the repayment reduces long-term liabilities in the statementof net position and is not reported in the statement of activities. 201,186
Proceeds from debt issues are a financing source in the governmental funds.They are not revenue is the statement of activities; issuing debt increaseslong-term liabilities in the statement of net position.
Capital Lease Proceeds (256,000)
Deferred Charge on Retirement of Debt, cost of issuance on refunding,and original issue premiums are recorded when incurred in the governmental funds but are deferred and recognized in the statement of activities over the life of the refunding:
Amortization of Loss on Early Retirement of Debt (205,424) Amortization of Bond Premiums 224,307 18,883
Interest on long-term debt in the statement of activities is accrued, regardless of whendue. In the governmental funds, interest is reported when due.
Prior Year 780,324 Current Year (821,763) (41,439)
In the statement of activities, certain operating expenses, e.g. compensatedexpenses (vacation & sick time) are measured by the amounts earned duringthe year. In the governmental funds, however, expenditures for these items arereported in the amount of financial resources paid. When the paid amountexceeds the earned amount the difference is an addition to the reconciliation;when the earned amount exceeds the paid amount, the difference is a reductionin the reconciliation.
Prior Year 399,872 Current Year (477,580) (77,708)
Change in Net Positon of Governmental Activities (176,862)$
The accompanying Notes to Financial Statements are an integral part of this statement.
FOR THE YEAR ENDED JUNE 30, 2016
UPPER FREEHOLD REGIONAL SCHOOL DISTRICTRECONCILIATION OF THE STATEMENT OF REVENUES, EXPENDITURES,
AND CHANGES IN FUND BALANCES OF GOVERNMENTAL FUNDSTO THE STATEMENT OF ACTIVITIES
45

restricted and unrestricted net assets are available and have determined that net assets were properly recognized under the policy.
42) We acknowledge our responsibility for the required supplementary information (RSI). The RSI is measured and presented within prescribed guidelines and the methods of measurement and presentation have not changed from those used in the prior period. We have disclosed to you any significant assumptions and interpretations underlying the measurement and presentation of the RSI.
Signature: Signature:
Title: Title:
RESERVED FOR MD&A LETTER
46

Proprietary Funds
47

This page intentionally left blank
48

EXHIBIT B-4
FOOD TOTALSERVICE CHILD KINDERGARTEN AHS SUMMER BUSINESS-TYPE
ASSETS FUND WATCH COMPLEMENT PROGRAMS ACTIVITIES
Current Assets: Cash & Cash Equivalents 9,788$ 188,819$ 53,670$ 34,407$ 286,684$ Cash with Fiscal Agent Accounts Receivable: State 116 - - - 116 Federal 2,400 - - - 2,400 Miscellaneous 100 - 19,590 - 19,690 Inventories 18,637 - - - 18,637
Total Current Assets 31,041 188,819 73,260 34,407 327,527
Capital Assets: Equipment 714,115 - - - 714,115 Accumulated Depreciation (349,002) - - - (349,002)
Total Capital Assets 365,113 - - - 365,113
Total Assets 396,154 188,819 73,260 34,407 692,640
Current Liabilities: Accounts Payable 8,069 - 490 183 8,742 Unearned Revenue - - 13,440 19,700 33,140 Capital Lease Payable 69,281 - - - 69,281 Accrued interest payable 51 - - - 51
Total Current Liabilities 77,401 - 13,930 19,883 111,214
NET POSITION
Investment in Capital Assets 295,832 - - - 295,832 Unreserved 22,921 188,819 59,330 14,524 285,594
Total Net Position 318,753$ 188,819$ 59,330$ 14,524$ 581,426$
The accompanying Notes to Financial Statements are an integral part of this statement.
BUSINESS-TYPE ACTIVITIES ENTERPRISE FUNDS
UPPER FREEHOLD REGIONAL SCHOOL DISTRICTPROPRIETARY FUNDS
STATEMENT OF NET POSITIONFOR THE FISCAL YEAR ENDED JUNE 30, 2016
49

EXHIBIT B-5
FOOD TOTALSERVICE CHILD KINDERGARTEN AHS SUMMER BUSINESS-TYPE
FUND WATCH COMPLEMENT PROGRAMS ACTIVITIESOperating Revenue: Daily Sales - Reimbursable Programs: School Lunch Program 100,647$ -$ -$ -$ 100,647$
Total - Daily Sales - Reimbursable Programs 100,647 - - - 100,647
Daily Sales Nonreimbursable Programs 443,277 - - - 443,277 Fees - 223,080 171,580 24,734 419,394 Miscellaneous Income 23,518 1,143 - - 24,661
Total Operating Revenue 567,442 224,223 171,580 24,734 987,979
Operating Expenses: Salaries 288,894 177,294 129,993 9,747 605,928 Employee Benefits - - 31,352 - 31,352 Purchased Prof./Tech. Services 47,002 1,254 - - 48,256 Purchased Property Services 1,825 - - - 1,825 Supplies and Materials 3,342 9,073 258 463 13,136 Depreciation 42,684 - - - 42,684 Miscellaneous 1,783 2,495 - - 4,278 Cost of Sales 318,044 - - - 318,044
Total Operating Expenses 703,574 190,116 161,603 10,210 1,065,503
Operating (Loss)/Gain (136,132) 34,107 9,977 14,524 (77,524)
Nonoperating Revenues: State Sources: State School Lunch Program 2,067 - - - 2,067 Federal Sources: National School Lunch Program 42,765 - - - 42,765 Food Distribution Program 34,936 - - - 34,936
Total Nonoperating Revenues 79,768 - - - 79,768
Change in Net Position (56,364) 34,107 9,977 14,524 2,244
Net Position - July 1 375,117 154,712 49,353 - 579,182
Net Position - June 30 318,753$ 188,819$ 59,330$ 14,524$ 581,426$
The accompanying Notes to Financial Statements are an integral part of this statement.
BUSINESS-TYPE ACTIVITIES ENTERPRISE FUNDS
UPPER FREEHOLD REGIONAL SCHOOL DISTRICTPROPRIETARY FUNDS
STATEMENT OF REVENUES, EXPENDITURES AND CHANGESIN NET POSITION
FOR THE FISCAL YEAR ENDED JUNE 30, 2016
50

EXHIBIT B-6
FOOD TOTALSERVICE CHILD KINDERGARTEN AHS SUMMER BUSINESS-TYPE
FUND WATCH COMPLEMENT PROGRAMS ACTIVITIESCash Flows From Operating Activities: Receipts from Customers 577,912$ 224,223$ 162,460$ 24,734$ 989,329$ Payments to Employees (288,894) (177,294) (129,993) (9,747) (605,928)$ Payments to Suppliers (343,158) (14,672) (18,480) 19,420 (356,890)
Net Cash Provided/(Used) by Operating Activities (54,140) 32,257 13,987 34,407 26,511
Cash Flows From Capital & RelatedFinancing Activities: (In)/Decrease In Capital Assets - - - - - Payment of Capital Lease (23,445) - - - (23,445)
Net Cash Provided/(Used) by Capital & Related Financing Activities (23,445) - - - (23,445)
Cash Flows From Noncapital FinancingActivities: Cash Received From State & Federal Reimbursements 48,225 - - - 48,225
Net Cash Provided by Noncapital Financing Activities 48,225 - - - 48,225
Net Increase/(Decrease) in Cash & Cash Equivalents (29,360) 32,257 13,987 34,407 51,291 Cash and Cash Equivalents, July 1 39,148 156,562 39,683 - 235,393
Cash & Cash Equivalents, June 30 9,788$ 188,819$ 53,670$ 34,407$ 286,684$
Cash Provided/(Used) by Operating Activities: Operating Income/(Loss) (136,132)$ 34,107$ 9,977$ 14,524$ (77,524)$ Adjustments to Reconcile Operating to Cash Provided/(Used) by Operating Activities: Depreciation Expense 42,684 - - - 42,684 Food Distribution Program 34,936 - - - 34,936 Change in Assets & Liabilities: Decrease/(Increase) in Accounts Receivable 10,470 - (9,120) - 1,350 (Increase)/Decrease in Inventory 2,402 - - - 2,402 Increase/(Decrease) in Accounts Payable (7,700) (1,850) 490 183 (8,877) Increase/(Decrease) in Unearned Revenue (800) - 12,640 19,700 31,540
Total Adjustments 81,992 (1,850) 4,010 19,883 104,035
Net Cash Provided/(Used) by Operating Activities (54,140)$ 32,257$ 13,987$ 34,407$ 26,511$
The accompanying Notes to Financial Statements are an integral part of this statement.
RECONCILIATION OF OPERATING INCOME/(LOSS) TO NET CASH PROVIDED/(USED) BY OPERATING ACTIVITIES:
UPPER FREEHOLD REGIONAL SCHOOL DISTRICTPROPRIETARY FUNDS
STATEMENT OF CASH FLOWSFOR THE FISCAL YEAR ENDED JUNE 30, 2016
BUSINESS-TYPE ACTIVITIES ENTERPRISE FUNDS
51

restricted and unrestricted net assets are available and have determined that net assets were properly recognized under the policy.
42) We acknowledge our responsibility for the required supplementary information (RSI). The RSI is measured and presented within prescribed guidelines and the methods of measurement and presentation have not changed from those used in the prior period. We have disclosed to you any significant assumptions and interpretations underlying the measurement and presentation of the RSI.
Signature: Signature:
Title: Title:
RESERVED FOR MD&A LETTER
52

Fiduciary Fund
53

This page intentionally left blank
54

EXHIBIT B-7
UNEMPLOYMENTCOMPENSATION SCHOLARSHIP PAYROLL STUDENT JUNE 30,
ASSETS TRUST TRUST FUND ACTIVITY TOTALS
Cash & Cash Equivalents 219,433$ 52,708$ 168,790$ 174,246$ 615,177$
Total Assets 219,433 52,708 168,790 174,246 615,177
LIABILITIES
Payroll Deductions & Withholdings - - 168,790 - 168,790 Due to Student Groups - - - 174,246 174,246
Total Liabilities - - 168,790 174,246 343,036
NET POSITION
Reserved: Unemployment Claims 219,433 - - - 219,433 Scholarship Awards - 52,708 - - 52,708
Total Net Position 219,433$ 52,708$ -$ -$ 272,141$
The accompanying Notes to Financial Statements are an integral part of this statement.
UPPER FREEHOLD REGIONAL SCHOOL DISTRICT
AGENCYPRIVATE PURPOSE
FOR THE FISCAL YEAR ENDED JUNE 30, 2016STATEMENT OF FIDUCIARY NET POSITION
FIDUCIARY FUNDS
55

EXHIBIT B-8
UNEMPLOYMENTCOMPENSATION SCHOLARSHIP
ADDITIONS: TRUST TRUST TOTALS
Contributions: Deductions From Employees' Salaries 51,483$ -$ 51,483$ Donor Contributions - 23,731 23,731
Total Contributions 51,483 23,731 75,214
Investment Earnings: Interest on Investments - - -
Total Investment Earnings - - -
Total Additions 51,483 23,731 75,214
DEDUCTIONS:
Unemployment Claims 99,431 - 99,431 Scholarships Awarded - 18,405 18,405
Total Deductions 99,431 18,405 117,836
Change in Net Position (47,948) 5,326 (42,622) Net Position - Beginning of Year 267,381 47,382 314,763
Net Position - End of Year 219,433$ 52,708$ 272,141$
The accompanying Notes to Financial Statements are an integral part of this statement.
PRIVATE PURPOSE
COMBINING STATEMENT OF CHANGES IN FIDUCIARY NET POSITIONFIDUCIARY FUND
UPPER FREEHOLD REGIONAL SCHOOL DISTRICT
FOR THE FISCAL YEAR ENDED JUNE 30, 2016
56

UPPER FREEHOLD REGIONAL SCHOOL DISTRICT
NOTES TO THE FINANCIAL STATEMENTSJUNE 30, 2016
57

This page intentionally left blank
58

UPPER FREEHOLD REGIONAL SCHOOL DISTRICTNOTES TO THE FINANCIAL STATEMENTS
FOR THE YEAR ENDED JUNE 30, 2016
Note 1: Summary of Significant Accounting Policies
The financial statements of the Upper Freehold Regional School District (the ‘District”) have been prepared in conformity with generally accepted accounting principles (GAAP) as prescribed by the Governmental Accounting Standards Board (GASB). The following is a summary of more significant accounting policies.
Reporting Entity
The Upper Freehold Regional School District is a Type II district located in the County of Monmouth, State of New Jersey. As a Type II district, the School District functions independently through a Board of Education. The operations of the District include three schools which comprise the Upper Freehold Regional School District. The Upper Freehold Regional School District has an approximate enrollment at June 30, 2016 of 2,296 students.
The primary criterion for including activities within the District’s reporting entity, as set forth in Section 2100 of the GASB Codification of Governmental Accounting and Financial Reporting Standards, is whether:
! the organization is legally separate (can sue or be sued in their own name);! the District holds the corporate powers of the organization;! the District appoints a voting majority of the organization’s board! the District is able to impose its will on the organization;! the organization has the potential to impose a financial benefit/burden on the District! there is a fiscal dependency by the organization on the District.
Component Units
GASB Statement No.14. The Financial Reporting Entity, provides guidance that all entities associated with a primary government are potential component units and should be evaluated for inclusion in the financial reporting entity. A primary government is financially accountable not only for the organizations that make up its legal entity but also for legally separate organizations that meet the criteria established by GASB Statement No. 14, as amended by GASB Statement No. 39, Determining Whether Certain Organizations are Component Units and GASB Statement No. 61, The Financial Reporting Entity: Omnis - an amendment of GASB Statements No. 14 and No. 34. The District had no component units as of for the year ended June 30, 2016.
Government-Wide Financial Statements
The District’s Government-Wide Financial Statements include a Statement of Net Position and aStatement of Activities. report information of all of the non-fiduciary activities of the District. For the most part, the effect of interfund activity has been removed from these government-wide statements. District activities, which normally are supported by taxes and intergovernmental revenues, are reported separately from business-type activities, which rely to a significant extent on fees and charges for support.
The statement of activities demonstrates the degree to which the direct expenses of a given function, segment or component unit are offset by program revenues. Direct expenses are those that are clearly identifiable with a specific function, segment, or component unit. Program revenues include charges to customers who purchase, use or directly benefit from goods or services provided by a given function, segment or component unit. Program revenues also include grants and contributions that are restricted to meeting the operational or capital requirements of a particular function, segment, or component unit.
59

UPPER FREEHOLD REGIONAL SCHOOL DISTRICTNOTES TO THE FINANCIAL STATEMENTS (continued)
FOR THE YEAR ENDED JUNE 30, 2016
Note 1: Summary of Significant Accounting Policies (continued):
Taxes and other items not properly included among program revenues are reported instead as general revenues. The District does not allocate general government (indirect) expenses to other functions.
Net position is restricted when constraints placed on it is either externally imposed or imposed by constitutional provisions or enabling legislation. Internally imposed designations of resources are not presented as restricted net position. When both restricted and unrestricted resources are available for use, generally it is the District’s policy to use restricted resources first, and then unrestricted resources as they are needed.
Separate financial statements are provided for governmental funds, proprietary funds, fiduciary funds and similar component units, and major component units. However, the fiduciary funds are not included in the government-wide statements. Major individual governmental funds and major individual enterprise funds are reported as separate columns in the fund financial statements.
Governmental Fund Financial Statements
Governmental Fund Financial Statements – The Governmental fund financial statements are reported using the current financial resources measurement focus and the modified accrual basis of accounting. Revenues are recognized as soon as they are both measurable and available. Revenues are considered to be available when they are collectible within the current period or soon enough thereafter to pay liabilities of the current period. For this purpose, the District considers revenues to be available if they are collected within 60 days of the end of the current fiscal year-end. Principal revenue sources considered susceptible to accrual include federal and state grants, tuition and transportation. Other revenues are considered to be measurable and available only when cash is received by the state. Expenditures generally are recorded when a liability is incurred, as under accrual accounting.
Proprietary Fund Financial Statements
Proprietary fund financial statements include a Statement of Net Position, a Statement of Revenues, Expenses and Changes in Fund Net Position, and a Statement of Cash Flows for each major proprietary fund and for the non-major funds aggregated. A column representing internal service funds is alsopresented in these statements. However, internal service funds balances and activities have been combined with the governmental activities in the Government-Wide financial statements.
Proprietary funds are accounted for using the “economic resources” measurement focus and the accrual basis of accounting. Accordingly, all assets, deferred outflows of resources, liabilities (whether current or noncurrent), and deferred inflows of resources are included on the Statement of Net Position. The Statement of Revenues, Expenses and Changes in Fund Net Position presents increases (revenues) and decreases (expenses) in total net position. Under the accrual basis of accounting, revenues are recognized in the period in which they are earned while expenses are recognized in the period in which the liability is incurred, regardless of the timing of related cash flows.
Operating revenues in the proprietary funds are those revenues that are generated from the primary operations of the fund. All other revenues are reported as non-operating revenues. Operating expenses are those expenses that are essential to the primary operations of the fund. All other expenses are reported as non-operating expenses.
60

UPPER FREEHOLD REGIONAL SCHOOL DISTRICTNOTES TO THE FINANCIAL STATEMENTS (continued)
FOR THE YEAR ENDED JUNE 30, 2016
Note 1: Summary of Significant Accounting Policies (continued):
Fiduciary Fund Financial Statements
Fiduciary fund financial statements include a Statement of Net Position. The District’s fiduciary funds are Agency Funds, which are custodial in nature (assets equal liabilities) and do not involve measurement of results of operations. The Agency funds are accounted for on a spending or “economic resources” measurement focus and the accrual basis of accounting as are the proprietary funds explained above.
Measurement Focus, Basis of Accounting and Financial Statement Presentation
The government-wide financial statements are reported using the economic resources measurement focus and the accrual basis of accounting as are the proprietary fund and fiduciary fund financial statements. Revenues are recorded when earned and expenses are recorded when a liability is incurred, regardless of the timing of related cash flows. Property taxes are recognized as revenues in the year in which they are levied. Grants and similar items are recognized as revenue as soon as all eligibility requirements imposed by the provider have been met.
Amounts reported as program revenues include 1) charges to customers or applicants for goods, services, or privileges provided, 2) operating grants and contributions, and 3) capital grants and contributions. Internally dedicated resources are reported as general revenues rather than as program revenues. Likewise, general revenues include all taxes.
While government-wide and fund financial statements are presented separately, they are interrelated. The governmental activities column of the government wide statements incorporates data from governmental funds and internal service funds, while business-type activities incorporate data from the District’s enterprise funds. Separate financial statements are provided for governmental funds, proprietary funds, and fiduciary funds. However, data from the fiduciary funds is not incorporated in the government-wide financial statements
Governmental fund financial statements are reported using the current financial resources measurement focus and the modified accrual basis of accounting. Revenues are recognized as soon as they are both measurable and available. Revenues are considered to be available when they are collectible within the current period or soon enough thereafter to pay liabilities of the current period. For this purpose, the District considers revenues to be available if they are collected within 60 days of the end of the current \fiscal year-end. Expenditures generally are recorded when a liability is incurred, as under accrual accounting. However, debt service expenditures, as well as expenditures related to compensated absences and claims and judgments, are recorded only when payment is due. General capital assets acquisitions are reported as expenditures in the governmental funds. Issuance of long-term debt and acquisitions under capital leases are reported as other financing sources.
Property taxes, charges for services, licenses, and interest on notes receivable associated with the current fiscal period are all considered to be susceptible to accrual and accordingly have been recognized as revenues of the current fiscal period. Entitlements are recorded as revenues when all eligibility requirements are met, including any time requirements, and the amount is received during the period or within the availability period for this revenue source (within 60 days of year-end). Expenditure-driven grants are recognized as revenue when the qualifying expenditures have been incurred and all eligibility requirements have been met, and the amount is received during the period or within the availability period for this revenue source (within 60 days of year-end). All other revenue items are considered to be measurable and available when cash is received.
61

UPPER FREEHOLD REGIONAL SCHOOL DISTRICTNOTES TO THE FINANCIAL STATEMENTS (continued)
FOR THE YEAR ENDED JUNE 30, 2016
Note 1: Summary of Significant Accounting Policies (continued):
Proprietary funds distinguish operating revenues and expenses from nonoperating items. Operating revenues and expenses generally result from providing services and producing and delivering goods in connection with a proprietary fund’s principal ongoing operations. The principal operating revenues of the Food Service Fund program are charges to customers for sales and services. Operating expenses for enterprise funds include the cost of sales and services, employee salaries and benefits, administrative expenses, and depreciation on capital assets. All revenues and expenses not meeting this definition are reported as nonoperating revenues and expenses. When both restricted and unrestricted resources are available for use, it is the District’s policy to use restricted resources first, then unrestricted resources as they are needed.
Internal service funds are used to account for those operations which provide benefits to other funds, departments, or agencies of the primary government and its component unit. Although internal service funds are reported as a proprietary fund in the fund financial statements, it is incorporated into governmental activities in the government-wide financial statements. The District does not maintain any internal service funds.
The District reports the following major governmental funds:
General Fund - The general fund is the general operating fund of the District and is used to account for all financial resources except those required to be accounted for in another fund. Included are certain expenditures for vehicles and movable instructional or noninstructional equipment which are classified in the Capital Outlay sub-fund.
As required by the New Jersey Department of Education the District includes budgeted capital outlay in this fund. Generally accepted accounting principles as they pertain to governmental entities state that General Fund resources may be used to directly finance capital outlays for long-lived improvements as long as the resources in such cases are derived exclusively from unrestricted revenues.
Resources for budgeted capital outlay purposes are normally derived from State of New Jersey Aid, interest earnings and appropriated fund balance. Expenditures are those that result in the acquisition of or additions to capital assets for land, existing buildings, improvements of grounds, construction of buildings, additions to or remodeling of buildings and the purchase of built-in equipment. These resources can be transferred from and to Current Expense by board resolution.
Special Revenue Fund - The Special Revenue Fund is used to account for the proceeds of specific revenue from State and Federal Government, (other than major capital projects, DebtService or the Enterprise Funds) and local appropriations that are legally restricted to expenditures for specified purposes.
Debt Service Fund - The debt service fund is used to account for the accumulation of resources for, and the payment of principal and interest on bonds issued to finance major property acquisition, construction and improvement programs.
62

UPPER FREEHOLD REGIONAL SCHOOL DISTRICTNOTES TO THE FINANCIAL STATEMENTS (continued)
FOR THE YEAR ENDED JUNE 30, 2016
Note 1: Summary of Significant Accounting Policies (continued):
The District reports the following major proprietary funds:
Food Service Fund – This fund accounts for the revenues and expenses pertaining to the District’s cafeteria operations.
Additionally, the District reports the following major fiduciary funds:
Private Purpose Trust Funds - Private-purpose trust funds are used to account for the principal and income for trust arrangements that benefit individuals, private organizations, or other governments. The district currently maintains the following private purpose trust funds:
Unemployment Trust Fund – Revenues consist of employee payroll withholdings, interest income, and contributions through the annual budget process of the District. Expenditures consist of unemployment reimbursement claims.
Agency Funds - Agency funds are assets held by a governmental entity (either as trustee or as an agent) for other parties that cannot be used to finance the governmental entity’s own operating programs. The district currently maintains Payroll Funds, Scholarship Funds and Student Activity Funds as Agency Funds.
During the course of operations, the District has activity between funds for various purposes. Any residual balances outstanding at year end are reported as due from/to other funds and advances to/from other funds. While these balances are reported in fund financial statements, certain eliminations are made in the preparation of the government-wide financial statements. Balances between the funds included in governmental activities (i.e., the governmental funds and internal service funds) are eliminated so that only the net amount is included as internal balances in the governmental activities column. Similarly, balances between the funds included in business-type activities (i.e., the enterprise funds) are eliminated so that only the net amount is included as internal balances in the business-type activities column.
Further, certain activity occurs during the year involving transfers of resources between funds. In fund financial statements these amounts are reported at gross amounts as transfers in/out. While reported in fund financial statements, certain eliminations are made in the preparation of the government-wide financial statements. Transfers between the funds included in governmental activities are eliminated so that only the net amount is included as transfers in the governmental activities column. Similarly, balances between the funds included in business-type activities are eliminated so that only the net amount is included as internal balances in the business-type activities column.
Budgets/Budgetary Control
The accrual basis of accounting is used for measuring financial position and operating results of proprietary fund types and private purpose trust funds. Under this method, revenues are recognized in the accounting period in which they are earned and expenses are recognized when they are incurred.
Annual appropriated budgets are prepared in the spring of each year for the general, special revenue and debt service funds. The budgets are submitted to the county office and are voted upon at the annual school election on the third Tuesday in April. Effective January 17, 2012, P.L.2011 c.202 eliminated the annual voter referendum on budgets which met the statutory tax levy cap limitations and the board of education members are elected at the November general election. Budgets are prepared using the modified accrual basis of accounting. The legal level of budgetary control is established at line item
63

UPPER FREEHOLD REGIONAL SCHOOL DISTRICTNOTES TO THE FINANCIAL STATEMENTS (continued)
FOR THE YEAR ENDED JUNE 30, 2016
Note 1: Summary of Significant Accounting Policies (continued):
accounts within each fund. Line item accounts are defined as the lowest (most specific) level of detail as established pursuant to the minimum chart of accounts referenced in N.J.A.C.6:20-2A(m)1. All budget amendments must be approved by School Board resolution.
Formal budgetary integration into the accounting system is employed as a management control device during the year. For governmental funds there are no substantial differences between the budgetary basis of accounting and generally accepted accounting principles with the exception of the legally mandated revenue recognition of the last state aid payment for budgetary purposes only and the special revenue fund as noted below. Encumbrance accounting is also employed as an extension of formal budgetary integration in the governmental fund types. Unencumbered appropriations lapse at fiscal year-end.
The accounting records of the special revenue fund are maintained on the grant accounting budgetary basis. The grant accounting budgetary basis differs from GAAP in that the grant accounting budgetary basis recognizes encumbrances as expenditures and also recognizes the related revenues, whereas the GAAP basis does not. Sufficient supplemental records are maintained to allow for the presentation of GAAP basis financial reports.
The budget, as detailed on Exhibit C-1, includes all amendments to the adopted budget, if any.
Exhibit C-3 presents a reconciliation of the special revenue fund revenues and expenditures from the budgetary basis of accounting as presented in the Combined Statement of Revenues, Expenditures and Changes in Fund Balances - Budget and Actual – General, Special Revenues and Debt Service Funds to the GAAP basis of accounting as presented in the Combined Statement of Revenues, Expenditures and Changes in Fund Balances - All Governmental Fund Types.
Encumbrances
Under encumbrance accounting purchase orders, contracts and other commitments for the expenditure of resources are recorded to reserve a portion of the applicable appropriation. Open encumbrances in governmental funds other than the special revenue fund are reported as assigned fund balances at fiscal year-end as they do not constitute expenditures or liabilities but rather commitments related to unperformed contracts for goods and services.
Open encumbrances in the special revenue fund for which the District has received advances are reflected in the balance sheet as a reduction of the accounts receivables or as unearned revenue at fiscal year-end.
The encumbered appropriation authority carries over into the next fiscal year. An entry will be made at the beginning of the next fiscal year to increase the appropriation reflected in the certified budget by the outstanding encumbrance amount as of the current fiscal year-end.
Cash and Cash Equivalents
Cash and Cash equivalents include petty cash, change funds, cash in banks and all highly liquid investments with a maturity of three months or less at the time of purchase and are stated at cost plus accrued interest. U.S. Treasury and agency obligations and certificates of deposit with maturities of one year or less when purchased are stated at cost.
64

UPPER FREEHOLD REGIONAL SCHOOL DISTRICTNOTES TO THE FINANCIAL STATEMENTS (continued)
FOR THE YEAR ENDED JUNE 30, 2016
Note 1: Summary of Significant Accounting Policies (continued):
New Jersey School Districts are limited as to the types of investments and types of financial institutions they may invest in. N.J.S.18A:20-37 provides a list of permissible investments that may be purchased by New Jersey school districts.
Additionally, the District has adopted a cash management plan that requires it to deposit public funds in public depositories protected from loss under the provisions of the Governmental Unit Deposit Protection Act (“GUDPA”). GUDPA was enacted in 1970 to protect Governmental Units from loss of funds on deposit with a failed banking institution in New Jersey.
N.J.S.A.17:9-41 et. Seq. establishes the requirements for the security of deposits of governmental units. The statute requires that no governmental unit shall deposit public funds in a public depository unless such funds are secured in accordance with the Act. Public depositories include Savings and Loan institutions, banks (both state and national banks) and savings banks the deposits of which are federally insured. All public depositories must pledge collateral, having a market value at least equal to five percent of the average daily balance of collected public funds, to secure the deposits of Governmental Units. If a public depository fails, the collateral it has pledged, plus the collateral of all other public depositories, is available to pay the full amount of their deposits to the Governmental Units.
Tuition Payable/Receivable
Tuition rates for the fiscal year end June 30, 2016 were established by the receiving district based on estimated costs. The charges are subject to adjustment when the final costs have been determined.
Inventories and Prepaid Expenses
Inventories are valued at cost, using the first-in/first-out (FIFO) method. The costs of inventories are recorded as expenditures when consumed rather when purchased.
The cost of inventories in governmental fund types is recorded as expenditures when purchased rather than when consumed.
Prepaid expenses, which benefit future periods, other than those recorded in the enterprise funds, are recorded as expenditure during the year of purchase. Prepaid expenses in the enterprise fund represent payments made to vendors for services that will benefit periods beyond June 30, 2016.
Short-Term Interfund Receivables/Payables
Short-term interfund receivables/payables represent amounts that are owed, other than charges for goods or services rendered to/from a particular fund in the District and that are due within one year. The amounts are eliminated in the governmental and business-type activities, which are presented as Internal Balances. Balances with fiduciary funds are not considered Internal Balances; therefore those balances are reported on the Statement of Net Position.
Capital AssetsCapital assets are reported in the applicable governmental or business-type activities column in the government-wide financial statements. Purchased or constructed assets are recorded at actual cost or estimated historical cost if actual cost is unavailable. Donated capital assets are recorded at estimated fair value at the date of donation. The District has established a threshold of $2,000 for capitalization of depreciable assets.
65

UPPER FREEHOLD REGIONAL SCHOOL DISTRICTNOTES TO THE FINANCIAL STATEMENTS (continued)
FOR THE YEAR ENDED JUNE 30, 2016
Note 1: Summary of Significant Accounting Policies (continued):
Major outlays for capital assets and improvements are capitalized as projects are constructed. The costs of normal maintenance and repairs that do not add to the value of the asset or materially extend asset lives are not capitalized.
Capital assets of the District are depreciated or amortized using the straight-line method over the following estimated lives:
Buildings - 50 YearsBuilding Improvements – 20 to 30 YearsMachinery & Equipment – 10 to 15 YearsOffice & Computer Equipment – 5 to 10 YearsVehicles – 8 Years
Accrued Salaries and WagesDistrict employees, who provide services to the District over the ten-month academic year and extended eleven-month calendar, do not have the option to have their salaries disbursed during the entire twelve-month year. Therefore, there is no accrual as of June 30, 2016 for such salaries.
Compensated Absences
Compensated absences are those absences for which employees will be paid, such as vacation, sick leave and sabbatical leave. A liability for compensated absences that are attributable to services already rendered, and that are not contingent on a specific event that is outside the control of the District and its employees, is accrued as the employees earn the rights to the benefits. Compensated absences that relate to future services, or that are contingent on a specific event that is outside the control of the District and its employees, are accounted for in the period in which such services are rendered or in which such events take place.
In the Government-Wide financial statements, under governmental activities, compensated absences are reported as an expenditure and noncurrent liabilities.
Unearned Revenue
Unearned revenue arises when assets are recognized before revenue recognition criteria have been satisfied and is recorded as a liability until the revenue is both measureable and the District is eligible to realize the revenue.
Long-Term Obligations
In government-wide financial statements, under governmental activities, long-term debt is recognized as a liability in the general fund as debt is incurred.
66

UPPER FREEHOLD REGIONAL SCHOOL DISTRICTNOTES TO THE FINANCIAL STATEMENTS (continued)
FOR THE YEAR ENDED JUNE 30, 2016
Note 1: Summary of Significant Accounting Policies (continued):
Use of Estimates
The preparation of financial statements in conformity with accounting principles generally accepted in the United States of America requires management to make estimates and assumption that affect certain reported amounts and disclosures. Accordingly, actual results could differ from those estimates.
Fund Balance
In accordance with Government Accounting Standards Board 54, Fund Balance Reporting and Governmental Fund Type Definitions, the Upper Freehold Regional School District classifies governmental fund balances as follows:
∀ Non-spendable – includes fund balance amounts that cannot be spent either because it is not in spendable form or because legal or contractual constraints.
∀ Restricted – includes fund balance amounts that are constrained for specific purposes which are externally imposed by external parties, constitutional provision or enabling legislation.
∀ Committed – includes fund balance amounts that are constrained for specific purposes that are internally imposed by the government through formal action of the highest level of decision making authority and does not lapse at year-end.
∀ Assigned – includes fund balance amounts that are intended to be used for specific purposes that are neither considered restricted or committed. Fund Balance may be assigned by the Business Administrator.
∀ Unassigned – includes balance within the General Fund which has not been classified within the above mentioned categories and negative fund balances in other governmental funds.
The District uses restricted/committed amounts to be spent first when both restricted and unrestricted fund balance is available, unless prohibited by law or regulation. Additionally, the District would first use committed, then assigned and lastly unassigned amounts of unrestricted fund balance when expenditures are made.
Net Position
Net position, represents the difference between summation of assets and deferred outflows of resources, and the summation of liabilities and deferred inflows of resources. Net position is classified in the following three components:
∀ Net Investment in Capital Assets – This component represents capital assets, net of accumulated depreciation, net of outstanding balances of borrowings used for acquisition, construction, or improvement of those assets.
∀ Restricted – Net position is reported as restricted when there are limitations imposed on their use either through the enabling legislation adopted by the District or through external restrictions imposed by creditors, grantors or laws or regulations of other governments.
∀ Unrestricted – Net position is reported as unrestricted when it does not meet the criteria of the other two components of net position.
Impact of Recently Issued Accounting Principles
Adopted Accounting Pronouncements
67

UPPER FREEHOLD REGIONAL SCHOOL DISTRICTNOTES TO THE FINANCIAL STATEMENTS (continued)
FOR THE YEAR ENDED JUNE 30, 2016
Note 1: Summary of Significant Accounting Policies (continued)
For the year ended June 30, 2016, the District implemented GASB Statement No. 72, Fair Value Measurement and Application. As a result of implementing this statement, the District is required to measure certain investments at fair value for financial reporting purposes. In addition, the District is required to measure donated capital assets at acquisition value (an entry price); these assets were previously required to be measured at fair value. Statement No. 72 requires disclosures to be made about fair value measurements, the level of fair value hierarchy, and valuation techniques. Implementation of this Statement did not impact the District’s financial statements.
The District implemented GASB Statement No. 73, Accounting and Financial Reporting for Pensions and Related Assets that are Not Within the Scope of GASB Statement 68, and Amendments to Certain Provisions of GASB Statements 67 and 68. Implementation of this Statement did not impact the District’s financial statements.
The District implemented GASB Statement No. 76, The Hierarchy of Generally Accepted Accounting Principles for State and Local Governments. Implementation of this Statement did not impact the District’s financial statements.
Recently Issued and Adopted Accounting Pronouncements
The GASB has issued the following Statements which will become effective in future fiscal years as shown below:
Statement No. 74, Financial Reporting for Postemployment Benefit Plans Other Than Pension Plans. The objective of this Statement is to improve the usefulness of information about postemployment benefits other than pensions (other postemployment benefits or OPEB) included in the general purpose external financial reports of state and local governmental OPEB plans for making decisions and assessing accountability. This Statement results from a comprehensive review of the effectiveness of existing standards of accounting and financial reporting for all postemployment benefits (pensions and OPEB) with regard to providing decision-useful information, supporting assessments of accountability and interperiod equity, and creating additional transparency. This Statement will be effective for the year ended June 30, 2017. Management does not expect this Statement to impact the District’s financial statements.
Statement No. 75, Accounting and Financial Reporting for Post-employment Benefits Other than Pensions. This Statement replaces the requirements of Statement No. 45, Accounting and FinancialReporting by Employers for Post- employment Benefits Other Than Pensions, as amended, and No. 57,
Recently Issued and Adopted Accounting Pronouncements (continued)
OPEB Measurements by Agency Employers and Agent Multi-Employer Plans, for OPEB Statement No. 74, Financial Reporting for Post-employment Benefit Plans Other Than Pension Plans, establishes new accounting and financial reporting requirements for OPEB Plans. This Statement will be effective for the year ended June 30, 2018. Management has not yet determined the potential impact on the District’s financial statements.
Statement No. 77, Tax Abatement Disclosures. This Statement requires governments that enter into tax abatement agreements to disclose information about those agreements. This Statement will be effective for the year ended June 30, 2017. Management does not expect this Statement to impact the District’s financial statements.
68

UPPER FREEHOLD REGIONAL SCHOOL DISTRICTNOTES TO THE FINANCIAL STATEMENTS (continued)
FOR THE YEAR ENDED JUNE 30, 2016
Note 1: Summary of Significant Accounting Policies (continued)
Statement No. 78, Pensions Provided through Certain Multiple-Employer Defined Benefit Pension Plans. The objective of this Statement is to address a practice issue regarding the scope and applicability of Statement No. 68, Accounting and Financial Reporting for Pensions. This Statement will be effective for the year ended June 30, 2017. Management does not expect this Statement to impact the District’s financial statements.
Statement No. 79, Certain External Investment Pools and Pool Participants. This Statement addresses accounting and financial reporting for certain external investment pools and pool participants. This Statement will be effective for the year ended June 30, 2017. Management does not expect this Statement to impact the District’s financial statements.
Statement No. 80, Blending Requirements for Certain Component Units - an amendment of GASB Statement No. 14. The objective of this Statement is to improve financial reporting by clarifying the financial statement presentation requirements for certain component units. This Statement amends the blending requirements established in paragraph 53 of Statement No. 14, The Financial Reporting Entity, as amended. This Statement will be effective for the year ended June 30, 2018. Management does not expect this Statement to impact the District’s financial statements.
Statement No. 81, Irrevocable Split-Interest Agreements. The objective of this Statement is to improve accounting and financial reporting for irrevocable split-interest agreements by providing recognition and measurement guidance for situations in which a government is a beneficiary of the agreement. This Statement will be effective for the year ended June 30, 2018. Management does not expect this Statement to impact the District’s financial statements.
Statement No. 82, Pension Issues – an amendment of GASB Statements No. 67, 68 and No. 73. The objective of this Statement is to address certain issues that have been raised with respect to Statements No. 67, Financial Reporting for Pension Plans, No. 68, Accounting and Financial Reporting for Pensions, and No. 73, Accounting and Financial Reporting for Pensions and Related Assets That Are Not within the Scope of GASB Statement 68, and Amendments to Certain Provisions of GASB Statements 67 and 68. This Statement will be effective for the year ended June 30, 2018. Management has not yet determined the potential impact on the District’s financial statements.
Bond Premiums, Discounts and Issuance Costs
In the government-wide financial statements and in the proprietary fund financial statements, bond premiums and discounts are deferred and amortized over the life of the bonds using the effective interest method. Bonds payable are reported net of the applicable bond premium or discount. Bond issuance costs are expensed when bonds are issued.
In governmental fund financial statements, bond premiums and discounts, as well as debt issuance costs are recognized in the current period. The face amount of the debt is reported as other financing sources. Premiums received on debt issuance are also reported as other financing sources. Issuance costs, whether or not withheld from the actual debt proceeds, are reported as debt service expenditures.
Deferred Loss on Refunding Debt
Deferred loss on refunding debt arising from the issuance of the refunding bonds is recorded as deferred outflows of resources. It is amortized in a systematic and rational manner over the shorter of the duration of the related debt or the new debt issues as a component of interest expense.
69

UPPER FREEHOLD REGIONAL SCHOOL DISTRICTNOTES TO THE FINANCIAL STATEMENTS (continued)
FOR THE YEAR ENDED JUNE 30, 2016
Note 1: Summary of Significant Accounting Policies (continued)
Deferred Outflows and Deferred Inflows of Resources
In addition to assets, the statement of net position will sometimes report a separate section for deferred outflows of resources. This separate financial statement element, deferred outflows of resources, represents a consumption of net position that applies to a future period(s) and so will not be recognized as an outflow of resources (expense/expenditure) until then.
In addition to liabilities, the statement of net position will sometimes report a separate section for deferred inflows of resources. This separate financial statement element, deferred inflows of resources, represents an acquisition of net position that applies to a future periods and so will not be recognized as an inflow of resources (revenue) until that time.
Subsequent Events
The District has evaluated subsequent events occurring after June 30, 2016 through the date of October 28, 2016, which is the date the financial statements were available to be issued.
Pensions Section
For purposes of measuring the net pension liability, deferred outflows of resources and deferred inflows of resources related to pensions, and pension expense, information about the pension plan’s fiduciary netposition and additions to/deductions from the plan’s fiduciary net position have been determined on the same basis as they are reported by the plan. For this purpose, benefit payments (including refunds of employee contributions) are recognized when due and payable in accordance with the benefit terms. Investments are reported at fair value.
Note 2: Cash and Cash Equivalents
The District is governed by the deposit limitations of New Jersey state law. The Deposits held at June 30, 2016 and reported at fair value are as follows:
TypeCarrying
Value
Deposits:Demand Deposits 2,944,134$
Total Deposits 2,944,134$
The District's Cash & Cash Equivalents are Reported as Follows:Governmental Fund 2,042,273$ Business-Type Activities 286,684 Fiduciary Funds 615,177
Total Cash & Cash Equivalents 2,944,134$
Custodial Credit Risk – Custodial credit risk is the risk that, in the event of a bank failure, the Board’s deposits may not be recovered. Although the Board does not have a formal policy regarding custodial credit risk, NJSA 17:9-41 et seq. requires that the governmental units shall deposit public funds in public
70
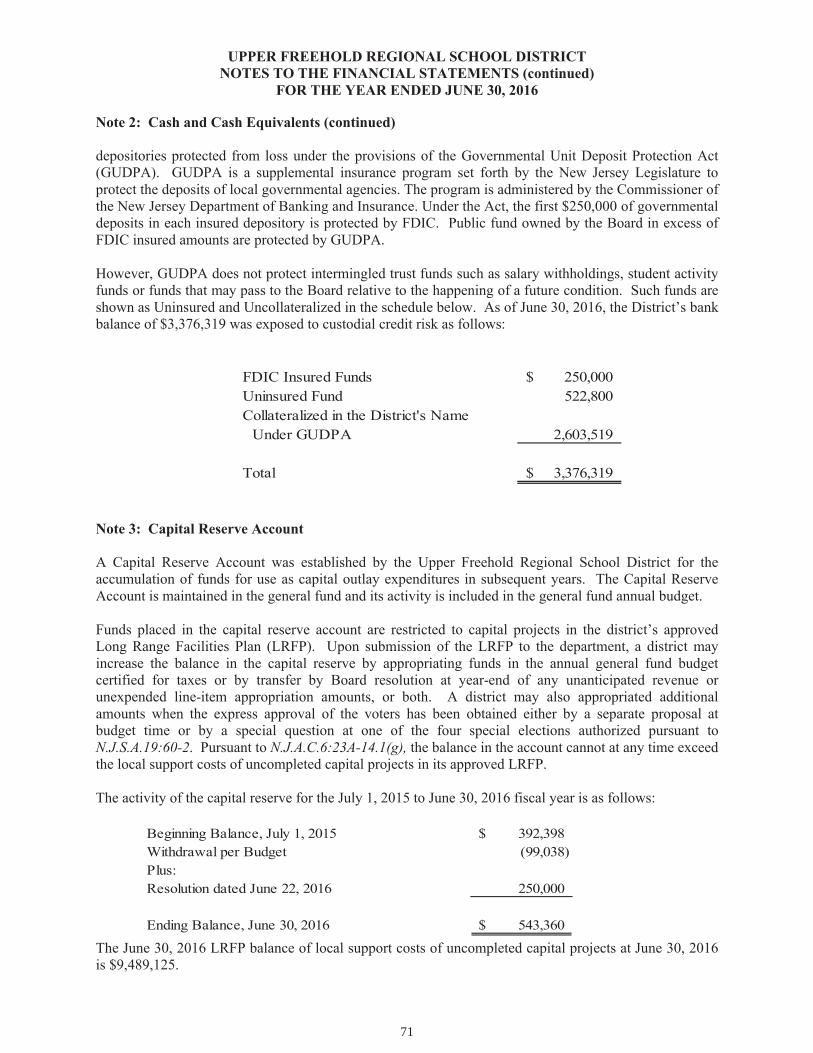
UPPER FREEHOLD REGIONAL SCHOOL DISTRICTNOTES TO THE FINANCIAL STATEMENTS (continued)
FOR THE YEAR ENDED JUNE 30, 2016
Note 2: Cash and Cash Equivalents (continued)
depositories protected from loss under the provisions of the Governmental Unit Deposit Protection Act (GUDPA). GUDPA is a supplemental insurance program set forth by the New Jersey Legislature to protect the deposits of local governmental agencies. The program is administered by the Commissioner of the New Jersey Department of Banking and Insurance. Under the Act, the first $250,000 of governmental deposits in each insured depository is protected by FDIC. Public fund owned by the Board in excess of FDIC insured amounts are protected by GUDPA.
However, GUDPA does not protect intermingled trust funds such as salary withholdings, student activity funds or funds that may pass to the Board relative to the happening of a future condition. Such funds are shown as Uninsured and Uncollateralized in the schedule below. As of June 30, 2016, the District’s bankbalance of $3,376,319 was exposed to custodial credit risk as follows:
FDIC Insured Funds 250,000$ Uninsured Fund 522,800 Collateralized in the District's Name
Under GUDPA 2,603,519
Total 3,376,319$
Note 3: Capital Reserve Account
A Capital Reserve Account was established by the Upper Freehold Regional School District for the accumulation of funds for use as capital outlay expenditures in subsequent years. The Capital Reserve Account is maintained in the general fund and its activity is included in the general fund annual budget.
Funds placed in the capital reserve account are restricted to capital projects in the district’s approved Long Range Facilities Plan (LRFP). Upon submission of the LRFP to the department, a district may increase the balance in the capital reserve by appropriating funds in the annual general fund budget certified for taxes or by transfer by Board resolution at year-end of any unanticipated revenue or unexpended line-item appropriation amounts, or both. A district may also appropriated additional amounts when the express approval of the voters has been obtained either by a separate proposal at budget time or by a special question at one of the four special elections authorized pursuant to N.J.S.A.19:60-2. Pursuant to N.J.A.C.6:23A-14.1(g), the balance in the account cannot at any time exceed the local support costs of uncompleted capital projects in its approved LRFP.
The activity of the capital reserve for the July 1, 2015 to June 30, 2016 fiscal year is as follows:
Beginning Balance, July 1, 2015 392,398$ Withdrawal per Budget (99,038) Plus:Resolution dated June 22, 2016 250,000
Ending Balance, June 30, 2016 543,360$
The June 30, 2016 LRFP balance of local support costs of uncompleted capital projects at June 30, 2016is $9,489,125.
71

UPPER FREEHOLD REGIONAL SCHOOL DISTRICTNOTES TO THE FINANCIAL STATEMENTS (continued)
FOR THE YEAR ENDED JUNE 30, 2016
Note 4: Maintenance Reserve Account
A maintenance reserve account in the amount of $150,000 was established by Board resolution on June 25, 2011. These funds may be used for specific activities necessary for the purpose of keeping a school facility open and safe for use or in its original condition, and for keeping its constituent buildings systems fully and efficiently functional and for keeping their warranties valid but cannot be used for routine or capital maintenance. The purpose of the reserve is to provide funds for anticipated expenditures required to maintain a building.
Pursuant to N.J.A.C.6A:26A-4.2 funds may be deposited into the maintenance reserve account at any time by board resolution to meet the required maintenance of the District by transferring unassigned general fund balance or by transferring excess unassigned general fund balance that is anticipated to be deposited during the current year in the advertised recapitulation of balances of the subsequent year's budget that is certified for taxes. Funds may be withdrawn from the maintenance reserve account and appropriated into the required maintenance account lines at budget time or any time during the year by Board resolution for use on required maintenance activities by school facility as reported in the comprehensive maintenance plan. Funds withdrawn from the maintenance reserve account are restricted to required maintenance appropriations and may not be transferred to any other line-item account. In any year that maintenance reserve account funds are withdrawn, unexpended required maintenance appropriations, up to the amount of maintenance reserve account funds withdrawn, shall be restored to the maintenance reserve account at year-end. At no time, shall the maintenance reserve account have a balance that exceeds four percent of the replacement cost of the current year of the District's school facilities. If the account exceeds this maximum amount at June 30, the excess shall be restricted and designated in the subsequent year's budget. The maintenance reserve account is maintained in the general fund and its activity is included in the general fund annual budget.
The activity of the maintenance reserve for the July 1, 2015 to June 30, 2016 fiscal year is as follows:
Beginning Balance, July 1, 2015 496,980$ Less:Budgeted withdrawal (196,980) Withdrawal approved January 6, 2016 (300,000) Plus:Resolution date June 22, 2016 250,000
Ending Balance, June 30, 2016 250,000$
Note 5: Emergency Reserve Account
An emergency reserve is restricted to be used to accumulate funds in accordance with N.J.S.A.18A:7F-41c(1) to finance unanticipated general fund expenditures required for a thorough and efficient education. The maximum balance permitted at any time in this reserve is the greater of $250,000 or 1 % of the general fund budget not to exceed one million dollars. Deposits may be made to the emergency reserve account which is approved by board resolution between June 1st and June 30th of any unanticipated revenue or unexpended line item appropriation or both. Withdrawals from the reserve require the approval of the commissioner unless the withdrawal is necessary to meet an increase in total health care costs in excess of four percent.
72

UPPER FREEHOLD REGIONAL SCHOOL DISTRICTNOTES TO THE FINANCIAL STATEMENTS (continued)
FOR THE YEAR ENDED JUNE 30, 2016
Note 5: Emergency Reserve Account (continued)
The District deposited $65,000 into an emergency reserve account during June 2008 pursuant to a Board resolution for use in subsequent fiscal years to finance unanticipated general fund expenditures. The emergency reserve account is maintained in the general fund and its activity is included in the general fund annual budget.
The activity of the emergency reserve for the July 1, 2015 to June 30, 2016 fiscal year is as follows:
Beginning Balance, July 1, 2015 300,000$
Ending Balance, June 30, 2016 300,000$
Note 6: Tuition Reserve Account
A tuition reserve is restricted to be used to accumulate funds in accordance with N.J.A.C. 6A:23A-14.4(a)(3) for anticipated tuition adjustments. According to N.J.A.C. 6A:23A-14.4(a)(3) permits the district to establish a tuition reserve in the general fund at June 30 by board resolution for up to 10 percent of the estimated tuition cost in the contract year for an anticipated tuition adjustment in the second year following the contract year. The code also requires that the district transfer to the general fund, by board resolution, any interest earned on the investments in a tuition reserve account on no less than an annual basis.
The District deposited $100,000 into a tuition reserve account during June 2016 pursuant to a Board resolution for use in subsequent fiscal years to finance unanticipated tuition expenditures. The tuitionreserve account is maintained in the general fund and its activity is included in the general fund annual budget.
Beginning Balance, July 1, 2015 -$ Withdrawal per Budget - Plus:Resolution date June 22, 2016 100,000
Ending Balance, June 30, 2016 100,000$
Note 7: Accounts Receivable
Accounts receivable at June 30, 2016 consisted of accounts and intergovernmental grants. All receivables are considered collectible in full due to the stable condition of state programs and the current fiscal year guarantee of federal funds. Accounts receivable as of fiscal year end for the School District’s individual major and fiduciary funds, in the aggregate, are as follows:
Ge ne ral Fund
Spe cial Re ve nue Fund
Proprie tary Fund Total
Intergovernmental 291,037$ 105,991$ 2,516$ 399,544$ Other 12,063 7,042 100 19,205
Total 303,100$ 113,033$ 2,616$ 418,749$
73

UPPER FREEHOLD REGIONAL SCHOOL DISTRICTNOTES TO THE FINANCIAL STATEMENTS (continued)
FOR THE YEAR ENDED JUNE 30, 2016
Note 8: Capital Assets
Capital asset balances and activity for the year ended June 30, 2016 were as follows:
Depreciation expense was charged to governmental and business-type functions/programs as follows:
Governmental Activities:Unallocated 2,170,480$
Total Depreciation Expense - Governmental Activites 2,170,480$
Business-Type Activities:Food Service Fund 42,684$
Total Depreciation Expense - Business-Type Activites 42,684$
June 30, June 30,Governmental Activities: 2015 Additions Deletions Adjustment 2016
Sites (Land) 5,419,448$ -$ -$ -$ 5,419,448$ Buildings & Building Improvements 78,608,310 318,386 - 78,926,696 Construction in Progress - - - - Machinery & Equipment 3,883,137 493,000 - (171,519) 4,204,618
Subtotal 87,910,895 811,386 - (171,519) 88,550,762
Accumulated Depreciation - Building & Improvements (19,495,244) (1,982,573) - (84,874) (21,562,691) Accumulated Depreciation - Machinery & Equipment (2,533,134) (187,907) - - (2,721,041)
Total 65,882,517$ (1,359,094)$ -$ (256,393)$ 64,267,030$
Business Type Activities:
Machinery & Equipment 714,115$ -$ -$ -$ 714,115$ Accumulated Depreciation (306,318) (42,684) - - (349,002)
Total 407,797$ (42,684)$ -$ -$ 365,113$
74

UPPER FREEHOLD REGIONAL SCHOOL DISTRICT NOTES TO THE FINANCIAL STATEMENTS (continued)
FOR THE YEAR ENDED JUNE 30, 2016
Note 9: Long-Term Obligations Changes in Long-Term Obligations for the year ended June 30, 2016, are as follows:
A. Bonds Payable: Bonds are authorized in accordance with State law by the voters of the municipality through referendums. All bonds are retired in serial installments within the statutory period of usefulness. Bonds issued by the Board are general obligation bonds and will be liquidated through the debt service fund. The District had bonds outstanding as of June 30, 2016 as follows:
Date of Issue
Final Maturity Interest Rate Amount
2/24/2004 11/1/2016 3.35% - 3.60% 495,000$ 2/1/2005 2/15/2032 4.00% - 4.50% 110,000
11/2/2006 2/15/2035 4.00% - 4.375% 9,560,000 7/15/2007 7/11/2017 4.375% - 4.50% 400,000 5/4/2010 7/15/2023 4.00% - 4.50% 6,490,000
7/23/2014 7/15/2032 2.00% - 5.00% 9,565,000 4/22/2015 2/15/2032 4.00% - 4.50% 22,790,000
49,410,000$ Total Principal and interest due on the District's serial bonds outstanding is as follows:
6/30/2015 6/30/2016 Due WithinBalance Additions Reductions Adjustments Amortization Balance One year
Governmental Activities:Bonds 51,370,000$ -$ 1,960,000$ -$ -$ 49,410,000$ 1,775,000$ Capital leases payable 506,572 256,000 201,186 - - 561,386 229,092 Compensated absences payable 399,872 77,708 - - - 477,580 - Bond premium 3,322,585 - - - (224,308) 3,098,277 159,050 Net Pension Liability 10,203,933 2,911,953 - - - 13,115,886 -
65,802,962$ 3,245,661$ 2,161,186$ -$ (224,308)$ 66,663,129$ 2,163,142$
75

UPPER FREEHOLD REGIONAL SCHOOL DISTRICTNOTES TO THE FINANCIAL STATEMENTS (continued)
FOR THE YEAR ENDED JUNE 30, 2016
Note 9: Long-Term Obligations (continued)
A. Bonds Payable: (continued)
On May 4, 2010, the District issued $9,175,000 refunding bonds with interest rates ranging from 3.00% to 5.00% to advance refund $9,348,000 school bonds with interest rates ranging from 4.00% to 4.75%. The refunding bonds mature on July 15, 2010 through 2023. The net proceeds from the issuance of therefunding bonds were used to purchase U.S. government securities and those securities were deposited in an irrevocable trust with an escrow agent to provide debt service payments until the school bonds were called on July 15, 2011. The advance refunding met the requirements of an in-substance debt defeasance and the school bonds were removed from the District's financial statements.
On July 23, 2014, the District issued $9,595,000 refunding bonds with interest rates ranging from 2.00% to 5.00% to advance refund $9,458,000 school bonds with interest rates ranging from 4.375% to 4.50%. The refunding bonds mature on July 15, 2015 through 2032. The net proceeds from the issuance of therefunding bonds were used to purchase U.S. government securities and those securities were deposited in an irrevocable trust with an escrow agent to provide debt service payments until the school bonds were called on July 15, 2016. The advance refunding met the requirements of an in-substance debt defeasance and the school bonds were removed from the District's financial statements.
On April 22, 2015, the District issued $23,025,000 refunding bonds with interest rates ranging from 4.00% to 4.50% to advance refund $23,090,000 school bonds with interest rates ranging from 4.00% to 4.50%. The refunding bonds mature on July 15, 2010 through 2023. The net proceeds from the issuance of the refunding bonds were used to purchase U.S. government securities and those securities were deposited in an irrevocable trust with an escrow agent to provide debt service payments until the school bonds were called on February 15, 2017. The advance refunding met the requirements of an in-substance debt defeasance and the school bonds were removed from the District's financial statements.
B. Bonds Authorized But Not Issued:
As of June 30, 2016, the Board had no bonds authorized but not issued.
Year EndedJune 30 Principal Interest Total
2017 1,775,000 2,002,364 3,777,364 2018 1,830,000 1,942,804 3,772,804 2019 1,915,000 1,867,019 3,782,019 2020 2,000,000 1,783,544 3,783,544 2021 2,090,000 1,696,344 3,786,344
2022-2026 11,970,000 7,099,613 19,069,613 2027-2031 14,945,000 4,436,281 19,381,281 2032-2035 12,885,000 1,308,100 14,193,100
49,410,000$ 22,136,069$ 71,546,069$
76

UPPER FREEHOLD REGIONAL SCHOOL DISTRICTNOTES TO THE FINANCIAL STATEMENTS (continued)
FOR THE YEAR ENDED JUNE 30, 2016
Note 9: Long-Term Obligations (continued)
C. Capital Leases Payable:
The District has purchased buses, computer, audiovisual, athletic and other equipment, and musical instruments, collectively valued at $1,142,422 under active lease agreements and has retired $581,036 of the lease principal leaving a balance of $561,386 at June 30, 2016. All of the capital leases are for terms of five years.
The schedule of the future minimum lease payments under the District's capital leases and the present value of the net minimum lease payments at June 30, 2016 is as follows:
Year Government Business TypeActivities Activities
2017 $239,405 $31,5292018 156,379 31,5292019 106,900 -2020 54,459 -2021 27,406 -
Subtotal 584,549 63,058Less: Amount representing interest (23,164) (749)Present value of net minimum lease payments $561,385 $ 62,309
The Government Activities and Business Type Activities present value of capital leases payable at June 30, 2016 is $229,092 and $30,917 and the long-term portion is $332,293 and $31,392, respectively. TheGeneral Fund will be used to liquidate capital leases payable.
D. Compensated Absences:
The liability for compensated absences of the governmental fund types is recorded in the current and long-term liabilities and will be liquidated by the General Fund. The liability at June 30, 2016 is $477,580 all of which is a long-term liability.
The liability for vested compensated absences of the proprietary fund types is recorded within those fundsas the benefits accrue to employees. As of June 30, 2016 no liability existed for compensated absences in the Proprietary Funds.
Note 10: Pension Obligations
A. Public Employees’ Retirement System (PERS)
Plan Description - The State of New Jersey, Public Employees' Retirement System (PERS) is a cost-sharing multiple-employer defined benefit pension plan administered by the State of New Jersey, Division of Pensions and Benefits (the Division). For additional information about PERS, please refer to Division's Comprehensive Annual Financial Report (CAFR) which can be found at www.state.nj.us/treasury/pensions/annrprts.shtml.
77

UPPER FREEHOLD REGIONAL SCHOOL DISTRICTNOTES TO THE FINANCIAL STATEMENTS (continued)
FOR THE YEAR ENDED JUNE 30, 2016
Note 10: Pension Obligations (continued):
A. Public Employees’ Retirement System (PERS) (continued):
The vesting and benefit provisions are set by N.J.S.A. 43:15A. PERS provides retirement, death and disability benefits. All benefits vest after ten years of service, except for medical benefits, which vest after 25 years of service or under the disability provisions of PERS.
The following represents the membership tiers for PERS:
Tier Definition 1 Members who were enrolled prior to July 1, 2007 2 Members who were eligible to enroll on or after July 1, 2007 and prior to November 2, 2008 3 Members who were eligible to enroll on or after November 2, 2008 and prior to May 22, 2010 4 Members who were eligible to enroll on or after May 22, 2010 and prior to June 28, 2011 5 Members who were eligible to enroll on or after June 28, 2011
Service retirement benefits of 1/55th of final average salary for each year of service credit is available to tiers 1 and 2 members upon reaching age 60 and to tier 3 members upon reaching age 62. Service retirement benefits of 1/60th of final average salary for each year of service credit is available to tier 4 members upon reaching age 62 and tier 5 members upon reaching age 65. Early retirement benefits are available to tiers 1 and 2 members before reaching age 60, tiers 3 and 4 before age 62 with 25 or more years of service credit and tier 5 with 30 or more years of service credit before age 65. Benefits are reduced by a fraction of a percent for each month that a member retires prior to the age at which a member can receive full early retirement benefits in accordance with their respective tier. Tier 1 members can receive an unreduced benefit from age 55 to age 60 if they have at least 25 years of service. Deferred retirement is available to members who have at least 10 years of service credit and have not reached the service retirement age for the respective tier.
Basis of Presentation - The schedules of employer allocations and the schedules of pension amounts by employer (collectively, the Schedules) present amounts that are considered elements of the financial statements of PERS or its participating employers. Accordingly, they do not purport to be a complete presentation of the financial position or changes in financial position of PERS or the participating employers. The amounts presented in the Schedules were prepared in accordance with U.S. generally accepted accounting principles. Such preparation requires management of PERS to make a number of estimates and assumptions relating to the reported amounts. Due to the inherent nature of these estimates, actual results could differ from those estimates.
Contributions - The contribution policy for PERS is set by N.J.S.A. 15A and requires contributions by active members and contributing employers. State legislation has modified the amount that is contributed by the State. The State's pension contribution is based on an actuarially determined amount which includes the employer portion of the normal cost and an amortization of the unfunded accrued liability. Funding for noncontributory group insurance benefits is based on actual claims paid. For fiscal year 2014 and 2013, the State's pension contribution was less than the actuarial determined amount. The local employers' contribution amounts are based on an actuarially determined rate which includes the normalcost and unfunded accrued liability. Chapter 19, P.L. 2009 provided an option for local employers of PERS to contribute 50% of the normal and accrued liability contribution amounts certified for payments due in State fiscal year 2009. Such employers will be credited with the full payment and any such amounts will not be included in their unfunded liability. The actuaries will determine the unfunded liability of those retirement systems, by employer, for the reduced normal and accrued liability contributions provided under this law. This unfunded liability will be paid by the employer in level annual
78

UPPER FREEHOLD REGIONAL SCHOOL DISTRICTNOTES TO THE FINANCIAL STATEMENTS (continued)
FOR THE YEAR ENDED JUNE 30, 2016
Note 10: Pension Obligations (continued):
A. Public Employees’ Retirement System (PERS) (continued):
payments over a period of 15 years beginning with the payments due in the fiscal year ended June 30, 2012 and will be adjusted by the rate of return on the actuarial value of assets.
Components of Pension Liability - At June 30, 2016, the District reported a liability of $13,115,886 for its proportionate share of the PERS net pension liability. The net pension liability was measured as of June 30, 2015. The total pension liability used to calculate the net pension liability was determined using update procedures to roll forward the total pension liability from an actuarial valuation as of July 1, 2014, to the measurement date of June 30, 2015. The District’s proportion of the net pension liability was based on the District’s actual contributions to the plan relative to the total of all participating employers’ contributions for the year ended June 30, 2015. The District’s proportion measured as of June 30, 2015, was 0.05843% percent, which was an increase of 0.00393% from its proportion measured as of June 30, 2014.
Pension Expense and Deferred Outflows/Inflows of Resources - For the year ended June 30, 2016, the District recognized pension expense of $973,723. At June 30, 2016, the District reported deferred outflows of resources and deferred inflows of resources related to PERS from the following sources:
Percentage NetYear Pension of APC Pension
Funding Cost (APC) Contributed Obligation
6/30/2016 502,323$ 100% 13,115,886$ 6/30/2015 449,292$ 100% 10,203,933$ 6/30/2014 424,576$ 100% 10,769,358$
6/30/2016 6/30/2015Actuarial valuation date (including roll forward) June 30, 2015 June 30, 2014
Deferred Outflows of Resources 2,345,324$ 770,158$ Deferred Inflows of Resources 454,443$ 906,523$ Net Pension Liability 13,115,886$ 10,203,933$
District's portion of the Plan's total net pension Liability 0.05843% 0.05450%
Collective Balances at June 30, 2016 and June 30, 2015
79

UPPER FREEHOLD REGIONAL SCHOOL DISTRICTNOTES TO THE FINANCIAL STATEMENTS (continued)
FOR THE YEAR ENDED JUNE 30, 2016
Note 10: Pension Obligations (continued):
A. Public Employees’ Retirement System (PERS) (continued):
The $2,345,324 reported as deferred outflows of resources related to pensions resulting from school district contributions subsequent to the measurement date (i.e. for the school year ending June 30, 2015, the plan measurement date is June 30, 2014) will be recognized as a reduction of the net pension liability in the year ended June 30, 2015. Other amounts reported as deferred outflows of resources and deferred inflows of resources related to pensions will be recognized in pension expense as follows:
Actuarial Assumptions - The total pension asset/(liability) as of the measurement date was determined by using an actuarial valuation as noted in the table below, with update procedures used to roll forward the total pension liability to the measurement date. The actuarial valuations used the following actuarial assumptions:
Deferred Outflows Deferred Inflowsof Resources of Resources
Changes of assumptions 1,408,541$ -$
Net difference between expected and actual 312,899 - experience
Net difference between projected and actualearnings on pension plan investments - 210,878
Changes in proportion and differencesbetween District contributions and proportionateshare of contributions 623,884 243,565
Total 2,345,324$ 454,443$
Year Ended June 30: PERS
2017 354,318$ 2018 354,318 2019 354,318 2020 506,343 2021 321,584
Thereafter -
80
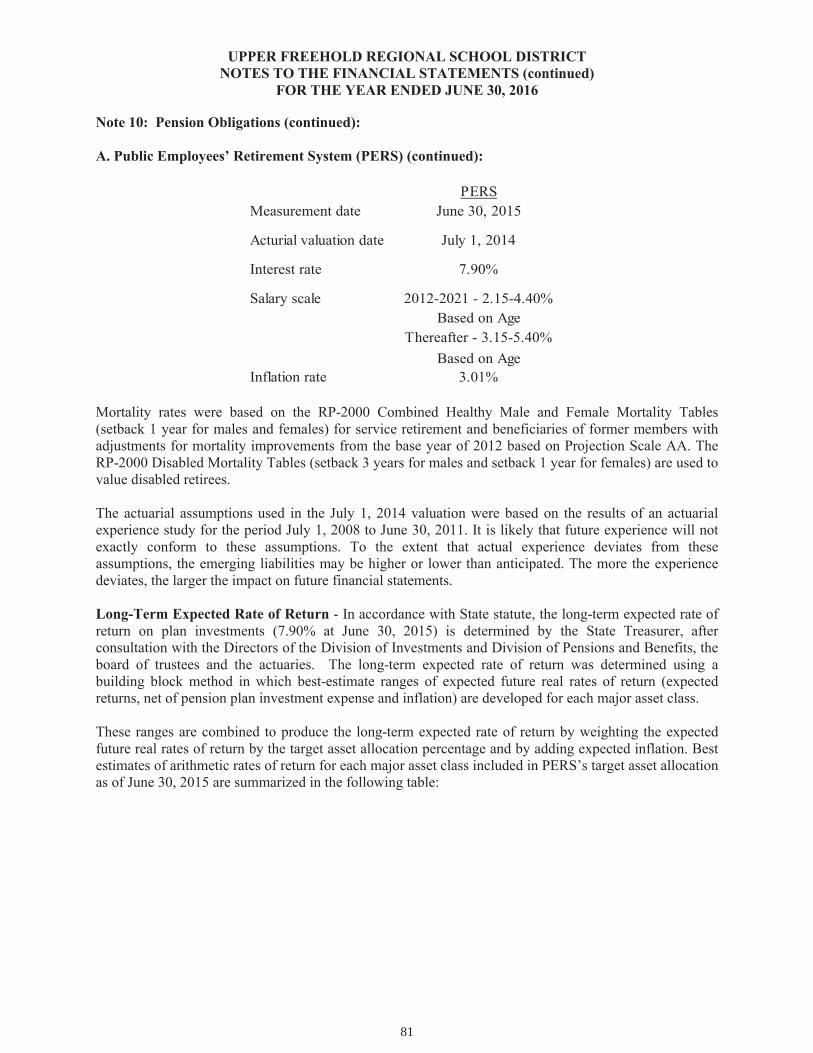
UPPER FREEHOLD REGIONAL SCHOOL DISTRICTNOTES TO THE FINANCIAL STATEMENTS (continued)
FOR THE YEAR ENDED JUNE 30, 2016
Note 10: Pension Obligations (continued):
A. Public Employees’ Retirement System (PERS) (continued):
PERSMeasurement date June 30, 2015
Acturial valuation date July 1, 2014
Interest rate 7.90%
Salary scale 2012-2021 - 2.15-4.40%Based on Age
Thereafter - 3.15-5.40%Based on Age
Inflation rate 3.01%
Mortality rates were based on the RP-2000 Combined Healthy Male and Female Mortality Tables (setback 1 year for males and females) for service retirement and beneficiaries of former members with adjustments for mortality improvements from the base year of 2012 based on Projection Scale AA. The RP-2000 Disabled Mortality Tables (setback 3 years for males and setback 1 year for females) are used to value disabled retirees.
The actuarial assumptions used in the July 1, 2014 valuation were based on the results of an actuarial experience study for the period July 1, 2008 to June 30, 2011. It is likely that future experience will not exactly conform to these assumptions. To the extent that actual experience deviates from these assumptions, the emerging liabilities may be higher or lower than anticipated. The more the experience deviates, the larger the impact on future financial statements.
Long-Term Expected Rate of Return - In accordance with State statute, the long-term expected rate of return on plan investments (7.90% at June 30, 2015) is determined by the State Treasurer, after consultation with the Directors of the Division of Investments and Division of Pensions and Benefits, the board of trustees and the actuaries. The long-term expected rate of return was determined using a building block method in which best-estimate ranges of expected future real rates of return (expected returns, net of pension plan investment expense and inflation) are developed for each major asset class.
These ranges are combined to produce the long-term expected rate of return by weighting the expected future real rates of return by the target asset allocation percentage and by adding expected inflation. Best estimates of arithmetic rates of return for each major asset class included in PERS’s target asset allocation as of June 30, 2015 are summarized in the following table:
81

UPPER FREEHOLD REGIONAL SCHOOL DISTRICTNOTES TO THE FINANCIAL STATEMENTS (continued)
FOR THE YEAR ENDED JUNE 30, 2016
Note 10: Pension Obligations (continued):
A. Public Employees’ Retirement System (PERS) (continued):
Discount Rate - The discount rate used to measure the total pension liability was 4.90% as of June 30, 2015. The single blended discount rate was based on long-term expected rate of return on pension plan investments of 7.90%, and a municipal bond rate of 3.80% as of June 30, 2015, based on the Bond Buyer Go 20-Bond Municipal Bond Index which includes tax-exempt general obligation municipals bonds with an average rating of AA/Aa or higher. The projection of cash flows used to determine the discount rate assumed that contributions from plan members will be made at the current member contribution rates and that contributions from employers will be made based on the average of the last five years of contributions made in relation to the last five years of actuarially determined contributions. Based on those assumptions, the plan’s fiduciary net position was projected to be available to make projected future benefit payments of current plan members through 2033. Therefore, the long-term expected rate of return on plan investments was applied to projected benefit payments through 2033, and the municipal bond rate was applied to projected benefit payments after that date in determining the total pension liability.
Sensitivity of the District’s proportionate share of the Net Pension Liability to Changes in the Discount Rate - The following presents the District’s proportionate share of the net pension liability calculated using the discount rate as disclosed above, as well as what the District’s proportionate share of the net pension liability would be if it were calculated using a discount rate that is 1-percentage-point lower (3.90) or 1-percentage-point higher (5.90%) than the current rate:
Target Long-Term ExpectedAsset Class Allocation Real Rate of Return
Cash 5.00% 1.04%U.S. Treasuries 1.75% 1.64%Investment Grade Credit 10.00% 1.79%Mortgages 2.10% 1.62%High Yield Bonds 2.00% 4.03%Inflation-Indexed Bonds 1.50% 3.25%Broad US Equities 27.25% 8.52%Developed Foreign Equities 12.00% 6.88%Emerging Market Equities 6.40% 10.00%Private Equity 9.25% 12.41%Hedge Funds/Absolute Return 12.00% 4.72%Real Estate (Property) 2.00% 6.83%Commodities 1.00% 5.32%Global Debt ex US 3.50% -0.40%REIT 4.25% 5.21%
Total 100.00%
1% Current 1%Decrease Discount Increase(3.90%) Rate (4.90%) (5.90%)
District's proportionate share ofthe net pension liability 16,301,442$ 13,115,886$ 10,445,140$
82

UPPER FREEHOLD REGIONAL SCHOOL DISTRICTNOTES TO THE FINANCIAL STATEMENTS (continued)
FOR THE YEAR ENDED JUNE 30, 2016
Note 10: Pension Obligations (continued):
B. Teachers’ Pension and Annuity Fund (TPAF)
Plan Description - The State of New Jersey, Teachers' Pension and Annuity Fund (TPAF) is a cost sharing multiple-employer defined benefit pension plan with a special-funding situation, by which the State of New Jersey (the State) is responsible to fund 100% of the employer contributions, excluding any local employer early retirement incentive (ERI) contributions. TPAF is administered by the State of New Jersey, Division of Pensions and Benefits (the Division). For additional information about TPAF, please refer to Division's Comprehensive Annual Financial Report (CAFR) which can be found at www.state.nj.us/treasury/pensions/annrprts.shtml.
The vesting and benefit provisions are set by N.J.S.A. 18A:66. TPAF provides retirement, death and disability benefits. All benefits vest after ten years of service, except for medical benefits, which vest after 25 years of service or under the disability provisions of TPAF. Members are always fully vested for their own contributions and, after three years of service credit, become vested for 2% of related interest earned on the contributions. In the case of death before retirement, members' beneficiaries are entitled to full interest credited to the members' accounts.
The following represents the membership tiers for TPAF:
Tier Definition 1 Members who were enrolled prior to July 1, 2007 2 Members who were eligible to enroll on or after July 1, 2007 and prior to November 2, 2008 3 Members who were eligible to enroll on or after November 2, 2008 and prior to May 22, 2010 4 Members who were eligible to enroll on or after May 22, 2010 and prior to June 28, 2011 5 Members who were eligible to enroll on or after June 28, 2011
Service retirement benefits of 1/55th of final average salary for each year of service credit is available to tiers 1 and 2 members upon reaching age 60 and to tier 3 members upon reaching age 62. Service retirement benefits of 1/60th of final average salary for each year of service credit is available to tier 4 members upon reaching age 62 and tier 5 members upon reaching age 65. Early retirement benefits are available to tiers 1 and 2 members before reaching age 60, tiers 3 and 4 before age 62 with 25 or more years of service credit, and tier 5 before age 65 with 30 or more years of service credit. Benefits are reduced by a fraction of a percent for each month that a member retires prior to the retirement age for his/her respective tier. Deferred retirement is available to members who have at least 10 years of service credit and have not reached the service retirement age for the respective tier.
Basis of Presentation - The schedules of employer and nonemployer allocations and the schedules of pension amounts by employer and nonemployer (collectively, the Schedules) present amounts that are considered elements of the financial statements of TPAF and the State as an employer/nonemployer entity. Accordingly, they do not purport to be a complete presentation of the financial position or changes in financial position of TPAF or the State. The amounts presented in the Schedules were prepared in accordance with U.S. generally accepted accounting principles. Such preparation requires management of TPAF to make a number of estimates and assumptions relating to the reported amounts. Due to the inherent nature of these estimates, actual results could differ from those estimates.
Contributions - The contribution policy for TPAF is set by N.J.S.A 18A:66 and requires contributions by active members and contributing employers. State legislation has modified the amount that is contributed by the State. The State's pension contribution is based on an actuarially determined amount which includes the employer portion of the normal cost and an amortization of the unfunded accrued liability.
83

UPPER FREEHOLD REGIONAL SCHOOL DISTRICTNOTES TO THE FINANCIAL STATEMENTS (continued)
FOR THE YEAR ENDED JUNE 30, 2016
Note 10: Pension Obligations (continued):
B. Teachers’ Pension and Annuity Fund (TPAF)
Funding for noncontributory group insurance benefits is based on actual claims paid. For fiscal year 2015, the State's pension contribution was less than the actuarial determined amount.
Special Funding Situation - The employer contributions for local participating employers are legally required to be funded by the State in accordance with N.J.S.A 18:66-33. Therefore, these local participating employers are considered to be in a special funding situation as defined by GASB Statement No. 68 and the State is treated as a nonemployer contributing entity. Since the local participating employers do not contribute directly to the plan (except for employer specific financed amounts), there is no net pension liability or deferred outflows or inflows to report in the financial statements of the local participating employers. However, the notes to the financial statements of the local participating employers must disclose the portion of the nonemployer contributing entities' total proportionate share of the net pension liability that is associated with the local participating employer.
Teachers Pensions and Annuity Fund (TPAF) - For purposes of measuring the net pension liability, deferred outflows of resources and deferred inflows of resources related to pensions, and pension expense, information about the fiduciary net position of the Teachers Pension and Annuity Fund (TPAF) and additions to/deductions from the TPAF’s fiduciary net position have been determined on the same basis as they are reported by the TPAF. For this purpose, benefit payments (including refunds of employee contributions) are recognized when due and payable in accordance with the benefit terms. Investments are reported at fair value.
TPAFMeasurement date June 30, 2015
Acturial valuation date July 1, 2014
Interest rate 7.90%
Salary scale
Inflation rate 2.50%
Varies Based On Experience
Percentage NetYear Pension of APC Pension
Funding Cost (APC) Contributed Obligation
6/30/2016 2,805,325$ 100% -$ 6/30/2015 2,156,756$ 100% -$ 6/30/2014 1,787,581$ 100% -$
Three-Year Trend Information for TPAF & Post Retirement Medical Contributions(Paid on behalf of the District)
84

UPPER FREEHOLD REGIONAL SCHOOL DISTRICTNOTES TO THE FINANCIAL STATEMENTS (continued)
FOR THE YEAR ENDED JUNE 30, 2016
Note 10: Pension Obligations (continued):
B. Teachers’ Pension and Annuity Fund (TPAF)
Mortality rates were based on the RP-2000 Health Annuitant Mortality Table for Males or Females, as appropriate, with adjustments for mortality improvements based on Scale AA. Pre-retirement mortality improvements for active members are projected using Scale AA from the base year of 2000 until the valuation date plus 15 years to account for future mortality improvement. Post-retirement mortality improvements for non-disabled annuitants are projected using Scale AA from the base year of 2000 for males and 2003 for females until the valuation date plus 7 years to account for future mortality improvement.
The actuarial assumptions used in the July 1, 2014 valuation were based on the results of an actuarial experience study for the period July 1, 2009 to June 30, 2012.
Long-Term Expected Rate of Return - In accordance with State statute, the long-term expected rate of return on plan investments (7.90% at June 30, 2015) is determined by the State Treasurer, after consultation with the Directors of the Division of Investments and Division of Pensions and Benefits, the board of trustees and the actuaries. The long-term expected rate of return was determined using a building block method in which best-estimate ranges of expected future real rates of return (expected returns, net of pension plan investment expense and inflation) are developed for each major asset class. These ranges are combined to produce the long-term expected rate of return by weighting the expected future real rates of return by the target asset allocation percentage and by adding expected inflation. Best estimates of arithmetic real rates of return for each major asset class included in TPAF's target asset allocation as of June 30, 2015 are summarized in the following table:
Target Long-Term ExpectedAsset Class Allocation Real Rate of Return
US Cash 5.00% 0.53%US Government Bonds 1.75% 1.39%US Credit Bonds 13.50% 2.72%US Mortgages 2.10% 2.54%US Inflation-Indexed Bonds 1.50% 1.47%US High Yield Bonds 2.00% 4.57%US Equity Market 27.25% 5.63%Foreign-Developed Equity 12.00% 6.22%Emerging Market Equities 6.40% 8.46%Private Real Estate Property 4.25% 3.97%Timber 1.00% 4.09%Farmland 1.00% 4.61%Private Equity 9.25% 9.15%Commodities 1.00% 3.58%Hedge Funds - MultiStrategy 4.00% 4.59%Hedge Funds - Equity Hedge 4.00% 5.68%Hedge Funds - Distressed 4.00% 4.30%
Total 100%
85

UPPER FREEHOLD REGIONAL SCHOOL DISTRICTNOTES TO THE FINANCIAL STATEMENTS (continued)
FOR THE YEAR ENDED JUNE 30, 2016
Note 10: Pension Obligations (continued):
B. Teachers’ Pension and Annuity Fund (TPAF)
Discount Rate - The discount rate used to measure the total pension liability was 4.13% as of June 30, 2015. The single blended discount rate was based on long-term expected rate of return on pension plan investments of 7.90%, and a municipal bond rate of 3.80% as of June 30, 2015, based on the Bond Buyer Go 20-Bond Municipal Bond Index which includes tax-exempt general obligation municipals bonds with an average rating of AA/Aa or higher. The projection of cash flows used to determine the discount rate assumed that contributions from plan members will be made at the current member contribution rates and that contributions from employers will be made based on the average of the last five years of employers’ contributions. Based on those assumptions, the plan’s fiduciary net position was projected to be available to make projected future benefit payments of current plan members through 2027. Therefore, the long-term expected rate of return on plan investments was applied to projected benefit payments through 2027, and the municipal bond rate was applied to projected benefit payments after that date in determining the total pension liability.
Pension plan fiduciary net position - Detailed information about the pension plan’s fiduciary net position is available in the separately issued PERS & TPAF financial report.
Note 11: Post-Retirement Benefits
Chapter 384 of Public Laws 1987 and Chapter 6 of Public Laws 1990 required Teachers’ Pensions and Annuity Fund (TPAF) and the Public Employees’ Retirement System (PERS), respectively, to fund post-retirement medical benefits for those State Employees who retire after accumulating 25 years of credited service or on a disability retirement. P.L. 2007, c.103 amended the law to eliminate the funding of post-retirement medical benefits through the TPAF and PERS. It created separate funds outside of the pensionplans for the funding and payment of post-retirement medical benefits for retired State employees and retired educational employees. As of June 30, 2016, there were 100,134 retirees eligible for post-retirement medical benefits. The cost of these benefits is funded through contributions by the State in accordance with P.L. 1994, c.62. Funding of post-retirement medical premiums changed from a prefunding basis to a pay-as-you-go basis beginning in Fiscal Year 1994.
The State is also responsible for the cost attributable to P.L. 1992, c.126, which provides free health benefits to members of PERS and the Alternate Benefit Program who retired from a board of education or county college with 25 years of service. The State paid $241.1 million toward Chapter 126 benefits for 19,056 eligible retired members in Fiscal Year 20154.
Note 12: Risk Management
The District is exposed to various risks of loss related to torts; theft of, damage to and destruction of assets; errors and omissions; injuries to employees; and natural disasters. The District has health benefits coverage for its employees under the State Employees’ Health Benefit Plan.
Property and Liability Insurance
The Upper Freehold Regional School District is a member of the School Alliance Insurance Fund (the "Fund"). The Fund provides general liability, workers' compensation, property and automobile coverage for its members. A complete schedule of insurance coverage can be found in the Statistical Section of this Comprehensive Annual Financial Report. The Fund is a risk-sharing public entity risk pool that is an
86

UPPER FREEHOLD REGIONAL SCHOOL DISTRICTNOTES TO THE FINANCIAL STATEMENTS (continued)
FOR THE YEAR ENDED JUNE 30, 2016
Note 12: Risk Management (continued)
insured and self-administered group of school boards established for the purpose of providing low-cost insurance for their respective members in order to keep local property taxes to a minimum. Each memberappoints an official to represent their respective entity for the purpose of creating a governing body from which officers for the Fund are elected.
As a member of the Fund, the District could be subject to supplemental assessments in the event of deficiencies. If the assets of the Fund were to be exhausted, members would become responsible for their respective shares of the Fund's liabilities. The Fund can declare and distribute dividends to members upon approval of the State of New Jersey Department of Banking and Insurance. These distributions are divided among the members in the same ratio as their individual assessment related to the total assessment of the membership body.
Financial statements for the Fund are available at the Fund's Executive Director's Office:
Public Entity Group Administrative Services51 Everett Drive, Suite B-40West Windsor, NJ 08550(609) 275-1155
New Jersey Unemployment Compensation Insurance – The District has elected to fund their New Jersey Unemployment Compensation Insurance under the “Benefit Reimbursement Method”. Under this plan the District is required to reimburse the New Jersey Unemployment Trust Fund for benefits paid to its former employees and charged to its account with the State. The District is billed quarterly for amounts due to the State. The following is a summary of School District contributions, reimbursements to the State for benefits paid and the ending balance of the School District’s expendable trust fund for the current and previous two years:
Fiscal YearDistrict
ContributionsEmployee
ContributionsAmount
ReimbursedEnding Balance
2015-2016 -$ 51,483$ 99,431$ 219,433$ 2014-2015 - 51,523 51,458 267,381 2013-2014 - 94,801 59,920 267,316
Note 13: Contingent Liabilities
Litigation
The Board is periodically involved in claims and lawsuits arising in the normal course of business, including issues regarding special education. The Board does not believe that the ultimate outcome of these claims will have a material adverse effect on the District's financial position.
Grant Programs
The District participates in federally and state assisted grant programs. These programs are subject to program compliance audits by the grantors or their representatives. The District is potentially liable for expenditures which may be disallowed pursuant to the terms of these grant programs. Management of the
87

UPPER FREEHOLD REGIONAL SCHOOL DISTRICTNOTES TO THE FINANCIAL STATEMENTS (continued)
FOR THE YEAR ENDED JUNE 30, 2016
Note 13: Contingent Liabilities (continued)
District is not aware of any material items of noncompliance which would result in the disallowance of grant program expenditures.
Note 14: Economic Dependency
The District receives a substantial amount of its support from federal and state governments. A significant reduction in the level of support, if this were to occur, could have an effect on the District’s programs and activities.
Note 15: Deferred Compensation
The Board offers its employees a choice of the following deferred compensation plans created in accordance with Internal Revenue Code Section 403(b). The plans, which are administered by the entities listed below, permits participants to defer a portion of their salary until future years. Amounts deferred under the plans are not available to employees until termination, retirement, death or unforeseeable emergency. The plan administrators are as follows:
Equitable Life Assurance OppenheimerVariable Annuity Life Insurance Company SiracusaLincoln Investment LegendMetropolitan Life Insurance Company
Note 16: Compensated Absences
The District accounts for compensated absences (e.g., unused vacation, sick leave) as directed by Governmental Accounting Standards Board Statement No. 16 (GASB 16), “Accounting for Compensated Absences”. A liability for compensated absences attributable to services already rendered and not District employees are granted vacation and sick leave in varying amounts under the District's personnel policies. In the event of termination, an employee is reimbursed for accumulated vacation. Sick leave benefits provide for specified dollar amount per sick day accumulated and begin vesting with the employee after one year of service.
The liability for vested compensated absences of the governmental fund types is recorded in the statement of net position under governmental activities. The current portion of the compensated absence balance is not considered material to the applicable funds total liabilities, and is therefore not shown separately from the long-term liability balance of compensated absences. The amount at June 30, 2016 is $477,580.
The liability for vested compensated absences of the proprietary fund types is recorded within those funds as the benefits accrue to employees. As of June 30, 2016 no liability existed for compensated absences in the proprietary fund types.
Note 17: Fund Balance
General Fund – [Exhibit B-1] - Of the $2,131,952 General Fund fund balance at June 30, 2016, $263,233 is reserved for encumbrances; $100,000 has been legally reserved for tuition adjustment in accordance with N.J.A.C. 6A:23A-3.1(f)(8); $160,000 is reserved as excess surplus in accordance with N.J.S.A. 18A:7F-7; $97,692 is reserved as excess surplus designated for subsequent year’s expenditures; $162,580 has been assigned to designated for subsequent year’s expenditures; $543,360 has been reserved in the Capital Reserve Account; $250,000 has been reserved in the Maintenance Reserve Account;
88

UPPER FREEHOLD REGIONAL SCHOOL DISTRICTNOTES TO THE FINANCIAL STATEMENTS (continued)
FOR THE YEAR ENDED JUNE 30, 2016
Note 17: Fund Balance (continued)
$300,000 has been reserved in the Emergency Reserve Account; and $255,087 is unreserved and undesignated.
Debt Service Fund – Of the Debt Service Fund fund balance at June 30, 2016, all of the $66,189 was reserved in accordance with N.J.S.A. 7F-41c(2).
Note 18: Deficit Unrestricted Net Position
As reflected on Exhibit A-1, Statement of Net position, a deficit in unrestricted net position of $(8,970,445) existed as of June 30, 2016 for governmental activities. The primary causes of this deficit is the District not recognizing the receivable for the last two state aid payments and the recording of the long-term liability for compensated absences and net pension. In accordance with full accrual accounting, which is the basis of accounting for Exhibit A-1, Statement of Net position, such liabilities are required to be recorded in the period in which they are incurred. However, in accordance with the rules and regulations that govern the District in the formulation of their annual budget (see Note 1), compensated absences and pension liabilities that relate to future services, or that are contingent on a specific event outside the control of the District and its employees, are funded in the period in which such services are rendered or in which such events take place. Therefore, this deficit in unrestricted net position for governmental activities does not indicate that the District is facing financial difficulties.
Note 19: Calculation of Excess Surplus
In accordance with N.J.S.A.18A:7F-7, as amended by P.L. 2004, c.73 (S1701), the designation for Reserved Fund Balance – Excess Surplus is a required calculation pursuant to the New Jersey Comprehensive Educational Improvement and Financing Act of 1996 (CEIFA). New Jersey school districts are required to reserve General Fund fund balance at the fiscal year-end of June 30 if they did not appropriate a required minimum amount as budgeted fund balance in their subsequent years’ budget. The excess fund balance at June 30, 2016 is $160,000. This represents a $62,308 increase from the prior year.
Note 20: Subsequent Event
On October 19, 2016 the district adopted a resolution approving the refunding of the 2006 bonds, in amount not to exceed $9,860,000.
89

restricted and unrestricted net assets are available and have determined that net assets were properly recognized under the policy.
42) We acknowledge our responsibility for the required supplementary information (RSI). The RSI is measured and presented within prescribed guidelines and the methods of measurement and presentation have not changed from those used in the prior period. We have disclosed to you any significant assumptions and interpretations underlying the measurement and presentation of the RSI.
Signature: Signature:
Title: Title:
RESERVED FOR MD&A LETTER
90

REQUIRED SUPPLEMENTARY INFORMATION - PART II
91

This page intentionally left blank
92
C. Budgetary Comparison Schedules
93

This page intentionally left blank
94

EXHIBIT C-1
POSITIVE/(NEGATIVE)
ACCOUNT ORIGINAL BUDGET FINAL FINAL TONUMBERS BUDGET TRANSFERS BUDGET ACTUAL ACTUAL
Revenues: Local Sources: Local Tax Levy 10-1210 20,937,139$ -$ 20,937,139$ 20,937,139$ -$ Tuition from Individuals 10-1310 64,450 - 64,450 95,730 31,280 Tuition 10-1320 8,290,444 - 8,290,444 8,290,985 541 Transportation from Individuals 10-1410 60,930 - 60,930 53,992 (6,938) Transportation 10-1420-1440 - - - 8,712 8,712 Rents and Royalties 10-1910 - 5,000 5,000 11,018 6,018 Miscellaneous Revenues 10-1XXX 191,230 (5,000) 186,230 240,141 53,911
Total Local Sources 29,544,193 - 29,544,193 29,637,717 93,524
State Sources: School Choice Aid 10-3116 1,151,850 - 1,151,850 1,151,850 -
Extraordinary Aid 10-3131 150,000 - 150,000 226,659 76,659 Categorical Special Education Aid 10-3132 976,240 - 976,240 976,240 - Equalization Aid 10-3176 2,954,308 - 2,954,308 2,954,308 - Categorical Security Aid 10-3177 122,431 - 122,431 122,431 - Categorical Transportation Aid 10-3121 383,459 - 383,459 383,459 - Non-Public Transportation Aid 10-3XXX - - - 6,264 6,264 PARCC Readiness Aid 10-3XXX 17,005 - 17,005 17,005 - Per Pupil Growth Aid 10-3XXX 17,005 - 17,005 17,005 - Nonbudgeted: Reimbursed TPAF Social Security - 1,181,795 1,181,795 On-Behalf TPAF Pension Contribution - 1,253,399 1,253,399 On-Behalf TPAF Pension Contribution - Post Retirement Medical - 1,492,452 1,492,452 On-Behalf TPAF Pension Contribution- NCGI - 59,474 59,474
Total State Sources 5,772,298 - 5,772,298 9,842,341 4,070,043
Total Revenues 35,316,491 - 35,316,491 39,480,058 4,163,567
Expenditures: Current Expense: Instruction - Regular Programs: Salaries of Teachers:
Kindergarten 11-110-100-101 154,512 (24,496) 130,016 129,993 23 Grades 1-5 11-120-100-101 2,127,553 17,802 2,145,355 2,145,097 258
Grades 6 - 8 11-130-100-101 1,940,958 262,561 2,203,519 2,203,519 - Grades 9 - 12 11-140-100-101 5,786,033 (44,064) 5,741,969 5,741,963 6 Home Instruction: Salaries of Teachers 11-150-100-101 13,000 1,176 14,176 14,176 - Purchased Professional - Educational Services 11-150-100-320 18,000 (12,726) 5,274 3,924 1,350 Regular Programs - Undistributed Instruction:
Other Salaries for Instruction 11-190-100-106 28,960 (17,276) 11,684 11,684 - Other Purchased Services 11-190-100-500 400,163 (66,802) 333,361 312,683 20,678 General Supplies 11-190-100-610 410,882 26,858 437,740 416,551 21,189 Textbooks 11-190-100-640 57,316 19,044 76,360 74,499 1,861 Other Objects 11-190-100-800 26,300 (2,442) 23,858 18,904 4,954
Total Regular Programs 10,963,677 159,635 11,123,312 11,072,993 50,319
UPPER FREEHOLD REGIONAL SCHOOL DISTRICTGENERAL FUND
BUDGETARY COMPARISON SCHEDULEFOR THE FISCAL YEAR ENDED JUNE 30, 2016
95

EXHIBIT C-1
POSITIVE/(NEGATIVE)
ACCOUNT ORIGINAL BUDGET FINAL FINAL TONUMBERS BUDGET TRANSFERS BUDGET ACTUAL ACTUAL
UPPER FREEHOLD REGIONAL SCHOOL DISTRICTGENERAL FUND
BUDGETARY COMPARISON SCHEDULEFOR THE FISCAL YEAR ENDED JUNE 30, 2016
Resource Room: Salaries of Teachers 11-213-100-101 2,950,454 (177,740) 2,772,714 2,736,952 35,762 Other Salaries for Instruction 11-213-100-106 326,334 16,947 343,281 320,555 22,726 Purchased Prof - Ed Services 11-213-100-320 2,000 709 2,709 2,701 8 General Supplies 11-213-100-610 19,656 (3,335) 16,321 16,198 123 Textbooks 11-213-100-640 1,500 (250) 1,250 1,249 1 Other Objects 11-213-100-800 1,000 (600) 400 320 80
Total Resource Room 3,300,944 (164,269) 3,136,675 3,077,975 58,700
Preschool Disabilities - Full Time: Salaries of Teachers 11-216-100-101 265,930 50,759 316,689 316,688 1 Other Purchased Services 11-216-100-106 114,858 25,906 140,764 137,428 3,336 General Supplies 11-216-100-600 - 2,902 2,902 2,553 349
Total Preschool Disabilities - Full-Time 380,788 79,567 460,355 456,669 3,686
Home Instruction:Salaries of Teachers 11-219-100-101 - 9,914 9,914 9,914 -
Total Home Instruction - 9,914 9,914 9,914 -
Total Special Education 3,681,732 (74,788) 3,606,944 3,544,558 62,386
Basic Skills/Remedial: Salaries of Teachers 11-230-100-101 244,357 127 244,484 244,483 1 General Supplies 11-230-100-610 7,856 (1,620) 6,236 6,181 55
Total Basic Skills/Remedial 252,213 (1,493) 250,720 250,664 56
Bilingual Education: Salaries of Teachers 11-240-100-101 36,837 12,122 48,959 48,958 1 General Supplies 11-240-100-610 950 (387) 563 562 1
Total Bilingual Education 37,787 11,735 49,522 49,520 2
School Sponsored Cocurricular Activities- Instruction: Salaries 11-401-100-100 197,074 (1,484) 195,590 172,188 23,402
Purchased Services 11-401-100-500 8,600 (309) 8,291 4,511 3,780 Supplies and Materials 11-401-100-600 12,647 1,435 14,082 13,055 1,027
Other Objects 11-401-100-800 - - - - -
Total School Sponsored Cocurricular Activities 218,321 (358) 217,963 189,754 28,209
96

EXHIBIT C-1
POSITIVE/(NEGATIVE)
ACCOUNT ORIGINAL BUDGET FINAL FINAL TONUMBERS BUDGET TRANSFERS BUDGET ACTUAL ACTUAL
UPPER FREEHOLD REGIONAL SCHOOL DISTRICTGENERAL FUND
BUDGETARY COMPARISON SCHEDULEFOR THE FISCAL YEAR ENDED JUNE 30, 2016
School Sponsored Athletics - Instruction: Salaries 11-402-100-100 380,978 (5,152) 375,826 349,987 25,839
Purchased Services 11-402-100-500 73,400 (6,193) 67,207 57,724 9,483 Supplies and Materials 11-402-100-600 49,972 (3,010) 46,962 35,658 11,304
Other Objects 11-402-100-800 26,614 1,627 28,241 24,232 4,009
Total School Sponsored Athletics Instruction 530,964 (12,728) 518,236 467,601 50,635
Total Instruction 15,684,694 82,003 15,766,697 15,575,090 191,607
Undistributed Expenditures: Instruction : Tuition to Other LEAs 11-000-100-562 20,900 20,900 20,900 - Tuition to County Vocational - School District - Regular 11-000-100-563 108,330 57,595 165,925 165,925 - Tuition to County Vocational School District - Special 11-000-100-564 89,000 (14,300) 74,700 72,315 2,385 Tuition to CSSD & Regional Day School 11-000-100-565 190,096 (33,866) 156,230 151,841 4,389 Tuition to Private School for the Handicapped - State 11-000-100-566 648,135 (82,210) 565,925 556,667 9,258 Tuition - State Facilities 11-000-100-568 - -
Total Undistributed Expenditures - Instruction 1,035,561 (51,881) 983,680 967,648 16,032
Attendance & Social Work Services: Salaries 11-000-211-100 95,765 (18,801) 76,964 76,423 541 Other Purchased Services 11-000-211-500 5,156 (5,006) 150 123 27 Supplies and Materials 11-000-211-600 237 - 237 237 -
Total Attendance & Social Work Services 101,158 (23,807) 77,351 76,783 568
Health Services: Salaries 11-000-213-100 180,664 61,335 241,999 240,115 1,884 Purchased Professional & Technical Services 11-000-213-300 81,682 (51,325) 30,357 30,356 1 Supplies and Materials 11-000-213-600 5,415 1,292 6,707 6,615 92
Total Health Services 267,761 11,302 279,063 277,086 1,977
97

EXHIBIT C-1
POSITIVE/(NEGATIVE)
ACCOUNT ORIGINAL BUDGET FINAL FINAL TONUMBERS BUDGET TRANSFERS BUDGET ACTUAL ACTUAL
UPPER FREEHOLD REGIONAL SCHOOL DISTRICTGENERAL FUND
BUDGETARY COMPARISON SCHEDULEFOR THE FISCAL YEAR ENDED JUNE 30, 2016
Speech, OT, PT & Related Services: Salaries 11-000-216-100 568,622 16,329 584,951 580,514 4,437 Purchased Services 11-000-216-320 97,320 29,141 126,461 126,294 167 Supplies and Materials 11-000-216-600 3,515 (9) 3,506 2,956 550
Total Speech, OT, PT & Related Services 669,457 45,461 714,918 709,764 5,154
Other Support Services - Students - Extra Services: Salaries 11-000-217-100 436,338 54,776 491,114 472,711 18,403
Purchased Professional Ed. Services 11-000-217-320 68,000 (2,145) 65,855 40,187 25,668 Supplies and Materials 11-000-217-600 - 341 341 321 20
Total Other Support Services-Students-Extra Services 504,338 52,972 557,310 513,219 44,091
Guidance: Salaries of Other Professional Staff 11-000-218-104 717,605 664 718,269 718,193 76 Salaries of Secretarial & Clerical Assistants 11-000-218-105 98,998 (880) 98,118 98,116 2 Purchased Professional - Educational Services 11-000-218-320 11,500 2,753 14,253 11,778 2,475 Other Purchased Professional & Technical Services 11-000-218-390 5,950 - 5,950 5,950 - Other Purchased Services 11-000-218-500 16,337 (11,012) 5,325 5,178 147 Supplies and Materials 11-000-218-600 3,325 - 3,325 3,325 -
Total Guidance 853,715 (8,475) 845,240 842,540 2,700
Child Study Teams: Salaries of Other Professional Staff 11-000-219-104 815,355 95,355 910,710 857,853 52,857 Salaries of Secretarial & Clerical Assistants 11-000-219-105 154,587 (11,425) 143,162 143,162 - Purchased Professional - Educational Services 11-000-219-320 26,000 10,706 36,706 32,813 3,893
Other Purchased Services(400-500 series) 11-000-219-500 700 - 700 627 73
Miscellaneous Purchased Services 11-000-219-592 10,089 (10,089) - - - Supplies and Materials 11-000-219-600 10,600 - 10,600 10,564 36 Other Objects 11-000-219-800 1,100 (280) 820 820 -
Total Child Study Teams 1,018,431 84,267 1,102,698 1,045,839 56,859
98

EXHIBIT C-1
POSITIVE/(NEGATIVE)
ACCOUNT ORIGINAL BUDGET FINAL FINAL TONUMBERS BUDGET TRANSFERS BUDGET ACTUAL ACTUAL
UPPER FREEHOLD REGIONAL SCHOOL DISTRICTGENERAL FUND
BUDGETARY COMPARISON SCHEDULEFOR THE FISCAL YEAR ENDED JUNE 30, 2016
Improvement of Instruction Services/Other Support Services - Instruction Staff: Salaries of Supervisors of Instruction 11-000-221-102 218,589 1 218,590 218,589 1 Salaries of Other Professional Staff 11-000-221-104 39,167 (9,778) 29,389 27,826 1,563 Salaries of Secretarial & Clerical Assistants 11-000-221-105 46,496 - 46,496 46,495 1 Salaries of Facilitators, Math Literacy Coaches 11-000-221-176 80,869 - 80,869 80,869 - Other Purchased Services 11-000-221-500 - 2,500 2,500 2,500 - Supplies and Materials 11-000-221-600 11,500 (2,800) 8,700 7,673 1,027 Other Objects 11-000-221-800 2,200 - 2,200 1,580 620
Total Improvement of Instruction Services/Other Support Services Instructional Staff 398,821 (10,077) 388,744 385,532 3,212
Educational Media Services/School Library: Salaries 11-000-222-100 408,505 337 408,842 408,841 1 Salaries of Tech Coordinators 11-000-222-177 109,188 7,008 116,196 116,196 - Other Purchased Services 11-000-222-500 - 1,000 1,000 980 20 Supplies and Materials 11-000-222-600 45,980 2,350 48,330 47,116 1,214
Total Educational Media Services/School Library 563,673 10,695 574,368 573,133 1,235
Support Services Instructional Staff Training Service: Salaries of Other Professional 11-000-223-104 59,196 (24,933) 34,263 25,336 8,927 Purchased Professional - Educational Services 11-000-223-320 2,000 (400) 1,600 1,600 - Other Purchased Services 11-000-223-500 23,600 (1,790) 21,810 19,066 2,744 Supplies and Materials 11-000-223-600 6,235 7,148 13,383 12,801 582 Other Objects 11-000-223-800 3,300 (2,201) 1,099 609 490
Total Support Services Instructional Training Services 94,331 (22,176) 72,155 59,412 12,743
Support Services General Administration: Salaries 11-000-230-100 221,500 (19,408) 202,092 202,091 1 Legal Services 11-000-230-331 44,000 (3,476) 40,524 40,522 2 Audit Services 11-000-230-332 36,300 (1,885) 34,415 34,415 -
Architectural/Engineering Services 11-000-230-334 5,000 30,384 35,384 35,384 - Other Purchased Professional Services 11-000-230-339 17,480 (11,350) 6,130 6,130 - Communications/Telephone 11-000-230-530 59,700 15,146 74,846 73,344 1,502 Other Purchased Services 11-000-230-590 82,312 (164) 82,148 72,577 9,571 General Supplies 11-000-230-610 14,074 (7,352) 6,722 6,579 143 BOE In-House Training/Meeting Supplies 11-000-230-630 500 (500) - - - Judgments Against the School District 11-000-230-820 8,005 8,005 8,004 1 Miscellaneous Expenditures 11-000-230-890 6,231 (1,998) 4,233 4,232 1 BOE Membership Dues & Fees 11-000-230-895 15,000 - 15,000 14,998 2
Total Support Services General Administration 502,097 7,402 509,499 498,276 11,223
99

EXHIBIT C-1
POSITIVE/(NEGATIVE)
ACCOUNT ORIGINAL BUDGET FINAL FINAL TONUMBERS BUDGET TRANSFERS BUDGET ACTUAL ACTUAL
UPPER FREEHOLD REGIONAL SCHOOL DISTRICTGENERAL FUND
BUDGETARY COMPARISON SCHEDULEFOR THE FISCAL YEAR ENDED JUNE 30, 2016
Support Services School Administration: Salaries of Principals & Assistant Principals 11-000-240-103 842,743 3 842,746 842,743 3 Salaries of Secretarial & Clerical Assistants 11-000-240-105 459,577 16,515 476,092 476,091 1
Purchased Prof. & Tech. Svcv. 11-000-240-300 3,525 (3,286) 239 - 239 Other Purchased Services 11-000-240-500 17,492 4,940 22,432 22,390 42 Supplies and Materials 11-000-240-600 10,849 (1,400) 9,449 8,083 1,366 Other Objects 11-000-240-800 1,650 - 1,650 1,640 10
Total Support Services School Administration 1,335,836 16,772 1,352,608 1,350,947 1,661
Central Services: Salaries 11-000-251-100 409,293 (27,268) 382,025 382,025 - Purchased Professional Services 11-000-251-330 2,000 2,540 4,540 4,540 -
Purchased Technical Services 11-000-251-340 27,580 (814) 26,766 26,745 21 Miscellaneous Purchased Services 11-000-251-592 11,687 (5,474) 6,213 5,609 604 Supplies & Materials 11-000-251-600 6,309 (1,825) 4,484 4,407 77 Miscellaneous Expenditures 11-000-251-890 4,500 (2,400) 2,100 2,071 29
Total Central Services 461,369 (35,241) 426,128 425,397 731
Administrative Information Technology: Salaries 11-000-252-100 84,801 (1,364) 83,437 83,434 3 Purchased Professional Services 11-000-252-330 22,335 (6,893) 15,442 15,264 178 Other Purchased Services 11-000-252-500 - - - - -
Supplies and Materials 11-000-252-600 8,550 (2,999) 5,551 5,504 47
Total Administrative Information Technology 115,686 (11,256) 104,430 104,202 228
Required Maintenance for School Facilities: Salaries 11-000-261-100 210,170 846 211,016 211,016 - Cleaning, Repair & Maintenance Services 11-000-261-420 104,273 460,359 564,632 347,991 216,641 General Supplies 11-000-261-610 51,416 8,319 59,735 37,653 22,082
Total Required Maintenance for School Facilities 365,859 469,524 835,383 596,660 238,723
100

EXHIBIT C-1
POSITIVE/(NEGATIVE)
ACCOUNT ORIGINAL BUDGET FINAL FINAL TONUMBERS BUDGET TRANSFERS BUDGET ACTUAL ACTUAL
UPPER FREEHOLD REGIONAL SCHOOL DISTRICTGENERAL FUND
BUDGETARY COMPARISON SCHEDULEFOR THE FISCAL YEAR ENDED JUNE 30, 2016
Custodial Services: Salaries 11-000-262-100 855,877 (7,484) 848,393 848,097 296
Salaries of Non-Instructional Aides 11-000-262-107 129,660 3,204 132,864 132,857 7 Cleaning, Repair & Maintenance Services 11-000-262-420 47,400 (8,572) 38,828 38,361 467 Other Purchased Property Services 11-000-262-490 171,472 (2,780) 168,692 166,909 1,783 Insurance 11-000-262-520 200,742 (15,700) 185,042 185,042 - Travel 11-000-262-580 443 1,460 1,903 1,865 38 Miscellaneous Purchased Services 11-000-262-590 1,225 (1,000) 225 88 137 General Supplies 11-000-262-610 173,235 (32,492) 140,743 140,250 493 Energy (Natural Gas) 11-000-262-621 148,500 (26,336) 122,164 111,868 10,296 Energy (Electricity) 11-000-262-622 613,288 (30,555) 582,733 495,081 87,652 Energy (Gasoline) 11-000-262-626 16,500 (7,140) 9,360 9,173 187 Other Objects 11-000-262-800 2,000 4,152 6,152 6,152 -
Total Custodial Services 2,360,342 (123,243) 2,237,099 2,135,743 101,356
Care & Upkeep of Grounds Cleaning, Repair & Maintenance
Salaries 11-000-263-100 180,650 (8,803) 171,847 171,672 175 Cleaning, Repair & Maintenance 11-000-263-420 2,800 4,550 7,350 6,339 1,011
General Supplies 11-000-263-610 45,795 1,124 46,919 46,106 813
Total Care & Upkeep of Grounds 229,245 (3,129) 226,116 224,117 1,999
SecuritySalaries 11-000-266-100 121,599 34,999 156,598 156,597 1
Cleaning, Repair & Maintenance 11-000-266-420 7,710 1,890 9,600 9,600 - General Supplies 11-000-266-610 10,639 (7,186) 3,453 1,375 2,078
Total Security 139,948 29,703 169,651 167,572 2,079
Student Transportation Services: Salaries for Pupil Transportation (Between Home & School) - Regular 11-000-270-160 31,000 (8,415) 22,585 18,757 3,828 Salaries for Pupil Transportation (Other Than Between Home & School) 11-000-270-162 - 1,455 1,455 1,455 - Purchased Professional & Technical Services 11-000-270-390 77,781 3,285 81,066 81,065 1 Cleaning, Repair & Maintenance Services 11-000-270-420 10,000 4,636 14,636 14,635 1 Contracted Services (Other Than Between School) - Vendors 11-000-270-511 899,000 40,806 939,806 939,772 34
101

EXHIBIT C-1
POSITIVE/(NEGATIVE)
ACCOUNT ORIGINAL BUDGET FINAL FINAL TONUMBERS BUDGET TRANSFERS BUDGET ACTUAL ACTUAL
UPPER FREEHOLD REGIONAL SCHOOL DISTRICTGENERAL FUND
BUDGETARY COMPARISON SCHEDULEFOR THE FISCAL YEAR ENDED JUNE 30, 2016
Contracted Services Between Home & School - Vendors 11-000-270-512 131,475 22,193 153,668 152,068 1,600 Contracted Services (Between Home & Home & School) Joint Agreements 11-000-270-513 137,700 56,437 194,137 194,137 - Contracted Services (Special Education) Vendors 11-000-270-514 180,000 94,545 274,545 274,531 14 Contracted Services (Regular
Contract Svc (Sp Ed.)-joint agreements 11-000-270-515 42,000 (445) 41,555 41,555 -
Students) - ESCs & CTSAs 11-000-270-517 45,000 (45,000) - - - Contracted Services (Special Education Students) - ESCs & CTSAs 11-000-270-518 82,000 58,552 140,552 140,552 - Aid in Lieu of Payments-Nonpublic 11-000-270-503 47,000 (14,159) 32,841 32,840 1 Miscellaneous Purchased Services - Transportation 11-000-270-593 23,369 (1,549) 21,820 21,819 1 Transportation Supplies 11-000-270-615 20,644 (8,134) 12,510 11,640 870 Other Objects 11-000-270-800 1,200 (900) 300 300 -
- Total Student Transportation Services 1,728,169 203,307 1,931,476 1,925,126 6,350
Unallocated Benefits - Employee Benefits: Social Security 11-000-291-220 531,831 (30,025) 501,806 464,816 36,990 Other Retirement Contributions - PERS 11-000-291-241 516,500 (14,100) 502,400 502,323 77 Other Retirement Contributions - Regular 11-000-291-249 6,000 (6,000) - - - Unemployment Compensation 11-000-291-250 - - - - - Worker's Compensation 11-000-291-260 284,008 (16,327) 267,681 267,681 - Health Benefits 11-000-291-270 5,620,660 (276,223) 5,344,437 5,240,059 104,378 Tuition Reimbursement 11-000-291-280 47,459 - 47,459 47,001 458 Other Employee Benefits 11-000-291-290 86,580 38,335 124,915 124,164 751
Total Unallocated Benefits - Employee Benefits 7,093,038 (304,340) 6,788,698 6,646,044 142,654
Nonbudgeted: Reimbursed TPAF Social Security Contribution - - - 1,181,795 (1,181,795) On-Behalf TPAF Pension Contributions - - - 1,253,399 (1,253,399) On-Behalf TPAF Pension Contributions - Post Retirement Medical - - - 1,492,452 (1,492,452) On-Behalf TPAF Pension Contributions -NCGI - - 59,474 (59,474)
Total Nonbudgeted - - - 3,987,120 (3,987,120)
Total Undistributed Expenditures 19,838,835 337,780 20,176,615 23,512,160 (3,335,545)
Total Expenditures - Current Expense 35,523,529 419,783 35,943,312 39,087,250 (3,143,938)
102

EXHIBIT C-1
POSITIVE/(NEGATIVE)
ACCOUNT ORIGINAL BUDGET FINAL FINAL TONUMBERS BUDGET TRANSFERS BUDGET ACTUAL ACTUAL
UPPER FREEHOLD REGIONAL SCHOOL DISTRICTGENERAL FUND
BUDGETARY COMPARISON SCHEDULEFOR THE FISCAL YEAR ENDED JUNE 30, 2016
Capital Outlay: Equipment: Regular Programs - Instruction: Grades 9 - 12 12-140-100-730 5,000 (500) 4,500 4,499 1 Instruction 12-000-100-730 - - - - - Required Maintenance of School Facilities 12-000-261-730 - 4,909 4,909 4,909 - Undistributed Expense - Care & Upkeep of Grounds 12-000-263-730 - 27,219 27,219 27,219 -
Total Equipment 5,000 31,628 36,628 36,627 1
Facilities Acquisition & Construction Services: Other Purchased Prof & Tech Service 12-000-400-300 - - - Construction Services 12-000-400-450 - 196,373 196,373 180,953 15,420 Assessment for Debt Service on SDA Funding 12-000-400-896 164,942 - 164,942 164,942 -
Total Facilities Acquisition & Construction Services 164,942 196,373 361,315 345,895 15,420
Assets Acquired Under Capital Leases (Nonbudgeted) - - - 256,000 (256,000)
Total Capital Outlay 169,942 228,001 397,943 638,522 (240,579)
Total Expenditures 35,693,471 647,784 36,341,255 39,725,772 (3,384,517)
Excess/(Deficiency) of Revenues Over/(Under) Expenditures (376,980) (647,784) (1,024,764) (245,714) 779,050
Other Financing Sources/(Uses): Cancellation of Prior Year Payables - - - 58,909 58,909 Capital Lease Proceeds (Nonbudgeted) - - - 256,000 256,000
Total Other Financing Sources/(Uses) - - - 314,909 314,909
103

EXHIBIT C-1
POSITIVE/(NEGATIVE)
ACCOUNT ORIGINAL BUDGET FINAL FINAL TONUMBERS BUDGET TRANSFERS BUDGET ACTUAL ACTUAL
UPPER FREEHOLD REGIONAL SCHOOL DISTRICTGENERAL FUND
BUDGETARY COMPARISON SCHEDULEFOR THE FISCAL YEAR ENDED JUNE 30, 2016
Excess/(Deficiency) of Revenues & Other Financing Sources Over/(Under) Expenditures & Other Financing Sources/(Uses) (376,980) (647,784) (1,024,764) 69,195 1,093,959 Fund Balances, July 1 2,600,246 - 2,600,246 2,600,246 -
.Fund Balances, June 30 2,223,266 (647,784) 1,575,482 2,669,441 1,093,959
Prior Year Reserve for Encumbrances (248,746) Withdrawal from Maintenance Reserve (Approved January 6, 2016) (300,000) Withdrawal from Capital Reserve (Approved July 15, 2015) (74,450) Withdrawal from Capital Reserve (Approved September 2, 2015) (3,988) Withdrawal from Capital Reserve (Approved November 18, 2015) (17,850) Withdrawal from Capital Reserve (Approved January 20, 2016) (2,750)
(647,784)
Restricted Fund Balance: Capital Reserve 543,360 Maintenance Reserve 250,000 Emergency Reserve 300,000 Tuition Reserve 100,000 Excess Surplus 160,000 Excess Surplus Designated for Subsequent Year's Expenditures 97,692
Committed Fund Balance: Year-end Encumbrances 263,233
Assigned Fund Balance: Designated for Subsequent Year's Expenditures 162,580
Unassigned Fund Balance 792,576
Subtotal 2,669,441
Reconciliation to Governmental Fund Statements (GAAP): Last State Aid Payment Not Recognized on GAAP Basis (537,489)
Fund Balance Per Governmental Funds (GAAP) 2,131,952
RECAPITULATION OF FUND BALANCE:
RECAPITULATION OF TRANSFERS:
104
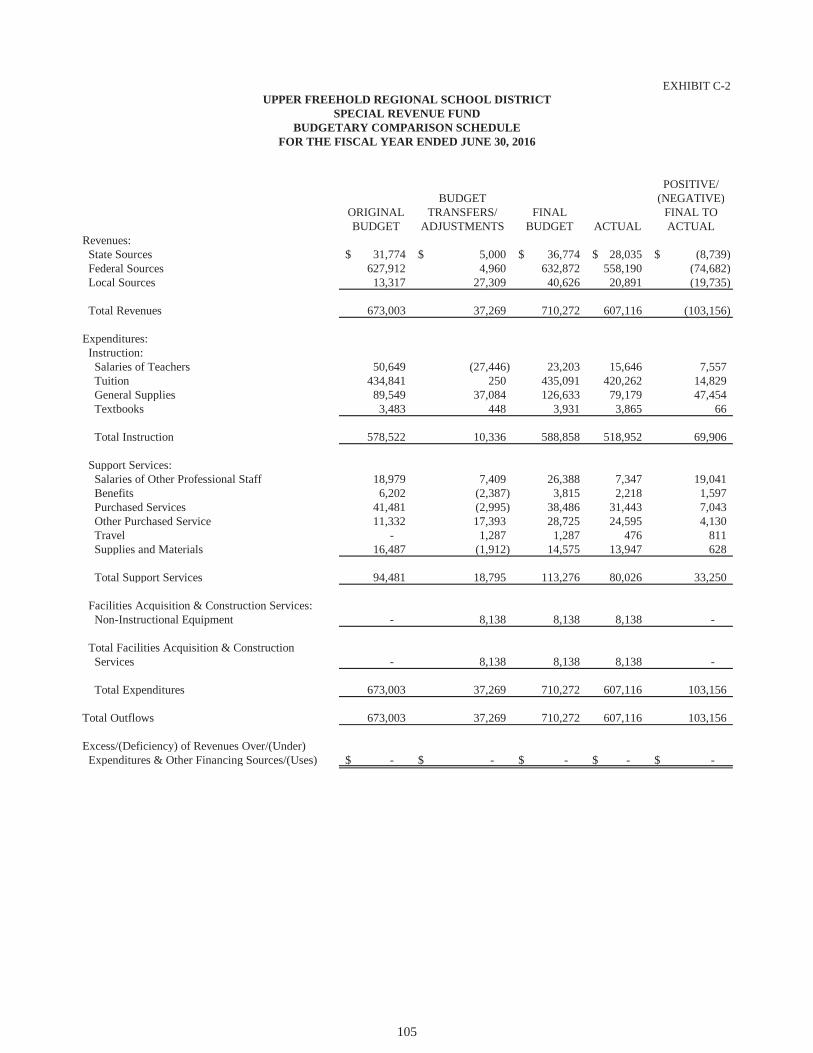
EXHIBIT C-2
POSITIVE/BUDGET (NEGATIVE)
ORIGINAL TRANSFERS/ FINAL FINAL TOBUDGET ADJUSTMENTS BUDGET ACTUAL ACTUAL
Revenues: State Sources 31,774$ 5,000$ 36,774$ 28,035$ (8,739)$ Federal Sources 627,912 4,960 632,872 558,190 (74,682) Local Sources 13,317 27,309 40,626 20,891 (19,735)
Total Revenues 673,003 37,269 710,272 607,116 (103,156)
Expenditures: Instruction: Salaries of Teachers 50,649 (27,446) 23,203 15,646 7,557 Tuition 434,841 250 435,091 420,262 14,829 General Supplies 89,549 37,084 126,633 79,179 47,454 Textbooks 3,483 448 3,931 3,865 66
Total Instruction 578,522 10,336 588,858 518,952 69,906
Support Services: Salaries of Other Professional Staff 18,979 7,409 26,388 7,347 19,041 Benefits 6,202 (2,387) 3,815 2,218 1,597 Purchased Services 41,481 (2,995) 38,486 31,443 7,043 Other Purchased Service 11,332 17,393 28,725 24,595 4,130 Travel - 1,287 1,287 476 811 Supplies and Materials 16,487 (1,912) 14,575 13,947 628
Total Support Services 94,481 18,795 113,276 80,026 33,250
Facilities Acquisition & Construction Services: Non-Instructional Equipment - 8,138 8,138 8,138 -
Total Facilities Acquisition & Construction Services - 8,138 8,138 8,138 -
Total Expenditures 673,003 37,269 710,272 607,116 103,156
Total Outflows 673,003 37,269 710,272 607,116 103,156
Excess/(Deficiency) of Revenues Over/(Under) Expenditures & Other Financing Sources/(Uses) -$ -$ -$ -$ -$
UPPER FREEHOLD REGIONAL SCHOOL DISTRICTSPECIAL REVENUE FUND
BUDGETARY COMPARISON SCHEDULEFOR THE FISCAL YEAR ENDED JUNE 30, 2016
105

restricted and unrestricted net assets are available and have determined that net assets were properly recognized under the policy.
42) We acknowledge our responsibility for the required supplementary information (RSI). The RSI is measured and presented within prescribed guidelines and the methods of measurement and presentation have not changed from those used in the prior period. We have disclosed to you any significant assumptions and interpretations underlying the measurement and presentation of the RSI.
Signature: Signature:
Title: Title:
RESERVED FOR MD&A LETTER
106

NOTES TO REQUIRED SUPPLEMENTARY INFORMATION
107

This page intentionally left blank
108

OTHER SUPPLEMENTARY INFORMATION
109

This page intentionally left blank
110

EXHIBIT C-3
GENERAL SPECIALFUND REVENUE
N-1 FUNDSources/Inflows of Resources: Actual Amounts (Budgetary Basis) "Revenue" From the Budgetary Comparison Schedule (C-Series) 39,480,058$ 607,116$ Difference - Budget to GAAP: Grant accounting budgetary basis differs from GAAP in that encumbrances are recognized as expenditures, and the related revenue is recognized.
Prior Year - Current Year - -
State aid payment recognized for GAAP statements in the current year, previously recognized for budgetary purposes. 526,808 -
State aid payment recognized for budgetary purposes, not recognized for GAAP statements until the subsequent year. (537,489) -
Total Revenues as Reported on the Statement of Revenues, Expenditures, and Changes in Fund Balances - Governmental Funds. (B-2) 39,469,377$ 607,116$
Uses/outflows of resources: Actual amounts (budgetary basis) "total expenditures" from the budgetary comparison schedule 39,725,772$ 607,116$ Differences - budget to GAAP Encumbrances for supplies and equipment ordered but not received is reported in the year the order is placed for budgetary purposes, but in the year the supplies are received for financial reporting purposes.
Prior Year - - Current Year - -
Total Expenditures as Reported on the Statement of Revenues, Expenditures, and Changes in Fund Balances - Governmental Funds (B-2) 39,725,772$ 607,116$
N-1 The general fund budget uses GAAP basis therefore no reconciliation is necessary.
Note A - Explanation of Differences between Budgetary Inflows and Outflows and GAAP Revenues and Expenditures
FOR THE FISCAL YEAR ENDED JUNE 30, 2016
UPPER FREEHOLD REGIONAL SCHOOL DISTRICTREQUIRED SUPPLEMENTARY INFORMATION
BUDGETARY COMPARISON SCHEDULE NOTE TO RSI
111

restricted and unrestricted net assets are available and have determined that net assets were properly recognized under the policy.
42) We acknowledge our responsibility for the required supplementary information (RSI). The RSI is measured and presented within prescribed guidelines and the methods of measurement and presentation have not changed from those used in the prior period. We have disclosed to you any significant assumptions and interpretations underlying the measurement and presentation of the RSI.
Signature: Signature:
Title: Title:
RESERVED FOR MD&A LETTER
112

REQUIRED SUPPLEMENTARY INFORMATION - PART III
113

This page intentionally left blank
114

L. Schedules Related to Accounting and Reporting for Pensions (GASB 68)
115

This page intentionally left blank
116

EXHIBIT L-1
2016 2015 2014
District's proportion of the net pension liability(asset) 0.05843% 0.05450% 0.05635%
District's proportionate share of the netpension liability (asset) 13,115,886$ 10,203,933$ 10,769,358$
District's covered-employee payroll 3,710,113$ 3,694,468$ 3,851,068$
District's proportionate share of the netpension liability (asset) as a percentage of itscovered-employee payroll 353.52% 276.19% 279.65%
Plan fiduciary net position as a percentage ofthe total pension liability 47.92% 52.08% 48.72%
**This schedule is presented to illustrate the requirement to show information for 10 years. However, until a full 10-year trend is compiled, governments should present information for those years for which information is available.
UPPER FREEHOLD REGIONAL SCHOOL DISTRICTSCHEDULE OF THE DISTRICT'S PROPORTIONATE SHARE OF THE NET PENSION LIABILITY
LAST THREE FISCAL YEARSPUBLIC EMPLOYEES' RETIREMENT SYSTEM
117

EXHIBIT L-2
2016 2015 2014
Contractually required contribution 502,323$ 449,292$ 424,576
Contributions in relation to thecontractually required contribution 502,323 449,292 424,576
Contribution deficiency (excess) -$ -$ -$
District's covered-employee payroll 3,710,113$ 3,694,468$ 3,851,068$
Contributions as a percentage of covered-employee payroll 13.54% 12.16% 11.02%
**This schedule is presented to illustrate the requirement to show information for 10 years. However, until a full 10-year trend is compiled, governments should present information for those years for which information is available.
UPPER FREEHOLD REGIONAL SCHOOL DISTRICTSCHEDULE OF DISTRICT CONTRIBUTIONS
PUBLIC EMPLOYEES' RETIREMENT SYSTEMLAST THREE FISCAL YEARS
118

EXHIBIT L-3
2016 2015 2014
District's proportion of the net pension liability(asset) 0.15418% 0.15531% 0.15531%
State's proportionate share of the netpension liability (asset) associated with the District 97,445,478$ 83,007,855$ 79,988,513$
District's covered-employee payroll 16,548,628$ 16,022,613$ 15,807,331$
District's proportionate share of the netpension liability (asset) as a percentage of itscovered-employee payroll 0.00% 0.00% 0.00%
Plan fiduciary net position as a percentage ofthe total pension liability 28.71% 33.64% 33.76%
**This schedule is presented to illustrate the requirement to show information for 10 years. However, until a full 10-year trend is compiled, governments should present information for those years for which information is available.
UPPER FREEHOLD REGIONAL SCHOOL DISTRICTSTATE'S PROPORTIONATE SHARE OF THE NET PENSION LIABILITY ASSOCIATED WITH THE DISTRICT'S
LAST THREE FISCAL YEARSTEACHERS' PENSION AND ANNUITY FUND
119

restricted and unrestricted net assets are available and have determined that net assets were properly recognized under the policy.
42) We acknowledge our responsibility for the required supplementary information (RSI). The RSI is measured and presented within prescribed guidelines and the methods of measurement and presentation have not changed from those used in the prior period. We have disclosed to you any significant assumptions and interpretations underlying the measurement and presentation of the RSI.
Signature: Signature:
Title: Title:
RESERVED FOR MD&A LETTER
120

NOTES TO REQUIRED SUPPLEMENTARY INFORMATION - PART III
121

This page intentionally left blank
122

UPPER FREEHOLD TOWNSHIP BOARD OF EDUCATIONNOTES TO THE REQUIRED SUPPLEMENTARY INFORMATION
JUNE 30, 2016
Teachers Pension and Annuity Fund (TPAF)
Basis of Presentation. The amounts presented in the Schedules were prepared in accordance with U.S. generally accepted accounting principles. The numbers were derived in a report provided by KPMG dated July 28, 2016. The full report is available by the State of New Jersey, Division of Pension and Benefits. Such preparation requires management of TPAF to make a number of estimates and assumptions relating to the reported amounts. Due to the inherent nature of these estimates, actual results could differ from those estimates.
Changes of benefit terms. The vesting and benefit provisions are set by N.J.S.A. 18A:66. TPAF provides retirement, death and disability benefits. All benefits vest after ten years of service, except for medical benefits, which vest after 25 years of service or under the disability provisions of TPAF. Members are always fully vested for their own contributions and, after three years of service credit, become vested for 2% of related interest earned on the contributions. In the case of death before retirement, members’ beneficiaries are entitled to full interest credited to the members’ accounts.
Changes of assumptions. Mortality rates were based on the RP-2000 Health Annuitant Mortality Table for Males or Females, as appropriate, with adjustments for mortality improvements based on Scale AA. Pre-retirement mortality improvements for active members are projected using Scale AA from the base year of 2000 until the valuation date plus 15 years to account for future mortality improvement. Post-retirement mortality improvements for non-disabled annuitants are projected using Scale AA from the base year of 2000 for males and 2003 for females until the valuation date plus 7 years to account for future mortality improvement.
Public Employees' Retirement System (PERS)
Basis of Presentation. The amounts presented in the Schedules were prepared in accordance with U.S. generally accepted accounting principles. The numbers were derived in a report provided by KPMG dated April 14, 2016. The full report is available by the State of New Jersey, Division of Pension and Benefits. Such preparation requires management of PERS to make a number of estimates and assumptions relating to the reported amounts. Due to the inherent nature of these estimates, actual results could differ from those estimates.
Changes of benefit terms. The vesting and benefit provisions are set by N.J.S.A. 43:15A. PERS provides retirement, death and disability benefits. All benefits vest after ten years of service, except for medical benefits, which vest after 25 years of service or under the disability provisions of PERS.
Changes of assumptions. Mortality rates were based on the RP-2000 Combined Healthy Male and Female Mortality Tables (setback 1 year for males and females) for service retirement and beneficiaries of former members with adjustments for mortality improvements from the base year of 2012 based on Projection Scale AA. The RP-2000 Disabled Mortality Tables (setback 3 years for males and setback 1 year for females) are used to value disabled retirees. The actuarial assumptions used in the July 1, 2014 valuation were based on the results of an actuarial experience study for the period July 1, 2008 to June 30, 2011. It is likely that future experience will not exactly conform to these assumptions. To the extent that actual experience deviates from these assumptions, the emerging liabilities may be higher or lower than anticipated. The more the experience deviates, the larger the impact on future financial statements.
123

restricted and unrestricted net assets are available and have determined that net assets were properly recognized under the policy.
42) We acknowledge our responsibility for the required supplementary information (RSI). The RSI is measured and presented within prescribed guidelines and the methods of measurement and presentation have not changed from those used in the prior period. We have disclosed to you any significant assumptions and interpretations underlying the measurement and presentation of the RSI.
Signature: Signature:
Title: Title:
RESERVED FOR MD&A LETTER
124

D. School Based Budget Schedules
Not Applicable
125

This page intentionally left blank
126
E. Special Revenue Fund
expenditures for specific proposes.(other than expendable trusts or major capital projects) that are legally restricted to
The Special Revenue Fund is used to account for the proceeds of specific revenue sources
127

This page intentionally left blank
128

EXH
IBIT
E-1
(Pag
e 1
of 3
)
I.D.E
.A.
PAR
T B
I.D.E
.A.
I.D.E
.A.
TITL
E II
TITL
E I
BA
SIC
PAR
T B
PAR
T B
TITL
E II
PAR
T A
PAR
T A
TITL
E II
IR
EGU
LAR
BA
SIC
PRES
CH
OO
LPA
RT
AC
AR
RY
OV
ERTI
TLE
IC
AR
RY
OV
ERC
AR
RY
OV
ERPR
OG
RA
MC
AR
RY
OV
ERPR
OG
RA
MR
even
ues:
Sta
te S
ourc
es-
$
-
$
-
$
-$
-
$-
$
-
$
-$
Fed
eral
Sou
rces
19,9
8615
,236
32,8
0637
,827
1,11
841
2,09
1
12
,400
13,3
55 L
ocal
Sou
rces
--
-
-
--
-
-
Tot
al R
even
ues
19,9
86$
15,2
36$
32,8
06$
37,8
27$
1,11
8$
412,
091
$12
,400
$13
,355
$
Expe
nditu
res:
Ins
truct
ion:
S
alar
ies o
f Tea
cher
s-
$
-
$
2,
118
$
13
,528
$
-$
-$
-$
-
$
Tui
tion
--
-
-
-
411,
015
9,24
7-
G
ener
al S
u ppl
ies
--
30,0
6721
,740
1,11
81,
076
2,70
3-
Tot
al In
stru
ctio
n-
-32
,185
35,2
681,
118
412,
091
11,9
50-
Su p
port
Serv
ices
:
Sal
arie
s-
5,
932
-
1,
415
--
-
-
Pur
chas
ed P
rofe
ssio
nal
Educ
atio
n Se
rvic
es-
--
-
-
-
450
13,3
55
Per
sona
l Ser
vice
s -
Em
ploy
ee B
enef
its-
453
621
1,14
4-
-
-
-
O
ther
Pur
chas
es S
ervi
ces
13,6
784,
717
-
-
--
-
-
Tra
vel
--
-
-
-
-
-
S
u ppl
ies a
nd M
ater
ials
6,30
84,
134
-
-
--
-
-
Tot
al S
u ppo
rt Se
rvic
es19
,986
15,2
3662
12,
559
--
45
0
13
,355
Fac
ilitie
s Ac q
uisi
tion
& C
onst
ruct
ion
Ser
vice
s:
N
on-I
nstru
ctio
nal E
quip
men
t-
--
-
-
-
-
Tot
al F
acili
ties A
c qui
sitio
n &
Con
stru
ctio
n Se
rvic
es-
-
-
-
-
-
-
-
Tota
l Ex p
endi
ture
s19
,986
$15
,236
$32
,806
$37
,827
$1,
118
$41
2,09
1$
12,4
00$
13,3
55$
NO
CH
ILD
LEF
T B
EHIN
D
UPP
ER
FR
EE
HO
LD
RE
GIO
NA
L S
CH
OO
L D
IST
RIC
T
FOR
TH
E F
ISC
AL
YE
AR
EN
DE
D J
UN
E 3
0, 2
016
CO
MB
ININ
G S
CH
ED
UL
E O
F R
EV
EN
UE
S A
ND
EX
PEN
DIT
UR
ES
- BU
DG
ET
AR
Y B
ASI
SSP
EC
IAL
RE
VE
NU
E F
UN
D
129

EXH
IBIT
E-1
(Pag
e 2
of 3
)
SUPP
LEM
ENTA
RY
CO
MPE
NSA
TOR
YSP
EEC
HTE
XTB
OO
KIN
STR
UC
TIO
NEX
AM
INA
TIO
NED
UC
ATI
ON
ESL
NU
RSI
NG
SER
VIC
ESR
even
ues:
Sta
te S
ourc
es3,
416
$
2,97
0$
3,
409
$
5,
922
$
-$
5,33
7$
-
$
Fed
eral
Sou
rces
-
-
-
-
-
-
-
Loc
al S
ourc
es-
-
-
-
-
-
-
Tot
al R
even
ues
3,41
6$
2,
970
$
3,40
9$
5,92
2$
-
$
5,
337
$
-$
Expe
nditu
res:
Ins
truct
ion:
S
alar
ies o
f Tea
cher
s-
$
-
$
-$
-
$
-
$
-
$
-$
Pur
chas
e of
Pro
fess
iona
l-
-
-
-
-
-
-
E
duca
tion
Serv
ices
-
-
-
-
-
-
-
T
uitio
n-
-
-
-
-
-
-
Gen
eral
Sup
plie
s-
-
-
-
-
-
-
Tex
tboo
ks3,
416
-
-
-
-
-
-
O
ther
Ob j
ects
-
-
-
-
-
-
-
Tot
al In
struc
tion
3,41
6
-
-
-
-
-
-
Sup
port
Serv
ices
:
Sal
arie
s-
-
-
-
-
-
-
Pur
chas
ed P
rofe
ssio
nal
Edu
catio
n Se
rvic
es-
2,
970
3,40
9
5,92
2
-
5,
337
-
Per
sona
l Ser
vice
s -
E
mpl
o yee
Ben
efits
-
-
-
-
-
-
-
O
ther
Pur
chas
es S
ervi
ces
-
-
-
-
-
-
-
T
rave
l-
-
-
-
-
-
-
Tot
al S
uppo
rt Se
rvic
es-
2,
970
3,40
9
5,92
2
-
5,
337
-
Fac
ilitie
s Acq
uisi
tion
&
C
onst
ruct
ion
Serv
ices
:
N
on-in
stru
ctio
nal E
quip
men
t-
-
-
-
-
-
-
Tot
al F
acili
ties A
cqui
sitio
n &
Con
stru
ctio
n Se
rvic
es-
-
-
-
-
-
-
Tota
l Exp
endi
ture
s3,
416
$
2,97
0$
3,
409
$
5,
922
$
-$
5,33
7$
-
$
NO
NPU
BLI
C
UPP
ER
FR
EE
HO
LD
RE
GIO
NA
L S
CH
OO
L D
IST
RIC
TSP
EC
IAL
RE
VE
NU
E F
UN
DC
OM
BIN
ING
SC
HE
DU
LE
OF
RE
VE
NU
ES
AN
D E
XPE
ND
ITU
RE
S - B
UD
GE
TA
RY
BA
SIS
FOR
TH
E F
ISC
AL
YE
AR
EN
DE
D J
UN
E 3
0, 2
016
130

EXH
IBIT
E-1
(Pag
e 3
of 3
)
VA
RIO
US
CA
SEPE
RK
INS
LOC
AL
TEC
HN
OLO
GY
SEC
UR
ITY
GR
AN
TG
RA
NT
GR
AN
TSTO
TALS
Rev
enue
s: S
tate
Sou
rces
1,50
6$
1,
999
$
3,47
6$
-
$
-
$
28
,035
$
Fed
eral
Sou
rces
-
-
-
13,3
71
-
558,
190
L
ocal
Sou
rces
-
-
-
-
20,8
91
20,8
91
Tot
al R
even
ues
1,50
6$
1,
999
$
3,47
6$
13
,371
$
20
,891
$
60
7,11
6$
Expe
nditu
res:
Ins
truct
ion:
S
alar
ies o
f Tea
cher
s-
$
-
$
-
$
-
$
-
$
15
,646
$
T
uitio
n-
-
-
-
-
42
0,26
2
G
ener
al S
uppl
ies
-
-
-
13,3
71
9,10
4
79,1
79
T
extb
ooks
-
-
-
-
449
3,86
5
Tot
al In
stru
ctio
n-
-
-
13
,371
9,
553
51
8,95
2
Sup
port
Serv
ices
:
Sal
arie
s-
-
-
-
-
7,
347
P
urch
ased
Pro
fess
iona
l
Ed
ucat
ion
Serv
ices
-
-
-
-
-
31,4
43
P
erso
nal S
ervi
ces -
Empl
oyee
Ben
efits
-
-
-
-
-
2,21
8
Oth
er P
urch
ases
Ser
vice
s-
-
3,
000
-
3,20
0
24,5
95
T
rave
l-
-
47
6
-
-
476
Sup
plie
s and
Mat
eria
ls1,
506
1,99
9
-
-
-
13
,947
Tot
al S
uppo
rt Se
rvic
es1,
506
1,99
9
3,
476
-
3,20
0
80,0
26
Fac
ilitie
s Acq
uisi
tion
& C
onst
ruct
ion
Serv
ices
:
N
on-I
nstru
ctio
nal E
quip
men
t-
-
-
-
8,
138
8,
138
Tot
al F
acili
ties A
cqui
sitio
n &
Con
stru
ctio
n Se
rvic
es-
-
-
-
8,
138
8,
138
Tota
l Exp
endi
ture
s1,
506
$
1,99
9$
3,
476
$
13,3
71$
20,8
91$
607,
116
$
NO
NPU
BLI
C
UPP
ER
FR
EE
HO
LD
RE
GIO
NA
L S
CH
OO
L D
IST
RIC
TSP
EC
IAL
RE
VE
NU
E F
UN
DC
OM
BIN
ING
SC
HE
DU
LE
OF
RE
VE
NU
ES
AN
D E
XPE
ND
ITU
RE
S - B
UD
GE
TA
RY
BA
SIS
FOR
TH
E F
ISC
AL
YE
AR
EN
DE
D J
UN
E 3
0, 2
016
131

restricted and unrestricted net assets are available and have determined that net assets were properly recognized under the policy.
42) We acknowledge our responsibility for the required supplementary information (RSI). The RSI is measured and presented within prescribed guidelines and the methods of measurement and presentation have not changed from those used in the prior period. We have disclosed to you any significant assumptions and interpretations underlying the measurement and presentation of the RSI.
Signature: Signature:
Title: Title:
RESERVED FOR MD&A LETTER
132

F. Capital Projects Fund
Not Applicable
133

This page intentionally left blank
134

CHILD WATCH
This Fund provides for the operation of food services within the School District.
FOOD SERVICE FUND
G. Proprietary Funds
that the cost of providing goods or services be financed through user charges.manner similar to private business enterprises - where the intent of the District's Board isProprietary Funds are used to account for operations that are financed and operated in a
AHS SUMMER PROGRAMS
This Fund provides for the operation of the District's extra-curricular summer programs.
This Fund provides for the operation of the District's after-care program.
KINDERGARTEN COMPLEMENT
This Fund provides for the operation of the District's extra-curricular kindergarten activities.
135

This page intentionally left blank
136

Enterprise Funds
137

This page intentionally left blank
138

EXHIBIT G-1
FOOD TOTALSERVICE CHILD KINDERGARTEN AHS SUMMER BUSINESS-TYPE
ASSETS FUND WATCH COMPLEMENT PROGRAMS ACTIVITIES
Current Assets: Cash & Cash Equivalents 9,788$ 188,819$ 53,670$ 34,407$ 286,684$ Cash with Fiscal Agent Accounts Receivable: State 116 - - - 116 Federal 2,400 - - - 2,400 Miscellaneous 100 - 19,590 - 19,690 Inventories 18,637 - - - 18,637
Total Current Assets 31,041 188,819 73,260 34,407 327,527
Capital Assets: Equipment 714,115 - - - 714,115 Accumulated Depreciation (349,002) - - - (349,002)
Total Capital Assets 365,113 - - - 365,113
Total Assets 396,154 188,819 73,260 34,407 692,640
Current Liabilities: Accounts Payable 8,069 - 490 183 8,742 Unearned Revenue - - 13,440 19,700 33,140 Capital Lease Payable 69,281 - - - 69,281 Accrued interest payable 51 - - - 51
Total Current Liabilities 77,401 - 13,930 19,883 111,214
NET POSITION
Investment in Capital Capital 295,832 - - - 295,832 Unreserved 22,921 188,819 59,330 14,524 285,594
Total Net Position 318,753$ 188,819$ 59,330$ 14,524$ 581,426$
UPPER FREEHOLD REGIONAL SCHOOL DISTRICTENTERPRISE FUND
COMBINING STATEMENT OF NET POSITIONAS OF JUNE 30, 2016
BUSINESS-TYPE ACTIVITIES ENTERPRISE FUNDS
139

EXHIBIT G-2
FOOD TOTALSERVICE CHILD KINDERGARTEN AHS SUMMER BUSINESS-TYPE
FUND WATCH COMPLEMENT PROGRAMS ACTIVITIES Local Sources: Daily Sales - Reimbursable Programs: School Lunch Program 100,647$ -$ -$ -$ 100,647$
Total - Daily Sales - Reimbursable Programs 100,647 - - - 100,647
Daily Sales Nonreimbursable Programs 443,277 - - - 443,277 Fees - 223,080 171,580 24,734 419,394 Miscellaneous Income 23,518 1,143 - - 24,661
Total Operating Revenue 567,442 224,223 171,580 24,734 987,979
Operating Expenses: Salaries 288,894 177,294 129,993 9,747 605,928 Employee Benefits - - 31,352 - 31,352 Purchased Prof./Tech. Services 47,002 1,254 - - 48,256 Purchased Property Services 1,825 - - - 1,825 Supplies and Materials 3,342 9,073 258 463 13,136 Depreciation 42,684 - - - 42,684 Miscellaneous 1,783 2,495 - - 4,278 Cost of Sales 318,044 - - - 318,044
Total Operating Expenses 703,574 190,116 161,603 10,210 1,065,503
Operating/(Loss)/Gain (136,132) 34,107 9,977 14,524 (77,524)
Nonoperating Revenues/(Expenses): State Sources: State School Lunch Program 2,067 - - - 2,067 Federal Sources: National School Lunch Program 42,765 - - - 42,765 Food Distribution Program 34,936 - - - 34,936
Total Nonoperating Revenues/ (Expenses) 79,768 - - - 79,768
Change in Net Position (56,364) 34,107 9,977 14,524 2,244
Net Position - July 1 375,117 154,712 49,353 - 579,182
Net Position - June 30 318,753$ 188,819$ 59,330$ 14,524$ 581,426$
UPPER FREEHOLD REGIONAL SCHOOL DISTRICTENTERPRISE FUND
COMBINING SCHEDULE OF REVENUES, EXPENSES ANDCHANGES IN FUND NET POSITION
AS OF JUNE 30, 2016
BUSINESS-TYPE ACTIVITIES ENTERPRISE FUNDS
140

EXHIBIT G-3
FOOD TOTALSERVICE CHILD KINDERGARTEN MILLSTONE AHS SUMMER BUSINESS-TYPE
FUND WATCH COMPLEMENT BUSING PROGRAMS ACTIVITIESCash Flows From Operating Activities: Receipts from Customers 577,912$ 224,223$ 162,460$ -$ 24,734$ 989,329$ Payments to Employees (288,894) (177,294) (129,993) - (9,747) (605,928) Payments to Suppliers (343,158) (14,672) (18,480) - 19,420 (356,890)
Net Cash Provided/(Used) by Operating Activities (54,140) 32,257 13,987 - 34,407 26,511
Cash Flows From Noncapital FinancingActivities: Cash Received From State & Federal Reimbursements 48,225 - - - 48,225
Net Cash Provided by Noncapital Financing Activities 48,225 - - - - 48,225
Cash Flows From Capital & RelatedFinancing Activities: Payment of Capital Lease (23,445) - - - (23,445)
Net Cash Provided/(Used) by Capital & Related Financing Activities (23,445) - - - - (23,445)
Net Increase/(Decrease) in Cash & Cash Equivalents (29,360) 32,257 13,987 - 34,407 51,291Cash & Cash Equivalents, July 1 39,148 156,562 39,683 - 235,393
Cash & Cash Equivalents, June 30 9,788$ 188,819$ 53,670$ -$ 34,407$ 286,684$
Operating Income/(Loss) (136,132)$ 34,107$ 9,977$ -$ 14,524$ (77,524)$Adjustments to Reconcile Operating Income/(Loss) to Cash Provided/(Used) by Operating Activities:
Depreciation Expense 42,684 - - - - 42,684 Food Distribution Program 34,936 - - - 34,936 Change in Assets & Liabilities:
(Increase)/Decrease in Accounts Receivable 10,470 - (9,120) - 1,350
(Increase)/Decrease in Inventory 2,402 - - - 2,402 Increase/(Decrease) in Accounts Payable (7,700) (1,850) 490 183 (8,877) Increase/(Decrease) in Unearned Revenue (800) - 12,640 19,700 31,540
Total Adjustments 81,992 (1,850) 4,010 19,883 104,035
Net Cash Provided/(Used) by Operating Activities (54,140)$ 32,257$ 13,987$ -$ 34,407$ 26,511$
RECONCILIATION OF OPERATING INCOME/(LOSS) TO NET CASH PROVIDED/(USED) BY OPERATING ACTIVITIES:
UPPER FREEHOLD REGIONAL SCHOOL DISTRICTENTERPRISE FUND
COMBINING SCHEDULE OF CASH FLOWSAS OF JUNE 30, 2016
BUSINESS-TYPE ACTIVITIES ENTERPRISE FUNDS
141

restricted and unrestricted net assets are available and have determined that net assets were properly recognized under the policy.
42) We acknowledge our responsibility for the required supplementary information (RSI). The RSI is measured and presented within prescribed guidelines and the methods of measurement and presentation have not changed from those used in the prior period. We have disclosed to you any significant assumptions and interpretations underlying the measurement and presentation of the RSI.
Signature: Signature:
Title: Title:
RESERVED FOR MD&A LETTER
142

Internal Service Fund
Not Applicable
143

This page intentionally left blank
144

Fiduciary Funds are used to account for funds received by the School District for a specific purpose
Agency Funds are used to account for assets held by the School District as an agent for individuals, private organizations, other governments and/or other funds.
Student Activity Fund: This Agency Fund is used to account for student fundsheld at the schools.
Unemployment Compensation Trust: This Fund is used to account for assets to finance the cost of unemployment benefits.
Scholarship Trust: This Fund is used to account for scholarship funds.
Payroll Agency Fund: This Agency Fund is used to account for the payroll transactions of the School District.
H. Fiduciary Fund
145

This page intentionally left blank
146
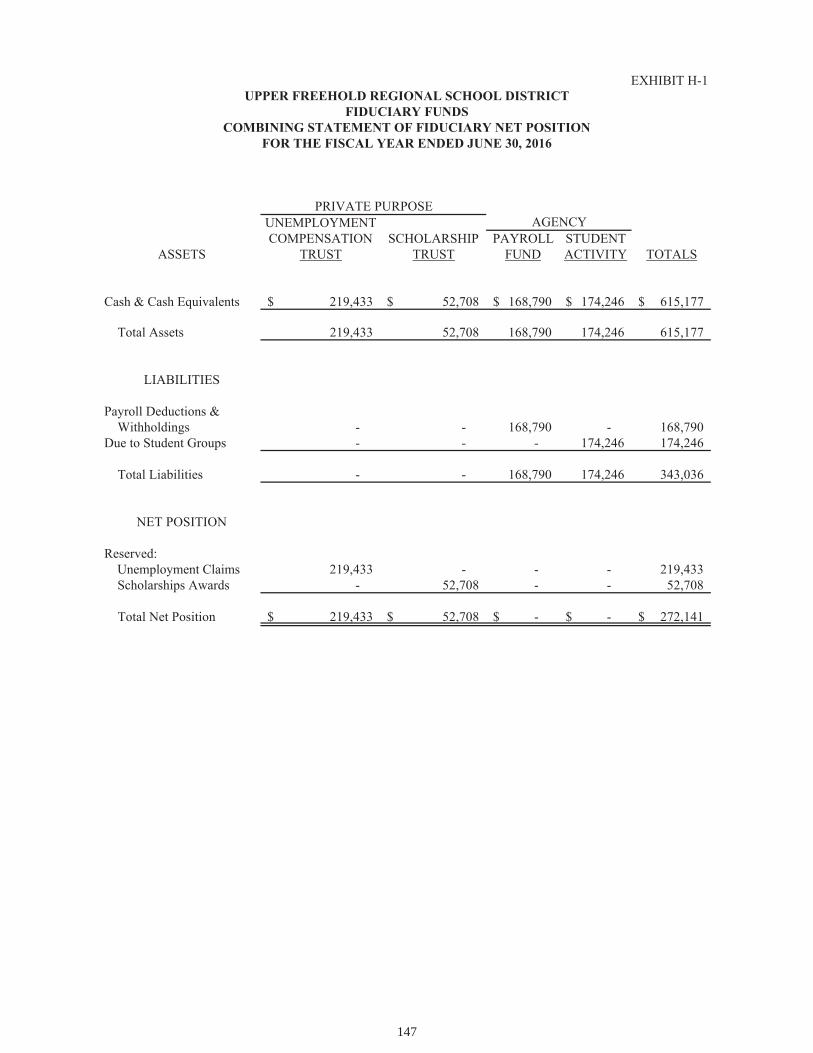
EXHIBIT H-1
UNEMPLOYMENTCOMPENSATION SCHOLARSHIP PAYROLL STUDENT
ASSETS TRUST TRUST FUND ACTIVITY TOTALS
Cash & Cash Equivalents 219,433$ 52,708$ 168,790$ 174,246$ 615,177$
Total Assets 219,433 52,708 168,790 174,246 615,177
LIABILITIES
Payroll Deductions & Withholdings - - 168,790 - 168,790 Due to Student Groups - - - 174,246 174,246
Total Liabilities - - 168,790 174,246 343,036
NET POSITION
Reserved: Unemployment Claims 219,433 - - - 219,433 Scholarships Awards - 52,708 - - 52,708
Total Net Position 219,433$ 52,708$ -$ -$ 272,141$
AGENCYPRIVATE PURPOSE
UPPER FREEHOLD REGIONAL SCHOOL DISTRICTFIDUCIARY FUNDS
COMBINING STATEMENT OF FIDUCIARY NET POSITIONFOR THE FISCAL YEAR ENDED JUNE 30, 2016
147

EXHIBIT H-2
UNEMPLOYMENTCOMPENSATION SCHOLARSHIP
ADDITIONS: TRUST TRUST TOTALS
Contributions: Deductions From Employee's Salaries -$ -$ -$ Donor Contributions 51,483 23,731 75,214
Total Contributions 51,483 23,731 75,214
Total Additions 51,483 23,731 75,214
DEDUCTIONS:
Unemployment Claims 99,431 - 99,431 Scholarships Awarded - 18,405 18,405
Total Deductions 99,431 18,405 117,836
Change in Net Position (47,948) 5,326 (42,622) Net Position - Beginning of Year 267,381 47,382 314,763
Net Position - End of Year 219,433$ 52,708$ 272,141$
PRIVATE PURPOSE
UPPER FREEHOLD REGIONAL SCHOOL DISTRICTFIDUCIARY FUND
COMBINING STATEMENT OF CHANGES IN FIDUCIARY NET POSITIONFOR THE FISCAL YEAR ENDED JUNE 30, 2016
148

EXHIBIT H-3
BALANCE BALANCEJULY 1, JUNE 30,
2015 ADDITIONS DELETIONS 2016ASSETS
Cash and Cash Equivalents:High School
Student Activity Fund 123,220$ 476,822$ 494,046$ 105,996$ Elementary/Middle
Student Activity Fund 54,767 138,279 124,796 68,250 HS Athletic Fund - 43,550 43,550 - MS Athletic Fund - 7,400 7,400 -
Total Assets 177,987$ 666,051$ 669,792$ 174,246$
LIABILITIES
Due to Student Groups 177,987$ 666,051$ 669,792$ 174,246$
Total Liabilities 177,987$ 666,051$ 669,792$ 174,246$
EXHIBIT H-4
BALANCE BALANCEJULY 1, JUNE 30,
ASSETS 2015 ADDITIONS DELETIONS 2016
Cash & Cash Equivalents 162,339$ 12,016,253$ 12,009,802$ 168,790$
Total Assets 162,339$ 12,016,253$ 12,009,802$ 168,790$
LIABILITIES
Net Payroll Deductions & Withholdings 162,339 12,016,253 12,009,802 168,790
Total Liabilities 162,339$ 12,016,253$ 12,009,802$ 168,790$
PAYROLL AGENCY FUNDSCHEDULE OF RECEIPTS AND DISBURSEMENTS
FOR THE FISCAL YEAR ENDED JUNE 30, 2016
UPPER FREEHOLD REGIONAL SCHOOL DISTRICTSTUDENT ACTIVITY AGENCY FUND
SCHEDULE OF RECEIPTS AND DISBURSEMENTSFOR THE FISCAL YEAR ENDED JUNE 30, 2016
149

restricted and unrestricted net assets are available and have determined that net assets were properly recognized under the policy.
42) We acknowledge our responsibility for the required supplementary information (RSI). The RSI is measured and presented within prescribed guidelines and the methods of measurement and presentation have not changed from those used in the prior period. We have disclosed to you any significant assumptions and interpretations underlying the measurement and presentation of the RSI.
Signature: Signature:
Title: Title:
RESERVED FOR MD&A LETTER
150

I. Long-Term Debt
and obligations under capital leases.general long-term liabilities of the School District. This includes serial bonds outstanding
The Long-Term Schedules are used to reflect the outstanding principal balances of the
151

This page intentionally left blank
152

EXHIBIT I-1(Page 1 of 2)
AMOUNT BALANCE BALANCEDATE OF OF INTEREST JUNE 30, JUNE 30,
ISSUE ISSUE ISSUE DATE AMOUNT RATE 2015 ISSUED REFUNDED PAYMENTS 2016
November 1,School 2/24/2004 $5,445,000 2016 495,000 3.600% 1,000,000$ -$ -$ 505,000$ 495,000$ RefundingBonds
February 15,School 2/1/2005 32,586,000 2016 110,000 4.000% 210,000 - - 100,000 110,000 Bonds
February 15,School 11/2/2006 9,760,000 2017 20,000 4.000% 9,580,000 - - 20,000 9,560,000Refunding 2018 20,000 4.000%Bonds 2019 25,000 4.000%
2020 25,000 4.000%2021 25,000 4.000%2022 25,000 4.000%2023 30,000 4.000%2024 365,000 4.000%2025 25,000 4.375%2026 25,000 4.375%2027 25,000 4.375%2028 30,000 4.375%2029 30,000 4.375%2030 30,000 4.375%2031 30,000 4.375%2032 35,000 4.375%2033 2,815,000 4.375%2034 2,930,000 4.375%2035 3,050,000 4.375%
July 15,School 7/15/2007 12,238,000 2016 400,000 4.50% 785,000 - - 385,000 400,000Bonds
Subtotal 11,575,000 - - 1,010,000 10,565,000
ANNUAL MATURITY
UPPER FREEHOLD REGIONAL SCHOOL DISTRICT LONG-TERM DEBT
STATEMENT OF SERIAL BONDSJune 30, 2016
153

EXHIBIT I-1(Page 2 of 2)
AMOUNT BALANCE BALANCEDATE OF OF INTEREST JUNE 30, JUNE 30,
ISSUE ISSUE ISSUE DATE AMOUNT RATE 2015 ISSUED REFUNDED PAYEMENTS 2016
July 15,School 5/4/2010 9,175,000 2016 720,000 4.000% 7,175,000 - - 685,000 6,490,000 Refunding 2017 750,000 4.000%Bonds 2018 785,000 5.000%
2019 830,000 5.000%2020 870,000 5.000%2021 915,000 4.500%2022 960,000 4.500%2023 660,000 4.500%
School 7/23/2014 9,595,000 2016 30,000 2.000% 9,595,000 - - 30,000 9,565,000 Refunding 2017 450,000 3.000%Bonds 2018 465,000 4.000%
2019 480,000 3.000%2020 495,000 4.000%2021 515,000 4.000%2022 535,000 4.000%2023 555,000 4.000%2024 580,000 4.000%2025 605,000 5.000%2026 635,000 4.000%2027 655,000 4.000%2028 680,000 3.000%2029 700,000 3.125%2030 725,000 4.000%2031 750,000 4.000%2032 710,000 4.000%
School 4/1/2015 23,025,000 2017 - 2.000% 23,025,000 - - 235,000 22,790,000 Refunding 2018 610,000 3.000%Bonds 2019 640,000 4.000%
2020 665,000 3.000%2021 700,000 4.000%2022 735,000 4.000%2023 775,000 4.000%2024 810,000 4.000%2025 1,895,000 4.000%2026 1,960,000 5.000%2027 2,050,000 4.000%2028 2,170,000 4.000%2029 2,285,000 3.000%2030 2,410,000 3.125%2031 2,490,000 4.000%2032 2,595,000 4.000%
Subtotal 39,795,000 - - 950,000 38,845,000
Total 51,370,000$ -$ -$ 1,960,000$ 49,410,000$
UPPER FREEHOLD REGIONAL SCHOOL DISTRICT LONG-TERM DEBT
STATEMENT OF SERIAL BONDS30-Jun-16
ANNUAL MATURITY
154

EXH
IBIT
I-2
AM
OU
NT
AM
OU
NT
AM
OU
NT
INTE
RES
TO
FO
UTS
TAN
DIN
GIS
SUED
RET
IRED
OU
TSTA
ND
ING
RA
TEO
RIG
INA
LJU
NE
30,
CU
RR
ENT
CU
RR
ENT
JUN
E 30
, IT
EMPA
YA
BLE
ISSU
E20
15Y
EAR
YEA
RA
DJU
STM
ENT
2016
Tech
nolo
gy E
quip
men
t1.
42%
400,
000
162,
828
$
-
$
80
,838
$
-
$
81,9
90$
Tech
nolo
gy E
quip
men
t1.
31%
237,
630
144,
340
-
47
,575
-
96,7
65
Tech
nolo
gy E
quip
men
t1.
80%
248,
792
199,
404
-
48
,300
-
151,
104
Tech
nolo
gy E
quip
men
t1.
80%
256,
000
-
25
6,00
0
24
,473
-
231,
527
506,
572
$
25
6,00
0$
20
1,18
6$
-
$
561,
386
$
UPP
ER
FR
EE
HO
LD
RE
GIO
NA
L S
CH
OO
L D
IST
RIC
TL
ON
G-T
ER
M D
EB
TSC
HE
DU
LE
OF
OB
LIG
AT
ION
S U
ND
ER
CA
PIT
AL
LE
ASE
SFO
R T
HE
FIS
CA
L Y
EA
R E
ND
ED
JU
NE
30,
201
6
155

EXHIBIT I-3
POSITIVE/NEGATIVE
ORIGINAL BUDGET FINAL FINAL TOBUDGET TRANSFERS BUDGET ACTUAL ACTUAL
Revenues: Local Sources: Local Tax Levy 3,766,496$ -$ 3,766,496$ 3,766,496$ -$ State Sources: Debt Service Aid Type II 106,731 - 106,731 106,731 -
Total Revenues 3,873,227 - 3,873,227 3,873,227 -
Expenditures: Regular Debt Service: Redemption of Principal 1,725,000 235,000 1,960,000 1,960,000 - Interest on Bonds 2,148,228 (235,000) 1,913,228 1,902,623 10,605
Total Expenditures 3,873,228 - 3,873,228 3,862,623 10,605
Excess/(Deficiency) of Revenues Over/(Under) Expenditures (1) - (1) 10,604 (10,605)Fund Balance July 1, 55,585 - 55,585 55,585 -
Fund Balance June 30, 55,584$ -$ 55,584$ 66,189$ (10,605)$
UPPER FREEHOLD REGIONAL SCHOOL DISTRICTDEBT SERVICE FUND
BUDGETARY COMPARISON SCHEDULEFOR THE FISCAL YEAR ENDED JUNE 30, 2016
June 30, 2016
156

STATISTICAL SECTION (Unaudited)
157

This page intentionally left blank
158

Financial Trends Information
Financial trends information is intended to assist the user in understanding and assessing how the School District's financial position has changed over time. Please refer to the following exhibits for a historical view of the School
District's financial performance. Note that the Exhibits are presented for the last ten fiscal years.
159

This page intentionally left blank
160

EXH
IBIT
J-1
2016
2015
2014
2013
2012
2011
2010
2009
2008
2007
Gov
ernm
enta
l Act
iviti
es:
In
vest
ed in
Cap
ital A
sset
s,
N
et o
f Rel
ated
Deb
t11
,066
,234
$
10,6
64,1
98$
15
,184
,910
$
15
,905
,809
$
15
,931
,984
$
16
,537
,818
$
12
,594
,180
$
8,
162,
390
$
7,77
9,86
0$
7,
146,
626
$
Res
trict
ed1,
780,
474
1,59
1,40
11,
473,
823
2,74
7,84
53,
472,
919
2,55
1,77
84,
439,
828
5,33
9,12
15,
330,
227
4,85
3,42
1
Unr
estri
cted
(8,9
70,4
45)
(8,2
02,4
74)
(1,5
79,8
72)
(380
,786
)(8
4,15
3)(8
23,8
92)
(786
,870
)(9
37,3
92)
(786
,399
)(5
10,4
34)
Tota
l Gov
ernm
enta
l Act
iviti
es
Net
Pos
ition
3,87
6,26
3$
4,
053,
125
$
15,0
78,8
61$
18,2
72,8
68$
19,3
20,7
50$
18,2
65,7
04$
16,2
47,1
38$
12,5
64,1
19$
12,3
23,6
88$
9,37
6,54
6$
Bus
ines
s-Ty
pe A
ctiv
ities
:
Inve
sted
in C
apita
l Ass
ets,
Net
of R
elat
ed D
ebt
295,
832
$
31
5,07
1$
321,
244
$
118,
649
$
60,2
34$
76,3
92$
85,6
69$
97,3
17$
108,
890
$
22,4
79$
Unr
estri
cted
285,
594
264,
111
368,
904
354,
309
380,
670
332,
938
285,
451
282,
430
300,
854
344,
253
Tota
l Bus
ines
s-Ty
pe A
ctiv
ities
N
et P
ositi
on58
1,42
6$
579,
182
$
69
0,14
8$
47
2,95
8$
44
0,90
4$
40
9,33
0$
37
1,12
0$
37
9,74
7$
40
9,74
4$
30
1,33
5$
Dis
trict
-Wid
e:
Net
Inve
stem
ent i
n
C
apita
l Ass
ets
11,3
62,0
66$
10
,979
,269
$
15,5
06,1
54$
16,0
24,4
58$
15,9
92,2
18$
16,6
14,2
10$
12,6
79,8
49$
8,25
9,70
7$
7,
888,
750
$
6,85
2,26
0$
R
estri
cted
1,78
0,47
41,
591,
401
1,47
3,82
32,
747,
845
3,47
2,91
92,
551,
778
4,43
9,82
85,
339,
121
5,33
0,22
73,
210,
231
U
nres
trict
ed(8
,684
,851
)(7
,938
,363
)(1
,210
,968
)(2
6,47
7)29
6,51
7(4
90,9
54)
(501
,419
)(6
54,9
62)
(485
,545
)(3
84,6
10)
Tota
l Dis
trict
Net
Pos
ition
4,45
7,68
9$
4,
632,
307
$
15,7
69,0
09$
18,7
45,8
26$
19,7
61,6
54$
18,6
75,0
34$
16,6
18,2
58$
12,9
43,8
66$
12,7
33,4
32$
9,67
7,88
1$
UPP
ER
FR
EE
HO
LD
RE
GIO
NA
L S
CH
OO
L D
IST
RIC
TN
ET
PO
SIT
ION
BY
CO
MPO
NE
NT
LA
ST T
EN
FIS
CA
L Y
EA
RS
(Acc
rual
Bas
is o
f Acc
ount
ing)
FISC
AL
YEA
R E
ND
ING
JUN
E 30
,
161

EXH
IBIT
J-2
2016
2015
2014
2013
2012
2011
2010
2009
2008
2007
Expe
nses
: G
over
nmen
tal A
ctiv
ities
In
stru
ctio
n:
R
egul
ar11
,072
,993
$
10,9
22,9
50$
11,2
53,2
65$
11,2
30,5
94$
10,4
16,7
19$
13,7
00,0
58$
13,8
35,9
96$
13,9
91,8
36$
13,3
52,5
18$
12,7
18,7
06$
Spe
cial
Edu
catio
n4,
063,
510
4,13
9,28
4
3,
770,
427
3,75
6,37
8
3,
634,
594
3,98
9,13
7
4,
139,
755
4,04
4,97
5
3,
866,
629
3,38
7,00
4
O
ther
Spe
cial
Inst
ruct
ion
300,
184
16
2,25
3
220,
688
18
4,55
6
277,
994
43
5,85
5
472,
049
45
3,31
0
462,
458
67
0,84
8
O
ther
Inst
ruct
ion
657 ,
355
69
3,37
0
671,
181
68
6,64
7
672,
951
84
8,49
7
1,16
2,23
6
1,
117,
387
1,01
4,19
8
97
9,46
8
Sup
port
Serv
ices
:
T
uitio
n96
7,64
8
628,
523
62
0,03
8
861,
425
1,
034,
879
1,01
1,54
7
87
0,92
9
820,
954
67
5,45
5
686,
042
Stu
dent
& In
stru
ctio
n R
elat
ed S
ervi
ces
4,56
3,33
4
4,
577,
878
4,31
5,73
2
4,
086,
559
3,90
4,70
6
5,
283,
263
5,88
1,76
4
4,
310,
409
3,90
8,07
1
3,
093,
702
Gen
eral
& B
usin
ess A
dmin
istra
tive
Serv
ices
498,
276
56
8,74
5
569,
667
58
0,18
7
605,
049
69
3,84
9
705,
259
71
4,97
1
806,
985
75
6,67
3
S
choo
l Adm
inis
trativ
e Se
rvic
es1,
350,
947
1,31
7,80
2
1,
374,
527
1,27
1,76
8
1,
164,
906
1,71
3,58
9
1,
684,
203
1,67
1,49
6
1,
910,
849
1,79
4,29
6
C
entra
l Ser
vice
s42
5,39
7
448,
404
41
4,07
7
414,
077
40
6,27
8
490,
081
45
6,92
4
438,
861
60
1,37
8
468,
007
Adm
inis
trativ
e In
form
atio
n Te
chno
logy
104,
202
11
3,25
1
111,
130
12
2,05
2
78,9
09
17
0,21
2
242,
999
34
5,63
4
248,
841
25
0,93
1
P
lant
Ope
ratio
ns a
nd M
aint
enan
ce2,
593,
238
2,78
2,80
7
2,
952,
941
2,77
6,64
8
2,
760,
106
3,71
7,91
4
3,
577,
511
3,26
3,35
5
3,
241,
401
3,13
2,60
6
P
upil
Tran
spor
tatio
n1,
925,
126
1,67
7,02
7
1,
620,
690
1,54
6,10
0
1,
705,
789
1,54
2,61
3
1,
884,
507
1,87
2,99
3
1,
645,
325
1,42
8,59
2
U
nallo
cate
d B
enef
its15
,842
,812
13,5
07,4
72
9,08
7,95
4
9,
154,
772
7,85
4,63
8
-
-
-
-
-
Int
eres
t on
Long
-Ter
m D
ebt
2,09
0,12
1
2,
499,
450
2,30
3,66
8
2,
371,
763
2,41
8,25
6
2,
578,
753
2,52
5,66
3
2,
710,
102
2,60
2,00
6
2,
066,
327
Una
lloca
ted
Dep
reci
atio
n2,
170,
480
2,20
0,64
3
3,
309,
361
2,17
1,80
3
2,
178,
365
1,53
4,48
0
97
9,28
4
987,
294
1,
138,
628
1,16
6,97
8
A
mor
tizat
ion
Expe
nse
--
-54
,715
54
,715
-
-
-
-
-
U
nallo
cate
d C
ompe
nsat
ed A
bsen
ces E
xpen
se-
--
-20
,790
-
-
-
-
-
U
nallo
cate
d A
djus
tmen
t to
Cap
ital A
sset
s25
6,39
3
119,
231
-
-
18
4,00
0
-
-
-
-
-
T
otal
Gov
ernm
enta
l Act
iviti
es E
xpen
ses
48,8
82,0
1646
,359
,090
42,5
95,3
4641
,270
,044
39,3
73,6
4437
,709
,848
38,4
19,0
7936
,743
,577
35,4
74,7
4232
,600
,180
Bus
ines
s-Ty
pe A
ctiv
ities
:
Foo
d Se
rvic
e70
3,57
4
697,
965
75
7,20
1
757,
201
78
7,41
7
734,
119
75
5,57
2
699,
848
61
9,34
8
603,
619
C
hild
Wat
ch19
0,11
6
199,
799
19
7,10
1
197,
101
20
1,63
3
215,
748
29
9,68
3
359,
468
37
0,93
9
322,
389
C
omm
unity
Edu
catio
n-
--
--
-12
,651
22
,241
38
,294
41
,460
K
inde
rgar
ten
Com
plem
ent
161,
603
15
8,39
8
149,
303
14
9,30
3
131,
143
19
0,67
4
-
-
-
-
AH
S Su
mm
er P
rogr
ams
10,2
10
-
-
-
-
-
-
-
-
-
Mill
ston
e B
usin
g-
-
-
-
-
80
1,33
0
-
-
-
-
Tota
l Bus
ines
s-Ty
pe A
ctiv
ities
Exp
ense
1,06
5,50
3
1,
056,
162
1,10
3,60
5
1,
103,
605
1,12
0,19
3
1,
941,
871
1,06
7,90
6
1,
081,
557
1,02
8,58
1
96
7,46
8
T
otal
Dis
trict
Exp
ense
s49
,947
,519
$
47,4
15,2
52$
43,6
98,9
51$
42,3
73,6
49$
40,4
93,8
37$
39,6
51,7
19$
39,4
86,9
85$
37,8
25,1
34$
36,5
03,3
23$
33,5
67,6
48$
Prog
ram
Rev
enue
s: G
over
nmen
tal A
ctiv
ities
:
Cha
rges
for S
ervi
ces:
Inst
ruct
ion
(Tui
tion)
8,38
6,71
5$
8,
172,
799
$
8,31
1,31
6$
8,
311,
316
$
9,10
1,11
3$
10
,016
,242
$
9,
393,
954
$
8,75
9,04
0$
8,
018,
059
$
7,36
5,50
1$
Pupi
l Tra
nspo
rtatio
n62
,704
103,
123
58
,430
58
,430
91
,965
101,
123
17
,692
53
,463
16
,016
62
,967
O
pera
ting
Gra
nts &
Con
tribu
tions
9,38
9,35
4
7,
682,
693
580,
584
58
0,58
4
605,
984
4,
087,
006
5,11
4,03
3
4,
238,
731
4,28
3,91
2
4,
083,
118
C
apita
l Gra
nts a
nd C
ontri
butio
ns-
--
-
-
952,
856
4,
011,
447
-
30,6
93
375,
136
Tota
l Gov
ernm
enta
l Act
iviti
es P
rogr
am
Rev
enue
s17
,838
,773
15,9
58,6
15
8,95
0,33
0
8,
950,
330
9,79
9,06
2
15
,157
,227
18
,537
,126
13
,051
,234
12
,348
,680
11
,886
,722
Bus
ines
s-Ty
pe A
ctiv
ities
:
Cha
rges
for S
ervi
ces:
Foo
d Se
rvic
e54
3,92
4
449,
568
55
4,14
1
554,
141
63
4,12
1
646,
298
60
7,39
1
597,
379
58
0,34
9
594,
178
Chi
ld W
atch
224,
223
21
5,07
6
204,
920
20
4,92
0
233,
525
22
9,61
2
329,
575
34
4,39
9
317,
303
33
7,43
8
C
omm
unity
Edu
catio
n-
--
--
-16
,179
17
,354
31
,826
33
,625
Kin
der g
arte
n C
ompl
emen
t17
1,58
0
117,
600
19
2,29
9
192,
299
14
2,45
4
146,
900
-
-
-
-
AH
S Su
mm
er P
rogr
ams
24,7
34
-
-
-
-
-
-
-
-
-
M
illst
one
Bus
ing
-
-
-
-
-
801,
330
-
-
-
-
Ope
ratin
g G
rant
s & C
ontri
butio
ns:
Foo
d Se
rvic
e79
,768
143,
545
12
8,46
4
128,
464
14
0,46
7
109,
654
10
3,39
5
86,6
25
69,2
18
61,1
09
Tota
l Bus
ines
s Typ
e A
ctiv
ities
Pro
gram
R
even
ues
1,04
4,22
9
92
5,78
9
1,07
9,82
4
1,
079,
824
1,15
0,56
7
1,
933,
794
1,05
6,54
0
1,
045,
757
998,
696
1,
026,
350
UPP
ER
FR
EE
HO
LD
RE
GIO
NA
L S
CH
OO
L D
IST
RIC
TC
HA
NG
ES
IN N
ET
PO
SIT
ION
- (A
CC
RU
AL
BA
SIS
OF
AC
CO
UN
TIN
G)
LA
ST T
EN
FIS
CA
L Y
EA
RS
FISC
AL
YEA
R E
ND
ING
JUN
E 30
,
162

EXH
IBIT
J-2
2016
2015
2014
2013
2012
2011
2010
2009
2008
2007
UPP
ER
FR
EE
HO
LD
RE
GIO
NA
L S
CH
OO
L D
IST
RIC
TC
HA
NG
ES
IN N
ET
PO
SIT
ION
- (A
CC
RU
AL
BA
SIS
OF
AC
CO
UN
TIN
G)
LA
ST T
EN
FIS
CA
L Y
EA
RS
FISC
AL
YEA
R E
ND
ING
JUN
E 30
,
Tota
l Dis
trict
Pro
gram
Rev
enue
s18
,883
,002
$
16,8
84,4
04$
10,0
30,1
54$
10,0
30,1
54$
10,9
49,6
29$
17,0
91,0
21$
19,5
93,6
66$
14,0
96,9
91$
13,3
47,3
76$
12,9
13,0
72$
Net
(Exp
ense
)/Rev
enue
:
Gov
ernm
enta
l Act
iviti
es(3
1,04
3,24
3)$
(30,
400,
475)
$(3
3,64
5,01
6)$
(32,
319,
714)
$(2
9,57
4,58
2)$
(22,
552,
621)
$(1
9,88
1,95
3)$
(23,
692,
343)
$(2
3,12
6,06
2)$
(20,
713,
458)
$
Bus
ines
s-Ty
pe A
ctiv
ities
(21,
274)
(130
,373
)(2
3,78
1)(2
3,78
1)30
,374
(8,0
77)
(11,
366)
(35,
800)
(29,
885)
58,8
82
T
otal
Gov
ernm
ent-W
ide
Net
Exp
ense
(31,
064,
517)
$(3
0,53
0,84
8)$
(33,
668,
797)
$(3
2,34
3,49
5)$
(29,
544,
208)
$(2
2,56
0,69
8)$
(19,
893,
319)
$(2
3,72
8,14
3)$
(23,
155,
947)
$(2
0,65
4,57
6)$
Gen
eral
Rev
enue
s & O
ther
Cha
nges
in N
et A
sset
s: G
over
nmen
tal A
ctiv
ities
:
Pro
perty
Tax
es L
evie
d fo
r Gen
eral
Pur
pose
s, N
et20
,937
,139
$
20,0
45,5
62$
18,7
22,2
71$
18,7
22,2
71$
18,3
55,1
68$
18,0
83,9
10$
17,3
88,7
07$
16,9
27,2
26$
16,5
09,0
74$
15,5
97,4
79$
T
axes
Lev
ied
for D
ebt S
ervi
ce3,
766,
496
3,80
6,67
3
3,
807,
652
3,80
7,65
2
3,
856,
255
3,43
5,28
9
3,
308,
827
2,58
0,50
5
2,
385,
075
2,31
0,73
7
Unr
estri
cted
Gra
nts &
Con
tribu
tions
5,83
1,78
7
5,
904,
035
8,48
3,72
8
8,
483,
728
7,71
3,04
1
2,
880,
966
2,61
7,63
9
3,
621,
107
3,21
9,85
2
3,
113,
897
In
vest
men
t Ear
ning
s-
-
-
-
-
51
,788
18
0,49
7
631,
705
1,
640,
121
1,68
3,58
2
Mis
cella
neou
s Inc
ome
330,
959
38
7,82
7
282,
502
28
2,50
2
698,
770
16
3,00
8
69,3
02
177,
118
20
1,77
5
119,
521
T
rans
fers
-
-
(24,
322)
(24,
322)
-(4
3,77
4)-
(4,8
87)
(6,4
68)
1,30
9
T
otal
Gov
ernm
enta
l Act
iviti
es30
,866
,381
30,1
44,0
9731
,271
,831
31,2
71,8
3130
,623
,234
24,5
71,1
8723
,564
,972
23,9
32,7
7423
,949
,429
22,8
26,5
25
Bus
ines
s-Ty
pe A
ctiv
ities
:
Inve
stem
ent E
arni
ngs
23,5
1819
,095
27,1
0027
,100
1,20
02,
513
2,73
991
68,
031
7,82
4
Adj
ustm
ents
to F
ixed
Ass
ets
-
31
2
-
-
-
-
-
-
-
-
T
rans
fers
-
-
-
-
-
43,7
74
-
4,88
7
6,
468
(1,3
09)
T
otal
Bus
ines
s-Ty
pe A
ctiv
ities
23,5
18
19
,407
27
,100
27
,100
1,
200
46,2
87
2,73
9
5,
803
14,4
99
6,51
5
Tota
l Gov
ernm
ent-W
ide
30,8
89,8
99$
30
,163
,504
$
31
,298
,931
$
31
,298
,931
$
30
,624
,434
$
24
,617
,474
$
23
,567
,711
$
23
,938
,577
$
23
,963
,928
$
22
,833
,040
$
Cha
nge
in N
et P
ositi
on:
G
over
nmen
tal A
ctiv
ities
(176
,862
)$
(256
,378
)$
(2,3
73,1
85)
$(1
,047
,882
)$
1,04
8,65
2$
2,01
8,56
6$
3,68
3,01
9$
240,
431
$82
3,36
7$
2,11
3,06
7$
B
usin
ess-
Type
Act
iviti
es2,
244
(110
,966
)3,
319
3,31
931
,574
38,2
10(8
,627
)(2
9,99
7)(1
5,38
6)65
,397
T
otal
Dis
trict
(174
,618
)$
(367
,344
)$
(2,3
69,8
66)
$(1
,044
,563
)$
1,08
0,22
6$
2,05
6,77
6$
3,67
4,39
2$
210,
434
$80
7,98
1$
2,17
8,46
4$
163

EXH
IBIT
J-3
2016
2015
2014
2013
2012
2011
2010
2009
2008
2007
Gen
eral
Fun
d:
Res
erve
d-
$
-$
-
$
-$
-
$
855,
591
$
1,41
2,28
6$
848,
512
$
1,14
9,61
3$
U
nres
erve
d-
-
-
-
-
420,
350
354,
899
507,
406
491,
428
R
estri
cted
1,71
4,28
5
1,
535,
816
1,47
3,82
0
2,
747,
842
3,45
4,01
4
1,
991,
403
-
-
-
-
A
ssig
ned
162,
580
18
0,00
0
250,
000
-
140,
112
43
7,83
0
-
-
-
-
U
nass
igne
d25
5,08
7
357,
622
25
9,18
8
311,
452
36
9,58
3
442,
338
-
-
-
-
Tota
l Gen
eral
Fun
d2,
131,
952
$
2,07
3,43
8$
1,
983,
008
$
3,05
9,29
4$
3,
963,
709
$
2,87
1,57
1$
1,
275,
941
$
1,
767,
185
$
1,
355,
918
$
1,
641,
041
$
All
Oth
er G
over
nmen
tal F
unds
:
Res
erve
d-
$
-$
-
$
-$
-
$
-$
3,
652,
585
$
20
,431
,607
$
46
0,67
2$
53
7,18
0$
Unr
eser
ved,
Rep
orte
d in
:
D
ebt S
ervi
ce F
und
-
-
-
-
-
-
148
445,
001
366,
263
456,
491
Des
igna
ted
for S
ubse
quen
t
Yea
r's E
xpen
ditu
res
-
-
-
-
-
-
88,8
95
(1,8
02,2
87)
37
,206
,360
30
,149
,343
Res
trict
ed66
,189
55,5
85
3
3
18
,905
372,
545
-
-
-
-
Tota
l All
Oth
er G
over
nmen
tal
F
unds
66,1
89$
55
,585
$
3$
3$
18,9
05$
37
2,54
5$
3,74
1,62
8$
19,0
74,3
21$
38,0
33,2
95$
31,1
43,0
14$
FISC
AL
YEA
R E
ND
ING
JUN
E 30
,
UPP
ER
FR
EE
HO
LD
RE
GIO
NA
L S
CH
OO
L D
IST
RIC
TFU
ND
BA
LA
NC
ES
AN
D G
OV
ER
NM
EN
TA
L F
UN
DS
LA
ST T
EN
FIS
CA
L Y
EA
RS
(Mod
ified
Acc
rual
Bas
is o
f Acc
ount
ing)
164

EXH
IBIT
J-4
2016
2015
2014
2013
2012
2011
2010
2009
2008
2007
Rev
enue
s:
Tax
es L
ocal
24,7
03,6
35$
23,8
52,2
35$
23,0
87,8
07$
22,5
29,9
23$
22,2
11,4
23$
21,5
19,1
99$
20,6
97,5
34$
19,5
07,7
31$
18,8
94,1
49$
17,9
08,2
16$
Tui
tion
Cha
r ges
8,38
6,71
58,
172,
799
7,51
5,56
88,
311,
316
9,10
1,11
310
,016
,242
9,39
3,95
48,
759,
040
8,01
8,05
97,
365,
501
In
tere
st E
arni
n gs
62,7
0410
3,12
357
,540
58,4
3091
,965
51,7
8818
0,49
763
1,70
51,
640,
121
1,68
3,58
2
Ren
ts a
nd R
o yal
ties
11,0
1812
,163
-
-
-
-
-
-
-
-
M
isce
llane
ous
261,
032
375,
664
174,
325
282,
502
240,
775
289,
157
99,3
6326
8,48
824
2,21
119
8,63
6
Sta
te S
ourc
es9,
966,
426
9,38
3,85
68,
772,
769
8,65
8,52
37,
724,
970
7,38
5,25
810
,543
,205
7,45
9,93
07,
143,
871
7,19
8,54
5
Fed
eral
Sou
rces
558,
190
513,
855
421,
158
405,
789
594,
055
510,
544
1,18
7,54
536
2,00
136
6,16
635
7,45
8
T
otal
Rev
enue
43,9
49,7
2042
,413
,695
40,0
29,1
6740
,246
,483
39,9
64,3
0139
,772
,188
42,1
02,0
9836
,988
,895
36,3
04,5
7734
,711
,938
Expe
nditu
res:
Ins
truct
ion:
R
e gul
ar In
stru
ctio
n11
,072
,993
10,9
22,9
5011
,042
,421
10,8
30,5
9410
,416
,719
10,3
26,6
6310
,796
,737
10,7
51,8
9510
,030
,717
9,26
9,31
2
Spe
cial
Edu
catio
n In
stru
ctio
n4,
063,
510
4,13
9,28
43,
770,
427
3,75
6,37
83,
634,
594
2,95
8,92
53,
128,
149
3,11
3,77
12,
756,
463
2,45
4,56
6
Oth
er In
stru
ctio
n95
7,53
985
5,62
389
1,86
987
1,20
395
0,94
599
3,32
91,
171,
398
1,16
7,18
31,
112,
726
1,19
4,01
3Su
ppor
t Ser
vice
s:
Tui
tion
967,
648
628,
523
620,
038
861,
425
1,03
4,87
91,
011,
547
870,
929
820,
954
675,
455
780,
832
S
tude
nt &
Inst
ruct
ion
Rel
ated
Ser
vice
s4,
563,
334
4,57
7,87
84,
315,
732
4,08
6,55
93,
993,
663
3,98
0,17
54,
364,
486
3,48
1,86
63,
127,
662
2,84
0,37
1
Gen
eral
& B
usin
ess
Adm
inis
tratio
n Se
rvic
es49
8,27
656
8,74
556
9,66
758
0,18
759
8,65
561
9,45
362
6,72
366
0,86
969
4,59
473
5,21
7
Sch
ool A
dmin
istra
tive
Ser
vice
s1,
350,
947
1,31
7,80
21,
374,
527
1,27
1,76
81,
164,
906
1,24
4,63
41,
263,
153
1,27
3,59
31,
368,
222
1,24
0,71
2
Cen
tral S
ervi
ces
425,
397
448,
404
426,
307
414,
077
406,
278
408,
511
380,
280
361,
042
380,
117
347,
380
A
dmin
istra
tive
Info
rmat
ion
Tec
hnol
o gy
104,
202
113,
251
111,
130
122,
052
78,9
0914
1,19
819
9,95
528
7,68
724
8,84
125
0,93
1
Pla
nt O
pera
tions
&
M
aint
enan
ce3,
124,
092
3,03
3,21
43,
150,
111
3,21
2,47
93,
208,
007
3,27
9,37
03,
191,
916
3,14
1,33
82,
928,
285
2,79
5,83
4
Pu p
il Tr
ansp
orta
tion
1,92
5,12
61,
677,
027
1,62
0,69
01,
546,
100
1,70
5,78
91,
418,
617
1,70
8,70
01,
791,
983
1,69
3,19
91,
463,
477
U
nallo
cate
d B
enef
its10
,633
,164
9,83
8,29
69,
099,
577
9,09
1,49
57,
854,
638
6,98
5,54
56,
980,
903
6,15
3,00
47,
013,
180
6,37
2,82
6C
a pita
l out
lay
646,
660
527,
529
448,
474
969,
119
644,
372
4,68
7,84
519
,823
,552
19,2
11,5
356,
677,
775
1,24
3,69
2D
ebt s
ervi
ce:
P
rinci
pal
1,96
0,00
01,
645,
000
1,59
5,00
01,
565,
000
1,54
5,00
01,
590,
000
1,44
0,00
01,
180,
000
1,05
0,00
01,
110,
000
In
tere
st &
Oth
er C
har g
es1,
902,
623
2,48
6,92
32,
334,
807
2,39
1,36
52,
446,
444
2,38
0,71
72,
571,
654
2,61
4,99
52,
373,
715
2,06
4,27
9
T
otal
Exp
endi
ture
s44
,195
,511
42,7
80,4
4941
,370
,777
41,5
69,8
0139
,683
,798
42,0
26,5
2958
,518
,535
56,0
11,7
1542
,130
,951
34,1
63,4
42
Exce
ss (D
efic
ienc
y) o
f Rev
enue
s
Ove
r/(U
nder
) Exp
endi
ture
s(2
45,7
91)
(366
,754
)(1
,341
,610
)(1
,323
,317
)28
0,50
3(2
,254
,341
)(1
6,41
6,43
7)(1
9,02
2,82
0)(5
,826
,374
)54
8,49
6
UPP
ER
FR
EE
HO
LD
RE
GIO
NA
L S
CH
OO
L D
IST
RIC
TC
HA
NG
ES
IN F
UN
D B
AL
AN
CE
S, G
OV
ER
NM
EN
TA
L F
UN
DS,
LA
ST T
EN
FIS
CA
L Y
EA
RS
(Mod
ified
Acc
rual
Bas
is o
f Acc
ount
ing)
165

EXH
IBIT
J-4
2016
2015
2014
2013
2012
2011
2010
2009
2008
2007
Rev
enue
s:
UPP
ER
FR
EE
HO
LD
RE
GIO
NA
L S
CH
OO
L D
IST
RIC
TC
HA
NG
ES
IN F
UN
D B
AL
AN
CE
S, G
OV
ER
NM
EN
TA
L F
UN
DS,
LA
ST T
EN
FIS
CA
L Y
EA
RS
(Mod
ified
Acc
rual
Bas
is o
f Acc
ount
ing)
Oth
er F
inan
cing
Sou
rces
/(Use
s):
B
ond
Proc
eeds
-
35,3
47,6
38
-
-
-
-
-
-
12,2
38,0
00
9,76
0,00
0
D
epos
it w
ith E
scro
w A
gent
-
(35,
083,
664)
-
-
-
-
-
-
-
(9,7
60,0
00)
W
ithdr
awl f
rom
Leg
al R
eser
ve-
-
-
-
-
-
-
-
-
-
C
ompe
nsat
ion
for L
oss o
n Fi
xed
Ass
ets
-
-
-
-
457,
995
-
-
-
-
-
Pro
ceed
s fro
m C
apita
l Lea
ses
256,
000
248,
792
237,
630
400,
000
-
356,
000
59
2,50
0
480,
000
200,
000
-
Tra
nsfe
rs in
58,9
09
-
10,4
77
(7,9
99)
18
7,05
3
16
8,66
2
392,
037
62
4,31
7
1,
581,
287
55
7,58
7
Tra
nsfe
rs O
ut-
-
-
-
(1
87,0
53)
16,3
29
(392
,037
)
(6
29,2
04)
(1,5
87,7
55)
(5
56,2
78)
-
-
-
-
-
(3
0,10
3)
-
-
-
-
Tota
l Oth
er F
inan
cing
Sou
rces
/(Use
s)31
4,90
9
51
2,76
6
24
8,10
7
39
2,00
1
45
7,99
5
51
0,88
8
592,
500
47
5,11
3
12
,431
,532
1,
309
Net
Cha
nge
in F
und
Bal
ance
s69
,118
$
14
6,01
2$
(1
,093
,503
)$
(931
,316
)$
73
8,49
8$
(1
,743
,453
)$
(15,
823,
937)
$
(1
8,54
7,70
7)$
6,
605,
158
$
54
9,80
5$
Deb
t Ser
vice
as a
Per
cent
age
of
Non
capi
tal E
xpen
ditu
res
8.9%
9.8%
9.6%
9.7%
10.2
%10
.6%
10.4
%10
.3%
8.2%
9.6%
Sour
ce: D
istri
ct R
ecor
ds
166

EXHIBIT J-5
FISCAL INTERESTYEAR ENDING ON TRANSPORTATION
JUNE 30, INVESTMENTS TUITION FROM LEA'S OTHER TOTAL
2016 -$ 8,386,715$ 62,704$ 251,159$ 8,700,578$ 2015 - 8,172,799 103,123 368,699 8,644,621 2014 1,613 7,515,568 57,540 168,096 7,742,817 2013 4,626 8,311,316 58,430 244,848 8,619,220 2012 3,765 9,101,113 91,965 194,431 9,391,274 2011 35,459 10,016,242 101,123 163,008 10,315,8322010 28,350 9,393,954 17,692 69,302 9,509,298 2009 7,388 8,759,040 53,463 177,118 8,997,009 2008 83,178 8,018,059 16,016 177,431 8,294,684 2007 130,265 7,365,501 62,967 119,521 7,678,254
Source: District records
UPPER FREEHOLD REGIONAL SCHOOL DISTRICTGENERAL FUND - OTHER LOCAL REVENUE BY SOURCE
LAST TEN FISCAL YEARS(Modified Accrual Basis of Accounting)
167

restricted and unrestricted net assets are available and have determined that net assets were properly recognized under the policy.
42) We acknowledge our responsibility for the required supplementary information (RSI). The RSI is measured and presented within prescribed guidelines and the methods of measurement and presentation have not changed from those used in the prior period. We have disclosed to you any significant assumptions and interpretations underlying the measurement and presentation of the RSI.
Signature: Signature:
Title: Title:
RESERVED FOR MD&A LETTER
168

Revenue Capacity Information
Revenue capacity information is intended to assist users in understanding and assessing the factors affecting the School District's ability to generate revenues. Please refer to the following exhibits for a historical view of these
factors and how they relate to the School District's ability to generate revenues.
169

This page intentionally left blank
170

EXH
IBIT
J-6
(b)
ESTI
MA
TED
FISC
AL
TOTA
LA
CTU
AL
YEA
R
TOTA
L(a
)N
ETTA
XD
IREC
T(C
OU
NTY
END
EDV
AC
AN
TFA
RM
ASS
ESSE
DPU
BLI
CV
ALU
ATI
ON
EXEM
PTSC
HO
OL
EQU
ALI
ZED
)JU
NE
30,
LAN
DR
ESID
ENTI
AL
REG
.Q
FAR
MC
OM
MER
CIA
LIN
DU
STR
IAL
APA
RTM
ENT
VA
LUE
UTI
LITI
ES
TAX
AB
LEPR
OPE
RTY
TAX
RA
TEV
ALU
E
Bor
ough
of A
llent
own
2016
$860
,900
171,
759,
100
700
14,2
97,8
004,
892,
900
191,
811,
400
191,
811,
400
40,4
27,5
001.
8730
21
0,40
3,84
120
15$7
68,9
0017
1,41
7,80
072
514
,291
,600
4,89
2,30
019
1,37
1,32
519
1,37
1,32
540
,427
,500
1.68
90
184,
917,
697
2014
768,
900
171,
804,
250
725
14,2
91,6
004,
892,
300
191,
757,
775
191,
757,
775
40,4
05,8
001.
6900
18
4,67
6,76
520
1377
3,40
017
1,14
0,00
060
014
,524
,700
4,79
2,30
019
1,23
1,00
019
1,23
1,00
040
,389
,200
1.64
70
193,
149,
507
2012
773,
400
172,
318,
400
600
14,7
78,2
004,
792,
300
192,
662,
900
192,
662,
900
40,3
89,2
001.
6240
18
7,23
1,00
020
1177
8,00
017
4,71
3,20
060
014
,778
,200
4,79
2,30
019
5,06
2,30
019
5,06
2,30
040
,384
,600
1.57
90
192,
662,
900
2010
367,
200
90,9
53,1
504,
300
8,15
1,00
02,
368,
400
101,
844,
050
843,
601
102,
687,
651
17,1
16,2
002.
9070
21
7,45
2,00
420
0939
6,30
090
,703
,850
4,30
08,
151,
000
2,36
8,40
010
1,62
3,85
083
5,92
710
2,45
9,77
717
,113
,000
2.78
30
214,
722,
746
2008
430,
700
90,1
45,2
004,
300
8,15
1,00
02,
368,
400
101,
099,
600
744,
981
101,
844,
581
17,1
13,0
002.
7700
21
7,24
4,00
020
0750
9,60
089
,274
,450
4,30
08,
788,
900
2,76
0,10
010
1,33
7,35
097
9,60
010
2,31
6,95
017
,113
,000
2.63
90
201,
310,
974
Upp
er F
reeh
old
Tow
nshi
p20
1622
,589
,100
978,
039,
100
146,
716,
200
9,32
2,70
045
,403
,300
12,7
25,1
0041
9,90
01,
215,
215,
400
1,21
5,21
5,40
018
9,07
8,20
01.
7800
1,
271,
424,
733
2015
20,9
97,9
0097
4,42
9,00
015
2,58
5,10
09,
475,
100
48,9
37,6
0013
,101
,500
419,
000
1,21
9,94
5,20
02,
246,
862
1,21
9,94
5,20
020
2,99
0,90
01.
7600
1,
240,
072,
685
2014
25,1
28,2
0093
4,33
0,80
015
5,68
5,30
09,
584,
000
43,9
95,3
0013
,573
,300
396,
300
1,18
2,69
3,20
02,
246,
862
1,18
2,69
3,20
019
3,34
8,10
01.
7470
1,
198,
843,
245
2013
25,9
18,0
0094
0,51
8,00
015
4,66
6,10
09,
399,
200
46,0
01,2
0013
,573
,300
396,
300
1,19
0,47
2,10
02,
246,
862
1,19
2,71
8,96
219
0,76
1,40
01.
6720
1,
251,
540,
248
2012
23,2
82,0
0092
8,79
5,00
015
5,76
1,80
09,
868,
200
41,5
39,5
0013
,573
,300
396,
300
1,17
3,21
6,10
02,
261,
626
1,17
5,47
7,72
618
2,93
9,50
01.
6500
1,
257,
654,
517
2011
24,4
88,3
0092
3,21
8,50
016
0,60
5,90
09,
898,
800
41,1
66,2
0013
,572
,100
396,
300
1,17
3,34
6,10
02,
362,
572
1,17
5,70
8,67
217
6,96
8,30
01.
6300
1,
303,
966,
484
2010
24,3
71,4
001,
017,
799,
800
179,
397,
700
9,75
2,90
044
,613
,300
14,6
71,1
0042
7,90
01,
291,
034,
100
3,02
1,87
11,
294,
055,
971
173,
674,
500
1.43
20
1,29
4,92
7,23
120
0925
,534
,400
1,06
8,52
8,30
017
7,38
8,70
09,
820,
700
47,6
96,3
0014
,671
,100
427,
900
1,34
4,06
7,40
03,
585,
249
1,34
7,65
2,64
916
9,90
9,30
01.
3240
1,
335,
342,
079
2008
30,6
01,7
001,
069,
197,
500
175,
747,
600
9,77
4,10
046
,857
,000
14,6
71,1
0042
7,90
01,
347,
276,
900
3,70
7,88
71,
350,
984,
787
168,
743,
500
1.23
60
1,31
9,51
5,24
220
0743
,060
,200
1,03
0,17
7,60
017
3,57
5,50
010
,149
,600
46,0
29,5
0014
,588
,000
427,
900
1,31
8,00
8,30
02,
509,
829
1,32
0,51
8,12
916
2,61
9,60
01.
2260
1,
240,
674,
187
a. T
axab
le v
alue
of m
achi
nery
, im
plem
ents
and
equ
ipm
ent o
f tel
epho
ne, t
eleg
raph
and
mes
seng
er sy
stem
com
pani
esb.
Tax
rate
s are
per
$10
0 of
ass
esse
d va
lue
* P
rope
rty re
valu
atio
n be
cam
e ef
fect
ive
in th
is y
ear.
UPP
ER
FR
EE
HO
LD
RE
GIO
NA
L S
CH
OO
L D
IST
RIC
TA
SSE
SSE
D V
AL
UE
AN
D A
CT
UA
L V
AL
UE
OF
TA
XA
BL
E P
RO
PER
TY
,L
AST
TE
N F
ISC
AL
YE
AR
S
171

EXH
IBIT
J-7
FISC
AL
TOTA
LY
EAR
GEN
ERA
LD
IREC
T A
ND
END
EDO
BLI
GA
TIO
NTO
TAL
BO
RO
UG
H O
FM
ON
MO
UTH
OV
ERLA
PPIN
GJU
NE
30,
BA
SIC
RA
TED
EBT
SER
VIC
ED
IREC
TA
LLEN
TOW
NC
OU
NTY
TAX
RA
TEA
llent
own
Bor
ough
2016
1.58
70.
2860
1.87
30N
/AN
/A1.
8730
2015
1.41
90.
2700
1.68
900.
8110
0.30
602.
8060
2014
1.41
10.
2790
1.69
000.
8110
0.30
602.
8070
2013
1.36
900.
2780
1.64
700.
7790
0.31
202.
7380
2012
1.34
210.
2819
1.62
400.
7220
0.30
502.
6510
2011
1.31
720.
2617
1.57
890.
6630
0.30
802.
5499
2010
2.44
290.
4641
2.90
701.
2360
0.58
204.
7250
2009
2.33
810.
4449
2.78
301.
2070
0.54
904.
5390
2008
2.40
360.
3664
2.77
001.
1230
0.54
704.
4400
2007
2.30
590.
3331
2.63
901.
0540
0.53
904.
2320
FISC
AL
TOTA
LY
EAR
GEN
ERA
LU
PPER
DIR
ECT
AN
DEN
DED
OB
LIG
ATI
ON
TOTA
LFR
EEH
OLD
MO
NM
OU
THO
VER
LAPP
ING
JUN
E 30
,B
ASI
C R
ATE
DEB
T SE
RV
ICE
DIR
ECT
TOW
NSI
PC
OU
NTY
TAX
RA
TEU
pper
Fre
ehol
d T
owns
hip
2016
1.50
900.
2710
1.78
00N
/AN
/AN
/A20
151.
4790
0.28
101.
7600
0.27
600.
3110
2.34
7020
141.
4610
0.28
901.
7500
0.26
800.
3140
2.33
2020
131.
3820
0.29
001.
6720
1.46
800.
3190
3.45
9020
121.
3560
0.29
401.
6500
1.91
000.
3110
3.87
1020
111.
3426
0.28
211.
6247
0.23
000.
3100
2.16
4720
101.
2033
0.22
871.
4320
0.20
800.
2700
1.91
0020
091.
1123
0.21
171.
3240
0.18
900.
2550
1.76
8020
081.
0725
0.16
351.
2360
0.17
400.
2480
1.65
8020
071.
0712
0.15
481.
2260
0.15
200.
2540
1.63
20
SCH
OO
L D
ISTR
ICT
DIR
ECT
RA
TEO
VER
LAPP
ING
RA
TES
SCH
OO
L D
ISTR
ICT
DIR
ECT
RA
TE
UPP
ER
FR
EE
HO
LD
RE
GIO
NA
L S
CH
OO
L D
IST
RIC
TD
IRE
CT
AN
D O
VE
RL
APP
ING
PR
OPE
RT
Y T
AX
RA
TE
SL
AST
TE
N F
ISC
AL
YE
AR
S(R
ate
per $
100
of A
sses
sed
Val
ue)
OV
ERLA
PPIN
G R
ATE
S
172
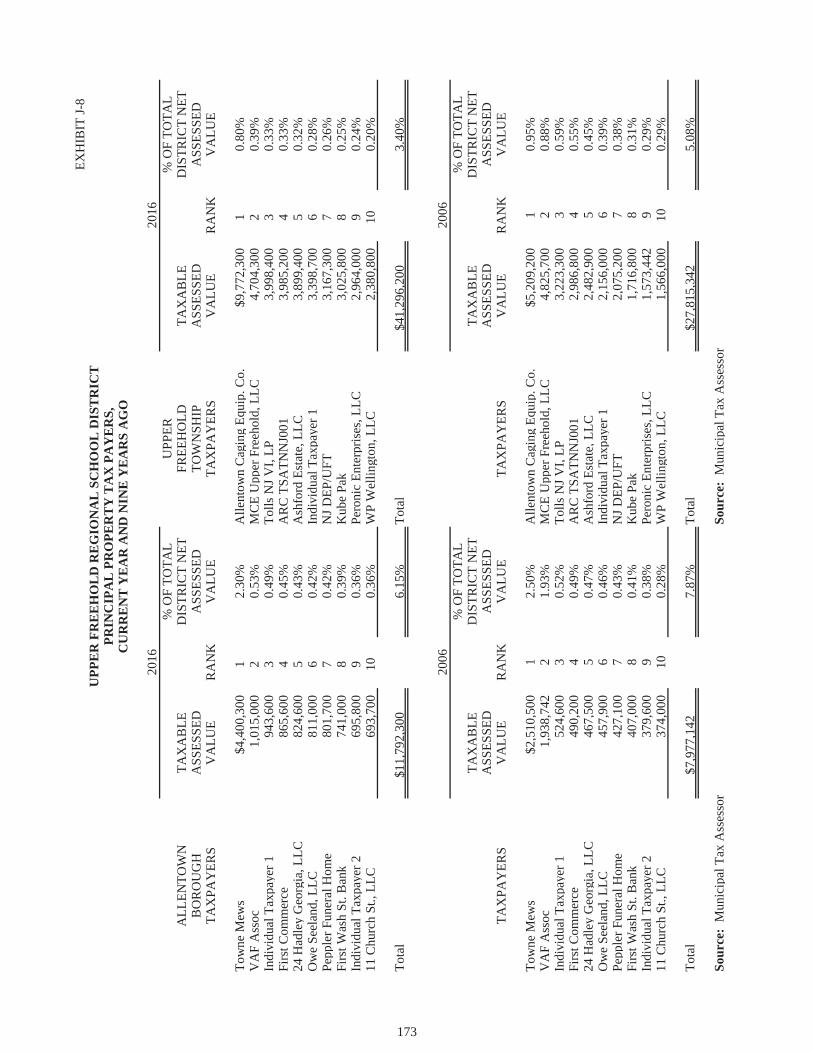
EXH
IBIT
J-8
% O
F TO
TAL
UPP
ER%
OF
TOTA
LA
LLEN
TOW
NTA
XA
BLE
DIS
TRIC
T N
ETFR
EEH
OLD
TAX
AB
LED
ISTR
ICT
NET
BO
RO
UG
HA
SSES
SED
ASS
ESSE
DTO
WN
SHIP
ASS
ESSE
DA
SSES
SED
TAX
PAY
ERS
VA
LUE
RA
NK
VA
LUE
TAX
PAY
ERS
VA
LUE
RA
NK
VA
LUE
Tow
ne M
ews
$4,4
00,3
001
2.30
%A
llent
own
Cag
ing
Equi
p. C
o.$9
,772
,300
10.
80%
VA
F A
ssoc
1,01
5,00
02
0.53
%M
CE
Upp
er F
reeh
old,
LLC
4,70
4,30
02
0.39
%In
divi
dual
Tax
paye
r 194
3,60
03
0.49
%To
lls N
J VI,
LP3,
998,
400
30.
33%
Firs
t Com
mer
ce86
5,60
04
0.45
%A
RC
TSA
TNN
J001
3,98
5,20
04
0.33
%24
Had
ley
Geo
rgia
, LLC
824,
600
50.
43%
Ash
ford
Est
ate,
LLC
3,89
9,40
05
0.32
%O
we
Seel
and,
LLC
811,
000
60.
42%
Indi
vidu
al T
axpa
yer 1
3,39
8,70
06
0.28
%Pe
pple
r Fun
eral
Hom
e80
1,70
07
0.42
%N
J DEP
/UFT
3,16
7,30
07
0.26
%Fi
rst W
ash
St. B
ank
741,
000
80.
39%
Kub
e Pa
k3,
025,
800
80.
25%
Indi
vidu
al T
axpa
yer 2
695,
800
90.
36%
Pero
nic
Ente
rpris
es, L
LC2,
964,
000
90.
24%
11 C
hurc
h St
., LL
C69
3,70
010
0.36
%W
P W
ellin
gton
, LLC
2,38
0,80
010
0.20
%
Tota
l$1
1,79
2,30
06.
15%
Tota
l$4
1,29
6,20
03.
40%
% O
F TO
TAL
% O
F TO
TAL
TAX
AB
LED
ISTR
ICT
NET
TAX
AB
LED
ISTR
ICT
NET
ASS
ESSE
DA
SSES
SED
ASS
ESSE
DA
SSES
SED
TAX
PAY
ERS
VA
LUE
RA
NK
VA
LUE
TAX
PAY
ERS
VA
LUE
RA
NK
VA
LUE
Tow
ne M
ews
$2,5
10,5
001
2.50
%A
llent
own
Cag
ing
Equi
p. C
o.$5
,209
,200
10.
95%
VA
F A
ssoc
1,93
8,74
22
1.93
%M
CE
Upp
er F
reeh
old,
LLC
4,82
5,70
02
0.88
%In
divi
dual
Tax
paye
r 152
4,60
03
0.52
%To
lls N
J VI,
LP3,
223,
300
30.
59%
Firs
t Com
mer
ce49
0,20
04
0.49
%A
RC
TSA
TNN
J001
2,98
6,80
04
0.55
%24
Had
ley
Geo
rgia
, LLC
467,
500
50.
47%
Ash
ford
Est
ate,
LLC
2,48
2,90
05
0.45
%O
we
Seel
and,
LLC
457,
900
60.
46%
Indi
vidu
al T
axpa
yer 1
2,15
6,00
06
0.39
%Pe
pple
r Fun
eral
Hom
e42
7,10
07
0.43
%N
J DEP
/UFT
2,07
5,20
07
0.38
%Fi
rst W
ash
St. B
ank
407,
000
80.
41%
Kub
e Pa
k1,
716,
800
80.
31%
Indi
vidu
al T
axpa
yer 2
379,
600
90.
38%
Pero
nic
Ente
rpris
es, L
LC1,
573,
442
90.
29%
11 C
hurc
h St
., LL
C37
4,00
010
0.28
%W
P W
ellin
gton
, LLC
1,56
6,00
010
0.29
%
Tota
l$7
,977
,142
7.87
%To
tal
$27,
815,
342
5.08
%
Sour
ce:
Mun
icip
al T
ax A
sses
sor
Sour
ce:
Mun
icip
al T
ax A
sses
sor
2016
2006
2016
2006
UPP
ER
FR
EE
HO
LD
RE
GIO
NA
L S
CH
OO
L D
IST
RIC
TPR
INC
IPA
L P
RO
PER
TY
TA
X P
AY
ER
S,C
UR
RE
NT
YE
AR
AN
D N
INE
YE
AR
S A
GO
173

EXHIBIT J-9
FISCAL TAXES COLLECTIONSYEAR LEVIED FOR IN
ENDED THE FISCAL PERCENTAGE SUBSEQUENTJUNE 30, YEAR AMOUNT OF LEVY YEARS
Allentown Borough2016 $3,232,888 $3,232,888 100.00% N/A2015 $3,194,837 $3,194,837 100.00% N/A2014 $3,148,682 3,148,682 100.00% N/A2013 3,129,158 3,129,158 100.00% N/A2012 3,109,383 3,109,383 100.00% N/A2011 2,985,372 2,985,372 100.00% N/A2010 2,851,860 2,851,860 100.00% N/A2009 2,821,382 2,821,382 100.00% N/A2008 2,699,785 2,699,785 100.00% N/A2007 2,638,616 2,638,616 100.00% N/A
Upper Freehold Township2016 $21,470,747 $21,470,747 100.00% N/A2015 $20,657,398 $20,657,398 100.00% N/A2014 19,939,125 19,939,125 100.00% N/A2013 19,400,865 19,400,865 100.00% N/A2012 19,102,040 19,102,040 100.00% N/A2011 18,533,827 18,533,827 100.00% N/A2010 17,845,674 17,845,674 100.00% N/A2009 16,686,349 16,686,349 100.00% N/A2008 16,194,364 16,194,364 100.00% N/A2007 15,269,600 15,269,600 100.00% N/A
(a) School taxes are collected by the Municipal Tax Collector. Under New Jersey State Statute, a municipalityis required to remit to the School District the entire property tax balance, in the amount voted upon or certifiedprior to the end of the school year.
Source: Upper Freehold Regional School District records, including the Certificate and Report ofSchool Taxes (A4F Form).
OF THE LEVY(a)
PROPERTY TAX LEVIES AND COLLECTIONSLAST TEN FISCAL YEARS
THE FISCAL YEAR
UPPER FREEHOLD REGIONAL SCHOOL DISTRICT
COLLECTED WITHIN
174

Debt Capacity Information
Debt capacity information is intended to assist in understanding and assessing the School District's debt burden and its ability to issue additional debt. Please refer to the following exhibits for a historical view of the School District's
outstanding debt and its debt capacity.
175

This page intentionally left blank
176

EXHIBIT J-10
BUSINESS-FISCAL BOND TYPE PERCENTAGEYEAR GENERAL ANTICIPATION ACTIVITIES OF
ENDED OBLIGATION CAPITAL NOTES CAPITAL TOTAL PER CAPITAJUNE 20, BONDS LEASES (BANs) LEASES DISTRICT INCOME PER CAPITA
2016 49,410,000$ 561,386$ N/A 92,726$ 50,064,112$ N/A 7,2692015 83,990,000 506,572 N/A 92,726 84,589,298 N/A 12,2792014 52,943,000 508,187 N/A 128,925 53,580,112 N/A 7,7632013 52,973,000 798,017 N/A N/A 53,771,017 N/A 7,7912012 56,103,000 657,435 N/A N/A 56,760,435 11.40% 6,5022011 57,648,000 1,105,336 N/A N/A 58,753,336 12.31% 6,7402010 59,238,000 1,055,073 N/A N/A 60,293,073 12.63% 6,9172009 60,851,000 934,954 N/A N/A 61,785,954 12.37% 7,0922008 62,031,000 958,040 N/A N/A 62,989,040 13.00% 7,259
Note: Details regarding the district's outstanding debt can be found in the notes to the financial statements.
GOVERNMENTAL ACTIVITIES
UPPER FREEHOLD REGIONAL SCHOOL DISTRICTRATIOS OF OUTSTANDING DEBT BY TYPE
LAST NINE FISCAL YEARS
177

EXHIBIT J-11
NET PERCENTAGEFISCAL GENERAL OF ACTUALYEAR GENERAL BONDED TAXABLE
ENDED OBLIGATION DEBT VALUE OFJUNE 30, BONDS DEDUCTIONS OUTSTANDING PROPERTY PER CAPITA
2016 49,410,000$ 49,410,000$ 4.066% 7,1742015 51,370,000 51,370,000 4.343% 7,4572014 52,943,000 - 52,943,000 7.102% 7,6712013 52,973,000 - 52,973,000 4.441% 7,6752012 56,103,000 - 56,103,000 4.092% 2,3932011 57,648,000 - 57,648,000 4.127% 6,6132010 59,238,000 - 59,238,000 4.085% 6,7962009 60,851,000 - 60,851,000 4.191% 6,9852008 62,031,000 - 62,031,000 4.360% 7,148
GENERAL BONDED DEBT OUTSTANDING
UPPER FREEHOLD REGIONAL SCHOOL DISTRICTRATIOS OF NET GENERAL BONDED DEBT OUTSTANDING
LAST NONE FISCAL YEARS
178

EXHIBIT J-12
DEBT PERCENTAGE OVERLAPPINGOUTSTANDING APPLICABLE DEBT
Allentown Borough: Debt Repaid With Property Taxes: Allentown Borough $2,654,760 100.000% $2,654,760 Monmouth County General Obligaiton Debt 479,236,724 0.18163% 870,438
Subtotal, Overlapping Debt 3,525,198Allentown Borough School District -
Total Direct & Overlapping Debt $3,525,198
Upper Freehold Township: Debt Repaid With Property Taxes: Upper Freehold Township $16,411,915 100.000% $16,411,915 Monmouth County General Obligaiton Debt 479,236,724 1.09752% 5,259,719
Subtotal, Overlapping Debt 21,671,634Upper Freehold School District Direct Debt 50,064,112
Total Direct & Overlapping Debt $71,735,746
Sources: Assessed value data used to estimate applicable percentages provided by the Monmouth County Board of Taxation.
Debt outstanding data provided by each governmental unit.NOTE - Overlapping governments are those that coincide, at least in part, with the geographic boundariesof the District.This schedule estimates the portion of the outstanding debt of those overlapping governments that is borneby the residents and businesses of the above Municipalities. This process recognizes that, when considering theDistrict's ability to issue and repay Long-Term debt, the entire debt burden borne by the residents and businessesshould be taken into account. However, this does not imply that every taxpayer is a resident, and thereforeresponsible for repaying the debt, of each overlapping payment.a. For debt repaid with property taxes, the percentage of overlapping debt applicable is estimated using taxableassessed property values. Applicable percentages were estimated by determining the portion of anothergovernment unit's taxable value that is within the District's boundaries and dividing it by each unit's totaltaxable value.
UPPER FREEHOLD REGIONAL SCHOOL DISTRICTRATIOS OF OVERLAPPING GOVERNMENTAL ACTIVITIES DEBT
AS OF JUNE 30, 2016
GOVERNMENTAL UNIT
179

EXH
IBIT
J-13
2016
2015
2014
2013
2012
2011
2010
2009
2008
2007
Deb
t Lim
it57
,018
,700
$
57
,018
,700
$
57
,300
,588
$
58
,765
,386
$
60
,168
,099
$
73,6
16,9
23$
73
,602
,503
$
71
,464
,256
$
66
,570
,251
$
59
,890
,193
$
Tota
l Net
Deb
t App
licab
le to
Lim
it49
,410
,000
51
,370
,000
52
,943
,000
54
,538
,000
56
,103
,000
57,6
48,0
00
59
,238
,000
60
,851
,000
62
,031
,000
50
,843
,000
Lega
l Deb
t Mar
gin
$7,6
08,7
00$5
,648
,700
4,35
7,58
84,
227,
386
4,06
5,09
915
,968
,923
14,3
64,5
0310
,613
,256
4,53
9,25
19,
047,
193
Tota
l Net
Deb
t App
licab
le to
the
Lim
it
as a
Per
cent
age
of D
ebt L
imit
86.6
6%90
.09%
92.4
0%92
.81%
93.2
4%78
.31%
80.4
8%85
.15%
93.1
8%84
.89%
Upp
erA
llent
own
Free
hold
Tota
l
2015
$210
,168
,539
$1,2
63,5
45,6
89$1
,473
,714
,228
2014
$184
,826
,347
$1,2
27,4
96,8
34$1
,412
,323
,181
2013
$186
,530
,433
$1,2
06,0
81,5
27$1
,392
,611
,960
$4,2
78,6
49,3
69
Ave
rage
Equ
aliz
ed V
alua
tion
of T
axab
le P
rope
rty$1
,426
,216
,456
Deb
t Lim
it (4
.0 %
of A
vera
ge E
qual
izat
ion
Val
ue)
$57,
048,
658
Net
Bon
ded
Scho
ol D
ebt
49,4
10,0
00
Lega
l Deb
t Mar
gin
$7,6
38,6
58
Sour
ce:
Equa
lized
val
uatio
n ba
ses w
ere
obta
ined
from
the
Ann
ual R
epor
t of t
he S
tate
of N
ew Je
rsey
,D
epar
tmen
t of T
reas
ury,
Div
isio
n of
Tax
atio
n
Equa
lized
Val
uatio
n B
asis
Leg
al D
ebt M
argi
n C
alcu
latio
n fo
r Fi
scal
Yea
r 20
13
UPP
ER
FR
EE
HO
LD
RE
GIO
NA
L S
CH
OO
L D
IST
RIC
TL
EG
AL
DE
BT
MA
RG
IN IN
FOR
MA
TIO
NL
AST
TE
N F
ISC
AL
YE
AR
S
180

Demographic and Economic Information
Demographic and economic information is intended (1) to assist users in understanding the socioeconomic environment within which the School District operates and (2) to provide information that facilitates comparisons of
financial statement information over time and among school districts. Please refer to the following exhibits for a historical view of the demographic and economics statistics and factors prevalent in the location in which the School
District operates.
181

This page intentionally left blank
182

EXHIBIT J-14
COUNTYPER CAPITA
BOROUGH OF ALLENTOWN PERSONAL PERSONAL UNEMPLOYMENTYEAR POPULATION (a) INCOME (b) INCOME (c) RATE (d)
2016 N/A N/A N/A N/A2015 1,825 N/A N/A 4.8%2014 1,823 66,019 120,352,637 5.1%2013 1,828 63,067 115,286,476 7.7%2012 1,830 63,001 115,291,830 7.4%2011 1,834 61,039 111,945,526 7.4%2010 1,828 57,873 105,791,844 7.3%2009 1,840 57,337 105,500,080 7.2%2008 1,844 59,915 110,483,260 4.4%2007 1,856 58,622 108,802,432 3.4%
2016 N/A N/A N/A N/A2015 6,887 N/A N/A 4.8%2014 6,886 66,019 454,606,834 7.2%2013 6,892 63,067 434,657,764 3.7%2012 6,875 63,001 433,131,875 3.6%2011 6,882 61,039 420,070,398 3.6%2010 6,900 57,873 399,232,700 3.6%2009 6,877 57,337 394,306,549 3.5%2008 6,868 59,915 411,496,220 2.1%2007 6,821 58,622 399,860,662 1.6%
Source: a Population information provided by the NJ Dept of Labor and Workforce Developmentb Per Capitac Personal Incomed Unemployment data provided by the NJ Dept of Labor and Workforce Development
UPPER FREEHOLD REGIONAL SCHOOL DISTRICTDEMOGRAPHIC AND ECONOMIC STATISTICS
LAST TEN FISCAL YEARS
UPPER FREEHOLD TOWNSHIP
183

EXHIBIT J-15
Source: Comprehensive Annual Financial Reports of Individual School Districts
NOT AVAILABLE
2016
UPPER FREEHOLD REGIONAL SCHOOL DISTRICTPRINCIPAL EMPLOYERS
CURRENT YEAR AND TEN YEARS AGO
2007
NOT AVAILABLE
184

Operating Information
Operating information is intended to provide contextual information about the School District's operations and resources to assist readers in using financial statement information to understand and assess the School District's
economic condition. Please refer to the following exhibits for a historical view of the factors and statistics pertinent to the School District's operations.
185

This page intentionally left blank
186

EXH
IBIT
J-16
Func
tion/
Prog
ram
2016
2015
2014
2013
2012
2011
2010
2009
2008
2007
Inst
ruct
ion:
R
egul
ar13
714
214
114
013
413
615
014
716
816
3
Spe
cial
Edu
catio
n61
6058
5156
5859
5820
18
Oth
er S
peci
al In
stru
ctio
n1
11
11
33
Supp
ort S
ervi
ces:
S
tude
nt &
Inst
ruct
ion
Rel
ated
Ser
vice
s61
6565
5553
5461
5630
30
Gen
eral
Adm
inst
rativ
e
S
ervi
ces
33
33
33
32
77
S
choo
l Adm
inis
trativ
e
S
ervi
ces
1719
2018
1717
2021
2121
P
lant
Ope
ratio
ns &
Mai
nten
ance
3027
3238
3839
3120
1515
P
upil
Tran
spor
tatio
n1
38
1919
1819
20
Bus
ines
s & O
ther
Sup
port
Serv
ices
1010
87
88
79
11
T
otal
320
327
328
316
318
335
350
331
284
278
Sour
ce: D
istri
ct P
erso
nnel
Rec
ords
UPP
ER
FR
EE
HO
LD
RE
GIO
NA
L S
CH
OO
L D
IST
RIC
TFU
LL
-TIM
E E
QU
IVA
LE
NT
DIS
TR
ICT
EM
PLO
YE
ES
BY
FU
NC
TIO
N/P
RO
GR
AM
LA
ST T
EN
FIS
CA
L Y
EA
RS
187
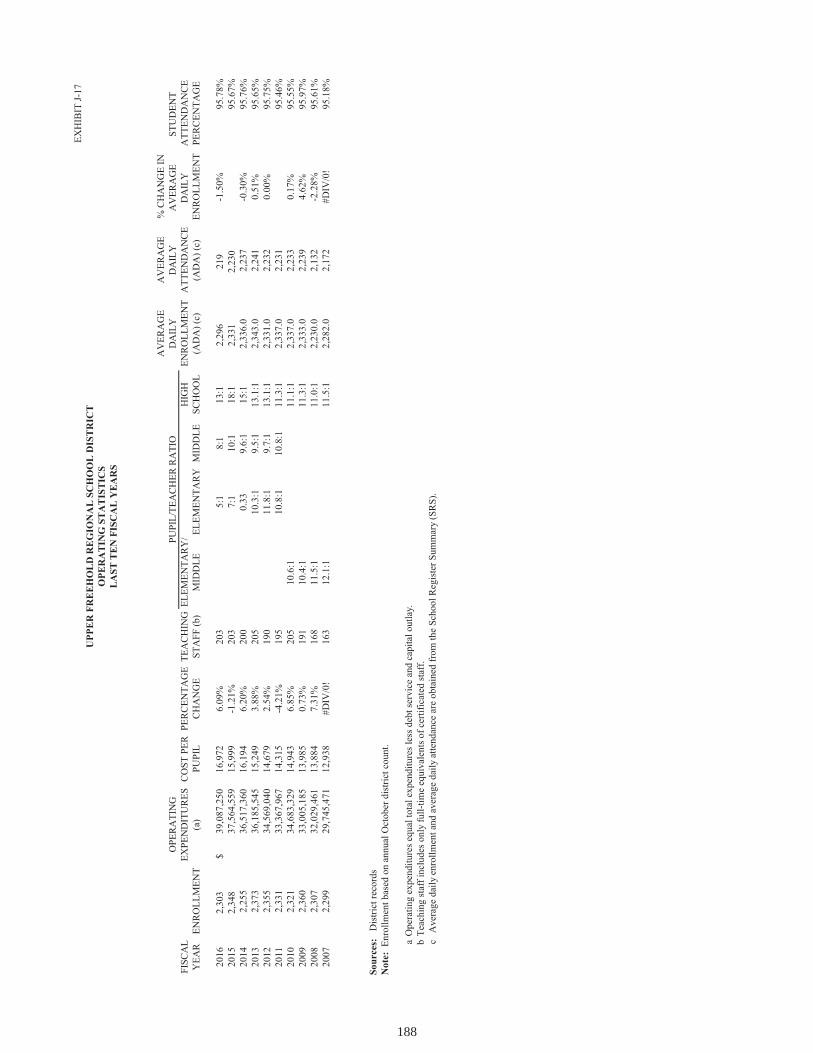
EXH
IBIT
J-17
AV
ERA
GE
AV
ERA
GE
% C
HA
NG
E IN
OPE
RA
TIN
GD
AIL
YD
AIL
YA
VER
AG
E ST
UD
ENT
FISC
AL
EXPE
ND
ITU
RES
CO
ST P
ERPE
RC
ENTA
GE
TEA
CH
ING
ELEM
ENTA
RY
/H
IGH
ENR
OLL
MEN
TA
TTEN
DA
NC
ED
AIL
Y
ATT
END
AN
CE
YEA
REN
RO
LLM
ENT
(a)
PUPI
LC
HA
NG
EST
AFF
(b)
MID
DLE
ELEM
ENTA
RY
MID
DLE
SCH
OO
L(A
DA
) (c)
(AD
A) (
c)EN
RO
LLM
ENT
PER
CEN
TAG
E
2016
2,30
3 $
39,
087,
250
16,9
72
6.09
%20
3 5:
18:
113
:12,
296
219
-1.5
0%95
.78%
2015
2,34
8
37,
564,
559
15,9
99
-1.2
1%20
3 7:
110
:118
:12,
331
2,23
095
.67%
2014
2,25
5
36,
517,
360
16,1
94
6.20
%20
0 0.
33
9.6:
115
:12,
336.
0 2,
237
-0.3
0%95
.76%
2013
2,37
3
36,
185,
545
15,2
49
3.88
%20
5 10
.3:1
9.5:
113
.1:1
2,34
3.0
2,24
1 0.
51%
95.6
5%20
122,
355
3
4,56
9,04
0 14
,679
2.
54%
190
11.8
:19.
7:1
13.1
:12,
331.
0 2,
232
0.00
%95
.75%
2011
2,33
1
33,
367,
967
14,3
15
-4.2
1%19
5 10
.8:1
10.8
:111
.3:1
2,33
7.0
2,23
1 95
.46%
2010
2,32
1
34,
683,
329
14,9
43
6.85
%20
5 10
.6:1
11.1
:12,
337.
0 2,
233
0.17
%95
.55%
2009
2,36
0
33,
005,
185
13,9
85
0.73
%19
1 10
.4:1
11.3
:12,
333.
0 2,
239
4.62
%95
.97%
2008
2,30
7
32,
029,
461
13,8
84
7.31
%16
8 11
.5:1
11.0
:12,
230.
0 2,
132
-2.2
8%95
.61%
2007
2,29
9
29,
745,
471
12,9
38
#DIV
/0!
163
12.1
:111
.5:1
2,28
2.0
2,17
2 #D
IV/0
!95
.18%
Sour
ces:
D
istri
ct re
cord
sN
ote:
Enr
ollm
ent b
ased
on
annu
al O
ctob
er d
istri
ct c
ount
.
aO
pera
ting
expe
nditu
res e
qual
tota
l exp
endi
ture
s les
s deb
t ser
vice
and
cap
ital o
utla
y.b
Teac
hing
staf
f inc
lude
s onl
y fu
ll-tim
e eq
uiva
lent
s of c
ertif
icat
ed st
aff.
cA
vera
ge d
aily
enr
ollm
ent a
nd a
vera
ge d
aily
atte
ndan
ce a
re o
btai
ned
from
the
Scho
ol R
egis
ter S
umm
ary
(SR
S).
UPP
ER
FR
EE
HO
LD
RE
GIO
NA
L S
CH
OO
L D
IST
RIC
TO
PER
AT
ING
ST
AT
IST
ICS
LA
ST T
EN
FIS
CA
L Y
EA
RS
PUPI
L/TE
AC
HER
RA
TIO
188

EXHIBIT J-18
DISTRICT BUILDINGS 2016 2015 2014 2013 2012 2011 2010 2009 2008 2007
High School: Square Feet 196,623 196,623 196,623 196,623 196,623 196,623 196,623 196,623 196,623 196,623 Capacity (Students) 1,264 1,264 1,264 1,264 1,264 1,264 1,264 1,264 1,264 1,264 Enrollment 1,273 1,262 1,240 1,240 1,218 1,166 1,144 1,139 1,078 1,075Middle School: Square Feet 14,200 14,200 142,000 142,000 142,000 142,000 - - - - Capacity (Students) 650 650 650 650 650 650 - - - - Enrollment 498 522 447 544 550 532 - - - - Elementary School: Square Feet 104,610 104,610 104,610 104,610 104,610 104,610 - - - - Capacity (Students) 1,286 1,286 1,286 1,286 1,286 1,286 - - - - Enrollment 532 564 568 575 587 633 - - - - Elementary/Middle School: Square Feet - - - - - - 104,610 104,610 104,610 104,610 Capacity (Students) - - - - - - 1,286 1,286 1,286 1,286 Enrollment - - - - - - 1,177 1,221 1,229 1,224Administration Building: Square Feet - - - - - 3,164 3,164 3,164 3,164 3,164Maintenance Offices (incl. Garage & Shed): Square Feet 6,326 6,326 6,326 6,326 6,326 6,326 6,326 6,326 6,326 6,326Imalystown School: Square Feet - - - - - 6,815 6,815 6,815 6,815 6,815Vocational Agricultural Building: Square Feet 13,696 13,696 13,696 13,696 13,696 13,696 13,696 13,696 13,696 13,696Annex Building: Square Feet 12,536 12,536 12,536 12,536 12,536 12,536 12,536 12,536 12,536 12,536
Number of Schools at June 30, 2016: Elementary = 1 Middle = 1 High School = 1 Other = 3
Source: Upper Freehold Regional School District Business Office.
Note: Increases in square footage and capacity are the result of additions.Enrollment is based on the annual October District count.
UPPER FREEHOLD REGIONAL SCHOOL DISTRICTSCHOOL BUILDING INFORMATION
LAST TEN FISCAL YEAR
189
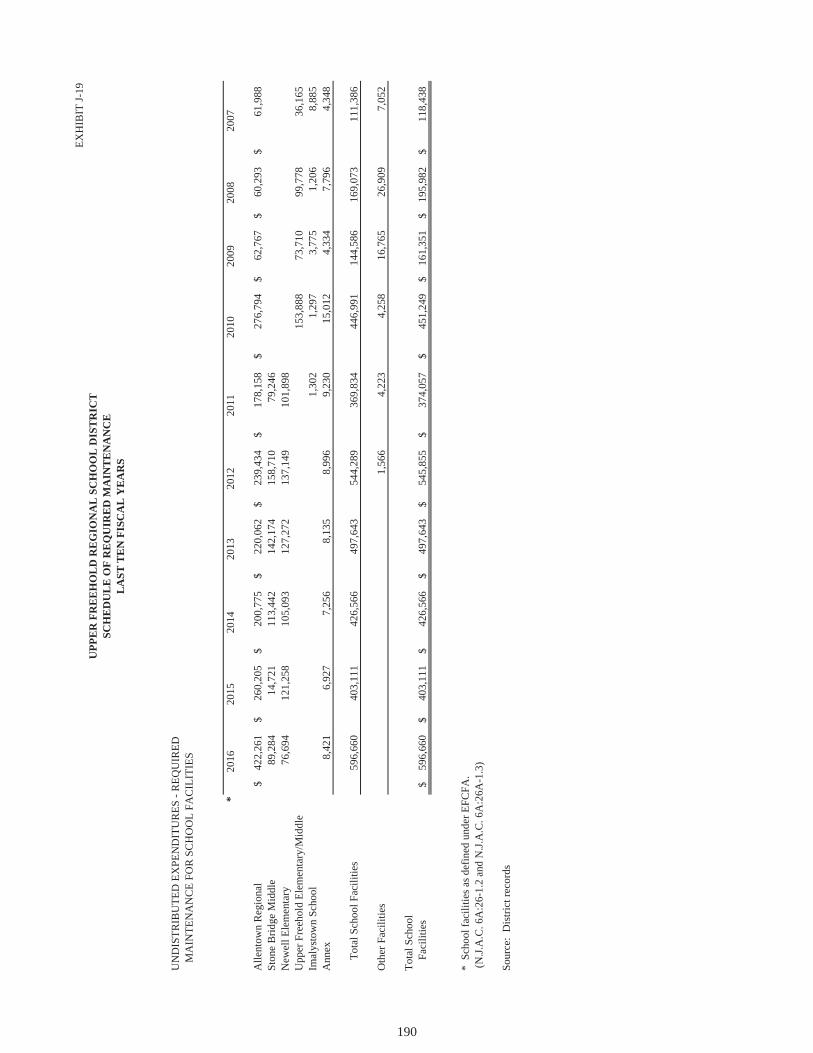
EXH
IBIT
J-19
UN
DIS
TRIB
UTE
D E
XPE
ND
ITU
RES
- R
EQU
IRED
M
AIN
TEN
AN
CE
FOR
SC
HO
OL
FAC
ILIT
IES
*20
1620
1520
1420
1320
1220
1120
1020
0920
0820
07
Alle
ntow
n R
egio
nal
422,
261
$
26
0,20
5$
200,
775
$
220,
062
$
239,
434
$
17
8,15
8$
27
6,79
4$
62
,767
$
60
,293
$
61
,988
$St
one
Brid
ge M
iddl
e89
,284
14,7
2111
3,44
2
14
2,17
415
8,71
079
,246
New
ell E
lem
enta
ry76
,694
121,
258
105,
093
127,
272
137,
149
101,
898
Upp
er F
reeh
old
Elem
enta
ry/M
iddl
e15
3,88
873
,710
99,7
7836
,165
Imal
ysto
wn
Scho
ol1,
302
1,29
73,
775
1,20
68,
885
Ann
ex8,
421
6,92
77,
256
8,
135
8,99
69,
230
15,0
124,
334
7,79
64,
348
T
otal
Sch
ool F
acili
ties
596,
660
403,
111
426,
566
497,
643
544,
289
369,
834
446,
991
144,
586
169,
073
111,
386
Oth
er F
acili
ties
1,56
64,
223
4,25
816
,765
26,9
097,
052
Tota
l Sch
ool
F
acili
ties
596,
660
$
40
3,11
1$
426,
566
$49
7,64
3$
545,
855
$37
4,05
7$
451,
249
$16
1,35
1$
195,
982
$
11
8,43
8$
* S
choo
l fac
ilitie
s as d
efin
ed u
nder
EFC
FA.
(N.J.
A.C
. 6A
:26-
1.2
and
N.J.
A.C
. 6A
:26A
-1.3
)
Sour
ce:
Dis
trict
reco
rds
UPP
ER
FR
EE
HO
LD
RE
GIO
NA
L S
CH
OO
L D
IST
RIC
TSC
HE
DU
LE
OF
RE
QU
IRE
D M
AIN
TE
NA
NC
EL
AST
TE
N F
ISC
AL
YE
AR
S
190

EXHIBIT J-20
COVERAGE DEDUCTIBLESchool Alliance Insurance Fund: School Package Policy: Property - Blanket Building & Contents 122,196,421 2,500 Commercial General Liability 5,000,000 2,000 Comprehensive Automobile Liability 5,000,000 1,000 Employee Benefits Liability 5,000,000 1,000 School Board Legal Liability 10,000,000
Excess Liability 10,000,000 CAP Excess
Public Employees' Faithful Performance Blanket Position Bond
Workers' Compensation - Employer's Liability Limit Part I: Workers' Compensation: 100,000 Part II: Employers' Liability 100,000
Public Official Bond: Board Secretary 100,000
Source: District records
UPPER FREEHOLD REGIONAL SCHOOL DISTRICTINSURANCE SCHEDULE
6/30/2016
191

restricted and unrestricted net assets are available and have determined that net assets were properly recognized under the policy.
42) We acknowledge our responsibility for the required supplementary information (RSI). The RSI is measured and presented within prescribed guidelines and the methods of measurement and presentation have not changed from those used in the prior period. We have disclosed to you any significant assumptions and interpretations underlying the measurement and presentation of the RSI.
Signature: Signature:
Title: Title:
RESERVED FOR MD&A LETTER
192

SINGLE AUDIT SECTION
193

This page intentionally left blank
194

EXHIBIT K-1
INDEPENDENT AUDITOR’S REPORT ON INTERNAL CONTROL OVER FINANCIAL REPORTING AND ON COMPLIANCE AND OTHER MATTERS BASED ON AN AUDIT OF
FINANCIAL STATEMENTS PERFORMED IN ACCORDANCE WITHGOVERNMENT AUDITING STANDARDS
Honorable President and Members of the Board of EducationUpper Freehold Regional School DistrictCounty of MonmouthAllentown, New Jersey 08501
We have audited, in accordance with the auditing standards generally accepted in the United States of America and the standards applicable to financial audits contained in Government Auditing Standards issued by the Comptroller General of the United States and audit requirements as prescribed by the Office of School Finance, Department of Education, State of New Jersey, the financial statements of the governmental and business-type activities, each major fund and the aggregate remaining fund information of the Upper Freehold Regional School District, as of and for the year ended June 30, 2016, and the related notes to the financial statements, which collectively comprise Upper Freehold Regional School District’s basic financial statements, and have issued our report thereon dated October 28, 2016.
Internal Control Over Financial Reporting
In planning and performing our audit of the financial statements, we considered Upper Freehold Regional School District's internal control over financial reporting (internal control) to determine the audit procedures that are appropriate in the circumstances for the purpose of expressing our opinions on the financial statements, but not for the purpose of expressing an opinion on the effectiveness of Upper Freehold Regional School District’s internal control. Accordingly, we do not express an opinion on theeffectiveness of Upper Freehold Regional School District’s internal control.
A deficiency in internal control exists when the design or operation of a control does not allow management or employees, in the normal course of performing their assigned functions, to prevent, or detect and correct, misstatements on a timely basis. A material weakness is a deficiency, or a combination of deficiencies, in internal control, such that there is a reasonable possibility that a material misstatement of the District’s financial statements will not be prevented, or detected and corrected on a timely basis. A significant deficiency is a deficiency, or a combination of deficiencies, in internal control that is less severe than a material weakness, yet important enough to merit attention by those charged with governance.
Our consideration of internal control was for the limited purpose described in the first paragraph of this section and was not designed to identify all deficiencies in internal control that might be material weaknesses or significant deficiencies. Given these limitations, during our audit we did not identify any deficiencies in internal control that we consider to be material weaknesses. However, material weaknesses may exist that have not been identified.
195
Holman | FreniaAllison, P.C.
HFCertified Public Accountants & Consultants
680 Hooper Avenue, Bldg B, Suite 201, Toms River, NJ 08753 • Tel: 732.797.1333618 Stokes Road, Medford, NJ 08055 • Tel: 609.953.0612
912 Highway 33, Suite 2, Freehold, NJ 07728 • Tel: 732.409.08006 E. Park Street, P.O. Box 614, Bordentown, NJ 08505 • Tel: 609.298.8639
795 Canton Street, Troy, PA 16947 • Tel: 570.297.5090926 Main Street, Suite 103, Rome, PA 18837 • Tel: 570.297.5090
www.hfacpas.com

Compliance and Other Matters
As part of obtaining reasonable assurance about whether Upper Freehold Regional School District's financial statements are free from material misstatement, we performed tests of its compliance with certain provisions of laws, regulations, contracts, and grant agreements, noncompliance with which could have a direct and material effect on the determination of financial statement amounts. However, providing an opinion on compliance with those provisions was not an objective of our audit, and accordingly, we do not express such an opinion. The results of our tests disclosed no instances of noncompliance or other matters that are required to be reported under Government Auditing Standardsand audit requirements as prescribed by the Office of School Finance, Department of Education, State of New Jersey.
Purpose of this Report
The purpose of this report is solely to describe the scope of our testing of internal control and compliance and the results of that testing, and not to provide an opinion on the effectiveness of the District’s internal control or on compliance. This report is an integral part of an audit performed in accordance with Government Auditing Standards and audit requirements as prescribed by the Office of School Finance, Department of Education, State of New Jersey, and federal and state awarding agencies and pass-through entities, in considering the District’s internal control and compliance. Accordingly, this communication is not suitable for any other purpose.
Respectfully Submitted,
HOLMAN FRENIA ALLISON, P.C.
Rodney R. HainesCertified Public AccountantPublic School Accountant, No. 2198
Toms River, New JerseyOctober 28, 2016
196

EXHIBIT K-2
INDEPENDENT AUDITOR’S REPORT ON COMPLIANCE FOR EACH MAJOR PROGRAM AND REPORT ON INTERNAL CONTROL OVER COMPLIANCE REQUIRED BY THE
UNIFORM GUIDANCE AND NEW JERSEY OMB CIRCULAR 15-08
Honorable President and Members of the Board of EducationUpper Freehold Regional School DistrictCounty of MonmouthAllentown, New Jersey 08501
Report on Compliance for Each Major State Program
We have audited Upper Freehold Regional School District’s compliance with the types of compliance requirements described in the OMB Compliance Supplement and the New Jersey State Aid/Grant Compliance Supplement that could have a direct and material effect on each of the District’s major state programs for the year ended June 30, 2016. Upper Freehold Regional School District’s major state programs are identified in the Summary of Auditor’s Results section of the accompanying Schedule of Findings and Questioned Costs.
Management’s Responsibility
Management is responsible for compliance with the requirements of laws, regulations, contracts, and grants applicable to its federal and state programs.
Auditor’s Responsibility
Our responsibility is to express an opinion on compliance for each of Upper Freehold Regional School District’s major state programs based on our audit of the types of compliance requirements referred to above. We conducted our audit of compliance in accordance with auditing standards generally accepted in the United States of America; the standards applicable to financial audits contained in Government Auditing Standards, issued by the Comptroller General of the United States; the audit requirements of Title 2 U.S. Code of Federal Regulations Part 200, Uniform Administrative Requirements, Cost Principles, and Audit Requirements for Federal Awards (Uniform Guidance); the New Jersey State Aid/Grant Compliance Supplement; the audit requirements prescribed by the Office of School Finance, Department of Education, State of New Jersey; and New Jersey OMB’s Circular 15-08, Single Audit Policy for Recipients of Federal Grants, State Grants and State Aid. Those standards, the Uniform Guidance and New Jersey OMB’s Circular 15-08 require that we plan and perform the audit to obtain
197
Holman | FreniaAllison, P.C.
HFCertified Public Accountants & Consultants
680 Hooper Avenue, Bldg B, Suite 201, Toms River, NJ 08753 • Tel: 732.797.1333618 Stokes Road, Medford, NJ 08055 • Tel: 609.953.0612
912 Highway 33, Suite 2, Freehold, NJ 07728 • Tel: 732.409.08006 E. Park Street, P.O. Box 614, Bordentown, NJ 08505 • Tel: 609.298.8639
795 Canton Street, Troy, PA 16947 • Tel: 570.297.5090926 Main Street, Suite 103, Rome, PA 18837 • Tel: 570.297.5090
www.hfacpas.com

reasonable assurance about whether noncompliance with the types of compliance requirements referred to above that could have a direct and material effect on a major state program occurred. An audit includes examining, on a test basis, evidence about Upper Freehold Regional School District’s compliance with those requirements and performing such other procedures as we considered necessary in the circumstances.
We believe that our audit provides a reasonable basis for our opinion on compliance for each major state program. However, our audit does not provide a legal determination of Upper Freehold Regional School District’s compliance.
Opinion on Each Major State Program
In our opinion, Upper Freehold Regional School District complied, in all material respects, with the types of compliance requirements referred to above that could have a direct and material effect on each of its major state programs for the year ended June 30, 2016.
Report on Internal Control Over Compliance
Management of Upper Freehold Regional School District is responsible for establishing and maintaining effective internal control over compliance with the types of compliance requirements referred to above. In planning and performing our audit of compliance, we considered Upper Freehold Regional School District’s internal control over compliance with the types of requirements that could have a direct and material effect on each major or state program to determine the auditing procedures that are appropriate in the circumstances for the purpose of expressing an opinion on compliance for each major state program and to test and report on internal control over compliance in accordance with the Uniform Guidance and New Jersey OMB’s Circular 15-08, but not for the purpose of expressing an opinion on the effectiveness of internal control over compliance. Accordingly, we do not express an opinion on the effectiveness of Upper Freehold Regional School District’s internal control over compliance.
A deficiency in internal control over compliance exists when the design or operation of a control over compliance does not allow management or employees, in the normal course of performing their assigned functions, to prevent, or detect and correct, noncompliance with a type of compliance requirement of a state program on a timely basis. A material weakness in internal control over compliance is a deficiency, or combination of deficiencies, in internal control over compliance, such that there is a reasonable possibility that material noncompliance with a type of compliance requirement of a state program will not be prevented, or detected and corrected, on a timely basis. A significant deficiency in internal control over compliance is a deficiency, or a combination of deficiencies, in internal control over compliance with a type of compliance requirement of a state program that is less severe than a material weakness in internal control over compliance, yet important enough to merit attention by those charged with governance.
Our consideration of internal control over compliance was for the limited purpose described in the first paragraph of this section and was not designed to identify all deficiencies in internal control over compliance that might be material weaknesses or significant deficiencies. We did not identify any deficiencies in internal control over compliance that we consider to be material weaknesses. However, material weaknesses may exist that have not been identified.
198

The purpose of this report on internal control over compliance is solely to describe the scope of our testing of internal control over compliance and the results of that testing based on the requirements of the Uniform Guidance and New Jersey OMB’s Circular 15-08. Accordingly, this report is not suitable for any other purpose.
Respectfully Submitted,
HOLMAN FRENIA ALLISON, P.C.
Rodney R. HainesCertified Public AccountantPublic School Accountant, No. 2198
Toms River, New JerseyOctober 28, 2016
199

restricted and unrestricted net assets are available and have determined that net assets were properly recognized under the policy.
42) We acknowledge our responsibility for the required supplementary information (RSI). The RSI is measured and presented within prescribed guidelines and the methods of measurement and presentation have not changed from those used in the prior period. We have disclosed to you any significant assumptions and interpretations underlying the measurement and presentation of the RSI.
Signature: Signature:
Title: Title:
RESERVED FOR MD&A LETTER
200

EXH
IBIT
K-3
SCH
EDU
LE A
BA
LAN
CE
(AC
CO
UN
TSU
NEA
RN
EDD
UE
TOFE
DER
AL
GR
AN
TOR
FED
ERA
LFE
DER
AL
AW
AR
DA
TC
AR
RY
OV
ER/
REC
EIV
AB
LE)
REV
ENU
EG
RA
NTO
RPA
SS T
HR
OU
GH
GR
AN
TOR
CFD
AIN
DEN
TIFI
CA
TIO
NA
WA
RD
GR
AN
TJU
NE
30,
(WA
LKO
VER
)C
ASH
BU
DG
ETA
RY
SUB
REC
EIPI
ENT
AT
JUN
E 30
,A
T JU
NE
30,
AT
JUN
E 30
,PR
OG
RA
M T
ITLE
NU
MB
ERN
UM
BER
AM
OU
NT
PER
IOD
2015
AM
OU
NT
REC
EIV
EDEX
PEN
DIT
UR
ESEX
PEN
DIT
UR
ES20
1620
1620
16
U.S
. DE
PAR
TM
EN
T O
F A
GR
ICU
LT
UR
E P
ASS
ED
-TH
RO
UG
HST
AT
E D
EPA
RT
ME
NT
OF
ED
UC
AT
ION
:
Chi
ld N
utriu
tion
Clu
ster
Non
-Cas
h A
ssist
ance
F
ood
Dist
ribut
ion
Prog
ram
10.5
6516
16N
J304
N10
9934
,936
$
7
/1/1
5-6/
30/1
6-
$
-
$
34,9
36$
(34,
936)
$
-
$
-$
-
$
-$
Cas
h A
ssist
ance
Nat
iona
l Sch
ool B
reak
fast
Prog
ram
10.5
5315
15N
J304
N10
997,
056
7/1
/14-
6/30
/15
(582
)
-
582
-
-
-
-
Su
btot
al
(582
)
-
582
-
-
-
-
-
N
atio
nal S
choo
l Lun
ch P
rogr
am10
.555
1616
NJ3
04N
1099
42,7
66 7
/1/1
5-6/
30/1
6-
-
40,3
66
(42,
766)
-
(2,4
00)
-
-
N
atio
nal S
choo
l Lun
ch P
rogr
am10
.555
1515
NJ3
04N
1099
87,2
93 7
/1/1
4-6/
30/1
5(5
,102
)
Subt
otal
(5
,102
)
-
40
,366
(4
2,76
6)
-
(2
,400
)
-
-
Tota
l Chi
ld N
utriu
tion
Clu
ster
(5,6
84)
-
75,8
84
(77,
702)
-
(2,4
00)
-
-
To
tal U
.S. D
e par
tmen
t of A
gric
ultu
re(5
,684
)
-
75
,884
(7
7,70
2)
-
(2
,400
)
-
-
U.S
. DE
PAR
TM
EN
T O
F E
DU
CA
TIO
N P
ASS
ED
-TH
RO
UG
HST
AT
E D
EPA
RT
ME
NT
OF
ED
UC
AT
ION
: S
peci
al R
even
ue F
und:
N
o C
hild
Lef
t Beh
ind:
Title
I84
.010
S010
A15
0030
63,3
129/
1/15
-8/3
1/16
-
-
15
,790
(3
2,80
6)
-
(1
7,01
6)
-
-
Title
I84
.010
S010
A15
0030
64,5
649/
1/14
-8/3
1/15
(486
)
-
34,8
84
(37,
827)
-
(3,4
29)
-
-
Subt
otal
(4
86)
-
50
,674
(7
0,63
3)
-
(2
0,44
5)
-
-
Title
IIA
84.3
67A
S367
A15
0029
31,8
269/
1/15
-8/3
1/16
-
-
5,
078
(19,
986)
-
(14,
908)
-
-
Ti
tle II
A84
.367
AS3
67A
1500
2932
,214
9/1/
14-8
/31/
15(3
,807
)
-
12
,507
(1
5,23
6)
-
(6
,536
)
-
-
Ti
tle II
A84
.367
AS3
67A
1500
2934
,581
9/1/
13-8
/31/
14(6
,081
)
-
6,
081
-
-
-
-
-
Subt
otal
(9
,888
)
-
23
,666
(3
5,22
2)
-
(2
1,44
4)
-
-
Title
IIIA
84.0
31A
9/1/
15-8
/31/
16-
-
-
(1,1
18)
-
(1,1
18)
-
-
-
-
-
(1
,118
)
-
(1
,118
)
-
-
I.
D.E
.A. P
art B
, Bas
ic R
egul
ar84
.027
H02
7A15
0100
429,
311
9/1/
15-8
/31/
16-
-
338,
683
(412
,091
)
-
(73,
408)
-
-
I.D
.E.A
. Par
t B, B
asic
Reg
ular
84.0
27H
027A
1501
0040
8,98
29/
1/14
-8/3
1/15
(18,
138)
-
18
,138
(1
2,40
0)
-
(1
2,40
0)
-
-
I.
D.E
.A. P
art B
, Pre
scho
ol84
.173
H17
3A15
0114
13,3
569/
1/15
-8/3
1/16
-
12
,755
(1
3,35
5)
-
(6
00)
-
-
I.D
.E.A
. Par
t B, P
resc
hool
84.1
73H
173A
1501
1413
,988
9/1/
13-8
/31/
14(5
,377
)
-
5,
377
-
-
-
-
-
Subt
otal
(2
3,51
5)
-
374,
953
(437
,846
)
-
(86,
408)
-
-
V
ocat
iona
l Edu
catio
n:
P
erki
ns G
rant
84.0
4813
,372
9/1/
15-8
/31/
16-
-
12,8
00
(13,
371)
-
(571
)
-
-
Per
kins
Gra
nt84
.048
14,9
009/
1/14
-8/3
1/15
(1,9
08)
-
1,90
8
-
-
-
-
-
Su
btot
al
(1,9
08)
-
14,7
08
(13,
371)
-
(571
)
-
-
Tot
al S
peci
al R
even
ue F
und
(35,
797)
-
46
4,00
1
(5
58,1
90)
-
(1
29,9
86)
-
-
Tot
al U
.S. D
e par
tmen
t of E
duca
tion
(35,
797)
-
46
4,00
1
(5
58,1
90)
-
(1
29,9
86)
-
-
Tota
l Fed
eral
Fin
anci
al A
ssist
ance
(41,
481)
$
-$
53
9,88
5$
(6
35,8
92)
$
-$
(1
32,3
86)
$
-
$
-$
UPP
ER
FR
EE
HO
LD
RE
GIO
NA
L S
CH
OO
L D
IST
RIC
TSC
HE
DU
LE
OF
FED
ER
AL
FIN
AN
CIA
L A
SSIS
TA
NC
EFO
R T
HE
FIS
CA
L Y
EA
R E
ND
ED
JU
NE
30,
201
6
201

EXH
IBIT
K-4
SCH
EDU
LE B
BA
LAN
CE
REP
AY
MEN
T(A
CC
OU
NTS
DU
E TO
GR
AN
T O
RA
TC
AR
RY
OV
ER/
OF
REC
EIV
AB
LE)
GR
AN
TOR
CU
MU
LATI
VE
STA
TE G
RA
NTO
R/
STA
TE P
RO
JEC
TA
WA
RDG
RA
NT
JUN
E 30
,(W
ALK
OV
ER)
CA
SHB
UD
GET
AR
YPR
IOR
YEA
RA
T JU
NE
30,
AT
JUN
E 30
,B
UD
GET
AR
YTO
TAL
PR
OG
RA
M T
ITLE
NU
MB
ERA
MO
UN
TPE
RIO
D20
15A
MO
UN
TR
ECEI
VED
EXPE
ND
ITU
RES
BA
LAN
CES
2016
2016
REC
EIV
AB
LEEX
PEN
DIT
UR
ES
Stat
e D
e par
tmen
t of E
duca
tion:
G
ener
al F
und:
Sch
ool C
hoic
e A
id16
-495
-034
-512
0-06
81 ,
151,
850
7/1
/15-
6/30
/16
-$
-$
1,
151,
850
$
(1,1
51,8
50)
$
-$
-
$
-$
110,
116
$
1,
151,
850
$
Tra
nspo
rtatio
n A
id16
-495
-034
-512
0-01
438
3,45
9
7/1
/15-
6/30
/16
-
-
38
3,45
9
(383
,459
)
-
-
-
36
,658
38
3,45
9
Spe
cial
Edu
catio
n C
ateg
oric
al A
id16
-495
-034
-512
0-08
997
6,24
0
7/1
/15-
6/30
/16
-
-
97
6,24
0
(976
,240
)
-
-
-
93
,328
97
6,24
0
Sec
urit y
Aid
16-4
95-0
34-5
120-
084
122,
431
7
/1/1
5-6/
30/1
6-
-
122,
431
(1
22,4
31)
-
-
-
11,7
04
122,
431
E
qual
izat
ion
Aid
16-4
95-0
34-5
120-
078
2,95
4,30
8
7
/1/1
5-6/
30/1
6-
-
2,95
4,30
8
(2
,954
,308
)
-
-
-
282,
431
2,
954,
308
PA
RC
C R
eadi
ness
Aid
16-4
95-0
34-5
120-
098
17,0
05
7
/1/1
5-6/
30/1
6-
-
17,0
05
(1
7,00
5)
-
-
-
1,
626
17,0
05
P
er P
u pil
Gro
wth
Aid
16-4
95-0
34-5
120-
097
17,0
05
7
/1/1
5-6/
30/1
6-
-
17,0
05
(1
7,00
5)
-
-
-
1,
626
17,0
05
T
rans
porta
tion:
Non
publ
ic S
choo
l16
-495
-034
-512
0-01
46,
264
7
/1/1
5-6/
30/1
6-
-
-
(6
,264
)
-
(6
,264
)
-
-
6,
264
Non
publ
ic S
choo
l15
-495
-034
-512
0-01
412
,069
7/1
/14-
6/30
/15
(12,
049)
-
12,0
49
-
-
-
-
-
Ext
raor
dina
r y A
id16
-495
-034
-512
0-47
322
6,65
9 7
/1/1
5-6/
30/1
6-
-
-
(2
26,6
59)
-
(2
26,6
59)
-
-
22
6,65
9
Ext
raor
dina
r y A
id15
-495
-034
-512
0-47
333
2,08
3 7
/1/1
4-6/
30/1
5(3
32,0
83)
-
33
2,08
3
-
-
-
-
-
-
N
onbu
d get
ed:
Rei
mbu
rsed
TPA
F So
cial
S
ecur
it y C
ontri
butio
n16
-100
-034
-509
5-00
21,
181,
795
7/1
/15-
6/30
/16
-
-
1,
123,
681
(1,1
81,7
95)
-
(58,
114)
-
-
1,
181,
795
Rei
mbu
rsed
TPA
F So
cial
S
ecur
it y C
ontri
butio
n15
-100
-034
-509
5-00
21,
169,
258
7/1
/14-
6/30
/15
(58,
108)
-
58,1
08
-
-
-
-
-
-
On-
Beh
alf T
PAF
Pens
ion
C
ontri
butio
n - N
CG
I16
-100
-034
-509
5-00
759
,474
7/1
/15-
6/30
/16
-
-
59
,474
(59,
474)
-
-
-
-
59,4
74
O
n-B
ehal
f TPA
F Pe
nsio
n
Con
tribu
tion
- Pos
t Ret
ire M
edic
al16
-100
-034
-509
5-00
11 ,
492,
452
7/1
/15-
6/30
/16
-
-
1,
492,
452
(1,4
92,4
52)
-
-
-
-
1,
492,
452
On-
Beh
alf T
PAF
Pens
ion
C
ontri
butio
n - N
orm
al16
-100
-034
-509
5-00
61 ,
253,
399
7/1
/15-
6/30
/16
-
-
1,
253,
399
(1,2
53,3
99)
-
-
-
-
1,
253,
399
T
otal
Gen
eral
Fun
d(4
02,2
40)
-
9,
953,
544
(9,8
42,3
41)
-
(291
,037
)
-
537,
489
9,
842,
341
S
peci
al R
even
ue F
und:
N.J.
Non
publ
ic A
id:
Text
book
16-1
00-0
34-5
120-
064
3 ,48
3 7
/1/1
5-6/
30/1
6-
-
3,48
6
(3,4
16)
-
-
70
-
3,
416
Text
book
15-1
00-0
34-5
120-
064
3 ,87
3 7
/1/1
4-6/
30/1
558
-
-
-
(58)
-
-
-
-
Nur
sin g
16-1
00-0
34-5
120-
070
5,49
0 7
/1/1
5-6/
30/1
6-
-
5,49
0
(5,3
37)
-
-
15
3
-
5,
337
Nur
sin g
15-1
00-0
34-5
120-
070
7,39
8 7
/1/1
4-6/
30/1
580
-
-
-
(80)
-
-
-
-
Tech
nolo
gy16
-100
-034
-512
0-37
31,
586
7/1
/15-
6/30
/16
-
-
1,
586
(1
,506
)
-
-
80
-
1,50
6
Te
chno
logy
15-1
00-0
34-5
120-
373
2,08
0 7
/1/1
4-6/
30/1
511
-
-
-
(11)
-
-
-
-
Secu
rity
2,02
5 7
/1/1
5-6/
30/1
6-
-
2,02
5
(1,9
99)
-
-
26
-
1,
999
Aux
iliar
y Se
rvic
e A
id (C
hapt
er 1
92):
Com
pens
ator
y Ed
ucat
ion
16-1
00-0
34-5
120-
067
7,61
4 7
/1/1
5-6/
30/1
6-
-
7,61
4
(5,9
22)
-
-
1,
692
-
5,
922
Com
pens
ator
y Ed
ucat
ion
15-1
00-0
34-5
120-
067
5,37
5 7
/1/1
4-6/
30/1
55,
375
-
-
-
(5,3
75)
-
-
-
-
ES
L15
-100
-034
-512
0-06
786
3 7
/1/1
4-6/
30/1
5-
-
863
-
-
863
-
-
H
ome
Inst
ruct
ion
15-1
00-0
34-5
120-
067
715
7/1
/14-
6/30
/15
(715
)
-
71
5
-
-
-
-
-
-
Han
dica
pped
Ser
vice
s Aid
(Cha
pter
193
):
Su
pple
men
tary
Inst
ruct
ion
16-1
00-0
34-5
120-
066
4,45
5 7
/1/1
5-6/
30/1
6-
-
4,45
5
(2,9
70)
-
-
1,
485
-
2,
970
Supp
lem
enta
ry In
stru
ctio
n15
-100
-034
-512
0-06
65,
493
7/1
/14-
6/30
/15
1,56
9
-
(1
,569
)
-
Ex
amin
atio
n &
Cla
ssifi
catio
n16
-100
-034
-512
0-06
63 ,
750
7/1
/15-
6/30
/16
-
-
3,
750
(3
,409
)
-
-
341
-
3,40
9
Ex
amin
atio
n &
Cla
ssifi
catio
n15
-100
-034
-512
0-06
68 ,
288
7/1
/14-
6/30
/15
3,06
6
-
-
-
(3
,066
)
-
-
-
-
Cor
rect
ive
S pee
ch16
-100
-034
-512
0-06
62,
508
7/1
/15-
6/30
/16
-
-
2,
508
-
-
-
2,
508
-
-
NJ C
urric
ulum
for A
gric
ultu
ral
Scie
nce
Educ
atio
n (C
ASE
)15
-100
-010
-333
0-01
95,
000
7/1
/15-
6/30
/16
647
-
5,00
0
(3,4
76)
(6
47)
-
1,
524
-
3,
476
T
otal
Spe
cial
Rev
enue
Fun
d10
,091
-
37,4
92
(2
8,03
5)
(1
0,80
6)
-
8,74
2
-
28,0
35
E
nter
pris
e Fu
nd:
Nat
iona
l Sch
ool L
unch
Pro
gram
(Sta
te S
hare
)16
-100
-010
-335
0-02
32,
067
7/1
/15-
6/30
/16
-
-
1,
951
(2
,067
)
-
(1
16)
-
-
2,
067
Nat
iona
l Sch
ool L
unch
Pro
gram
(Sta
te S
hare
)15
-100
-010
-335
0-02
33,
918
7/1
/14-
6/30
/15
(225
)
-
22
5
-
-
-
-
-
-
T
otal
Ent
erpr
ise
Fund
(225
)
-
2,
176
(2
,067
)
-
(1
16)
-
-
2,
067
D
ebt S
ervi
ce F
und:
Deb
t Ser
vice
Aid
, Typ
e II
16-4
95-0
34-5
120-
075
106,
731
7/1
/15-
6/30
/16
-
-
10
6,73
1
(106
,731
)
-
-
-
-
10
6,73
1
T
otal
Deb
t Ser
vice
Fun
d-
-
106 ,
731
(1
06,7
31)
-
-
-
-
106,
731
T
otal
Sta
te F
inan
cial
Ass
ista
nce
(392
,374
)$
-
$
10,0
99,9
43$
(9,9
79,1
74)
(1
0,80
6)$
(2
91,1
53)
$
8,
742
$
53
7,48
9$
9,97
9,17
4$
Les
s: A
war
ds N
ot S
ubje
ct to
New
Jer
sey
OM
B C
ircu
lar
15-0
8:
On-
Beh
alf T
each
er P
ensi
on a
nd A
nnui
t y F
und
1,49
2,45
2
On-
Beh
alf T
each
er P
ost-R
etirm
ent M
edic
al1 ,
253,
399
O
n-B
ehal
f NC
GI
59,4
74
Tot
al S
tate
Fin
anci
al A
ssis
tanc
e Su
b jec
t to
New
Jers
ey O
MB
Circ
ular
15-
08(7
,173
,849
)$
MEM
O
UPP
ER
FR
EE
HO
LD
RE
GIO
NA
L S
CH
OO
L D
IST
RIC
TSC
HE
DU
LE
OF
STA
TE
FIN
AN
CIA
L A
SSIS
TA
NC
EFO
R T
HE
FIS
CA
L Y
EA
R E
ND
ED
JU
NE
30,
201
6
202

EXHIBIT K-5 (Page 1 of 2)
UPPER FREEHOLD REGIONAL SCHOOL DISTRICTNOTES TO THE SCHEDULES OF FINANCIAL ASSISTANCE
FOR THE YEAR ENDED JUNE 30, 2016
Note 1: General
The accompanying schedules of expenditures of federal awards and state financial assistance include federal and state award activity of the Board of Education, Upper Freehold Regional School District. The Board of Education is defined in Note 1 to the Board’s basic financial statements. All state awards received directly from agencies, as well as state financial assistance passed through other government agencies is included on the schedule of expenditures of state financial assistance.
Note 2: Summary of Significant Accounting Policies
The accompanying schedules of expenditures of awards and financial assistance are presented on the budgetary basis of accounting with the exception of programs recorded in the food service fund, which are presented using the accrual basis of accounting. These bases of accounting are described in Note 1 to the board's basic financial statements. The information in this schedule is presented in accordance with the requirements of 2 CFR 200-Uniform Administrative Requirements, Cost Principles, and Audit Requirements for Federal Awards. Therefore, some amounts presented in this schedule may differ from amounts presented in, or used in the preparation of, the basic financial statements.
Of the federal and state expenditures presented in the schedules of expenditures of federal awards and state financial assistance, the Upper Freehold Regional School District did not provide any federal or state awards to sub recipients.
Noncash assistance is reported in the schedule of expenditures of federal awards as the entitlement value, as determined by the United States Department of Agriculture, of the food commodities received and disbursed during the year ended June 30, 2016. Unearned revenue represents the value of commodities left in the ending inventory of the District as of June 30, 2016.
Upper Freehold Regional School District has not elected to use the 10% de minimis cost rate allowed by the Uniform Guidance.
Note 3: Relationship to Basic Financial Statements
The basic financial statements present the general fund and special revenue fund on a GAAP basis. Budgetary comparison statements or schedules (RSI) are presented for the general fund and special revenue fund to demonstrate finance related legal compliance in which certain revenue is permitted by law or grant agreement to be recognized in the audit year, whereas for GAAP reporting, revenue is not recognized until the subsequent year or when expenditures have been made.
The general fund is presented in the accompanying schedules on the modified accrual basis with the exception of the revenue recognition of the one or more deferred June state aid payments in the current budget year, which is mandated pursuant to N.J.S.A. 18A:22-44.2. For GAAP purposes payments are not recognized until the subsequent budget year due to the state deferral and recording of the one or more June state aid payments in the subsequent year. The special revenue fund is presented in the
203

EXHIBIT K-5 (Page 2 of 2)
UPPER FREEHOLD REGIONAL SCHOOL DISTRICTNOTES TO THE SCHEDULES OF FINANCIAL ASSISTANCE (continued):
FOR THE YEAR ENDED JUNE 30, 2016
Note 3: Relationship to Basic Financial Statements (continued):
accompanying schedules on the grant accounting budgetary basis which recognizes encumbrances as expenditures and also recognizes the related revenues, whereas the GAAP basis does not. The special revenue fund also recognizes the one or more state aid June payments in the current budget year, consistent with N.J.S.A. 18A:22-4.2.
The net adjustment to reconcile from the budgetary basis to the GAAP basis is ($10,681) for the general fund and $0 for the special revenue fund. See Exhibit C-3, notes to required supplementary information for a reconciliation of the budgetary basis to the modified accrual basis of accounting for the general andspecial revenue funds. Awards and financial assistance revenues are reported in the Board’s basic financial statements on a GAAP basis as presented as follows:
Federal State Total
General Fund $ - $ 9,831,660 $ 9,831,660 Special Revenue Fund 558,190 28,035 586,225 Debt Service Fund - 106,731 106,731 Food Service Fund 77,701 2,067 79,768
Total Financial Assistance $ 635,891 $ 9,968,493 $10,604,384
Note 4: Relationship to Federal and State Financial Reports
Amounts reported in the accompanying schedules agree with the amounts reported in the related federal and state financial reports.
Note 5: Other
Revenues and expenditures reported under the Food Distribution Program represents current year value received and current year distributions respectively. The amount reported as TPAF Pension Contributions represents the amount paid by the state on behalf of the District for the year ended June 30, 2016. TPAF Social Security Contributions represents the amount reimbursed by the state for the employer’s share of social security contributions for TPAF members for the year ended June 30, 2016.
Note 6: Federal and State Loans Outstanding
The Upper Freehold Regional School District had no loan balances outstanding at June 30, 2016.
204

EXHIBIT K-6 (Page 1 of 3)
UPPER FREEHOLD REGIONAL SCHOOL DISTRICTSCHEDULE OF FINDINGS & QUESTIONED COSTS
For the Fiscal Year Ended June 30, 2016
Section I – Summary of Auditor’s Results
Financial StatementsType of auditor’s report issued: Unmodified
Internal control over financial reporting:
1) Material weakness(es) identified? No
2) Significant deficiencies identified that are not considered to be material weaknesses? None Reported
Noncompliance material to basic financial Statements noted? No
Federal Awards – NOT APPLICABLE
Dollar threshold used to distinguish between type A and type B programs:
Auditee qualified as low-risk auditee?
Internal Control over major programs:
1) Material weakness(es) identified?
2) Significant deficiencies identified that are not considered To be material weaknesses?
Type of auditor’s report issued on compliance for major programs
Any audit findings disclosed that are required to be reported in accordance With 2 CFR 200 Section .516(a) of the Uniform Guidance?
Identification of major programs:
CFDA Number(s) FAIN Number(s) Name of Federal Program or Cluster
NOT APPLICABLE
205

EXHIBIT K-6 (Page 2 of 3)
UPPER FREEHOLD REGIONAL SCHOOL DISTRICTSCHEDULE OF FINDINGS & QUESTIONED COSTS
For the Fiscal Year Ended June 30, 2016
Section I – Summary of Auditor’s Results
State Awards
Dollar threshold used to distinguish between type A and type B programs: $750,000
Auditee qualified as low-risk auditee? Yes
Internal Control over major programs:
1) Material weakness(es) identified? No
2) Significant deficiencies identified that are not considered To be material weaknesses? None Reported
Type of auditor’s report issued on compliance for major programs Unmodified
Any audit findings disclosed that are required to be reported in accordance With 2 CFR 200 Section .516(a) of the Uniform Guidance or NJOMB Circular Letter 15-08 as applicable? No
Identification of major programs:
State Grant/Project Number(s) Name of State Program
495-034-5120-078 Equalization Aid495-034-5120-084 Security Aid495-034-5120-089 Special Educational Categorical Aid495-034-5120-085 Adjustment Aid495-034-5120-096 Under Adequacy Aid495-034-5120-097 Per Pupil Growth Aid495-034-5120-098 PARCC Readiness
206

EXHIBIT K-6 (Page 3 of 3)
UPPER FREEHOLD REGIONAL SCHOOL DISTRICTSCHEDULE OF FINDINGS & QUESTIONED COSTS
For the Fiscal Year Ended June 30, 2016(continued)
Section II – Financial Statement Findings
This section identifies the significant deficiencies, material weaknesses and instances of noncompliance related to the basic financial statements that are required to be reported in accordance with Government Auditing Standards and with audit requirements prescribed by the Division of Administration and Finance, Department of Education, State of New Jersey.
No Current Year Findings
Section III – Schedule of Federal Award Findings & Questioned Costs
This section identifies audit findings required to be reported by 2 CFR 200 section .516 of the Uniform Administrative Requirements, Cost Principles, and Audit Requirements for Federal Awards.
Not Applicable
Section IV –State Financial Assistance Findings & Questioned Costs
This section identifies audit findings required to be reported by 2 CFR 200 section .516 of the Uniform Administrative Requirements, Cost Principles, and Audit Requirements for Federal Awards and NJOMB Circular Letter 15-08, as applicable.
No Current Year Findings
207

EXHIBIT K-7UPPER FREEHOLD REGIONAL SCHOOL DISTRICT
SUMMARY SCHEDULE OF PRIOR-YEAR AUDIT FINDINGSAND QUESTIONED COSTS AS PREPARED BY MANAGEMENT
For the Fiscal Year Ended June 30, 2016
This section identifies the status of prior-year findings related to the basic financial statements and state awards that are required to be reported in accordance with Chapter 6.12 of Government Auditing Standards, USOMB Uniform Administrative Requirements, Cost Principles, and Audit Requirements for Federal Awards. (¶.511 (a)(b)) and NJOMB’s Circular 04-04 and/or 15-08, as applicable.
No Prior Year Findings
208