school climate data workshop delaware positive behavior support project may 12, 2014 george bear,...
TRANSCRIPT

School Climate Data WorkshopDelaware Positive Behavior
Support Project
May 12, 2014George Bear, Ph.D.
University of Delaware

Why is school climate important?
School Climate is linked to a wide range of academic, behavioral, and socio-emotional outcomes for students:• Academic achievement • Student academic, social, and personal attitudes
and motives • Attendance and school avoidance• Behavior problems, delinquency, victimization• Emotional well-being

School climate is also linked to outcomes for teachers:• Less burnout and greater retention in the
profession• Greater implementation fidelity of new
curriculum and interventions• Greater levels of job satisfaction

DE School Climate Survey
Participation
Nu
mb
er
of
Sch
ools
School Years
2004-2005
2005-2006
2006-2007
2007-2008
2008-2009
2009-2010
2010-2011
2011-2012
2012-2013
2013-20140
20
40
60
80
100
120
140
160
180
13
48
128
112
150 155 160 164 165 163

School Climate Workshop, 5/23/12
2014 Survey SampleStudent Survey
Teacher Survey Home Survey
Elementary
Schools 83 90 90
Respondents 16340 3602 12428
MiddleSchools 27 30 30
Respondents 10133 1480 3409
HighSchools 19 18 18
Respondents 7060 1287 1887
Alternative
Schools 4 5 5
Respondents 130 95 51
Special Schools 6 8 8
Respondents 258 428 252
Early
Childhood
Schools 0 5 5
Respondents 0 184 549
Other Schools 8 8 8
Respondents 3286 308 920

Delaware School Climate Surveys 2014 Subscales
Part I : School Climate
Student Survey Teacher/Staff
Survey Home Survey
Teacher-Student Relations
Teacher-Student Relations
Teacher-Student Relations
Student-Student Relations
Student-Student Relations
Student-Student Relations
Respect for Diversity Respect for Diversity Respect for Diversity
Clarity of Expectations Clarity of Expectations Clarity of Expectations
Fairness of Rules Fairness of Rules Fairness of Rules
School Safety School Safety School Safety
Student Engagement School-wide
Student Engagement School-wide
Bullying School-wide Bullying School-wide
Teacher-Home Communications
Teacher-Home Communications
Staff Relations
Total School Climate Total School Climate Total School Climate
Parent Satisfaction

Part I: School ClimateItem Examples
Teacher-Student Relations • “Teachers care about their students.”
Student-Student Relations • “Students are friendly with each other.”
Respect for Diversity • “Students respect those of other races.”
Student Engagement School-wide• “Most students try their best.”
Clarity of Expectations• “Students know what the rules are.”
Fairness of Rules • “The school rules are fair.”

Part I: School ClimateItem Examples (continued)
School Safety• “This school is safe.”
Bullying School-wide (Note: A high score for this subscale is unfavorable)
• “Students threaten and bully others in this school”
Teacher-Home Communications• “Teachers listen to the concerns of
parents.”Staff Relations
• “Teachers work well together in this school.”
Satisfaction with School• “I like this school.”

PART II: Techniques
Student Survey
Teacher/Staff Survey
Home Survey
Positive Behavior Techniques
Positive Behavior Techniques
Punitive Techniques
Punitive Techniques
Social Emotional Learning Techniques
Social Emotional Learning Techniques

Part II: TechniquesItem Examples
Use of Positive Techniques• “Students are praised often.”• “Classes get rewards for good behavior.”
Use of Punitive Techniques (Note: A high score for this subscale is unfavorable)• “Students are punished a lot.”• “Students are often sent out of class for breaking
rules.”
Use of Social Emotional Learning (SEL) Techniques• “Students are taught to feel responsible for how they
act.”• “Students are taught to understand how others think
and feel.”

Part III: Bullying & IV: Engagement (Individual Level)
Student Survey Teacher/Staff
Survey Home Survey
Bullying Victimization1
Physical Bullying
Physical Bullying
Verbal Bullying
Verbal Bullying
Social/Relational Bullying
Social/Relational Bullying
Cyberbullying2
Student Engagement
Cognitive & Behavioral
Cognitive & Behavioral
Emotional Emotional
1 Grades 6-12 only for the printed version. Optional for grades 4-5 with computer version. 2 Grades 6-12 only.

Part III: Bullying VictimizationItem Examples
Verbal Bullying• “A student said mean things to me.”
Physical Bullying• “I was pushed or shoved on purpose.”
Social/Relational Bullying• “A student told or got others to not like me.”
Cyberbullying (grades 6-12)• “A student sent me a mean or hurtful
message about me using email, text messaging, instant messaging, or similar electronic messaging.”

Part IV: Student EngagementItem Examples
Cognitive and Behavioral Engagement
• “I pay attention in class.”• “I try my best in school.”
Emotional Engagement• “I feel happy in school.”• “My school is a fun place to be.”

Survey Reliability and Validity

Evidence of Reliability and Validity
Reliability: • Are the scores consistent, or stable?
Validity: • Does the test yield the factors
predicted? • Are the scores related to other variables
how we might expect (e.g., grade level, sex and race, academic achievement, suspensions)?

Climate Surveys: Reliability (alpha coefficients)
Subscale StudentTeacher/
Staff Home
Teacher-Student Relations .86 .85 .90
Student-Student Relations .86 .91 .94
School Safety .81 .89 .91
Clarity of Expectations .76 .90 .92
Fairness of Rules .80 .84 .89
Respect for Diversity .80 .87 .89
Student Engagement School-wide .80 .85 N/A
Bullying School-wide .79 .89 N/A
Teacher-Home Communications N/A .90 .89
Staff Relations N/A .95 N/A
Total Climate .94 .96 .97
Parent Satisfaction N/A N/A .88
Use of Positive Behavioral Techniques .83 .85 N/A
Use of Punitive Techniques .73 .77 N/AUse of Social Emotional Learning Techniques .85 .92 N/A

Climate Surveys: Reliability (alpha coefficients)
Subscale Student HomeCognitive and Behavioral Engagement
.84 .90
Emotional Engagement
.88 .91
Verbal Bullying .91 .90Physical Bullying .86 .80Social/Relational Bullying
.91 .90
Total Bullying .95 .93Cyberbullying .93 N/A

Research supporting the validity of the surveys (including confirmatory factor analyses) has been published in several of the top peer-reviewed journals and presented at multiple national conferences. Likewise, the surveys and articles about the theory and research supporting them appear in several book chapters.
See Technical Manual on Delaware PBS website

Peer-Reviewed Journals:Bear, G. G., Gaskins, C., Blank, J. , & Chen, F. F. (2011). Delaware School
Climate Survey-Student: Its factor structure, concurrent validity, and reliability. Journal of School Psychology.Bear, G., Yang, C., Pell, M., & Gaskin, C. (in press).Validation of a brief measure of teachers' perceptions of school climate: relations to student achievement and suspensions. Learning Environments Research.Yang, C., Bear, G. G., Chen, F.F., Zhang, W., Blank, J.C., & Huang, X.S.
(2013). Students’ perceptions of school climate in the U.S. and China. School Psychology Quarterly.
Other Resources/Chapters about the surveys:Bear, G.G., Yang, C., Mantz, L., & Boyer, D. (2012).Technical manual for the Delaware School Climate Surveys. Center for Disabilities Studies, University of Delaware.Bear, G.G., Whitcomb, S., Elias, M., & Blank, J. (in press). SEL and Schoolwide Positive Behavioral Interventions and Supports. In J. Durlak, T. Gullotta, C. Domitrovich, P. Goren, & R. Weissberg (Eds.), Handbook of social and emotional learning. Guilford Press.Bear, G. G. (2010). School discipline and self-discipline: A practical guide to promoting prosocial student behavior. New York: Guilford Press.

Validity Screening Items on Student Survey
Items:• “I am telling the truth in this survey.”• “I answered all items truthfully on this
survey.”Results:
• 6.2% (2,587) disagreed to one or both items and thus were deleted
• 4.1% (1,727) did not respond to one or both items
• “Liars” scored significantly lower, but their removal had very little impact on overall scores (about 1 tenth of a point)

2014 State-wide Results
Part I: School Climate Subscales
Student Survey Results

Total School Climate by Student Grade
Student perceptions tend to decrease, especially from elementary to middle school

Teacher-Student Relations
Student Relations
Respect for Diversity
Student Engagement School-wide
Clarity of Expectations
Fairness of Rules
School Safety
Bullying School-wide
Total School Climate
Grade Level Differences: Student Survey 2014

School Climate Workshop, 5/23/12
Student Engagement by Grade Level
Cognitive and Behavioral Engagement
Emotional Engagement

Teacher-Student Relations
Student Relations
Respect for Diversity
Student Engagement School-wide
Clarity of Expectations
Fairness of Rules
School Safety
Bullying School-wide
Total School Climate
Racial Differences: Student Survey 2014

Part I: School Climate
Subscales
Teacher/Staff Survey Results
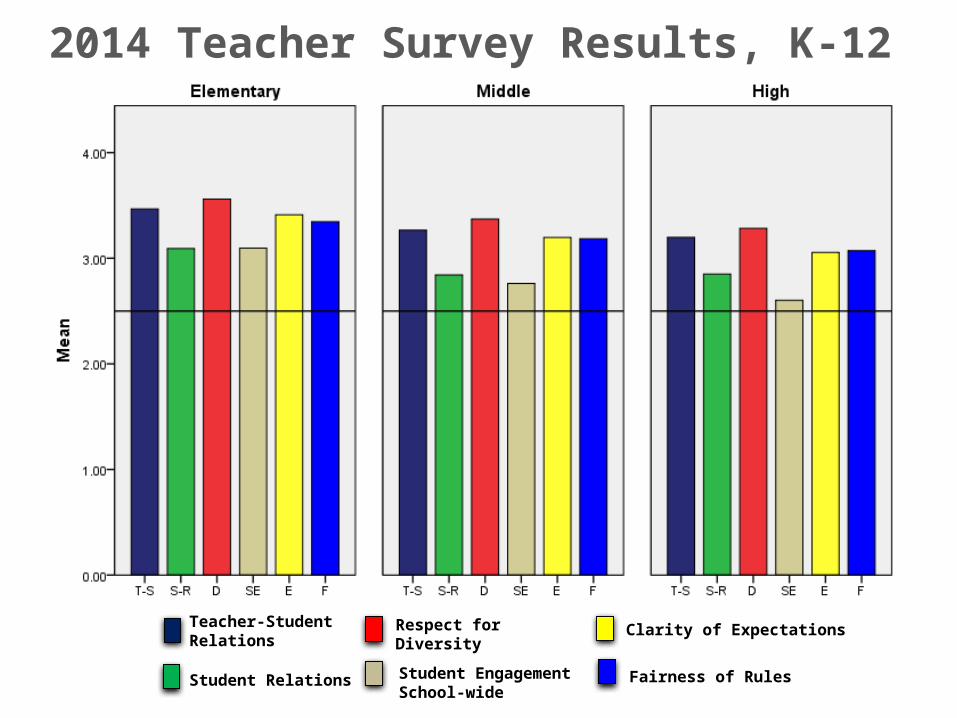
Teacher-Student Relations
Student Relations
Respect for Diversity
Student Engagement School-wide
Clarity of Expectations
Fairness of Rules
2014 Teacher Survey Results, K-12

School Safety
Bullying School-wide
Total School ClimateTeacher-Home Communication
Staff Relations
2014 Teacher Survey Results, K-12

Sample subscale responses associated with
teacher/staff scores (Part I: School Climate)
Percent who Agreed or
Agreed a lotElem
SchoolMiddle School
High Schoo
l
Teacher-Student Relations7. Teachers care about their students. 99.3 98.0 97.5
Student–Student Relations11. Students are friendly with each other. 92.4 82.2 85.1
Student Engagement School-wide29. Most students work hard to get good grades.
88.1 69.4 54.9
Clarity of Expectations10. Students know how they are expected to act.
96.9 91.1 87.8
Bullying School-wide*9. Students threaten and bully others in this school.
31.8 59.7 46.2
School Safety19. Students feel safe in this school. 96.6 86.7 84.1
* = A high score on this subscale is negative because items are negatively worded.

Sample subscale responses associated with
teacher/staff scores (Part I: School Climate)
Percent who Agreed or
Agreed a lotElemScho
ol
Middle
School
High Scho
ol
Respect for Diversity2. Teachers treat students of all races with respect.
98.0 94.7 94.5
Fairness of Rules18. The school’s Code of Conduct is fair.
94.3 90.4 89.1
Teacher-Home Communications37. Teachers do a good job communicating with parents.
97.1 91.7 86.0
Staff Relations36. Teachers, staff, and administrators function as a good team in this school.
86.3 77.4 70.9
Part I: School Climate Subscales Home Survey Results

Teacher-Student Relations
Student Relations
Respect for Diversity
Clarity of Expectations
Fairness of Rules
School Safety
Teacher-Home Communication
Total School Climate
Grade Level Differences: Home Survey 2014

Sample subscale responses associated
with home scores (Part I: School Climate)
Percent who Agreed or
Agreed a lotElemSchoo
l
Middle
School
High Schoo
l
Teacher-Student Relations7. Teachers care about their students.
97.7 92.0 88.2
Student–Student Relations11. Students are friendly with each other.
88.4 71.1 72.2
Clarity of Expectations10. Students know how they are expected to act.
98.2 95.3 92.8
Teacher-Home Communication24. Teachers work closely with parents to help students when they have problems.
92.0 80.6 73.7

Sample subscale responses associated
with home scores (Part I: School Climate)
Percent who Agreed or
Agreed a lotElemScho
ol
Middle
School
High Scho
ol
School Safety19. Students feel safe in this school.
97.2 87.1 81.8
Respect for Diversity2. Teachers treat students of all races with respect.
97.8 92.0 89.7
Fairness of Rules18. The school’s Code of Conduct is fair.
97.7 93.1 90.4
Parent Satisfaction9. I am satisfied with the education students get in this school.
92.9 87.0 82.4

Part II: Techniques
Positive, Punitive and Social-Emotional Learning
Techniques

Part II: TechniquesStudent Responses

Positive Techniques
Punitive Techniques
SEL Techniques
Disciplinary Techniques by Student Grade Level

Sample subscale responses associated with
student scores (Part II: Techniques)
Percent who Agreed or
Agreed a lotElemScho
ol
Middle
School
High School
Use of Positive Behavioral Techniques
2. Students are praised often.11. Classes get rewards for good behavior
82.988.6
57.357.2
44.435.1
Use of Punitive Techniques*7. Students are often yelled at by adults.10. Many students are sent to the office for breaking rules.
33.048.8
51.158.9
47.356.3
Use of SEL Techniques3. Students are taught to feel responsible for how they act.13. Students are taught they should care about how others feel.
91.390.0
82.769.3
76.353.8
* = A high score on this subscale is negative because items are negatively worded.

Part III: BullyingStudent Results
• Students asked to respond to 12 statements about the extent to which he/she was bullied, including: – 4 physical statements– 4 verbal statements– 4 social bullying statements
• Students in grades 6-12 also given 5 statements about cyberbullying
• Students responded on a 6-point scale from “Never” to “Everyday”

1. I was teased by someone saying hurtful things to me.
Never Sometimes
Once or Twice a Month
Once a Week
Several Times a Week
Everyday
Grade Level
Elementary 48.9% 35.2% 4.9% 3.0% 3.6% 4.4%
Middle 47.9% 32.5% 5.1% 4.1% 5.3% 5.1%
High 59.0% 26.2% 4.9% 3.4% 3.2% 3.3%
Total 51.2% 31.8% 5.0% 3.5% 4.2% 4.4%
Verbal Bullying Items
4. A student said mean things to me.
Never Sometimes
Once or Twice a Month
Once a Week
Several Times a Week
Everyday
Grade Level
Elementary 47.6% 34.3% 5.2% 3.6% 3.5% 5.7%
Middle 47.7% 31.8% 5.1% 4.2% 4.8% 6.4%
High 58.2% 26.4% 4.4% 3.8% 3.2% 4.0%
Total 50.4% 31.3% 4.9% 3.9% 3.9% 5.5%

7. I was called names I didn’t like.
Never Sometimes
Once or Twice a Month
Once a Week
Several Times a Week
Everyday
Grade Level
Elementary 56.6% 29.0% 3.7% 2.8% 2.9% 5.1%
Middle 54.7% 28.0% 4.1% 3.3% 3.9% 6.0%
High 63.2% 23.2% 4.1% 2.9% 2.6% 3.9%
Total 57.7% 27.1% 4.0% 3.0% 3.2% 5.1%
Verbal Bullying Items
10. Hurtful jokes were made up about me.
Never Sometimes
Once or Twice a Month
Once a Week
Several Times a Week
Everyday
Grade Level
Elementary 69.2% 20.0% 2.9% 2.0% 2.1% 3.9%
Middle 67.5% 19.7% 3.0% 2.8% 2.7% 4.3%
High 73.0% 16.4% 3.3% 2.1% 2.0% 3.1%
Total 69.6% 18.9% 3.0% 2.3% 2.3% 3.9%

2. I was pushed or shoved on purpose.
Never Sometimes
Once or Twice a Month
Once a Week
Several Times a Week
Everyday
Grade Level
Elementary 62.9% 26.1% 4.0% 2.4% 2.3% 2.3%
Middle 60.6% 26.4% 4.4% 3.0% 2.8% 2.8%
High 71.4% 17.7% 3.9% 2.6% 1.7% 2.6%
Total 64.3% 24.0% 4.1% 2.7% 2.3% 2.6%
Physical Bullying Items
5. I was hit or kicked and it hurt.
Never Sometimes
Once or Twice a Month
Once a Week
Several Times a Week
Everyday
Grade Level
Elementary 75.2% 16.6% 2.3% 2.1% 1.6% 2.3%
Middle 77.5% 13.7% 2.8% 2.1% 1.6% 2.2%
High 86.2% 6.8% 2.0% 1.8% 1.2% 1.9%
Total 79.0% 12.9% 2.4% 2.0% 1.5% 2.2%

8. A student stole or broke something of mine on purpose.
Never Sometimes
Once or Twice a Month
Once a Week
Several Times a Week
Everyday
Grade Level
Elementary 72.9% 18.2% 3.3% 1.9% 1.4% 2.2%
Middle 73.2% 17.4% 3.4% 2.3% 1.7% 2.0%
High 80.3% 12.2% 2.7% 2.0% 1.1% 1.7%
Total 75.0% 16.3% 3.2% 2.1% 1.4% 2.0%
Physical Bullying Items
11. A student threatened to harm me.
Never Sometimes
Once or Twice a Month
Once a Week
Several Times a Week
Everyday
Grade Level
Elementary 77.6% 14.0% 2.5% 1.8% 1.4% 2.8%
Middle 77.7% 13.0% 2.8% 2.0% 1.8% 2.6%
High 82.4% 9.6% 2.4% 1.9% 1.5% 2.3%
Total 78.9% 12.4% 2.6% 1.9% 1.6% 2.6%

3. Students left me out of things to make me feel badly.
Never Sometimes
Once or Twice a Month
Once a Week
Several Times a Week
Everyday
Grade Level
Elementary 63.4% 23.8% 4.2% 2.7% 2.3% 3.6%
Middle 69.6% 18.4% 3.5% 2.8% 2.6% 3.1%
High 75.2% 14.6% 3.6% 2.4% 1.7% 2.5%
Total 68.9% 19.3% 3.8% 2.6% 2.3% 3.1%
Social/Relational Bullying Items
6. A student told or got others not to like me.
Never Sometimes
Once or Twice a Month
Once a Week
Several Times a Week
Everyday
Grade Level
Elementary 70.0% 18.8% 3.1% 1.9% 2.2% 4.0%
Middle 70.1% 18.0% 3.2% 2.4% 2.2% 4.2%
High 73.4% 16.1% 3.4% 2.3% 1.9% 3.0%
Total 70.9% 17.8% 3.2% 2.2% 2.1% 3.8%

9. A student got others to say mean things about me.
Never Sometimes
Once or Twice a Month
Once a Week
Several Times a Week
Everyday
Grade Level
Elementary 73.5% 17.0% 2.7% 1.8% 1.7% 3.3%
Middle 72.2% 16.2% 3.0% 2.4% 2.4% 3.8%
High 76.6% 13.9% 3.4% 2.0% 1.7% 2.5%
Total 73.8% 15.9% 3.0% 2.1% 2.0% 3.3%
Social/Relational Bullying Items
12. Students told another student not to be friends with me because the other students didn’t like me.
Never Sometimes
Once or Twice a Month
Once a Week
Several Times a Week
Everyday
Grade Level
Elementary 72.4% 18.0% 2.5% 1.9% 1.8% 3.5%
Middle 73.6% 15.8% 2.9% 2.1% 2.0% 3.7%
High 76.9% 13.7% 2.7% 2.2% 1.6% 2.9%
Total 74.1% 16.0% 2.7% 2.0% 1.8% 3.4%

14. A student sent me a mean or hurtful message about me using email, text messaging, instant messaging, or similar
electronic messaging.
Never Sometimes
Once or Twice a Month
Once a Week
Several Times a Week
Everyday
Grade Level
Middle 84.8% 9.9% 2.0% 1.2% .9% 1.2%
High 83.5% 10.2% 2.0% 1.6% 1.0% 1.7%
Total 84.3% 10.0% 2.0% 1.3% .9% 1.4%
Cyberbullying Items
15. A student sent to others a mean or hurtful message about me using email, text messaging, instant messaging,
or similar electronic messaging.
Never Sometimes
Once or Twice a Month
Once a Week
Several Times a Week
Everyday
Grade Level
Middle 82.4% 11.2% 2.1% 1.5% 1.1% 1.6%
High 80.5% 11.6% 2.6% 1.9% 1.2% 2.1%
Total 81.6% 11.4% 2.3% 1.7% 1.2% 1.8%

Cyberbullying Items16. A student posted something mean or hurtful about me on a social media website, such as Facebook, Twitter, or
Myspace.
Never Sometimes
Once or Twice a Month
Once a Week
Several Times a Week
Everyday
Grade Level
Middle 87.0% 8.1% 1.6% 1.3% .7% 1.3%
High 83.6% 9.3% 2.5% 1.8% 1.1% 1.8%
Total 85.6% 8.6% 2.0% 1.5% .9% 1.5%
17. A student pretending to be me sent or posted something hurtful or mean about me or others using text
messaging, a social media website, email, or a similar method.
Never Sometimes
Once or Twice a Month
Once a Week
Several Times a Week
Everyday
Grade Level
Middle 91.2% 5.1% 1.0% 1.0% .7% 1.0%
High 91.0% 4.1% 1.3% 1.3% .9% 1.5%
Total 91.1% 4.7% 1.1% 1.1% .7% 1.2%

Cyberbullying Items
18. A student sent me a mean or hurtful text message, email, or posting for me to see about another student.
Never Sometimes
Once or Twice a Month
Once a Week
Several Times a Week
Everyday
Grade Level
Middle 84.4% 9.5% 1.8% 1.5% 1.2% 1.6%
High 82.3% 9.3% 2.9% 1.8% 1.5% 2.2%
Total 83.5% 9.4% 2.3% 1.6% 1.3% 1.9%

Part II: Techniques
Teacher/Staff Results

Positive Techniques
Punitive Techniques
SEL Techniques
In contrast to reports of students, teachers/staff consistently report low use of punitive techniques and high use of positive and SEL techniques.
Disciplinary Techniques by Teacher Grade Level

How do school climate scores relate to other measures?
• Caution: Correlation does not mean causation. Direction of influence is likely to be bidirectional.

Subscales
% Students Suspended/Expelled % Passing ELA % Passing Math
Elementary
Middle/High
Elementary
Middle/High
Elementary
Middle/High
Teacher-Student Relations -.63** -.46** .48** .44** .50** .45**
Student-Student Relations
-.76** -.48** .63** .63** .65** .63**
Respect for Diversity -.72** -.41** .68** .43** .67** .42**
School Safety -.65** -.47** .57** .60** .54** .60**
Clarity of Expectations -.60** -.47** .51** .52** .51** .53**
Fairness of Rules -.55** -.59** .45** .47** .46** .49**
Engagement -.57** -.41** .45** .48** .49** .51**
Schoolwide Bullying .66** .30* -.74** -.49** -.70** -.47**
Total Climate -.62** -.45** .44** .49** .47** .50**
N= 83 Elementary schools; 46 Middle and High Schools. *p <.05, **p < .01
Evidence of Concurrent Validity Student Survey and School-level Data

Evidence of Concurrent Validity Teacher Survey and School-level Data
Teacher Survey
% Students Suspended/Expel
led% Passing ELA % Passing Math
Elementary Middle/High
Elementary Middle/High Elementar
yMiddle/
High
Teacher-Student Relations -.58** -.50** .63** .48** .65** .47**Student-Student Relations -.76** -.62** .74** .69** .75** .71**Respect for Diversity -.55** -.47** .66** .51** .66** .52**
School Safety-.70** -.42** .68** .54** .68** .54**
Clarity of Expectations -.54** -.27* .62** .36** .62** .36*
Fairness of Rules-.56** -.36** .60** .40** .61** .43**
Engagement-.73** -.54** .78** .61** .82** .68**
Bullying Schoolwide .70** .21 -.67** -.37** -.70** -.44**Teacher-Home Communication -.59** -.43** .70** .43** .70** .43**
Staff Relations-.56** -.26* .49** .25* .49** .22*
Total Climate-.67** -.45** .67** .51** .72** .53**
N= 84 Elementary schools; 46 Middle and High Schools. *p <.05, **p < .01

Evidence of Concurrent Validity Student Survey: Positive, Punitive, SEL
Techniques
School Climate Workshop, 5/23/12
Positive Punitive SELElementa
ryMiddle/
High Elementary Middle/High Elementary
Middle/High
Teacher-Student Relations .65** .74** -.66** -.47** .85** .92**
Student-Student Relations .42** .33* -.80** -.66** .80** .63**
Respect for Diversity .42** .69** -.82** -.40** .77** .88**
School Safety .51** .53** -.70** -.63** .82** .78**
Clarity of Expectations .67** .64** -.70** -.37* .83** .91**
Fairness of Rules .54** .67** -.70** -.50** .81** .82**
Engagement .59** .73** -.70** -.41** .85** .90**
Bullying School-wide -.17 .01 .93** .70** -.61** -.20
Total Climate .66** .74** -.63** -.44** .90** .95**
% Suspensions -.25* -.13 .71** .60** -.47** -.38*
% Passing ELA .05 .00 -.79** -.66** .40** .35**
% Passing Math .12 .07 -.76** -.67** .42** .37**
N= 84 Elementary schools; 46 Middle and High Schools. *p <.05, **p < .01

Evidence of Concurrent Validity Teacher Survey: Positive, Punitive, SEL
Techniques
Positive Punitive SELElement
ary Middle Elementary Middle Element
ary Middle
Teacher-StudentRelations
.67** .67** -.81** -.60* .87** .81**
Student-Student Relations
.56** .56** -.90** -.69** .84** .64**
Respect for Diversity .65** .59** -.79** -.57** .82** .73**
School Safety .62** .55** -.87** -.60** .85** .69**
Clarity of Expectations .65** .74** -.82** -.55** .87** .87**
Fairness of Rules .63** .64** -.80* -.54** .86** .77**
Engagement .62** .70** -.89** -.73** .86** .79**
N= 89 Elementary schools; 46 Middle and High Schools *p <.05, **p < .01

Evidence of Concurrent Validity Teacher Survey: Positive, Punitive, SEL
Techniques
Positive Punitive SELElementar
y Middle Elementary Middle Elementar
y Middle
Bullying -.49** -.01 .86** .32* -.77** -.13
Teacher-Home Communications
.67** .74** -.81** -.59** .90** .84**
Staff Relations .60** .53** -.69** -.33* .79** .70**
Total School Climate .66** .69** -.89** -.63** .91** .83**
% Suspensions -.37** -.24 .76** .45** -.52** -.28
% Passing ELA .45** .25 -.74** -.55** .69** .34*
% Passing Math .47** .28 -.75** -.62** .69** .33*
N= 89 Elementary schools; 46 Middle and High Schools *p <.05, **p < .01

Elementary Students
Verbal Bullying
Physical Bullying
Social Bullying
Total School Climate -.47** -.48** -.52**
Engagement: Cog. & Behav. -.32** -.37** -.35**
Engagement: Emotional -.44** -.47** -.52**
Punitive Techniques .62** .60** .62**
Positive Techniques -.11 -.07 -.12
SEL Techniques -.35** -.37** -.41**

Middle School and High School Students
Verbal Bullying
Physical Bullying
Social Bullying
Total School Climate .18 -.08 -.12
Engagement: Cog. & Behav. .28 .10 .01
Engagement: Emotional .15 -.08 -.09
Punitive Techniques .18 .35* .18
Positive Techniques .36* .25 .09
SEL Techniques .24 .01 -.07

Summary
• Delaware has developed a reliable and valid measure of school climate.
• Scores on the surveys are reliable and related to important outcomes, particularly academic achievement and suspensions/expulsions.

Types of Scores Reported
Standard Scores
Mean set at 100, standard deviation of 15 (i.e., “normal” range is plus or minus 15).
Based on grade-level norms (either elementary, middle school, high school, early childhood, special education) or on specific grades for student survey (3-12).
Answers: How do student perceptions of school climate in your school compare to those of other students in other schools at similar grade levels?

Average Item Score
• Sum of score for all items on a subscale, divided by the subscale’s number of items
• For Part I, scores can range from 1 (Strongly Disagree) to 4 (Strongly Agree)
• For example: – 4 items on subscale– Scores on items = 4, 4, 3, 3– Average score = 14/4 = 3.5
• NOTE: the meaning is different for Part III Bullying Victimization (6 point rating)
School Climate Workshop, 5/7/13

Answers: Regardless how your school compares to other schools, do the scores reflect positive or negative perceptions of school climate?
Particularly meaningful when scores tend be very high across all schools (e.g., when “average” is very positive)Most appropriate score for comparing scores from year to year.
School Climate Workshop, 5/7/13

Frequency scores
• Number and percentage of responses to individual items
• Answers: • Given a subscale score, what specific
items caused the score to be low (or high)?
• Presented for all items on each survey • Some items do not fall under a subscale,
and thus must be looked at alone

To Middle and High Schools:• In general, perceptions of school climate
become lower with increasing grades (not shown in standard scores, but shown in other two scores).
ALL Grade Levels:• Scores tend to be lowest for Student Relations• Lower for African Americans• Lower if your school has high free and reduced
lunch count
CAUTIONS:

• When interpreting standard and average item scores for your school:– First, focus on Total Score on each
subscale of the survey– Next, check for group differences
• Student Survey: Grade, Race, Gender• Teacher Survey: Teacher vs. Other
Staff• Home Survey: Grade, Race
School Climate Workshop, 5/7/13

School Climate Report Structure & Coding
Table Number Codes• 1 = School Climate Subscales
Data• 2 = Techniques Subscales Data• 3 = Bullying Subscales Data• 4 = Engagement Subscales Data
Table Letter Codes• a = Standard Scores• b = Average Item Scores• c = Individual Items %
Response
• STUDENT only:• (1) = Race & Gender
Breakdown• (2) = Grade Level
Breakdown
Response CodesTable 1, 2, 4:1 = Disagree A Lot, 2 = Disagree, 3 = Agree, 4 = Agree A Lot Table 3:1 = Never, 2 = Sometimes, 3 = Once or Twice/Month, 4 = Once/Week, 5 = Several Times/Week, 6 = Everyday
Symbol Code
✷ A higher score represents an unfavorable response to items on the Bullying School-Wide subscale and the Use of Punitive Techniques subscale.