school choice regulations: red tape or red herring? · school choice regulations: red tape or red...
TRANSCRIPT

JAnuAry 2013
BY DAVID STUIT AND SY DOAN, BASIS POLICY RESEARCHForeword by Chester E. Finn, Jr. and Amber M. Winkler
School Choice regulations:red Tape or red herring?

iiSchool Choice Regulations: Red Tape or Red Herring? Table of Contents
03 Executive Summary and Foreword
07 Acknowledgments
08 Introduction
08 Organization
09 Part I: Background
09 The National Landscape
11 Programs Included in This Study
11 What Is the Difference between Voucher Programs and Tax Credit Scholarship Programs?
12 Part II: Descriptive Analysis
12 Private School Participation Rates in Voucher Programs and Tax Credit Scholarship Programs
13 What Types of Regulations Apply to Participating Private Schools?
15 Which Programs Have the Most and Least Regulations?
19 Do Programs with More Regulations Have Lower School-Participation Rates?
20 Are Some Types of Private Schools More Sensitive to Regulation than Others?
22 Part III: Survey Results
22 About the Survey
23 Who Influences the Decision to Participate?
23 What Reasons Do Schools Give for Not Participating in Voucher Programs?
25 What Reasons Do Schools Give for Participating in Voucher Programs?
25 Which Regulations Are Most Important to Schools' Participation Decisions?
28 Are Non-participating Schools More Selective?
28 Are Non-participating Schools More Expensive?
30 What Regulatory Changes Would Entice Schools to Participate?
31 Part IV: Discussion
33 Appendix: Technical Information on the Descriptive Analysis
41 Endnotes
46 About the Authors
CONTENTS

3School Choice Regulations: Red Tape or Red Herring? Executive Summary and Foreword
ExECuTivE Summary aNd FOrEwOrd
Chester E. Finn, Jr. and Amber M. Winkler
Many proponents of private school choice—both the voucher and tax credit scholarship versions—take for granted that schools won’t participate (or shouldn’t participate) if government asks too much of them, regulates their practices, requires them to reveal closely held information and—above all—demands that they be publicly accountable for student achievement. A recent Friedman Foundation report, for example, be-moaned testing requirements that “may force all par-ticipating schools to move in the direction of a sin-gle, monopolistic curriculum and pedagogy...”1 And analysts at the Cato Institute went so far as to send letters to Indiana private schools urging them not to participate in the state’s new voucher program, which it called a “strategic defeat” for school reform, in part because of its testing and transparency requirements.2
But is this assumption justified? It’s surely plausible on paper. Part of what’s distinctive and valuable—and often educationally effective—about private schools is their autonomy, their freedom to be different, their es-cape from the heavy regulatory regime that characteriz-es most of public education. Insofar as they cherish that autonomy, over-regulation by government might well deter them from participating in taxpayer-supported choice programs and thereby block children from ben-efiting from the education those private schools offer.
Were such school refusals to be widespread, the pro-grams themselves could not serve many kids. Voucher and tax credit programs obviously cannot do much good if their putative beneficiaries—typically girls and boys from disadvantaged backgrounds and/or dreadful public schools—are unable to gain access to privately operated schools. If those schools shun the programs, there isn’t much point in creating or expanding such opportunities, at least not in relation to the current supply of private schools. (A separate issue, not ad-dressed here, is whether additional pupil demand made possible by such programs will cause a “supply response,” namely the creation of new private schools.)
Private schools deciding whether to participate in a voucher or tax credit scholarship program must weigh
multiple factors: Do they have room for more pupils? Is their education program suited to the needs (and, often, the deficits) that voucher- and scholarship-bearing youngsters are apt to bring with them? Is the amount of the voucher or scholarship sufficient to offset the marginal cost of enrolling such a student? How will the school handle transportation? And what about political considerations that may be important to schools, including the responses of current pupils (and parents), of alumni/ae and donors, and of influ-ential folks in their communities?
Yes, there’s much for school leaders to ponder in addi-tion to whatever concern they may have with govern-ment rules and red tape. And policy makers shaping education-choice programs involving private schools must obviously do their best to anticipate the schools’ likely responses. Well-designed programs will natural-ly strive for sufficient school participation so that they can have the opportunity to accomplish their purpose.
But policy makers must also be responsible stewards of taxpayer dollars and do their best to ensure that such programs advance the public’s interest in securing a quality education for all children in safe, salubrious environments—all of which leads to some degree of regulation. And in the vast realm of regulation, per-haps the touchiest will turn out to be (or so we’ve been admonished by the critics and worry-warts mentioned above) the requirement that private schools administer state tests and be held publicly accountable for student achievement as measured by such tests.
Policy makers contemplating the creation, revision, or expansion of school-choice programs must therefore balance the impulse to regulate on behalf of the public interest against the need for enough private schools to participate so that the children for whom the pro-grams are intended can, in reality, benefit from them.
But how to fix that balance? Is there some tipping point beyond which private schools will surely eschew the program? Are some regulations absolutely intoler-able, others mildly repugnant, others bearable—even benign? Where is reality?

4School Choice Regulations: Red Tape or Red Herring? Executive Summary and Foreword
Fortunately, enough voucher and scholarship pro-grams exist today that it’s possible to answer these questions empirically—that is, to gauge the extent to which regulations (and other factors) actually de-ter private schools from participating. Mindful that regulations come in many forms and flavors, it’s also possible to examine which kinds of regulation (if any) are particularly vexing to private schools and to investigate whether specific regulations are more troublesome to some segments of the diverse private school universe than to others. The results of such an analysis allow us to reality-test the broad cau-tions voiced by the Friedman Foundation, the Cato Institute, and others—in particular their warning that holding schools to account for student achieve-ment (especially via conventional state testing pro-grams) will surely cause them to turn their backs on such programs and thus leave needy children with-out good educational options at all.
We at the Thomas B. Fordham Institute have a long-standing interest in advancing quality school choices for kids who need them and a parallel interest in boost-ing educational achievement with the help of rigorous standards, assessments, and accountability systems. As an authorizer of charter schools in Ohio, we deal di-rectly with the intersection of those twin policy goals. But we believe in private school choice, too—indeed, we believe in every kind of school choice that works for kids—and have previously mapped the touchy territory of accountability for “voucher schools” and advised policy makers on how to deal with these chal-lenging trade-offs and balancing acts.3
So it was clearly time to probe more deeply into the realities of today’s voucher (and tax credit scholar-ship) programs and determine how the private schools themselves view these issues of government regulation.
To conduct that investigation, we turned once again to Dr. David Stuit of Basis Policy Research who had previously done a fine piece of work for us (Are Bad Schools Immortal?, 2010). His analytic skills are su-perb, and his energy and diligence are unmatched. With financial assistance from the Walton Family Foundation, The Lynde and Harry Bradley Founda-tion, the Lovett and Ruth Peters Foundation, the Randolph Foundation, and the Thomas B. Fordham Foundation (our sister organization), we asked David and his colleague Sy Doan to examine closely thir-teen extant voucher and tax credit scholarship pro-grams (six of the former, seven of the latter) across eleven states. We asked them to describe the nature,
extent, and burdensomeness of their regulations and to determine how many private schools participate in them—and how many do not. We asked them also to survey private schools in communities served by four of the country’s most prominent voucher programs (city-specific programs in Milwaukee and Cleveland, statewide programs in Ohio and Indiana) to ascertain how both participating and non-participating schools view those programs and their regulations and how heavily they weigh program requirements (and other constraints) when deciding whether to sign up for and accept the programs’ students.4
In particular, we asked David and Sy to investigate this quartet of questions:
› Do regulations and accountability requirements deter private schools from participating in choice programs?
› How important are regulations and account-ability requirements to private school participa-tion compared to other factors, such as voucher amounts, etc.?
› Are certain types of regulations and accountability requirements stronger deterrents than others?
› Do certain types of private schools shy away from stronger regulations and accountability more than others?
❖ KEy FIndIngS
1) There is enormous variation in the nature and ex-tent of the regulations associated with these thir-teen programs. Stuit’s “burden scores” (calculated on a scale from zero for “least regulated” to one hundred for “most regulated”) range from eight for Arizona’s “individual” tax credit scholarship program to seventy-six for the current iteration of Milwaukee’s long-running voucher program (like a ship burdened with barnacles, the Milwau-kee program has accumulated more rules as it has grown older and larger).
2) As expected, there is a moderately negative cor-relation between regulatory burden and pri-vate school participation in choice programs. In other words, the more regulations, the less likely schools are to sign up for them. Partici-pation rates in voucher programs ranged from 29 percent for the newly expanded Louisi-

5School Choice Regulations: Red Tape or Red Herring? Executive Summary and Foreword
ana Student Scholarships program to 94 per-cent for Cleveland’s Scholarship program.5 Analysts estimate that if a program were to change from being the least to the most regulat-ed, private school participation rates would drop nine percentage points.
3) Yet “regulations” per se aren’t the schools’ foremost concern. Indeed, “not willing to comply” with program rules was cited by just 3 percent of non-participating schools as their single most impor-tant reason for avoiding the program. Instead, the most-cited reason was a lack of voucher-eligible families in the region.6
4) Within the sphere of program regulations, and contrary to the anti-testing assertions of Friedman and others, curricular constraints and testing is-sues ranked among the less-important consider-ations for private school leaders (see figure ES-1). Just a quarter of them listed the “requirement to participate in state testing” as “very” or “extreme-ly” important to their decision (and only 17 per-cent said that about “public reporting of state test results”) versus half or more who were concerned about admissions (“upholding student admissions criteria”) and “allowing students to opt out of reli-gious activities” (a rule found only in Milwaukee).
5) Catholic schools are least likely to have their deci-sions affected by regulation. Non-sectarian schools are more likely to forego participation when bur-dened with increased regulations—as are small schools, possibly because they have less space and administrative capacity to handle the paperwork associated with participation. (They may also be located in thinly-populated areas with few vouch-er-eligible children.)
6) Tax credit scholarship programs—because they are an indirect way of subsidizing private school attendance, using “taxpayer dollars” that never ac-tually pass through the state treasury—are signifi-cantly less subject to additional regulations than voucher programs.
7) The reasons that most school principals gave for participating in the voucher program were the fol-lowing: to expand their mission in the community (87 percent), “to help voucher eligible families al-ready enrolled in their schools” (75 percent) and “to help needy children in the community” (72 percent).
❖ PolIcy tAKEAwAyS
› Choice advocates and policy makers should bear in mind that in order to exist and operate in many states—and particularly to be “accredited” or “chartered” by those states (and thus perhaps become eligible for other forms of public aid)—private schools must already comply with various rules and regulations, which sometimes include testing requirements. That is to say, participation in a choice program will not be the first time that many schools’ freedoms of action are constrained by government demands.
› That does not, however, mean that policy mak-ers should burden private schools (or anyone else, for that matter) with unnecessary regulation. They must seek the bare minimum that enables them to look taxpayers (and choice opponents) in the eye and say, “This program is in the public inter-est.” The kinds of regulation they should be wari-est of are those that bear on student admissions and schools’ religious (and religious-education) practices. These types are significantly more like-ly to deter schools from taking part in the pro-grams than are requirements pertaining to aca-demic standards, testing, and public disclosure of achievement results.7 Reasonable folks, of course, can disagree about what constitutes “good” and “bad” regulation, but any that results in copious compliance-checking can deter would-be par-ticipants: nearly 60 percent of non-participating schools cited “amount of paperwork required” as key to their opt-out decision.
› Perhaps especially as “Common Core” standards take effect in states and new, improved assessments (aligned with those standards) come on line—and more so if colleges and employers begin taking those standards and test results seriously—private schools may become even more accepting of the obligation to embrace those academic standards (for core subjects) and the assessments that ac-company them.
› In any case, regulation by government is not the greatest deterrent to private school participation in voucher and tax credit scholarship programs. More consequential concerns involve the design of the program itself: how many and which sorts of youngsters and families are eligible for it, how many of them live within striking distance of a given private school, how well is the program

6School Choice Regulations: Red Tape or Red Herring? Executive Summary and Foreword
Source: Survey results.
Note: The results in Figure ES-1 are based on responses from 241 private schools (179 participants and 62 non-participants). Figure ES-1 reports the percentage of respondents who indicate that each factor was either “very important” or “extremely important” to their decision. Separate figures are presented for all private schools (n=241), participants (n=179), and non-participants (n=62). The survey question was, “Below are some specific factors that might influence a school’s decision to participate in a voucher program. To what extent were these factors important when your school was deciding whether or not to participate?”
Figure ES-1. Importance of different program requirements to schools’ decisions regarding participation in voucher programs
Upholding student admissions criteria
Allowing students to opt out of religious activities
Amount of paperwork required
The maximum dollar amount of the voucher
Adopting an open-enrollment policy for voucher participants
Limits on charging additional tuition or fees
Requirement to participate in state testing
Teacher credential/certification requirements
Teaching certain state curriculum standards
Administrator credential/certification requirements
Public reporting of schools' state test results
Providing minimum number of instrucitonal hours
Conducting teacher performance evaluations
Financial audit and financial disclosure requirements
Percent of schools indicating factor was “Very Important” or “Extremely Important” to their participation decision
52%
50%
42%
40%
31%
25%
25%
25%
24%
22%
17%
16%
16%
14%
54%
48%
36%
43%
22%
22%
21%
28%
23%
24%
15%
17%
17%
14%
48%
57%
58%
31%
58%
36%
37%
18%
24%
15%
21%
13%
15%
15%
ALL SCHOOLS PARTICIPANTS NON-PARTICIPANTS

7School Choice Regulations: Red Tape or Red Herring? Executive Summary and Foreword
publicized, how burdensome is it for families to qualify and apply, and how close to “adequacy” is the level of financial assistance that it makes avail-able to students and the schools they attend?
› Those considerations apply to tax credit scholar-ship programs as well as voucher programs, yet a clear takeaway from this research is that, to minimize regulatory burden and maximize school participation (not to mention sidestep “Blaine Amendment” type barriers in state constitutions), policy-makers ought to opt for the tax-credit ap-proach. They should do so, however, mindful that in minimizing burden and maximizing participa-tion they will also lose a measure of accountabil-ity. As Table 2 and Figure 4 make clear (pgs 12 and 15), tax-credit programs enjoy higher private-school participation rates—but almost all of them abjure testing mandates and public-reporting of student performance. (Florida’s tax-credit pro-gram and one of Arizona’s two programs are par-tial exceptions to that statement.)
Acknowledgments
Many people and organizations helped make this report
possible. Our thanks go to the Walton Family Foundation,
The Lynde and Harry Bradley Foundation, the Lovett and Ruth
Peters Foundation, and the Randolph Foundation for their
financial support, as well as to our sister organization, the
Thomas B. Fordham Foundation.
Special thanks are due to lead analyst David Stuit, the
founding partner of Basis Policy Research. We appreciate
Dr. Stuit’s enthusiasm for and execution of rigorous and
relevant ed-policy research. Similar appreciation goes to
David’s co-author Sy Doan, a research associate with Basis
who spent countless hours sifting through private school
regulations and recruiting survey respondents. Patrick Wolf,
the endowed chair for school choice in the Department of
Education Reform at the University of Arkansas, served
as an external advisor, providing technical and substantive
feedback at critical junctures. We’re thankful, too, for the
excellent research assistance provided by Claire Graves and
Michael Ishimoto.
We are indebted to the 241 private school administrators
who took the time out of their busy schedules to complete
our survey and explain why they do or do not participate in
voucher programs. We also owe thanks to the Wisconsin
Department of Public Instruction and Indiana Department
of Education for providing timely, detailed responses to our
questions on their states’ respective voucher programs.
Finally, kudos to the Fordham team: Executive Vice President
Michael Petrilli hatched the study idea and provided feedback
on report drafts; Emmy Partin allowed us to tap her wealth of
knowledge on the inner workings of Ohio’s voucher programs;
Matt Richmond oversaw production; Michelle Gininger and
Joe Portnoy managed dissemination; Pamela Tatz served as
copyeditor; Alton Creative, Inc. served as layout designer;
and Sam Whitehead created our fantastic M.C. Escher-
inspired cover.

8School Choice Regulations: Red Tape or Red Herring? Introduction
iNTrOduCTiONPrivate school vouchers have experienced a revival of sorts over the past few years. They found a new audience in the Republican majorities that swept into office after the 2010 midterm elections. In 2011—the “Year of School Choice,” according to the Wall Street Journal—state lawmakers passed fif-teen bills to create, expand, or restore programs that allow families to use publicly funded vouchers or tax credit scholarships to enroll in private schools.8
Notable among these were Indiana’s enactment of a statewide voucher program with broad income eligi-bility limits that reach the middle class, the renewal of the D.C. Opportunity Scholarship Program, and a four-fold increase in the number of vouchers available in Ohio’s statewide EdChoice Scholarship Program. More recently, Louisiana expanded the New Orleans voucher program to the rest of the state.9
The success of private school–choice programs hinges to a significant degree on a robust supply of high-quality private schools willing and able to enroll scholarship-eligible families. According to economic theory on school choice, the new demand for private schooling that is generated by vouchers will be met by two sources: new schools will emerge in the mar-ketplace and existing schools will find ways to expand their enrollment.10 Yet empirical research on the sup-ply side of the school-choice issue is scarce, and we know little about how the private school market is actually responding to voucher programs. As private school–choice programs expand to more communities and to higher income brackets, it becomes increasingly important to understand such factors.
This study examines how program regulations (includ-ing testing and accountability requirements) and other factors influence the participation of existing private schools. It consists of two components: A descriptive analysis of the regulations in relation to school partici-pation rates in thirteen voucher and tax credit scholar-ship programs and a survey of private schools in five cities with prominent voucher programs.
❖ orgAnIzAtIon
The report is divided into four sections. The first pro-vides some essential background, including a review of the origins of school choice in the U.S., an explanation of the difference between voucher and tax credit scholar-ship programs, and a look at the current national land-scape of voucher and tax credit scholarship programs.
The second section is a descriptive analysis of the rela-tionship between regulations and private school partici-pation rates in thirteen choice programs (six voucher and seven tax credit scholarship programs) across ten states and the District of Columbia. Using data on close to 6,000 private schools from the Private School Universe Survey (PSS) and other sources, we estimate the partici-pation rates of the programs, describe their regulations, examine the degree to which more regulation correlates with lower participation, and explore differences in how certain types of private schools respond to changes in regulatory burden.
The third section presents findings from a survey of 241 private schools in five cities with voucher pro-grams (Cleveland, Milwaukee, Cincinnati, Dayton, and Indianapolis). The survey results shed light on the reasons behind schools’ decisions on whether or not to participate in the voucher programs. We pay particular attention to understanding the importance of regula-tions in such decisions, relative to other factors.
The final section summarizes the key findings from both components of the study and discusses implica-tions for future policy and practice.

9School Choice Regulations: Red Tape or Red Herring? Part I: Background
ParT i: BaCkgrOuNdMilton Friedman introduced the modern-day concept of the school voucher more than fifty years ago. In his seminal 1955 essay titled the “The Role of Govern-ment in Education,” the Nobel Prize–winning econo-mist proposed an education system based on portable vouchers that would allow families to enroll their chil-dren in the school of their choice—public or private. This, Friedman argued, would exert competitive pres-sure upon the education sector to improve continually the quality of education provided.11
Friedman’s ideas were first put into practice in the U.S. in 1990, when Wisconsin passed legislation to create the nation’s first modern school-voucher program, the Milwaukee Parental Choice Program. The Supreme Court’s decision in the 2002 Zelman v. Simmons-Harris case—in which the country’s second voucher program, the Cleveland Scholarship and Tutoring pro-gram, was ruled constitutional—would help pave the legal road to future choice programs.
Even after that decision made clear that a properly designed voucher program could avoid running afoul
of the First Amendment’s “establishment clause,” risks remained under sundry state constitutions, par-ticularly those incorporating “Blaine amendments” restricting or forbidding the expenditure of state dollars in instances of possible religious entangle-ment. Hence tax credit scholarship programs arose as more politically and legally viable alternatives.12
Like vouchers, tax credit scholarship programs also use taxpayer dollars to provide scholarships for private school tuition, but they do so indirectly by providing tax credits to those who donate to non-profit Scholar-ship Granting Organizations (more below). Arizona legislators created the first such program in 1997.
❖ thE nAtIonAl lAndScAPE
In 2011–12, an estimated 210,000 students used vouchers or tax credit scholarships to attend private schools, accounting for 4.5 percent of private school enrollment in the U.S. and 0.4 percent of the total K–12 student population (see Figure 1).14 To put these figures into context, the number of voucher and tax
54m 4.7m
1.6m
250k
210k
Source: The enrollment data were collected from the National Center for Education Statistics (NCES) Common Core of Data, NCES 2009–10 Private School Universe Survey (PSS), and the Center for Public Education.13 The total number of voucher and tax credit recipients was collected from School Choice Now: The Year of School Choice: School Choice Yearbook 2011–12 by the Alliance for School Choice.
Note: Figure 1 reports student enrollment among different schooling options. The circles are included to illustrate relative enrollment size. All enrollment figures are from the 2009–10 school year, except for virtual school enrollment and voucher/tax credit recipients (2011–12).
Total K–12 Population (Private and Public)
Total K–12 Private School Enrollment
Charter School Enrollment
Full-time Virtual School Enrollment
Total Voucher/Tax Credit Recipients
Figure 1. Private school voucher/scholarship recipients relative to total K–12 population

10School Choice Regulations: Red Tape or Red Herring? Part I: Background
Table 1: Voucher and tuition tax-credit scholarship programs
JurISdIctIon nAmE tyPE yEAr EnActEd tArgEt StudEntS # oF StudEntS
D.C. Opportunity Scholarship Program Voucher 2004 Means-Tested 1,615
Indiana Choice Scholarship Program* Voucher 2011 Means-Tested 3,919
LouisianaStudent Scholarships for Educational Excellence Program
Voucher 2008Failing School & Means-Tested
1,848
OhioCleveland Scholarship and Tutoring Program*
Voucher 1995 Means-Tested 5,603
Ohio EdChoice Scholarship Program* Voucher 2005 Failing School 16,136
Wisconsin Milwaukee Parental Choice Program* Voucher 1990 Means-Tested 23,198
WisconsinParental Private School Choice Program (Racine)
Voucher 2011 Means-Tested 228
ArizonaIndividual School Tuition Organization Tax Credit
Tax Credit Scholarship
1997 None 25,343
ArizonaCorporate School Tuition Organization Tax Credit
Tax Credit Scholarship
2006 Means-Tested 4,578
Florida Florida Tax Credit Scholarship ProgramTax Credit Scholarship
2001 Means-Tested 37,998
Georgia Georgia Private School Tax CreditTax Credit Scholarship
2008 None 8,131
IndianaIndiana School Scholarship Tax Credit Program
Tax Credit Scholarship
2009 Means-Tested 10,820
IowaSchool Tuition Organization Tax Credit Program
Tax Credit Scholarship
2006 Means-Tested 590
PennsylvaniaEducational Improvement Tax Credit Program
Tax Credit Scholarship
2001 Means-Tested 40,876
Rhode Island Corporate Scholarship Tax CreditTax Credit Scholarship
2006 Means-Tested 341
FloridaJohn M. McKay Scholarship for Students with Disabilities Program
Voucher 1999 Special Education 22,861
GeorgiaGeorgia Special Needs Scholarship Program
Voucher 2007 Special Education 2965
LouisianaSchool Choice Pilot Program for Certain Students with Exceptionalities
Voucher 2010 Special Education 186
Ohio Autism Scholarship Program Voucher 2003 Special Education 2236
OhioJon Peterson Special Needs Scholarship Program
Voucher 2011 Special Education N/A
OklahomaLindsey Nicole Henry Scholarship for Students with Disabilities Program
Voucher 2010 Special Education 160
Utah Carson Smith Special Needs Scholarship Voucher 2005 Special Education 635
Arizona Lexie’s Law ScholarshipsTax Credit Scholarship
2009 Special Education 115
Source: Alliance for School Choice.
Note: Table 1 reports all choice programs listed in School Choice Now: The Year of School Choice: School Choice Yearbook 2011–12 published by the Alliance for School Choice. Two choice programs listed in the 2011–12 School Choice Yearbook, Colorado’s (Douglas County’s) Choice Scholarship Program and Oklahoma’s Equal Opportunity Education Scholarships, are not included in Table 1 because they were not operational during the 2011–12 school year. The number of students in the Ohio Autism Scholarship Program was not available. The shaded programs are included in the descriptive analysis. Programs with an asterisk are included in the survey analysis.

11School Choice Regulations: Red Tape or Red Herring? Part I: Background
credit scholarship recipients that year was equal to one-eighth of all charter school enrollees and compa-rable in size to another fledgling sector of the K–12 market: virtual public schools.
Table 1 displays the twenty-three voucher programs and tax credit scholarship programs that were active during the 2011–12 school year. Fourteen of these are voucher programs, while nine are tax credit scholarship programs. Eight programs are restricted to students with disabili-ties, while fifteen are open to the general K–12 popula-tion.15 All but two of the programs serving the general population use means testing or similar criteria to give disadvantaged families priority access to scholarships.16
❖ ProgrAmS IncludEd In thIS Study
The descriptive analysis and survey focused on sub-sets of the programs shown in Table 1. The descrip-tive analysis focused on the thirteen programs shaded in yellow in Table 1 (six voucher programs and seven tax credit scholarship programs). None of the thirteen programs were restricted to special education students. Data on private schools that offer the specific educa-tion services required to participate in special educa-tion programs were not available, so we focused on programs that are open to the general K–12 popula-tion. These thirteen programs span ten states and the District of Columbia, with Arizona and Ohio each containing two. The survey was administered to pri-vate schools located within the jurisdictions of the four voucher programs indicated by an asterisk in Table 1.
The sampling frame for the survey included all private schools in five cities (Dayton, Cincinnati, Cleveland, Milwaukee, and Indianapolis).
❖ whAt IS thE dIFFErEncE bEtwEEn VouchEr ProgrAmS And tAx crEdIt ScholArShIP ProgrAmS?
Voucher programs and tax credit scholarship programs both use taxpayer dollars to provide private school schol-arships to eligible students. The key difference lies in how money flows from taxpayers to private schools (see Figure 2). Vouchers are funded directly out of the state operat-ing budget, using tax revenue that would otherwise go towards educating the voucher recipients in the public school system. In a typical voucher program, a qualifying family will seek out a private school that participates in the program. The school will verify the family’s eligibil-ity and, if the student is accepted, will submit the neces-sary paperwork to the state on behalf of that family (with the parents’ endorsement). The state then disburses the voucher payment directly to the private school.
In the case of tax credit scholarship programs, the state grants individuals and/or corporations the option to donate to non-profit Scholarship Granting Organiza-tions (SGOs) in exchange for credits against their state tax liability worth 50 to 100 percent of the amount do-nated.17 The SGOs partner with private schools and use those donated funds to provide scholarships to students. Unlike voucher programs, taxpayer monies received by private schools via tax credit scholarship programs never pass through state coffers—that is, the school and the state never engage directly in a monetary transaction. Tax credit dollars never actually enter into the state treasury.
The difference in how tax dollars flow to private schools has important implications with regards to how schools are regulated. As our analysis reveals, schools participat-ing in tax credit programs are subject to fewer regula-tory burdens and accountability pressures than those in voucher programs. In tax credit scholarship programs, the SGOs are the direct recipients of taxpayer money, but that money is not “government property” so to speak, because it never entered the state treasury.18 Hence, the fiduciary responsibility lies with the SGOs, who must ensure that private schools use the funds appropriately. In contrast, checks for voucher programs come directly from the state treasury, and the state has the fiduciary re-sponsibility over how those funds are used. It is no sur-prise, then, that schools receiving funds directly from the state are subject to more government oversight.
Taxpayer
Figure 2. The flow of tax dollars to private schools in voucher programs and tax credit scholarship programs
VouchEr ProgrAmS
Private School4 4
tAx crEdIt ScholArShIP ProgrAm
State
4 4
State
SGO
Private SchoolTaxpayer
Parents choose school
Parents choose school
44

12School Choice Regulations: Red Tape or Red Herring? Part II: Descriptive Analysis
ParT ii: dESCriPTivE aNalySiSWe begin by comparing the school participation rates of thirteen programs during the 2011–12 school year.19 Then we describe the universe of regulations that could apply to participating schools and proceed to identify the programs subject to the most and least regulations using a newly developed measure of “regulatory bur-den.” Finally, using a cross section of data on private schools located within the jurisdictions of the thirteen programs, we examine the degree to which higher regu-latory burden correlates with lower odds of participa-tion and look for evidence that certain types of schools are more deterred by regulations than others.
❖ PrIVAtE School PArtIcIPAtIon rAtES In VouchEr ProgrAmS And tAx crEdIt ScholArShIP ProgrAmS
We calculate participation rates using school-level data from the National Center for Education Statistics’ (NCES) Private School Universe Survey (PSS) and state departments of education. The PSS provides a central source of information on the private schools lo-cated in the jurisdictions of the thirteen programs. We merged the 2009–10 PSS data (the most recent year
Table 2. Participation rates in voucher programs and tax credit scholarship programs
All PrIVAtE SchoolS urbAn PrIVAtE SchoolS
Total No. Participation Rate Total No. Participation Rate
Voucher Programs
D.C. Opportunity Scholarship 62 74% 61 76%
IN Choice Scholarship 676 35% 234 45%
LA Student Scholarships for Educational Excellence Program 445 29% 179 31%
OH Cleveland Scholarship and Tutoring Program 38 94% 36 100%
OH EdChoice Scholarship Program 839 39% 232 63%
WI Milwaukee Parental Choice Program 156 60% 121 74%
Total 2216 39% 863 55%
Tuition Tax Credit Scholarship Programs
AZ Individual School Tuition Organization Tax Credit 286 83% 147 89%
AZ Corporate School Tuition Organization Tax Credit 286 51% 147 56%
FL Florida Tax Credit Scholarship Program 1630 62% 503 65%
GA Georgia Private School Tax Credit 657 46% 132 50%
IA School Tuition Organization Tax Credit Program 224 71% 234 72%
PA Educational Improvement Tax Credit Program 1198 56% 303 62%
RI Corporate Scholarship Tax Credit 95 54% 35 56%
Total 4376 59% 1501 64%
Overall 6592 52% 2364 61%
Source: The authors’ calculations using data from the NCES 2009–10 PSS and program-participation information collected from state departments of education
Note: The results in Table 2 were computed using PSS sampling weights. The sample was restricted to schools observed in 2009–10 PSS data and excluded schools identified by the PSS as special education schools, early childhood programs, or Amish schools. All of the programs’ participation rates fall within 5 percentage points of each other when calculated without weights. The last column reports results for the subset of schools (n=2024 unweighted, 2364 weighted) located in communities designated by the PSS as large, midsize, or small cities; an urban-centric community type is reported in PSS as “City”.

13School Choice Regulations: Red Tape or Red Herring? Part II: Descriptive Analysis
available) with a master list of schools that participated in the voucher or tax credit scholarship programs in 2011–12.20 A school is designated as a “participant” if we found some type of official documentation indicat-ing its intent to participate in 2011–12. This includes directories of participating schools from state or SGO websites and published lists of schools that submit-ted applications or “intent to apply” forms with their state. Schools need not enroll students to be labeled participants, they just need to signal their desire to participate.21 Our final dataset includes 5,863 private schools, which generalizes to 6,592 schools after ap-plying the PSS sampling weights.22 (See Appendix for more detail on data and methods.)
Table 2 presents the 2011–12 participation rates for the thirteen programs. These reflect participation among schools in at least their 3rd year of operation (i.e., schools observed in the 2009–10 PSS). These are “raw” participation rates that do not reflect whether or not schools were eligible to participate or schools’ proximity to eligible voucher (scholarship) recipients. (Later in the report, we adjust the participation rates for these factors and others in order to provide a better apples-to-apples comparison.) In addition to reporting the participation rates for all schools, we also looked at the subset of schools located in urban areas, where demand from eligible families is greatest.
Overall, 52 percent of schools participated in their voucher or tax credit scholarship programs in 2011–12. Rates ranged from 94 percent in Cleveland’s voucher program to 29 percent in Louisiana’s newly expanded voucher program. Urban schools are slightly more likely to participate (61 percent), a result we expected due to the higher concentrations of eligible families in cities. Overall participation rates are significantly higher, on average, in tuition tax-credit scholarship programs than in voucher programs (59 versus 39 percent), but this dif-ference is diminished when we limit our focus to urban schools (64 percent compared to 55 percent).
❖ whAt tyPES oF rEgulAtIonS APPly to PArtIcIPAtIng PrIVAtE SchoolS?
Our primary objective is to understand the extent to which regulations explain why school participation rates are higher in some programs than others. In this section we describe the universe of regulations that ap-ply to private schools in voucher and tax credit schol-arship programs. These regulations can be categorized into the ten domains shown in Figure 3. We use this framework to develop a measure of “regulatory burden” based on the number of requirements in each of the ten domains.
Domain 1: Eligibility requirementsEligibility requirements refer to the initial criteria that dictate which schools are eligible to apply for the pro-gram. Accreditation is the most significant of these re-quirements. Six of the thirteen programs require par-ticipating schools to be accredited (see Table 3).23 Four programs—the two Ohio programs (state accreditation is referred to as “chartering” in Ohio), Iowa’s tax credit scholarship program, and Indiana’s statewide voucher program—require schools to earn accreditation (char-tering) prior to participating. In Milwaukee, schools must be “pre-accredited” by an independent review board before they can participate and must then earn full accreditation within their first three-and-a-half years of participating.24 Similarly, Georgia allows non-accredited schools to participate as long as the accredita-tion process is underway when they first enroll.
The two Ohio voucher programs and Iowa’s tax credit scholarship program require schools to earn accredita-tion (chartering) through the state. Iowa is unique in-somuch as it requires all private schools in the state to obtain state accreditation, so this hurdle is not specific to participants in the scholarship program.25 Indiana’s
Figure 3. Ten domains of private-school regulation in voucher programs and tax credit scholarship programs
1. Eligibility Requirements
2. Application Requirements
9. Oversight & Endorsement
3. Curricular Requirements
8. Paperwork & Reporting
4. Licensure & Credentialing
7. Tuition & Fees
Restricitons
5. Financial Disclosure &
Reporting
6. Student Admissions Guidelines
Private School
regulation
10. Testing & Accountability

14School Choice Regulations: Red Tape or Red Herring? Part II: Descriptive Analysis
voucher program accepts accreditation from the state board or a state-approved national or regional accredit-ing body. Schools in Milwaukee and Georgia must earn accreditation from an independent regional or national accreditation agency.
In some states, accreditation provides an important stamp of legitimacy and enables private schools to tap into certain public school resources, such as busing or auxiliary provisions like textbooks, computer software, and therapists.26 Accessing such benefits requires private schools to comply with regulations that are not expect-ed of non-accredited schools, even if they do not par-ticipate in school-choice programs. For example, private schools seeking accreditation in Indiana and Ohio face additional testing requirements. Accredited Indiana schools are required to administer Indiana’s state stan-dardized test, the ISTEP+, while Ohio’s chartered pri-vate schools must administer the Ohio Graduation Test.
Domain 2: Application requirementsApplication requirements refer to the various require-ments imposed on schools that are eligible to enroll in the program. These include application forms and fees, along with proofs of insurance and financial viability. Like eligibility requirements, application procedures
are another form of “entry control,” in that they screen schools out on the front end.
Domain 3: Curricular requirementsCertain choice programs require participating schools to adopt specific curriculum standards or provide in-struction in particular subjects. These requirements range from providing instruction in core academic subjects to mandatory drug and alcohol–awareness courses.
Domain 4: Licensure and credentialingThis category includes regulations pertaining to staff credentialing or certification. Some programs do not require any certification, while others require either a bachelor’s degree or full certification for teachers and administrators.
Domain 5: Financial disclosure and reportingThese regulations include any requirements for par-ticipating schools to disclose financial information. Possible regulations include mandatory financial au-dits, submission of financial reports, and disclosure of both public and non-public fund expenditures.
Table 3. Voucher programs and tax credit scholarship programs that require private schools to be accredited in order to participate
ProgrAmrEquIrEmEnt For
PArtIcIPAtIonAccrEdItIng AgEncIES
tImE rEquIrEd to comPlEtE AccrEdItAtIon ProcESS
Cleveland Scholarship and Tutoring Program
Chartered (by state) at time of participation
State Agency 1 to 3 years
Georgia Tax Credit Scholarship Program
Accredited or in the process at time of participation
State-approved Agency Differs by agency
Indiana Choice Scholarship Program
Accredited at time of participationState Agency or State-approved Agency
Process can possibly be “fast-tracked” to be completed over summer.
Iowa Tax Credit ProgramAll private schools in Iowa must be state accredited.
State Agency 1 to 2 years
Ohio EdChoice Scholarship Program
Chartered at time of participation State Agency At least 2 years
Milwaukee Parental Choice Program
Pre-accreditation required at time of participation, accreditation within 3 ½ years
State-approved Agency Differs by agency
Source: Program-regulation information collected from state departments of education (2011–12).
Note: This data is based on requirements for participation in 2011–12. The program offices of the Cleveland Scholarship and Tutoring Program and the Ohio EdChoice Scholarship Program refer to Table 2’s “accreditation” as “chartering.”

15School Choice Regulations: Red Tape or Red Herring? Part II: Descriptive Analysis
Domain 6: Student-admission guidelinesStudent-admission guidelines include student-eligibil-ity requirements (i.e., any means-testing or “failing-schools” requirements) and any regulation of schools’ admissions policies or procedures.
Domain 7: Tuition and fees restrictionsThis category includes any restrictions on either the scholarship amount or a participating school’s charged tuition and fees. Rhode Island’s Corporate Scholarship Tax Credit program has the fewest tuition and fees re-strictions and is the only choice program with no cap on the maximum scholarship amount.
Domain 8: Paperwork and reportingPaperwork and reporting regulations include any re-quirements that schools process, maintain, and submit records to the state.
Domain 9: Oversight and enforcementThese regulations consist of any measures taken by the program office to oversee and enforce compliance with program regulations. Oversight measures imposed on private schools participating in tax credit scholarship programs are limited, because such oversight is directed primarily toward SGOs.
Domain 10: Testing and accountability requirementsTesting and accountability requirements refer to the ways in which programs monitor the academic results of participating schools and students and subsequently report those results to the public. The thirteen private school–choice programs included in our study dis-played a range of testing and accountability measures (see Figure 4). Five, all tax credit scholarship programs, do not require schools to conduct any form of test-ing. Of the eight programs that do require testing, five require schools to administer the regular state assess-ments, while the other three give participating private schools the option to use a norm-referenced test. The Indiana Choice Scholarship Program has arguably the most stringent testing and accountability measures of all thirteen, and it is one of two programs with an an-nual performance-accountability rating system in place for participating schools (Louisiana’s voucher program is the other).27
❖ whIch ProgrAmS hAVE thE moSt And lEASt rEgulAtIonS?
Before we can answer this question, we must briefly de-scribe how we measured the amount of “regulatory bur-den” on schools in the thirteen programs. This measure is based on the number of requirements that apply to
Figure 4. Testing and accountability requirements of voucher programs and tax credit scholarship programs
A. Administer some form of standardized test in at least 1 gradeB. Administer the state standardized testC. Administer test to voucher students in all tested gradesD. Administer test to non-voucher studentsE. Report annual test scores to state
F. Provide parents with test scores G. State reports test results at program levelH. State reports test results of participating private schoolsI. State releases test results for student subgroupsJ. School receives accountability rating/grade from state
IN Voucher A B C D E F G H J
OH Voucher A B C E F G H I
Cleveland Voucher A B C E F G H I
Milwaukee Voucher A B C E F G H
LA Voucher A B C E G H J
D.C. Voucher A E C F G
FL Tax Credit A E F G
AZ Corp Tax Credit A E
The following programs have no testing and accountaibility requirements: AZ Ind Tax Credit, GA Tax Credit, IA Tax Credit, PA Tax Credit, and RI Tax Credit
Source: The program-regulation information was collected from state departments of education.
Note: Figure 4 shows select testing and accountability requirements for the thirteen choice programs included in study. Each lettered red bar corresponds to one of ten testing and accountability requirements.
Greatest Requirements
Fewest Requirements
16School Choice Regulations: Red Tape or Red Herring? Part II: Descriptive Analysis
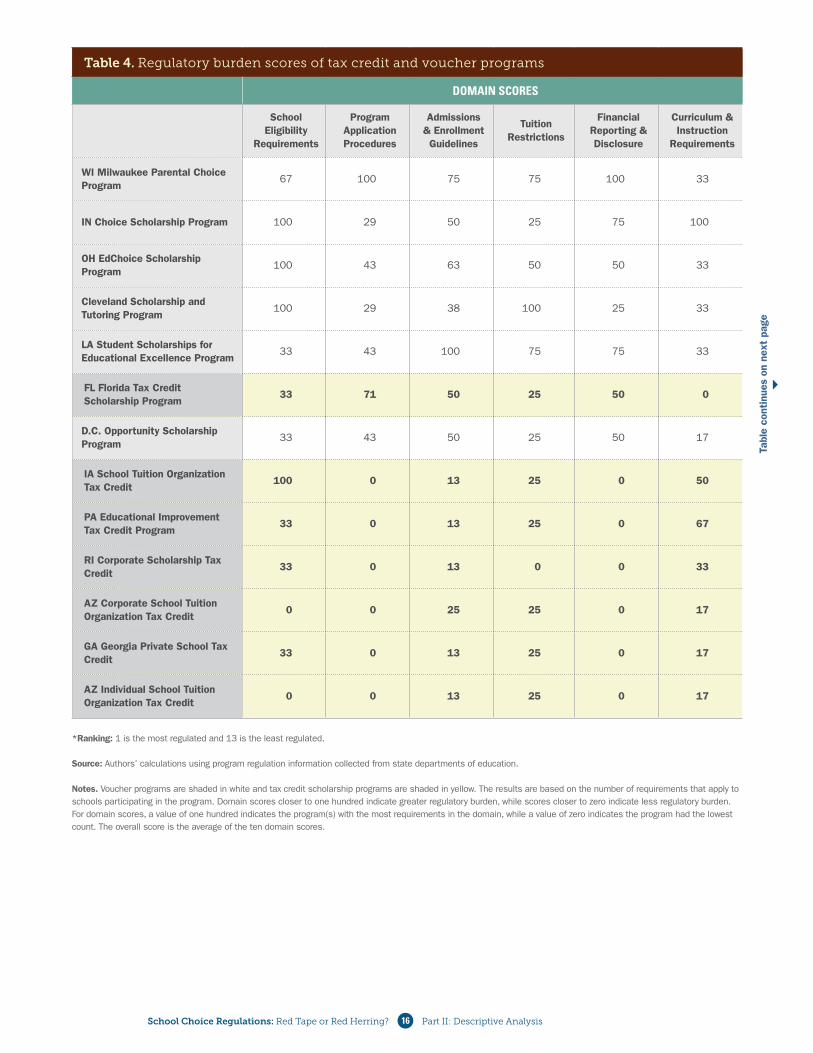
Table 4. Regulatory burden scores of tax credit and voucher programs
domAIn ScorES
School Eligibility
Requirements
Program Application Procedures
Admissions & Enrollment Guidelines
Tuition Restrictions
Financial Reporting & Disclosure
Curriculum & Instruction
Requirements
WI Milwaukee Parental Choice Program
67 100 75 75 100 33
IN Choice Scholarship Program 100 29 50 25 75 100
OH EdChoice Scholarship Program
100 43 63 50 50 33
Cleveland Scholarship and Tutoring Program
100 29 38 100 25 33
LA Student Scholarships for Educational Excellence Program
33 43 100 75 75 33
FL Florida Tax Credit Scholarship Program
33 71 50 25 50 0
D.C. Opportunity Scholarship Program
33 43 50 25 50 17
IA School Tuition Organization Tax Credit
100 0 13 25 0 50
PA Educational Improvement Tax Credit Program
33 0 13 25 0 67
RI Corporate Scholarship Tax Credit
33 0 13 0 0 33
AZ Corporate School Tuition Organization Tax Credit
0 0 25 25 0 17
GA Georgia Private School Tax Credit
33 0 13 25 0 17
AZ Individual School Tuition Organization Tax Credit
0 0 13 25 0 17
*Ranking: 1 is the most regulated and 13 is the least regulated.
Source: Authors’ calculations using program regulation information collected from state departments of education.
Notes. Voucher programs are shaded in white and tax credit scholarship programs are shaded in yellow. The results are based on the number of requirements that apply to schools participating in the program. Domain scores closer to one hundred indicate greater regulatory burden, while scores closer to zero indicate less regulatory burden. For domain scores, a value of one hundred indicates the program(s) with the most requirements in the domain, while a value of zero indicates the program had the lowest count. The overall score is the average of the ten domain scores.
Tabl
e co
ntin
ues
on n
ext
page
4

17School Choice Regulations: Red Tape or Red Herring? Part II: Descriptive Analysis
Table 4. Regulatory burden scores of tax credit and voucher programs (cont'd)
domAIn ScorES
Paperwork & Reporting
Certification & Licensure
Requirements
Testing & Accountability Requirements
Oversight & Enforcement
Overall Score Ranking*
WI Milwaukee Parental Choice Program
100 40 92 75 76 1
IN Choice Scholarship Program 83 100 100 25 69 2
OH EdChoice Scholarship Program
67 80 92 100 68 3
Cleveland Scholarship and Tutoring Program
67 80 92 100 66 4
LA Student Scholarships for Educational Excellence Program
67 20 92 25 56 5
FL Florida Tax Credit Scholarship Program
67 40 50 100 49 6
D.C. Opportunity Scholarship Program
50 20 50 25 36 7
IA School Tuition Organization Tax Credit
50 60 25 25 35 8
PA Educational Improvement Tax Credit Program
33 20 0 0 19 9
RI Corporate Scholarship Tax Credit
42 40 0 0 16 10
AZ Corporate School Tuition Organization Tax Credit
25 20 33 0 15 11
GA Georgia Private School Tax Credit
25 0 8 0 12 12
AZ Individual School Tuition Organization Tax Credit
25 0 0 0 8 13
Table continued from previous page
4

18School Choice regulations: Red Tape or Red Herring? Part II: Descriptive Analysis
schools within each of the ten domains. Constructing it required four basic steps. First, we reviewed the state statutes and operating guidelines of all thirteen choice programs and came up with an exhaustive checklist of seventy-one requirements that apply to schools in one or more of them (see Appendix). Second, we organized the requirements into the ten domains discussed earlier. Th ird, we counted the number of requirements that ap-plied to each program within each domain and assigned scores between zero and one hundred in each domain such that the program with the most requirements in the domain received a score of one hundred, the pro-gram with the least requirements a score of zero, and the rest fell somewhere in between.28 Finally, we determined the overall regulatory burden score for each program by taking the average of their ten domain scores.29
Th is measure is more objective and reliable than the letter grades and rankings that are typically used to judge school-choice programs, but it is not without fl aws.30 One notable limitation is that it only accounts for the number of requirements listed in offi cial docu-ments, while a complete measure of regulatory burden would also factor in the time and money necessary to comply with the regulations (i.e., the burdensomeness of a given requirement). We cannot quantify these two aspects, so the validity of our measure rests on the as-sumption that programs with more regulation on paper will actually require more time and money on the part of schools. Research from other industries suggests that this is a reasonable assumption.31
Figure 5. Regulatory burden scores and private school participation rates of voucher programs and tax credit scholarship programs
100%
90%
80%
70%
60%
50%
40%
30%
20%
10%
0%
0 10 20 30 40 50 60 70 80 90 100
62%
53%
PrEd
IctE
d P
Art
IcIP
AtIo
n r
AtE
AZ Ind 90%
PA 65%
RI 59%AZ Crp 50%
GA 47%
IA 64% FL - 62%
D.C. 76%
Cleveland 82%
Milwaukee 58%
LA 33%
OH 42%
IN 48%
rEgulAtory burdEn ScorE (least to most regulated)
9% decrease in participation when regulatory burden rises from 10 to 75.
Source: Authors’ calculations using data from the 2009–10 PSS and program-regulation information collected from state departments of education.
Notes: Figure 5 plots the predicted participation rates of the thirteen programs against their regulatory burden scores. For example, the Milwaukee voucher program is shown at the intersection of its regulatory burden score of seventy-six and its adjusted participation rate of 58 percent. Green dots indicate tuition tax credit programs, grey dots indicate voucher programs. The predicted participation rates shown in Figure 5 are average predicted probabilities (fi xed plus random components) obtained from a random effects logit model (see Appendix for details). Sample restricted to schools observed in 2009-10 PSS data, excluding schools identifi ed by the PSS as special education schools, early childhood programs, or Amish schools. Unweighted sample includes 5,863 schools.
4

19School Choice Regulations: Red Tape or Red Herring? Part II: Descriptive Analysis
Programs' regulatory-burden scores are shown in Ta-ble 4, ranked from most to least regulated. What is im-mediately clear from Table 4 is that voucher programs place many more requirements on schools than do tax credit scholarship programs, pointing to a real differ-ence between funding private school attendance via a non-government SGO rather than the state treasury.32 With the exception of Florida’s Tax Credit Scholar-ship Program, which has similar requirements to those of the state’s special-needs voucher program, the tax credit scholarship programs all have lower regulatory-burden scores than the voucher programs. 33
Most-regulated programsThe Milwaukee Parental Choice Program (MPCP), the nation’s first voucher program, scored highest in regula-tory burden. In addition to extensive compliance and financial reporting procedures, MPCP is set apart from the rest by two prominent requirements. First, it is the only one that regulates religious activities; participating schools must allow voucher recipients the opportunity to “opt out” of religious activities, a provision that was adopted when MPCP lifted its ban on religious-school participation in 1998.34 Second, it requires schools to adopt open-enrollment policies, thereby preventing private schools from applying their preexisting admis-sions criteria to voucher students.
The Indiana Choice Scholarship Program ranked second in regulatory burden. It has the most requirements in four of the ten domains: school eligibility, certification and licensure, curriculum and instruction, and testing and accountability. Private schools in the Indiana Choice Scholarship Program receive annual performance grades. Additionally, Indiana’s curriculum and instruction re-quirements, which include implementation of the state-wide elementary-level reading curriculum, are the most extensive of the thirteen programs.
Right behind Indiana’s voucher program are the two Ohio voucher programs: the statewide EdChoice Scholarship Program and the Cleveland Scholarship and Tutoring Program. Both programs are heavy on front- and back-end requirements. To be eligible for participation, schools must complete the state’s multi-year chartering process and adopt the same op-erating standards that are used for public schools.35
Both programs require schools to administer the state assessments if they serve students in tested grades.36
They also have strong oversight measures, including a designated compliance staff with authority to conduct unannounced site visits.
Least-regulated programsArizona’s Individual Tax Credit Scholarship Program, the country’s first such program, scored lowest on our measure of regulatory burden. This program does not require participating schools to do anything beyond what is required of all private schools operating in the state. Participating schools do not have to test students or disclose financial data to the state. Further, the pro-gram does not restrict access via means-testing or other student-eligibility criteria, so SGOs have full control over whom they award scholarships to.37
Georgia’s Tax Credit Scholarship for Private Schools places second. This program also does not require stan-dardized testing and makes it explicitly illegal to public-ly disclose information about schools beyond the total number and total dollar amount of tax credits used.38
Georgia’s and Arizona’s programs are the only two non–special needs programs that do not restrict students’ eligibility based on means-testing or whether they are currently enrolled in failing schools.39
❖ do ProgrAmS wIth morE rEgulAtIonS hAVE lowEr School-PArtIcIPAtIon rAtES?
At this point, we have established there are large differences in regulatory burden across the thirteen programs. We have also shown that the programs have a wide range of participation rates. Now we return to the primary objective of the study and ex-amine the extent to which more stringent regula-tion is linked to lower participation. Using the PSS dataset described earlier, we test the hypothesis that schools will be significantly less likely to participate in programs with high regulatory burden scores.
We test this hypothesis by examining the correlation be-tween programs’ regulatory burden scores and partici-pation rates. The research literature points to a variety of factors other than regulatory burden that may explain differences in participation rates across programs. These include differences in private school characteristics (e.g., religious orientation, program focus, grade configura-tion, ethnic diversity), the amount of excess capacity available to enroll additional students (e.g., number of open seats, student-teacher ratio, and enrollment size), the level of demand from eligible families (e.g., poverty rates, enrollment in neighboring public schools, high school graduation rates, per-pupil expenditures of lo-cal school districts, and the number of adherents to the school’s religion in the county), and differences in the

20School Choice Regulations: Red Tape or Red Herring? Part II: Descriptive Analysis
amounts of subsidy available to students via the voucher or tax credit scholarship programs (e.g., the number of scholarships available, average scholarship amounts). We use a statistical technique called logistic regression to control for the influence of these extraneous factors on participation rates. This allows us to “predict” the participation rates that would occur if the programs and their school populations were similar on all these factors (see Appendix for more details).
Our results point to a moderate negative relationship between regulatory burden and private school partici-pation. Figure 5 (page 18) illustrates this relationship by plotting the thirteen programs’ predicted participa-tion rates against their regulatory burden scores. For ex-ample, the Milwaukee voucher program is shown at the intersection of its regulatory burden score of seventy-six and its predicted participation rate of 58 percent. The red trend line running through Figure 5 displays the average predicted participation rate at increasing levels of regulatory burden. To gauge the impact of regulatory burden we can compare the average predicted participa-tion rates at low and high levels of regulatory burden. Following the red trend line in Figure 5, we see that a shift from a low regulatory burden score of ten to a high regulatory burden score of seventy-five associates with a decrease in participation rates from 62 percent to 53 percent. This implies that moving from very low regula-tion (think Arizona’s Individual Tax Credit Scholarship program) to very high regulation (think Milwaukee’s voucher program), would lead to a 9 percentage point drop in participation.
❖ ArE SomE tyPES oF PrIVAtE SchoolS morE SEnSItIVE to rEgulAtIon thAn othErS?
Next, we will consider whether some types of private schools are more sensitive to regulatory burden than oth-ers. By their nature, some schools may be more or less in-clined to participate, regardless of regulatory burden. To investigate these issues we compare predicted participa-tion rates of schools with different religious orientations.
In addition to presenting their predicted participation rates under average regulation, we report their odds of participation in programs with low and high regulations. A “low” regulated program would have regulations simi-lar to Arizona’s individual tax credit program or Georgia’s tax credit program, while a program with “high” regu-lations would be similar to Milwaukee. If certain types of private schools are more deterred by regulations, we
would expect a larger gap between their participation in low- and high-regulated programs. The results of the simulation are displayed in Figure 6. In addition to the participation rates, we provide the weighted number of schools and the share of private school enrollment for each school type.
The findings in Figure 6 indicate that some segments of the private school market are indeed more likely to participate in school-choice programs than others. Moreover, some appear more sensitive to regulation than others.
Catholic schools are significantly more likely to par-ticipate in school-choice programs than are the other five private school segments. The predicted participa-tion rates of Catholic schools are 19 percentage points above the average of all schools in the data set (76 per-cent versus 57 percent). They also appear to be less de-terred by regulations: Their predicted participation rates exceed 70 percent, even in programs with high regula-tions. These findings should bring some relief to those concerned that too much regulation will drive schools away and cause a shortage in seats for voucher students. Catholic schools, which account for almost 40 percent of private school enrollments nationally (51 percent in our data set), appear to be a highly dependable supplier of seats to voucher students.
What accounts for this? The most obvious answer is self-preservation. Catholic-school enrollment has been declining for almost fifty years, with one in five Catholic schools closing its doors over the last decade.40 Vouch-ers provide an opportunity to replenish lost enrollment and, in some cases, stave off closure.41 Another explana-tion could be that voucher programs are well-aligned with the Catholic church’s mission to serve the poor.42 Consequently, Catholic schools are strongly encouraged to participate by their diocesan leaders. On the other hand, it could also be that Catholic schools are simply in greater demand from eligible families because their tuition rates are reasonable and they have a heavy pres-ence in urban areas.
Non-sectarian schools are significantly less likely to par-ticipate in private school–choice programs than their re-ligious counterparts, and they appear more deterred by heavy regulation. We see in Figure 6 that when regula-tions shift from low to high, non-sectarian participation drops 15 percentage points from 54 to 39 percent, com-pared to an average decline of 9 percentage points (62 to 53). One reason these schools may be less inclined to participate, particularly in programs with heavy regu-

21School Choice regulations: Red Tape or Red Herring? Part II: Descriptive Analysis
lation, is that they have fewer open seats. Enrollment in non-sectarian private schools has grown faster in the past decade than it has in other private school seg-ments, in part because they have proven less vulnerable to charter school expansion.43 Restrictions on tuition and fees may also play a role. Th e average tuition rate of non-sectarian private schools is roughly three times higher than those of either Catholic or other religious schools.44 Th is would explain why non-sectarian schools avoid heavily regulated programs that restrict their abil-ity to charge families more than the set voucher (schol-arship amount). And again it could be a function of demand. Low-income minority families, who comprise the majority of eligible voucher (scholarship) recipients in many programs, tend to be more religious and there-fore may gravitate to religious schools.45
Among non-sectarian schools, those designated as “spe-cial program” are least likely to participate. Th eir pre-dicted participation rate of 36 percent is half that of Catholic schools. In programs with high regulations, their chances of participating drop to 30 percent. Th e majority of this segment consists of Montessori schools. Schools that embrace the Montessori philosophy—which emphasizes individualized, self-paced, explor-atory learning—do not look favorably on standardized testing, which might explain why they shy away from school-choice programs.46Another reason these schools are less likely to participate is that they tend to be small-er, which means they have less space and administrative capacity to handle the paperwork associated with par-ticipation. Our analysis found that the odds of a school with fewer than fi fty students participating were close to half those of other schools.
Catholic Schools(1,997 schools)
Conservative Christian
(1,196 schools)
Other Religious, affi liated with denomination(612 schools)
Other religious, not affi liated with
denomination(1,416 schools)
Nonsectarian regular
(622 schools)
Nonsectarian special program(749 schools)
Source: Authors’ calculations using data from the 2009–10 PSS and program regulation information collected from state departments of education.
Notes: Figure 6 reports the total number of schools (using weights) and enrollment in our sample of schools on thirteen programs. The predicted participation rates shown in Figure 6 are the average predicted probabilities for each school segment under different specifi cations on the value of the regulatory burden measure (Low Regulation = 10, Average = 45, High Regulation = 75). These are derived from a random effects logit model (see Appendix for details). Schools’ predicted probabilities are obtained for each level of regulatory burden holding all other independent variables at their means and averaging over the random effects. Sample restricted to schools observed in 2009–10 PSS data, excluding schools identifi ed by the PSS as special education schools, early childhood programs, or Amish schools. Unweighted sample includes 5,863 schools.
Figure 6. Predicted participation rates by school religious orientation and regulation level
High Regulation Average Regulation Low Regulation
72%76%
80%
53% 56%
64%
48%54%
61%
37%45%
54%
39%45%
54%
30%36%
41%
All Schools
53%57%
62%
xx% Share of Private School Enrollment
50.6% 13.8%
8.4% 12.5%11.5% 3.2%

22School Choice Regulations: Red Tape or Red Herring? Part III: Survey Results
ParT iii: SurvEy rESulTS
❖ About thE SurVEy
In this section, we will present findings from a survey of private schools in Cleveland, Cincinnati, Dayton, In-dianapolis, and Milwaukee. The survey was designed to gather information on private schools’ reasons for par-ticipating or not participating in one of the four voucher programs that operate in these five cities: The Milwaukee Parental Choice Program (Milwaukee), the Cleveland Scholarship and Tutoring Program (Cleveland), Ohio’s Ed Choice Program (Cincinnati and Dayton), and Indi-ana’s Choice Scholarship program (Indianapolis).47
Table 5 provides information about our survey sam-ple, including the number of participating and non-participating schools that were surveyed across the five cities, as well as response rates.48 The survey was administered in the spring of 2012 to 369 private schools. Surveys were addressed to school princi-pals. Overall, 241 schools (65 percent) responded to the survey, including 73 percent of participating schools (n=179) and 50 percent of non-participat-ing schools (n=62).
Table 5. Survey sample and response rate
VouchEr ProgrAm no. oF SchoolS SurVEyEd no. oF rESPondEntS SurVEy rESPonSE rAtE
EdChoice Scholarship Program (Cincinnati and Dayton)
Participating Schools 66 52 79%
Non-Participating Schools 57 29 51%
Total Schools 123 81 66%
Milwaukee Parental Choice Program (Milwaukee)
Participating Schools 99 69 70%
Non-Participating Schools 22 12 55%
Total Schools 121 81 67%
Indiana Choice Scholarship Program (Indianapolis)
Participating Schools 46 34 74%
Non-Participating Schools 39 19 49%
Total Schools 85 53 62%
Cleveland Scholarship and Tutoring Program (Cleveland)
Participating Schools 34 24 71%
Non-Participating Schools 6 2 33%
Total Schools 40 26 65%
All Programs
Participating Schools 245 179 73%
Non-Participating Schools 124 62 50%
Total Schools 369 241 65%
Source: Program-participation data collected from state departments of education.
Note: Table 5 shows the survey sample and survey response rates by program and participation status.

23School Choice Regulations: Red Tape or Red Herring? Part III: Survey Results
❖ who InFluEncES thE dEcISIon to PArtIcIPAtE?
Before delving into what influenced the decision, we examine who influenced the decision. Respondents were asked to gauge the level of influence of eight constituencies on their decisions shown in Figure 7. We see that school leaders (principals and school boards) have the greatest influence over whether or not to participate. Participating schools reported higher levels of influence for all eight constituencies, which stems from the fact that many non-partici-pants were not aware of the program or did not see any demand from eligible voucher families, making their stakeholders’ perspectives unimportant.
❖ whAt rEASonS do SchoolS gIVE For not PArtIcIPAtIng In VouchEr ProgrAmS?
To identify the top reasons for non-participation, we asked non-participating schools to review a list of pos-sible reasons why they might choose not to participate in a voucher program and to check all that apply. We then asked them to rank their top three reasons for not participating. Their responses, shown in Figure 8, convey a sense of the importance of regulations, as compared to other considerations. The figure contains three bar charts: the first shows the percentage of respondents who indi-cated that the reason was applicable to their decision; the second shows the percentage indicating the reason was one of their top three reasons, and the third shows the percentage who indicate that the reason was their most important reason.
Figure 7. Percent of respondents indicating group or individual had a moderate or major influence on school’s decision to participate
73%
92%
Head of School or Principal
School Board
Diocese or sponsoring organization
Teachers Parents of Enrolled Students
Students Local Community Members
Alumni
54%
69%
15%
62%
22%
50%
24%
50%
12%
40%
10%
35%
4%
19%
Non-Participants Participants
Source: Survey results.
Note: Results in Figure 7 based on responses from 241 private schools (179 participants, 62 non-participants). Figure 7 reports percentage of respondents who indicated that constituency had either a “moderate influence” or “major influence” on their decision. Survey Question: How much influence did each group or individual have on your school’s decision to participate in the voucher program? Respondents were asked to select one of the following responses: “No influence,” “Minor Influence,” “Moderate Influence,” “Major Influence,” “Not Sure.”
How much influence did each group or individual have on your school’s decision to participate (or not) in the voucher program?

24School Choice regulations: Red Tape or Red Herring? Part III: Survey Results
Th e most-cited reason for non-participation was a lack of student demand. Close to one-third of non-partici-pants indicated that there were “not enough voucher-eligible families interested in attending” their school. Almost one-fi fth cited low demand as the single most important reason for not participating.
Twenty-seven percent of non-participating schools indicate that “unwillingness to comply with program regulations” was a reason for not participating, making it the third most frequently cited reason, after a lack of voucher-eligible families and “other” reasons (see Fig-ure 8’s note for more information on what “other rea-sons” entails). All of the schools that cited regulations as a reason ranked it among their top three, but only 3
percent (two schools) ranked it the single most impor-tant reason for not participating. Program regulations appear to be an important contributing factor to non-participation but are rarely the single most-important factor.
Twenty-four percent of non-participating schools felt that the choice program was not a good fi t for their school’s mission, with nearly all of these schools (21 percent) considering it one of their top three reasons. Overall, 23 percent of non-participating schools felt that program participation would hurt their school fi nances. Few schools (16 percent) indicated that ca-pacity limits were at the heart of their decision to not participate.
Source: Survey results.
Note: The results in Figure 8 are based on responses from sixty-two non-participants. Figure 8 presents three bar charts. The fi rst reports the percentage of respondents indicating “Yes,” the reason did apply to their school’s decision not to participate. The second bar chart reports the percentage of respondents who listed the reason as one of their top three for not participating. The third bar chart reports the percentage of respondents who listed the reason as the single most important for not participating. Participants who indicated “Other” were asked to provide a brief written description of their reason. Two common reasons provided were (1) they were not fully informed on program regulations and (2) the public schools in their area were high performing. The survey question was, “Below are some reasons why schools might not participate in voucher programs. Which of following apply to your school?”
Figure 8. Reasons private schools give for not participating in voucher programs
Not enough voucher-eligible families
Other
Not willing to comply with program regulations
Not a good fi t for school culture and mission
Concerned it would weaken school's fi nancial situation
Concerned it would lower academic standards
Not eligible because of accreditaion status
Desire to maintain freedom to teach and express religious beliefs
Not enough capacity to enroll more students
Not aware program existed
31%
% citing as a reason for not participating
% citing as one of the top 3 reasons for not participating
% citing as single most important reason for not participating
5%
32%
29%
27%27%27%27%
24%
23%
19%
19%
18%
16%
13%
31%
21%
27%27%27%
21%
18%
9%
18%
11%
16%
10%
19%
15%
10%
8%
9%
8%
10%
3%
3%
27%

25School Choice Regulations: Red Tape or Red Herring? Part III: Survey Results
Meanwhile, 13 percent of non-participating schools in-dicated that they had never heard of their local voucher program. Though this was the least-cited reason, it sug-gests that there is more work to be done in choice pro-gram outreach and awareness efforts.
❖ whAt rEASonS do SchoolS gIVE For PArtIcIPAtIng In VouchEr ProgrAmS?
Using the same protocol, we asked participating schools about their reasons for joining voucher pro-grams (Figure 9). The top three reasons that schools cited for participating were expanding the school’s mission to a larger community (87 percent), help-ing families already at their school who qualified for the voucher (75 percent), and helping needy chil-dren (72 percent). Observe that all three revolve around a central theme of serving the community.
Half of the participating schools indicated that strengthening the school’s financial situation was a reason for participation, with 18 percent citing this as their most important reason. Other items that led schools to participate were driven by existing financial issues, such as filling open seats (33 percent) or pre-venting school closure or consolidation (14 percent)— both of which were among the least cited reasons.
❖ whIch rEgulAtIonS ArE moSt ImPortAnt to SchoolS’ PArtIcIPAtIon dEcISIonS?
In addition to asking schools to identify their top rea-sons for participating or not participating in voucher programs, we asked them to rate the importance of spe-cific program requirements in their decisions (Figure 10).49 These responses allow us to ascertain the types of regulations that are most worrisome to private schools.
% citing as one of the top 3 reasons for participating
% citing as single most important reason for participating
Source: Survey results.
Note: The results in Figure 9 were based on responses from 179 participants. The first bar chart reports the percentage of respondents who indicated “Yes,” the reason did apply to their school’s decision to participate. The second bar chart reports the percentage who listed the specified reason as one of their top three for participating. The third bar chart reports the percentage who listed the reason as their single most important for participating. The survey question was, “Below are some reasons why schools might participate in voucher programs. Which of following apply to your school?”
Figure 9. Reasons private schools give for participating in voucher programs
Expand mission to larger community
Help existing families who qualified for the voucher
Help needy children in the community
A lot of eligible families interested in attending school
Strengthen school's financial situation
Bring back former families who no longer could afford tuition
Fill open seats in some of our classes
Prevent school from being closed or condolidated
Other
53%
% citing as a reason for participating
87%
75%
72%
50%
34%
33%
14%
5%
35%
28%
37%
12%
30%
10%
9%
4%
0%
20%
14%
25%
2%
18%
5%
5%
2%
0%

26School Choice Regulations: Red Tape or Red Herring? Part III: Survey Results
Source: Survey results.
Note: The results in Figure 10 are based on responses from 241 private schools (179 participants and 62 non-participants). Figure 10 reports the percentage of respondents who indicate that each factor was either “very important” or “extremely important” to their decision. Separate figures are presented for all private schools (n=241), participants (n=179), and non-participants (n=62). The survey question was, “Below are some specific factors that might influence a school’s decision to participate in a voucher program. To what extent were these factors important when your school was deciding whether or not to participate?”
Figure 10. Importance of different program requirements to schools’ decisions regarding participation in voucher programs
Upholding student admissions criteria
Allowing students to opt out of religious activities
Amount of paperwork required
The maximum dollar amount of a voucher
Adopting an open-enrollment policy for voucher participants
Limits on charging additional tuition or fees
Requirement to participate in state testing
Teacher credential/certification requirements
Teaching certain state curriculum standards
Administrator credential/certification requirements
Public reporting of schools' state test results
Providing minimum number of instrucitonal hours
Conducting teacher performance evaluations
Financial audit and financial disclosure requirements
Percent of schools indicating factor was “Very Important” or “Extremely Important” to their participation decision
52%
50%
42%
40%
31%
25%
25%
25%
24%
22%
17%
16%
16%
14%
54%
48%
36%
43%
22%
22%
21%
28%
23%
24%
15%
17%
17%
14%
48%
57%
58%
31%
58%
36%
37%
18%
24%
15%
21%
13%
15%
15%
ALL SCHOOLS PARTICIPANTS NON-PARTICIPANTS

27School Choice Regulations: Red Tape or Red Herring? Part III: Survey Results
The survey data reveal that, of all types of regulations, schools are most sensitive to those that impose restric-tions on their student admissions procedures. More than half of all respondents (54 percent of participants and 48 percent of non-participants) indicated “up-holding student admissions criteria” was either a “very important” or “extremely important” factor in their re-spective decisions, ranking it the highest among the re-
quirements listed in the survey. Furthermore, nearly six out of ten non-participants (58 percent) rated “adopt-ing an open-enrollment policy” as a “very important” or “extremely important” factor in their decision.
Also important to private schools in determining whether or not to participate was the requirement to allow students to opt out of religious activities. This
Source: Survey results.
Note: The results in Figure 11 were based on responses from 241 private schools (179 participants and sixty-two non-participants). Figure 11 reports the percentage of participants and non-participants indicating that the information was considered in the admissions process. “Legacy Status” refers to whether or not the student has family members currently or previously enrolled in the school. The survey question was, “What information does your school consider in the admissions process?”
Figure 11. Information used by participating and non-participating schools in their student admissions process
Interview with students or parents
Prior academic record
Special needs status
Standardized achievement test scores
Recommendations
Admission test results
Special aptitudes/skills
Church membership or religious affiliation
Legacy Status
None
Other
69%
Percentage of private schools that consider information in student admission process
63%
63%
64%
61%
55%
35%
46%
37%
37%
37%
35%
32%
25%
34%
21%
26%
26%
8%
21%
10%
9%
Non-Participants
Participants

28School Choice Regulations: Red Tape or Red Herring? Part III: Survey Results
was noted by 57 percent of non-participants and 48 percent of participants. Yet it is peculiar, considering only one of the four programs (Milwaukee’s) has such a requirement. This result may indicate respondents’ unfamiliarity with program requirements, but it may also hint at how sensitive religious schools are to re-strictions on their religious identity.
The amount of paperwork required was rated the third most influential factor among all schools, and the top factor among non-participants. A full 58 percent of non-participants and 36 percent of participants indicated that it was very or extremely important to them. The increase in paperwork that results from program participation can be significant, particularly for smaller schools with few administrators. Complaints about paperwork burden were pervasive in the open-ended comments provided by participating schools.
One in four respondents indicated that participation in state testing was very or extremely important. This requirement factored more heavily into the decisions of non-participants (37 percent) than those of participants (21 percent). Indiana and Ohio, however, both require private schools to administer state standardized tests as a condition of state accreditation (chartering), so testing was already the norm for many participating schools.
The survey data suggest private schools are less con-cerned about the accountability aspect of state testing than they are about the burden of actually administer-ing the tests. For instance, among non-participants, 37 percent rated the “requirement to participate in state testing” as very or extremely important, whereas 21 per-cent indicated the same for “public reporting of school’s state test results”. The open-ended comments back up the claim that accountability is a major concern. Many respondents expressed frustration that they have to ad-minister the state tests in addition to the norm-refer-enced tests required by their diocese or governing body, or they voiced concern that standardized testing was incongruent with their school’s educational philosophy. However, none of the respondents commented on the publication of their test results or other aspects related to accountability.
Teacher and administrator credentials, minimum in-structional hours, and disclosing school finances were among the least important factors for both participants and non-participants. Many participating schools com-mented that they complied with these regulations long before they signed up for the voucher program, in part because they are required to for state accreditation.
❖ ArE non-PArtIcIPAtIng SchoolS morE SElEctIVE?
As noted above, private schools aim to safeguard their admissions procedures. To learn more about such pro-cedures in private schools, we asked participants and non-participants about the type of information they use to screen potential students (see Figure 11). Both tended to rely on similar information—most com-monly parent interviews, prior academic records, and special-needs statuses. Twenty-one percent of voucher participants indicated that they do not use any infor-mation to guide admissions, compared to 8 percent of non-participants. This difference was entirely driven by responses from participating schools in Milwaukee, which cannot legally use any information aside from eligibility status when admitting voucher students. The other three programs do not have this restriction but require schools to abide by written admissions guidelines.
❖ ArE non-PArtIcIPAtIng SchoolS morE ExPEnSIVE?
We also inquired about schools’ tuition and fees. Each respondent was asked to select one of three price ranges that best described the total per-student tuition and fees that a full-time pupil would pay at their schools. Separate ranges were provided for K–8 and 9–12 students. Table 6 compares the tuition and fees of participating and non-participating schools,
Table 6. Tuition costs relative to voucher amount for participating and non-participating schools
PArt
IcIP
AntS
non
- PA
rtIc
IPAn
tS
All
Sch
oo
lS
Tuition below voucher amount by at least $1,000
21% 26% 23%
Tuition within $1,000 (above or below) of voucher amount
3% 6% 4%
Tuition exceeds voucher amount by at least $1,000
76% 69% 73%
Source: Survey results.
Note: The results in Table 6 are based on responses from 241 private schools (179 participants and 62 non-participants). The rows may not sum to 100 percent due to rounding. The actual survey item presented three ranges of dollar amounts. Schools were asked to respond separately for K–8 and 9–12 tuition amounts. The survey question was, “Which of the following best describes the total per-student cost of tuition and compulsory fees for full-time enrollment in your school?”

29School Choice Regulations: Red Tape or Red Herring? Part III: Survey Results
relative to the maximum voucher amounts for their respective programs in 2011–12.
If financial costs are a major deterrent to participa-tion, we might expect non-participants to be more likely to have tuition and fees that exceed maximum voucher amounts. The data do not bear this out. In fact, the proportion of schools reporting total per-student tuition and fees at least $1,000 above the voucher amount is slightly higher for participants than non-participants (76 percent compared to 69 percent). However, it is possible that the actual tu-ition rates of non-participants in our survey are still considerably higher, on average, than those of
participating schools, but the survey did not pick up on this difference because our top category was too broad to discriminate between, say, a participat-ing school charging $8,000 and a non-participating school charging $16,000. 50
The results show the majority of schools are subsidizing the tuition of their voucher students, with three out of four participating schools reporting that their total cost of tuition and fees for full-time students exceeded the maximum value of the voucher by at least $1,000. This does not mean that most schools are in worse financial condition as a result of their participation in voucher programs. For a school with an enrollment shortfall,
Source: Survey results.
Note: The results in Figure 12 are based on responses from 62 non-participants. The bars in Figure 12 indicate the percentage of non-participants indicating they would be “much more likely” to participate if a program enacted the change listed to the left of the bar. The survey question was: “How would expanding the voucher eligibility to all families (universal voucher) influence your school’s likelihood of participation in the future?” Response options included: “No more likely to participate,” “somewhat more likely to participate,” “much more likely to participate,” and “not sure.”
Figure 12. The influence of expanding voucher eligibility to all families on private school participation
Expanding voucher eligibility to all families (universal voucher)
Raising the maximum voucher amount to match our regular tuition rates
Eliminating the requirement to allow student to opt out of religious activites
Eliminating open-enrollment admissions requirements
Removing limits on charging additional tuition or fees to voucher recipients
Eliminating the public reporting of schools' test scores
Eliminating the requirement to participate in state testing
Eliminating financial audit and disclosure requirements
Eliminating curriculum requirements
Eliminating administrator credential/certification requirements
Eliminating teacher credential/certification requirements
38%
How would the following changes influence your school’s likelihood of participation in the future?
29%
23%
19%
16%
15%
15%
14%
13%
8%
8%

30School Choice Regulations: Red Tape or Red Herring? Part III: Survey Results
accepting a voucher student at a discounted rate may be preferable to taking a complete loss on an empty seat. But while the voucher amounts may be sufficient for filling excess capacity, they may be too low to incentiv-ize schools to expand their enrollment in order to serve more voucher families.
❖ whAt rEgulAtory chAngES would EntIcE SchoolS to PArtIcIPAtE?
Finally, we asked non-participating schools what changes to the program requirements would influence their decision to participate in the future. We posed a number of hypothetical regulatory changes to the non-participating schools in our survey sample and asked them to indicate whether, if these hypothetical changes were put in place, they would be more likely to participate.
The item that elicited the strongest response was “ex-panding voucher eligibility to all families” (see Figure 12), with 38 percent of non-participants indicating they would be “much more likely to participate” if this change occurred. This again points to low demand as the primary reason for non-participation (recall that “lack of demand from eligible families” was the top-ranked reason cited by non-participants in Figure 8).
Twenty-nine percent of non-participants would be more likely to participate if voucher amounts were raised to match their existing tuition levels. Additionally, we see more evidence that schools are sensitive to restrictions on religious activities and admissions procedures.
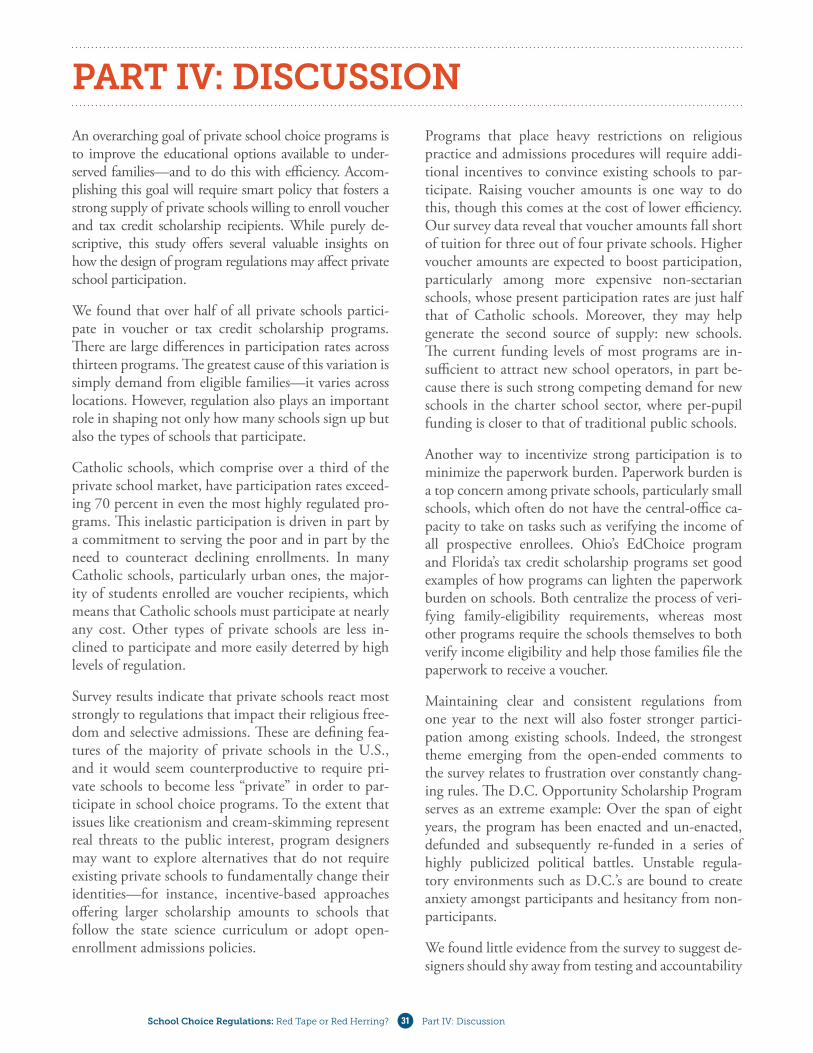
31School Choice Regulations: Red Tape or Red Herring? Part IV: Discussion
ParT iv: diSCuSSiONAn overarching goal of private school choice programs is to improve the educational options available to under-served families—and to do this with efficiency. Accom-plishing this goal will require smart policy that fosters a strong supply of private schools willing to enroll voucher and tax credit scholarship recipients. While purely de-scriptive, this study offers several valuable insights on how the design of program regulations may affect private school participation.
We found that over half of all private schools partici-pate in voucher or tax credit scholarship programs. There are large differences in participation rates across thirteen programs. The greatest cause of this variation is simply demand from eligible families—it varies across locations. However, regulation also plays an important role in shaping not only how many schools sign up but also the types of schools that participate.
Catholic schools, which comprise over a third of the private school market, have participation rates exceed-ing 70 percent in even the most highly regulated pro-grams. This inelastic participation is driven in part by a commitment to serving the poor and in part by the need to counteract declining enrollments. In many Catholic schools, particularly urban ones, the major-ity of students enrolled are voucher recipients, which means that Catholic schools must participate at nearly any cost. Other types of private schools are less in-clined to participate and more easily deterred by high levels of regulation.
Survey results indicate that private schools react most strongly to regulations that impact their religious free-dom and selective admissions. These are defining fea-tures of the majority of private schools in the U.S., and it would seem counterproductive to require pri-vate schools to become less “private” in order to par-ticipate in school choice programs. To the extent that issues like creationism and cream-skimming represent real threats to the public interest, program designers may want to explore alternatives that do not require existing private schools to fundamentally change their identities—for instance, incentive-based approaches offering larger scholarship amounts to schools that follow the state science curriculum or adopt open-enrollment admissions policies.
Programs that place heavy restrictions on religious practice and admissions procedures will require addi-tional incentives to convince existing schools to par-ticipate. Raising voucher amounts is one way to do this, though this comes at the cost of lower efficiency. Our survey data reveal that voucher amounts fall short of tuition for three out of four private schools. Higher voucher amounts are expected to boost participation, particularly among more expensive non-sectarian schools, whose present participation rates are just half that of Catholic schools. Moreover, they may help generate the second source of supply: new schools. The current funding levels of most programs are in-sufficient to attract new school operators, in part be-cause there is such strong competing demand for new schools in the charter school sector, where per-pupil funding is closer to that of traditional public schools.
Another way to incentivize strong participation is to minimize the paperwork burden. Paperwork burden is a top concern among private schools, particularly small schools, which often do not have the central-office ca-pacity to take on tasks such as verifying the income of all prospective enrollees. Ohio’s EdChoice program and Florida’s tax credit scholarship programs set good examples of how programs can lighten the paperwork burden on schools. Both centralize the process of veri-fying family-eligibility requirements, whereas most other programs require the schools themselves to both verify income eligibility and help those families file the paperwork to receive a voucher.
Maintaining clear and consistent regulations from one year to the next will also foster stronger partici-pation among existing schools. Indeed, the strongest theme emerging from the open-ended comments to the survey relates to frustration over constantly chang-ing rules. The D.C. Opportunity Scholarship Program serves as an extreme example: Over the span of eight years, the program has been enacted and un-enacted, defunded and subsequently re-funded in a series of highly publicized political battles. Unstable regula-tory environments such as D.C.’s are bound to create anxiety amongst participants and hesitancy from non-participants.
We found little evidence from the survey to suggest de-signers should shy away from testing and accountability

32School Choice Regulations: Red Tape or Red Herring? Part IV: Discussion
requirements out of concern that they will stifle partici-pation. The concerns of non-participating schools re-garding testing were more related to their philosophical opposition to standardized testing and the burden of administering the state test on top of the test required by their governing organizations. They did not express strong opposition to the accountability aspect of test-ing, such as publicizing test scores or receiving letter grades from the state.
This descriptive research makes a number of contribu-tions to our understanding of the role of regulations and other factors in shaping the supply of private schools in school choice programs. Even so, there is great deal we still need to learn. Most importantly, additional re-search is necessary to identify the policies that foster a higher-quality supply of private school participants, not just a larger supply. This includes factors that encour-age the most effective existing private schools to sign up and that ensure ineffective schools make a quick exit.

33School Choice Regulations: Red Tape or Red Herring? Appendix: Technical Information on the Descriptive Analysis
aPPENdix: TEChNiCal iNFOrmaTiON ON ThE dESCriPTivE aNalySiS
Table a-1. Primary sources used to gather information on private school regulations
nAmE rEgulAtIon dAtA SourcES
D.C. Opportunity Scholarship Program 1. Scholarships H.R. 471
2. “How to Use your Scholarship,” D.C. Investment Trust, http://www.dcscholarships.org/elements/file/OSP/How%20to%20Use%20Your%20Scholarship%2012-13%20(English).pdf
Indiana Choice Scholarship Program 1. Indiana Code 20-51-1; Indiana Code 20-51-4
2. “Application to Become an Eligible School Under Indiana’s Choice Scholarship Program,” Indiana Department of Education, http://www.doe.in.gov/sites/default/files/school-choice/application-become-eligible-school.pdf
3. “Indiana Choice Scholarship Program: Frequently Asked Questions – Eligible Schools,” Indiana Department of Education, http://www.doe.in.gov/sites/default/files/school-choice/2012-05-faqforschools.pdf
Louisiana Student Scholarship for Educational Excellence 1. Louisiana HB 976
2. Louisiana Department of Education, “Criteria for School Participation in the Student Scholarship for Educational Excellence Program,” http://www.louisianaschools.net/lde/uploads/20035.pdf
Ohio EdChoice Scholarship Program 1. Ohio Code 3310
2. Ohio Educational Choice Scholarship Program: Policy and Procedures Manual, Ohio Department of Education
Cleveland Scholarship and Tutoring Program 1. Ohio Code 3313
2. Cleveland Scholarship Tutoring Program 2009-10 Policy Manual, Ohio Department of Education
Milwaukee Parental Choice Program 1. Wisconsin Stat. 119.23
2. “Milwaukee Parental Choice Program: Program Forms,” Wisconsin Department of Public Instruction, http://sms.dpi.wi.gov/sms_forms
Arizona Individual School Tuition Organization Tax Credit 1. Ariz. Stat. 43-1089, Arizona Department of Revenue
2. Manual for School Tuition Organizations, Arizona Department of Revenue, http://www.azdor.gov/LinkClick.aspx?fileticket=NfhvNE7I864%3d&tabid=114
Arizona Corporate School Tuition Organization Tax Credit 1, Ariz. Stat. 43-1183, http://www.azleg.state.az.us/ars/43/01183.htm
2. Manual for School Tuition Organizations, Arizona Department of Revenue, http://www.azdor.gov/LinkClick.aspx?fileticket=NfhvNE7I864%3d&tabid=114
Florida Tax Credit Scholarship Program 1. Florida Stat. 1002.395
2. “Participate Now,” Step Up for Students, http://www.stepupforstudents.org/HowItWorks/ForSchools/ParticipateNow
Georgia Private School Tax Credit 1. Georgia HB 325
Iowa School Tuition Organization Tax Credit Program 1. Iowa Code 422.11S
Pennsylvania Educational Improvement Tax Credit 1. Pennsylvania Article XVII – F
Rhode Island Corporate Tax Credit Scholarship Program 1. Rhode Island Code Chapter 44-62

34School Choice Regulations: Red Tape or Red Herring? Appendix: Technical Information on the Descriptive Analysis
Az
corP
tcS
Az
Ind
tcS
clEV
Vo
uch
Er
dc
Vou
chEr
oh
Ed
ch
oIc
E
Fl t
cS
gA
tcS
In V
ou
chEr
IA t
cS
lA V
ou
chEr
mIl
w V
ou
chEr
PA t
cS
rI t
cS
Financial Reporting & Disclosure
Submit annual financial report that includes audit by independent public accountant
Submit annual financial report
Disclose voucher/scholarship expenditures
Disclose non-voucher/scholarship expenditures
Provide state with details on tuition rate structure
Eligibility Requirements
Register private school with state
Accreditation/charter required for participating schools at some point
Accreditation/charter required at time of participation
Application Requirements
Notify state of intent to participate
Submit application to participate for the first time
Required to submit application every year
Application fee required
Required to submit proof of financial viability
Required to submit proof/certificate of insurance
Required to obtain surety/fidelity bond or letter of credit
Curriculum & Instruction Requirements
Maintain copies of Constitution, etc.
Display American flag in each classroom
Provide instruction on American civics, history, or heritage
Provide instruction in core subjects (reading, math, science)
Provide education on drugs, alcohol, tobacco
Follow state academic content standards
Tuition & Fee Restrictions
School cannot charge voucher recipient more than voucher amount
Maximum set on scholarship/voucher amount (cap)
Fixed voucher amount set for all eligible recipients
Parents required to contribute portion of scholarship
Table a-2. Private school choice program requirements used to determine regulatory burden scores

35School Choice Regulations: Red Tape or Red Herring? Appendix: Technical Information on the Descriptive Analysis
Az
corP
tcS
Az
Ind
tcS
clEV
Vo
uch
Er
dc
Vou
chEr
oh
Ed
ch
oIc
E
Fl t
cS
gA
tcS
In V
ou
chEr
IA t
cS
lA V
ou
chEr
mIl
w V
ou
chEr
PA t
cS
rI t
cS
Certification & Licensure Requirements
Criminal background checks for all employees
Bachelor's degrees required of instructional staff
Teacher certificate/license required of all teachers
Administrator certificate/license required of all administrators
Annual performance evaluations required of all teachers
Oversight
State budget line item for program oversight/compliance
Designated office in state department of education for compliance
Published instructions on how to report fraud or violations
Program staff conducts announced site visits
Program staff conducts unannounced site visits
Admissions & Enrollment Guidelines
Abide by written admissions policy
Students allowed to opt out of religious activity
Lottery required for oversubscription
Cap on voucher students in first few years
Adopt open-enrollment policy
No enrollment preference for siblings
No enrollment preference to students previously enrolled
School required to admit new students in all grades offered
Restricted to students enrolled in public school or Kindergarten students
Program restricted to families based on income
Restricted to families assigned to failing schools
Restricted to families assigned to failing schools and in poverty
Testing & Accountability Requirements
Administer some form of standardized test
Administer the state's standardized tests
Test voucher recipients in at least one grade
Test voucher recipients in all grades
Table a-2. Private school choice program requirements used to determine regulatory burden scores (cont'd)

36School Choice Regulations: Red Tape or Red Herring? Appendix: Technical Information on the Descriptive Analysis
*Indicates requirement applies to program
Source: Program regulation information collected from state departments of education
Note: The Milwaukee Parental Choice Program’s pre-accreditation requirement is considered a form of accreditation for the purposes of this study.
Az
corP
tcS
Az
Ind
tcS
clEV
Vo
uch
Er
dc
Vou
chEr
oh
Ed
ch
oIc
E
Fl t
cS
gA
tcS
In V
ou
chEr
IA t
cS
lA V
ou
chEr
mIl
w V
ou
chEr
PA t
cS
rI t
cS
Administer test to non-voucher students
Report annual test scores to state
Provide parents with student's test scores
State releases test scores at state level
State releases test scores at school level
State releases test scores at subgroup level
School receives annual accountability rating from state
Follow state regulations regarding test security and proctoring
Pay costs of administering tests
Required to maintain school improvement plan/strategic plan
Paperwork & Reporting
Maintain student health records
Maintain certificate of occupancy for building and facilities
Maintain immunization records for all students
Have fire safety inspections
Submit annual compliance report
Maintain daily attendance records on voucher students
Submit enrollment records of voucher students at least once per year
Submit enrollment records of voucher students at least twice per year
Verifying family income eligibility status
Maintain records of family income eligibility
Submit application for scholarship on parents' behalf
Table a-2. Private school choice program requirements used to determine regulatory burden scores (cont'd)

37School Choice Regulations: Red Tape or Red Herring? Appendix: Technical Information on the Descriptive Analysis
❖ modEl oF School PArtIcIPAtIon
We use a random intercept logistic regression model to examine the relationship of regulatory burden and private school participation. The model we fit predicts participation as a function of school and program fac-tors. It can be written as:
Where P* is conceptualized as a latent continuous re-sponse variable representing the propensity of school j to participate in their school choice program k, which underlies Pjk, the observed binary indicator of school participation status in 2011-12.51
Xjk is a vector of school-specific independent variables that includes measures of the local demand for the private school from eligible voucher recipients, the excess capacity of the school to enroll more students, and other school characteristics expected to influence participation. Descriptions of these variables are pro-vided in Table A-4. Some of the variables are taken from Private School Universe Survey (PSS) data in the
year (s) immediately prior to the enactment of schools’ respective choice programs to address concern that the post-program measures are endogenous to participa-tion. For instance, school enrollment size will be en-dogenous to participation in post-program years be-cause schools that enroll voucher/scholarship students are expected to see an increase in enrollment. β is a vector of coefficients that corresponds Xjk.
Zk is a vector of program-level explanatory variables with coefficients λ. The small sample of programs (n=13) imposes limits on the number of program-level factors we can include in the same model. Our base model includes two program-level controls that we ex-pected to influence school participation. An estimate of the total number of vouchers/scholarships available to eligible families in 2011-12 and the average vouch-er/scholarship amounts.
Rk is the measure of the regulatory burden that comes with participation in program k. This measure is con-stant for all schools within a given program jurisdiction. As described in the main body of the report, R is based on the number of requirements each program has across 10 domains of regulation. Seventy-one unique require-ments were counted across the 10 domains. Min-max normalization is used to put programs’ results on a scale with a plausible range of 0 to 100 (observed range 8
Table a-3. Reliability Statistics on the Regulatory Burden Measure
no. ItEmS
(rEquIrEmEntS)IntErnAl conSIStEncy
(cronbAch’S AlPhA)ItEm-rESt corrElAtIon
(IndEx)
School Eligibility Requirements 3 0.72 0.77
Application Procedures 7 0.82 0.84
Admissions & Enrollment Guidelines 12 0.69 0.78
Tuition Restrictions 4 0.61 0.64
Testing & Accountability Requirements 13 0.91 0.94
Financial Reporting & Disclosure 5 0.80 0.82
Curriculum & Instruction Requirements 6 0.77 0.32
Compliance Reporting 11 0.82 0.91
Certification & Licensure Requirements 5 0.71 0.63
Oversight 5 0.76 0.66
Overall 71 0.92
Source: Regulation information collected from state departments of education.
Note: Table A-3 reports the number of requirements in each of the ten domains, along with the internal consistency Cronbach’s alpha coefficient for each domain and the correlation of each domain-level score to the rest of the domain-level scores.
Pjk* = Xjkβ + Zkλ + Rkδ + μk+ εjk
Where Pjk = 1 if Pjk* ≥ 0; Pjk = 0 if Pjk* < 0
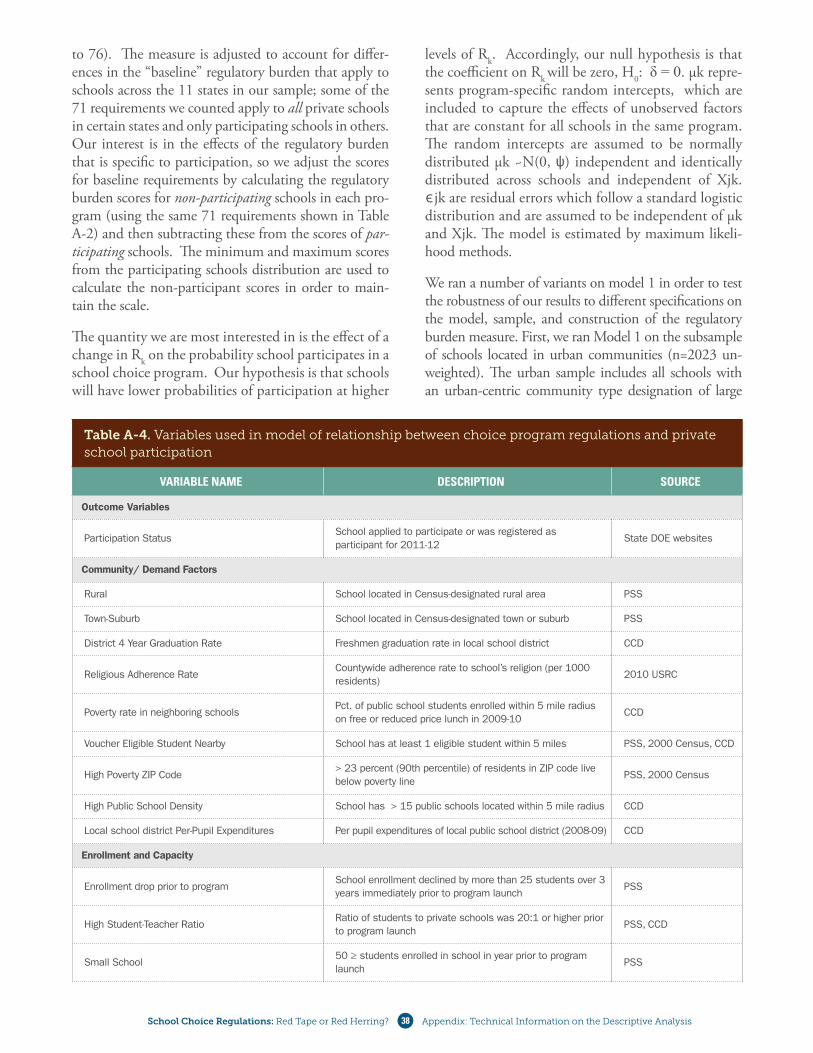
38School Choice Regulations: Red Tape or Red Herring? Appendix: Technical Information on the Descriptive Analysis
to 76). The measure is adjusted to account for differ-ences in the “baseline” regulatory burden that apply to schools across the 11 states in our sample; some of the 71 requirements we counted apply to all private schools in certain states and only participating schools in others. Our interest is in the effects of the regulatory burden that is specific to participation, so we adjust the scores for baseline requirements by calculating the regulatory burden scores for non-participating schools in each pro-gram (using the same 71 requirements shown in Table A-2) and then subtracting these from the scores of par-ticipating schools. The minimum and maximum scores from the participating schools distribution are used to calculate the non-participant scores in order to main-tain the scale.
The quantity we are most interested in is the effect of a change in Rk on the probability school participates in a school choice program. Our hypothesis is that schools will have lower probabilities of participation at higher
levels of Rk. Accordingly, our null hypothesis is that the coefficient on Rk will be zero, H0: δ = 0. μk repre-sents program-specific random intercepts, which are included to capture the effects of unobserved factors that are constant for all schools in the same program. The random intercepts are assumed to be normally distributed μk ~N(0, ψ) independent and identically distributed across schools and independent of Xjk. εjk are residual errors which follow a standard logistic distribution and are assumed to be independent of μk and Xjk. The model is estimated by maximum likeli-hood methods.
We ran a number of variants on model 1 in order to test the robustness of our results to different specifications on the model, sample, and construction of the regulatory burden measure. First, we ran Model 1 on the subsample of schools located in urban communities (n=2023 un-weighted). The urban sample includes all schools with an urban-centric community type designation of large
VArIAblE nAmE dEScrIPtIon SourcE
Outcome Variables
Participation Status School applied to participate or was registered as participant for 2011-12
State DOE websites
Community/ Demand Factors
Rural School located in Census-designated rural area PSS
Town-Suburb School located in Census-designated town or suburb PSS
District 4 Year Graduation Rate Freshmen graduation rate in local school district CCD
Religious Adherence RateCountywide adherence rate to school’s religion (per 1000 residents)
2010 USRC
Poverty rate in neighboring schoolsPct. of public school students enrolled within 5 mile radius on free or reduced price lunch in 2009-10
CCD
Voucher Eligible Student Nearby School has at least 1 eligible student within 5 miles PSS, 2000 Census, CCD
High Poverty ZIP Code> 23 percent (90th percentile) of residents in ZIP code live below poverty line
PSS, 2000 Census
High Public School Density School has > 15 public schools located within 5 mile radius CCD
Local school district Per-Pupil Expenditures Per pupil expenditures of local public school district (2008-09) CCD
Enrollment and Capacity
Enrollment drop prior to programSchool enrollment declined by more than 25 students over 3 years immediately prior to program launch
PSS
High Student-Teacher RatioRatio of students to private schools was 20:1 or higher prior to program launch
PSS, CCD
Small School50 ≥ students enrolled in school in year prior to program launch
PSS
Table a-4. Variables used in model of relationship between choice program regulations and private school participation

39School Choice Regulations: Red Tape or Red Herring? Appendix: Technical Information on the Descriptive Analysis
that participation rates will be lower in new programs as a function of schools (and families) unfamiliarity with the requirements for participation. A number of the schools in Indianapolis that responded to our sur-vey indicated they did not learn about their program early enough to apply for it.
Third, we introduce a fixed effect for voucher pro-grams, excluding the other program level controls, but retaining the regulatory burden measure. This model tests the association of regulatory burden to school participation while controlling for systematic differ-ences in participation between schools in voucher and tax credit scholarship programs.
Fourth, we estimate Model 1 using an alternative weighting scheme for the measure of regulatory bur-den, which assigns weight to the domain-level scores according to the level of importance revealed in the survey responses. The alternative “survey-based” weights are derived from respondents’ average rating
of the importance of factors (items) that corresponded to each of the 10 domains of regulation. We use the average of their ratings on the 5-point Likert scale ranging from 1 = “not at all important” to 5 = “ex-tremely important”. The survey-based weights may better represent the type of regulatory burden that schools respond to, although the preferences of the survey respondents in the four voucher programs may not generalize to schools in the other 9 programs. The original and alternative weights for the 10 domains are shown in Table A-5.
Fifth, we specified a probit model with correlated random effects in an attempt to correct for potential selection bias in the sample that arises due to school eligibility (accreditation) restrictions. 52 Specifically, this is to deal with the fact that the sample includes 63 non-chartered schools in Ohio and 148 non-ac-credited schools in Indiana that are not eligible to participate in their respective voucher programs. Since ineligible schools do not have the option to partici-
city, midsize city, or small city (according to the PSS). Restricting the sample to urban schools is intended to mitigate potential bias due to unmeasured differences across schools in their level of awareness of the program and the amount of demand from eligible families they experience. For example, three of the more heavily-reg-ulated voucher programs (Cleveland, Milwaukee, and DC) are exclusively urban. Schools in the jurisdictions of these high-profile city-based programs are surrounded
by heavier concentrations of eligible voucher recipients and likely more aware that the programs exist. Failure to account for these factors might confound the relation-ship of regulation to participation.
Second, we added a binary indicator of “New Pro-grams” to Model 1. Two of the 13 programs in our sample were less than 2 years old: the Indiana and Louisiana statewide voucher programs. We suspect
VArIAblE nAmE dEScrIPtIon SourcE
School Characteristics
High SchoolSchool served grades 9-12 exclusively prior to choice pro-gram launch
PSS
High Minority> 50% of student population enrolled in year prior to pro-gram launch was minority (non-white)
PSS
Alternative School School classified as Alternative School PSS
Montessori School School classified as Montessori School PSS
Non-Catholic Religious School School has religious orientation other than Catholic PSS
Catholic School classified as Catholic school PSS
Tuition & Costs (Program Level)
Average Scholarship/Voucher Amount of Program Average scholarship amount of program Friedman Foundation
No. available scholarshipsThe total number of vouchers/scholarships available to eligible families.
Alliance for school choice
Regulatory Burden (Program Level)
Overall Regulatory Burden ScoreNormative measure ranging from 0 to 100 based on number of requirements across 10 domains (total of 71 possible requirements)
Author calculations
Table a-4. Variables used in model of relationship between choice program regulations and private school participation (cont'd)
Sources: Data were collected from the 2009-10 Private School Universe Survey (PSS), the 2010-11 Common Core of Data (CCD), the Alliance for School Choice, the Friedman Foundation, various state departments of education, the 2000 Census, and the 2010 U.S. Religious Census: Religious Congregations & Membership Study (USRC).
Notes: Table A-4 indicates the data sources for variables used in base logit model specification (Model 1). All participation data are from the 2011-12 with the exception of Louisiana, which used the list of schools indicating their intent to participate in the new statewide program in 2012-13.

40School Choice Regulations: Red Tape or Red Herring? Appendix: Technical Information on the Descriptive Analysis
pate, their participation outcomes are treated as miss-ing in Model 1. Selection bias will arise if the ineligible schools differ from the eligible schools in unobserved ways that affect their probability of participation. The bivariate probit model makes a correction for this bias.
Finally, we replaced the program random-effects with state fixed-effects in order to exploit the within-state variation in program regulatory burden that exists in Arizona. Arizona has two tuition tax-credit scholarship programs that have different levels of regulation. We include the state fixed effects to test if schools within the same state are more likely to participate in the pro-gram with lower regulatory burden. Robust standard errors are used to account for multiple observations of Arizona schools in the sample.
Results from different specifications were not substan-tively different in terms of the magnitude or signifi-cance of the marginal effects of regulatory burden on participation. In all specifications we find a positive and statistically significant association of regulatory burden to the odds of participation.
rEgulAtIon domAIn
orIgInAl wEIght (EquAl-
wEIghtIng)
AltErnAtIVE wEIght (SurVEy-
wEIghtIng)
Eligibility Requirements
10% 7%
Application Requirements
10% 6%
Curricular Requirements
10% 8%
Tuition & Fee Restrictions
10% 12%
Student Admission Guidelines
10% 17%
Paperwork & Reporting
10% 16%
Oversight & Enforcement
10% 6%
Licensure & Credentialing
10% 9%
Financial Disclosure & Reporting
10% 6%
Testing & Accountability
10% 8%
Table a-5. Original and survey-based weighting of regulatory burden measure
Source: Regulation information collected from state departments of education.
Note: Table reports the weight assigned to each of the 10 domains when calculating the overall average regulatory burden. The original measure assigns equal weight (10%) to all 10 domains, while the alternative weighting scheme assigns weights based on the results of the private school survey conducted in Milwaukee, Indianapolis, Dayton, Cincinnati, and Cleveland.

41School Choice Regulations: Red Tape or Red Herring? Endnotes
ENdNOTES1. Greg Forster and James L. Woodworth, The
Greenfield School Revolution and School Choice (Friedman Foundation for Educational Choice, June 2012), http://www.edchoice.org/CMS-Modules/EdChoice/FileLibrary/853/Greenfield-School-Revolution-and-School-Choice.pdf.
2. Adam Schaeffer, “A Strategic Defeat for Edu-cational Freedom,” Huffington Post, March 5, 2011, http://www.huffingtonpost.com/adam-schaeffer/a-strategic-defeat-for-ed_b_857687.html.
3. Michael J. Petrilli et al., When Private Schools Take Public Dollars: What’s the Place of Account-ability in School Voucher Programs? (Thomas B. Fordham Institute, March 2009), http://www.ed-excellencemedia.net/publications/2009/200904_whenprivateschoolstakepublicdollars/School%20Vouchers%20Report.pdf.
4. As this study shows, it’s possible for a school to agree to participate in a program and go through the various steps required to do so yet, for various reasons, end up in any given year with no pupils from it.
5. Participation rates are “raw” in that they do not factor in whether or not schools are eligible to participate, school proximity to eligible voucher/scholarship recipients, number of scholarships available, etc. See report for “adjusted” participa-tion rates that consider such variables.
6. This might be, for example, the result of a nar-rowly defined program; a dearth of families (or public schools) in the vicinity that meet the pro-gram’s eligibility requirements; a lack of aware-ness or interest in the program among those who might benefit from it; and/or insufficient funding to cover all who might otherwise be eligible to take part.
7. We’re aware that simply by flagging these con-cerns with admissions and religious practices, we may be alerting enemies of private school choice to new ways to curb the spread and take-up rates of such programs.
8. “The Year of School Choice,” Wall Street Journal, July 5, 2011, http://professional.wsj.com/article/SB10001424052702304450604576420330972531442.html.
9. Michelle Gininger, School Choice: Legislation State by State (American Federation for Children, 2011), accessed January 11, 2013, http://www.federationforchildren.com/system/uploads/119/original/Legislation_State_by_State_2011.09.19.pdf?1316465450; “The Year of School Choice.”
10. Clive R. Belfield, Henry M. Levin, and Heather L. Schwartz, “School Choice and the Supply of Private Schooling Places: Evidence from the Mil-waukee Parental Choice Program,” Occasional Paper No. 84, National Center for the Study of Privatization in Education (New York: Teach-ers College, 2004), http://www.ncspe.org/pub-lications_files/OP_84.pdf; Julian R. Betts, “The Economic Theory of School Choice,” in Getting Choice Right: Ensuring Equity and Efficiency in Ed-ucation Policy, ed. Julian R. Betts and Tom Love-less (Washington, D.C.: Brookings Institution Press, 2005) 14-39.
11. Milton Friedman, “The Role of Government in Education,” in Capitalism and Freedom (Chicago: University of Chicago Press, 1962), 85-107.
12. Martin R. West, School Choice through the Tax Code: Past Limitations, Future Prospects (Cam-bridge, MA : Program on Educational Policy and Governance, Harvard University, 2002).
13. Patte Barth, Jim Hull, and Rebecca St. Andrie, Searching for the Reality of Virtual Schools (Alex-andria, VA: Center for Public Education, May 2012), http://www.centerforpubliceducation.org/Main-Menu/Organizing-a-school/Searching-for-the-reality-of-virtual-schools-at-a-glance/Searching-for-the-reality-of-virtual-schools-full-report.pdf.
14. Stephen P. Broughman et al., Private School Uni-verse Survey (PSS): Public-Use Data File for School Year 2009-10 (National Center for Education Statistics, March 2012), http://nces.ed.gov/pub-search/pubsinfo.asp?pubid=2012320; Malcom

42School Choice Regulations: Red Tape or Red Herring? Endnotes
Glenn and Michelle Gininger, School Choice Now: The Year of School Choice: School Choice Yearbook 2011-12 (Washington, D.C.: Alliance for School Choice, 2012), http://s3.amazonaws.com/assets.allianceforschoolchoice.com/admin_assets/up-loads/67/scy2012.pdf.
15. School choice for special-education students is a prominent aspect of the school-choice move-ment, and its research demands separate, dedi-cated studies such as those by Marcus & Greene (2009) and Wolf, Witte, & Fleming (2012). Marcus A. Winters and Jay P. Greene, How Special Ed Vouchers Keep Kids From Being Misla-beled as Disabled, Civic Report no. 58 (Manhat-tan Institute for Policy Research, 2009), http://www.manhattan-institute.org/html/cr_58.htm; Patrick J. Wolf, John F. Witte, and David J. Fleming, “Special Choices,” Education Next 12, no. 3 (2012), 16-22, http://educationnext.org/special-choices/.
16. The Ohio EdChoice Scholarship Program and the Louisiana Student Scholarships for Educational Excellence Program, often referred to as “failing school” programs, direct scholarships specifically toward students enrolled in low-performing pub-lic schools. Only the Arizona Individual School Tuition Organization Tax Credit and the Georgia Private School Tax Credit, both tax credit schol-arship programs, lack state legislation requiring needs-based student eligibility requirements.
17. Scholarship Granting Organizations (SGOs) are also referred to as School Tuition Organizations (STOs).
18. In a 2011 case regarding Arizona’s personal tax credit scholarship program, the U.S. Supreme Court ruled that taxpayer donations to SGOs are not government property. Arizona Christian Sch. Tuition Org. vs Winn, 131, 131 S. Ct. 1426, 179 L. Ed. 2d 523 (2011).
19. Louisiana’s participation rates are based on the 2012–13 school year.
20. Participation data for Louisiana’s voucher pro-gram is from 2012–13. We used the Louisiana Department of Education’s published list of private schools that submitted “intent to apply” forms for the 2012–13 school year so we could measure participation in the expanded statewide
program. There were 508 schools (13.3 percent) in the master participation list that could not be matched to records in the PSS data, either because the school was not in the PSS file (which would be the case if the school opened after 2009 or did not complete the PSS questionnaire), changed its name, or was designated as a special-education or early-childhood school and was therefore dropped from the PSS dataset prior to merging in partici-pation data. Of the 366 unmatched participants, 72 percent were from two programs: 220 from Florida’s tax credit scholarship program and 146 from Arizona’s Individual Tax Credit Scholarship program.
21. Defining participation based on evidence of “in-tent to participate” versus evidence of enrolling voucher/tax credit scholarship students is pref-erable since the latter is entirely contingent the existence of demand for the school from eligible families, which is not our primary interest.
22. The unweighted response rate for the 2009–10 PSS was 93.8 percent, so this sample is represen-tative of all of the private schools in operation in 2009–10 (Stephen P. Broughman et al., Private School Universe Survey (PSS): Public-Use Data File for School Year 2009-10). Early-childhood cen-ters, special-education schools, and Amish schools were dropped from the dataset. In addition to the PSS and participation lists, we incorporate data from a variety of sources: zip codes and county-level demographics are from the U.S. Census (Summary File 3: Poverty Status in 1999 of Indi-viduals (Washington, D.C.: U.S. Census of Popu-lation and Housing, Government Printing Office, 2000); county-level information on religious ad-herence rates is from the 2010 U.S. Religion Cen-sus (Clifford Grammich et al., 2010 U.S. Religion Census: Religious Congregations and Membership Study (Lenexa, KS: Association of Statisticians of American Religious Bodies, 2012), http://www.thearda.com/rcms2010/rcms_notes.asp); and data on neighboring public schools (demograph-ics, enrollment, per-pupil funding, and gradua-tion rates) are from the NCES Common Core of Data (Patrick Keaton, Numbers and Types of Public Elementary and Secondary Schools From the Com-mon Core of Data: School Year 2010–11–First Look (Washington, D.C.: National Center for Educa-tion Statistics, April 2012), http://nces.ed.gov/pubsearch/pubsinfo.asp?pubid=2012325rev).

43School Choice Regulations: Red Tape or Red Herring? Endnotes
23. The D.C. Opportunity Scholarship Program does not require accreditation, but it does require par-ticipating schools to present their accreditation information to families upon request.
24. The pre-accreditation process is unique to the Milwaukee Parental Choice Program. The process entails a review and approval of private schools’ educational plans. Pre-accreditation is meant for previously non-accredited schools or newly founded schools; already-accredited schools do not have to obtain pre-accreditation in order to participate. Private schools that obtain pre-ac-creditation must obtain full accreditation within three and a half years in order to continue par-ticipating in the Milwaukee Parental Choice Program, as stipulated in the program’s statutes. Alan J. Borsuk, “Just 3 New Voucher Schools Ap-proved,” Milwaukee-Wisconsin Journal Sentinel, July 20, 2009, http://www.jsonline.com/news/education/51268272.html.
25. “Nonpublic School Accreditation,” Iowa Depart-ment of Education, accessed January 11, 2013, http://educateiowa.gov/index.php?option=com_content&task=view&id=482&Itemid=529.
26. The State of Ohio and Private Schools: Essentials and Historical Background,” Ohio Association of Independent Schools, www.oais.org/files/5168/_Documents/PS_StateOH.doc.
27. Indiana assigns accountability grades to all state-accredited schools, not just those participating in the Indiana Choice Scholarship program.
28. This metric is modeled after the World Bank’s Ease of Doing Business: Distance to Frontier Score, which is used to measure countries’ regu-latory environments as it pertains to starting and operating businesses (World Bank, Doing Busi-ness 2012: Doing Business in a More Transparent World (Washington, D.C.: World Bank, 2011), http://www.doingbusiness.org/~/media/FPD-KM/Doing%20Business/Documents/Annual-Reports/English/DB12-FullReport.pdf). Rescal-ing the requirement count Y to Z for program p in domain x requires: Zpx = [Max(Yx ) – Ypx/Max(Yx)-Min(Yx)]*100. This measure is some-times referred to as “The Percentage of Maximum Possible” (see Patricia Cohen et al., “The Problem of Units and the Circumstance for POMP,” Mul-tivariate Behavioral Research 34,no. 3 (1999), 315-
346, ftp://ftp.rush.edu/users/molebio/JMichael/thumb1007/POMPpaper.pdf.
29. We explored a variety of approaches to weighting the domain-level scores when aggregating to an overall regulatory burden score, including weight-ing by the number of possible regulations in the domain, weighting according to the internal-con-sistency reliability of the domains, and weighting according to the preferences indicated by the survey results. The distribution and relative rankings of the thirteen programs’ overall scores were not substan-tively different using these approaches, and neither were the results of the probit analysis.
30. The internal-consistency reliability coefficient (Cronbach’s alpha) for the ten domains is .926 (see Appendix for more details on the measure’s reliabil-ity). The regulatory-burden scores also have a strong negative correlation to the Friedman Foundation’s grading of school restrictions (0.83); a lower grade from Friedman corresponds to a higher regulatory-burden score.
31. Simeon Djankov et al., “The Regulation of En-try,” The Quarterly Journal of Economics 117, no. 1 (2002), 1-37, http://www.doingbusiness.org/~/media/GIAWB/Doing%20Business/Doc-uments/Methodology/Supporting-Papers/DB-Methodology-Regulation-of-Entry.pdf.
32. Adam B. Schaeffer, “The Public Education Tax Credit,” Policy Analysis no. 605 (Cato Institute, December 2007), http://www.cato.org/sites/cato.org/files/pubs/pdf/pa-605.pdf.
33. Program regulatory-burden scores only consider regulations imposed on participating private schools, and thus, regulations imposed on SGOs in tax credit scholarship programs are not factored into a program’s score. Common program regula-tions of SGOs include disclosure of financial ac-tivity and background checks of SGO employees.
34. “History of the Choice Program,” Choose Your School Wisconsin, accessed January 11, 2013, http://www.chooseyourschoolwi.org/history-wis-consin-school-choice-program.html.
35. “Receiving a Charter,” Ohio Department of Edu-cation, last modified January 4, 2013, http://www.ode.state.oh.us/GD/Templates/Pages/ODE/ODEDetail.aspx?page=3&TopicRelationID=701&ContentID=1211&Content=133090.

44School Choice Regulations: Red Tape or Red Herring? Endnotes
36. Subgroup test scores for scholarship recipients are released on the ODE website at the district level, according to which public school district the stu-dent would be assigned to if she were not par-ticipating in a choice program. Performance on the private school–level is calculated but must be requested from ODE.
37. Vicki E. Murray, “An Analysis of Arizona Indi-vidual Income Tax-credit Scholarship Recipients’ Family Income, 2009–10 School Year,” Program on Education Policy and Governance Work-ing Paper (Cambridge, MA: Harvard Kennedy School, 2010), http://www.hks.harvard.edu/pepg/PDF/Papers/PEPG10-18_Murray.pdf.
38. Southern Education Foundation, A Failed Experi-ment: Georgia’s Tax Credit Scholarships for Private Schools (Atlanta, GA: The Southern Education Foundation, 2011), http://www.southernedu-cation.org/content/pdf/A_Failed_Experiment_Georgias_Tax_Credit.pdf.
39. Arizona’s program monitors the number of schol-arships going to low-income families.
40. Gilbert Cruz, “Looking for Solutions to the Catholic-School Crisis,” Time, October 12, 2009, http://www.time.com/time/nation/arti-cle/0,8599,1929589,00.html.
41. Peter Meyer, “Can Catholic Schools Be Saved?” Education Next 7, no. 2 (2007), 12-20, http://ed-ucationnext.org/can-catholic-schools-be-saved/.
42. A number of church writing and documents high-light how the Catholic mission can be advanced through choice programs. “Church Documents,” Alliance for Catholic Education, University of Notre Dame, accessed January 11, 2013, http://ace.nd.edu/pea/church-documents.
43. Richard Buddin, “The Impact of Charter Schools on Public and Private Enrollments,” Policy Anal-ysis no. 707 (Cato Institute, August 2012), www.cato.org/pubs/pas/PA707.pdf.
44. Thomas D. Snyder and Charlene M. Hoffman, “Digest of Education Statistics 2002: NCES 2003–060” (Washington, D.C.: National Center for Education Statistics, U.S. Depart-ment of Education, 2003), http://nces.ed.gov/pubs2003/2003060.pdf.
45. Paul Peterson and Matthew Chingos’ recent analysis of a privately funded voucher program in New York City found that low-income minority families are drawn more towards religious schools, particularly Catholic schools. The predicted par-ticipation rates in Figure 6 adjust for differences in county religious-adherence rates, but this vari-able may not have captured these dynamics.
46. “Private Schools,” American Montessori Society, accessed January 11, 2013, https://www.amshq.org/School%20Resources/Private.aspx; Chris Holfester, The Montessori Method (Ipswich, MA: EBSCO Publishing, 2008), accessed January 11, 2013, http://www.williamsburgmontessori.org/wp-content/uploads/2010/08/The_Montessori_Method.pdf.
47. The Ohio Ed Choice and Indiana Choice Schol-arship programs are open to schools across those states, but the survey frame was limited to schools in Cincinnati, Dayton, and Indianapolis. We nar-rowed the sampling frame to these cities to ensure that our limited resources were spent gathering responses from schools that actually faced a par-ticipation decision at some point in time. Given the high concentrations of eligible voucher re-cipients in these cities, we expected the majority of private schools to be aware of their voucher programs and likely to have made an intentional choice on whether to participate, which ultimate-ly would increase the reliability of their responses.
48. We offered schools both a hard copy and online version of the survey. Schools were encouraged to complete the online survey when possible. Sur-veys in both formats were administered to schools in May 2012. Of the 241 responding schools, 68 percent responded to the survey online and 32 percent responded via hard copy. Schools were offered two forms of incentives for participating. First, all schools in the sample were mailed a $5 gift card along with their hard-copy survey. The gift card was available for immediate use and not contingent upon completing the survey. Second, schools that completed the survey within the an-nounced survey window were entered into a raffle to win a set of e-readers.
49. The actual survey scale shown in Figure 9 includ-ed nine additional items (factors). For the sake of parsimony, we chose to display only the fourteen items that were specific to program regulations.

45School Choice Regulations: Red Tape or Red Herring? Endnotes
50. Patrick Wolf ’s evaluation of the D.C. Opportuni-ty Scholarship found that non-participants were significantly more likely to have tuitions above the program’s scholarship cap. Patrick Wolf et al., Evaluation of the DC Opportunity Scholarship Program: Impacts After One Year: NCEE 2007-4009 (Washington, D.C.: Institute for Educa-tion Sciences, June 2007), http://ies.ed.gov/ncee/pubs/20074009/.
51. As discussed earlier, Pjk is equal to 1 for all schools for which we could find some type of documen-tation indicating they sought participation in the program in the 2011–12 school year. This includes schools that filed paperwork indicating “intent to participate” with a state program of-fice or, in the case of tuition tax credit programs, schools listed as a partner school on the website of an SGO. An exception to this was our approach to Louisiana, for which we used application data 59 from the 2012–13 school year (the Louisi-ana Department of Education’s list of schools that filed an “intent to participate” form in the sum-mer of 2012) because that’s when the program was expanded statewide.
52. Alfonso Miranda and Sophia Rabe-Hesketh, “Maximum Likelihood Estimation of Endog-enous Switching and Sample Selection Models for Binary, Ordinal, and Count Variables,” Stata Journal 6, no. 3 (2006), 285-308, http://www.stata-journal.com/sjpdf.html?articlenum=st0107

46School Choice Regulations: Red Tape or Red Herring? About the Authors
aBOuT ThE auThOrSDavid Stuit is a founding partner at Basis Policy Re-search, where he conducts applied research for school districts, foundations, and other organizations involved in education reform. The majority of his research ad-dresses issues related to school choice and teacher qual-ity. Stuit earned his PhD in Leadership and Policy Studies from Vanderbilt University’s Peabody College of Education and Human Development.
Sy Doan is a Research Associate at Basis Policy Re-search. His research interests include school choice, measuring school and teacher effectiveness, and the politics of education reform. He holds a BA in Eng-lish and political science from the University of Notre Dame where he also worked as a Campus Campaign Coordinator for Teach for America.