school bus crashworthiness research · school bus crashworthiness research ... front-section...
TRANSCRIPT

1
School Bus Crashworthiness
Research
School Bus Crashworthiness
Research
October 2002October 2002
John HinchJohn HinchNHTSANHTSA
OutlineOutline
BackgroundBackgroundStatistical DataStatistical DataFullFull--Scale TestsScale TestsSled TestsSled TestsNAS Study NAS Study Research ResultsResearch ResultsFuture WorkFuture Work
School Bus FactsSchool Bus Facts
450,000 School buses (A, B, C, & D)450,000 School buses (A, B, C, & D)
4.3 Billion miles traveled4.3 Billion miles traveled
23.5 Million children23.5 Million children
8.5 Billion student trips8.5 Billion student trips

2
School Bus TypesSchool Bus Types
C D
A B
School Bus TypesSchool Bus Types
A B
Type Type ““AA””Constructed utilizing a cutaway Constructed utilizing a cutaway
frontfront--section vehicle with a left side section vehicle with a left side driverdriver’’s door s door
Includes two classificationsIncludes two classifications––Type A1, with a GVWR of Type A1, with a GVWR of 10,000 pounds or less10,000 pounds or less––Type A2, with a GVWR Type A2, with a GVWR greater than 10,000 poundsgreater than 10,000 pounds
Type Type ““BB””Constructed utilizing a stripped chassisConstructed utilizing a stripped chassisEntrance door is behind the front wheelsEntrance door is behind the front wheelsIncludes two classificationsIncludes two classifications
––Type B1, with a GVWR of 10,000 Type B1, with a GVWR of 10,000 pounds or lesspounds or less––Type B2, with a GVWR greater than Type B2, with a GVWR greater than 10,000 pounds10,000 pounds
School Bus TypesSchool Bus Types
C D
Type Type ““CC””Constructed utilizing a Constructed utilizing a
chassis with a hood and front chassis with a hood and front fender assemblyfender assembly
Entrance door is ahead of Entrance door is ahead of the behind the front wheelsthe behind the front wheels
Type Type ““DD””Constructed utilizing a stripped chassisConstructed utilizing a stripped chassisEntrance door is ahead of the front Entrance door is ahead of the front
wheelswheelsAlso known as Also known as ““Transit styleTransit style”” or or ““Forward Forward
control vehiclecontrol vehicle””

3
19991999--2000 Sales 2000 Sales by Bus Typeby Bus Type
10,181
250
25,898
11,341
05,000
10,00015,00020,00025,00030,000
Type A Type B Type C Type D
State Restraint State Restraint RequirementsRequirements
New York New York -- Currently requires lap belts (1987)Currently requires lap belts (1987)New Jersey New Jersey -- Currently requires lap belts Currently requires lap belts (1994)(1994)Florida Florida -- Currently requires a "safety belt" Currently requires a "safety belt" (which is a lap belt) (2001)(which is a lap belt) (2001)Louisiana Louisiana -- Will require "occupant restraint Will require "occupant restraint systems" (June 30, 2004)systems" (June 30, 2004)California California –– Will require Lap/Shoulder beltsWill require Lap/Shoulder belts
School buses (2005)School buses (2005)Small school buses (2004) Small school buses (2004)
School BusSchool BusResearch PlanResearch Plan
Safe Passage for America’s Children
National Highway Traffic Safety Administration
August 1998
SCHOOL BUS Safety:SCHOOL BUS Safety:

4
Statistical DataStatistical Data
The National Automotive Sampling SystemThe National Automotive Sampling System
General Estimates System (NASS GES)General Estimates System (NASS GES)
SB Statistical DataSB Statistical Data
School bus body vehiclesSchool bus body vehiclesAll school bus body vehicles, regardless of useAll school bus body vehicles, regardless of use1977 and newer (post1977 and newer (post--standard vehicles)standard vehicles)11 Crash years 11 Crash years –– 1990 through 20001990 through 2000
School Bus Body Vehicles School Bus Body Vehicles SummarySummary
~26,000 Crashes per year~26,000 Crashes per year
~10 SB Occupant fatalities/year~10 SB Occupant fatalities/year
~9,500 SB occupant injuries/year~9,500 SB occupant injuries/year
1990-2000
5
School Bus Body VehiclesSchool Bus Body VehiclesOccupant FatalitiesOccupant Fatalities
10.2 Fatalities per year10.2 Fatalities per year25% Drivers25% Drivers75% Passengers75% Passengers
School relatedSchool relatedYES YES –– 85% 85% NO NO –– 15% 15%
1990-2000
Passenger Fatalities Passenger Fatalities on SBon SB
55 Fatal passenger crashes 55 Fatal passenger crashes 5 per year5 per year
83 Passenger fatalities 83 Passenger fatalities 7.5 per/year7.5 per/year
–– 6.0 for Full6.0 for Full--sized school busessized school buses–– 1.5 for Van1.5 for Van--based school busbased school bus
1990-2000
SB Body Crash Data SB Body Crash Data Summary (90Summary (90--00)00)
7.5 passenger fatalities per year 7.5 passenger fatalities per year ~2 Passenger fatalities in frontal crashes~2 Passenger fatalities in frontal crashes
–– Target for beltsTarget for belts~2 Passenger fatalities in side crashes~2 Passenger fatalities in side crashes
–– Typically in intrusion zone (includes trains)Typically in intrusion zone (includes trains)~3.5 Include other crash and non~3.5 Include other crash and non--crash modescrash modes
–– Overturn (belts could help)Overturn (belts could help)–– RearRear–– Non collision (such as, fell from vehicle) Non collision (such as, fell from vehicle)
6
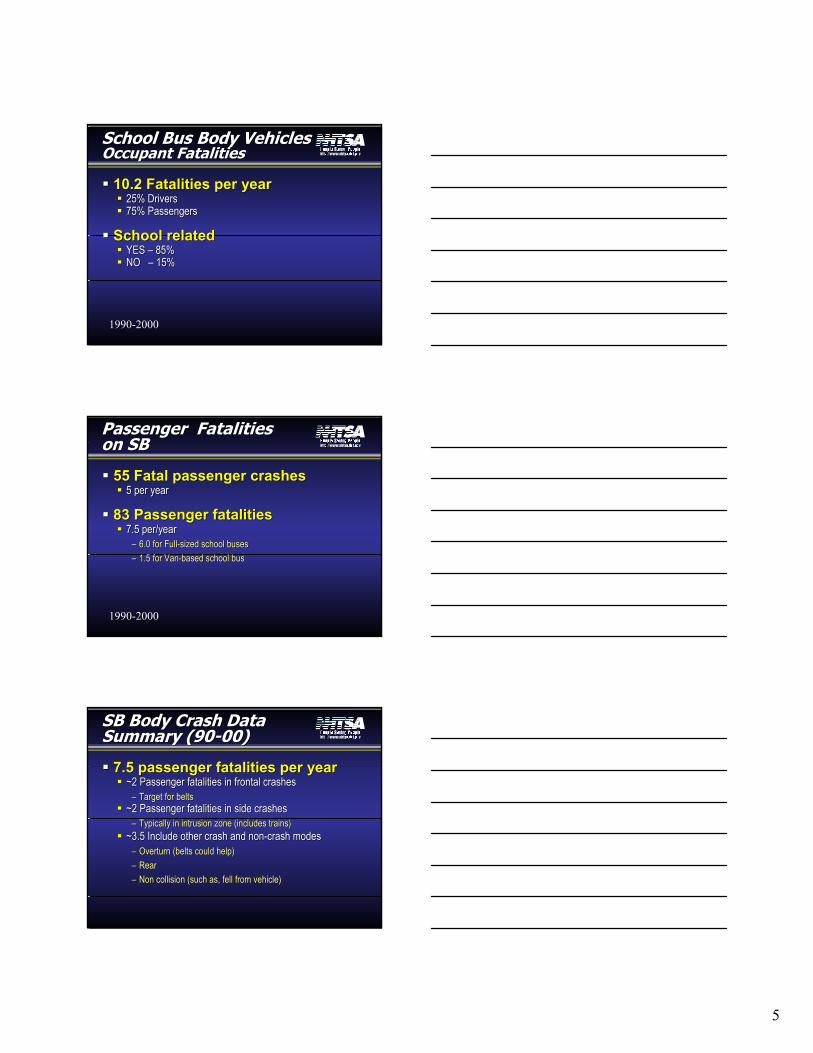
01 School Transportation01 School Transportation--Related Fatal OccupantsRelated Fatal Occupants
FatalFatal FatalitiesFatalities
CrashesCrashes DriversDrivers PassengersPassengers
School busesSchool buses 88 4 4 99
VanVan--based SBbased SB 22 11 11
Veh used as SBVeh used as SB 22 11 22
TotalTotal 1212 66 1212(Van & Shuttle Bus)(Van & Shuttle Bus)
Source 2001 FARS Annual FileSource 2001 FARS Annual File
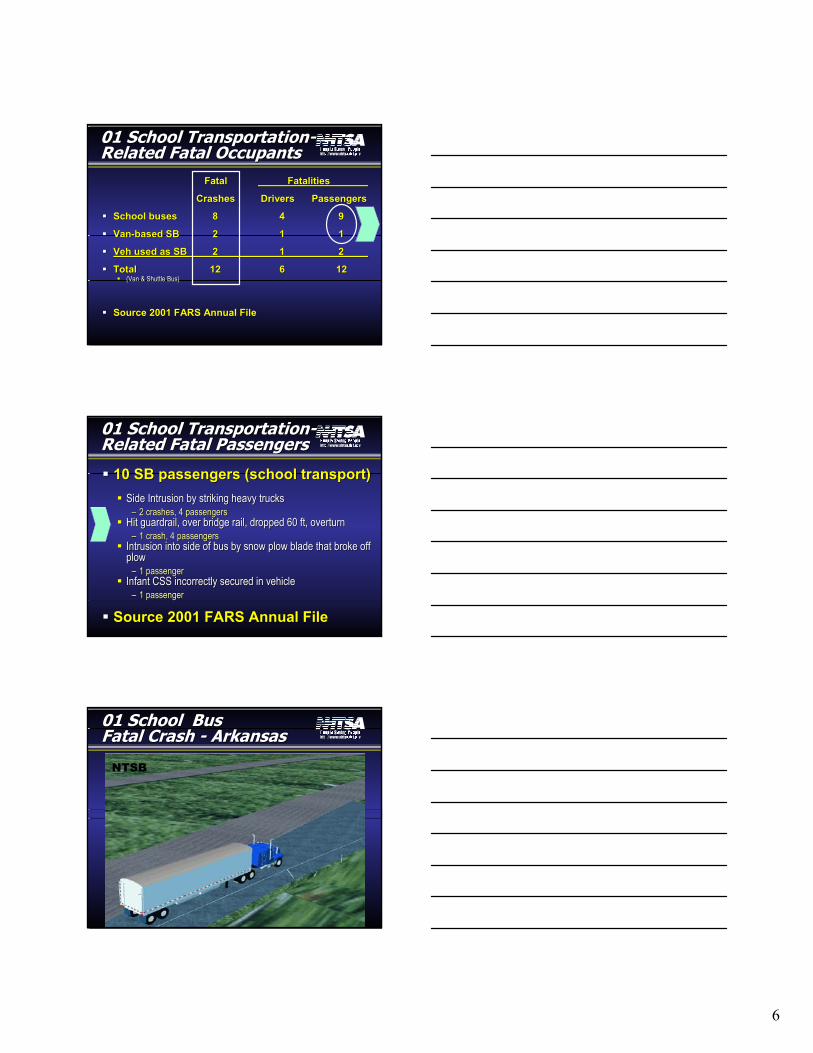
01 School Transportation01 School Transportation--Related Fatal PassengersRelated Fatal Passengers
10 SB passengers (school transport)10 SB passengers (school transport)Side Intrusion by striking heavy trucks Side Intrusion by striking heavy trucks
–– 2 crashes, 4 passengers2 crashes, 4 passengersHit guardrail, over bridge rail, dropped 60 ft, overturn Hit guardrail, over bridge rail, dropped 60 ft, overturn
–– 1 crash, 4 passengers1 crash, 4 passengersIntrusion into side of bus by snow plow blade that broke off Intrusion into side of bus by snow plow blade that broke off plow plow
–– 1 passenger1 passengerInfant CSS incorrectly secured in vehicle Infant CSS incorrectly secured in vehicle
–– 1 passenger1 passenger
Source 2001 FARS Annual FileSource 2001 FARS Annual File
01 School Bus 01 School Bus Fatal Crash Fatal Crash -- ArkansasArkansas
NTSB

7
TestingTesting
Testing ProgramTesting Program
Vehicle Tests Vehicle Tests Full scale testsFull scale testsFrontalFrontalSideSide
Laboratory TestsLaboratory TestsSled testsSled tests
Research conducted at NHTSA’s Research conducted at NHTSA’s Vehicle Research and Test Center Vehicle Research and Test Center (VRTC)(VRTC)
East Liberty, OHEast Liberty, OH
Full Scale TestsFull Scale Tests
Frontal barrier testFrontal barrier testClass “C” SBClass “C” SBFlat barrierFlat barrierStriking speed Striking speed –– 30 MPH 30 MPH
Side impact testSide impact testClass “D” SBClass “D” SBStriking vehicle Striking vehicle -- 22,26522,265--lb truck lb truck Striking speed Striking speed –– 45 mph45 mphAngle Angle -- 90 degrees90 degreesImpact point Impact point –– Left side just behind front tires on busLeft side just behind front tires on bus

8
Frontal Barrier TestFrontal Barrier TestPre Crash PhotoPre Crash Photo
Frontal Barrier TestFrontal Barrier TestOccupant Seating PositionOccupant Seating Position
Frontal Barrier Test Frontal Barrier Test -- VideoVideo

9
Frontal Barrier TestFrontal Barrier TestPost Crash PhotoPost Crash Photo
Side Impact Test Side Impact Test Pre Crash PhotoPre Crash Photo
Side Impact Test Side Impact Test Occupant Seating PositionOccupant Seating Position

10
Side Impact Test Side Impact Test -- VideoVideo
Side Impact Test Side Impact Test Post Crash PhotoPost Crash Photo
Laboratory TestingLaboratory Testing
3 Series3 SeriesBuck fabricated from SBBuck fabricated from SBGeneric (Flat plate) buckGeneric (Flat plate) buckRecent testsRecent tests
Hi severityHi severity3535--37 mph37 mph

11
Generic (Flat Plate) BuckGeneric (Flat Plate) Buck
Restraint Systems Restraint Systems EvaluatedEvaluated
CompartmentalizationCompartmentalization
Lap beltsLap belts
Lap/shoulder beltsLap/shoulder belts
New systemsNew systems
Occupant SizesOccupant Sizes
SmallSmall--sized sized studentstudent
6 year6 year--old dummyold dummy52 lbs52 lbs
MediumMedium--sized sized 12 year12 year--oldold55thth percentile female dummypercentile female dummy108 lbs108 lbs
Large high school studentLarge high school student5050th th percentile male dummypercentile male dummy172 lbs172 lbs

12
Injury AssessmentsInjury Assessments
Head Injury Criteria (HIC)Head Injury Criteria (HIC)
Neck injury criteria (Nij)Neck injury criteria (Nij)
Chest injury criteria (G’s)Chest injury criteria (G’s)
Leg injury criteria (Femur load)Leg injury criteria (Femur load)
Abdominal loadsAbdominal loadsexperimental measurement systemsexperimental measurement systems
Restraint OperationRestraint Operation
CompartmentalizationCompartmentalization
Blue Bird Bus SeatsBlue Bird Bus Seats
13
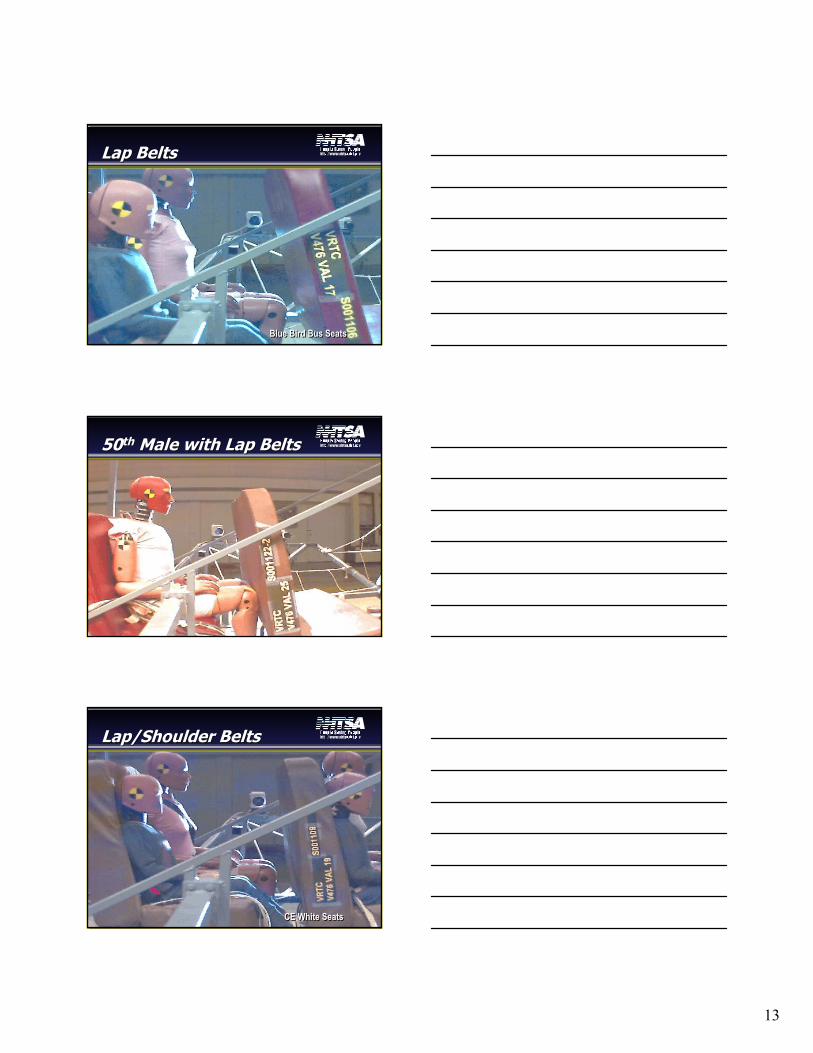
Lap BeltsLap Belts
Blue Bird Bus SeatsBlue Bird Bus Seats
5050thth Male with Lap BeltsMale with Lap Belts
Lap/Shoulder BeltsLap/Shoulder Belts
CE White SeatsCE White Seats

14
Seat Back Height Issue
Seat Back Height Issue
5050thth Male into Male into Standard Height SeatStandard Height Seat
5050thth Male into Standard Height Male into Standard Height Seat w/ 5Seat w/ 5thth Female in FrontFemale in Front
15
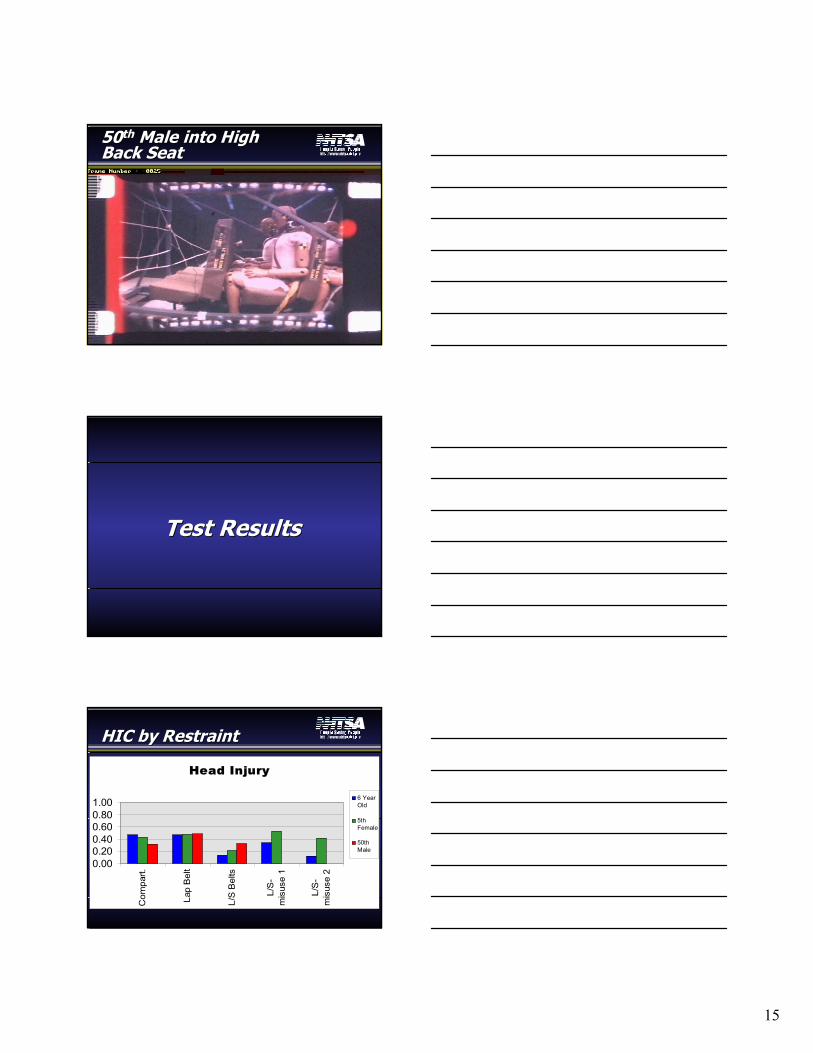
5050thth Male into High Male into High Back SeatBack Seat
Test ResultsTest Results
HIC by RestraintHIC by Restraint
Head Injury
0.000.200.400.600.801.00
Com
part.
Lap
Bel
t
L/S
Bel
ts
L/S
-m
isus
e 1
L/S
-m
isus
e 2
6 YearOld
5thFemale
50thMale

16
Nij by RestraintNij by Restraint
Neck Injury
0.000.501.001.502.002.50
Com
part
.
Lap
Bel
t
L/S
Bel
ts
L/S
-m
isus
e 1
L/S
-m
isus
e 2
6 YearOld
5thFemale
50thMale
Chest Acceleration by Chest Acceleration by RestraintRestraint
Chest Injury
0.000.200.400.600.801.00
Compart. Lap Belt L/S Belts
6 YearOld
5thFemale
50thMale
Peak Load Peak Load -- Abdominal Abdominal AreaArea
Dummy Restraint Load
6-Year-OldCompartmentalization 100 lbs (444 N)Lap belt only 291 lbs (1,293 N) Lap/shoulder belt 164 lbs (729 N)
5th Percentile FemaleCompartmentalization 135 lbs (601 N) Lap belt only 758 lbs (3,371 N) Lap/shoulder belt 308 lbs (1,372 N)

17
Conclusions from DataConclusions from Data
CompartmentalizationCompartmentalization
Low head injury values Low head injury values
Medium neck injury valuesMedium neck injury values
Seat back override in extreme Seat back override in extreme conditionsconditions
Lap BeltsLap Belts
Low head injury valuesLow head injury values
High neck injury valuesHigh neck injury valuesNij higher than compartmentalization restraintNij higher than compartmentalization restraint
Keeps passengers in their seatsKeeps passengers in their seats

18
Lap/Shoulder BeltsLap/Shoulder Belts
Low head injury values Low head injury values Lower than compartmentalization and lap belt results Lower than compartmentalization and lap belt results
Low neck injuries valuesLow neck injuries valuesLess than other restraints Less than other restraints
Keeps passengers in their seatsKeeps passengers in their seats
Restraint misuse can produce Restraint misuse can produce undesirable outcomesundesirable outcomes
Becomes lapBecomes lap--beltbelt--only like only like
Stiffer seat back possibly neededStiffer seat back possibly neededCould effect unbelted occupants behind Could effect unbelted occupants behind
Report to Congress and
News Release
Report to Congress and
News Release
Report to CongressReport to Congress
http://wwwhttp://www--nrd.nhtsa.dot.gov/departments/nrdnrd.nhtsa.dot.gov/departments/nrd--11/SchoolBus.html11/SchoolBus.html
April 2002April 2002
AbstractAbstract
Downloadable copy of full reportDownloadable copy of full report
Downloadable moviesDownloadable movies

19
News ReleaseNews Release
http://www.nhtsa.dot.gov/nhtsa/announhttp://www.nhtsa.dot.gov/nhtsa/announce/press/pressdisplay.cfm?year=2002&ce/press/pressdisplay.cfm?year=2002&filename=pr37filename=pr37--02.html02.html
NHTSA 37NHTSA 37--0202
May 7, 2002May 7, 2002
News ReleaseNews Release
Agency is considering the following Agency is considering the following changes to existing federal safety changes to existing federal safety regulationsregulations
Increase seat back height from 20 inches to 24 inches Increase seat back height from 20 inches to 24 inches Require buses under 10,000 pounds to have lap/shoulder Require buses under 10,000 pounds to have lap/shoulder restraintsrestraintsDevelop standardized test procedures for voluntarily installed Develop standardized test procedures for voluntarily installed lap/shoulder beltslap/shoulder belts
National Academy of Sciences
National Academy of Sciences

20
NAS ReportNAS Report
The Relative Risks of School Travel: The Relative Risks of School Travel: A National Perspective and Guidance A National Perspective and Guidance for Local Community Assessmentfor Local Community AssessmentSpecial Report 269 (2002) Special Report 269 (2002) Sponsored by NHTSASponsored by NHTSAPerformed by the National Research Performed by the National Research CouncilCouncil
NAS Report NAS Report -- OverviewOverview
Purpose: To help identify the risks of Purpose: To help identify the risks of school travelschool travel
The report considered six transportation The report considered six transportation modes of traveling to and from schoolmodes of traveling to and from school
School busesTransit busesMotorcoach servicesPassenger vehicles driven by individuals 19 or olderPassenger vehicles driven by operators under 19 YOPedestrians and bicyclists
NAS Report NAS Report -- FindingsFindingsEvery year, Every year, about 800 schoolabout 800 school--age children are killed in age children are killed in motor vehicle crashesmotor vehicle crashes during normal school travel during normal school travel hours hours ---- weekday mornings and afternoons during weekday mornings and afternoons during school monthsschool months
These fatalities account for about These fatalities account for about 14 percent of the 14 percent of the 5,600 child deaths5,600 child deaths that occur on the nation's that occur on the nation's roadwaysroadways
Children are at Children are at far more risk traveling to and from far more risk traveling to and from school in private passenger vehiclesschool in private passenger vehicles ---- especially if a especially if a teenteen--age driver is involved age driver is involved ---- than in school busesthan in school buses
Bicycling and walking also place students at greater Bicycling and walking also place students at greater risk than traveling by school busrisk than traveling by school bus

21
NAS Report NAS Report -- FindingsFindings
Of these 800 deathsOf these 800 deathsMost (~74 percent) occur in private passenger vehicles
More than half of all the child fatalities occur when a teenager is driving
Many (~22 percent) are the result of pedestrian or bicycle accidentsVery few (~2 percent) are school-bus related
NAS Report NAS Report •• Detailed recommendationsDetailed recommendations•• Copies of this report is available at:Copies of this report is available at:
www.nap.edu
Search for Search for ““The Relative Risks of School The Relative Risks of School Travel: A National Perspective and Guidance Travel: A National Perspective and Guidance for Local Community Risk Assessment for Local Community Risk Assessment ----Special Report 269 (2002)Special Report 269 (2002)””
Additional ResearchAdditional Research
22
Research PlanResearch Plan
VRTC VRTC –– Testing Additional Restraint Testing Additional Restraint SystemsSystems
VRTC VRTC –– Side Impact ProtectionSide Impact Protection
Mercer UniversityMercer University’’s Engineering s Engineering Research CenteResearch Centerr
VRTC Testing CompletedVRTC Testing Completed
Testing Additional Restraint SystemsTesting Additional Restraint Systems33--point seat point seat –– multi part seat system multi part seat system Inflatable restraint systemInflatable restraint system
Side Impact WorkSide Impact WorkIn progressIn progressLooking at head impactsLooking at head impacts
33-- Point Seat SystemPoint Seat System
II--MM--MM--IIIntegrated seat incorporating a three Integrated seat incorporating a three point (lap/shoulder) belt restraint point (lap/shoulder) belt restraint systemsystemProtection for both belted and Protection for both belted and unbelted occupants unbelted occupants Provides unique solution to this Provides unique solution to this design/safety issuedesign/safety issue

23
33-- Point Seat SystemPoint Seat System
33-- Point Seat SystemPoint Seat System
33-- Point Seat SystemPoint Seat System

24
Air Bag SystemAir Bag SystemAMSAFE Safety Restraint SystemAMSAFE Safety Restraint System
Developed for use on airline passenger seatsDeveloped for use on airline passenger seatsBag shape and volume fine tuned for school bus Bag shape and volume fine tuned for school bus applicationapplicationInstalled in the webbing of the lap belt and deploys Installed in the webbing of the lap belt and deploys forward and upward into the space of the wearer and the forward and upward into the space of the wearer and the seat back in frontseat back in front
Similar criteria response levels to those sled Similar criteria response levels to those sled tests involving the lap/shoulder belt tests involving the lap/shoulder belt configuration configuration Not EvaluatedNot Evaluated
Out of position occupants Out of position occupants Effects of objects in the occupants lap Effects of objects in the occupants lap
Air Bag SystemAir Bag System
Air Bag SystemAir Bag System

25
SafeSafe--TT--BarBar
Manufactured by The Majestic Manufactured by The Majestic Companies, Ltd. Companies, Ltd. Similar in concept to the lap bars Similar in concept to the lap bars frequently used in amusement park rides frequently used in amusement park rides Padded bar rests on (or near) the lap of Padded bar rests on (or near) the lap of the occupant and locks in place during a the occupant and locks in place during a crash crash It is not an appropriate restraint for It is not an appropriate restraint for higher severity environments higher severity environments
SafeSafe--TT--BarBar
Mercer University’s Mercer University’s Engineering Research CenterEngineering Research Center
Developing a finite element model of a typical Developing a finite element model of a typical school bus constructionschool bus constructionStudying the effects of sidewall padding on Studying the effects of sidewall padding on occupant protectionoccupant protectionDeveloping a finite element model Developing a finite element model countermeasure to address side impact countermeasure to address side impact excursionexcursionConsiderations are being given to the effect of Considerations are being given to the effect of seat pad contours and other parameters. The seat pad contours and other parameters. The effectiveness of restraint systems for various effectiveness of restraint systems for various size occupants is being assessedsize occupants is being assessed

26
Further Work and Further Work and DocumentationDocumentation
ESV Report on SB research (5/03)ESV Report on SB research (5/03)
Complete and document MERCComplete and document MERC’’s s research and findingsresearch and findings
Complete side impact head injury Complete side impact head injury researchresearch
NHTSA SB TeamNHTSA SB Team
This presentation brought to you by:This presentation brought to you by:Jeff Elias, TRCJeff Elias, TRCJohn Hinch NHTSA, Advanced Research and AnalysisJohn Hinch NHTSA, Advanced Research and AnalysisCharles Hott NHTSA, RulemakingCharles Hott NHTSA, RulemakingLinda McCray, NHTSA, Applied ResearchLinda McCray, NHTSA, Applied ResearchAloke Prasad, NHTSA, Applied Research, VRTCAloke Prasad, NHTSA, Applied Research, VRTCLisa Sullivan, NHTSA, Applied Research, VRTCLisa Sullivan, NHTSA, Applied Research, VRTCDon Willke, NHTSA, Applied Research, VRTCDon Willke, NHTSA, Applied Research, VRTC