school breakfast program cost/benefit analysis – extension, family living program 2007 school...
TRANSCRIPT
UW – EXTENSION, FAMILY LIVING PROGRAM
2007
School Breakfast Program Cost/Benefit Analysis
Achieving a profitable SBP Heather Hilleren, MBA
GreenLeaf Market
4 3 2 N L A K E S T , M A D I S O N W I 5 3 7 0 6

SBP
Co
st/B
en
efit
An
alys
is: E
xecu
tive
Su
mm
ary
1
Contents
Executive Summary ....................................................................................................................................... 1
Study Overview ............................................................................................................................................. 3
What are the Benefits of SBPs? .................................................................................................................... 4
Thinking of Starting an SBP? ......................................................................................................................... 5
Do SBPs Make Money? ................................................................................................................................. 8
Costs .......................................................................................................................................................... 8
Participation ............................................................................................................................................ 11
Administrative support ........................................................................................................................... 14
What are the Start-up Costs?...................................................................................................................... 16
Equipment ............................................................................................................................................... 16
Labor ....................................................................................................................................................... 16
Communication ....................................................................................................................................... 17
How can an SBP become profitable? .......................................................................................................... 18
Increase participation ............................................................................................................................. 18
Plan for normal expenses ....................................................................................................................... 19
What to charge (if at all) ......................................................................................................................... 20
What to serve .......................................................................................................................................... 23
Increase MPLH ........................................................................................................................................ 26
Track progress ......................................................................................................................................... 26
How Should a District Evaluate an SBP? ..................................................................................................... 28
Participation ............................................................................................................................................ 28
Breakfast:Lunch Ratio ............................................................................................................................. 29
Meals per labor hour (MPLH) ................................................................................................................. 30
Number of healthy meals vs. a la carte .................................................................................................. 31
Per-meal cost .......................................................................................................................................... 32
Amount of uneaten food ........................................................................................................................ 32
Student surveys ....................................................................................................................................... 32
What’s Next? (Recommendations) ............................................................................................................. 34
Works Cited ................................................................................................................................................. 35

SBP
Co
st/B
en
efit
An
alys
is: E
xecu
tive
Su
mm
ary
1
Executive Summary
Studies have shown feeding children a nutritious breakfast increases their school performance, nutrition intake, and overall health while decreasing obesity, discipline problems, and illnesses. Financially, adding a school breakfast program (SBP) creates an additional revenue stream, increases jobs, and brings outside capital into a community.
Despite these benefits, Wisconsin consistently ranks last nationally in its ability to feed children breakfast at school (School Breakfast Scorecard, 2006). Wisconsin school districts cite cost as the number one reason for not starting an SBP (Westover, 2006).
This study assesses the costs associated with SBPs to determine if breakfast programs can break-even, and if so, how they can achieve profitability.
Included are both urban and rural school districts that offer the three primary types of breakfast programs (standard, grab & go, and mid-morning) in their high schools. Seven school districts submitted financial reports and were interviewed to compile a financial analysis of SBPs. Although high schools form the primary focus of this study, elementary schools were included in the district financial analysis.
This study examined five questions:
1. What Are the Benefits of SBPs? Countless studies have proved that a nutritionally sound breakfast benefits children, parents, teachers, school districts, and the community.
Nutritional benefits
Increased nutritional intake
Decreased daily intake of fat as a percentage of calories
Decreased stomachaches and headaches
Decreased obesity and blood cholesterol levels
Decreased risk for cardiovascular disease
School performance benefits
Increased cognitive function and school performance
Increased attention spans
Decreased discipline problems
Decreased absenteeism and tardiness
Financial benefits
Bring additional funds into the school district and surrounding community
Create jobs
Increase overall financial stability of foodservice
2. Do SBPs Make Money? Yes, SBPs can be profitable. All of the high schools interviewed were able to break-even on their SBP. In half of the districts interviewed, their SBPs were more profitable than their lunch programs.
Participation is key to bringing an SBP program to profitability, and participation is greatly affected by the type of SBP offered.
Students need to have ample opportunity to purchase and consume breakfast. Offering a designated time and place for breakfast greatly increases the number of children eating breakfast and the profitability of the SBP.

SBP
Co
st/B
en
efit
An
alys
is: E
xecu
tive
Su
mm
ary
2
3. What Are the Start-up Costs? Start-up costs for SBPs have three general cost categories: equipment, labor, and communication. Of the schools interviewed, costs ranged anywhere from $0 to nearly $23,000.
Costs to begin an SBP typically align with serving needs. For this reason, costs are usually lowest for schools that already prepare and serve lunch on-site.
By planning ahead before starting an SBP, schools can greatly increase their chances of initiating a successful program.
Support was listed by Foodservice Directors as the primary reason for their SBP’s success. Gathering support before starting an SBP will help ensure a successful launch.
Participation is critical. The type of breakfast program will have a great impact on participation levels.
A high Excess Cash Balance (ECB) before starting an SBP will help cover initial startup costs.
Location of the SBP in the school can affect participation levels and meal costs.
Measuring progress will enable the Foodservice Director to monitor the health of an SBP and determine what changes will affect participation levels.
4. How Can an SBP Become Profitable? Breakfast costs did not present a financial challenge for the districts interviewed in the study. Interviewees cited participation and labor efficiencies rather than cost as primary concerns.
Of the serving types, those that set aside both a place and time for children to buy and eat breakfast together had the highest participation. Between the standard, grab & go, and mid-morning serving types, the mid-morning, in-classroom type had the highest participation levels.
A la carte breakfast did not contribute positively to the districts’ SBP profitability or nutritional goals.
SBPs can increase their profitability by: 1. Increasing participation 2. Planning for expected expenses 3. Charging appropriately 4. Serving nutritious, FAT (Fun, Attractive, Tasty) foods 5. Pricing a la carte appropriately 6. Increasing productivity (MPLH) 7. Tracking progress
5. How Should a District Evaluate an SBP? The most profitable SBPs maintained detailed reporting systems that differentiated among
programs (lunch, breakfast, and a la carte), schools, and even individual meals. The most useful data from these reports included participation levels, meals per labor hour (MPLH), and student surveys.
Conclusion
SBP profitability is closely linked to participation levels. Financial stability is less an issue of ‘costs’ than an issue of participation levels and productivity.
Schools with the highest participation in their SBP set time aside during the school day for children to eat breakfast. Districts with the highest participation levels cited administrative support as the greatest asset to the SBP. This support enabled them to implement the changes necessary to increase participation and to make the SBP profitable.
The most successful SBPs used detailed break-out reports to identify and measure how those changes benefited the SBP.

SBP
Co
st/B
en
efit
An
alys
is: S
tud
y O
verv
iew
3
Study Overview
The purpose of this study was to compile a financial cost-benefit analysis of school breakfast programs (SBPs) in seven representative school districts. Wisconsin’s low ranking (last of the 50 states) in school breakfast program participation prompted the decision to determine likely contributing factors.
The selected districts were categorized as either urban (four districts) or rural (three districts); the districts in each category were further classified by the type of breakfast served in their secondary schools (none, standard, grab & go, mid-morning).
SBP Type District Size SBP School
Standard Rural High School
Standard Urban High School
Grab & Go Urban Middle School
Grab & Go Urban High School
Mid-morning Rural High School
Mid-morning Urban High School
None Rural None
Data collection involved interviewing each selected district’s Foodservice Director, foodservice employees, and other staff and reviewing financial information provided by each district and by Wisconsin’s Department of Public Instruction (DPI). Data analysis methods are described in the section entitled How Should a District Evaluate an SBP? Briefly, the evaluation considered participation; the breakfast:lunch ratio; labor and food costs; revenue comparisons; the type, number, and cost of meals served; and the meals per labor hour (MPLH).
The study used the following definitions:
District Size:
Urban – more than 8,000 students in the district Rural – fewer than 3,000 students in the district
Breakfast Type:
Standard breakfast – served before the start of school.
Mid-morning – served any time after first period. This meal can be served in the cafeteria, hallway, or classroom.
Grab & Go – served a paper bag breakfast for consumption during class with no designated breakfast time.
Meal Preparation
Conventional – meals made ‘from scratch’. Convenience – meals are ‘heat and serve’.
Interviewers sought to determine the
financial barriers contributing to Wisconsin’s poor ranking for providing children with school breakfasts. Although high schools form the primary focus of this study, the breakfast programs at individual schools within districts varied tremendously.
This report seeks to answer the following questions:
1. What Are the Benefits of SBPs? 2. Do SBPs Make Money? What Are the Start-up Costs?
3. How Can an SBP Become Profitable? 4. How Should a District Evaluate an SBP?

SBP
Co
st/B
en
efit
An
alys
is: W
hat
Are
th
e B
enef
its
of
SBP
s?
4
What Are the Benefits of SBPs?
Providing breakfast to children still holds the greatest value opportunity for schools. Even if districts need to invest in an SBP each year, studies show that this investment will result in healthier children, lower sugar intake and obesity, fewer nurse visits, higher test scores, better attendance, longer attention spans, and fewer discipline problems. Financially, an SBP provides an additional revenue stream, creates jobs, and brings money into the local community.
A great deal of money is forgone by not taking part in the SBP. If Wisconsin provided 60 breakfasts for every 100 lunches, the state could garner nearly $15 million annually in Federal funding (School Breakfast Scorecard, 2006). As each dollar spent within a community circulates three times before leaving it, Wisconsin is missing out on $75 million in economic growth (Birkholzer, 2005).
Currently, Wisconsin ranks last nationally in its ability to feed children breakfast. In 2006, only 29.3 Wisconsin children ate breakfast for every 100 who ate lunch. In contrast, in West Virginia, 58.5 children ate breakfast for every 100 who ate lunch.
Wisconsin’s low ranking can be attributed to a lack of breakfast programs in school districts. Wisconsin ranks second to last in the nation in the percentage of schools that offer breakfast to children. Only 58% of Wisconsin schools offering lunch also offer breakfast (School Breakfast Scorecard, 2006).
One common concern about whether to offer an SBP centers on the parents’ responsibility to provide breakfast for their children. Research demonstrates that in many homes, students do not eat breakfast at home before school. Even in those homes that provide breakfast, nutritional standards rarely meet USDA school breakfast requirements (Nicklas, Bao, Webber, & Berenson, 1993).
In Wisconsin, only a third of students eat breakfast every day. Of children below the age of 15, one in ten does not eat breakfast at all. As children grow older, even fewer eat breakfast, indicating that healthy eating habits decline over time (Division for Learning and Support: Equity and Advocacy, 2005).
Benefits of nutritious SBPs include:1
Nutrition
Increase in nutritional intake (Gordon, Devaney, & Burghardt, 1995)
Decrease in daily intake of fat as a percentage of calories (Dwyer, et al., 1998)
Decrease in stomachaches and headaches (Rosales & Janowski, 2002)
Decrease in obesity and blood cholesterol levels (Nicklas, Baranowski, Cullen, & Berenson, 2001)
Decrease in risk for cardiovascular disease (Nicklas, Elkasabany, Srinivasan, & Berenson, 2001)
School performance
Increase in cognitive function and school performance (Pollitt & Mathews, 1998)
Increase in attention spans (Simeon & Grantham-McGregor, 1989)
Decrease in discipline problems (Murphy, Wehler, Pagano, Little, Kleinman, & Jellinek, 1998)
Decrease in absenteeism and tardiness (Meyers, Sampson, Weitzman, Rogers, & Kayne, 1989)
Financial
Bring additional funds into the school district and surrounding community
Create jobs
Increase overall financial stability of foodservice
By not having an SBP, districts pass up an opportunity both to improve the health and learning ability of their children and to create an additional revenue stream that can strengthen the fiscal balance of a foodservice department.
1 These data were collected from multiple
studies; the majority focused on breakfasts that met nutritional guidelines similar to the USDA’s. Children who consume an inadequate breakfast (fewer than three of the four food groups) likely will not experience the same results.

SBP
Co
st/B
en
efit
An
alys
is: T
hin
kin
g o
f St
arti
ng
an S
BP
?
5
Thinking of Starting an SBP?
Whether or not a district decides to implement an SBP, simply the process of considering one has enormous benefits. Often foodservice programs have not been assessed in years beyond bottom-line performance.
The potential advent of an SBP invites Foodservice Directors and administrators to use financial and planning tools to thoroughly review the current foodservice program. Considering an SBP enables Foodservice Directors to discuss the factors affecting the infrastructure required to feed a district’s students and to actively communicate to the district’s administration on how to improve the current foodservice program.
Presumably, this active communication is why Foodservice Directors in districts with an SBP enjoy a more supportive relationship with the administration than those in districts without SBPs (Westover, 2006). Communication between Foodservice Directors and administrators is critical because Foodservice Directors are expected to fill many roles: balancing foodservice budgets; ensuring proper nutrition to students; marketing programs; educating students and teachers; and managing and training employees.
Instead of focusing solely on meeting a school’s or a district’s immediate needs (the pattern in many districts without SBPs), having an SBP often enables the administration and Foodservice Director to maintain good, ongoing communication that supports an improved foodservice program.
Support
All Foodservice Directors interviewed believed that support for the SBP, especially from the district administration, was the chief reason for its success. Other groups taking an active interest in the success of the SBP included principals, teachers, parents, school coaches, school nurses, and school boards.
Bringing in positive, influential members from these and similar groups before starting a
breakfast program can be critical to the SBP’s success. These supporters help launch the program and help everyone adjust to the change. Transitioning to a new SBP will encounter some hurdles, despite its many benefits. Getting SBP supporters on board early enables them to assist those with difficulties during the transition.
For example, one urban district had foodservice staff in one school who fully supported the SBP, but had foodservice staff in another school who opposed starting the same type of SBP. Another urban district had teachers in one school who were enthusiastic about serving breakfast in the classroom, while teachers for the same grade level at another school strongly opposed it.
In both instances, the districts worked to overcome this initial opposition through peer mentoring. The teachers and foodservice staff who opposed the proposed SBPs consulted with their counterparts at the other schools to find out how to troubleshoot possible challenges. This approach solved the problem in both districts.
Unexpected Benefit
The decision to start an SBP prompted one rural district to assess its foodservice program for the first time in years. Each year the district funded a $10,000 foodservice deficit, assuming most small districts experienced such problems.
Instead, the district discovered that the cost of providing lunch had continued to rise (to more than $2.40), even though the price had not changed ($1.75). An initial price increase of $.25 brought in an additional $3,500 of revenues, which immediately reduced the district’s deficit. Additional price increases will be phased in to eliminate the district’s Fund 50 deficit. The SBP is now in its first year and continues to have strong support.

SBP
Co
st/B
en
efit
An
alys
is: T
hin
kin
g o
f St
arti
ng
an S
BP
?
6
Both districts in these examples recognized that administrative support made resolution possible because that support prompted teachers and foodservice staff to find solutions.
Participation
Participation is the bread and butter of any SBP. If too few students participate, breaking even becomes impossible. The type of breakfast program implemented will have a great impact on participation levels. Again and again, districts related incidents where changing how or even when they served breakfast doubled participation in less than a week. Offering the type of breakfast that produces the highest participation will be critical for success, although it might not be the easiest to schedule, or the most popular with all groups. Although any change will be challenging, the primary goal of an SBP is to encourage children to eat a complete, nutritious breakfast.
For details on increasing participation, see the Participation section under Do SBPs Make Money?
Excess Cash Balance (ECB)
SBPs, like new businesses, often need a year of adjustments to find what works best. An excess cash balance (ECB) will soften the adjustment. The districts interviewed in this study found participation and labor efficiencies to be the greatest challenges in the first year. How quickly an SBP broke even depended on how actively committed administration and foodservice were to the SBP. Districts without an ECB, that are already struggling to make current programs breakeven, are unlikely to succeed with an SBP.
Location
When a district plans to begin an SBP, starting in the best location is key to the program’s short- and long-term success.
For example, one district decided to begin its SBP in the high school because foodservice staff was already working there during breakfast time. As a result, the foodservice staff was able to serve cold breakfast with no additional labor. Profits from the breakfasts supported increased labor costs, thus enabling the addition of hot breakfast offerings.
Another district decided to start in the elementary school because the school provided substantial on-site administrative and teacher support. This program is highly successful: teachers support breakfast in the classroom, ask parents to participate, and actively encourage children to eat.
Measuring progress
Over time, if an SBP does not evolve, enthusiasm tends to wane. Successful SBPs recognize that maintaining high participation is proactive, not reactive. Ongoing reports monitor the health of an SBP, and provide rapid feedback on any changes. Consistent monthly or weekly breakout reports will identify progress or declines quickly, in time to make adjustments.
Useful reports are not necessarily technical. In one high school, foodservice staff announces
Excess Cash Balance (ECB)
Federal regulations state the “school food authority shall limit its net cash resources to an amount that does not exceed three months’ average expenditures for its nonprofit school food service or such other amount as may be approved by the state agency in accordance with 210.19(a).”
If districts carry an ECB for two years, DPI asks them to submit a plan to spend down the balance. Some districts interviewed were in the process of spending down their balance on the purchase of new equipment and/or renovating their facilities.

SBP
Co
st/B
en
efit
An
alys
is: T
hin
kin
g o
f St
arti
ng
an S
BP
?
7
the daily breakfast participation number to the Foodservice Director as she walks through the door. Everyone knows immediately if the numbers are up or down.
As a result of this ‘tally’, foodservice staff, has begun to actively talk with students as they come through the line to find new ways to make breakfast more appealing. This approach enables foodservice staff to quickly know how they are doing, understand why, make adjustments, and to almost immediately see results.
Of the districts interviewed, those that had thoroughly planned for the launch and maintenance of their SBPs met with greater success.
Districts can benefit from the resources readily available through the University of Wisconsin – Extension, the Department of Public Instruction, and the National Food Service Management Institute.
Summary
Before starting an SBP, schools can increase their success by preparing.
Support was listed by Foodservice Directors as the primary reason for their SBP’s success. Gathering support before starting an SBP will help ensure a successful launch.
Participation is critical. The type of breakfast program implemented will have a great impact on participation levels.
A high ECB before starting an SBP will help cover the initial startup costs.
Location of the SBP can affect participation levels and meal costs.
Measuring progress will enable the Foodservice Director to monitor the health of an SBP and determine which changes will affect participation levels.
SBP
Co
st/B
en
efit
An
alys
is: D
o S
BP
s M
ake
Mo
ney
?
8
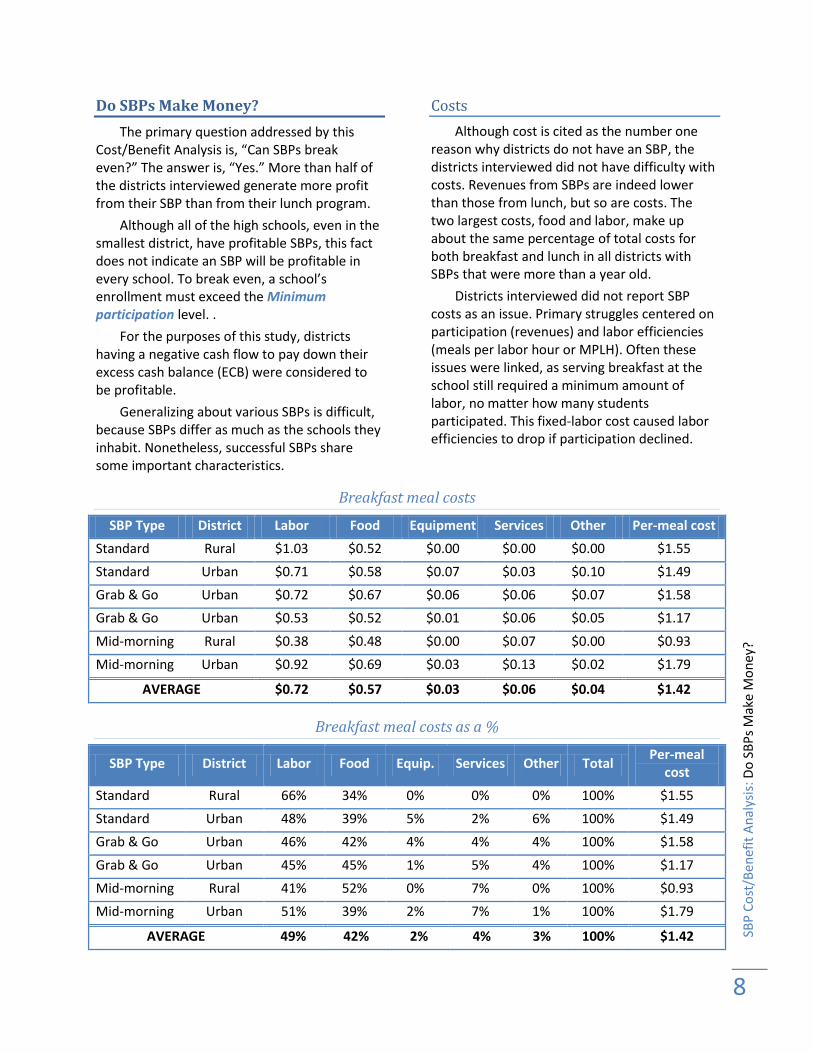
Do SBPs Make Money?
The primary question addressed by this Cost/Benefit Analysis is, “Can SBPs break even?” The answer is, “Yes.” More than half of the districts interviewed generate more profit from their SBP than from their lunch program.
Although all of the high schools, even in the smallest district, have profitable SBPs, this fact does not indicate an SBP will be profitable in every school. To break even, a school’s enrollment must exceed the Minimum participation level. .
For the purposes of this study, districts having a negative cash flow to pay down their excess cash balance (ECB) were considered to be profitable.
Generalizing about various SBPs is difficult, because SBPs differ as much as the schools they inhabit. Nonetheless, successful SBPs share some important characteristics.
Costs
Although cost is cited as the number one reason why districts do not have an SBP, the districts interviewed did not have difficulty with costs. Revenues from SBPs are indeed lower than those from lunch, but so are costs. The two largest costs, food and labor, make up about the same percentage of total costs for both breakfast and lunch in all districts with SBPs that were more than a year old.
Districts interviewed did not report SBP costs as an issue. Primary struggles centered on participation (revenues) and labor efficiencies (meals per labor hour or MPLH). Often these issues were linked, as serving breakfast at the school still required a minimum amount of labor, no matter how many students participated. This fixed-labor cost caused labor efficiencies to drop if participation declined.
Breakfast meal costs
SBP Type District Labor Food Equipment Services Other Per-meal cost
Standard Rural $1.03 $0.52 $0.00 $0.00 $0.00 $1.55
Standard Urban $0.71 $0.58 $0.07 $0.03 $0.10 $1.49
Grab & Go Urban $0.72 $0.67 $0.06 $0.06 $0.07 $1.58
Grab & Go Urban $0.53 $0.52 $0.01 $0.06 $0.05 $1.17
Mid-morning Rural $0.38 $0.48 $0.00 $0.07 $0.00 $0.93
Mid-morning Urban $0.92 $0.69 $0.03 $0.13 $0.02 $1.79
AVERAGE $0.72 $0.57 $0.03 $0.06 $0.04 $1.42
Breakfast meal costs as a %
SBP Type District Labor Food Equip. Services Other Total Per-meal
cost
Standard Rural 66% 34% 0% 0% 0% 100% $1.55
Standard Urban 48% 39% 5% 2% 6% 100% $1.49
Grab & Go Urban 46% 42% 4% 4% 4% 100% $1.58
Grab & Go Urban 45% 45% 1% 5% 4% 100% $1.17
Mid-morning Rural 41% 52% 0% 7% 0% 100% $0.93
Mid-morning Urban 51% 39% 2% 7% 1% 100% $1.79
AVERAGE 49% 42% 2% 4% 3% 100% $1.42

SBP
Co
st/B
en
efit
An
alys
is: D
o S
BP
s M
ake
Mo
ney
?
9
Food costs for the entire foodservice often decrease when an SBP is launched. Increasing the quantity of food purchased often leads to price discounts. For example, most foodservice vendors will offer better prices for larger orders and fewer deliveries.
Although price and quality are very important considerations for any SBP, even more important is whether students will eat the food provided. If the students refuse to eat the food, regardless of its quality or price, then the SBP loses its efficacy.
The cost of food for a single breakfast ranged between $0.48–0.69 and 34–52% of total costs. Cost differences stemmed from quality, quantity, and preparation differences.
Serving a quality breakfast is perceived as a struggle for many districts. Two districts interviewed felt that foods meeting USDA nutritional standards cost more than less
healthy options. Nonetheless, these districts opted for healthier breakfast choices because of both better nutritional content and higher sales when fresher, healthier options were made available. Those schools that made an effort to serve meals higher in nutritional value found their sales went up, offsetting the cost to provide those meals.
Interestingly, the districts with the lowest food costs and per-meal costs were not the largest districts, but the districts that made a majority of their meals ‘from scratch’, even baking bread. By purchasing fewer processed foods, the smallest district spent $0.21 less per meal for breakfast foods than the largest district.
Labor costs did not offset the total cost. The two smallest districts also had the lowest per-meal costs ($2.18 and $2.16 for lunch and $0.93 for breakfast).
Food as a % of meal cost
SBP type Location Lunch Total meals
Food cost per meal
SBP Total meals
Food cost per meal
SBP/Lunch difference
Standard Rural 33.3% 274,602 $0.81 33.5% 28,441 $0.52 64.2%
Standard Urban 38.9% 930,304 $0.82 38.9% 50,034 $0.58 70.7%
Grab & Go Urban 32.5% 913,269 $0.88 42.4% 212,410 $0.67 76.1%
Grab & Go Urban 45.0% 846,254 $1.03 44.0% 87,459 $0.52 50.5%
Mid-Morn* Rural 30.0% 104,308 $0.66 52.0% 10,507 $0.48 72.7%
Mid-Morn. Urban 36.5% 1,033,910 $0.80 38.5% 216,453 $0.69 86.3%
None Rural 56.9% 194,105 $0.73
*first year of SBP, adjusted based on 2004–05 data
SBP
Co
st/B
en
efit
An
alys
is: D
o S
BP
s M
ake
Mo
ney
?
10
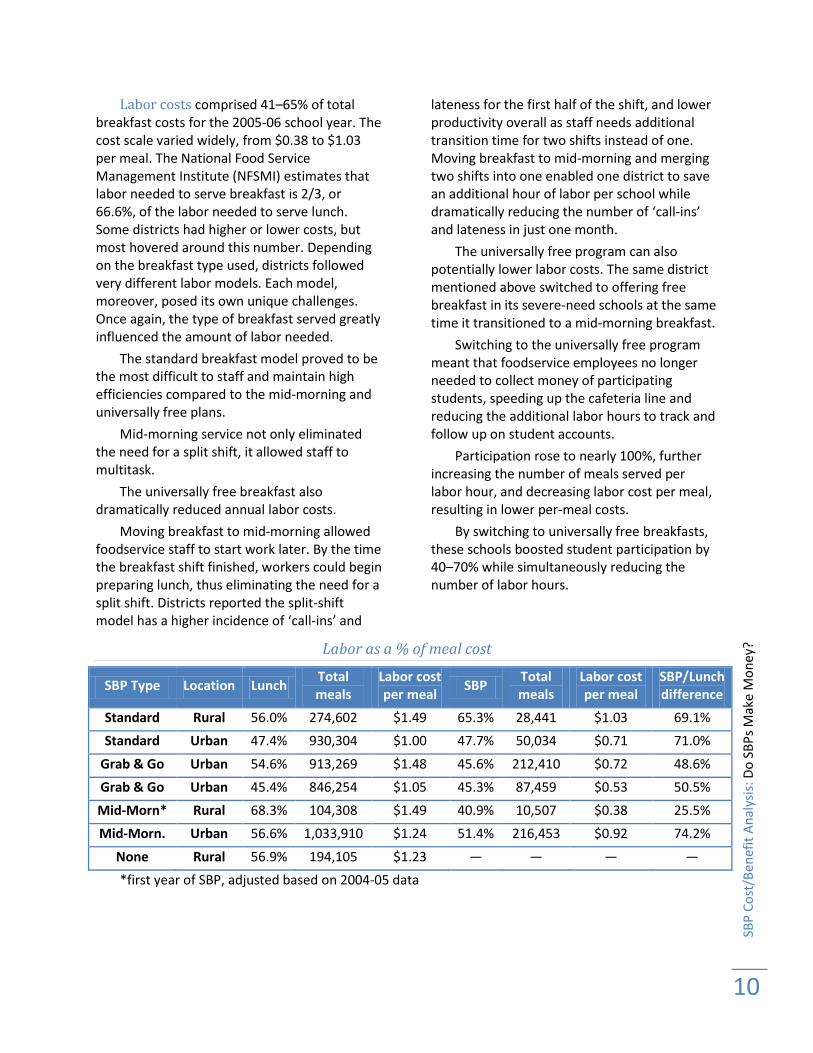
Labor costs comprised 41–65% of total breakfast costs for the 2005-06 school year. The cost scale varied widely, from $0.38 to $1.03 per meal. The National Food Service Management Institute (NFSMI) estimates that labor needed to serve breakfast is 2/3, or 66.6%, of the labor needed to serve lunch. Some districts had higher or lower costs, but most hovered around this number. Depending on the breakfast type used, districts followed very different labor models. Each model, moreover, posed its own unique challenges. Once again, the type of breakfast served greatly influenced the amount of labor needed.
The standard breakfast model proved to be the most difficult to staff and maintain high efficiencies compared to the mid-morning and universally free plans.
Mid-morning service not only eliminated the need for a split shift, it allowed staff to multitask.
The universally free breakfast also dramatically reduced annual labor costs.
Moving breakfast to mid-morning allowed foodservice staff to start work later. By the time the breakfast shift finished, workers could begin preparing lunch, thus eliminating the need for a split shift. Districts reported the split-shift model has a higher incidence of ‘call-ins’ and
lateness for the first half of the shift, and lower productivity overall as staff needs additional transition time for two shifts instead of one. Moving breakfast to mid-morning and merging two shifts into one enabled one district to save an additional hour of labor per school while dramatically reducing the number of ‘call-ins’ and lateness in just one month.
The universally free program can also potentially lower labor costs. The same district mentioned above switched to offering free breakfast in its severe-need schools at the same time it transitioned to a mid-morning breakfast.
Switching to the universally free program meant that foodservice employees no longer needed to collect money of participating students, speeding up the cafeteria line and reducing the additional labor hours to track and follow up on student accounts.
Participation rose to nearly 100%, further increasing the number of meals served per labor hour, and decreasing labor cost per meal, resulting in lower per-meal costs.
By switching to universally free breakfasts, these schools boosted student participation by 40–70% while simultaneously reducing the number of labor hours.
Labor as a % of meal cost
SBP Type Location Lunch Total meals
Labor cost per meal
SBP Total meals
Labor cost per meal
SBP/Lunch difference
Standard Rural 56.0% 274,602 $1.49 65.3% 28,441 $1.03 69.1%
Standard Urban 47.4% 930,304 $1.00 47.7% 50,034 $0.71 71.0%
Grab & Go Urban 54.6% 913,269 $1.48 45.6% 212,410 $0.72 48.6%
Grab & Go Urban 45.4% 846,254 $1.05 45.3% 87,459 $0.53 50.5%
Mid-Morn* Rural 68.3% 104,308 $1.49 40.9% 10,507 $0.38 25.5%
Mid-Morn. Urban 56.6% 1,033,910 $1.24 51.4% 216,453 $0.92 74.2%
None Rural 56.9% 194,105 $1.23 — — — —
*first year of SBP, adjusted based on 2004-05 data

SBP
Co
st/B
en
efit
An
alys
is: D
o S
BP
s M
ake
Mo
ney
?
11
Participation
Participation is often the primary deciding factor whether an SBP is profitable. All schools need a minimum amount of participation to break even. Calculating this number before beginning an SBP will help foodservice and administration estimate how much time is needed for the SBP to reach profitability, and to know when it will be necessary to adjust a current program.
High participation numbers are also why some districts can achieve a high ECB, allowing for additional equipment and cafeteria renovations.
When investing in new equipment or starting a new program, it is important to consider how the added revenues from increased participation may help to support the cost of additional labor or equipment.
The type of SBP implemented influences how convenient it is for a child to buy and eat breakfast and thus will significantly impact participation levels. Two schools interviewed described how changing their SBP type dramatically increased their participation rate, overnight.
When starting a new program, performing a minimum participation assessment will help to determine the type of program needed to sustain those minimum participation levels.
Changes in a program, such as setting aside time for children to eat breakfast in class, will be easier to implement if the administration can demonstrate the likely impact on participation levels. Administrators and teachers will need justification for any changes in their schedule. One school interviewed sent out a ‘thank you’ in the school newsletter, informing parents and teachers of the participation impact of switching to mid-morning breakfast.
Different participation scenarios and minimum participation levels can be calculated using the University of Wisconsin–Extension’s spreadsheet titled School Breakfast Program Reports.
Minimum participation
Serving breakfast requires a minimum amount of labor for preparation, setup, and service. This fixed cost persists regardless of how many children choose to eat. Therefore, a minimum number must take part in the SBP for it to break even. This number will differ for each school, depending on the SBP type and location.
Obviously, if the minimum participation level is greater than the school’s enrollment, a SBP will likely not be successful, unless costs can be reduced. If the minimum participation level is close to full enrollment, it may be necessary to integrate breakfast into the school day.
Successful SBPs clearly communicated the minimum participation number to foodservice staff. When asked why their staff was so enthusiastic about the breakfast program, districts answered similarly. “[Our staff] knows that high participation numbers mean job security.”
Of the three breakfast types, a standard breakfast required the least amount of labor when served from a central kitchen.
A grab & go breakfast required additional labor to pack the breakfasts. Often the meal was sold from a separate station requiring a staff member to be present. This prevented the staff member from multitasking and limited the amount of time meals could be sold.
A mid-morning breakfast in the classroom requires less labor than a grab & go breakfast, because a staff member does not have to package individual meals, take the time to sell individually to each student, and take a meal count. Instead, meals are delivered in crates instead of bags and meal counts are taken by teachers, then tallied by a staff member working in the office.
Transportation, serving, and selling time will greatly increase the minimum number of labor hours needed to serve a school if the school does not have a preparation kitchen. Some of these costs can be reduced or eliminated by choosing a different SBP type.

SBP
Co
st/B
en
efit
An
alys
is: D
o S
BP
s M
ake
Mo
ney
?
12
Example
Below is an example of a high school’s minimum participation level calculation. Taking the average meal cost from the districts interviewed, the cost of serving a meal is $0.70 without labor.
The estimated minimum amount of labor to prepare and serve breakfast at the high school level in both urban and rural districts was two hours daily. Pay and benefits for two hours of labor costs $27.03
By dividing the cost of labor by the revenue left to pay for labor, this school needs to have 38 students participate in the breakfast program daily to break even.
Meal cost without labor
Food cost per meal
Equipment Purchased
services Other
Meal cost without labor
$0.57 + $0.03 + $0.06 + $0.04 = $0.70
Income without labor
Revenue per meal
Meal cost (no labor)
Revenue per meal (no labor)
$1.41 - $0.70 = $0.71
Minimum amount of labor needed
Minimum hours
Labor cost per hour
Minimum labor cost
2 X $13.65 = $27.03
Minimum participation
Minimum labor cost
Revenue per meal (no labor)
Number of meals to break-even
$27.03 ÷ $0.71 = 38
SBP type
Participation is the most important determinant whether a district can break even on an SBP. Districts with higher participation generate higher revenues at a lower cost per meal.
The greatest commonality among districts with high participation rates has been how easy and convenient it is for the children to buy and eat breakfast, which is largely determined by the type of SBP. A standard breakfast that is not integrated into the school day interferes least with school schedules, but greatly reduces the opportunities for students to buy and eat breakfast.
Of the high schools interviewed, those that offered a designated time and place for breakfast had the highest participation rates, while those with a limited window for
purchasing and eating had the lowest participation rates.
The best example of this can be seen by comparing the two large districts with a grab & go breakfast. In one, no food was allowed outside of the cafeteria. In the other, teachers encouraged students to grab a breakfast and eat in the classroom. The result was an 18% difference in participation levels.
The same cafeteria-bound SBP showed it could attain higher participation rates by giving students time for breakfast during Breakfast Week. Each day, the homeroom teachers brought their classes to the cafeteria for breakfast. For each grade level brought to the cafeteria, participation jumped to more than 75%.
One district interviewed had started a standard breakfast program in their elementary

SBP
Co
st/B
en
efit
An
alys
is: D
o S
BP
s M
ake
Mo
ney
?
13
school three months before this study. Participation remained below 5% for the first month. Realizing the students did not have enough time to purchase and eat breakfast, they switched to a mid-morning breakfast. Participation increased by 25% overnight.
Although changing the type of breakfast may affect class schedules, the benefits affect students, teachers, administrators, foodservice, parents, and the community. As discussed in
the Benefits of nutritious SBPs include: section, increasing breakfast participation results in healthier children, lower sugar intake and obesity, fewer nurse visits, higher test scores, better attendance, longer attention spans, and fewer discipline problems. Financially, increasing participation provides an additional revenue stream, creates jobs, and brings money into the local economy.
SBP type participation levels in high schools
SBP type Size In-class SBP age Students HS Participation
Standard Rural None 1 2,631 911 12%
Standard Urban Few 1 10,050 1,451 7%
Grab & Go Urban None 5 10,280 1,844 3%
Grab & Go* Urban Most 18 10,210 934 21%
Mid M. Rural Most 1 780 380 30%
Mid M. Urban Some 17 8,071 1,451 17%
*Middle school
100% Participation
100% participation can be reached by changing expectations. Instead of assuming children will eat breakfast at home, some schools expect and encourage children to eat together at school, just as they do for lunch.
One district found it could increase participation to nearly 100% in a non-severe-need school by changing the SBP type.
The elementary classrooms already served a Mid-morning Nutrition Break to students. Each week a student was chosen to bring either the snack or a donation to purchase the snack. Not all students could afford to contribute. To compensate, some students were asked to make additional donations.
By switching from the Mid-morning Nutrition Break to breakfast, free and reduced students were no longer asked to contribute money and others were not asked to contribute more than their share. Teachers no longer
needed to plan menus, purchase snacks, or remind parents to participate. The nutritional value of the break has increased considerably.
All students eat together in the classroom, eliminating the stigma of breakfast as a ‘poor kid’s’ meal.
Teachers now expect that all students will eat breakfast and hold students accountable when they try to skip the most important meal of the day.
Breakfast participation increased from 7% to nearly 100% in the example school (see below).
Not shown below is the amount of labor hours saved. The Foodservice Director reduced the amount of labor needed to serve the school because teachers documented the number of meals and students picked up breakfast bins for the classrooms.
The result of changing the SBP type increased revenues by nearly $61,000.

SBP
Co
st/B
en
efit
An
alys
is: D
o S
BP
s M
ake
Mo
ney
?
14
Standard school breakfast program (previous)
Students Days Price
Fed & state aid
Per-meal revenue
Quantity sold
Revenue Partici-pation
Paid students
215 176 $1.05 $.34 $1.39 528 $734 1.4%
Reduced students
15 176 $0.30 $1.11 $1.41 704 $993 26.7%
Free students
43 176 $0.00 $1.41 $1.41 2112 $2,978 27.9%
Total 273 — — — — 3344 $4,704 7.0%
Mid-morning school breakfast program (current)
Students Days Price Fed & state aid
Per-meal revenue
Quantity sold
Revenue Partici-pation
Paid students
215 176 $1.05 $.34 $1.39 37,083 $51,545 98%
Reduced students
15 176 $0.30 $1.11 $1.41 2,587 $3,648 98%
Free students
43 176 $0 $1.41 $1.41 7,417 $10,458 98%
Total 273 — — — — 47,087 $65,651 98%
Administrative support
All school districts encountered challenges when implementing an SBP, or when attempting to alter an existing SBP. Whether these challenges arose from a principal resisting a schedule change, teachers not wanting food in the classroom, or parents insisting it is not the school’s place to feed children, the solution always involved the administrator.
All districts that implemented an SBP within the past two years faced challenges. Administrators, teachers, parents, and occasionally a Foodservice Director might protest beginning a SBP. Low initial participation, low foodservice productivity, and low funding for startup were other hurdles new SBPs encountered.
The three districts that started their SBP the previous year could break even by the second year. All of these districts encountered challenges in the first year of the program; however, rather than aborting their efforts, they sought and implemented innovative solutions.
In nearly all cases, these solutions were implemented faster by having administrative support.
The most successful districts keep their administrator informed as they continuously work to resolve various challenges, especially the ever-present issue of how to increase and maintain participation.
To do so, they actively survey the students, track meal preferences, and give productivity feedback to the staff. They assess each menu item for nutrition and its FAT (Fun, Attractive,

SBP
Co
st/B
en
efit
An
alys
is: D
o S
BP
s M
ake
Mo
ney
?
15
Tasty) qualities, always seeking new ways to bring healthy choices into the menu. They set goals and hold regular meetings to assess whether they have met their goals. They always strive to surpass their goals.
Most of all, they work to change
perceptions of school breakfast from a ‘poor kid’s’ meal to a part of the regular school day. Changing perceptions, and often the class schedule, is difficult if not impossible without administrative support.
Summary
SBPs can be profitable. All of the high schools interviewed were able to breakeven on their SBP and half had SBPs more profitable than their lunch programs.
Participation is key to bringing an SBP program to profitability, and participation is greatly affected by the type of SBP offered. Students need to have an ample opportunity to purchase and consume breakfast. Offering a designated time and place for breakfast greatly increases the number of children eating breakfast and the profitability of the SBP.
A Rough Start
A rural elementary school decided to start a breakfast program. In the beginning, administration and teachers supported the SBP as long as it remained outside of the classroom and did not infringe on time meant for education. Keeping this in mind, they decided on a standard, before-school breakfast.
Every person recalling that first month of the standard breakfast describes it as nothing short of chaos. Students were unsure where to go, when to go, or what to do when they got there. Even with monitors, the breakfast area was a noisy frenzy. Those students who made it through the food line had no time to eat, or were simply too distracted by the surrounding activity to eat. Some students had woken up less than an hour before arriving at school and just looked at their food blankly. Most of the food served ended up in the trash. Participation was extremely low (single digit) and likely decreasing. The frustrated foodservice was ready to drop the program.
To remedy the problem, a mid-morning breakfast program was proposed. Teachers resisted at first, arguing that class time would be disrupted and messy meals would be unmanageable. Now teachers were calling for an end to the breakfast program.
No agreements were reached, yet teachers agreed to try the mid-morning breakfast program, even though they were convinced that it would not work.
In this new approach, bagged breakfasts were delivered the previous day with lunch, and refrigerated overnight. The next day, students were given breakfast following the first period of class.
Participation in breakfast jumped 30% the first week. The school nurse began noticing fewer visits to her office, and fewer students complaining of headaches and stomachaches. Teachers began noticing changes in student behavior and increased attention spans.
Details such as cleanup were quickly worked out. Teachers taught during the breakfast break, using it for reading time or instruction. Only one month after the initial change, administration, teachers, and foodservice voted to keep the mid-morning breakfast program. Now six months after the start, the SBP enjoys more support than ever.

SBP
Co
st/B
en
efit
An
alys
is: W
hat
Are
th
e St
art-
up
Co
sts?
16
What Are the Start-up Costs?
Start-up costs for SBPs have three general cost categories: equipment, labor, and communication. Of the schools interviewed, costs ranged anywhere from no additional cost to nearly $23,000.
Costs to begin an SBP typically align with serving needs. For this reason, costs are usually lowest for those schools that already prepare and serve lunch on site.
Equipment
Additional equipment is needed when breakfast will be served differently from lunch. In most locations, this has been the case. For example, off-site locations may need refrigeration units ($2,758), serving carts ($474), or additional thermal crates for transportation.
Some districts have re-evaluated their current kitchen needs to include larger equipment necessary for the entire foodservice operation. When this is the case, the costs of such equipment should be divided proportionally among all meal categories, based on equipment use for each meal category.
Breakfast equipment
Reach-in refrigerator $4,500
Refrigerator $2,758
Wireless register $1,660
Toaster $935
Serving cart $474
Labor
Labor start-up costs are determined by finding the higher of (1) the amount of labor needed to cover the estimated participation or (2) the minimum amount of labor needed to serve the school breakfast.
Calculating serving time
Assuming that the school will reach its minimum participation level, the labor needed to serve can be calculated by:
Example
A high school estimates its initial breakfast participation will be 150 students each day.
Since the school’s foodservice staff can prepare three breakfasts in the time it takes to prepare two lunches, their meal equivalency (ME) is 100 meals. (see Calculating meal equivalents (ME)).
ME = 150 X 2/3 = 100
Their meals per labor hour (MPLH) is 20.
Therefore, they will need to schedule 5 hours of labor time to serve breakfast (see Calculating MPLH).
Labor needed = 100 ÷ 20 = 5 hours
Estimating the number of meals to be served
Calculating the meal equivalanceis (ME)
Dividing by the meal per labor hour (MLPH) rate

SBP
Co
st/B
en
efit
An
alys
is: W
hat
Are
th
e St
art-
up
Co
sts?
17
Minimum labor for breakfast
Districts interviewed needed from one hour to five hours of labor for their SBP depending on the location, serving type, meal selection, and participation level. A school housing a distribution kitchen and serving a cold breakfast will need less time to serve. A school with off-site preparation, serving a standard breakfast (requiring an additional shift), serving meals made from scratch, and/or bagging the meals will require more labor.
The districts interviewed average two hours of labor time for an on-site breakfast program. Grab & Go had slightly higher labor costs due to bagging time.
The off-site schools interviewed used an average of 3.5 hours of labor to prepare, transport and serve a cold breakfast.
If the minimum participation level will be exceeded, plan for an increase in labor to coincide with an increase in participation.
Communication
Communication will be an ongoing cost. Whether it is informing children and parents about a new SBP, boosting excitement about an existing program, conducting surveys, or even preparing the monthly menu calendar, each task takes time and resources.
Starting a breakfast program may require additional meeting time and notifications, thus adding to the cost of starting an SBP.
One district estimated it would need a dietician ($50.00/meeting) to lead a staff meeting (30 staff at $15.50 each for meeting stipend), posters and flyers ($390.00) to announce their breakfast program, attendance at the state SBP meeting ($450 for gas, food, and lodging), and giving each student five free breakfasts and one parent a free breakfast during National SB Week ($2,750.00) for a total of $4,105.00 in communication costs.
Preparing and budgeting for these ongoing costs reminds administrators and staff that communication is an expectation, not an afterthought.
A Shoestring Budget
One rural district interviewed had no additional funds to begin a high school breakfast program but decided they could ‘make do’ with what they had.
Without money for a serving table, fold-up tables were set up in the school hallway. Without money for equipment, they started by offering a cold breakfast. Without money for labor, the staff was able to increase labor productivity, using the extra time to set up breakfast.
Now in its second year, this breakfast program has taken off. Revenues from breakfast were put back into the foodservice program to raise the quality of offerings. A hot breakfast is now offered daily in addition to cold choices. Backlit signs advertise the daily menu throughout the school. Best of all, participation is at 12% and increasing every day.
Summary
Start-up costs for SBPs have three general cost categories: equipment, labor, and communication. Of the schools interviewed, costs ranged anywhere from no additional cost to nearly $23,000.
Costs to begin an SBP typically align with serving needs. For this reason, costs are usually lowest for those schools that already prepare and serve lunch on site.
SBP
Co
st/B
en
efit
An
alys
is: H
ow
Can
an
SB
P B
eco
me
Pro
fita
ble
?
18
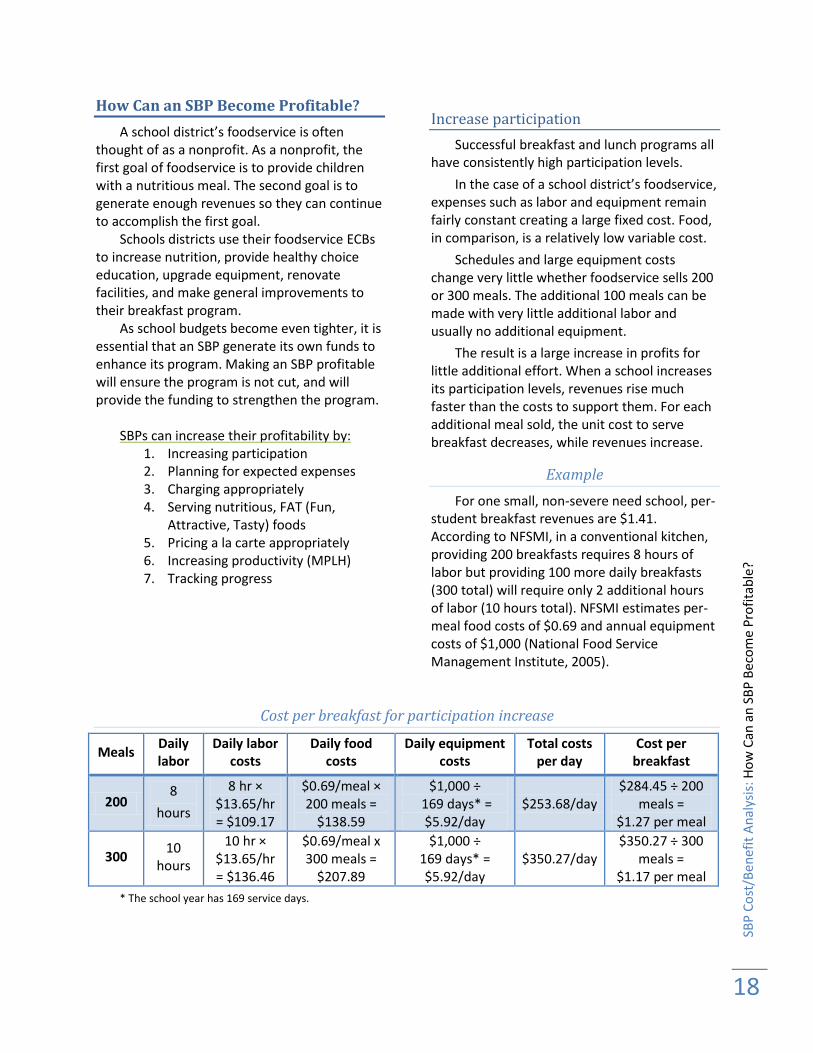
How Can an SBP Become Profitable?
A school district’s foodservice is often thought of as a nonprofit. As a nonprofit, the first goal of foodservice is to provide children with a nutritious meal. The second goal is to generate enough revenues so they can continue to accomplish the first goal.
Schools districts use their foodservice ECBs to increase nutrition, provide healthy choice education, upgrade equipment, renovate facilities, and make general improvements to their breakfast program.
As school budgets become even tighter, it is essential that an SBP generate its own funds to enhance its program. Making an SBP profitable will ensure the program is not cut, and will provide the funding to strengthen the program.
SBPs can increase their profitability by:
1. Increasing participation 2. Planning for expected expenses 3. Charging appropriately 4. Serving nutritious, FAT (Fun,
Attractive, Tasty) foods 5. Pricing a la carte appropriately 6. Increasing productivity (MPLH) 7. Tracking progress
Increase participation
Successful breakfast and lunch programs all have consistently high participation levels.
In the case of a school district’s foodservice, expenses such as labor and equipment remain fairly constant creating a large fixed cost. Food, in comparison, is a relatively low variable cost.
Schedules and large equipment costs change very little whether foodservice sells 200 or 300 meals. The additional 100 meals can be made with very little additional labor and usually no additional equipment.
The result is a large increase in profits for little additional effort. When a school increases its participation levels, revenues rise much faster than the costs to support them. For each additional meal sold, the unit cost to serve breakfast decreases, while revenues increase.
Example
For one small, non-severe need school, per-student breakfast revenues are $1.41. According to NFSMI, in a conventional kitchen, providing 200 breakfasts requires 8 hours of labor but providing 100 more daily breakfasts (300 total) will require only 2 additional hours of labor (10 hours total). NFSMI estimates per-meal food costs of $0.69 and annual equipment costs of $1,000 (National Food Service Management Institute, 2005).
Cost per breakfast for participation increase
Meals Daily labor
Daily labor costs
Daily food costs
Daily equipment costs
Total costs per day
Cost per breakfast
200 8
hours
8 hr × $13.65/hr = $109.17
$0.69/meal × 200 meals =
$138.59
$1,000 ÷ 169 days* =
$5.92/day $253.68/day
$284.45 ÷ 200 meals =
$1.27 per meal
300 10
hours
10 hr × $13.65/hr = $136.46
$0.69/meal x 300 meals =
$207.89
$1,000 ÷ 169 days* = $5.92/day
$350.27/day $350.27 ÷ 300
meals = $1.17 per meal
* The school year has 169 service days.

SBP
Co
st/B
en
efit
An
alys
is: H
ow
Can
an
SB
P B
eco
me
Pro
fita
ble
?
19
Increasing participation by 100 breakfasts (from 200 to 300 breakfasts), will enable this school to lower its per-breakfast costs by $0.10. Over the course of a year, this additional participation will create an additional $7,500 in profit.
Profit for participation increase
Meals Cost per
meal
Revenue per meal
Costs per day
Revenue per day
Annual service
days
Annual costs
Annual revenue
Annual profit
200 $1.27 $1.41 200 meals × $1.27 = $253.68
200 meals × $1.41 = $282
169 169 days × $253.68 = $42,871.92
169 days × $282 = $47,658
$4,786
300 $1.17 $1.41 300 meals × $1.17 = $350.27
300 meals × $1.41 = $423
169 169 days × $350.27 = $59,195.63
169 days × $423 = $71,487
$12,291
As discussed earlier in SBP type on page 12, how breakfast is served will significantly affect participation. Many schools doubled or tripled their participation levels in less than a week simply by changing the SBP type offered.
Participation also measures the popularity of individual breakfast offerings. Long-term tracking that links participation levels to menu items can provide a much more reliable assessment tool than merely having a ‘feel’ for which items are popular.
A school offering multiple breakfast choices will want to track participation levels for individual meals and for meal combinations. Corn flakes may get high participation levels when paired with a breakfast burrito, but low levels on a breakfast pizza day.
Some schools found certain days of the week, in their case Monday, have the lowest participation. By moving their most popular breakfast items to those days, they are able to increase participation for the entire week.
Tracking does not need to be complex. One school used its monthly menu calendar to track participation, writing down next to each menu item how many had been purchased that day. At a glance they could see which items were popular, which were not, and which menu combinations brought in the highest overall participation numbers.
Plan for Normal Expenses
Most districts interviewed based their budgets on the previous year’s numbers. Four districts factored in likely future expenses that were not realized in the previous year. These expenses included equipment, communication, and renovations.
Factoring equipment into the foodservice budget is critical. Not budgeting each year for equipment maintenance or future replacement means that the district has deferred major costs. The costs will certainly be incurred and paid, but no one knows exactly when.
Properly maintaining equipment increases its useful life and reduces the chance of an expensive, catastrophic, or emergency equipment failure. Equally important, a servicing company can often accurately determine how much longer equipment will last. For example, when one small district’s refrigeration system failed completely, the district had to immediately transfer money from other funds to pay for the repairs.
Another district interviewed keeps a complete financial breakout of all equipment, the annual depreciation, maintenance records and schedule, and expected replacement date. Depreciating the equipment each year helped to offset income and eased preparing for purchase of a replacement. This district knew
SBP
Co
st/B
en
efit
An
alys
is: H
ow
Can
an
SB
P B
eco
me
Pro
fita
ble
?
20
exactly how much to budget for equipment expense and planned for future replacements.
Communication with students will also be an on-going expense. Student surveys, notes to parents, and signage are all necessary to maintain and increase student participation.
Like equipment, planning for renovations is necessary to guarantee an efficient workspace, ease the flow of lines through the cafeteria, and increase the visual appeal of the cafeteria. One district’s foodservice set aside enough money to create a food court with four stations.
Few districts planned to increase the price of lunch or breakfast. Often, such increases were instituted only on an ‘as needed’ basis. Considering the long history of rising costs in foodservice, annual cost increases are nearly a guarantee. Districts have learned that planning for increases in food costs, employee salaries, and benefit costs is essential.
What to Charge (If at All)
Deciding how to price meals can be politically charged. Districts do not want to face complaints from parents. Interestingly, although the financially struggling districts in this study did charge lower prices overall, they had no clear rationale for their price systems.
It should be stressed that a low meal price does not necessarily translate into more meals sold. Cost is only one of many factors that influence children’s decisions. Indeed, cost typically ranks lower on student’s priority list than the FAT (Fun, Attractive, Tasty) appeal. This is why open-campus high schools usually experience much lower participation for lunch, even when their meal offerings are less expensive than fast-food.
The five most commonly used pricing systems are:
1. Reimbursement levels 2. Promotions (incentives) 3. Margins 4. Costs 5. Universally free
Reimbursement levels
The most common pricing method is based on Federal and state aid levels. Under this method, all students ‘pay’ (contribute) the same amount for their meal.
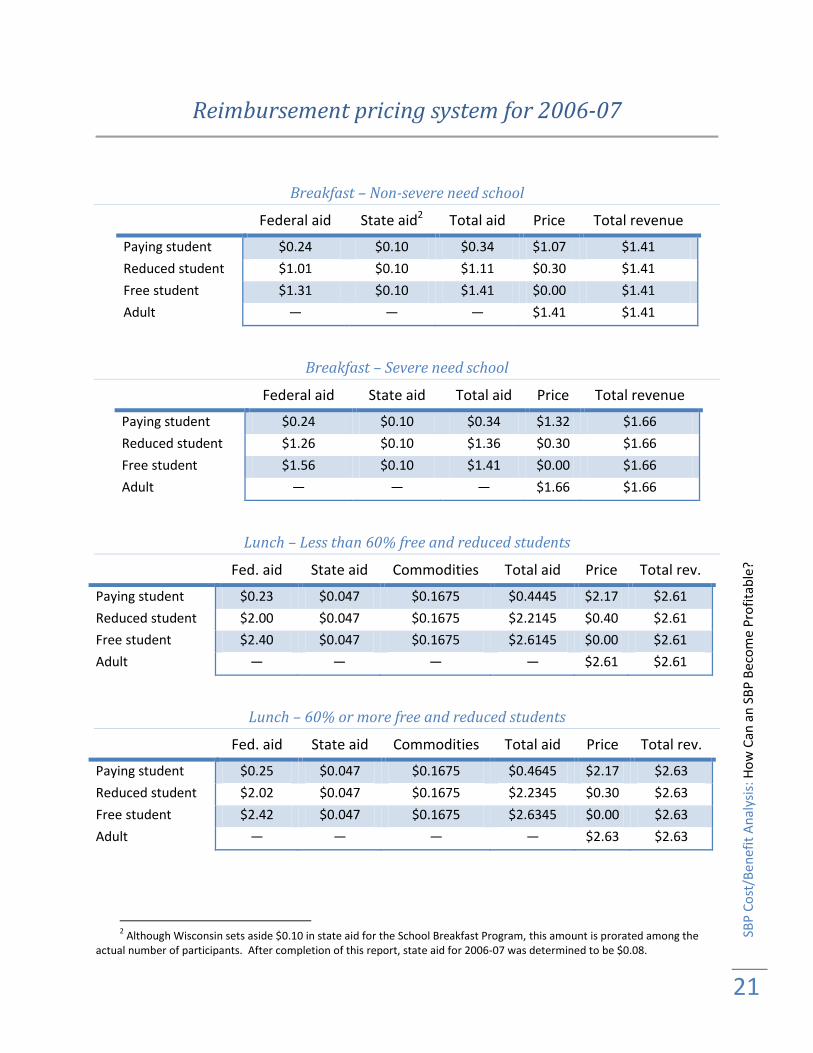
Schools employing this method set the amount they receive for a free student meal as the baseline. As shown in the tables on the next page, a paying student would be charged $1.07 for breakfast at a non-severe- need school, $1.32 for breakfast at a severe-need school, and $2.17 for lunch at any school.
This system ensures that all students, regardless of economic status, will be ’paying’ the same amount for their meal.
Although it would appear the reimburse-ment system charges more to paying students in severe-need schools, this rarely happens. Most severe need schools find it more profitable to implement the universally free program.
SBP
Co
st/B
en
efit
An
alys
is: H
ow
Can
an
SB
P B
eco
me
Pro
fita
ble
?
21
Reimbursement pricing system for 2006-07
Breakfast – Non-severe need school
Federal aid State aid2 Total aid Price Total revenue
Paying student $0.24 $0.10 $0.34 $1.07 $1.41
Reduced student $1.01 $0.10 $1.11 $0.30 $1.41
Free student $1.31 $0.10 $1.41 $0.00 $1.41
Adult — — — $1.41 $1.41
Breakfast – Severe need school
Federal aid State aid Total aid Price Total revenue
Paying student $0.24 $0.10 $0.34 $1.32 $1.66
Reduced student $1.26 $0.10 $1.36 $0.30 $1.66
Free student $1.56 $0.10 $1.41 $0.00 $1.66
Adult — — — $1.66 $1.66
Lunch – Less than 60% free and reduced students
Fed. aid State aid Commodities Total aid Price Total rev.
Paying student $0.23 $0.047 $0.1675 $0.4445 $2.17 $2.61
Reduced student $2.00 $0.047 $0.1675 $2.2145 $0.40 $2.61
Free student $2.40 $0.047 $0.1675 $2.6145 $0.00 $2.61
Adult — — — — $2.61 $2.61
Lunch – 60% or more free and reduced students
Fed. aid State aid Commodities Total aid Price Total rev.
Paying student $0.25 $0.047 $0.1675 $0.4645 $2.17 $2.63
Reduced student $2.02 $0.047 $0.1675 $2.2345 $0.30 $2.63
Free student $2.42 $0.047 $0.1675 $2.6345 $0.00 $2.63
Adult — — — — $2.63 $2.63
2 Although Wisconsin sets aside $0.10 in state aid for the School Breakfast Program, this amount is prorated among the
actual number of participants. After completion of this report, state aid for 2006-07 was determined to be $0.08.

SBP
Co
st/B
en
efit
An
alys
is: H
ow
Can
an
SB
P B
eco
me
Pro
fita
ble
?
22
Promotions
A promotion is a limited-time incentive program. Incentives can be in the form of price incentives or prize gifts.
Some districts offer a week of free breakfast; others choose to have an ‘introductory price’ when starting an SBP.
Free beads for Mardi Gras, raffles (open to all who stop by the cafeteria) for bikes and basketballs, and other give-away events are part of some schools’ SBP promotion programs.
Margins
Pricing meals from a set margin is often used with a la carte. Products are marked up a set percentage. For instance, a markup of 300% might be used for all products.
In retail, the price is then rounded to the nearest $0.10, and then reduced by a penny to give the perception of being less expensive. For example, a juice purchased for $0.13 and marked up 300% would cost $0.52. The product is instead priced at $0.49 to give the impression of a better deal.
Schools typically round to the nearest $0.05 to make calculations and giving change easier.
Costs
One district interviewed, reluctant to raise prices, decided instead to base the price of breakfast and lunch on costs.
In this pricing model, the district does not raise prices unless foodservice is in danger of going below its budget. As long as the district’s foodservice revenues cover costs, prices do not increase.
Of the seven districts interviewed, this district has the lowest per-meal revenue for lunch and the lowest participation rates for lunch. This indicates that meals are rarely chosen on the basis of cost and reducing the cost of a meal does not automatically translate into a higher participation rate.
This pricing system typically results from an administration that is reluctant to raise prices, from a gap in financial information, or from both.
As the costs for labor and food rise each year, school meal prices will inevitably need to rise as well. Planning for the inevitable will avoid the problems associated with cutting costs too closely, such as skipping equipment maintenance, putting off employee raises, buying lower quality food, and not setting aside funds for unexpected problems that might arise.
Financial projections can forecast the need for price increases to cover equipment replacement, employee raises, future renovations, increasing the ECB, and purchasing higher nutrition foods to increase participation levels (further increasing revenues).
If the district is reluctant to raise prices out of concern for a community with low-income families, consider offering a universally free SBP.
Universally free
A universally free breakfast program offers breakfast to all students at no cost, assuming that Federal and state reimbursements will cover every student’s meal expense. Schools with a high free and reduced population may benefit financially from serving a universally free breakfast.
Not all schools can offer universally free breakfasts. A severe-need school is much more likely to benefit, although a few non-severe-need schools have had costs low enough to start a universally free SBP. The determining factors are the cost per meal and the percentage of free/reduced students.
An urban district from this study assessed its 11 elementary severe-need schools to determine if they would benefit from a universally free breakfast.
One such assessment is shown on the following page.

SBP
Co
st/B
en
efit
An
alys
is: H
ow
Can
an
SB
P B
eco
me
Pro
fita
ble
?
23
Mid-morning Nutrition Break for a severe-need school – 2006-07
Free students Reduced students Paid students
Number 189 36 82
Federal aid $1.56 $1.26 $0.24
State aid* $0.10 $0.10 $0.10
Aid per day 189 students X $1.66 =
$313.74 a day
36 students X $1.36 =
$48.96 a day
82 students X $.34 =
$27.88 a day
Total aid
(176-day year)
$313.74 X 176 days =
$55,218.24
$48.96 X 176 days =
$8,616.96
$27.88 X 176 days =
$4,906.88
Total revenue $68,742.08
Expense per meal $1.08 $1.08 $1.08
Expense per day 189 X $1.08 =
$204.12
36 X $1.08 =
$38.88
82 X $1.08 =
$88.56
Total expense (year) $204.12 X 176 days =
$35,925.12
$38.88 X 176 days =
$6,842.88
$88.56 X 176 days =
$15,586.56
Total expenses $58,354.56
Profit $10,387.52
*actual 2006-07 state aid may differ from estimated
The severe-need school assessment found that this school will generate more than $10,000 in profits annually by serving all children a universally free breakfast.
The program, which the school called a ‘Mid-morning Nutrition Break’, enabled all students to have breakfast together without singling out students on assistance. Teachers no longer had to send notes home to remind parents/guardians to send breakfast money or to collect payments. And, because breakfast was served an hour later, foodservice employees no longer worked split shifts.
The analysis of the 11 elementary schools revealed that not all schools had the potential to be profitable. Taken together, however, the district’s severe-need schools gained more than $3,000 in profits each year.
Thinking of children first, the Foodservice Director decided to switch all severe-need elementary schools to the universally free program instead of limiting free breakfasts to only those schools that had generated profit.
What to Serve
Consider nutritious, FAT (Fun, Attractive, Tasty) foods
Although children do not have a choice where they eat, they do choose what they eat. When serving children, shapes, colors, and taste should be considered.
One rural district interviewed has a test kitchen as part of its routine. New menu items were tested for appearance and taste, improved, and then offered to students for feedback.
Foods left uneaten
Schools that give children little or no menu choice will almost certainly have food left uneaten. This is a larger problem in elementary schools where children have no meal choices. Parents buy meals assuming that the child will eat them.

SBP
Co
st/B
en
efit
An
alys
is: H
ow
Can
an
SB
P B
eco
me
Pro
fita
ble
?
24
In most districts, uneaten food was offered to other children. In one district, prepackaged food was collected, returned, then served once more (only to be rejected again).
Returned food obviously indicates students dislike the food served. Tracking the number of returned, uneaten items is an excellent way to measure the FAT (Fun, Attractive, Tasty) characteristics of meals, especially when parents decide whether their child eats a school- or home-prepared meal. (See Amount of uneaten food in How Should a District Evaluate an SBP?)
Full meals vs. a la carte
A la carte is a challenging subject. As one Foodservice Director noted, “When funding was low and food costs high, we came to rely on the money generated from a la carte.” On the other hand, another Foodservice Director stated, “A la carte options are not nutritious and discourage students from eating.”
It is obvious a la carte has become an ethical and financial issue in many districts. Notably, this study found, for breakfast, a la carte is not always a financial win.
A Question of ethics
A la carte presents an ethical problem for Foodservice Directors. Students tend to establish a pecking order. Most a la carte meals are an option only for paying students, not for students on a free and reduced programs. Those who have money can show off by buying a la carte, knowing poorer students cannot. In this way, students use a la carte to keep themselves apart from students from low-income families.
In middle school and especially in high school, the traditional breakfast or lunch meal has a stigma of being a ‘poor kid’s’ meal. All districts interviewed on a la carte recognized this common knowledge.
Consequently, free and reduced students can be intimidated by the cafeteria, opting not to eat at all instead of announcing their poverty by getting breakfast.
Even knowing that students use a la carte to discriminate, some Foodservice Directors felt the income generated from a la carte was too large to pass up.
One district in this study was able to solve this problem while still offering a la carte items. The Foodservice Director decided to offer only items which were also part of a meal as a la carte. For instance, she created the menu, and then offered those items a la carte for a very high mark up. Students could not easily differentiate between students who purchased
Having Breakfast Your Way
Faced with the challenge of encouraging high school students to purchase a healthy breakfast over a la carte, the Foodservice Director in Sauk City created an incentive program.
For breakfast, she offers a choice of six entrées, three fruits, and seven extras. Individual items can be purchased either a la carte or by a ’Meal Deal’ combination of entrée, fruit and milk for $1.05.
When students buy items a la carte, the prices are higher. For example, a bagel with peanut butter (entrée) and milk costs $1.25.
The same meal plus fruit will cost $0.20 less. Students save money by eating a well-balanced breakfast and enjoy more food for less money.
The Foodservice Director sees herself first and foremost as an educator.
“We are teaching students how to make healthy choices. It starts in the elementary school, and by the time they leave high school they will know how to make nutritious decisions.
Students know the value of a dollar.” Which would you choose? Bagel + milk = $1.25 Bagel + fruit + milk = $1.05

SBP
Co
st/B
en
efit
An
alys
is: H
ow
Can
an
SB
P B
eco
me
Pro
fita
ble
?
25
a school meal and those who purchased a la carte items.
Another issue arises when considering foodservice is housed in a school. A school’s primary objective is to teach children. Foodservice is given the task of not only feeding children, but educating them on nutritional decision making. Choosing to eat an a la carte item in place of a meal is almost never a nutritionally sound decision.
As one director said, “What are we teaching our children by offering a la carte?”
Lack of time
The 2006 Wisconsin School Breakfast Survey revealed that schools serve a la carte primarily because of a perceived lack of time to serve breakfast (Westover, 2006). The facts do not support this perception. The districts interviewed for this study reported no change in preparation hours or serving time between a la carte and cold breakfasts. This was accomplished by packaging a la carte items into a ‘meal deal’ that qualified for the SBP.
A la carte profitability
Although many districts considered a la carte to be more profitable, closer scrutiny of student’s breakfast choices demonstrated that this was not always the case.
Federal and state subsidies are lost when children chose to purchase an a la carte item instead of a reimbursed meal.
Example:
A rural district interviewed for this report offers both a la carte and full breakfast in its high school. One full breakfast option consists of a box of cereal, crackers, orange juice, and milk, for which the foodservice pays $0.31, $.06, $0.15 and $0.15 for each item, respectively—a total food cost of $.67 per breakfast. The district charges $1.25 for the full breakfast and $1.45 for the a la carte meal ($0.75 for the cereal, $0.10 for the crackers, $0.25 for milk, and $0.35 for orange juice).
Using just these costs and prices, the district earns $0.58 per-meal profit from the full breakfast and $0.78 profit if the same breakfast is charged as a la carte. On the surface a la carte appears more profitable, because it brings in an additional $0.20 of per-meal revenue for the district.
In actuality, for every a la carte breakfast sold, the district forgoes the 2006-07 per-meal Federal (and potential state) reimbursement of $0.34 for full breakfasts. When those reimbursements are factored in, the school district makes $0.14 less selling the breakfast a la carte, even though they charge the student $0.20 more.
The chart below clearly illustrates that a la carte is much less profitable for the district than offering a complete breakfast. Although the district does make an additional $0.04 when selling a la carte over offering a free or reduced breakfast, most of these students do not buy a la carte.
Breakfast profit compared to a la carte profit
Program Food cost
Student pays
Profit before aid
Federal & state aid
Value to foodservicea
Foodservice net profitb
A la carte $0.67 $1.45 $0.78 $0.00 $1.45 $0.78
Paid breakfast $0.67 $1.25 $0.58 $0.34 $1.59 $0.92
Reduced breakfast $0.67 $0.30 ($0.37) $1.11 $1.41 $0.74
Free breakfast $0.67 $0.00 ($0.67) $1.41 $1.41 $0.74 a Value to foodservice = Amount student pays + Federal & state aid for 2006-07 b Foodservice net profit = Value to foodservice – Food cost

SBP
Co
st/B
en
efit
An
alys
is: H
ow
Can
an
SB
P B
eco
me
Pro
fita
ble
?
26
This scenario assumes that students will make healthy decisions. On the day of the interview, the students who purchased cereal a la carte did not buy crackers or orange juice. In fact, they did not buy anything other than milk to go with their cereal. To the student, $1.00 for cereal and milk seemed a better deal than $1.25
for breakfast including juice. Had the district charged only $1.00 for breakfast, it still would have made an additional $0.13 in profit and offered the student more food. Instead it lost money by not encouraging students to eat a well-balanced meal.
Charging $1.00 for breakfast vs. student’s a la carte choice
Student’s choice Food cost Student
pays Federal & state aid
Value to foodservice
Profit to foodservice
Cereal + milk $0.46 $1.00 $0.00 $1.00 $0.54 Cereal + milk + crackers + juice $0.67 $1.00 $0.34 $1.34 $0.67
The purpose of a school’s foodservice is not to make money, but to provide healthy, nutritious, well-balanced meals. A la carte misses this goal as no single a la carte item provides the nutrition found in a complete meal.
If a la carte items are sold, they should be the same as a meal. This way, students cannot easily differentiate between the paid and the free students.
Pricing individual a la carte items higher than the complete meals will encourage students to choose nutritional, full meals over a la carte items.
Increase MPLH
Labor costs are often the largest expense in an SBP. Measuring and improving labor productivity will greatly affect the SBP’s ability to break even.
Efficiencies are often a result of changing the workflow and ’working smarter, not harder’.
See the Meals per labor hour (MPLH) section on page 30 for calculation details.
Track progress
Trying to reach a goal without tracking progress is like trying to hit a bull’s-eye when blindfolded: You know the general direction, but cannot adjust your aim until it is too late.
Deciding on the goal of foodservice, then choosing which report to focus on (see How Should a District Evaluate an SBP?) can help districts achieve their goals.
Tracking progress implies ongoing assessments. Scheduling regular meetings with administration and/or staff to review reports and making those meetings part of a routine ensures that tracking progress will not be set aside.
Perhaps the most difficult temptation to resist is skipping a meeting. Skipping a meeting communicates that neither the review nor the goal really matters. Skipped or canceled meetings often lead to foodservice staff also skipping the work needed to accomplish the stated goals.
One way to make tracking progress doable and rewarding is to ensure that all goals are specific, measureable, attainable, realistic, and have a timeline (S.M.A.R.T.).
Having measureable outcomes simplifies foodservice’s task of tracking progress. Measurable outcomes enable the Foodservice Director to know when or if the goal has been met. Deciding to ‘increase student preference for high school lunch over eating out’ will be easy to assess with good tracking data.
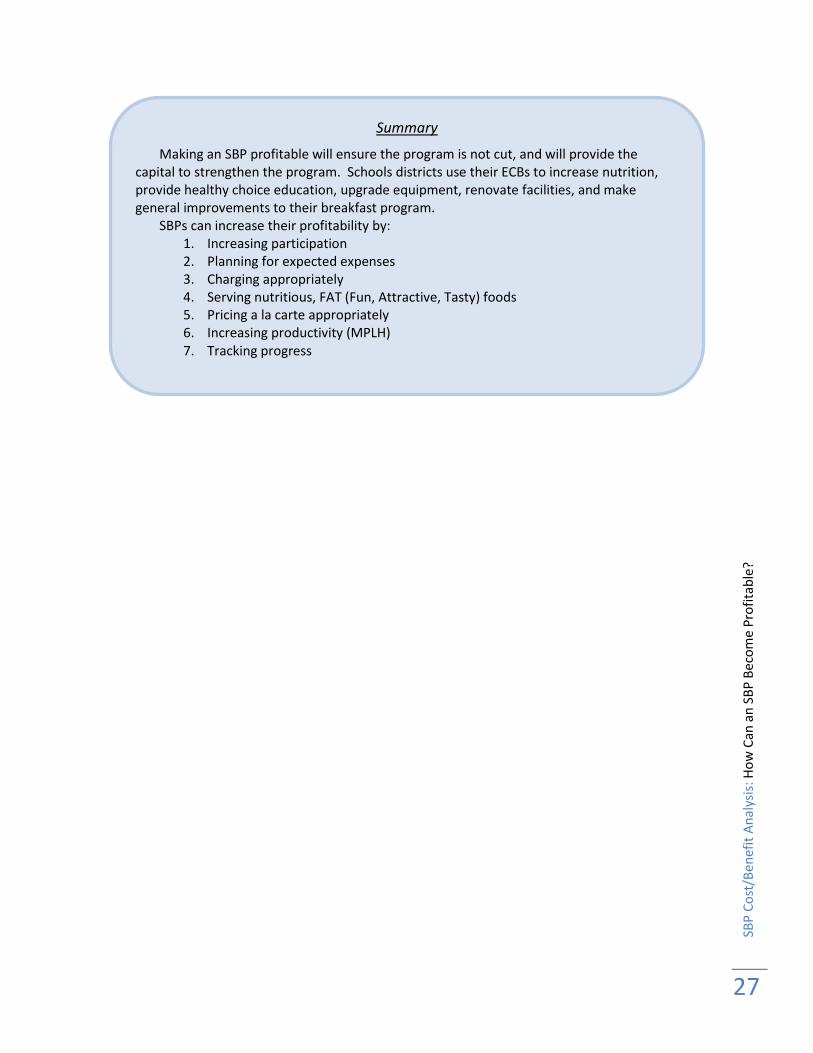
SBP
Co
st/B
en
efit
An
alys
is: H
ow
Can
an
SB
P B
eco
me
Pro
fita
ble
?
27
Summary
Making an SBP profitable will ensure the program is not cut, and will provide the capital to strengthen the program. Schools districts use their ECBs to increase nutrition, provide healthy choice education, upgrade equipment, renovate facilities, and make general improvements to their breakfast program.
SBPs can increase their profitability by: 1. Increasing participation 2. Planning for expected expenses 3. Charging appropriately 4. Serving nutritious, FAT (Fun, Attractive, Tasty) foods 5. Pricing a la carte appropriately 6. Increasing productivity (MPLH) 7. Tracking progress

SBP
Co
st/B
en
efit
An
alys
is: H
ow
Sh
ou
ld a
Dis
tric
t Ev
alu
ate
an
SB
P?
28
How Should a District Evaluate an SBP?
Reports can tell a story and indicate where problems exist and how to solve them. Simple expense/revenue reports will reveal only where money is spent and whether the budget balances. They do not indicate why revenues are low or suggest how to improve the SBP.
When provided with no information other than whether expenditures are over or under budget, foodservices are put in a compromising position. Remedying a problem (most often being over budget), becomes difficult, if not impossible, if the foodservice does not have appropriate tools.
The most successful foodservice programs rely on a combination of internally generated administrative reports. Each report has associated S.M.A.R.T. goals: specific, measurable, attainable, realistic, and have a timeline. Each goal is accompanied by a plan on how achieve it.
A school district’s annual Child Nutrition Program Report generated by Wisconsin’s Department of Public Instruction is an excellent example of a comprehensive report.
Reports are useful only if generated in a timely manner. For instance, an annual report would tell a Foodservice Director if an SBP were over-budget only after it is too late to remedy the situation.
There are many ways to assess an SBP, each with a different purpose. Seven methods are reviewed here.
Methods:
Participation – measures the percentage of total students purchasing meals.
Breakfast:Lunch Ratio – compares the number of students eating breakfast with those eating lunch.
Meals per Labor Hour (MPLH) – measures labor productivity.
Number of healthy meals vs. a la carte – reveals success of meal incentives over a la carte.
Per-meal Cost – measures expenses on a per-meal basis.
Amount of Food Returned Uneaten – measures meal appeal
Student Surveys – provides formal or informal qualitative assessment
Participation
Participation is the primary measure of success for SBPs, and the easiest to calculate. It is either expressed as a number (i.e., 303 meals purchased daily) or a percentage (i.e., 79% of children participated).
The Child Nutrition Program Report, published by the Wisconsin Department of Public Instruction, refers to participation as either the ADP (Average Daily Participation) or the Participation Rate.
Participation can be used to measure the number of children taking part in the district or school breakfast program, the number of meals purchased, and/or the popularity of meals. Keeping a daily participation log can help foodservice detect changes caused from weather, menu offerings, or scheduling alterations.

SBP
Co
st/B
en
efit
An
alys
is: H
ow
Sh
ou
ld a
Dis
tric
t Ev
alu
ate
an
SB
P?
29
Example
The average daily meal participation count is calculated by dividing the total number of breakfasts served by the number of operating days for the same time period.
Calculating breakfast meal participation
Daily student breakfast participation
= Breakfasts served per month
Number of operating days in month
The percentage is calculated by dividing the number of meals purchased by the total population of children in the school. Often the number is adjusted for attendance variations.
Calculating student breakfast participation percentage
Average student breakfast participation
= Daily student breakfast participation
Daily student attendance
Breakfast:Lunch Ratio
The Breakfast:Lunch Ratio compares the number of breakfast meals sold to the number of lunches sold.
For instance, in 2006, Wisconsin’s Breakfast:Lunch Ratio was 29:100, indicating that the state served 29 breakfasts for every 100 lunches. In contrast, West Virginia’s 2006 Breakfast:Lunch Ratio was 59:100, double that of Wisconsin. The ratio indicates 59 children in West Virginia ate breakfast for every 100 who ate lunch (School Breakfast Scorecard, 2006).
One advantage of the Breakfast:Lunch Ratio as a statistic is that the ratio is free from population and serving ability biases. For example, a school that has low lunch participation could still have a high Breakfast:Lunch Ratio if a relatively high percentage of children participate in the SBP.
This ratio can be used to detect breakfast time constraints, stigma, uncomfortable dining area, or poor breakfast menu choices. A low Breakfast:Lunch Ratio suggests there may be
problems specific to the SBP which need to be improved, such as scheduling.
A good Breakfast:Lunch Ratio, but a low participation rate, indicates changes need to be made in the overall foodservice program.
Example:
A school district served a total of 151,620 student breakfasts and 270,750 student lunches last year.
151,620 breakfast X 100 = .56 X 100 = 56
270,750 lunches
Breakfast:Lunch Ratio = 56:100
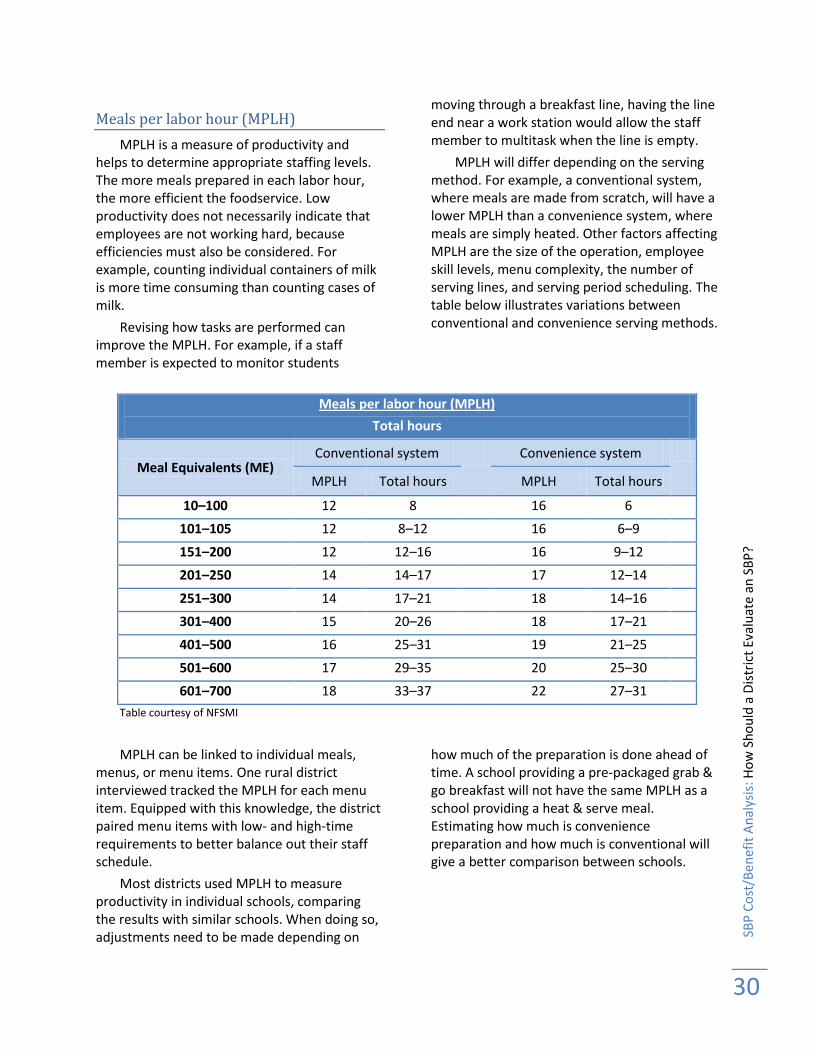
SBP
Co
st/B
en
efit
An
alys
is: H
ow
Sh
ou
ld a
Dis
tric
t Ev
alu
ate
an
SB
P?
30
Meals per labor hour (MPLH)
MPLH is a measure of productivity and helps to determine appropriate staffing levels. The more meals prepared in each labor hour, the more efficient the foodservice. Low productivity does not necessarily indicate that employees are not working hard, because efficiencies must also be considered. For example, counting individual containers of milk is more time consuming than counting cases of milk.
Revising how tasks are performed can improve the MPLH. For example, if a staff member is expected to monitor students
moving through a breakfast line, having the line end near a work station would allow the staff member to multitask when the line is empty.
MPLH will differ depending on the serving method. For example, a conventional system, where meals are made from scratch, will have a lower MPLH than a convenience system, where meals are simply heated. Other factors affecting MPLH are the size of the operation, employee skill levels, menu complexity, the number of serving lines, and serving period scheduling. The table below illustrates variations between conventional and convenience serving methods.
Meals per labor hour (MPLH)
Total hours
Meal Equivalents (ME) Conventional system Convenience system
MPLH Total hours MPLH Total hours
10–100 12 8 16 6
101–105 12 8–12 16 6–9
151–200 12 12–16 16 9–12
201–250 14 14–17 17 12–14
251–300 14 17–21 18 14–16
301–400 15 20–26 18 17–21
401–500 16 25–31 19 21–25
501–600 17 29–35 20 25–30
601–700 18 33–37 22 27–31
Table courtesy of NFSMI
MPLH can be linked to individual meals, menus, or menu items. One rural district interviewed tracked the MPLH for each menu item. Equipped with this knowledge, the district paired menu items with low- and high-time requirements to better balance out their staff schedule.
Most districts used MPLH to measure productivity in individual schools, comparing the results with similar schools. When doing so, adjustments need to be made depending on
how much of the preparation is done ahead of time. A school providing a pre-packaged grab & go breakfast will not have the same MPLH as a school providing a heat & serve meal. Estimating how much is convenience preparation and how much is conventional will give a better comparison between schools.

SBP
Co
st/B
en
efit
An
alys
is: H
ow
Sh
ou
ld a
Dis
tric
t Ev
alu
ate
an
SB
P?
31
Calculating meal equivalents (ME)
The first step in calculating MPLH is determining the meal equivalents. Lunch is the basic measuring unit for all foodservice sales. Thus, any food sales other than lunch must be converted into a lunch equivalent.
For SBPs, full breakfast, a la carte, snacks, and catering all have different preparation times, and therefore have different conversion ratios.
Breakfasts are faster to prepare than lunch. For a conventional breakfast, the most accepted equivalency conversion is three breakfasts are equivalent to two lunches. For a convenience system, two breakfasts are equivalent to one lunch. The most common multiplier districts in the study used was two breakfasts for every lunch (½ or 0.5).
Conventional system
Meal Equivalent
= 2 lunches
= 0.66 3 breakfasts
Convenience system
Meal Equivalent
= 1 lunch
= 0.5 2 breakfasts
Example
A school district served 170,460 breakfasts last year.
Breakfast ME = 170,460 x 0.5 = 85,230
Calculating MPLH
Lunch example:
A rural district calculated its annual MPLH. During that year, the district served 194,105 lunch meals using 17,460 labor hours.
244,440 meals = 14 MPLH
17,460 labor hours
This district’s MPLH for its conventional lunch program is 14.
Breakfast example:
A school is calculating breakfast MPLH. Each day it uses 3 hours to serve 132 breakfasts.
1. First, the school must calculate the meal equivalents:
Breakfast ME = 132 x 0.5 = 66
2. Next, the school calculated the average number of daily labor hours to reach 3 hours.3
3. Now, the school can calculate its MPLH:
Daily ME =
66 = 22 MPLH
Daily labor hours 3
This district has an MPLH of 22 for its convenience breakfast program.
Number of healthy meals vs. a la carte
The goal of foodservice is to provide healthy, well-balanced meals. Comparing the total number of meals sold with the number of ala cart meals sold will give foodservice an indication of the choices children make at school. High a la carte sales indicate that a la carte markup is not high enough, meals are not high enough in FAT (Fun, Attractive, Tasty) qualities, and/or convenience is an issue.
3 Labor hours comprise all staff hours allocated
to foodservice including the Foodservice Director, supervisors, kitchen staff, cashiers, and custodial staff. Hours do not include paid sick, personal, or holiday leave.
Convert meals into meal equivalents (ME)
Total all labor hours
Divide ME by the total labor hours

SBP
Co
st/B
en
efit
An
alys
is: H
ow
Sh
ou
ld a
Dis
tric
t Ev
alu
ate
an
SB
P?
32
Per-meal cost
Per-meal cost helps break out the expenses for each meal. To calculate, each expense is divided by the number of meals served during the same time period. Wisconsin’s Department of Public Instruction provides an annual breakout on every “Child Nutrition Program Report”.
Tracking annual changes will assist foodservice in predicting likely annual increases in food, labor and equipment expenses.
Amount of uneaten food
Schools that offer children little or no menu choice will have uneaten food left over. This problem is more prevalent in elementary schools where children have very limited meal choices and parents buy meals assuming the child will eat them. One district solved this problem by asking the children to set aside uneaten food for other children to take if they wished.
Another approach in the lower grades is to send uneaten food home with the child, rather than back to foodservice. This alerts the parents to the student’s preferences and they can plan to pack a meal on the days they know their child will not eat, based on the menu calendar.
A generally accurate way to track menu preferences is to have teachers note how many items are sent home or thrown away. Since this approach increases each teacher’s workload, posting weekly results can demonstrate that foodservice takes the reporting seriously. Communicating to teachers when a menu item has been dropped (or added/increased) because of their reports will only reinforce the message.
Using the menu calendar to monitor the number of uneaten items simplifies tracking. These annotated menu calendars provide a record of children’s eating preferences. Reviewing the consumption patterns on a monthly basis can help the Foodservice Director determine which menu items to eliminate and which to keep.
Student surveys
Surveying students refers to both formal paper surveys and the informal daily survey an attentive foodservice staff conducts each time it serves a meal.
Paper surveys can be the only time non-participating students explain why they choose not to take part in the SBP. Therefore, taking the time to create a wide-ranging survey that covers the children’s usual eating habits (including how they eat their food now; what they eat; what, when, and where they would like to eat) can yield valuable answers. The responses can help foodservice understand the desired meal atmosphere, how much time is needed, and students’ food preferences.
Posting the results where students can see them as well as sharing the results with their teachers (who took class time to have students complete the surveys) are important follow-ups.
Informal surveys can be just as effective, even if they not as statistically rigorous. For example, when students go through the line, foodservice staff can ask what sounds good to them on the menu. What are the students looking forward to eating? Have they tried the other meal? Why not? What did they have for dinner last night?
Those schools that followed the informal survey approach derived unexpected benefits. Interacting with the students encouraged the foodservice staff to look students in the eyes, and they often smiled at them. This warm, personal approach indirectly gave students the message that the foodservice staff cared about them and their needs. The students responded just as positively. In other schools where staff did not actively interact with the students, the students tended just to look at the floor and rush through the serving line as quickly as possible. These personal, informal surveys effectively communicated to the children that staff members really wanted them there, and actively wanted them to enjoy the food.

SBP
Co
st/B
en
efit
An
alys
is: H
ow
Sh
ou
ld a
Dis
tric
t Ev
alu
ate
an
SB
P?
33
Students’ tastes change over the years. A new restaurant in town, a popular TV show, a new sports diet, or new products offered at the grocery store may change what students prefer to eat at school. Surveys are the only way schools can answer the ‘why’ behind students’ choices.
Summary
The most profitable SBPs maintained detailed reporting systems that differentiated between programs (lunch, breakfast, and a la carte), schools, and even individual meals.
Seven commonly used reports are:
1. Participation 2. Breakfast:Lunch Ratio 3. Meals per labor hour (MPLH) 4. Meals vs. a la carte 5. Per-meal cost 6. Amount of uneaten food 7. Student surveys

SBP
Co
st/B
en
efit
An
alys
is: W
hat
’s N
ext?
(R
eco
mm
end
atio
ns)
34
What’s Next? (Recommendations)
Providing school children with nutritious breakfasts has demonstrated benefits that far exceed those from lunch. Nonetheless, neither district administrators nor the community generally offer the same level of support for SBPs as for lunch programs.
Adding an SBP can potentially increase nutrition, health, and school performance while decreasing obesity, discipline problems, and illness.
Financially, SBPs create an additional revenue stream, increase jobs, and bring additional capital into a community.
Although Wisconsin school districts cite cost as the number one reason for not starting a SBP, clearly cost is not the real barrier (School Breakfast Program) (Westover, 2006). Participation levels and labor efficiencies (often a result of low participation) are the true concerns.
Schools with the highest participation levels set aside time during the school day for children to eat breakfast. They have the same expectation as for lunch: children will eat the meal together at school.
Districts with the highest participation levels cited administrative support as the greatest asset to their SBP. This support enabled them to implement the changes
necessary to increase participation and to make the SBP profitable.
The most successful SBP programs used detailed breakout reports to identify needed changes and show administrators the expected impact those changes would have.
Although each district interviewed was highly individual, those with a successful SBP had some commonalities.
Setting goals, both short-term and long-term, gave administrators, directors, and staff a focus to work towards.
Reviewing/tracking progress towards those goals provided accountability.
Breakout reports enabled the Foodservice Director to measure progress and justify changes necessary to reach the stated goal.
FAT (Fun, Attractive, Tasty) foods encouraged participation and excitement for breakfast.
Support is the most critical component of successful SBPs. Administrators, staff, teachers, coaches, and even the school nurse can be influential allies.
Though districts without SBPs are concerned about the cost of running a program, all of the districts, both large and small, are profitable. This makes the SBP one of the best investments for children.

SBP
Co
st/B
en
efit
An
alys
is: <
Wo
rks
Cit
ed
35
Works Cited
Birkholzer, K. (2005, July). Local Economic Development and its Potential. TechNet . Division for Learning and Support: Equity and Advocacy. (2005). 2005 Youth Risk Behavior Survey
Results. Madison, WI: Wisconsin Department of Public Instruction. Dwyer, J. T., Ebzery, M. K., Nicklas, T. A., Feldman, H. A., Evans, M. A., Zive, M. M., et al. (1998). Do
Third Graders Eat Healthful Breakfasts? Family Economics Review , 16. Gordon, A. R., Devaney, B. L., & Burghardt, J. A. (1995). Dietary Effects of the National School Lunch
Program and the School Breakfast Program. The American Journal of Clinical Nutrition , 61, 221S-231S. Meyers, A. F., Sampson, A. E., Weitzman, M., Rogers, B. L., & Kayne, H. (1989). School Breakfast
Program and School Performance. Pediatrics & Adolescent Medicine , 143 (10). Murphy, J. M., Wehler, C. A., Pagano, M. E., Little, M., Kleinman, R. E., & Jellinek, M. S. (1998).
Relationship Between Hunger and Psychosocial Functioning in Low-Income American Children. Journal of the American Academy of Child & Adolescent Psychiatry , 37 (2), 163-170.
National Food Service Management Institute. (2005). Financial Management Information System. Applied Research Division. Hattiesburg: The University of Southern Mississippi.
Nicklas, T. A., Bao, W., Webber, L. S., & Berenson, G. S. (1993). Breakfast consumption affects adequacy of total daily intake in children. Jornal of the American Dietetic Association , 93 (8), 886-91.
Nicklas, T. A., Baranowski, T., Cullen, D. W., & Berenson, G. (2001). Eating Patterns, Dietary Quality and Obesity. Journal of the American College of Nutrition , 20 (6), 599-608.
Nicklas, T. A., Elkasabany, A., Srinivasan, S., & Berenson, G. (2001). Trends in Nutrient Intake of 10-Year-Old Children over Two Decades (1973-1994) - The Bogalusa Heart Study. american Journal of Epidemiology , 153 (10), 969-977.
Nicklas, T. A., O'Neil, C. E., & Berenson, G. S. (1998). Nutrient Contribution of Breakfast, Secular Trends, and the Role of Ready-to-Eat Cereals: A review of data from the Bogalusa Heart Study. The American Journal of Clinical Nutrition , 67, 757S-763S.
Pollitt, E., & Mathews, R. (1998). Breakfast and Cognition: an Integrative Study. The American Journal of Clinical Nutrition , 67, 804S-813S.
Pollitt, E., & Mathews, R. (1998). Breakfast and Cognition: an Integrative Summary. The American Journal of Clinical Nutrition , 67, 804S-813S.
Rosales, W., & Janowski, J. (2002, May). The State of Breakfast in Wisconsin. (2006). School Breakfast Scorecard. Food Research and Action Center. Simeon, D., & Grantham-McGregor, S. (1989). Effects of Missing Breakfast on the Cognitive
Functions of School Children of Differing Nutritional Status. The American Journal of Clinical Nutrition , 49, 646-653.
Westover, B. (2006). Wisconsin School Breakfast Survey Final Report. UW-Extension, Cooperative Extension Family Living Program.
(2006). Wisconsin Child Nutrition Data. Wisconsin Department of Public Instruction.