school-based interventions to reduce drug/alcohol use evidence-based practice in the trenches ...
TRANSCRIPT

School-based interventions to reduce drug/alcohol use
Evidence-based practice in the trenches
www.pv-psg.org 316-284-6446 [email protected]

Who is Prairie View? Non-profit Community Mental Health Center Open since 1954 450 employees, serves 12,000 patients/year Full range of services, including inpatient hospital,
outpatient therapy, school for at-risk youth, adolescent residential program, community-based outreach, housing
15 years of clinical outcomes research 14 years of adventure-based programming with inpatient,
outpatient, and non-clinical populations of all ages 6 years of outcomes research in adventure Partnering with Project Adventure to study outcomes tools,
provide open enrollment trainings, and study behavioral management models.
Who is Process Solutions? Prairie View’s organizational consulting,
training, and research division Vision statement: Renewing Spirit,
Discovering Strengths, Pursuing Excellence
Three core components Process Communication Model (PCM) Adventure-based learning models Self-Efficacy outcomes measurement

Overview Setting the stage Getting the contract – making the case,
connecting the dots Research design and data collection Results so far Lessons learned Discussion
Prior experience Worked with Haysville Alternative school
during 2005-2006 school years experimenting with combination of adventure course and school-based adventure groups.
Collected outcomes data with control groups showing effectiveness in raising self-efficacy
Had begun capacity building with alternative school staff to conduct school-based groups

The big one! Haysville school district taking bids on
drug-alcohol reduction programs Already had a liking for adventure-based
methods Strong school board pressure for hard-line
fear-based tactics such as drug dogs School advisory council allowed us to
make a presentation, submit a bid
Making our case Escalating drug and alcohol use, along with the
negative health and societal consequences Increasing communication gap between youth
and adult culture Changes in socio-economic profile and gaps Increasingly fragmented family and community
support systems More and more responsibility shifted to schools to
help deal with the problems So many things interfering with the learning
process

Our hope
Reducing drug and alcohol use/abuse among youth
Making school a place where youth are developing the skills necessary to become healthy, contributing adults
Feeling like we are really connecting with kids, making a difference in their lives
Modeling effective approaches, where others can come to observe and learn

Where’s the problem? Where’s the solution? Attitudes, values, and beliefs about
student drug and alcohol use From your perspective, what’s the solution
to all this nonsense?
How did you answer? Nurturing ___ Values ___ Information ___ Fun ___ Direction ___ Excitement ___
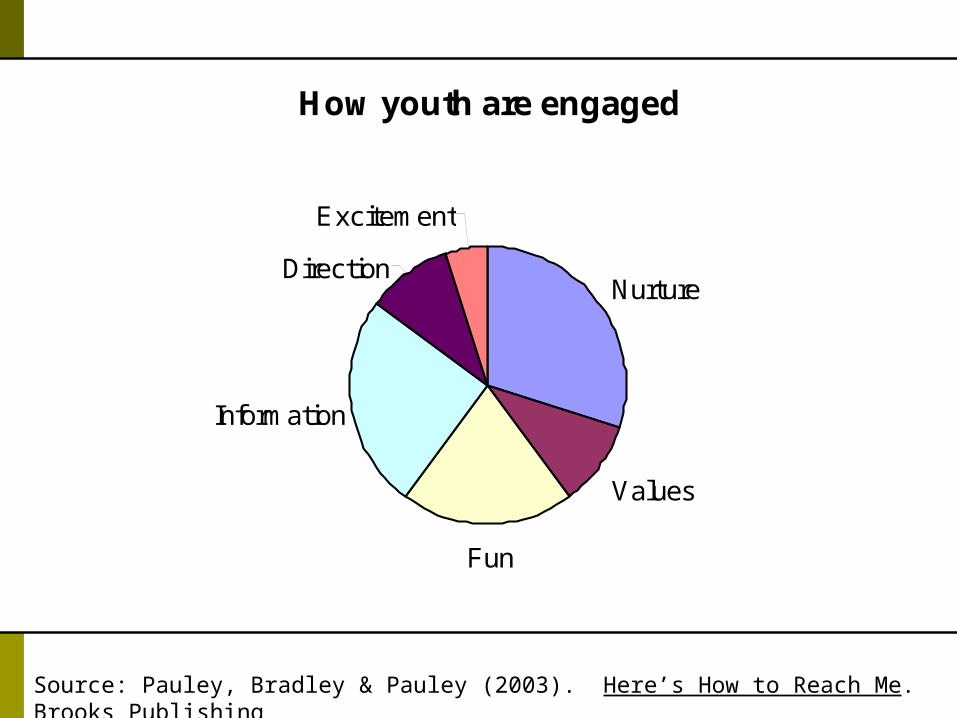
Source: Pauley, Bradley & Pauley (2003). Here’s How to Reach Me. Brooks Publishing
How youth are engaged
Nurture
Values
Fun
Information
Direction
Excitement

How at-risk youth are engaged
Nurture4%
Values4%
Fun48%
Information4%
Direction8%
Excitement32%
Less than 20% of the youth account for more than 80% of the problems

Toward No Drug Abuse (TND) SAMHSA Model program status Lists individual, family, school, and
community protective factors 1/3 of the factors relate to having
adequate information The remaining 2/3 relate to developing
social and emotional intelligence

CTC Survey Data for Haysville Drug/Alcohol use above county and state
averages on most indicators Below averages on protective factors Above averages on risk factors Getting bad press Of the 17 peer/individual, family, and school risk
factors, 14 relate to social/emotional intelligence process factors, i.e. patterns of getting motivational needs met in unhealthy ways, failure to engage or relate effectively, or mismatch between environmental demands and coping skills

So what are the keys? Self-awareness - understanding what makes me
tick and stop ticking effectively Responsibility - Skill-building in meeting my
needs in healthy ways, recognizing and reversing negative attention patterns
Belief in my ability to act on what I know and learn
Hope that my effort will get me somewhere Support - peer, school, family, and community
support for positive change
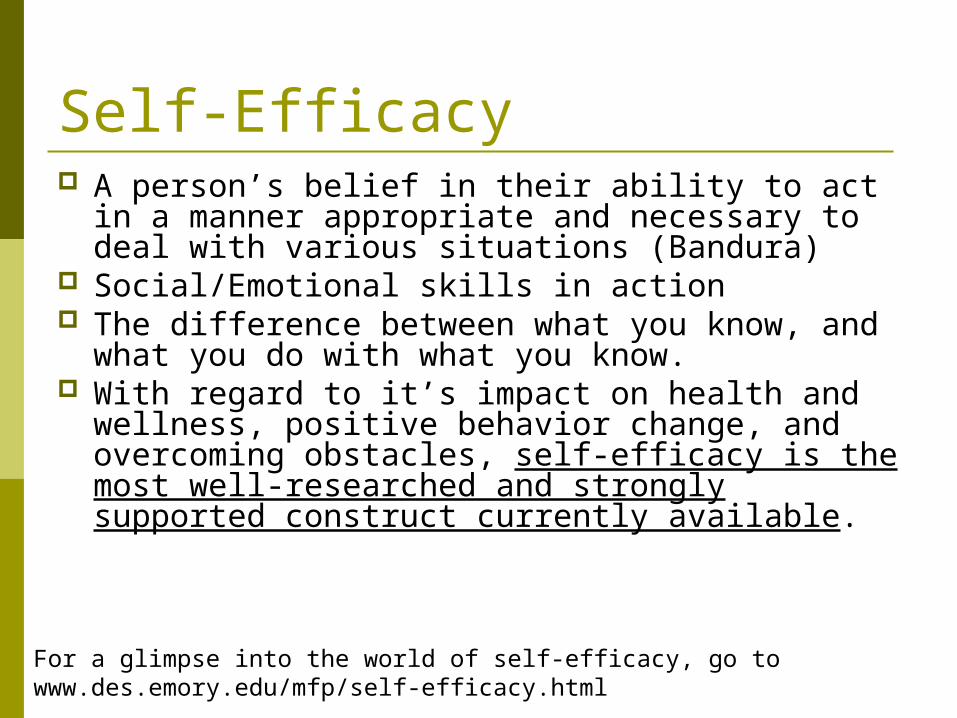
Self-Efficacy A person’s belief in their ability to act in a manner
appropriate and necessary to deal with various situations (Bandura)
Social/Emotional skills in action The difference between what you know, and what
you do with what you know. With regard to it’s impact on health and wellness,
positive behavior change, and overcoming obstacles, self-efficacy is the most well-researched and strongly supported construct currently available.
For a glimpse into the world of self-efficacy, go to www.des.emory.edu/mfp/self-efficacy.html
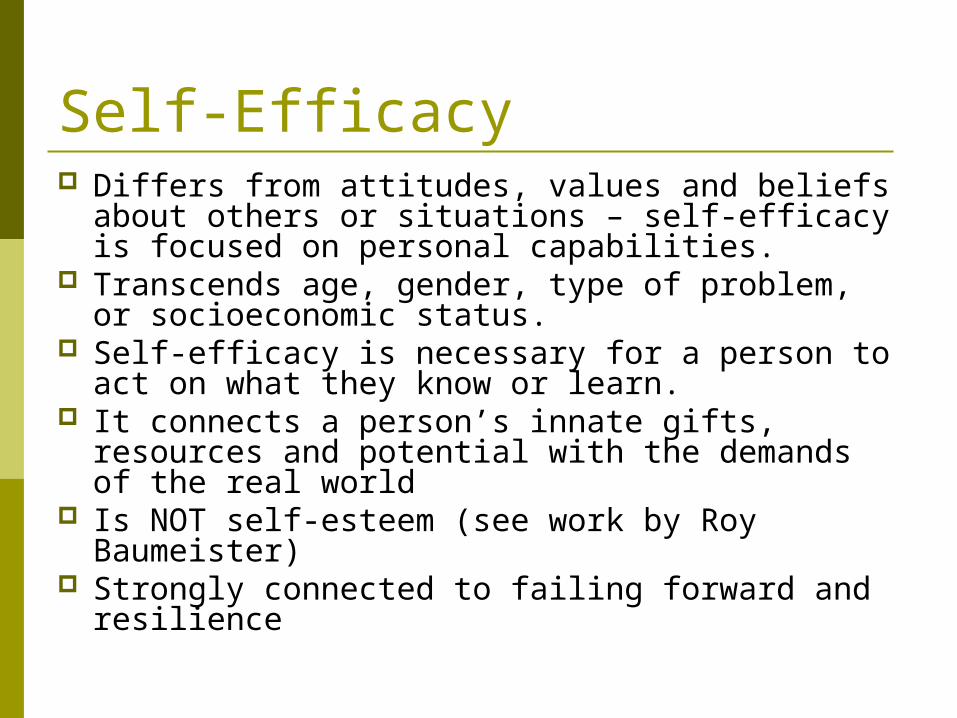
Self-Efficacy Differs from attitudes, values and beliefs about
others or situations – self-efficacy is focused on personal capabilities.
Transcends age, gender, type of problem, or socioeconomic status.
Self-efficacy is necessary for a person to act on what they know or learn.
It connects a person’s innate gifts, resources and potential with the demands of the real world
Is NOT self-esteem (see work by Roy Baumeister) Strongly connected to failing forward and
resilience

Process Solutions knows what works
Prairie View has a 52 year history in building self-efficacy. We are in the change business.
14 year history in measuring outcomes in mental health and substance abuse treatment exploring the most effective approaches.
Just received Lattner Foundation grant to advance our work in outcomes
13 year history in adventure-based programming Present nationally at conferences Published outcomes tools Partnership with Project Adventure, the nation’s premier adventure
training and programming organization Ongoing calendar of training programs Ongoing research programs Proven results with local schools
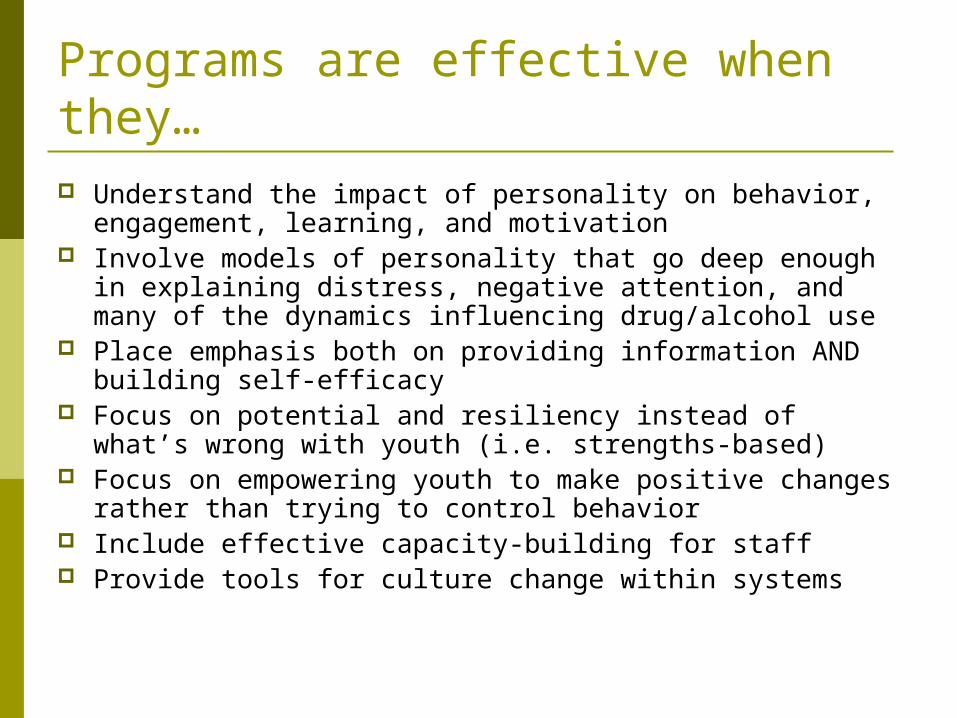
Programs are effective when they… Understand the impact of personality on behavior,
engagement, learning, and motivation Involve models of personality that go deep enough in
explaining distress, negative attention, and many of the dynamics influencing drug/alcohol use
Place emphasis both on providing information AND building self-efficacy
Focus on potential and resiliency instead of what’s wrong with youth (i.e. strengths-based)
Focus on empowering youth to make positive changes rather than trying to control behavior
Include effective capacity-building for staff Provide tools for culture change within systems

Our tools Perceived Competence of Functioning Inventory (PCFI) – 16
item self-report assessment of self-efficacy Motivational competencies* - setting and pursuing goals Affective competencies – dealing with feelings about self Cognitive competencies – judgment and critical thinking Relational competencies* - connecting with others, giving
and receiving support General Level of Functioning – overall efficacy
Internal consistency of .88 - .90 Test-retest reliability - .73 Validated against the MCMI, Hope Scale, Ways of Coping
Scale, Brief Symptom Index, and OQ-45
* Preliminary data from a large-scale longitudinal study at University of Minnesota on the impact of adventure-based interventions on drug/alcohol use shows that raising motivational and relational competencies are the two strongest predictors of success.
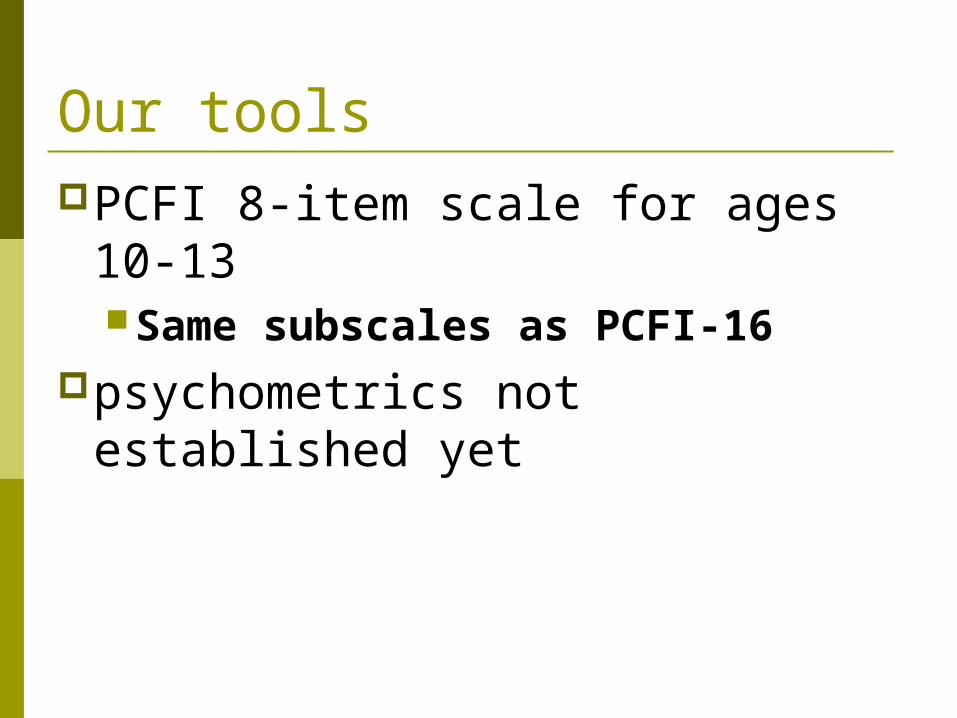
Our toolsPCFI 8-item scale for ages 10-13
Same subscales as PCFI-16psychometrics not established
yet

Our tools Process Communication Model (PCM)
Transactional personality communication model Defines 6 personality types, each with specific and
predictable Perceptual filters and preferred “channels of communication” Character strengths Psychological needs and motivators Learning styles and environmental preferences Second by second negative attention and sabotage behaviors Likely racket emotions /authentic unresolved emotions Typical clinical manifestations
Manual, training trajectory, and competency skills verification exists, so fidelity easier to manage
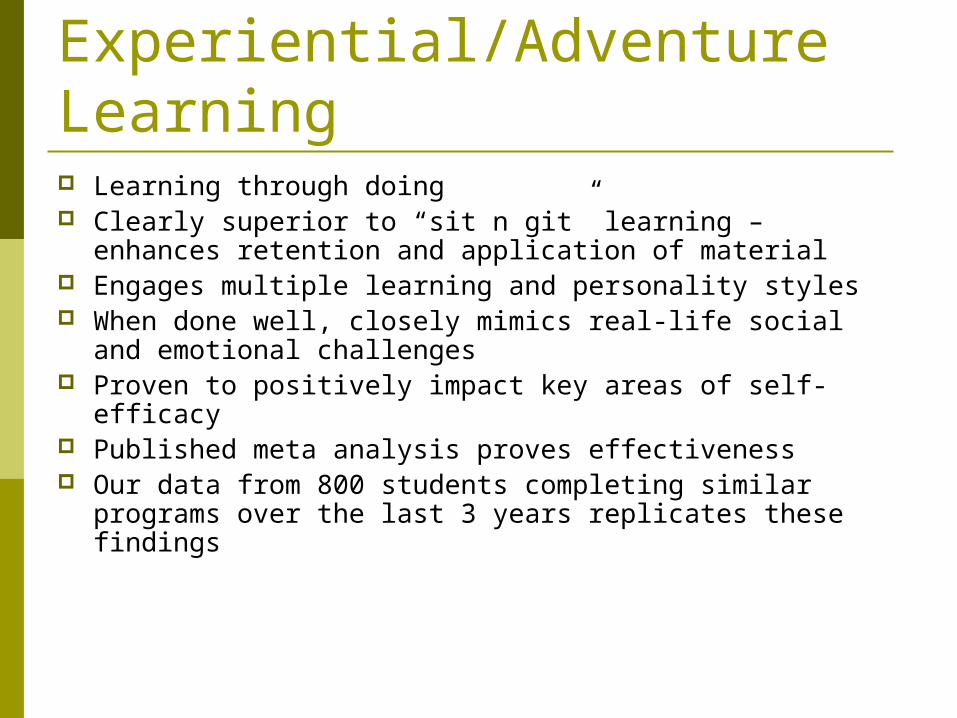
Experiential/Adventure Learning Learning through doing Clearly superior to “sit n git” learning – enhances retention
and application of material Engages multiple learning and personality styles When done well, closely mimics real-life social and
emotional challenges Proven to positively impact key areas of self-efficacy Published meta analysis proves effectiveness Our data from 800 students completing similar programs
over the last 3 years replicates these findings
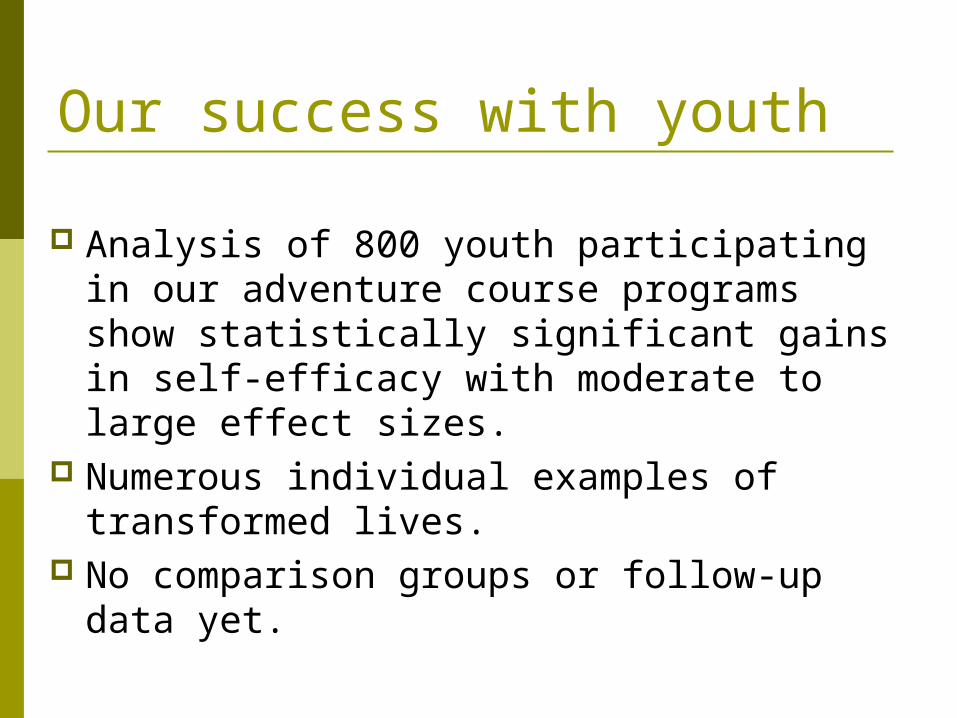
Our success with youth
Analysis of 800 youth participating in our adventure course programs show statistically significant gains in self-efficacy with moderate to large effect sizes.
Numerous individual examples of transformed lives.
No comparison groups or follow-up data yet.

Our success with at-risk youth Grades 6-12
Analysis of 204 at-risk students from 5 different schools (including Haysville Alternative) who have completed our school-based programs since 2005, and 23 matched controls. Slight reduction in motivational, affective, cognitive, and
relational capabilities for control group* Significant improvements in all scales for treatment group When asked to rate their confidence in coping without using
drugs or alcohol – negligible change in control group, improvement in treatment group. Although the improvement was fairly small, it was 15 x larger than the change in the control group.
* Our programs reversed a negative trend without changing curriculum or staffing. When we train staff and parents to use these tools, outcomes can be even more dramatic.

Why choose Process Solutions?
Local relationships and support that will be here for the long term
Clinical expertise and history Proven tools, proven outcomes Research experience and national
partnerships for excellence Shared values

What do you have to gain? Impact on target behaviors, enhanced
student efficacy and achievement, enhanced staff morale
Publicity and recognition for innovation Opportunity and research data to obtain
grant funding
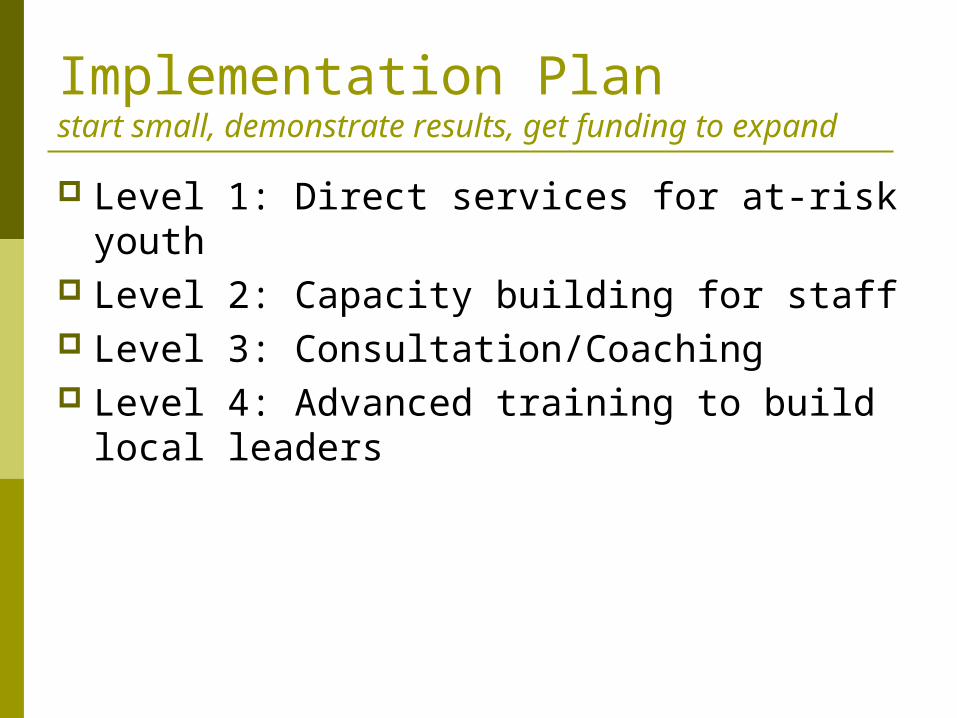
Implementation Planstart small, demonstrate results, get funding to expand
Level 1: Direct services for at-risk youth Level 2: Capacity building for staff Level 3: Consultation/Coaching Level 4: Advanced training to build local
leaders

Level 1: Direct Services LEEP program – Learning and Empowerment
through Experiential Programs Up to 15 students 1 hour/week on-site groups for 6 weeks Finish with 1 day on adventure course Outcomes tracking for treatment and matched control
group Fidelity
Program manual Weekly facilitator consultation group Dual facilitator model

Level 2: Capacity Building
2 day PCM training (second semester) Content
Teach teachers the PCM model, which outlines basic skills in connecting, motivating, and reducing conflict in the classroom for all 6 personality types
Teach tools for empowering students to get their psychological needs and motivators met in healthy, productive ways (rather than with drugs/alcohol/violence)
Teach basics of transforming the classroom into an environment that supports all learning styles and engages all students
Could be applied for parents as well (perhaps even include parents?)
Fidelity Manual and rigorous certification training Regular group consultation among trainers Dual trainer model

Level 3: Consultation/Coaching PVPS staff on-site for regular consultation
and coaching 1 hour ten times during semester
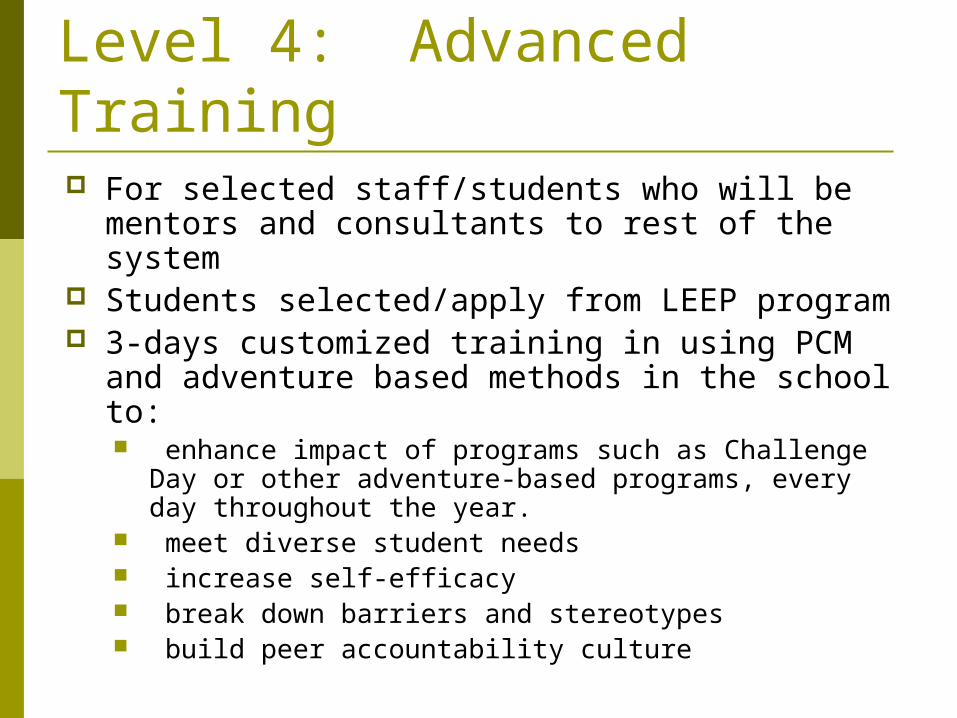
Level 4: Advanced Training For selected staff/students who will be mentors
and consultants to rest of the system Students selected/apply from LEEP program 3-days customized training in using PCM and
adventure based methods in the school to: enhance impact of programs such as Challenge Day or
other adventure-based programs, every day throughout the year.
meet diverse student needs increase self-efficacy break down barriers and stereotypes build peer accountability culture

Funding Options Funds that directly relate to these services
Safe and Drug Free Schools dollars Staff Development funds At Risk Student funds
Other options?

Anticipating resistance
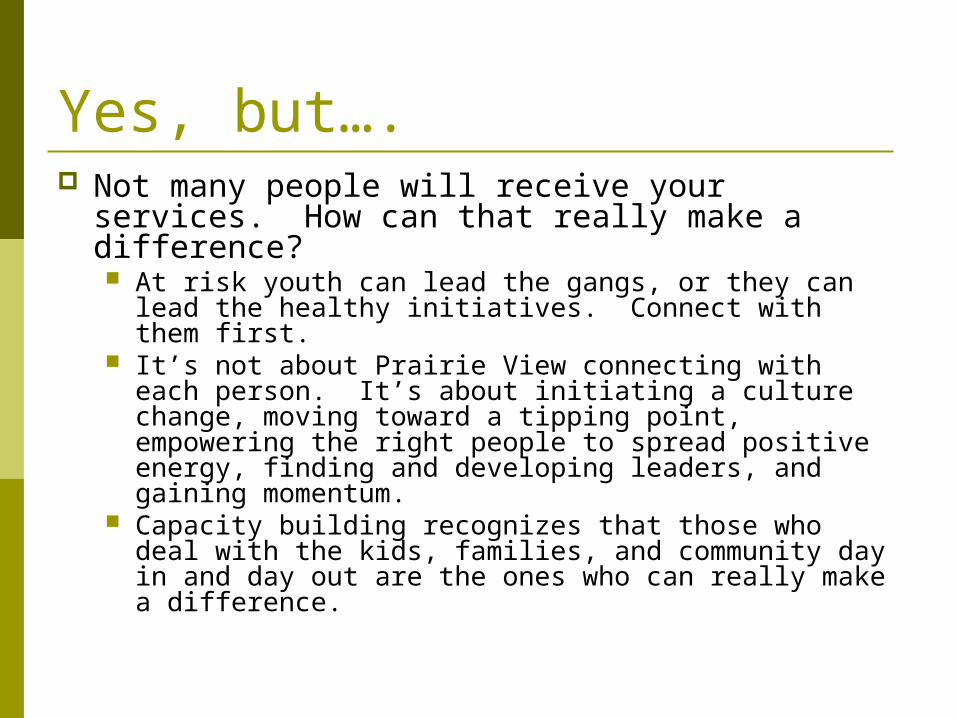
Yes, but…. Not many people will receive your services. How
can that really make a difference? At risk youth can lead the gangs, or they can lead the
healthy initiatives. Connect with them first. It’s not about Prairie View connecting with each person.
It’s about initiating a culture change, moving toward a tipping point, empowering the right people to spread positive energy, finding and developing leaders, and gaining momentum.
Capacity building recognizes that those who deal with the kids, families, and community day in and day out are the ones who can really make a difference.

Yes, but…. What about the kids who are already
using? You can’t stop them, but you can begin to
create a culture and environment that is incompatible with drug/alcohol abuse
This is a long-term investment

Yes, but…. When will we fit this all in?
How are at risk youth spending their time now? How productive is it? What are they accomplishing?
How much time are staff spending dealing with the distraction of disengaged youth, consequences of drug/alcohol use and other problems we are attempting to address?
The intended result is that everyone involved (staff and students) are making more productive use of their precious time.

Yes, but…. What about the schools who aren’t involved…what can they
do? Assist in efforts to find funding Work to develop community coalitions and partnerships Volunteer to be a control group Send one or two staff to our open enrollment seminars to test-
drive what we do Initial demonstration training should include staff from around
the district so we can discuss this question during those two days
Promote the program and listen to what others are learning

Obtaining Collaboration Built on existing relationship with the
district’s education coordinator and principle from one of the grade schools
Proposal presented to district site council Follow-up presentations and planning
meetings with principles and counselors from the two participating schools
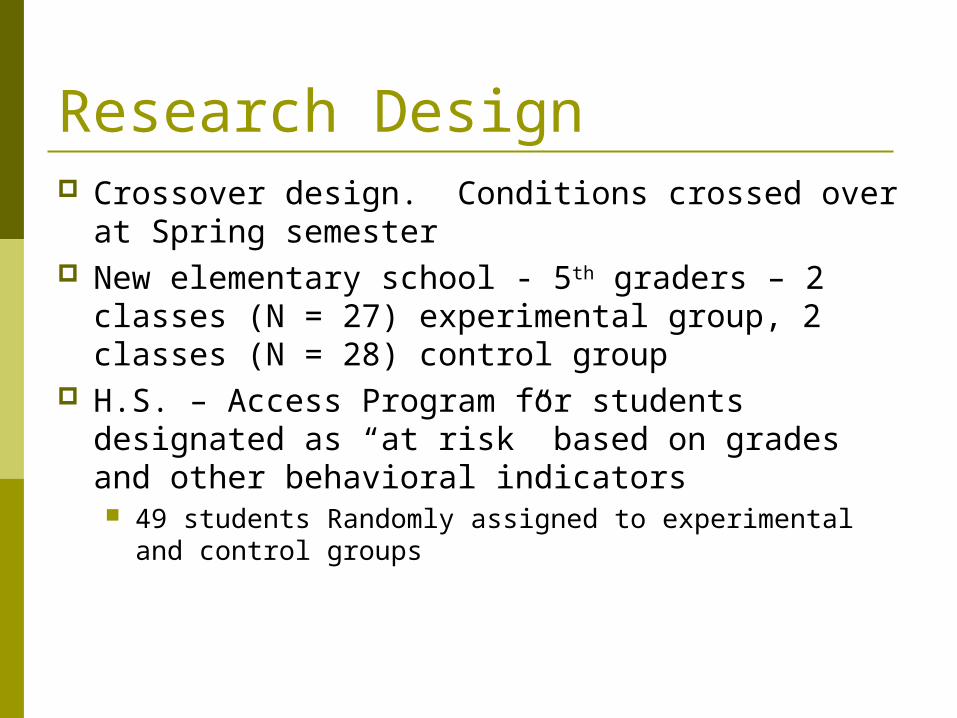
Research Design Crossover design. Conditions crossed over at
Spring semester New elementary school - 5th graders – 2 classes
(N = 27) experimental group, 2 classes (N = 28) control group
H.S. – Access Program for students designated as “at risk” based on grades and other behavioral indicators 49 students Randomly assigned to experimental and
control groups
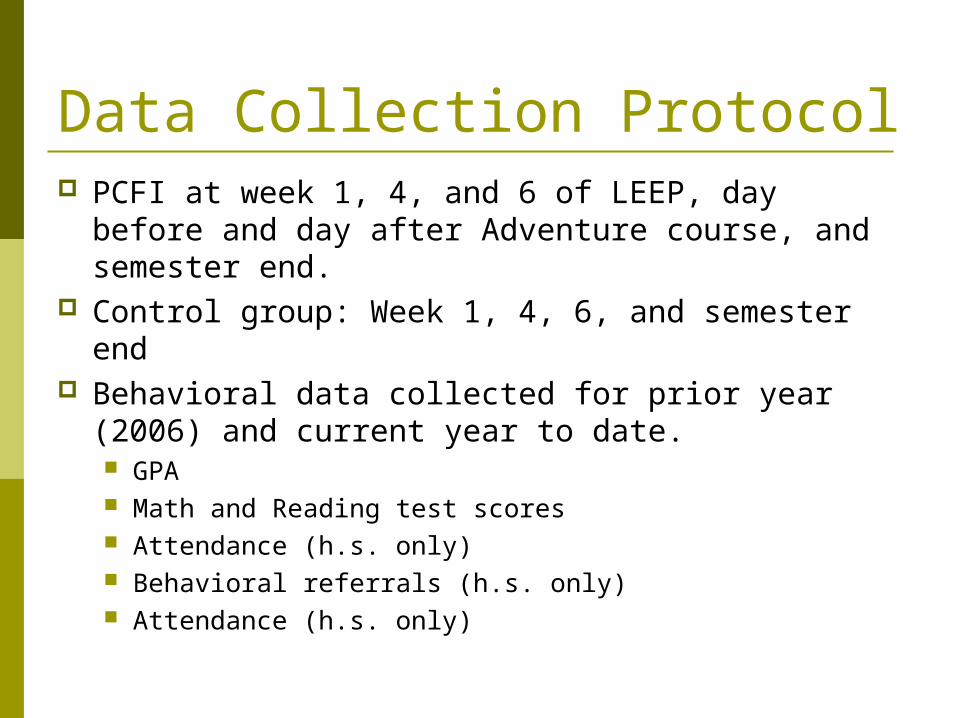
Data Collection Protocol PCFI at week 1, 4, and 6 of LEEP, day before and
day after Adventure course, and semester end. Control group: Week 1, 4, 6, and semester end Behavioral data collected for prior year (2006)
and current year to date. GPA Math and Reading test scores Attendance (h.s. only) Behavioral referrals (h.s. only) Attendance (h.s. only)
Challenges along the way Getting all the PCFI data collected
Designated internal staff person trained to collect all PCFI data for every condition
All PCFIs were completed in classroom setting, same time of day (even for adventure course)
PVPS facilitators brought data back to our lab for scoring
Our outcomes coordinator had constant contact with school to update on status of data collection, missing data, etc.

Challenges along the way Changing plans mid-stream
H.S. staff didn’t show up for consultation, didn’t support LEEP program
Resources and funds diverted to elementary school for second semester
Challenges along the way Gathering behavioral data
Took several months for school to collect and deliver all the data
Lots of missing data, no referral or attendance data for elementary students
Lots of passing the buck

What we’ve got so far! Psychometrics of the PCFI PCFI self-efficacy data for program and
control groups Associated behavioral data for program
and control groups
Testing Internal Consistency 49 high school students completed PCFI-16 at 4
time frames throughout semester. Program group (N = 25) also completed PCFI before and after day on adventure course
55 5th grader students completed PCFI-8 at 4 time frames throughout semester. Program group (N = 28) also completed PCFI before and after day on adventure course

Full Scale ReliabilityPCFI-16 and PCFI-8
0.50.550.6
0.650.7
0.750.8
0.850.9
0.951
Week 1 Week 3 Week 6 Pre-Adv.Course
Post-Adv.
Course
Week13
Time Frame
PCFI-16
PCFI-8

Implications Reliability goes up with repeated administrations
(would be expected) but stabilizes somewhat over time
As with our previous experience, initial administration with a group is less reliable than follow-up administrations (demand characteristics, lack of trust, etc.)
8-item PCFI performed respectably, may present a viable alternative for younger children
Examining test-retest reliability, and subscale characteristics are the next steps

Pre-Test Mid-TestPost-Test Adv-Pre Adv-Post
Semester End
Pre to End
Change
Pre to End St. Dev.
Pre to End
Effect
Pre to Adv Post Change
Pre to Adv Post
Effect
Motivational 55.51 60.00 63.33 64.07 61.85 62.22 6.71 13.46 0.50 6.34 0.45Cognitive 61.38 62.76 65.19 65.19 61.48 62.59 1.21 14.57 0.08 0.10 0.01Relational 63.10 65.17 64.81 66.67 66.67 64.81 1.71 13.26 0.13 3.57 0.25Affective 63.79 66.55 66.30 65.93 67.41 66.30 2.51 16.84 0.15 3.62 0.21GLF 60.95 63.62 64.91 65.46 64.35 63.98 3.03 11.04 0.27 3.40 0.28
Prairie Elementary School - Program Group
20.0
30.0
40.0
50.0
60.0
70.0
80.0
Motivational Cognitive Relational Affective GLF
Ave
rage
Sco
re
Pre-Test Mid-Test Post-Test Adv-Pre Adv-Post Semester End

Pre-Test Mid-TestPost-Test
Semester End
Pre to End
Change
Pre to End St. Dev.
Pre to End
Effect
Motivational 58.00 58.89 57.31 55.00 -3.00 8.53 -0.35Cognitive 65.00 58.89 60.00 57.69 -7.31 12.03 -0.61Relational 63.33 62.22 63.46 62.69 -0.64 13.32 -0.05Affective 67.67 71.85 66.54 65.00 -2.67 12.01 -0.22GLF 63.50 62.96 61.83 60.10 -3.40 7.97 -0.43
Prairie Elementary School - Control Group
20.0
30.0
40.0
50.0
60.0
70.0
80.0
Motivational Cognitive Relational Affective GLF
Ave
rage S
core
Pre-Test Mid-Test Post-Test Semester End

Prairie Elementary – PCFI Results
Motivational
55.057.059.061.063.065.067.069.071.073.075.0
Pre-
Test
Mid-Te
st
Post-
Test
Adv-P
re
Adv-P
ost
Semes
ter E
nd
Ave
rage
Sco
re
Program Control

Prairie Elementary – PCFI Results
Cognitive
55.057.059.061.063.065.067.069.071.073.075.0
Pre-
Test
Mid-Te
st
Post-
Test
Adv-P
re
Adv-P
ost
Semes
ter E
nd
Ave
rage
Sco
re
Program Control

Prairie Elementary – PCFI Results
Relational
55.057.059.061.063.065.067.069.071.073.075.0
Pre-
Test
Mid-Te
st
Post-
Test
Adv-P
re
Adv-P
ost
Semes
ter E
nd
Ave
rage
Sco
re
Program Control

Prairie Elementary – PCFI Results
Affective
55.057.059.061.063.065.067.069.071.073.075.0
Pre-
Test
Mid-Te
st
Post-
Test
Adv-P
re
Adv-P
ost
Semes
ter E
nd
Ave
rage
Sco
re
Program Control
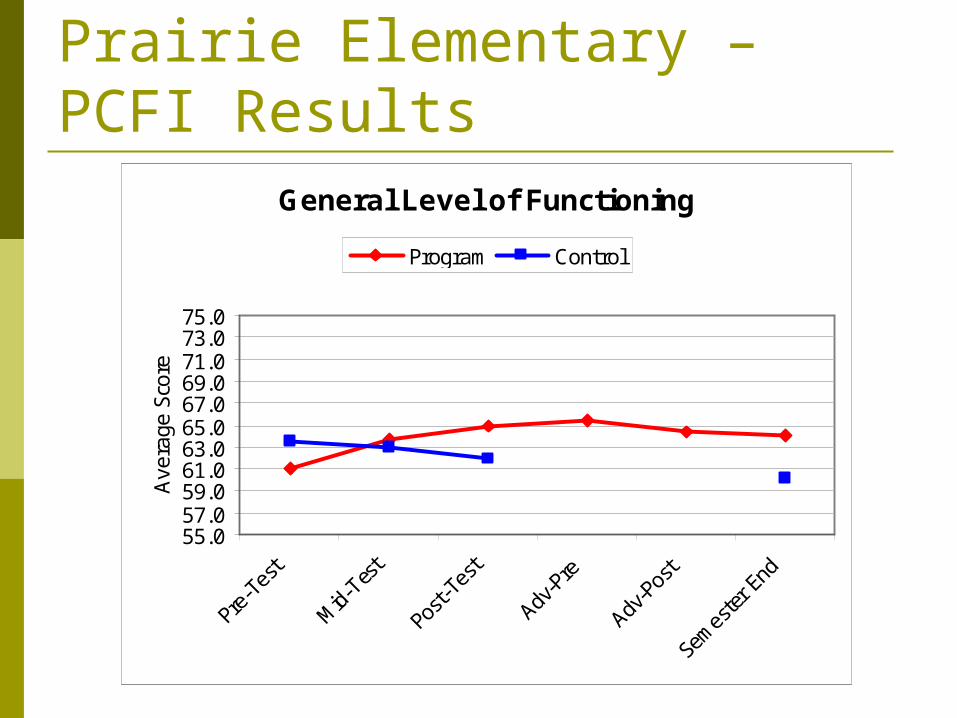
Prairie Elementary – PCFI Results
General Level of Functioning
55.057.059.061.063.065.067.069.071.073.075.0
Pre-
Test
Mid-Te
st
Post-
Test
Adv-P
re
Adv-P
ost
Semes
ter E
nd
Ave
rage
Sco
re
Program Control
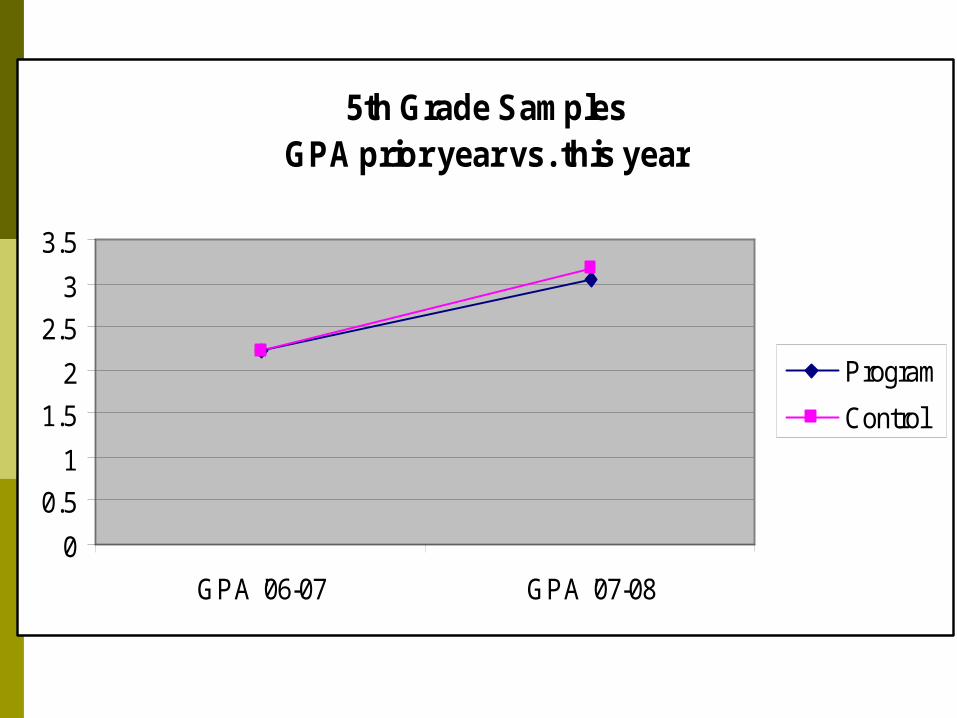
5th Grade SamplesGPA prior year vs. this year
0
0.5
1
1.5
2
2.5
3
3.5
GPA '06-07 GPA '07-08
Program
Control
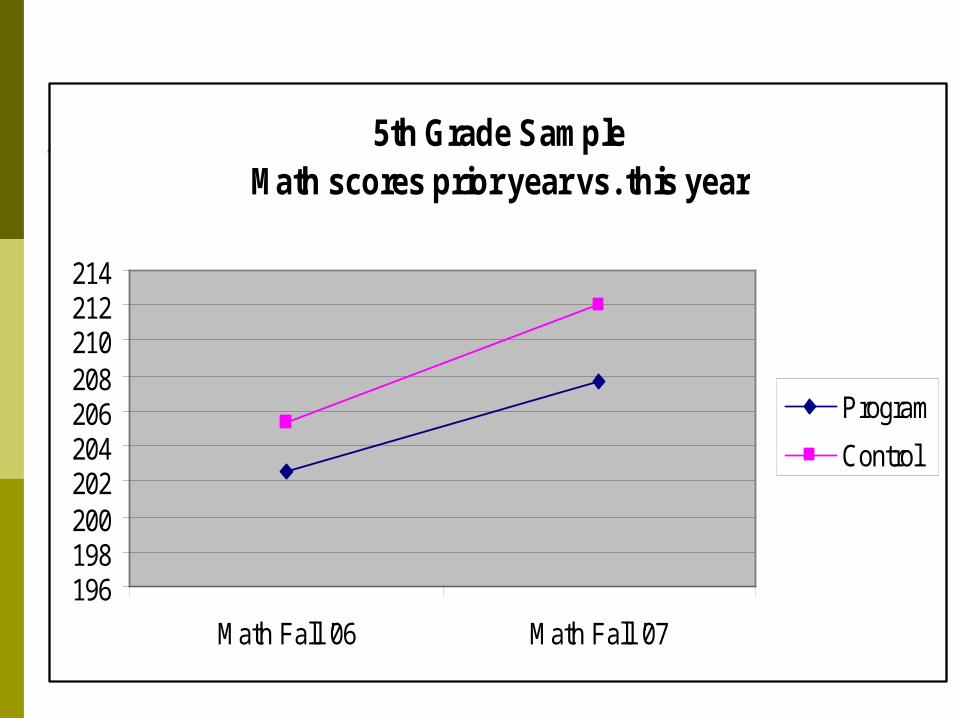
5th Grade SampleMath scores prior year vs. this year
196198200202204206208210212214
Math Fall '06 Math Fall '07
Program
Control
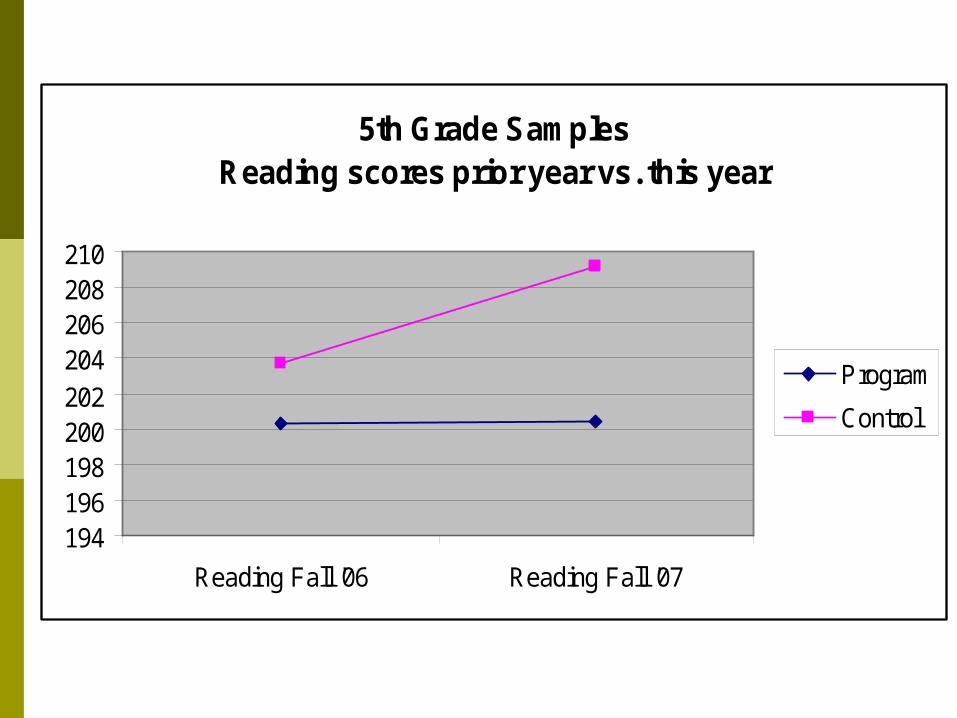
5th Grade SamplesReading scores prior year vs. this year
194196198200202204206208210
Reading Fall '06 Reading Fall '07
Program
Control

GPA '06-07
GPA '07-08
Change Size
Stan. Dev.
Effect Size Sig. Level
Program 2.22 3.05 0.83 1.46 0.57 Control 2.22 3.18 0.96 1.66 0.58 n.s
Math Fall '06
Math Fall '07
Change Size
Stan. Dev.
Effect Size
Program 202.62 207.68 5.06 11.62 0.44Control 205.36 212.04 6.68 11.93 0.56 n.s
Reading Fall '06
Reading Fall '07
Change Size
Stan. Dev.
Effect Size
Program 200.27 200.39 0.12 13.13 0.01Control 203.73 209.15 5.42 11.72 0.46 p = .03
Behavioral Measures Prairie Elementary

Prairie Elementary SummaryProgram Vs. Control Summary PCFI
No difference between groups on any scales at beginning
Motivational scale significantly higher at end for program group
Cognitive scale approaching significance at end for program group
GPA Change Scores N.S. difference between groups
Math Change Scores N.S. difference between groups
Reading Change Scores Control group started higher and made significantly
more change than program group

Pre-Test Mid-TestPost-Test Adv - Pre
Adv - Post
Semester End
Pre to End
Change
Pre to End St. Dev.
Pre to Post
Effect
Pre to Adv Post Change
Pre to Adv Post
Effect
Motivational 56.00 56.35 54.96 57.63 59.00 58.17 2.17 13.04 0.17 3.00 0.24Cognitive 49.04 50.96 51.70 52.74 55.60 50.67 1.63 17.50 0.09 6.56 0.43Relational 55.65 50.78 54.37 55.26 53.60 47.50 -8.15 14.34 -0.57 -2.05 -0.14Affective 53.57 53.91 57.93 56.59 59.00 57.17 3.60 16.23 0.22 5.43 0.37GLF 53.57 53.00 54.74 55.56 56.80 53.38 -0.20 13.15 -0.01 3.23 0.27
Campus High School - Program Group
20.0
30.0
40.0
50.0
60.0
70.0
80.0
Motivational Cognitive Relational Affective GLF
Ave
rage S
core
Pre-Test Mid-Test Post-TestAdv - Pre Adv - Post Semester End
Pre-Test Mid-TestPost-Test
Semester End
Pre to End
Change
Pre to End St. Dev.
Pre to Post
Effect
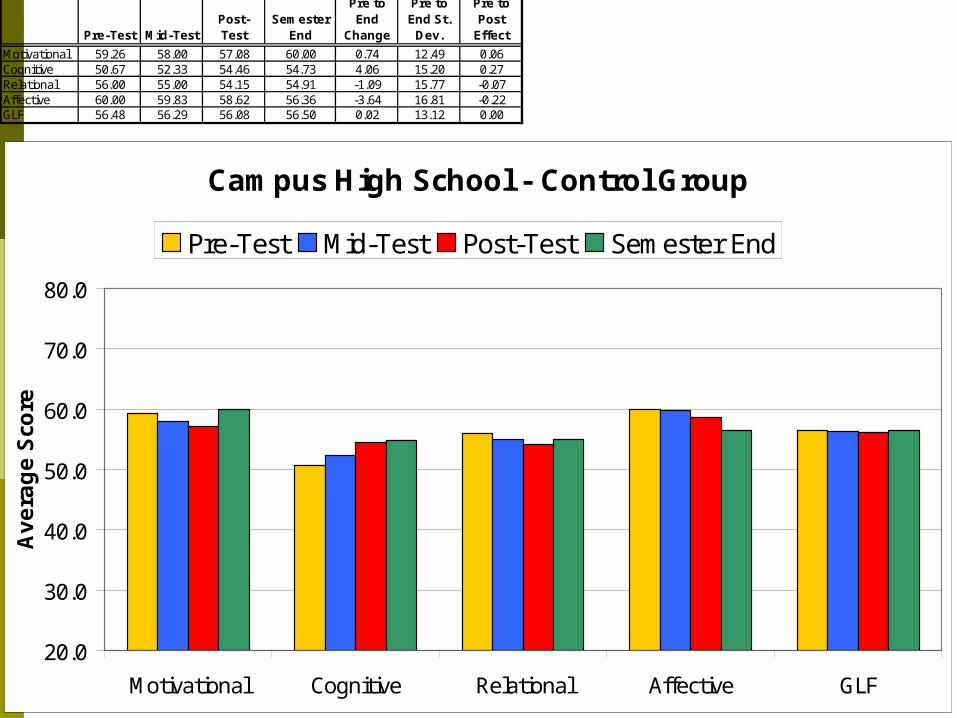
Motivational 59.26 58.00 57.08 60.00 0.74 12.49 0.06Cognitive 50.67 52.33 54.46 54.73 4.06 15.20 0.27Relational 56.00 55.00 54.15 54.91 -1.09 15.77 -0.07Affective 60.00 59.83 58.62 56.36 -3.64 16.81 -0.22GLF 56.48 56.29 56.08 56.50 0.02 13.12 0.00
Campus High School - Control Group
20.0
30.0
40.0
50.0
60.0
70.0
80.0
Motivational Cognitive Relational Affective GLF
Ave
rage S
core
Pre-Test Mid-Test Post-Test Semester End

Campus High School – PCFI Results
Motivational
45.0047.0049.0051.0053.0055.0057.0059.0061.0063.0065.00
Pre-
Test
Mid-Te
st
Post-
Test
Adv-P
re
Adv-P
ost
Semes
ter E
nd
Ave
rage
Sco
re
Program Control

Campus High School – PCFI Results
Cognitive
45.0047.0049.0051.0053.0055.0057.0059.0061.0063.0065.00
Pre-
Test
Mid-Te
st
Post-
Test
Adv-P
re
Adv-P
ost
Semes
ter E
nd
Ave
rage
Sco
re
Program Control

Campus High School – PCFI Results
Relational
45.0047.0049.0051.0053.0055.0057.0059.0061.0063.0065.00
Pre-
Test
Mid-Te
st
Post-
Test
Adv-P
re
Adv-P
ost
Semes
ter E
nd
Ave
rage
Sco
re
Program Control

Campus High School – PCFI Results
Affective
45.0047.0049.0051.0053.0055.0057.0059.0061.0063.0065.00
Pre-
Test
Mid-Te
st
Post-
Test
Adv-P
re
Adv-P
ost
Semes
ter E
nd
Ave
rage
Sco
re
Program Control

Campus High School – PCFI Results
General Level of Functioning
45.0047.0049.0051.0053.0055.0057.0059.0061.0063.0065.00
Pre-
Test
Mid-Te
st
Post-
Test
Adv-P
re
Adv-P
ost
Semes
ter E
nd
Ave
rage
Sco
re
Program Control

High School Students - GPA
0
0.5
1
1.5
2
2.5
GPA '06-07 GPA '07-08
Program
Control
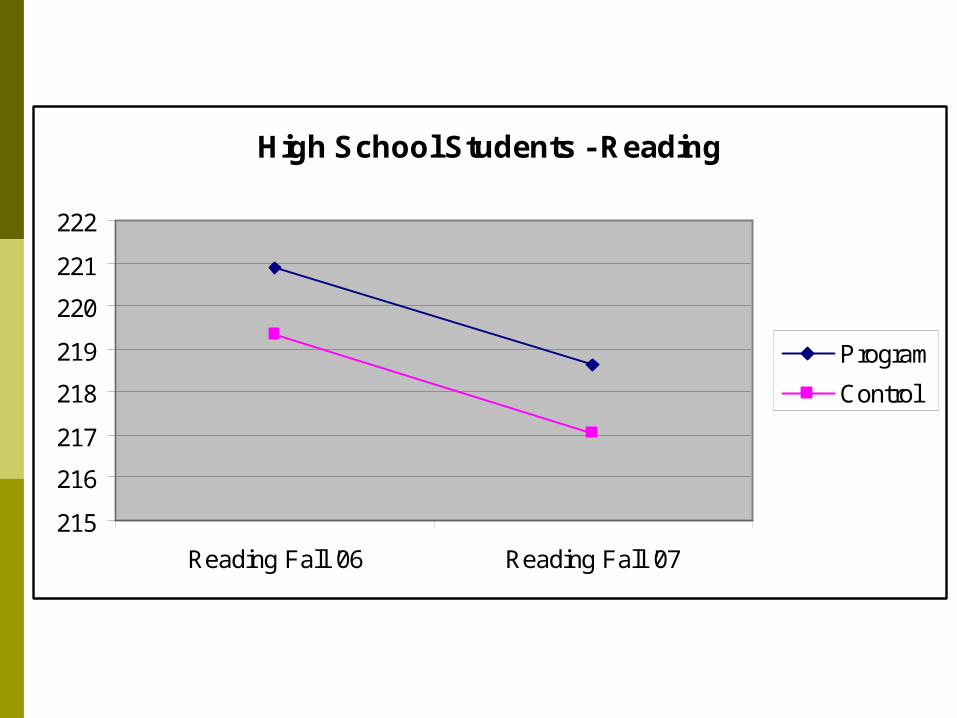
High School Students - Reading
215
216
217
218
219
220
221
222
Reading Fall '06 Reading Fall '07
Program
Control
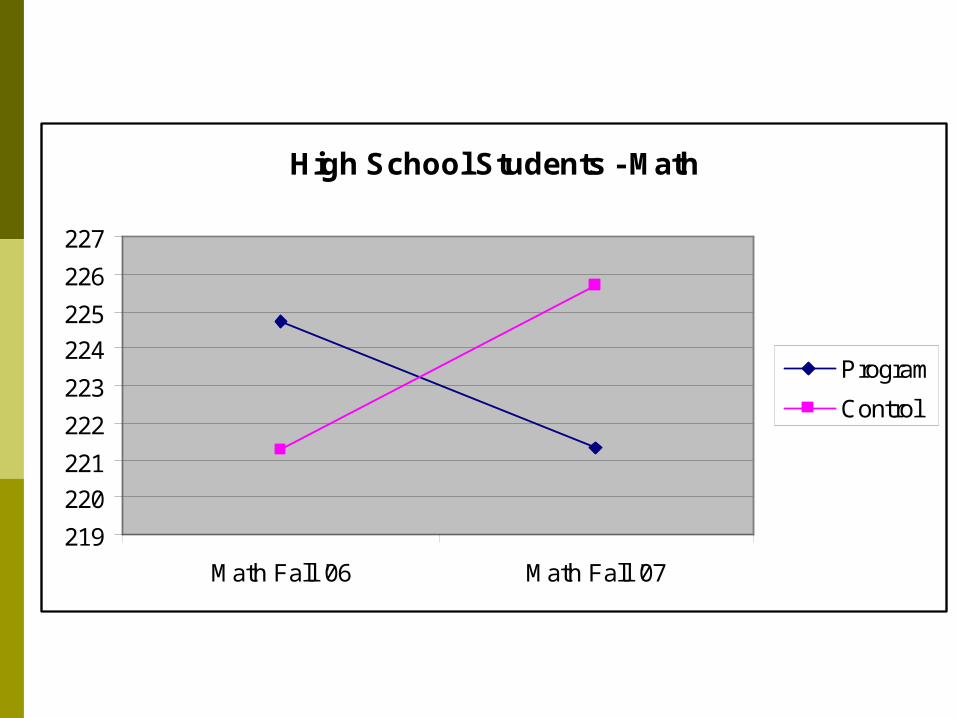
High School Students - Math
219
220
221
222
223
224
225
226
227
Math Fall '06 Math Fall '07
Program
Control

High School Students - Missed Days
0
2
4
6
8
10
12
14
Attendance '06-07 Attendance '07-08
Program
Control
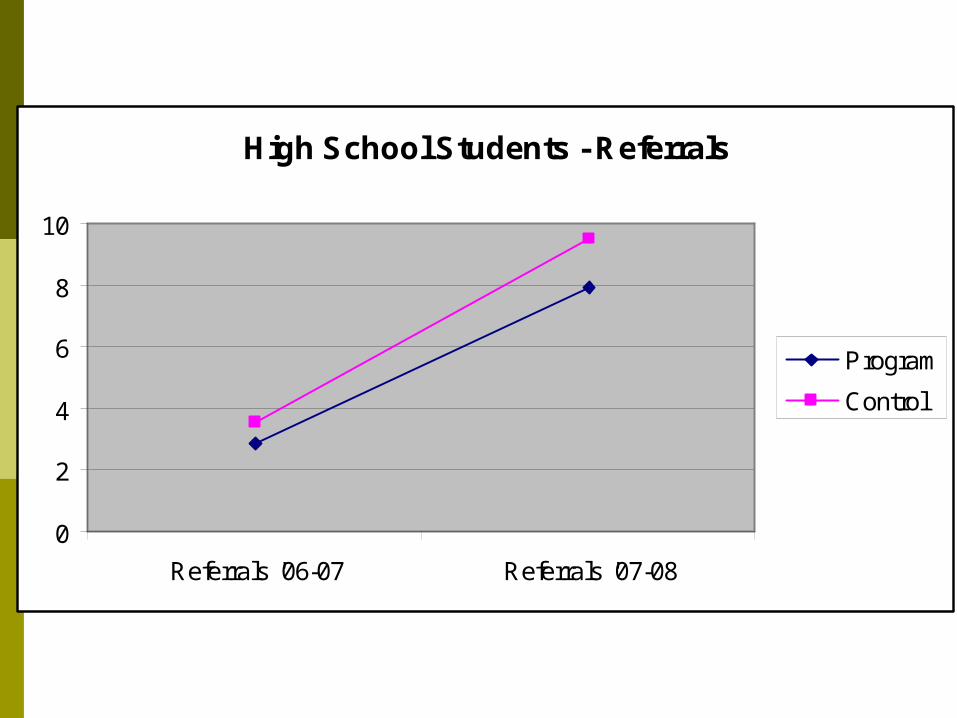
High School Students - Referrals
0
2
4
6
8
10
Referrals '06-07 Referrals '07-08
Program
Control

Behavioral Measures – Campus H.S.
GPA '06-07 GPA '07-08Change
SizeStan. Dev.
Effect Size Sig. Dif?
Program 1.86 2.04 0.18 0.83 0.22Control 1.61 1.73 0.12 0.66 0.18 n.s.
Referrals '06-07
Referrals '07-08
Change Size
Stan. Dev.
Effect Size
Program 2.85 7.94 5.09 5.28 0.96Control 3.54 9.48 5.94 5.25 1.13 n.s
Attendance '06-07
Attendance '07-08
Change Size
Stan. Dev.
Effect Size
Program 11.81 3.72 -8.09 8.26 -0.98Control 9.19 5.43 -3.76 7 -0.54 0.01
Math Fall '06Math Fall
'07Change
SizeStan. Dev.
Effect Size
Program 224.74 221.35 -3.39 8.83 -0.38Control 221.26 225.67 4.41 9.91 0.45 0.02
Reading Fall '06
Reading Fall '07
Change Size
Stan. Dev.
Effect Size
Program 220.91 218.62 -2.29 8.93 -0.26Control 219.35 217.04 -2.31 9.19 -0.25 n.s.

H.S. At risk youth SummaryProgram Vs. Control Summary PCFI
Groups did not differ significantly at the beginning on any scales
Groups did not differ significantly at the end on any scales
GPA Change Scores N.S. difference at beginning or end of semester
Math Change Scores N.S. difference at beginning or end of semester
Reading Change Scores Control group started higher and made significantly
more change than program group

Haysville Teachers on Adventure Course (n =9)
20.0
30.0
40.0
50.0
60.0
70.0
80.0
Motivational Cognitive Relational Affective GLF
Ave
rage
Sco
re
Pre-Test Post-Test

PCM Quality Educator Relations Seminar (n = 18)August 29-30, 2007
20.0
30.0
40.0
50.0
60.0
70.0
80.0
Motivational Cognitive Relational Affective GLF
Avera
ge S
core
Pre-Test Post-Test

Teacher Capacity building
Pre-Test Post-Test Change Effect Size
Motivational 64.22 65.78 1.56 0.23Cognitive 58.00 62.67 4.67 0.44Relational 58.22 61.33 3.11 0.35Affective 59.33 61.11 1.78 0.18GLF 59.94 62.72 2.78 0.37
Pre-Test Post-Test Change Effect Size
Motivational 62.67 67.56 4.89 0.69Cognitive 62.67 68.89 6.22 0.66Relational 56.89 62.67 5.78 0.67Affective 60.00 65.78 5.78 0.80GLF 60.56 66.22 5.66 0.78
Day on the adventure course
Two-day course on student communication and motivation
Alternative H.S. Students School-based groups running
autonomously using school staff Each semester the group comes to the
adventure course.

Haysville Alternative (n = 16)
20.0
30.0
40.0
50.0
60.0
70.0
80.0
Motivational Cognitive Relational Affective GLF
Avera
ge S
core
Pre-Test Pre-Adv. Post-Adv. Mid-Test Post-Test
Pre-Test Pre-Adv. Post-Adv. Mid-Test Post-Test Change St. Dev. Effect Size
Motivational 56.50 59.00 64.75 59.20 61.50 5.00 10.82 0.46Cognitive 50.00 56.50 63.25 52.53 54.25 4.25 9.58 0.44Relational 49.25 55.75 63.50 52.00 49.25 0.00 11.24 0.00Affective 51.50 57.75 68.25 58.40 59.50 8.00 13.22 0.61GLF 51.81 57.25 64.94 55.53 56.13 4.32 8.77 0.49
Good news / Bad news Prairie Elementary has invested fully, is moving
forward with teacher capacity building and culture shifts.
Campus high school still teetering, trying to decide what to do – wants us to treat the problem kids, little ownership for culture change.
Alternative high school continues to use the adventure course, and rely on us for consultation, and achieving great results.
Comparing these three schools, seems that it pays to commit over time, invest in internal capacity, and integrate adventure more fully into the educational climate.
Next Steps Finish out school year, see what second semester
data after crossover looks like. Definitely increase intensity of school-based
interventions in both schools. Continue to track behavioral and PCFI data over
the next 12-18 months. Stick with protocol as best we can. Explore ways to increase motivational and
relational scales more. Continue tracking CTC data Explore gender differences as well as the
psychometrics of PCFI-8 Examine fidelity of implementation better