school and student characteristics & student … september/2015 annual report...school and...
TRANSCRIPT

School and Student Characteristics &
Student Achievement Outcomes
FY 2016 Commission Activities
School and Student Characteristics and
Student Achievement Outcomes One of the many ways that ACCSC verifies the effectiveness of its work and that of the programs and services offered by ACCSC-accredited institutions is through detailed analysis of school characteristics and performance data. The Commission recently completed its analysis of the 2015 Annual Report and found once again that its accredited institutions continue to demonstrate significant institutional and student success through their rates of student graduation and graduate employment attainment.
These data are important indicators and are used by ACCSC to better understand its accredited institutions and the trends associated with career education, as well as to develop the Commission’s accountability standards.
The information contained in this report is a summary of the key data points from the 2015 ACCSC Annual Report and provides detailed information pertaining to ACCSC school characteristics, student characteristics, program characteristics, and student achievement rates and trends.
Sincerely,
Michale S. McComis, Ed.D. Executive Director

2
Student Demographics Overall, the analysis of the 2015 Annual Report data shows that student enrollment continues to decline. Although the student population has decreased, student demographics remain consistent. Based upon data submitted in the Annual Report, ACCSC-accredited institutions and their students show the following characteristics: 77% of the schools had 300 or fewer students as of June 30, 2015. Average enrollment as of June
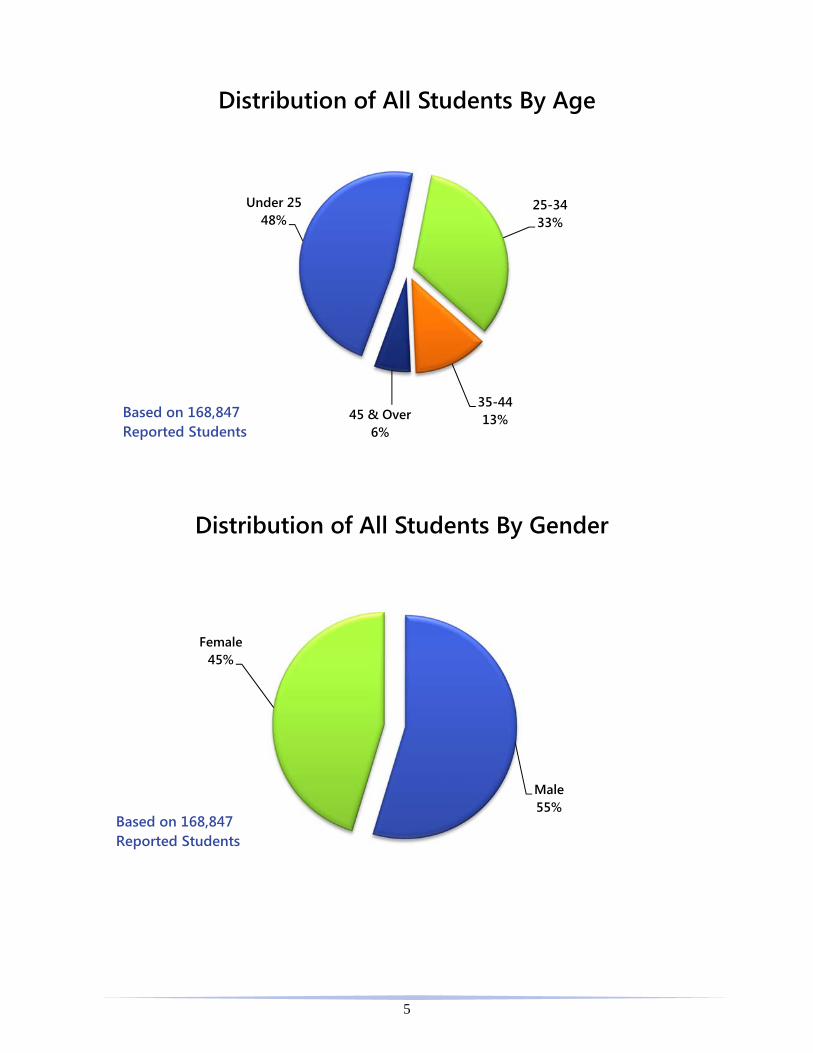
30, 2015 was 245 students. The majority of institutions are in metropolitan areas with populations of at least 250,000. 48% of the students are under the age 25 and 33% of the students are in the age group 25-34. Student population is evenly distributed with regard to gender, although the percentage of male
students enrolled continues to increase slightly. 59% of classified students represent ethnic minority groups. 100% of enrolled students have a high school diploma or equivalent and/or some postsecondary
education.
These figures show that ACCSC-accredited institutions continue to provide training in small school formats and serve a large percentage of non-traditional and ethnic minority students in urban and suburban settings. Program Characteristics With respect to the types of programs offered by ACCSC-accredited institutions, schools submitted summary information for 5,296 programs in over 120 different occupational areas. Key characteristics include the following: 40% of ACCSC-accredited institutions offer a degree program;
o 31% of all programs offered at ACCSC-accredited institutions are degree programs. Of the 1,517 reported degree programs, 1,119 are associate degrees (74%), 360 are baccalaureate
degrees (24%), and 38 are master’s degrees (2%). 61% of students are enrolled in non-degree programs, 25% of students are enrolled in associate
degree programs, 13% of students are enrolled in baccalaureate degree programs and 1% of students are enrolled in master’s degree programs.
With fewer schools reporting data for the 2015 Annual Report, the total number of programs reported represents a 3% decrease over the prior year. Member institutions continue to assess program offerings and adapt to the changing needs of prospective students and to meet the needs of community employers. The overall percentage of ACCSC degree granting institutions decreased to 40%, a decrease of 1%. Although the graduate programs continue to represent a small portion of the degree offerings (2%), the number of Master’s degrees decreased over the past year.

3
200,113
183,963
168,847
010,00020,00030,00040,00050,00060,00070,00080,00090,000
100,000110,000120,000130,000140,000150,000160,000170,000180,000190,000200,000210,000
2013 2014 2015
Enrollment as of June 30, 2015
Based on 724 Annual Reports
Based on 705 Annual Reports
Based on 690 Annual Reports
300 or Less Students
77%
301-600 Students16%
601-900 Students4% 901 + Students
3%
Institution Size By Student Enrollment - All Schools
Based on 690 Annual Reports
Submitted
Average Enrollment = 245 Students

4
Metro Level A - 1 Million or Greater
30%
Metro Level B -250,000 to 999,999
25%
Metro Level C -100,000 to 249,999
18%
Metro Level D -Less than 100,000
6%
Urbanized Area -50,000 or Greater
7%
Urban Cluster -2,500 to 49,999
10%
Rural Area - All Others
4%
Distribution of All Schools by Population Area
Based on 690Annual Reports Submitted
Average Reported Household Median Income = $51,463Average Reported Unemployment Rate = 6.1%
1386532
510322340332
212188
124169166
137106
8184
544251
2922
0 200 400 600 800 1000 1200 1400
Allied HealthAutomotive/Motorcycle/Marine
Building & Industrial TradesBusiness & Business Related
Beauty & Skin CareInformation TechnologyHolistic Arts & SciencesNursing & Health Aide
Legal & SecurityCulinary Arts
Art-Commercial & IndustrialRadio, Television, Motion Pictures
Heavy Equipment Operator & Truck DriverAviation
Specialized FieldsElectronics
Architecture, Engineering, & DraftingArt-Fine
Veterinary Science & Animal Related ArtsFashion & Interior Design
Distribution of Programs by Program Area
5
Under 2548%
25-3433%
35-4413%45 & Over
6%
Distribution of All Students By Age
Based on 168,847Reported Students
Male55%
Female45%
Distribution of All Students By Gender
Based on 168,847 Reported Students

6
White/Non-Hispanic
41%
Hispanic29%
Black/Non-Hispanic
25%Asian/Pacific
Islander4%
Native American/Alaskan
1%
Distribution of All Students By Ethnicity
Based on 150,362 Reported and Classified Students
Certificate / Diploma
69%
Associate Degree23%
Baccalaureate Degree
7%
Master's Degree1%
Distribution of Programs By Credential
Based on 4887 Program Enrollment
Summaries Submitted
Total Percentage of Degree
Programs = 31%

7
Offers a Degree Program
40%
Does Not Offer a Degree Program
60%
Percentage of Schools Which Offer Degree Programs
Based On 690Annual Reports
Submitted
1
4
5
3
25
0
16
27
37
280
23
69
107
272
302
346
0 50 100 150 200 250 300 350
Master of Public Health
Master of Fine Arts
Master of Business Administration
Master of Arts
Master of Science
Bachelor of Professional Studies
Bachelor of Applied Science
Bachelor of Arts
Bachelor of Fine Arts (BFA, BGA)
Bachelor of Science (BS, BSN, BHS)
Associate of Arts
Associate of Applied or Specialized Business
Associate of Specialized Technology
Associate of Science
Associate of Occupational Studies (AOS, OAD)
Associate of Applied Science
Distribution of Degree Programs By Credential
1,119 Associate Degrees
360 Baccalaureate Degrees
38 Master's DegreesBased on 1,517 Total Reported Degree

8
22
150
190
374
1,229
398
976
1,834
18,920
722
1,390
3,428
9,880
12,346
14,007
102,981
Master of Public Health
Master of Business Administration
Master of Arts
Master of Fine Arts
Master of Science
Bachelor of Applied Science
Bachelor of Arts
Bachelor of Fine Arts (BFA, BGA)
Bachelor of Science (BS, BSN, BHS)
Associate of Arts
Associate of Applied or Specialized Business
Associate of Specialized Technology
Associate of Science
Associate of Applied Science
Associate of Occupational Studies (AOS, OAD)
Non-Degree
Distribution of Student Enrollment By Program Credential
25% - Associate Degrees
13% - Baccalaureate Degrees
1% - Master's Degrees
61% - Non-Degree Programs
Based on 4,887 Total Reported Programs168,847 Students

9
Student Achievement Outcomes The Commission first promulgated the quantitative student achievement standards in 1998 based upon several studies conducted by the Center on Education and Training for Employment at the Ohio State University. During 2002, the Commission engaged in a comprehensive study of the student achievement requirements promulgated in 1998 and the associated processes of data collection and verification. The Commission continues to review comparative data and make adjustments to the methodology for the analysis of student achievement outcomes in order to ensure sound data collection and analysis. As part of its ongoing commitment to assessing student achievement in its accredited schools and the tools used to do so, during the 2015 Annual Report year, the Commission conducted an 11-year longitudinal study of the graduation and employment rates report from 2005 to 2015 in the ACCSC Annual Report. In so doing, the Commission hoped to discern the stability, predictability, and reliability of the rates used in establishing ACCSC’s benchmark rates. The Commission was particularly interested in whether there were significant year-over-year variations in the data reported. The longitudinal study applied the same formula to the 11-year data set as it has applied to the three-year data sets used to establish ACCSC’s benchmark student achievement rates. Overall, the Commission found that the data collected and the resulting benchmarking established from that data is both stable and reliable. In fact, there is little variation from ACCSC’s current benchmarks compared to the results of the 11-year longitudinal study. Also, as part of its systematic program of review, the National Center for Higher Education Management Systems reviewed ACCSC’s student achievement standards, practices, and the longitudinal study and found that “[t]aken together, these features provide considerable confidence in the soundness and appropriateness of ACCSC’s general approach to establishing quantitative performance criteria on selected student outcomes measures.” Previously, the Commission re-calculated student achievement benchmark rates every three years using a rolling average. Because the longitudinal data and study show no significant variation from the current benchmarks (with one exception), the Commission established the results of the 11-year longitudinal study as the basis for its new student achievement rates. The one exception is in programs 24 months in length or longer. This group of programs exhibits the largest variability and range of graduation rate outcomes. Once that variability was controlled for, the rate stabilized at 40%, which the Commission believes is an appropriate trigger for further monitoring in these longer programs. The established rates are semi-permanent meaning that while the Commission will continue to study and assess the reported rates of student achievement regularly, the Commission does not intend to adjust the rates unless the data suggest that an adjustment is warranted. With regard to the employment rate, the Commission’s 11-year longitudinal data and study yielded a 70% benchmark, which the Commission adopted. The employment rate for all programs was previously 70% and was only lowered due to the impact of the economic recession. The data show that employment rates overall have risen and thus found resetting the employment rate benchmark at 70% to be appropriate.

10
While graduation and employment rates play an integral role in an institution’s on-going programmatic and institutional assessment plan, an additional area that demonstrates student learning outcomes includes pass rates on licensing/certification examinations required for employment. The Commission has collected licensure/certification examination pass rate data through the Annual Report over the 11-year period and now requires schools to demonstrate a minimum 70% pass rate on licensure/certification examinations for those programs where a governmental entity requires students to pass the examination as a condition of employment. The Commission continues to refine protocols intended to give both schools and the Commission a framework for the review and assessment of student achievement rates and to provide a framework for assessing rates that are above benchmarks and above average as well as below benchmark rates.
ESTABLISHED BENCHMARK GRADUATION RATES
Program Length in Months
Average Rates of Graduation Demonstrates Acceptable
Student Achievement
Standard Deviation
Established Benchmark Graduation Rates
1-3 92% 8% 84% 4-6 84% 11% 73% 7-9 72% 12% 60%
10-12 69% 14% 55% 13-15 64% 14% 50% 16-18 62% 15% 47% 19-23 61% 18% 43% 24+ 53% 13% 40%
ESTABLISHED BENCHMARK EMPLOYMENT RATE
Program Length in Months
Average Rate of Employment Demonstrates Acceptable
Student Achievement
Standard Deviation
Established Benchmark Employment Rate
All Programs 78% 8% 70%

11
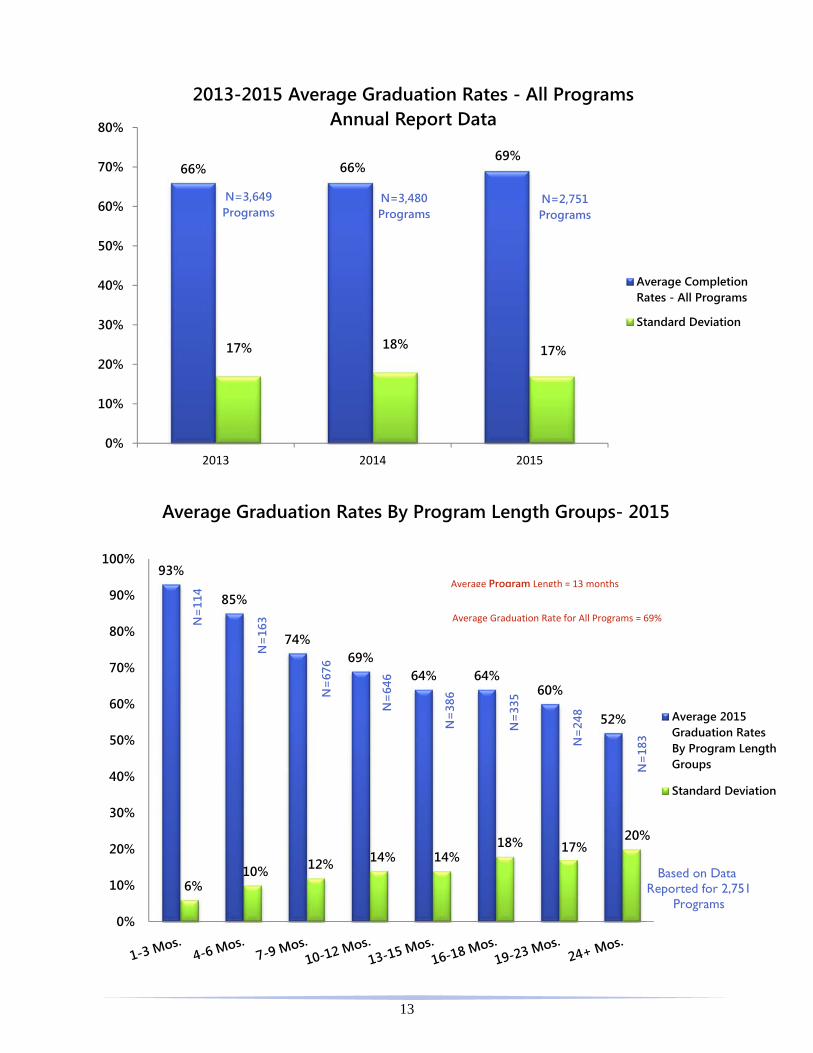
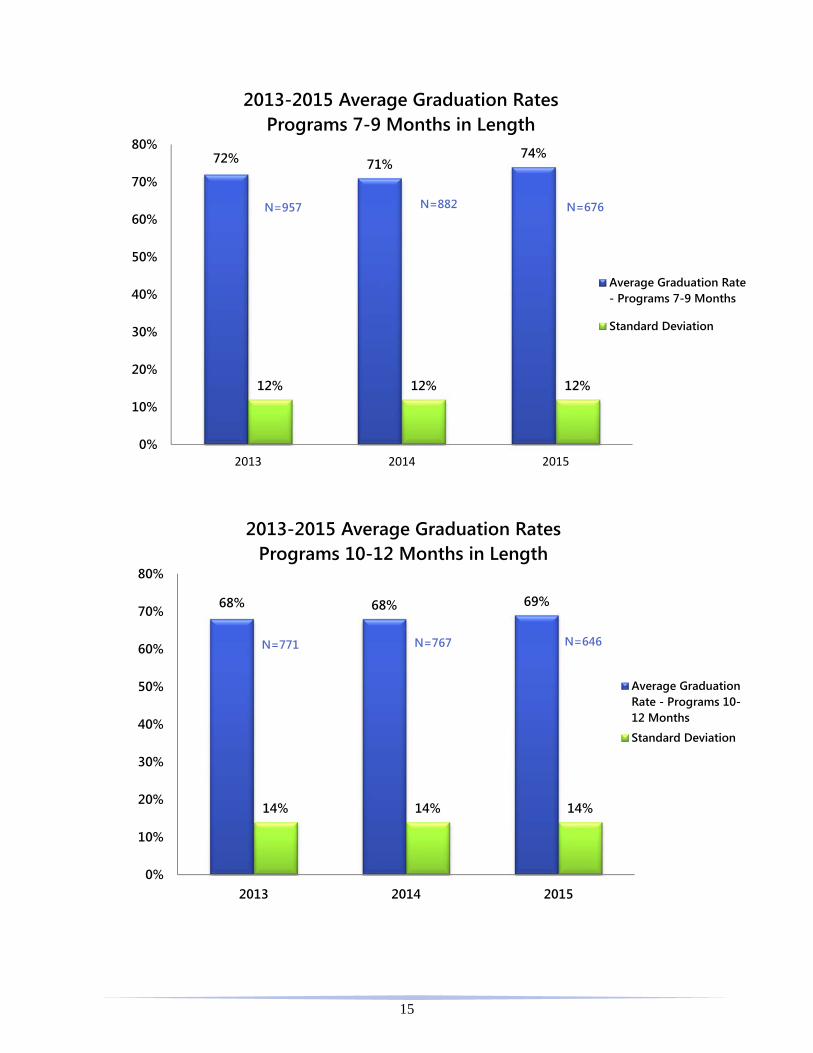
Analysis of the 2015 Annual Report Data The graduation rates reported by ACCSC-accredited institutions in the 2015 Annual Report are consistent with the data reported for previous years. For the Period 2013-2015, the annual average rate of graduation remained steady at 66% for 2013-2014; however, in 2015, the average rate of graduation increased moderately to 69%. Analysis of the three-year data found that the slight upturn seen in 2013 (75%) that was not maintained in 2014 as the employment rate dropped slightly to 74% was regained in 2015 (75%) as the average reported unemployment rate continues to decline. As noted above, the longitudinal study found that over the 11-year period, the employment rate is trending upward since its 11-year low in 2012. The analysis of graduation rates continues to show that program length has a strong influence on program graduation, i.e., as length increases graduation rates decline. This correlation is consistently the most substantial and significant relationship found in the Commission’s student achievement data and allows the Commission to evaluate programmatic performance within a context of program length comparability. The number of programs reported in the Commission’s recent review of student achievement data for the three-year period of 2013-2015 found that the total reported number of shorter programs (3 months or less) increased slightly in 2015. The reported number of programs 4-6 months in length increased approximately 19% over the three-year period. The number of programs greater than 6 months in length continue to decrease in all groupings of programs longer than 6 months. As the number of schools reporting decreases, the number of reported programs has decreased by approximately 25% over the last three years. Review of graduation rates for the three-year period of 2013-2015 found little to no variations over the three-year period in all program length groupings, although in all groupings, the 2015 graduation rate in each grouping was slightly higher than the previous years. Review of the revised groupings of programs of 19-23 months in length and 24 months and longer found that the graduation rates are consistent for the three-year period, supporting the determination that the revised groupings are a more natural breakpoint. However, the standard deviation continues to remain high, indicating a more heterogeneous distribution of graduation rates. The student achievement outcomes for longer programs are an area that the Commission intends to monitor with keen interest. While graduation and employment rates play an integral role in an institution’s on-going programmatic and institutional assessment plan, an additional area that demonstrates student learning outcomes includes pass rates on licensing/certification examinations required for employment. The Commission collects licensure/certification examination pass rate data through the Annual Report and implemented, effective July 1, 2015, the requirement that schools demonstrate a minimum 70% pass rate on licensure/certification examinations for those programs where a governmental entity requires students to pass the examination as a condition of employment. Review of the major areas requiring licensure such as allied health, nursing, cosmetology, massage therapy, and truck driving found the average pass rate has consistently exceeded 70% for the past three years. Overall, the student graduation and graduate employment attainment rates demonstrate that ACCSC-accredited institutions graduate a significant number of students and that a significant number of students attain training-related employment after graduation. The Commission

12
encourages its institutions to avoid using the benchmark rates as a goal for graduation and employment but as an assessment starting point and goal setting baseline. Institutions should continue to set the highest attainable goals with regard to student success and the rates of graduation and employment.
13
66% 66%69%
17% 18% 17%
0%
10%
20%
30%
40%
50%
60%
70%
80%
2013 2014 2015
2013-2015 Average Graduation Rates - All ProgramsAnnual Report Data
Average CompletionRates - All Programs
Standard Deviation
N=2,751Programs
N=3,480Programs
N=3,649Programs
93%
85%
74%69%
64% 64%60%
52%
6%10% 12% 14% 14%
18% 17%20%
0%
10%
20%
30%
40%
50%
60%
70%
80%
90%
100%
Average Graduation Rates By Program Length Groups- 2015
Average 2015Graduation RatesBy Program LengthGroups
Standard Deviation
Based on Data Reported for 2,751
Programs
N=
114
N=
163
N=
676
N=
646
N=
386
N=
335
N=
248
N=
183
Average Program Length = 13 months
Average Graduation Rate for All Programs = 69%

14
92% 92% 93%
6% 7% 6%
0%
10%
20%
30%
40%
50%
60%
70%
80%
90%
100%
2013 2014 2015
2013-2015 Average Graduation RatesPrograms 1-3 Months in Length
Average Graduation Rate -Programs 1-3 Months
Standard Deviation
N= 98 N=100 N=114
84% 83% 85%
11% 12% 10%
0%
10%
20%
30%
40%
50%
60%
70%
80%
90%
2013 2014 2015
2013-2015 Average Graduation Rates Programs 4-6 Months in Length
Average Graduation Rate -Programs 4-6 Months
Standard Deviation
N=137 N=156 N=163
15
72% 71%74%
12% 12% 12%
0%
10%
20%
30%
40%
50%
60%
70%
80%
2013 2014 2015
2013-2015 Average Graduation Rates Programs 7-9 Months in Length
Average Graduation Rate- Programs 7-9 Months
Standard Deviation
N=957 N=882 N=676
68% 68% 69%
14% 14% 14%
0%
10%
20%
30%
40%
50%
60%
70%
80%
2013 2014 2015
2013-2015 Average Graduation Rates Programs 10-12 Months in Length
Average GraduationRate - Programs 10-12 Months
Standard Deviation
N=771 N=767 N=646

16
62% 62%64%
16% 16%14%
0%
10%
20%
30%
40%
50%
60%
70%
2013 2014 2015
2013-2015 Average Graduation Rates Programs 13-15 Months in Length
Average Graduation Rate- Programs 13-15 Months
Standard Deviation
N=534 N=514 N=386
60% 60%64%
16%18% 18%
0%
10%
20%
30%
40%
50%
60%
70%
2013 2014 2015
2013-2015 Average Graduation Rates Programs 16-18 Months in Length
Average Graduation Rate -Programs 16-18 Months
Standard Deviation
N=494 N=432 N=335

17
57% 57%60%
18% 19% 17%
0%
10%
20%
30%
40%
50%
60%
70%
2013 2014 2015
2013-2015 Average Graduation Rates Programs 19-23 Months in Length
Average GraduationRate - Programs 19-23 Months
Standard Deviation
N=369 N=342 N=248
50%48%
52%
22%20%
17%
0%
10%
20%
30%
40%
50%
60%
2013 2014 2015
2013-2015 Average Graduation Rates Programs 24 Months and Greater in Length
Average GraduationRate ‐ Programs 24+MonthsStandard Deviation
N=289 N=287 N=183

18
75% 74% 75%
15% 16% 14%
0%
10%
20%
30%
40%
50%
60%
70%
80%
2013 2014 2015
2013-2015 Average Employment Attainment RatesAnnual Report Data
Avg. Employment Rates -All ProgramsStandard Deviation
N=3,649 Programs N=2,751 ProgramsN=3,480 Programs
60.00
65.00
70.00
75.00
80.00
85.00
90.00
95.00
100.00
2013 2014 2015
Licensure Pass Rate by Program Area
Allied Health
Holistic Arts & Sciences
Aviation
Beauty & Skin Care
Building & Industrial Trades
Heavy Equipment Operator &Truck Driver
Nursing & Health Aid

19
COMMISSION ACTIVITY REPORT FY2016 Total
ACCREDITED INSTITUTIONS SUMMARY OF ACCREDITED SCHOOLS Main Schools 432 Branch Schools 242 TOTAL ACCREDITED SCHOOLS 674 SUMMARY OF SCHOOL CLOSURES, VOLUNTARY WITHDRAWALS, AND REMOVALS Closures 20 Voluntary Withdrawals 15 Removals from accredited list 13 TOTAL CLOSURES, VOLUNTARY WITHDRAWALS AND REMOVALS 48 ACCREDITATION SUMMARY OF INITIAL APPLICATION ACTIVITIES Initial Applications Received 24 Initial Applications Accepted 16 Initial Applications Deferred 14 Initial Applications Rejected 5 SUMMARY OF RENEWAL APPLICATION ACTIVITIES Renewal Applications Received 101 Renewal Applications Accepted 135 Renewal Applications Deferred 3 SUMMARY OF ON-SITE EVALUATIONS/REVIEWS Branch (Part I or Part II) 12 Change of Location 21 Change of Ownership 25 Commission Directed Visits (Announced and Unannounced) 2 Corporate 0 Degree 28 Distance Education 5 Distance Education Facility 3 Initials 8 Masters Degree 1 Orientation 13 Other 14 Renewals 146 Re-Visits 1 Satellites 4 Unrelated New Program 27 Unannounced Visits 32

20
EXTERNAL RELATIONS/MEMBERSHIP SUMMARY OF EXTERNAL RELATIONS ACTIVITIES/MEMBERSHIP SERVICES Accreditation Workshop Attendance 334 Webinar Attendance 961 Representatives from Potential Applicants 81 Representatives from Accredited Schools 253 Team Leader Training 47 Education Specialist Training 4 Professional Development Conference 150 COMMISSION MEETINGS SUMMARY OF COMMISSION MEETING ACTIONS - INITIAL APPLICANTS Accredited for Maximum Term of 3 Years 3 Accredited for Less than the Maximum Term of 3 Years 0 Deferred 6 Denied 0 TOTAL INITIAL APPLICANTS CONSIDERED 9 SUMMARY OF COMMISSION MEETING ACTIONS - RENEWAL Accredited for Maximum Term of 5 Years 80 Short-Cycled 13 Deferred 57 Warning 11 Warning - Continued 4 Warning - Vacated 5 Probation 4 Probation - Continued 4 Probation - Vacated 5 Removal 2 Fail-To-Grant 1 TOTAL RENEWALS CONSIDERED 186 SUMMARY OF COMMISSION MEETING ACTIONS - SUBSTANTIVE CHANGES Accept Report 65 Deferred 6 Denied 1 Warning 1 Warning - Continued 0 Warning - Vacated 0 Probation 0 Probation - Continued 0 Probation - Vacated 0 Removal 0 Fail-To-Grant 0 TOTAL SUBSTANTIVE CHANGES CONSIDERED 73
21
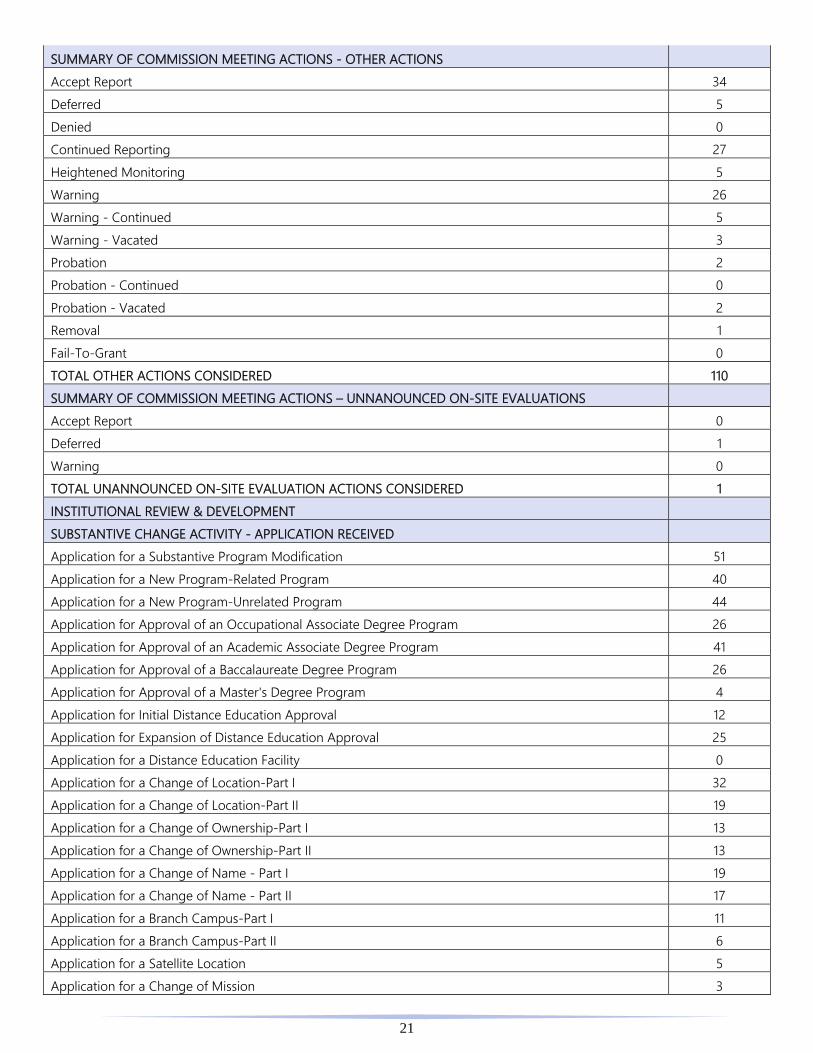
SUMMARY OF COMMISSION MEETING ACTIONS - OTHER ACTIONS Accept Report 34 Deferred 5 Denied 0 Continued Reporting 27 Heightened Monitoring 5 Warning 26 Warning - Continued 5 Warning - Vacated 3 Probation 2 Probation - Continued 0 Probation - Vacated 2 Removal 1 Fail-To-Grant 0 TOTAL OTHER ACTIONS CONSIDERED 110 SUMMARY OF COMMISSION MEETING ACTIONS – UNNANOUNCED ON-SITE EVALUATIONS Accept Report 0 Deferred 1 Warning 0 TOTAL UNANNOUNCED ON-SITE EVALUATION ACTIONS CONSIDERED 1 INSTITUTIONAL REVIEW & DEVELOPMENT SUBSTANTIVE CHANGE ACTIVITY - APPLICATION RECEIVED Application for a Substantive Program Modification 51 Application for a New Program-Related Program 40 Application for a New Program-Unrelated Program 44 Application for Approval of an Occupational Associate Degree Program 26 Application for Approval of an Academic Associate Degree Program 41 Application for Approval of a Baccalaureate Degree Program 26 Application for Approval of a Master's Degree Program 4 Application for Initial Distance Education Approval 12 Application for Expansion of Distance Education Approval 25 Application for a Distance Education Facility 0 Application for a Change of Location-Part I 32 Application for a Change of Location-Part II 19 Application for a Change of Ownership-Part I 13 Application for a Change of Ownership-Part II 13 Application for a Change of Name - Part I 19 Application for a Change of Name - Part II 17 Application for a Branch Campus-Part I 11 Application for a Branch Campus-Part II 6 Application for a Satellite Location 5 Application for a Change of Mission 3

22
Application for Clock Hour to Credit Hour Conversion 63 Facility Expansion Report 15 Program Modification Report (Non-substantive) 466 Application for Continuing Education and Avocational Programs 47 TOTAL SUBSTANTIVE CHANGE APPLICATIONS RECEIVED 998 SUBSTANTIVE CHANGE ACTIVITY - APPLICATION APPROVED Application for a Substantive Program Modification 49 Application for a New Program-Related Program 45 Application for a New Program-Unrelated Program 48 Application for Approval of an Occupational Associate Degree Program 25 Application for Approval of an Academic Associate Degree Program 43 Application for Approval of a Baccalaureate Degree Program 18 Application for Approval of a Master's Degree Program 4 Application for Initial Distance Education Approval 3 Application for Expansion of Distance Education Approval 26 Application for a Distance Education Facility 0 Application for a Change of Location-Part I 29 Application for a Change of Location-Part II 20 Application for a Change of Ownership-Part I 2 Application for a Change of Ownership-Part II 14 Application for a Change of Name - Part I 20 Application for a Change of Name - Part II 20 Application for a Branch Campus-Part I 5 Application for a Branch Campus-Part II 5 Application for a Satellite Location 8 Application for a Change of Mission 1 Application for Clock Hour to Credit Hour Conversion 37 Facility Expansion Report 18 Program Modification Report (Non-substantive) 474 Application for Continuing Education and Avocational Programs 38 TOTAL SUBSTANTIVE CHANGE APPLICATIONS APPROVED 952 SUMMARY OF COMPLAINT ACTIVITIES Complaints - Received 49 Complaints - Closed 49 Complaints - Forward to Committee/Panel 42 Complaints - Process Anonymous Complaint 5 Complaints - Forward to On-Site Evaluation Team 0 Complaints - No Action 25 Complaints - Accept Report/Close Complaint 4 Complaints - Place on Reporting 0 Complaints - Continued Reporting 5 Complaints - Deferred 1

23
Complaints - Warning 1 Complaints - Probation 0 TOTAL COMPLAINT ACTIONS 181 SUMMARY OF MEDIA REPORT ACTIVITIES Media Reports - Received 0 Media Reports - Forwarded to Committee/Panel 4 Media Reports - Accept Report 2 Media Reports - Place on Reporting 0 Media Reports - Continued Reporting 0 Media Reports - Deferred 2 Media Reports - Warning 0 Media Reports - Probation 0 TOTAL MEDIA REPORT ACTIONS 8 SUMMARY OF AGENCY NOTICE ACTIVITIES Agency Notices - Received 205 Agency Notices - Forwarded to Committee/Panel 127 Agency Notices - Accept Report/Remove from Reporting 45 Agency Notices - Place on Reporting 20 Agency Notices - Continued Reporting 39 Agency Notices - Forwarded to On-Site Evaluation Team 1 Agency Notices - Deferred 5 Agency Notices - Warning 15 Agency Notices - Probation 2 Agency Notices - Revocation 1 TOTAL AGENCY NOTICE ACTIONS 460 SUMMARY OF SIGNIFICANT GROWTH ACTIONS (All Forwarded to Commission) Significant Growth - Information Requested 8 Significant Growth - Accept Report/Remove from Reporting 5 Significant Growth - Place on Reporting 0 Significant Growth - Continued Reporting 0 Significant Growth - Place on Heightened Monitoring 5 Significant Growth - Deferred 1 Significant Growth - Warning 0 Significant Growth - Probation 0 TOTAL SIGNIFICANT GROWTH ACTIONS 19 SUMMARY OF COHORT DEFAULT RATE ACTIONS (All Forwarded to Commission) CDR - Information Requested 5 CDR - Accept Report/Remove from Reporting 9 CDR - Continued Reporting 3 CDR - Place on Reporting 1 CDR - Warning 1 CDR - Deferred 1

24
CDR - Tabled 0 CDR - Probation 1 TOTAL COHORT DEFAULT RATE ACTIONS 21 SUMMARY OF EMPLOYMENT VERIFICATION ACTIONS EV - Information Requested 97 EV - Accept Report/Remove from Reporting 19 EV - Continued Reporting 6 EV - Place on Reporting 14 EV - Placed on Heightening Monitoring 3 EV - Warning 1 EV - Deferred 2 EV - Probation 1 TOTAL EMPLOYMENT VERIFICATION ACTIONS 143 PROGRESS REVIEW COMMITTEE SUMMARY OF PROGRESS ACTIONS (OUTCOMES) Outcomes - Accept Report/Remove from Reporting 47 Outcomes - Accept Report/Remove from Reporting/Heightened Monitoring 9 Outcomes - Continued Reporting 66 Outcomes - Warning 23 Outcomes - Vacate Warning (Continue on Reporting) 5 Outcomes - Probation 0 Outcomes - Deferred 13 Outcomes - Tabled 0 Outcomes - Resubmit 1 Outcomes - Revocation 0 TOTAL OUTCOMES REPORTING 164 SUMMARY OF PROGRESS ACTIONS (REFUND) Refund - Accept Report/Remove from Reporting 7 Refund - Continued Reporting 5 Refund - Warning 2 Refund - Vacate Warning (Continue on Reporting) 0 Refund - Probation 0 Refund - Deferred 0 Refund - Resubmit 0 Refund - Revocation 1 TOTAL REFUND REPORTING 15 SUMMARY OF PROGRESS ACTIONS (ANNUAL REPORT) AR - Monitoring AR Data/Information Letters Sent 185 AR - Placed on Outcomes Reporting 50 AR - Accept Report 45 AR - Placed on Heightened Monitoring 18 AR - Warning 7
25
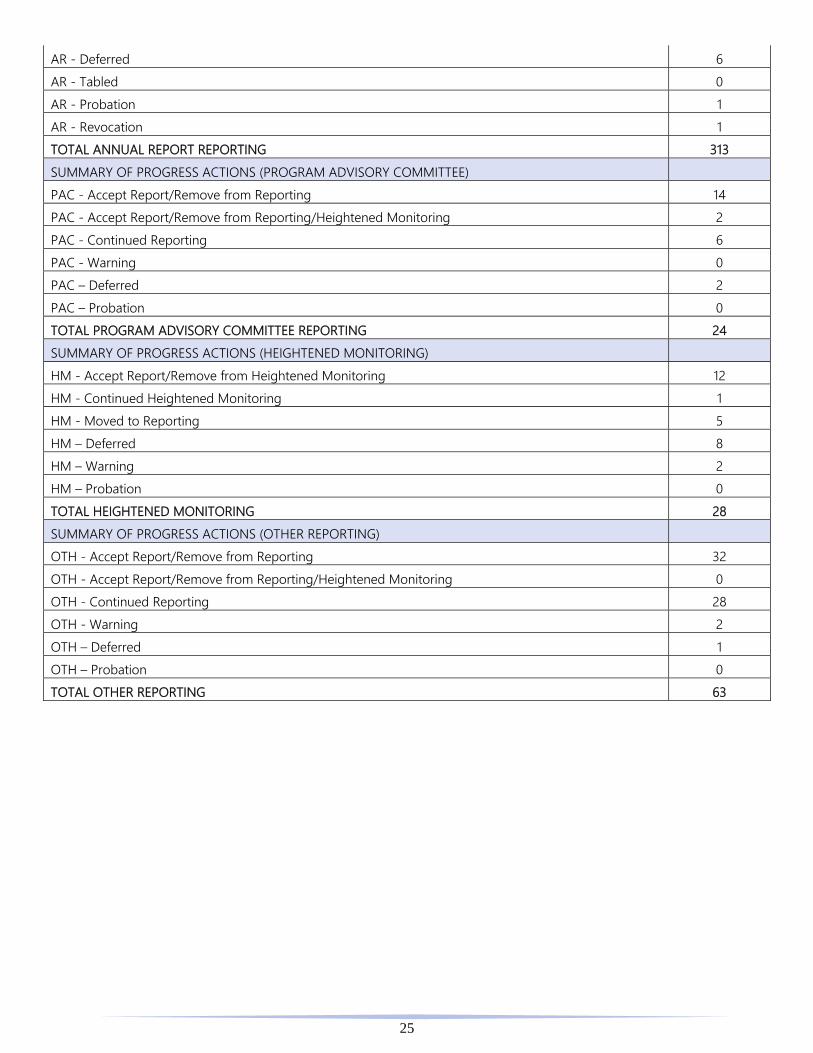
AR - Deferred 6 AR - Tabled 0 AR - Probation 1 AR - Revocation 1 TOTAL ANNUAL REPORT REPORTING 313 SUMMARY OF PROGRESS ACTIONS (PROGRAM ADVISORY COMMITTEE) PAC - Accept Report/Remove from Reporting 14 PAC - Accept Report/Remove from Reporting/Heightened Monitoring 2 PAC - Continued Reporting 6 PAC - Warning 0 PAC – Deferred 2 PAC – Probation 0 TOTAL PROGRAM ADVISORY COMMITTEE REPORTING 24 SUMMARY OF PROGRESS ACTIONS (HEIGHTENED MONITORING) HM - Accept Report/Remove from Heightened Monitoring 12 HM - Continued Heightened Monitoring 1 HM - Moved to Reporting 5 HM – Deferred 8 HM – Warning 2 HM – Probation 0 TOTAL HEIGHTENED MONITORING 28 SUMMARY OF PROGRESS ACTIONS (OTHER REPORTING) OTH - Accept Report/Remove from Reporting 32 OTH - Accept Report/Remove from Reporting/Heightened Monitoring 0 OTH - Continued Reporting 28 OTH - Warning 2 OTH – Deferred 1 OTH – Probation 0 TOTAL OTHER REPORTING 63

Accrediting Commission of Career Schools and Colleges 2101 Wilson Blvd., Suite 302
Arlington, VA 22201 703.247.4212 tel 703.247.4533 fax www.accsc.org