schmidt schmidt demographic change in germany€¦ · assess the burden of younger generations...
TRANSCRIPT

1
Demographic developments in Germany – avoiding a false sense
of security in times of vigorous growth
Christoph M. Schmidt and Torsten Schmidt1
Abstract
While strong immigration flows have stabilized the German population in recent years, in the long-run Germany is set to display a substantial population decline and, even more importantly, severe population aging. This will endanger average prosperity growth and the stability of the systems providing old-age security, health care and long-term care. The current economic mood is quite joyful, though, preventing a pensive look at these long-term challenges. It would be pref-erable to place more emphasis on promoting economic growth and to implement structural reforms to prepare the social security system for future demographic change. Among these measures are interventions aiming at increasing the par-ticipation rate of women, enhancing productivity by more investments into human capital, and the coupling of the statutory retirement age to increases in old-age life expectancy.
1 Contact: Prof. Dr. Christoph M. Schmidt (Email: [email protected]) and Dr. Torsten Schmidt (Email. [email protected]), RWI – Leibniz Institute for Economic Research, Hohenzollernstr. 1-3, 45128 Essen, Germany.

2
I. Introduction
In Germany, the current demographic and economic situation is quite favorable.
A strong immigration after the enlargement of the European Union and refugees
from Africa and the Middle East has stabilized the German population, which oth-
erwise would have started to decline in 2010. Moreover, the stable economic en-
vironment during the European debt crisis led to strong capital inflows that low-
ered the yields on government bonds and reduced the debt payments for public
debt substantially. At the same time, the last years witnessed strong employment
growth, associated with higher tax revenues and revenues of the social security
system, and even surpluses in the federal budget. It is likely that this favorable
situation will continue to exist in the short-run.
However, this favorable development hides that the demographic change in Ger-
many is by and large an inevitable development in the long-run. While it might be
possible to alter the degree of ageing and of population decline, it will hardly be
possible to turn the trend around. From this long-run perspective, economic policy
has to address the principal question of how to adapt to this development to mit-
igate any negative consequences effectively. However, given the favorable cur-
rent situation the political will to address these challenges remains insufficient.
On the contrary, recent changes in the pension system even reduced the sus-
tainability of the German social security system.
The long-run challenges for the public finances and in particular the social secu-
rity system will start to become visible after 2021 when the baby boom generation
starts to retire. Due to the fact that the demographic change is a slow process,
the various aspects of this transitions are quite certain (Bloom and Luca 2016). It
is therefore instructive to explore the likely quantitative effects on economic
growth and public finances, based on projections of the demographic transition.
These simulations need to carefully consider the possible linkages between de-
mographic and economic developments. While the effects of aging on the size of
the labor force or the public expenditures for social security are obvious, there
might be other channels that should not be neglected.

3
This paper provides a comprehensive discussion of the current state of the de-
bate on the economic consequences of demographic change in Germany, and
suggests measures to alleviate the ensuing economic burden. We start by pre-
senting the current state of the demographic transition in Germany and its long-
term outlook, followed by a discussion of the consequences of these changes for
the growth of economic prosperity. In particular, we use recent empirical findings
to challenge some of the assumptions typically invoked to study the effects of
demographic change on economic growth. The assessments by the German
Federal Ministry of Finance and the European Commission regarding the sus-
tainability of public finances provide the basis for our discussion of possible re-
forms of the systems of old-age security, health care and long-term care.
The results of these projections show that age-dependent expenditures increase
substantially after 2021. This implies that the current structure of public finances
is not sustainable. This sustainability gap is so wide that it will not be sufficient to
concentrate efforts exclusively on promoting economic growth. What is needed
is a more comprehensive package of measures, where not only participation
rates are lifted by providing a better environment for the combination of work and
family life, and productivity growth is promoted by enhancing investments in hu-
man capital, but reforms are also addressing the social security system directly.
Specifically, it is highly advisable to couple further increases to the statutory re-
tirement age with the increasing old-age life expectancy. Not implementing the
necessary reforms today, which could alleviate the imbalances causing the sus-
tainability gap, will lead to increasing problems tomorrow.
II. Demographic transition in Germany
We start the discussion by illustrating the current state of the demographic tran-
sition in Germany and its long-term outlook. There are at least two important de-
mographic trends with considerable effects on economic growth and public fi-
nances – alterations to the size of the population, and changes in its age struc-
ture. In many respects, it is the ageing of the population which implies the more
remarkable economic consequences.
4
The first important element of demographic transition is the decline in birth rates.
This has two important implications. The first is that the population declines be-
cause every new cohort of newborns will be smaller than the last one. The second
implication is that the population becomes older on average as calendar time
passes by. As can be seen in Figure 1 this trend started in the late sixties. In the
early seventies, the number of births fell below the number of deaths. However,
the birth deficit was balanced by a positive net migration until 2008. Afterwards
the population in Germany started to decline. The eastward enlargement of the
European Union and some years later the European debt crisis lead to a notice-
able increase of the number of immigrants to Germany. This strong net migration
again stabilized the population size.
However, as the projection suggests this development is not likely to continue in
the future. It is already visible that migration from Spain has eased since the eco-
nomic recovery. In contrast, immigration from Eastern Europe will continue for
some time because the income differences between Germany and Eastern Eu-
rope are still large. Nevertheless, it is likely that the number of immigrants will
decline compared to 2010. However, caused by the increasing number of refu-
gees from Africa and the Middle East we expect more than 200 000 immigrants
over the medium-run.

5
Figure 1
Fertility, mortality, migration
Source: Destatis (2015).
It is also evident from Figure 1 that the birth deficit will increase considerably after
2020. If one assumes that the immigration will decline over a longer time horizon
the most likely scenario is that the population in Germany will start to decline
around the year 2020 (Figure 2). However, immigration is difficult to predict. The
Federal Statistical Office uses therefore two main scenarios (T- and T+ in the
following) which differ among others in their assumptions about future immigra-
tion. Further differences of the two scenarios lie in the assumptions about the
birth rates, life expectancy and the participation rate (Table 1). These two sce-
narios are also the basis for the sustainability report of the Federal Ministry of
Finance (2016).
Births
Deaths
Birth surplus
Birth deficit
Migration balance, assumption W2
Migration balance, assumption W1

6
Figure 2
Population in Germany
Source: Destatis (2015).
Scenario 1 (T-): The birth rate stays at its long-term average of 1.4 children per
woman. Life expectancy of women increases from 82.8 to 90.4 and for men from
77.7 to 86.7 years. Net migration is assumed to be 100 000 person per year.
Scenario 1 (T+): The birth rate increases to 1.6 in 2028. Life expectancy of
women increases to 88.8 and for men from 84.8 years. Net migration is assumed
to be 200 000 person per year after 2020.
Mio. of individuals
Before census
After census estimated
Scenario 1: Constancy
with weak migration
Scenario 2: Constancy
with strong migration

7
Table 1
Assumptions for the baseline scenarios of the sustainability report from
the Ministry of Finance
2010 2020 2030 2040 2050 2060 Scenario T–
Demography: Population (mill.) 81.7 81.5 79.6 76.8 73.2 69.2 Old-age dependency a) 31.1 35.1 46.9 54.7 58.6 64.1 Labour market: Participation rates (%) – females (15–64) 74.6 79.6 82.2 82.5 83.0 83.5 – males (15–64) 84.5 85.4 86.0 85.9 85.9 86.1 Labour force (mill.) 43.8 44.6 42.2 38.8 36.4 33.4 Employment (mill.) 41.0 43.0 39.9 36.7 34.4 31.6 Unemployment rate b)
(%) 6.4 3.8 5.5 5.5 5.5 5.5
Economic growth: Labour productivity c) (%) 0.6 1.0 1.9 1.8 1.6 1.6 GDP c) (%) 0.9 1.4 1.1 0.9 0.9 0.7 GDP per capita c) (%) 0.9 1.4 1.4 1.3 1.4 1.3
Scenario T+ Demography: Population (mill.) 81.7 82.2 81.9 80.6 78.8 76.9 Old-age dependency a) 31.0 34.7 45.0 50.2 51.2 53.7 Labour market: Participation rates (%) – females (15–64) 74.6 78.5 82.6 82.8 83.3 84.0 – males (15–64) 84.5 85.0 86.5 86.4 86.4 86.7 Labour force (mill.) 43.8 44.8 43.9 41.8 40.9 39.4 Employment (mill.) 41.0 43.2 42.6 40.6 39.8 38.3 Unemployment rate b)
(%) 6.4 3.6 3.0 3.0 3.0 3.0
Economic growth: Labour productivity c) (%) 0.6 0.9 1.9 2.0 1.8 1.9 GDP c) (%) 0.9 1.4 1.8 1.5 1.6 1.5 GDP per capita c) (%) 0.9 1.4 1.8 1.7 1.9 1.7 Annotations: a) Population aged 65+ per population aged 15–64. b) % of total labour force (internationally standardised definition). c) Real growth rates (annualised averages over the last 10 years). Sources: Figures for 2010 are based on actual data provided in official data sources; all other fig-ures are based on simulations using the SIM.13 model („Social Insurance Model, 2013 ver-sion“).
Source: Werding (2016).

8
Figure 3
Development of the age dependency ratio
Source: Werding (2016). Dotted lines are projections based on data from the
old census. Solid lines are based on data of the new census.
The relentless increase of life expectancy is the second important element of the
demographic transition. This tendency intensifies the aging of the population and
has a strong effect on the German pay-as-you-go pension system because it in-
creases the size of the 65+ cohort. A common indicator for this development is
the increasing age-dependency-ratio (Figure 3). This indicator is often used to
assess the burden of younger generations caused by the current structure of the
pension insurance. The age-dependency-ratio is the relation between the number
of retirees and size of the working age population.
In a pay-as-you-go pension system, this ratio indicates how many members of
the labor force have to finance the pension of one retiree. For example, an in-
crease from 32 to 55 means that currently 3 workers have to pay the pension of
one retiree. In 2060 only two workers have to finance the pension of one retiree.
Forecast
Scenario T-
Scenario T+

9
This measure is therefore already illustrative for the challenges of the ongoing
demographic change. However, there are many other aspects to consider.
III. Economic consequences
To assess the scope of the needed reforms in the social security system it is
necessary to quantify the effects of the demographic transition on economic
growth. Due to the long time horizon, it is common to estimate the effects of aging
on long-run or potential output. Most sustainability assessments, as the one used
by the Federal Ministry, use a production function approach. In this approach,
potential GDP is explained by labor, capital and total factor productivity.2
The direct effect of an aging population can be considered via the labor force. In
the EU Commissions aging reports (2015) the demographic transition is modeled
by splitting the total population into age groups. The sizes of these age cohorts
are then multiplied by age cohort specific participation rates. This allows for a
detailed projection of the labor force using the information about the development
of age groups. Afterwards the labor force measure is multiplied by the non-accel-
erating wage rate of unemployment (NAWRU) to get the number of full employed
workers. The NAWRU and all other parameters are held constant.
Moreover, net-migration is assumed to be exogenously determined. In particular,
the TFP growth and the development of the capital stock are assumed to be ex-
ogenous to the demographic transition, and both are assumed to remain at his-
torical values. In addition, despite the recent debate of the secular stagnation
hypothesis, in the calculations for the sustainability report, the real interest rate –
rather than being determined endogenously within the model – is simply assumed
to return from its current level to its historical long-run average of three percent
(Figure 4).
2 The European Commission has developed a very elaborated procedure to calculate potential
output by smoothing the time series of the input variables. The EU Commission uses this proce-dure for their aging reports. The approach used by the Federal Ministry of Finance is simpler but uses some variables and parameter values from the EU Commissions database.

10
Figure 4
Assumption about the real interest rate
Source: Werding (2016).
Based on this approach the economic development, measured by GDP, is de-
rived until 2060. This highlights that this is not a forecast of the most likely eco-
nomic development. This approach is rather an assessment of the impact of the
demographic transition holding all other things constant. As we have argued in
the introduction this is important for the discussion about economic policy be-
cause the transition is under way even if it is currently not very noticeable.
Current situation and long-run outlook
In this section, we present the results for the economic development based on
the above-mentioned methodology used in the sustainability report of the Ministry
of Finance (2015). To emphasize the sensitivity of the economic development
with regard to the assumptions for the demographic variables the two scenarios
(pessimistic T- and optimistic T+) are used in the calculations.
Forecast
Senario T-
and T+t
Annual averages
Average 1991 - 2007

11
In the pessimistic scenario (T-) GDP growth will decline from 1.5% in 2021 to
0.8% in 2060 (Figure 5). The effects of the demographic transition become visible
when we compare this development with the growth rates of GDP per capita and
GDP per employee. Between 2020 and 2030 the decline in GDP growth is ac-
companied by declining rates of per capita GDP growth while growth rates of
GDP per employee increases. This is caused by the retirement of the baby boom-
ers during that period. From 2030 to 2060 the decline in GDP growth is more
closely related to the decline in GDP growth per employee. This time the effect
of the declining labor force dominates the development.
Figure 5
Economic Growth in Scenario T-
Source: Werding (2016).
Forecast
Productivity
2009 -4.4 %
GDP per employee
GDP
GDP per capita

12
In the more optimistic scenario T+ the developments of the economic variables
are mainly the same but the magnitude of the economic effects are less pro-
nounced (Figure 6). The GDP growth rate declines in the same period from 2.2%
to 1.5%. The decline of GDP per employee is much weaker and GDP per capita
increases. Therefore, the development is more related to the shrinkage of the
labor force.
Figure 6
Economic growth in Scenario T+
Source: Werding (2016).
GDP per employee
GDP
GDP per capita
Productivity
2009 -4.4 %
Forecast

13
Additional channels of the demographic transition on economic growth
The simplicity and transparency is clearly an advantage of the presented ap-
proach. However, a review of the literature shows that there are other channels,
through which the demographic transition might affect economic growth and
therefore the sustainability of public finances. In the following, we discuss some
of them along the input variables in the production function.
Effects of the demographic transition on K
The second important source for long-run economic growth is the development
of the capital stock. In the approach of the EU Commission, it is assumed that in
the long-run the investment share is constant to a long-run historical average.
Moreover, to avoid jumps in the transition from the actual investment share to the
long-run average it is assumed that it takes place gradually in a linear manner.
However, the discussion about the secular stagnation hypothesis is related to the
discussion about the effects of the demographic transition on private savings and
therefore private investment. It is argued that the demographic change dampens
saving and therefore investment. A weaker savings demand is accompanied by
a reduction of the real interest rate what conflicts with the assumption of a con-
stant interest rate in the simulations. The requirement for this line of reasoning is
that the main feature of the demographic transition is the decrease of the popu-
lation size. If this cohort effect dominates then a reduction in the number of savers
will reduce savings as well.
If we take into account that the increase of life expectancy could work in the op-
posite direction the overall effect is ambiguous. Recent simulations by Carvalho
et al. (2016) show that if households are aware of an increasing life expectancy
they will save more for their retirement period. Moreover, under plausible as-
sumptions this effect is expected to overcompensate the cohort size effect. It is
therefore an empirical question what effect the demographic transition domi-
nates.

14
This discussion is not only meaningful for physical capital but for all classes of
assets. If people want to save more the demand for assets increases. If the sup-
ply of assets is inelastic the prices of these assets should increase as well. In
contrast, if asset demand is mainly related to the cohort size of savers the demo-
graphic change should create a downward pressure on asset prizes. This is the
so-called asset meltdown hypothesis. In a recent paper, Jäger and Schmidt
(2017) analyzed the relationship between population size, life expectancy and
house prices for a panel of 13 industrial countries. As in Fair and Dominguez
(1991) the coefficients of the age cohorts are assumed lie along a polynomial.
Moreover, the expected life expectancy at age 20 is included in the estimation.
Their results indicate that it is likely that the cohort-size effect dominates the life-
expectancy effect. In particular, the coefficients of age cohorts derived from the
estimated coefficients of the polynomial show that larger age cohorts between
age 30 and 40 are positively related to house prices. In contrast, larger age co-
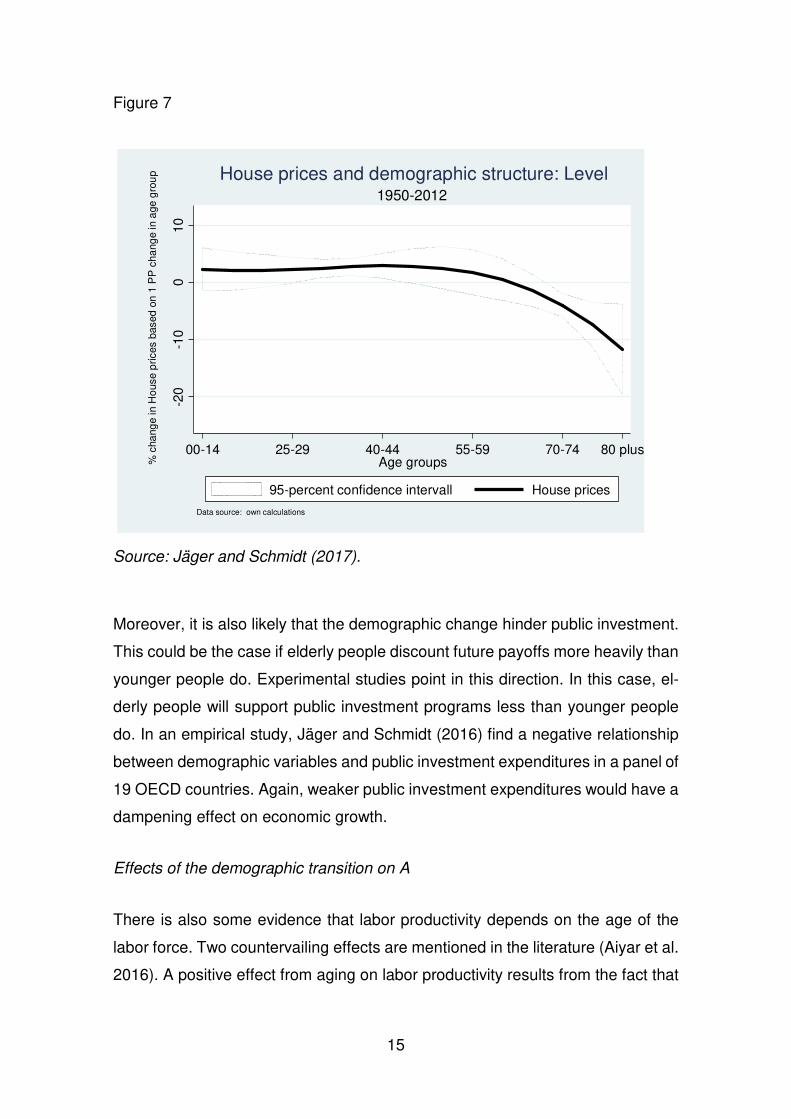
horts above 70 are negatively correlated with house prices (Figure 7). It is there-
fore to be expected that the ongoing demographic change reduce the amount of
saving and therefore the amount of investment and the value of assets. The con-
clusion is that the effect of demographic change on output growth in more pro-
nounced than assumed in the presented simulations for the sustainability report.
15
Figure 7
Source: Jäger and Schmidt (2017).
Moreover, it is also likely that the demographic change hinder public investment.
This could be the case if elderly people discount future payoffs more heavily than
younger people do. Experimental studies point in this direction. In this case, el-
derly people will support public investment programs less than younger people
do. In an empirical study, Jäger and Schmidt (2016) find a negative relationship
between demographic variables and public investment expenditures in a panel of
19 OECD countries. Again, weaker public investment expenditures would have a
dampening effect on economic growth.
Effects of the demographic transition on A
There is also some evidence that labor productivity depends on the age of the
labor force. Two countervailing effects are mentioned in the literature (Aiyar et al.
2016). A positive effect from aging on labor productivity results from the fact that
-20
-10
010
% c
hang
e in
Ho
use
pric
es b
ased
on
1 P
P c
hang
e in
age
gro
up
00-14 25-29 40-44 55-59 70-74 80 plusAge groups
95-percent confidence intervall House prices
Data source: own calculations
1950-2012House prices and demographic structure: Level

16
workers become more experienced with their working age. A negative effect re-
sults from the fact that skills depend on the stock of knowledge accumulated dur-
ing the education period. The combination of these two factors leads to an inverse
U-shaped pattern of labor productivity. A strong increase until age 40 and de-
crease afterwards. The empirical literature finds a statistically and economically
significant effect. Consequently, it becomes more difficult to increase productivity
to stabilize economic growth in an aging society.
A second important determinant of labor productivity is R&D. If the number of
researchers is an important factor for the development of innovations, a decreas-
ing population size could also reduce the number of researchers. However, this
effect could be outweighed by the stronger accumulation of human capital. Again,
the increasing life expectancy could encourage more investment in human capital
(Lee 2016). One approach could be to make Germany more attractive for foreign
researchers. It is also possible to increase the number of young researchers by
making these jobs more attractive.
IV. Effects on public finances
Public finances are directly affected by the demographic transition and indirectly
by the effects on economic growth. We start the discussion by showing the de-
velopment of public expenditures that are mainly affected by the demographic
transition. In this context, the no-change assumption is crucial because it is very
likely that economic policy will react in some way if the demographic change be-
comes visible. Nevertheless, to prepare these policy reactions it is very valuable
to show what is likely to happen without these reforms. In what follows, the addi-
tional assumption that the revenue to GDP ratio is constant over the whole sim-
ulation period is used. This assumption is questionable because the overall rev-
enue system in Germany has an income elasticity slightly above one.
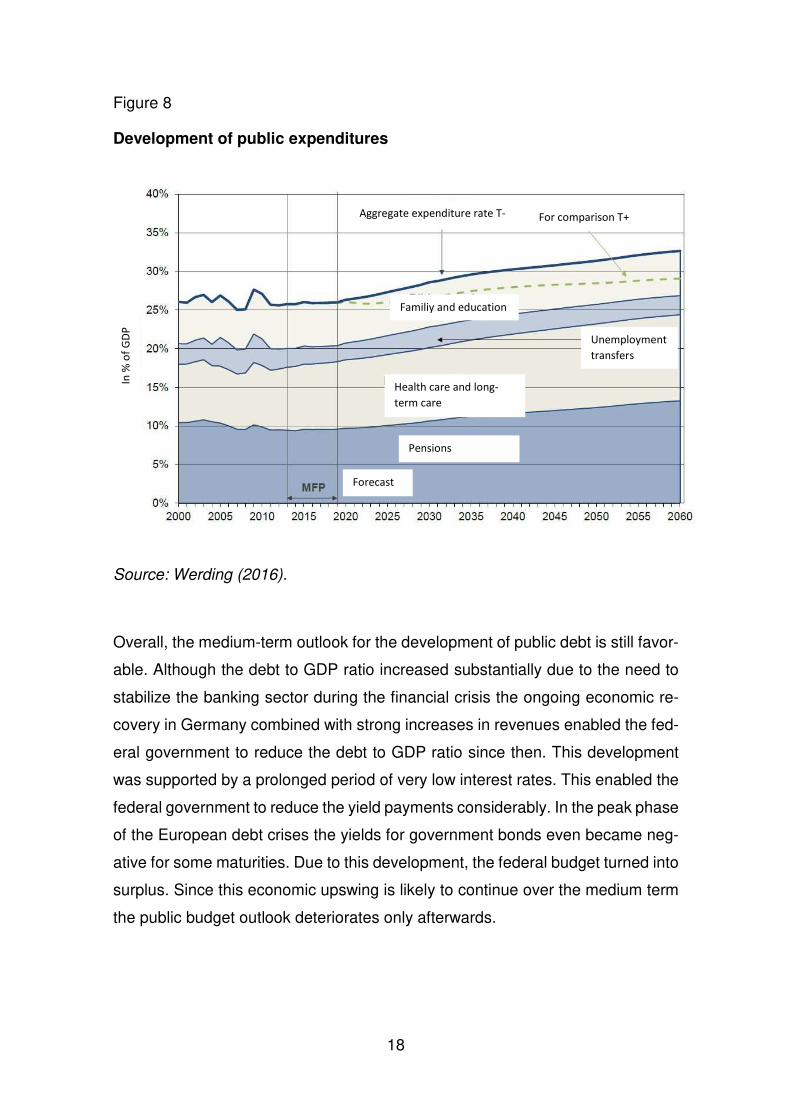
To show the quantitative importance of these considerations we again use the
simulations from the fourth sustainability report of the Federal Ministry of Finance
(2015). It is obvious in Figure 8 that the demographic change will increase the
17
public expenditures considerably. Using again the two scenarios T- and T+ the
path for public expenditures are simulated until 2060. The simulations show that
the developments of expenditures will be quite stable until 2020. Consequently,
the debt to GDP ratio will decrease. After 2020 however the demographic transi-
tion will become more visible and therefore the fiscal stance worsens.
If we look at single categories it is obvious that the expenditures of the pension
insures will be directly affected by the increasing age dependency-ratio. How-
ever, two countervailing effects will dampen this development. The first is the
demographic factor included in the formula to calculate the pension payments.
The second is the increasing participation rate of elderly people.
The second expenditure category that is highly affected by the aging process is
the insurance for long-term care. It is assumed that these costs are mainly driven
by labor productivity, wages and the increasing number of cases. However, the
expected increase in expenditure from one to two percent in relation to GDP is
not very pronounced.
This also applies for the expenditures of the health care insurance. However,
these expenditures depend on the respective stock of knowledge in health care
that is unknown currently. From this perspective, the expenditure path is highly
uncertain.
18
Figure 8
Development of public expenditures
Source: Werding (2016).
Overall, the medium-term outlook for the development of public debt is still favor-
able. Although the debt to GDP ratio increased substantially due to the need to
stabilize the banking sector during the financial crisis the ongoing economic re-
covery in Germany combined with strong increases in revenues enabled the fed-
eral government to reduce the debt to GDP ratio since then. This development
was supported by a prolonged period of very low interest rates. This enabled the
federal government to reduce the yield payments considerably. In the peak phase
of the European debt crises the yields for government bonds even became neg-
ative for some maturities. Due to this development, the federal budget turned into
surplus. Since this economic upswing is likely to continue over the medium term
the public budget outlook deteriorates only afterwards.
Pensions
Forecast
For comparison T+ Aggregate expenditure rate T-
Health care and long-
term care
Familiy and education
Unemployment
transfers
In %
of
GD
P

19
However, after 2025 when the demographic change becomes more pronounced
increasing age related expenditures in combination with the assumption of a con-
stant revenue to GDP ratio leads to a substantial increase in public debt relative
to GDP (Figure 9). Therefore, the question arises whether this is a sustainable
development or not. Unfortunately, there is no clear answer to this question. How-
ever, a first approach is a negative definition. A steady increase of the debt to
GDP ratio is clearly not sustainable (Schmidt 2014). In contrast, a stable debt to
GDP ratio is often seen as a sustainable development. If a sustainability gap is
identified fiscal consolidation is needed to stabilize the debt to GDP ratio. Then
the question arises what the necessary amounts are to improve the budget. To
answer this question it is common in Germany to use the following indicators.
Figure 9
Development of the public debt ratio
BMF (2016).
Forecast Scenario T-
Scenario T+
Deficit ratio = 0.35% until 2060
T+ T-
% o
f G
DP

20
The first indicator (S1) measures the necessary annual improvement in the pri-
mary public deficit (in percent of GDP) that is necessary to reach a debt ratio of
60% in 2060. The goal of a debt to GDP ratio of 60% was established in the
Maastricht treaty of the European Union.
The second long-term indicator (S2) measures the necessary annual improve-
ment in the primary public deficit (in percent of GDP) to meet the intertemporal
budget constraint. Future revenues are sufficient to cover all future expenditures
even from past debt.
The first medium-term indicator (S12030) measures the gradual improvements
that are necessary until 2020 to reach a debt ratio of 60% in 2060. s12030
measures the necessary annual steps.
The second medium-term indicator (S2mt) measures the necessary gradual im-
provement until 2020 to meet the intertemporal budget constraint. s1mt measures
the necessary annual steps.
21
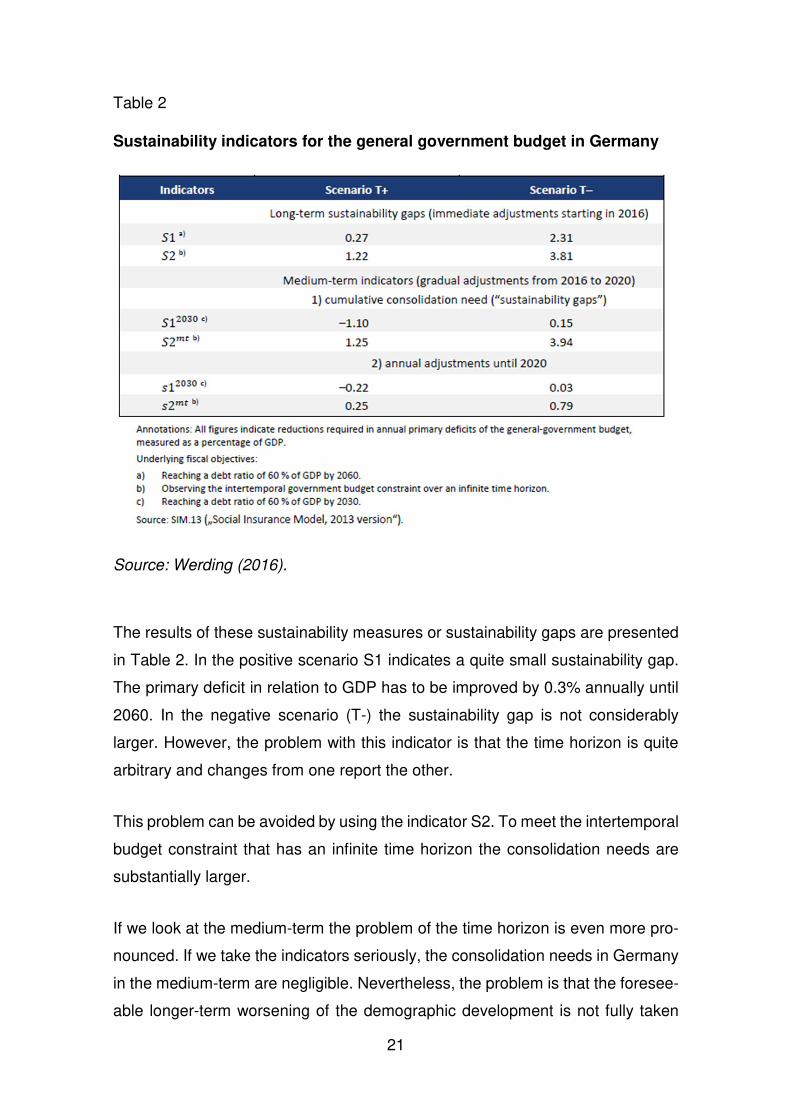
Table 2
Sustainability indicators for the general government budget in Germany
Source: Werding (2016).
The results of these sustainability measures or sustainability gaps are presented
in Table 2. In the positive scenario S1 indicates a quite small sustainability gap.
The primary deficit in relation to GDP has to be improved by 0.3% annually until
2060. In the negative scenario (T-) the sustainability gap is not considerably
larger. However, the problem with this indicator is that the time horizon is quite
arbitrary and changes from one report the other.
This problem can be avoided by using the indicator S2. To meet the intertemporal
budget constraint that has an infinite time horizon the consolidation needs are
substantially larger.
If we look at the medium-term the problem of the time horizon is even more pro-
nounced. If we take the indicators seriously, the consolidation needs in Germany
in the medium-term are negligible. Nevertheless, the problem is that the foresee-
able longer-term worsening of the demographic development is not fully taken

22
into account by these measures. It underestimates the consolidation needs or
shift them into the future.
The conclusion form these indicators therefore has to be that the federal govern-
ment in Germany should start now to reform the social security system in a way
that they are able to cope with the foreseeable demographic change. The ad-
vantage would be that these reforms could have to some extend a preventive
character. Private households therefore would have time to adjust their decisions
for example for saving to this new environment.
An easy to implement reform of the pension system is to increase the retirement
age. The increasing life expectancy is one argument in favor of this measure be-
cause it is not simple an increase of lifetime. At the same time health of older
people improve substantially. For this reason, the council of economic experts
(SVR 2011) suggested to tie the retirement age to the increasing life expectancy
by a rule. Under the current law, the retirement age will increase from 65 to 67 in
the year 2030.
However, this is not sufficient to reduce the age related expenditures considera-
bly. To avoid future discussions about a discrete increase of the retirement age
a rule could be implemented. The council of economic experts suggested to split
the lifetime after age 20 between working life and retirement period by 7 to 3.
Using this rule it is to expect that the retirement age would be raised to 69 in the
year 2060. At the same time, the retirement period would increase to 20 years in
2060.

23
V. Conclusions
It is definitely more than adequate to place the discussion of the economic con-
sequences of the demographic transition on the top of the political agenda. Cur-
rently the demographic transition might not receive sufficient attention because it
is overlaid by strong immigration. However, the consequences of declining birth
rates and of increasing life expectancy are real, and they are foreseeable for the
long-run. Responses to this demographic change have to be implemented now
because they need time to become effective, and because otherwise the chal-
lenges will tend to grow even further. Simulations conducted by the German min-
istry of finance can be used as guidance for what measures are most efficient to
dampen the effects on public finances. The overall effects are so substantial that
a single measure is not sufficient.
A first option is to increase the fertility rate to dampen the demographic change
in general. However, the simulations show that this has only limited effects on
public finance. Even if this policy is successful, it will take a long period to gener-
ate economic significant effects. In contrast, it is also shown by simulations that
migration has a quite strong impact on public finances. An explicit migration policy
is therefore an additional option to reduce the sustainability gap in the future.
Another approach is to strengthen economic growth. To reduce the reduction of
labor supply during the demographic change one option is to increase the partic-
ipation rate in general and of woman in particular. Improved childcare and more
flexible labor contracts in particular with regard to part time work could increase
the labor supply within an age cohort.
Other starting points is an increase of productivity. One approach is to promote
investments in human capital. However, the aging on the labor force could reduce
the effectiveness of this policy. In general, it is likely the effects of the demo-
graphic transition on economic growth are so substantial that policies to increase
productivity or other sources of economic growth are not able to compensate the
negative impact. However, they might dampen the negative effect.

24
Overall, it seems to be unavoidable to reform the social security system. In par-
ticular, the heightening of the retirement age should be high on the agenda. There
are many jobs were it is not necessary that people retire at age 65. In particular,
if older people are healthier today than in former times. The Council of Economic
Experts in Germany therefor suggested connecting the retirement age to the in-
creasing life expectancy by using a constant ratio of the working period and the
retirement period.
Literatur
Aiyar S., C. Ebeke and X. Shao (2016), The Impact of Workforce Aging on Euro-
pean Productivity, IMF working Paper 16/238.
Bloom, D.E. and D. L. Luca (2016), The Global Demography of Aging: Facts,
Explanations, Future, J. Piggot and A. Woodland (Eds.) Handbook of the Eco-
nomics of Population Aging, 59-118.
BMF – Bundesministerium der Finanzen (2015), Vierter Bericht zur Tragfähigkeit
der öffentlichen Finanzen, Berlin.
Carvalho, C., A: Ferrero and F. Nechio (2016), Demographics and real interest
rates: Inspecting the mechanism. European Economic Review, SI: The Post-
Crisis Slump 88, 208–226.
European Commission (2014), The 2015 Aging Report – Underlying Assump-
tions and Projection Methods, European Economy 8.
Fair, R.C. and K.M. Dominguez (1991), Effects of the Changing U.S. Age Distri-
bution on Macroeconomic Equations. American Economic Review 81, 1276–
1294.
Feyrer, J. (2007), Demographics and Productivity. Review of Economics and Sta-
tistics 89, 100–109.
Jäger, P. and T. Schmidt (2016), The Political Economy of Public Investment
when Population is Aging: A Panel Cointegration Analysis, European Journal
of Political Economy 43, 145-158.

25
Jäger, P. and T. Schmidt (2017), Demographic Change and House Prices: Head-
wind or Tailwind? Economics Letters 160, 82-85.
Lee, R. (2016), Macroeconomics, Aging and Growth, J. Piggot and A. Woodland
(Eds.) Handbook of the Economics of Population Aging, 59-118.
Schmidt, C.M. (2014), Der demographische Wandel als große Herausforderung
für Wirtschaft und Gesellschaft - ein Überblick. Paper presented at the North
Rhine-Westphalian Academy of Sciences, Humanities and the Arts at the 17.
June 2014.
SVR – Sachverständigenrat zur Begutachtung der gesamtwirtschaftlichen Ent-
wicklung (2011), Herausforderungen des demographischen Wandels: Exper-
tise im Auftrag der Bundesregierung, Wiesbaden.
Werding, M. (2016), Modellrechnungen für den vierten Tragfähigkeitsbericht,
FiFo-Berichte 20.