scea 2000 - 15 june 2000 [email protected] jrs, tasc, 5/7/2015, 1 bmdo cost risk improvement in...
TRANSCRIPT

SCEA 2000 - 15 June 2000
[email protected] JRS, TASC, 04/18/23, 1
BMDO Cost RiskImprovement in Operations and
Support (O&S) Estimates
J. R. Summerville, R. L. Coleman, M. E. Dameron
Annual SCEA National Conference
Manhattan Beach, CA
15 June 2000

SCEA 2000 - 15 June 2000
[email protected] JRS, TASC, 04/18/23, 2
Outline
• Purpose
• Overview of BMDO Cost Risk Methodology
• Issues with Risk in O&S
• Ideas for improvement
• Implementation
• Analysis of Results
• Conclusion

SCEA 2000 - 15 June 2000
[email protected] JRS, TASC, 04/18/23, 3
Purpose• Research done for, and funded by the Ballistic
Missile Defense Organization (BMDO) under direction of Ms. Donna Snead and Mr. Lowell Naef.
• Purpose was to further enhance BMDO Cost Risk Model, which has been used to develop independent life cycle cost risk assessments since 1989 – Model is currently well received, however there are some
recognized weaknesses that await further research. One such area is the capability for quantifying risk in O&S.
– The focus of this paper will be to examine ways reflect more accuracy in O&S cost risk estimates.
SCEA 2000 - 15 June 2000
[email protected] JRS, TASC, 04/18/23, 4
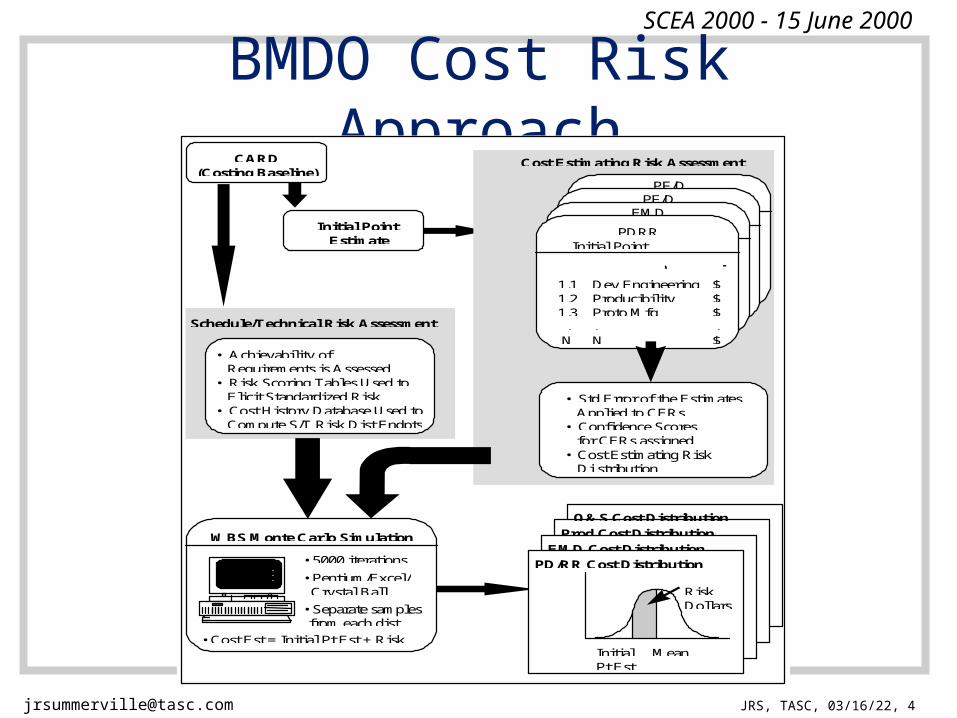
BMDO Cost Risk ApproachCARD
(Costing Baseline)
Initial PointEstimate
Schedule/Technical Risk Assessment
Cost Estimating Risk Assessment
PF/DPF/D
EMD
PDRRInitial PointEstimate
CWBS Name Cost
1.11.21.3.N
Dev EngineeringProducibilityProto Mfg.N
$$$.$
• Std Error of the Estimates Applied to CERs• Confidence Scores for CERs assigned• Cost Estimating Risk
Di stributionendpoints
• Achievability ofCARD Requirements is Assessed
• Risk Scoring Tables Used to Elicit Standardized RiskScores• Cost History Database Used to Compute S/T Risk Dist Endpts
WBS Monte Carlo Simulation
• 5000 iterations
• Pentium/Excel/ Crystal Ball
• Separate samplesfrom each dist.
• Cost Est = Initial Pt Est + Risk
Prod Cost DistributionO&S Cost Distribution
EMD Cost Distribution
InitialPt Est
Mean
RiskDollars
PD/RR Cost Distribution

SCEA 2000 - 15 June 2000
[email protected] JRS, TASC, 04/18/23, 5
BMDO Cost Risk Model
WBS Initial Point CE S/T EstimateEstimate draw draw with Risk
1.0 Hardware 100M 127M1.1 Item 1 80M 1.1 1.15 100M1.2 Item 2 20M 1.15 1.2 27M2.0 SW 10M 1.03 1.3 13M3.0 SE/PM 11M 14MTotal 121M 168M
Take the base
Number
Multiply by a random variable resulting from the
Monte Carlo process
Collect the results in a histogram
Some elements
are roll-ups
The result is an estimate with risk
Steps:
Example (one iteration):
Some elements are factors off of others

SCEA 2000 - 15 June 2000
[email protected] JRS, TASC, 04/18/23, 6
BMDO Cost Risk ModelFunctional Correlation1
Suppose SE/PM = a * Hardware
a = .1, with Standard Deviation of .01
H/W = 100, with Standard Deviation of 10
Iteration 1
Iteration 2
Iteration 3
Iteration 4
H/W = 100a = .09
Drawn Variables
H/W = 110a = .10
H/W = 90a = .11
H/W = 90a = .09
FunctionalCorrelation
SE/PM = 9
SE/PM = 11
SE/PM = 9.9
SE/PM = 8.1
WithoutCorrelation
SE/PM = 9
SE/PM = 10
SE/PM = 11
SE/PM = 9
xx xxx xx
x
SE/PM
H/W
SE/PM
H/W
1 An Overview of Correlation and Functional Dependencies in Cost Risk and Uncertainty Analysis, DoDCAS 1994, R. L. Coleman, S. S. Gupta

SCEA 2000 - 15 June 2000
[email protected] JRS, TASC, 04/18/23, 7
Should We Have Risk in O&S?• We know:
– O&S Cost is correlated to Acquisition Hardware/Software, (e.g. SW Maintenance, spares, etc.)
– Correlation of cost growth exists between the R&D and Production phases of Acquisition1
• We believe: this implies correlation in cost growth between O&S and Acquisition from onset– Note, this does not mean cost growth during O&S
– Intuitive, though no data analysis to support
1 Cost Risk Estimates Incorporating Functional Correlation, Acquisition Phase Relationships, and Realized Risk, SCEA National Conference 1997, R. L. Coleman, S. S. Gupta, J. R. Summerville, G. E. Hartigan

SCEA 2000 - 15 June 2000
[email protected] JRS, TASC, 04/18/23, 8
020406080
100120
200 400 600EMD SW
So
ftw
are
M
ain
ten
an
ce
Navy Area Risk ResultsBefore O&S Revamp
Pt Est Mean CV Risk $ Risk % CE Risk S/T RiskLCC 5392.64 6,262.92 0.12 870.28 16.1% 3.6% 12.6%PDRR 241.11 274.24 0.11 33.13 13.7% 2.4% 11.3%EMD 1226.11 1,491.47 0.12 265.36 21.6% 3.3% 18.4%LRIP 230.65 272.75 0.17 42.10 18.3% 3.7% 14.6%Prod-Missile 2494.12 2,940.70 0.17 446.59 17.9% 3.9% 14.0%Prod-Ships 609.53 668.18 0.35 58.66 9.6% 3.3% 6.3%O&S 567.72 588.18 0.13 20.46 3.6% 3.6% 0.0%D&D 23.40 27.40 0.24 4.00 17.1% 3.9% 13.2%
After O&S RevampPt Est Mean CV Risk $ Risk % CE Risk S/T Risk
LCC 5392.64 6,300.64 0.12 908.00 16.8% 3.6% 13.3%PDRR 241.11 274.20 0.11 33.09 13.7% 2.4% 11.3%EMD 1226.11 1,491.05 0.12 264.95 21.6% 3.3% 18.3%LRIP 230.65 272.80 0.17 42.14 18.3% 3.7% 14.6%Prod-Missile 2494.12 2,944.59 0.17 450.47 18.1% 3.9% 14.2%Prod-Ships 609.53 669.54 0.36 60.01 9.8% 3.3% 6.5%O&S 567.72 621.23 0.23 53.51 9.4% 3.6% 5.8%D&D 23.40 27.22 0.24 3.82 16.3% 3.9% 12.5%
Issues with BMDO O&S Risk
Example:
SW Maintenance vs. Dev SW
Point Estimat
e
As Dev SW increases, SW Maint should as well,
causing a higher mean, and thus a higher risk percentage. Lack of
correlation holds down the SW Maint cost here.
As Dev SW increases, SW Maint should as well,
causing a higher mean, and thus a higher risk percentage. Lack of
correlation holds down the SW Maint cost here.
Numbers are for
example only
• Most BMDO elements currently have little to no sched/tech risk in O&S– Compare Risk % and CV w/other phases
– Lack of correlation is the culprit

SCEA 2000 - 15 June 2000
[email protected] JRS, TASC, 04/18/23, 9
Ideas for Improvement• Use Functional Correlation1 where available
• Expand on Functional Correlation using the following methods:– Cost Response Curves– Injected Correlation– Algebraic manipulation
Details to follow
1 Cost Risk Estimates Incorporating Functional Correlation, Acquisition Phase Relationships, and Realized Risk, SCEA National Conference 1997, R. L. Coleman, S. S. Gupta, J. R. Summerville, G. E. Hartigan;An Overview of Correlation and Functional Dependencies in Cost Risk and Uncertainty Analysis, DoDCAS 1994, R. L. Coleman, S. S. Gupta

SCEA 2000 - 15 June 2000
[email protected] JRS, TASC, 04/18/23, 10
Cost Response Curves1
-20
0
20
40
60
80
100
0 20 40 60 80 100 120
Development Cost, $M
Mai
nte
nan
ce C
ost,
$M
Y= 0.74 X - 0.18
Example:
• Use existing cost tools to create a functional relationship– E.g. for Software: SLIM, SEER, SASET– Run several iterations on different SLOC values to
derive an equation that links maintenance cost to development cost
– Incorporate in cost model as a functional relationship
1 Cost Response Curves - Their generation, their use in IPTs, Analyses of Alternatives, and Budgets, DoDCAS 1996, K. J. Allison, K. E. Crum, R. L. Coleman, R. G. Klion
SCEA 2000 - 15 June 2000
[email protected] JRS, TASC, 04/18/23, 11
Injected Correlations
• Setup links to create correlation implicitly– Correlation coefficients are not estimated
directly– Procedure involves linking cost growth factors
between elements, and creating correlation in the simulation as a result
– The amount of correlation you have implicitly estimated can be calculated after the simulation has run… example later…

SCEA 2000 - 15 June 2000
[email protected] JRS, TASC, 04/18/23, 12
Other Approaches
• Other extensions of Functional Correlation are possible
• Similar to the CRC, FC may be applied if there is a CER that is related to a common variable in Acquisition, e.g. weight.– This case involves simple algebraic manipulation of
the O&S equation in order for it to reference the resulting cost of the related CER rather than its common parameter


SCEA 2000 - 15 June 2000
[email protected] JRS, TASC, 04/18/23, 14
Maintenance (Visual Inspection)
1%
Disposal (Recertification)
1%
Contractor Technical Support
4%
Other Int. Maintenance
(shipping)2%
Consumable Mat/Repair Parts
(ILMF)11%
Other Sustaining Support (range
support)5%
Software Maintenance
7%
Other Recurring Investments
69%
Navy Area O&S Breakdown
Correlated
Independent

SCEA 2000 - 15 June 2000
[email protected] JRS, TASC, 04/18/23, 15
O&S Model Adjustments
• Before: 1% of O&S phase Correlated to Acquisition• After: 89% of O&S phase Correlated to Acquisition• Used functional relationships where possible
– Disposal, spares
• Injected correlation in cases where functions not available– SW Maintenance, Intermediate Maintenance

SCEA 2000 - 15 June 2000
[email protected] JRS, TASC, 04/18/23, 16
Maintenance (Visual Inspection)
1%
Disposal (Recertification)
1%
Contractor Technical Support
4%
Other Int. Maintenance
(shipping)2%
Consumable Mat/Repair Parts
(ILMF)11%
Other Sustaining Support (range
support)5%
Software Maintenance
7%
Other Recurring Investments
69%
Navy Area O&S BreakdownDirecting Correlation
Correlated
Independent
Ship Adjunct
Processors
SW Development
RecurringProductionRecurringProductionRecurringProduction
Acquisition Item to be Correlated

SCEA 2000 - 15 June 2000
[email protected] JRS, TASC, 04/18/23, 17
Risk in Navy Area O&SBefore and After
Point Phase Correlated Original Model New Test ModelEstimate Portion to Mean Risk % CV Mean Risk % CV
TOTAL 567.72 100% 588.18 3.6% 0.13 621.23 9.4% 0.23Maintenance (Visual Inspection) 3.99 1%
Missile Recurring Production 4.14 3.6% 0.19 4.75 18.9% 0.25
Consumable Mat/Repair Parts (ILMF) 25.96 11%
Missile Recurring Production 26.70 2.8% 0.19 30.70 18.3% 0.25
Other Int. Maintenance (shipping) 10.38 2% nothing 10.78 3.9% 0.19 10.70 3.1% 0.19
Contractor Technical Support 24.05 4% nothing 24.83 3.3% 0.19 24.69 2.7% 0.20
Other Recurring Investments 391.36 69%
Ship HW (Adjunct Processors) 404.91 3.5% 0.19 420.50 7.4% 0.33
Software Maintenance 42.08 7% EMD SW 43.61 3.6% 0.19 56.85 35.1% 0.27Other Sustaining Support (range support) 64.30 5% nothing 66.61 3.6% 0.15 66.46 3.4% 0.15
Disposal (Recertification) 5.60 1%
Missile & Ship Recurring HW 6.59 17.9% 0.25 6.58 17.6% 0.26

SCEA 2000 - 15 June 2000
[email protected] JRS, TASC, 04/18/23, 18
Correlation ExampleSW Maintenance
Before: After:
Actual Simulation Results
020406080
100120
200 400 600EMD SW
So
ftw
are
Mai
nte
nan
ce
020406080
100120
200 400 600EMD SW
So
ftw
are
M
ain
ten
an
ce
Not Correlated Correlated
Risk = 3.6% Risk = 35.1%

SCEA 2000 - 15 June 2000
[email protected] JRS, TASC, 04/18/23, 19
Risk % in Navy Area O&SBefore and After
0.0%
5.0%
10.0%
15.0%
20.0%
25.0%
30.0%
35.0%
40.0%
Original Model
New Test Model

SCEA 2000 - 15 June 2000
[email protected] JRS, TASC, 04/18/23, 20
Navy Area RiskNavy Area Risk Results
Before O&S RevampPt Est Mean CV Risk $ Risk % CE Risk S/T Risk
LCC 5392.64 6,262.92 0.12 870.28 16.1% 3.6% 12.6%PDRR 241.11 274.24 0.11 33.13 13.7% 2.4% 11.3%EMD 1226.11 1,491.47 0.12 265.36 21.6% 3.3% 18.4%LRIP 230.65 272.75 0.17 42.10 18.3% 3.7% 14.6%Prod-Missile 2494.12 2,940.70 0.17 446.59 17.9% 3.9% 14.0%Prod-Ships 609.53 668.18 0.35 58.66 9.6% 3.3% 6.3%O&S 567.72 588.18 0.13 20.46 3.6% 3.6% 0.0%D&D 23.40 27.40 0.24 4.00 17.1% 3.9% 13.2%
After O&S RevampPt Est Mean CV Risk $ Risk % CE Risk S/T Risk
LCC 5392.64 6,300.64 0.12 908.00 16.8% 3.6% 13.3%PDRR 241.11 274.20 0.11 33.09 13.7% 2.4% 11.3%EMD 1226.11 1,491.05 0.12 264.95 21.6% 3.3% 18.3%LRIP 230.65 272.80 0.17 42.14 18.3% 3.7% 14.6%Prod-Missile 2494.12 2,944.59 0.17 450.47 18.1% 3.9% 14.2%Prod-Ships 609.53 669.54 0.36 60.01 9.8% 3.3% 6.5%O&S 567.72 621.23 0.23 53.51 9.4% 3.6% 5.8%D&D 23.40 27.22 0.24 3.82 16.3% 3.9% 12.5%

SCEA 2000 - 15 June 2000
[email protected] JRS, TASC, 04/18/23, 21
Analysis• Risk increased for all newly correlated items• Total percent still seems understated when
compared to other phases--why?– Bulk of Phase $ (69%) under “Other Recurring
Investments”• Cost is for periodic replacement of ship adjunct processors• Correlated to adjunct processor HW in the ship production
phase, low risk
– Note new O&S risk % close to Ship Production risk %

SCEA 2000 - 15 June 2000
[email protected] JRS, TASC, 04/18/23, 22
Resulting Correlation
SUMMARY OUTPUT
Regression StatisticsMultiple R 0.61R Square 0.38Adjusted R Square 0.36Standard Error 11.49Observations 50
ANOVAdf SS MS F Sig F
Regression 1 3,835.11 3,835.11 29.03 0.000002Residual 48 6,341.72 132.12Total 49 10,176.83
Coeffs Std Error t Stat P-value Low 95% Up 95%Intercept -1.87 11.41 -0.16 0.87 -24.82 21.08EMD SW 0.15 0.03 5.39 0.00 0.10 0.21
AFTER
020406080
100120
200 400 600EMD SW
SUMMARY OUTPUT
Regression StatisticsMultiple R 0.02R Square 0.0004Adjusted R Square -0.02Standard Error 7.24Observations 50
ANOVAdf SS MS F Sig F
Regression 1 0.901121 0.901121 0.017168 0.896303Residual 48 2519.504 52.48967Total 49 2520.405
Coeffs Std Error t Stat P-value Low 95% Up 95%Intercept 43.80 5.40 8.11 1.5E-10 32.94 54.65EMD SW 0.00 0.01 -0.13 0.90 -0.03 0.03
BEFORE
020406080
100120
200 300 400 500 600
EMD SW
Software MaintenanceExample
= 0.61
This is not to say we haveconfidence that these resultsexactly reflect reality, but it
is clearly a better alternativethan what was previously
accepted
This is not to say we haveconfidence that these resultsexactly reflect reality, but it
is clearly a better alternativethan what was previously
accepted

SCEA 2000 - 15 June 2000
[email protected] JRS, TASC, 04/18/23, 23
Conclusion
• The methodology presented in this paper has significantly enhanced the quality of BMDO O&S cost estimates– Concepts are simple to implement
– All required assumptions can feasibly be made by cost analysts
• Future improvements will result with the development of better CERs for O&S that provide known relationships with Acquisition.