scarcity, trade offs, and production...
TRANSCRIPT

Copyright © 2013 Nelson Education Limited
SCARCITY, TRADE‐OFFS, AND PRODUCTION POSSIBILITIES
Chapter 2
Copyright © 2013 Nelson Education Limited
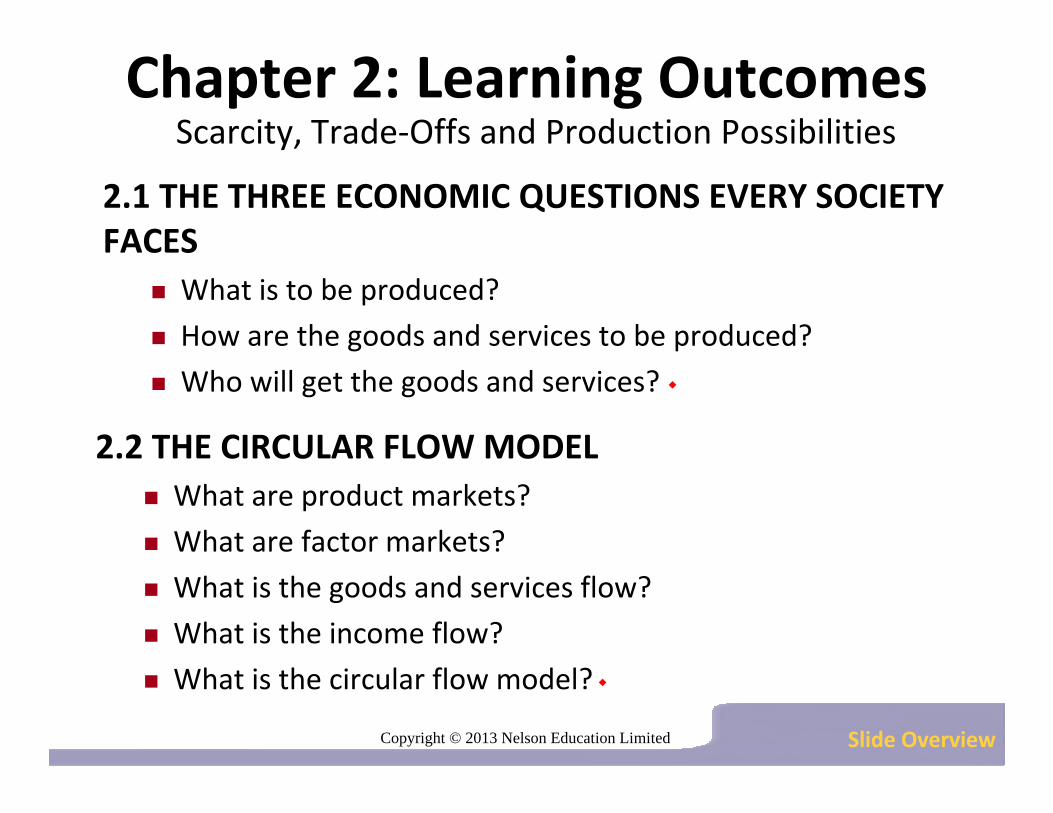
Chapter 2: Learning Outcomes
2.1 THE THREE ECONOMIC QUESTIONS EVERY SOCIETY FACES
What is to be produced?
How are the goods and services to be produced?
Who will get the goods and services?
Scarcity, Trade‐Offs and Production Possibilities
Slide Overview
2.2 THE CIRCULAR FLOW MODELWhat are product markets?
What are factor markets?
What is the goods and services flow?
What is the income flow?
What is the circular flow model?

Copyright © 2013 Nelson Education Limited
Chapter 2: Learning Outcomes
2.3 THE PRODUCTION POSSIBILITIES CURVEWhat is a production possibilities curve?
What is efficiency?
How is opportunity cost measured?
What is the law of increasing opportunity costs?
2.4 ECONOMIC GROWTH AND THE PRODUCTION POSSIBILITIES CURVE
How do we show economic growth on the production possibilities curve?
How can we summarize the production possibilities curve model?
Scarcity, Trade‐Offs and Production Possibilities
Slide Overview
Copyright © 2013 Nelson Education Limited
Chapter 2
2.1 The Three Economic Questions Every Society Faces
2.2 The Circular Flow Model
2.3 The Production Possibilities Curve
2.4 Economic Growth and the Production Possibilities Curve
Copyright © 2013 Nelson Education Limited
2.1 The Three Economic Questions Every Society Faces
Our wants far outstrip what can be produced from nature’s scarce resources.
Because of scarcity, certain economic questions must be answered…
Section 2.1

Copyright © 2013 Nelson Education Limited
2.1 The Three Economic Questions Every Society Faces
What is to be produced?
How are these goods and services to be produced?
Who will get the goods and services?
Section 2.1
Copyright © 2013 Nelson Education Limited
2.1 The Three Economic Questions Every Society Faces
1. What is to be produced?
In market economies, consumers decided what is produced by voting with their dollars (or pounds or yen etc.). This is called Consumer sovereignty
Decentralized decision‐making process
Millions of individual producers and consumers determine what goods will be produced.
Section 2.1
Copyright © 2013 Nelson Education Limited
2.1 The Three Economic Questions Every Society Faces
1. What is to be produced?
most countries have mixed economies ‐ the government and private sector determine the allocation of resources together
Section 2.1
Copyright © 2013 Nelson Education Limited
2.1 The Three Economic Questions Every Society Faces
2. How are the Goods and Services to be Produced?
Goods and services can generally be produced in several ways. For example, a ditch can be dug by many workers using their hands, by a few workers with shovels, or by one person with a backhoe.
Section 2.1
Copyright © 2013 Nelson Education Limited
2.1 The Three Economic Questions Every Society Faces
2. How are the Goods and Services to be Produced?
the best method is the least‐costmethod.
each nation tends to:
conserve its relatively scarce (more expensive) resources;
use more of its relatively abundant (cheaper) resources.
Section 2.1
Copyright © 2013 Nelson Education Limited
2.1 The Three Economic Questions Every Society Faces
2. How are the Goods and Services to be Produced?
labour intensivemethods will be used where capital is relatively scarce.
capital intensivemethods will be used where labour is relatively scarce.
Section 2.1

Copyright © 2013 Nelson Education Limited
2.1 The Three Economic Questions Every Society Faces
3. Who will get the Goods and Services
a question of distribution of income.
in a market economy, the output one can get depends on one's income.
income depends on the quantity and quality of scarce resources that an individual controls.
Section 2.1

Copyright © 2013 Nelson Education Limited
2.1 The Three Economic Questions Every Society Faces
Why Do Celebrities Make So Much Money?
Because they control scarce resources: in this case, Avril’s talent and name recognition.
Talents and other goods and services in limited supply relative to demand will command higher prices.
Avril Lavigne
Section 2.1
Copyright © 2013 Nelson Education Limited
2.1 The Three Economic Questions
Section Check
Every economy has to decide What to Produce?
In a decentralized market economy, millions of buyers and sellers determine what and how much to produce.
In a mixed economy, the government and the private sector determine the allocation of resources.
Section 2.1
Copyright © 2013 Nelson Education Limited
2.1 The Three Economic Questions
Section Check
Every economy has to decide: How to Produce the Goods and Services?
The best form of production is the one that conserves the relatively scarce (more costly) resources and uses more of the abundant (less costly) resources.
When capital is relatively scarce and labour is plentiful, production tends to be labour‐intensive.
When labour is scarce and capital is relatively abundant, production tends to be capital‐intensive.
Section 2.1
Copyright © 2013 Nelson Education Limited
2.1 The Three Economic Questions
Section Check
Finally, every economy has to determine: Who Will Get the Goods and Services?
In a market economy, the amount of goods and services one is able to obtain depends on one’s income.
The amount of one’s income depends on the quantity and the quality of the scarce resources that the individual controls.
Section 2.1

Copyright © 2013 Nelson Education Limited
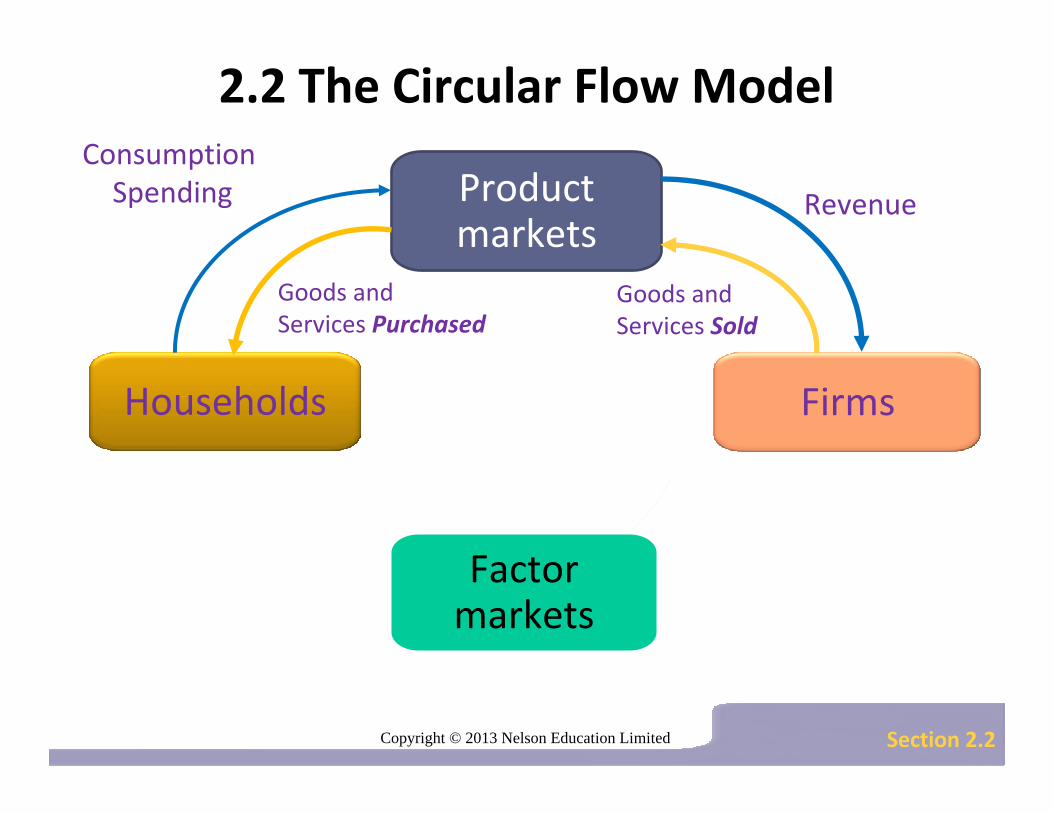
2.2 The Circular Flow Model
What are product markets?
What are factor markets?
What is the goods and services flow?
What is the income flow?
What is the circular flow model?
Section 2.2

Copyright © 2013 Nelson Education Limited
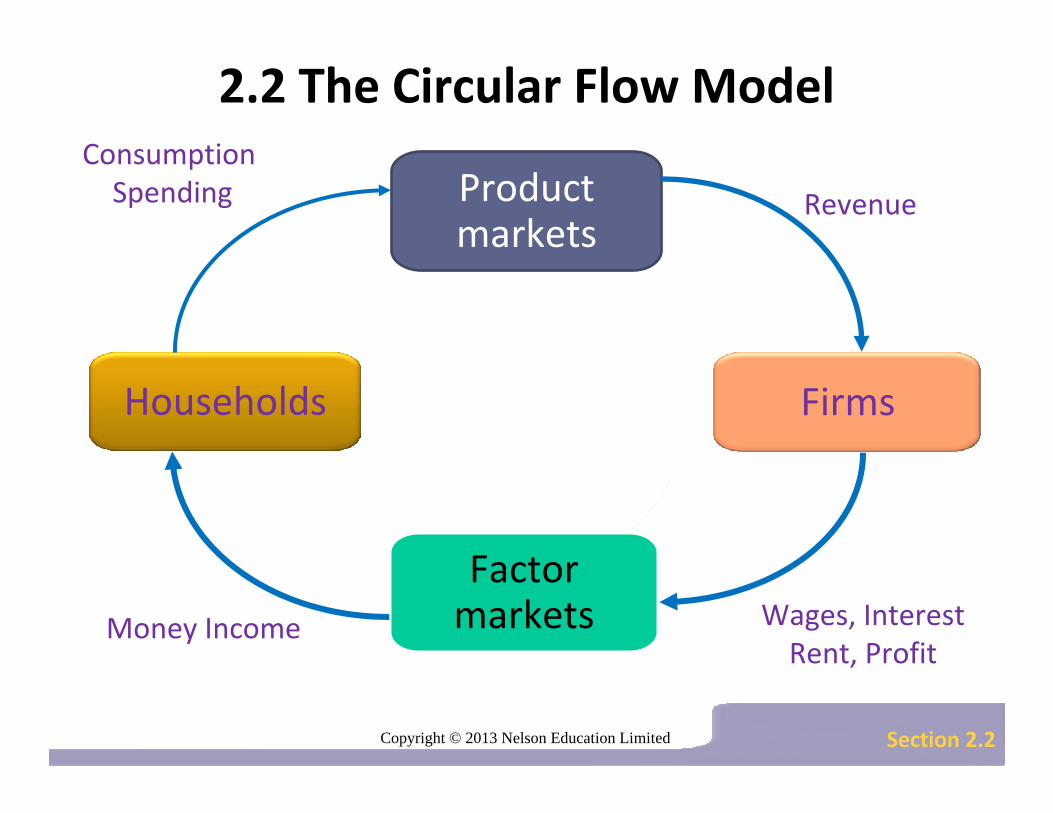
2.2 The Circular Flow Model
What are Product Markets?the markets for consumer goods and services
households are buyers, firms are sellers.
payments flow to firms at the same time goods and services flow to households.
Section 2.2
Copyright © 2013 Nelson Education Limited
2.2 The Circular Flow Model
Section 2.2
Firms
Factor marketsFactor markets
Households
Product markets
Revenue
Consumption Spending
Goods andServices Sold
Goods and Services Purchased
Copyright © 2013 Nelson Education Limited
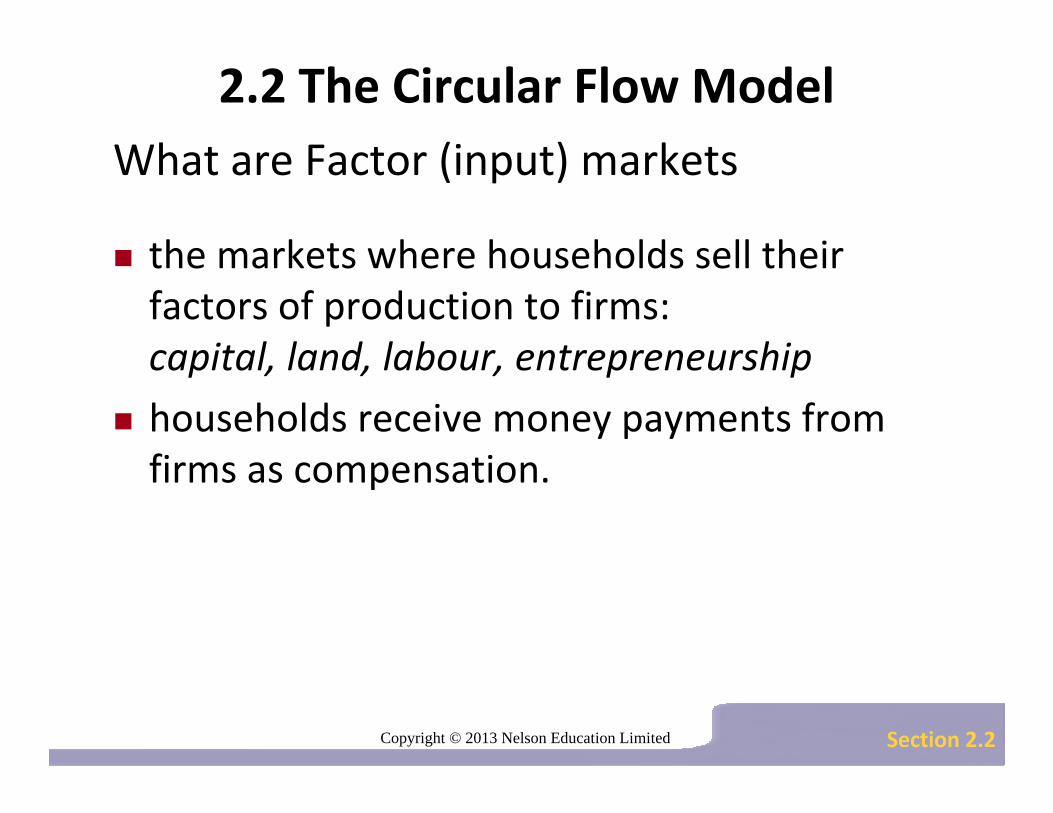
2.2 The Circular Flow ModelWhat are Factor (input) markets
the markets where households sell their factors of production to firms:capital, land, labour, entrepreneurship
households receive money payments from firms as compensation.
Section 2.2
Copyright © 2013 Nelson Education Limited
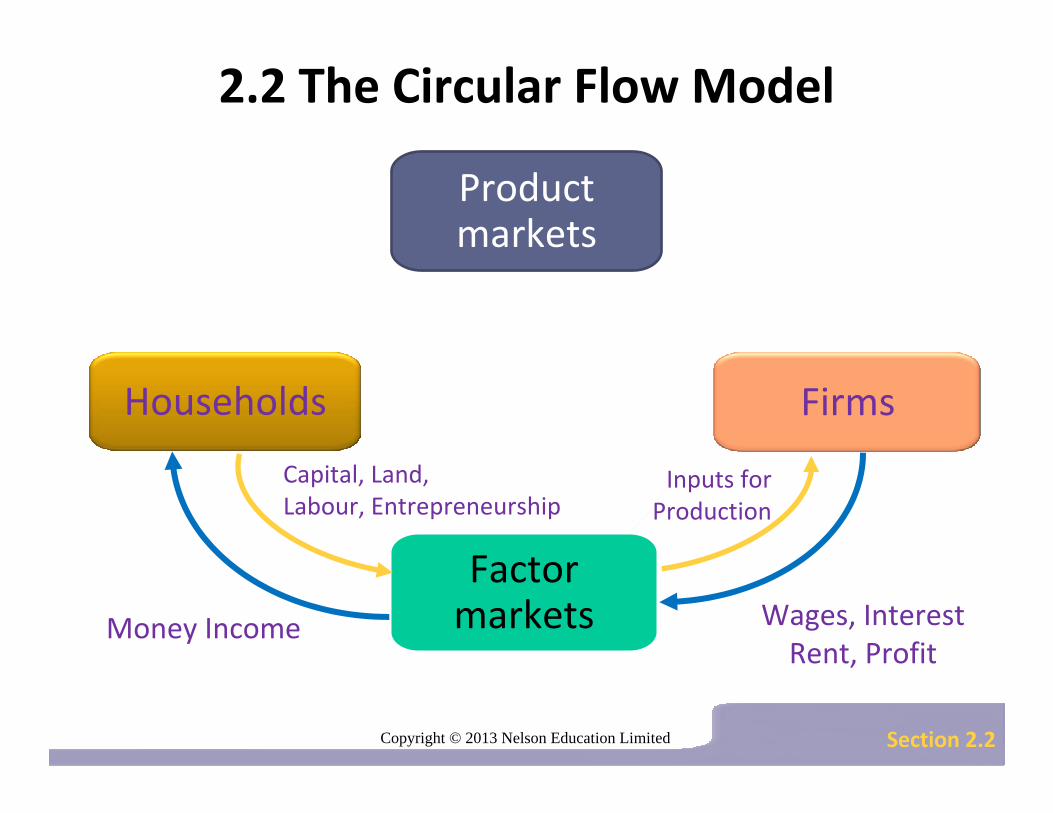
2.2 The Circular Flow Model
Section 2.2
Firms
Factor marketsFactor markets
Households
Product markets
Money Income Wages, InterestRent, Profit
Capital, Land, Labour, Entrepreneurship
Inputs forProduction
Copyright © 2013 Nelson Education Limited
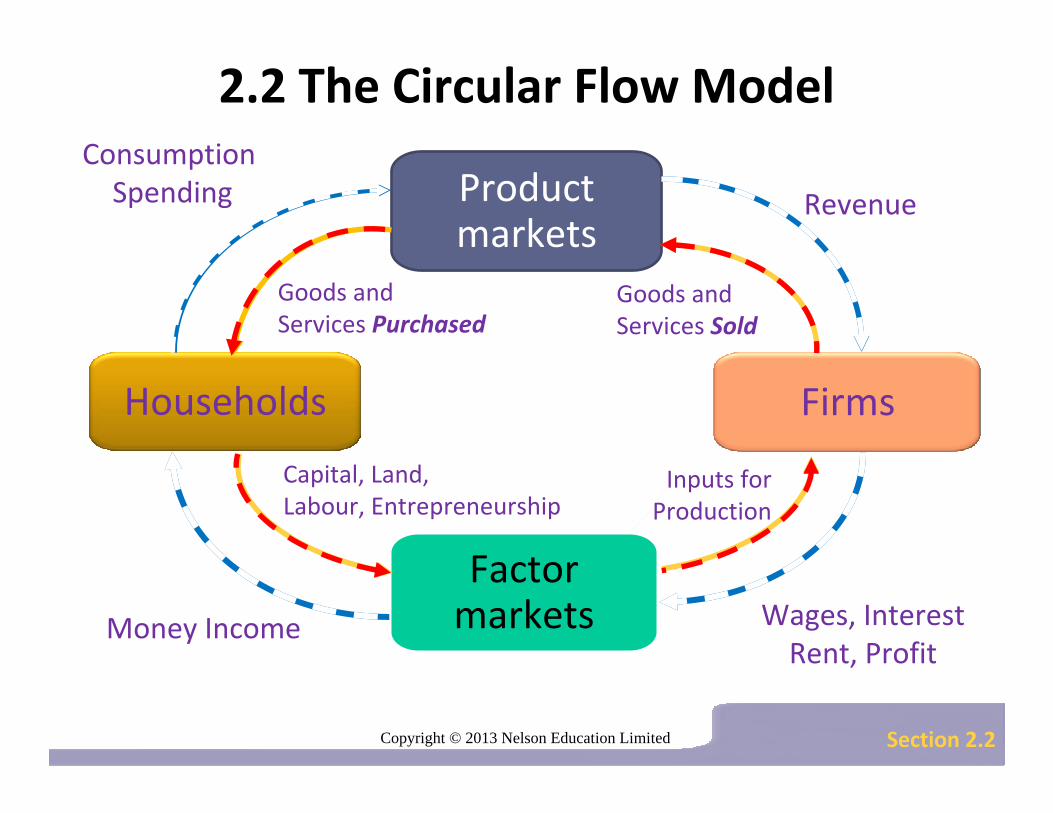
2.2 The Circular Flow Model
What is the Goods and Services Flow
Continuous flow of inputs and outputs in an economy
Section 2.2
Copyright © 2013 Nelson Education Limited
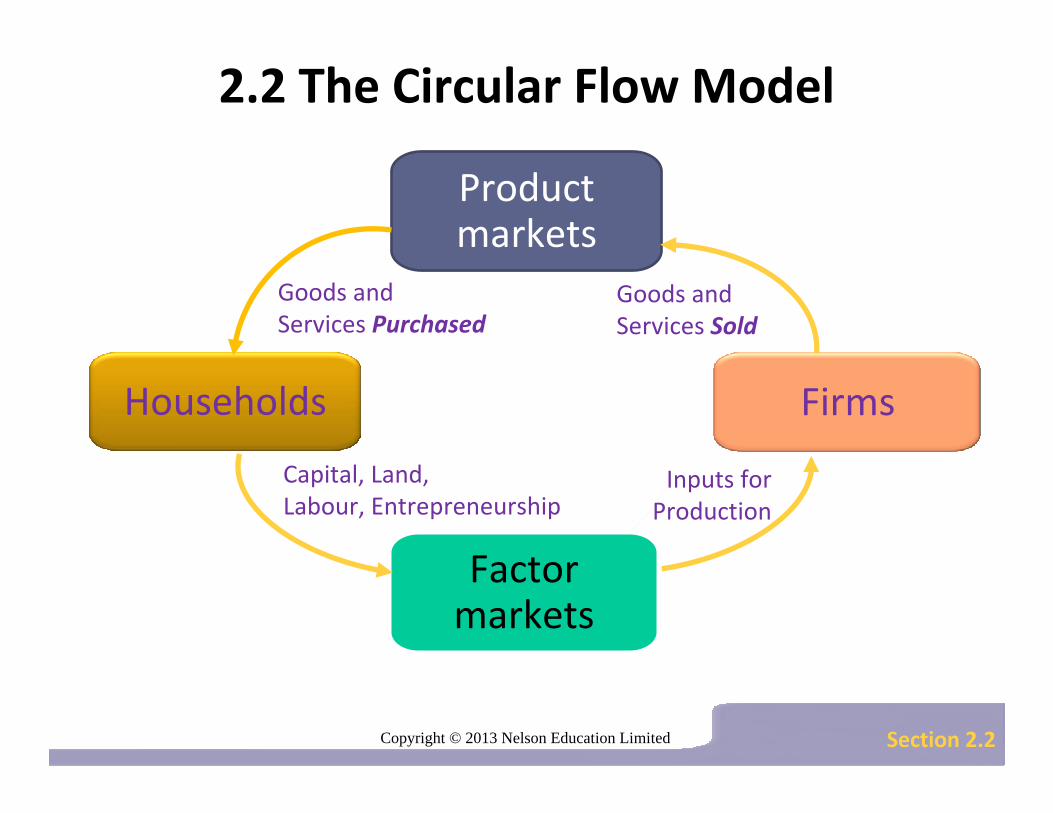
2.2 The Circular Flow Model
Section 2.2
Firms
Factor marketsFactor markets
Households
Product markets
Goods andServices Sold
Capital, Land, Labour, Entrepreneurship
Goods and Services Purchased
Inputs forProduction
Copyright © 2013 Nelson Education Limited
2.2 The Circular Flow Model
What is the Income Flow?
Continuous flow of income and spending in an economy.
Section 2.2
Copyright © 2013 Nelson Education Limited
2.2 The Circular Flow Model
Section 2.2
Firms
Factor marketsFactor markets
Households
Product markets
Revenue
Consumption Spending
Money Income Wages, InterestRent, Profit
Copyright © 2013 Nelson Education Limited
2.2 The Circular Flow Model
Section 2.2
Firms
Factor marketsFactor markets
Households
Product markets
Revenue
Consumption Spending
Money Income Wages, InterestRent, Profit
Goods andServices Sold
Capital, Land, Labour, Entrepreneurship
Goods and Services Purchased
Inputs forProduction
Copyright © 2013 Nelson Education Limited
2.2 The Circular Flow Model
Section 2.2
Copyright © 2013 Nelson Education Limited
2.2 The Circular Flow Model
Section Check
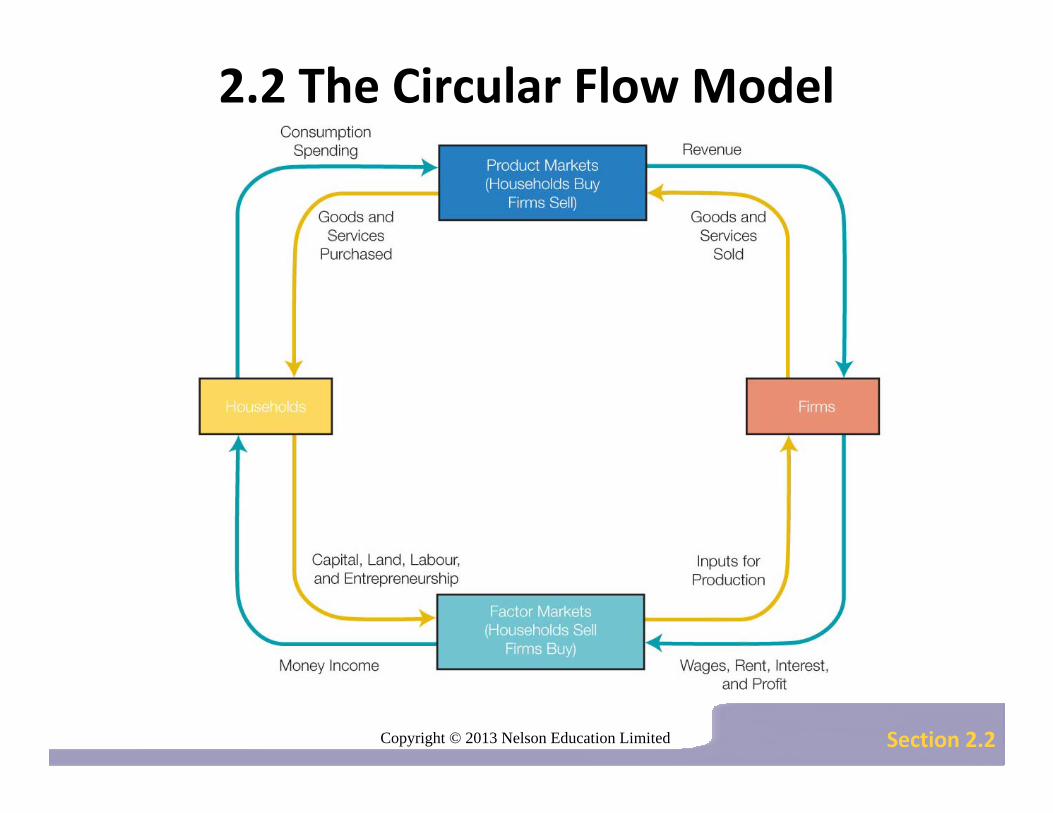
In the productmarket, households are buyers and firms are sellers.
In the factormarkets, households are the sellers and firms are the buyers.
The goods and services flow represents the continuous flow of inputs and outputs in an economy.
Section 2.2

Copyright © 2013 Nelson Education Limited
2.2 The Circular Flow Model
Section Check
The income flow represents the continuous flow of income and expenditure in an economy.
The circular flowmodel illustrates the flow of goods, services, and payments among firms and households
Section 2.2
Copyright © 2013 Nelson Education Limited
2.3 The Production Possibilities Curve
What is a production possibilities curve?
What is efficiency?
What is opportunity cost?
How is opportunity cost measured?
What is the law of increasing opportunity costs?
Section 2.3
Copyright © 2013 Nelson Education Limited
2.3 The Production Possibilities Curve
Production Possibilities Curve
shows potential total output combinations of any two goods for an economy
given existing levels of resources and technology
illustrates the economic concepts of scarcity, choice and trade-offs
Section 2.3
Copyright © 2013 Nelson Education Limited
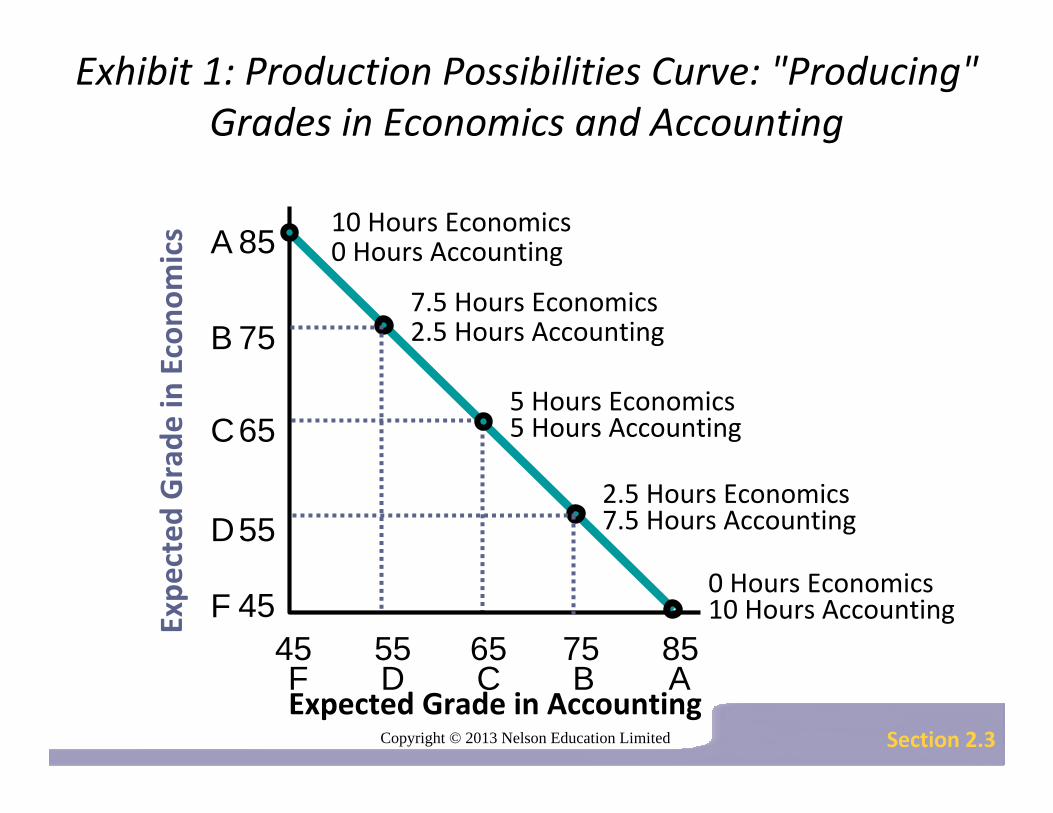
Exhibit 1: Production Possibilities Curve: "Producing" Grades in Economics and Accounting
Expe
cted
Grade
in Econo
mics
655545 75 85CDF B A
Expected Grade in Accounting
85
75
65
55
F
A
B
C
D
10 Hours Economics0 Hours Accounting
7.5 Hours Economics2.5 Hours Accounting
5 Hours Economics5 Hours Accounting
2.5 Hours Economics7.5 Hours Accounting
0 Hours Economics10 Hours Accounting45
Section 2.3

Copyright © 2013 Nelson Education Limited
2.3 The Production Possibilities Curve
Section 2.3

Copyright © 2013 Nelson Education Limited
2.3 The Production Possibilities Curve
Efficiency:getting the most from society’s scarce resources. resources are used efficiently at all points along a production possibilities curvemore of one product requires the sacrifice of another product
Section 2.3

Copyright © 2013 Nelson Education Limited
2.3 The Production Possibilities Curve
Efficiency:if resources are not fully used, an economy is operating within the curve. actual output is less than potential output. a point outside the curve is not attainable with existing resources and technology
Section 2.3

Copyright © 2013 Nelson Education Limited
Exhibit 2: Production Possibilities Curve: The Trade‐Off Between Shelter and Food
Shel
ter (
units
)
I(Inefficient)
Food (units)0
10987654321
20 40 60 80
N (Not Attainable)
AB
C
D
E
all points on the curve are efficient (A,B,C,D,E)
any points outside of the curve are not attainable with current resources and technology (N).
all points in the shaded area are inefficient (I).
Section 2.3

Copyright © 2013 Nelson Education Limited
2.3 The Production Possibilities Curve
Section 2.3
Copyright © 2013 Nelson Education Limited
2.3 The Production Possibilities Curve
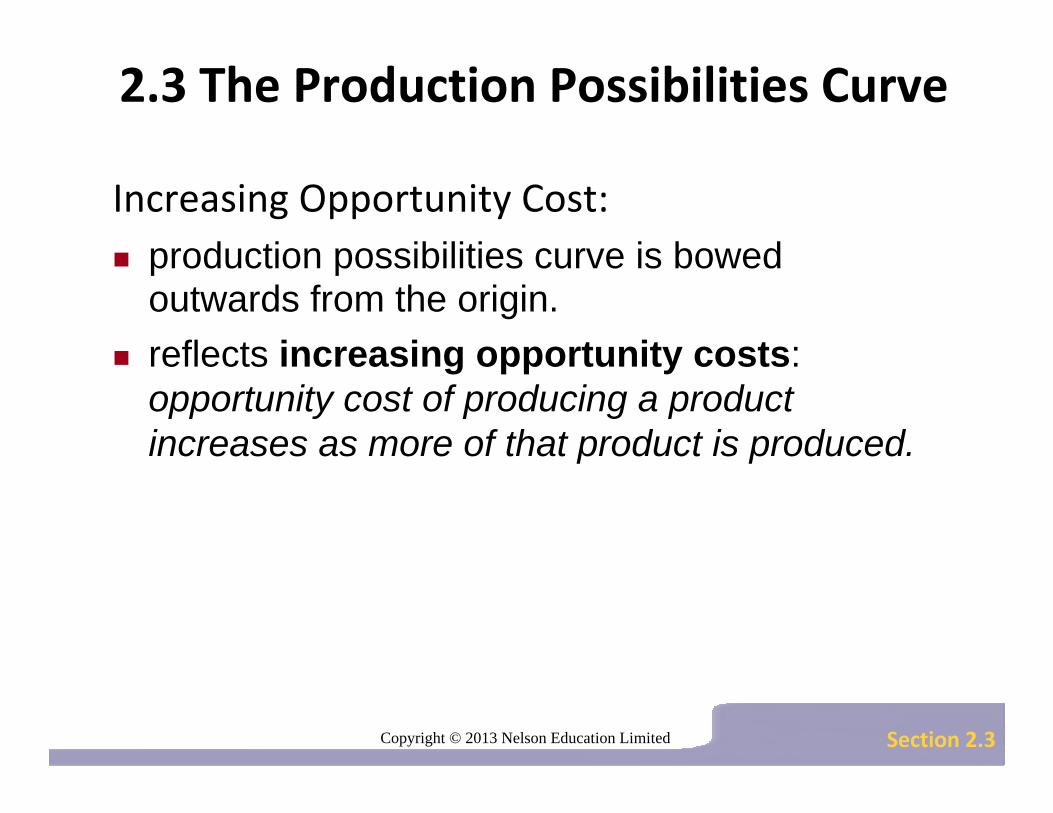
Increasing Opportunity Cost:production possibilities curve is bowed outwards from the origin. reflects increasing opportunity costs:opportunity cost of producing a product increases as more of that product is produced.
Section 2.3

Copyright © 2013 Nelson Education Limited
2.3 The Production Possibilities Curve
Increasing Opportunity Cost:some resources are less adaptable to alternative uses. as more of a product is produced, less adaptable resources are used the production of additional units becomes increasingly more costly
Section 2.3

Copyright © 2013 Nelson Education Limited
2.3 The Production Possibilities Curve
Section 2.3

Copyright © 2013 Nelson Education Limited
Exhibit 3: Increasing Opportunity Cost and the Production Possibilities Curve
Shel
ter (
unit)
Food (units)0
10987654321
20 40 60 80
AOpportunity cost in forgone shelter (1 unit) to obtain 20 additional food units B Opportunity cost in forgone shelter (2 units)
to obtain 20 additional food units
C
D
Opportunity cost in forgone shelter (3 units) to obtain 20 additional food units
Opportunity cost in forgone shelter (4 units) to obtain 20 additional food units
E
Section 2.3

Copyright © 2013 Nelson Education Limited
2.3 The Production Possibilities Curve
Section Check
The production possibilities curve represents the potential total output combinations of two goods available to a society given its resources and existing technology.
Efficiency requires society to use its resources to the fullest extent—no wasted resources. If the economy is operating within (under) the production possibilities curve, the economy is operating inefficiently.
Section 2.3

Copyright © 2013 Nelson Education Limited
2.3 The Production Possibilities Curve
Section Check
The cost of altering production within the production possibilities curve framework, at efficiency, is measured in forgone units of the sole alternative.
A bowed production possibilities curve means that the opportunity costs of producing additional units of a good rise as society produces more of that good (invoking the law of increasing opportunity costs).
Section 2.3

Copyright © 2013 Nelson Education Limited
2.4 Economic Growth and Production Possibilities
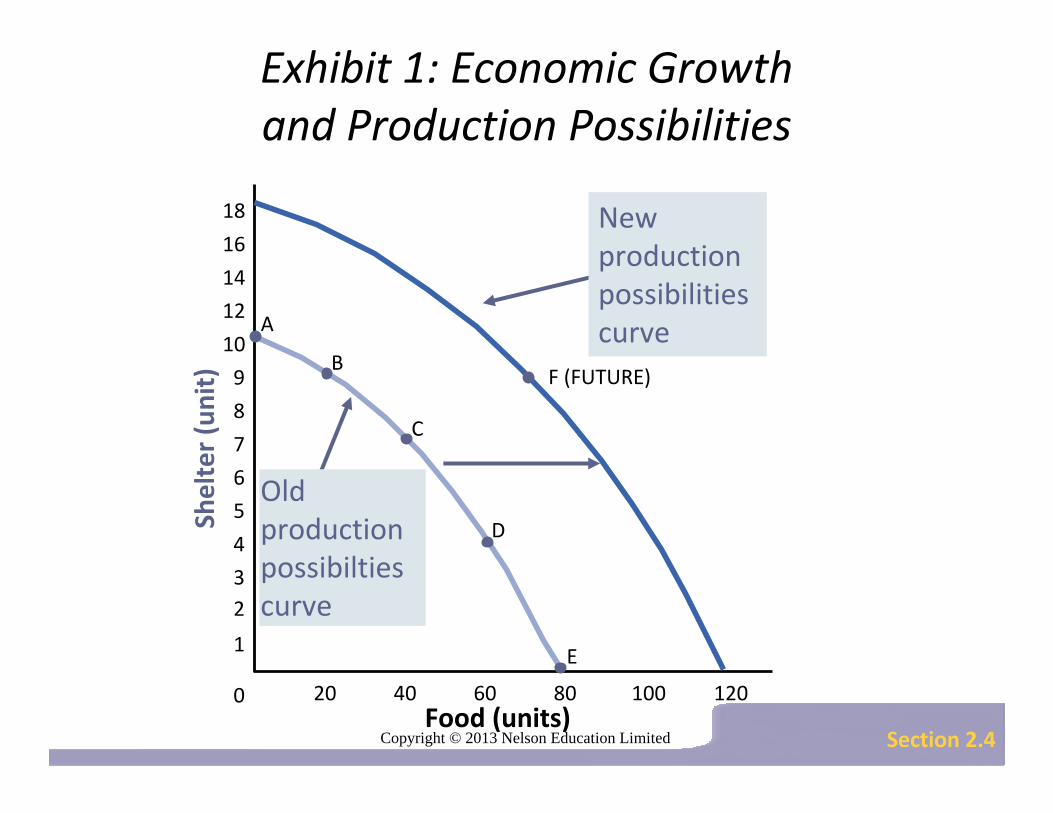
Economic Growth:results from qualitative or quantitative changes in the factors of production (resources).
- advancements in technology - improvements in productivity - new sources of natural resources
causes an outward shift in the possible combinations of goods and services.
Section 2.4

Copyright © 2013 Nelson Education Limited
2.4 Economic Growth and Production Possibilities
Section 2.4
Copyright © 2013 Nelson Education Limited
Exhibit 1: Economic Growth and Production Possibilities
Shelter (unit)
Food (units)0
10
9
12
14
16
18
8
7
6
5
4
32
1
20 40 60 100 12080
A
B
C
D
E
F (FUTURE)
New production possibilities curve
Old production possibilties curve
Section 2.4

Copyright © 2013 Nelson Education Limited
2.4 Economic Growth and Production Possibilities
Generating Economic Growth:must invest more resources for the future.
capital goods expand the ability to produce in the future
to grow, must produce fewer consumer goods, more capital goods.
sacrifice some current consumption to increase future consumption
Section 2.4

Copyright © 2013 Nelson Education Limited
2.4 Economic Growth and Production Possibilities
Section 2.4

Copyright © 2013 Nelson Education Limited
2.4 Economic Growth and Production Possibilities
Section 2.4

Copyright © 2013 Nelson Education Limited
2.4 Economic Growth and Production Possibilities
Section Check
Economic growth is represented by an outward shift of the production possibilities curve, indicating an increase in the possibility of producing more of all goods. Despite this, scarcity inevitably remains a fact of life.
The production possibilities model is an effective way of illustrating the economic concepts of scarcity, choice, opportunity costs, efficiency, and economic growth.
Section 2.4

Copyright © 2013 Nelson Education Limited
Reviewing the Learning Outcomes
2.1 THE THREE ECONOMIC QUESTIONS EVERY SOCIETY FACES
What is to be produced?
How are the goods and services to be produced?
Who will get the goods and services?
2.2 THE CIRCULAR FLOW MODELWhat are product markets?
What are factor markets?
What is the goods and services flow?
What is the income flow?
What is the circular flow model?
Slide Summary

Copyright © 2013 Nelson Education Limited
Reviewing the Learning Outcomes
2.3 THE PRODUCTION POSSIBILITIES CURVEHow do we show economic growth on the production possibilities curve?
How can we summarize the production possibilities curve model?
2.4 ECONOMIC GROWTH AND THE PRODUCTION POSSIBILITIES CURVE
How do we show economic growth on the production possibilities curve?
How can we summarize the production possibilities curve model?
Slide Summary