scarcity, trade-offs, and comparative advantage. scarcity and trade-offs households, firms and...
TRANSCRIPT

Scarcity, Trade-offs, and Comparative Advantage
Scarcity and Trade-offs
Households, firms and governments continually face decisions about how best to use their scarce resources.
Scarcity: a situation in which unlimited wants exceed the limited resources available to fulfill those wants.
Scarcity requires trade-offs. Economics teaches us tools to help make good trade-offs.
Example: When deciding how to use its scarce workers and machinery, if Tesla wants to produce more Model X SUVs, those resources will not be available to produce Model S sedans.
Production Possibilities Frontier (PPF)
A production possibilities frontier (PPF) is a curve showing the maximum attainable combinations of two products that may be produced with available resources and current technology.
Question: Is the PPF a positive or normative tool?
Answer: Positive; it shows “what is”, not “what should be”.
PPF for Tesla Motors
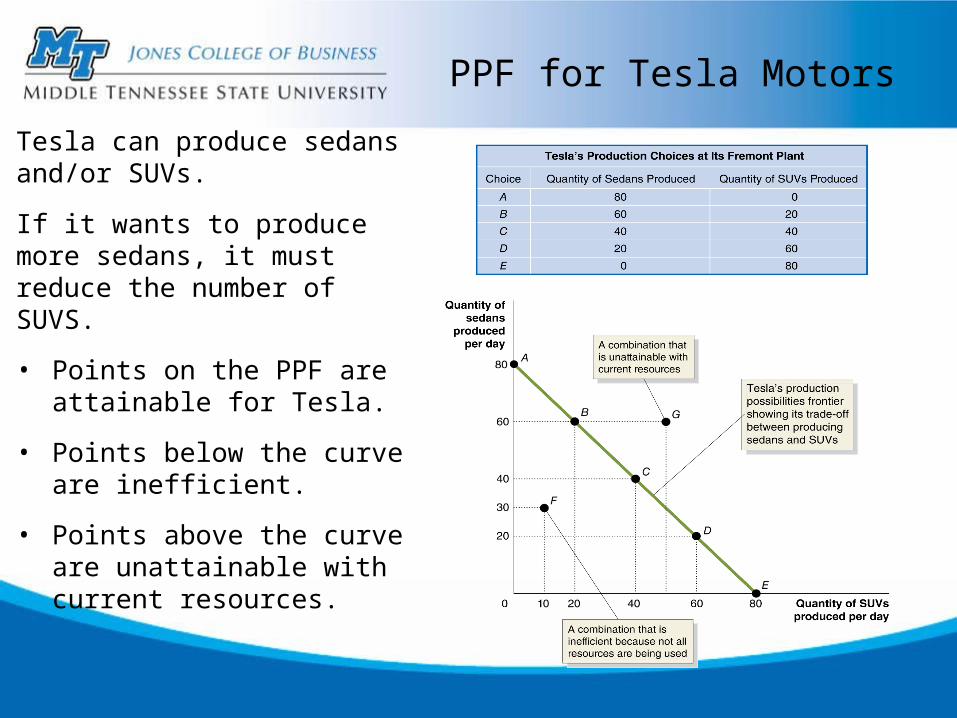
Tesla can produce sedans and/or SUVs.
If it wants to produce more sedans, it must reduce the number of SUVS.
• Points on the PPF are attainable for Tesla.
• Points below the curve are inefficient.
• Points above the curve are unattainable with current resources.
Tesla Can Trade Off Sedans for SUVs
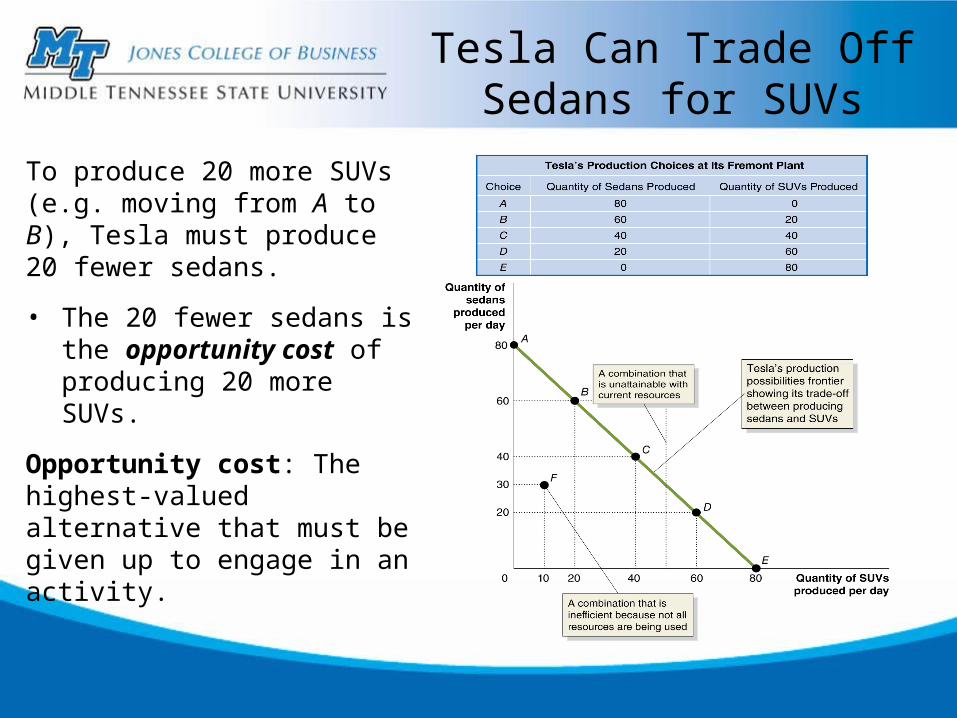
To produce 20 more SUVs (e.g. moving from A to B), Tesla must produce 20 fewer sedans.
• The 20 fewer sedans is the opportunity cost of producing 20 more SUVs.
Opportunity cost: The highest-valued alternative that must be given up to engage in an activity.
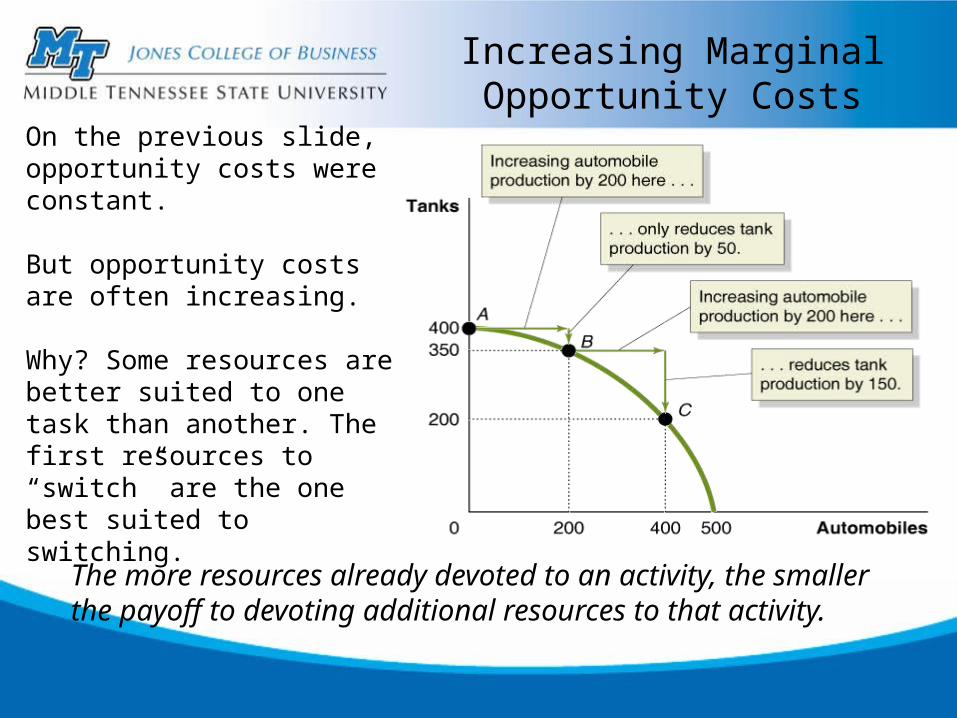
Increasing Marginal Opportunity Costs
On the previous slide, opportunity costs were constant.
But opportunity costs are often increasing.
Why? Some resources are better suited to one task than another. The first resources to “switch” are the one best suited to switching.
The more resources already devoted to an activity, the smaller the payoff to devoting additional resources to that activity.
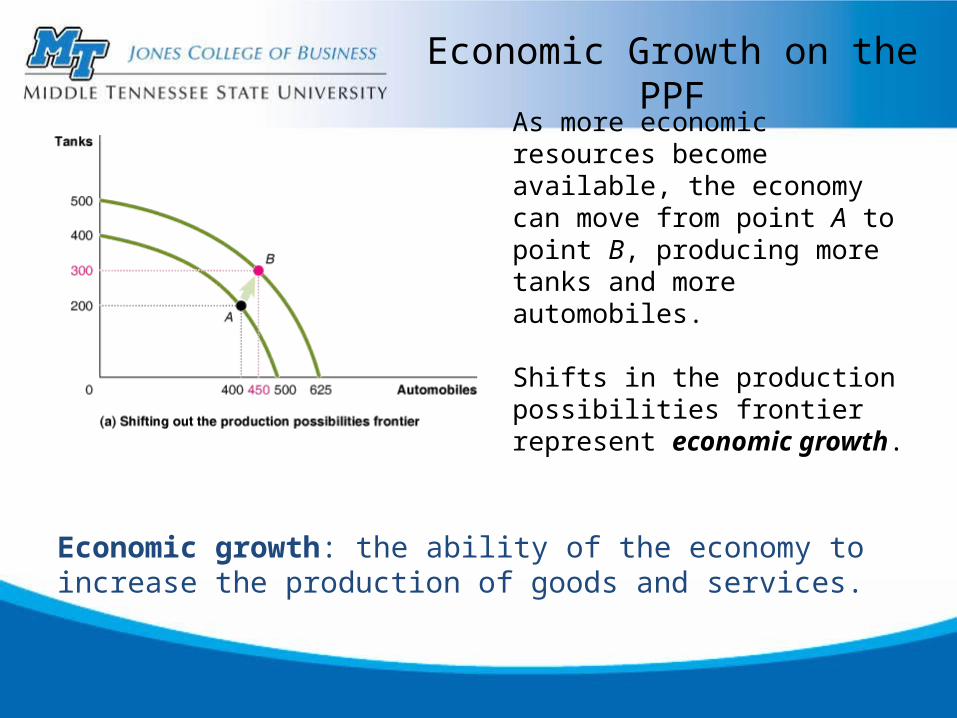
Economic Growth on the PPF
As more economic resources become available, the economy can move from point A to point B, producing more tanks and more automobiles.
Shifts in the production possibilities frontier represent economic growth.
Economic growth: the ability of the economy to increase the production of goods and services.
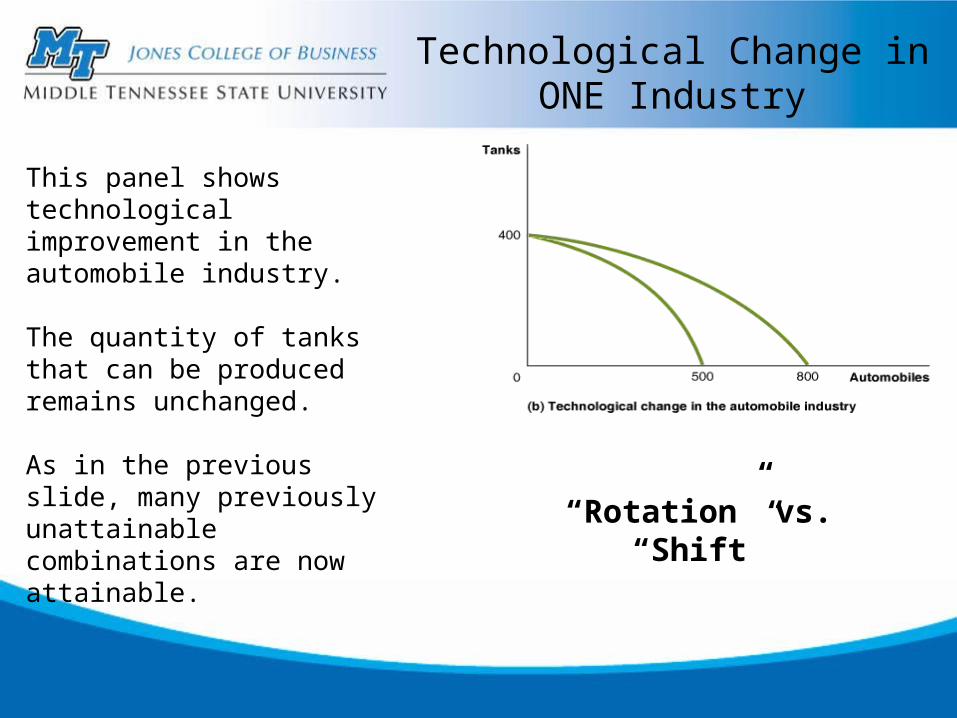
Technological Change in ONE Industry
This panel shows technological improvement in the automobile industry.
The quantity of tanks that can be produced remains unchanged.
As in the previous slide, many previously unattainable combinations are now attainable. “Rotation” vs. “Shift”
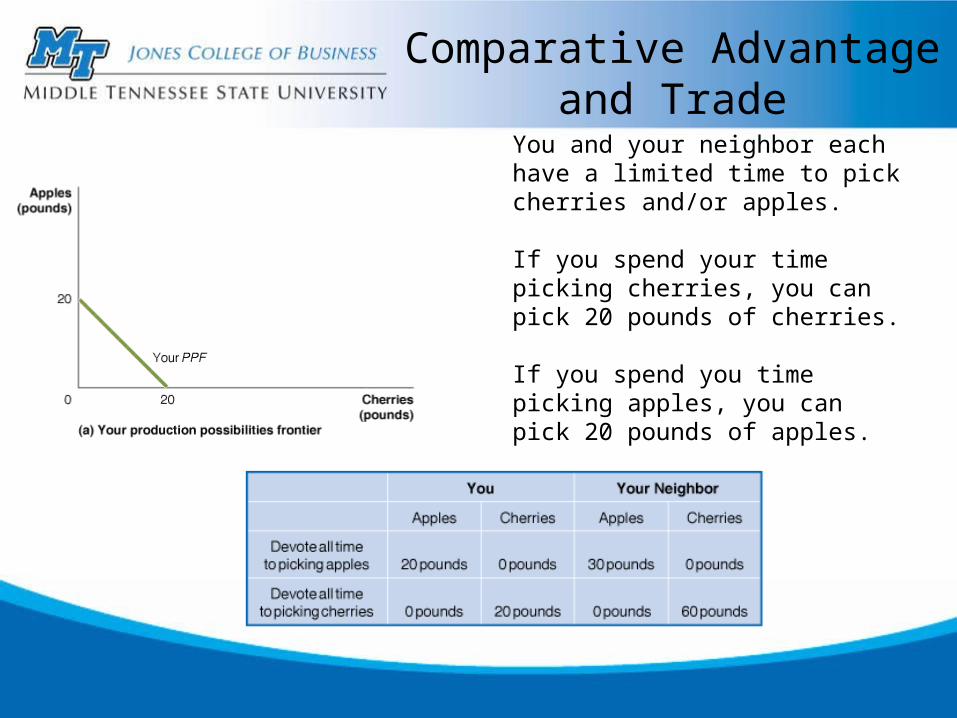
Comparative Advantage and Trade
You and your neighbor each have a limited time to pick cherries and/or apples.
If you spend your time picking cherries, you can pick 20 pounds of cherries.
If you spend you time picking apples, you can pick 20 pounds of apples.
Specialization and Trade
What if you and your neighbor decided to specialize and trade?
Trade: The act of buying and selling.
Could your neighbor benefit from trade? She is better at picking both apples and cherries…
Both of you can benefit from trade, by specializing in what you are relatively good at. Let’s see how…
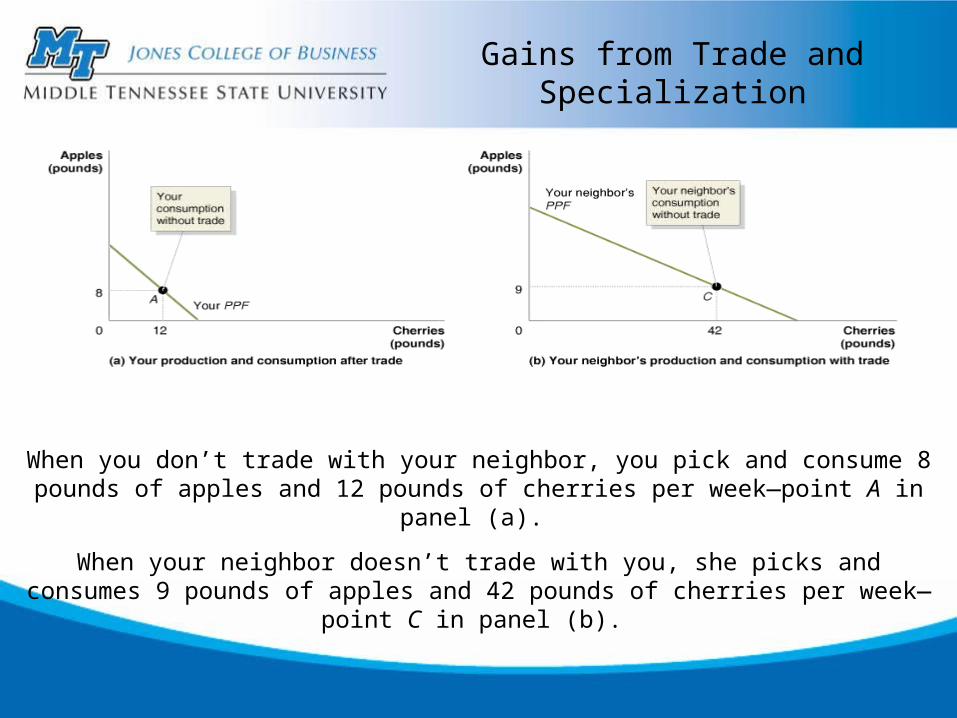
Gains from Trade and Specialization
When you don’t trade with your neighbor, you pick and consume 8 pounds of apples and 12 pounds of cherries per week—point A in panel (a).
When your neighbor doesn’t trade with you, she picks and consumes 9 pounds of apples and 42 pounds of cherries per week—point C in panel (b).
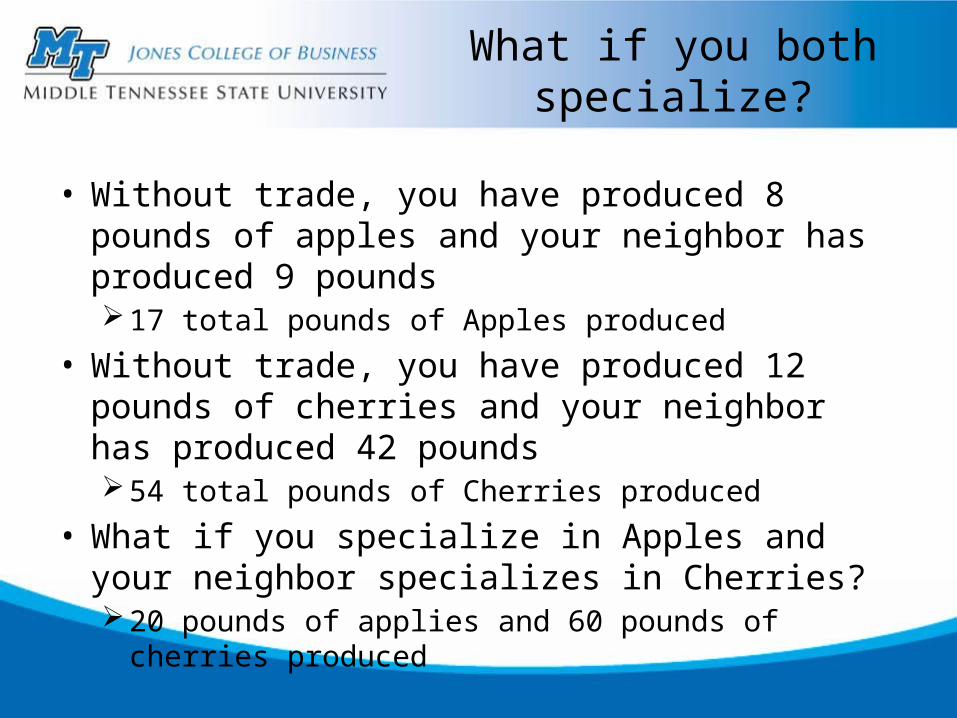
What if you both specialize?
• Without trade, you have produced 8 pounds of apples and your neighbor has produced 9 pounds17 total pounds of Apples produced
• Without trade, you have produced 12 pounds of cherries and your neighbor has produced 42 pounds54 total pounds of Cherries produced
• What if you specialize in Apples and your neighbor specializes in Cherries?20 pounds of applies and 60 pounds of cherries produced
Bottomline: Trade and Specialization
• By specializing – based on what you are relatively good at – we are able to produce MORE of BOTH goods
• You and your neighbor can TRADE with each other to allow BOTH of you to consume more of BOTH goods
• Example: what if you traded 10 pounds of apples for 15 pounds of cherries?
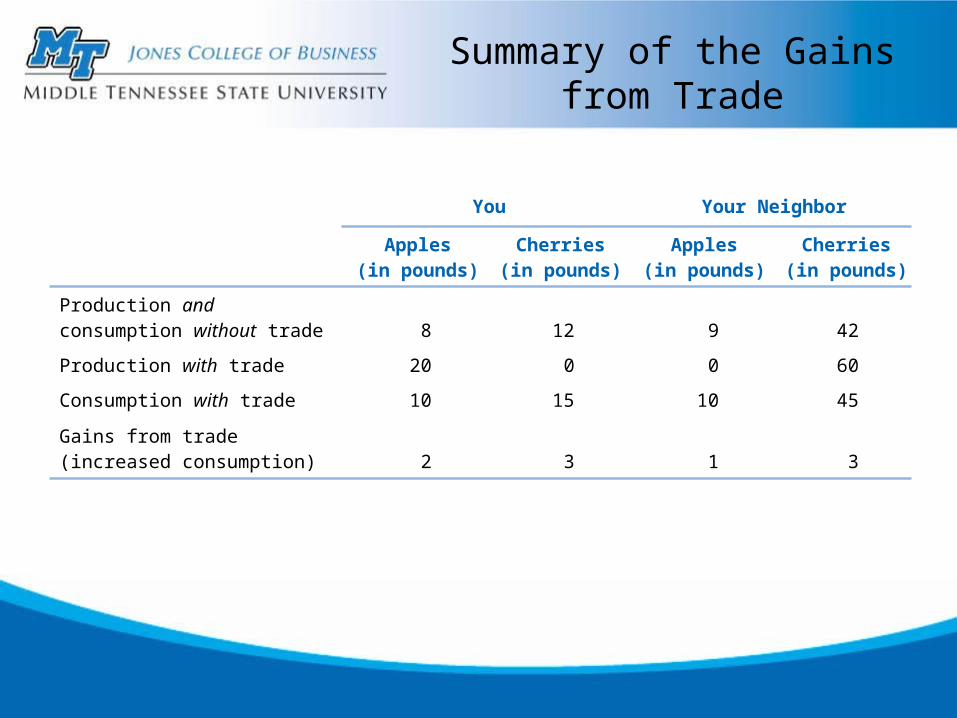
Summary of the Gains from Trade
You Your Neighbor
Apples(in pounds)
Cherries(in pounds)
Apples(in pounds)
Cherries(in pounds)
Production and consumption without trade 8 12 9 42
Production with trade 20 0 0 60
Consumption with trade 10 15 10 45
Gains from trade (increased consumption) 2 3 1 3
Comparative Advantage and the Gains from Trade
How could both of you benefit from trade, when your neighbor was so much better than you?
Economists say your neighbor had an absolute advantage in both cherry- and apple-picking, but you had a comparative advantage in picking apples.
Absolute advantage: The ability of an individual, a firm, or a country to produce more of a good or service than competitors, using the same amount of resources.
Comparative advantage: The ability of an individual, a firm, or a country to produce a good or service at a lower opportunity cost than competitors.
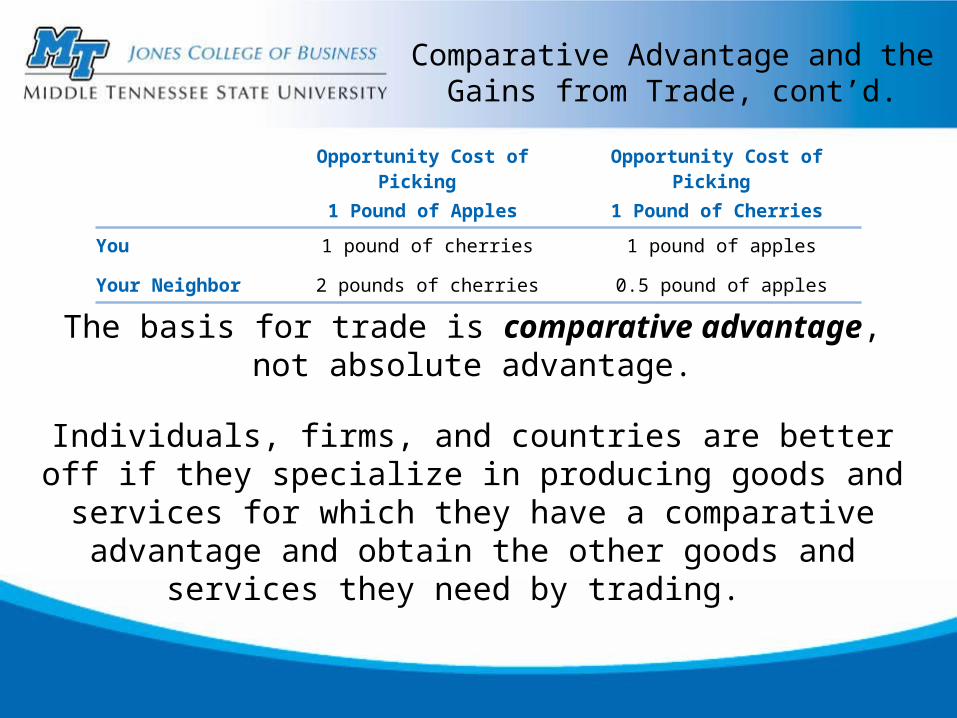
Comparative Advantage and the Gains from Trade, cont’d.
The basis for trade is comparative advantage, not absolute advantage.
Individuals, firms, and countries are better off if they specialize in producing goods and services for which they have a comparative advantage and obtain the other goods and services they need by
trading.
Opportunity Cost of Picking 1 Pound of Apples
Opportunity Cost of Picking 1 Pound of Cherries
You 1 pound of cherries 1 pound of apples
Your Neighbor 2 pounds of cherries 0.5 pound of apples
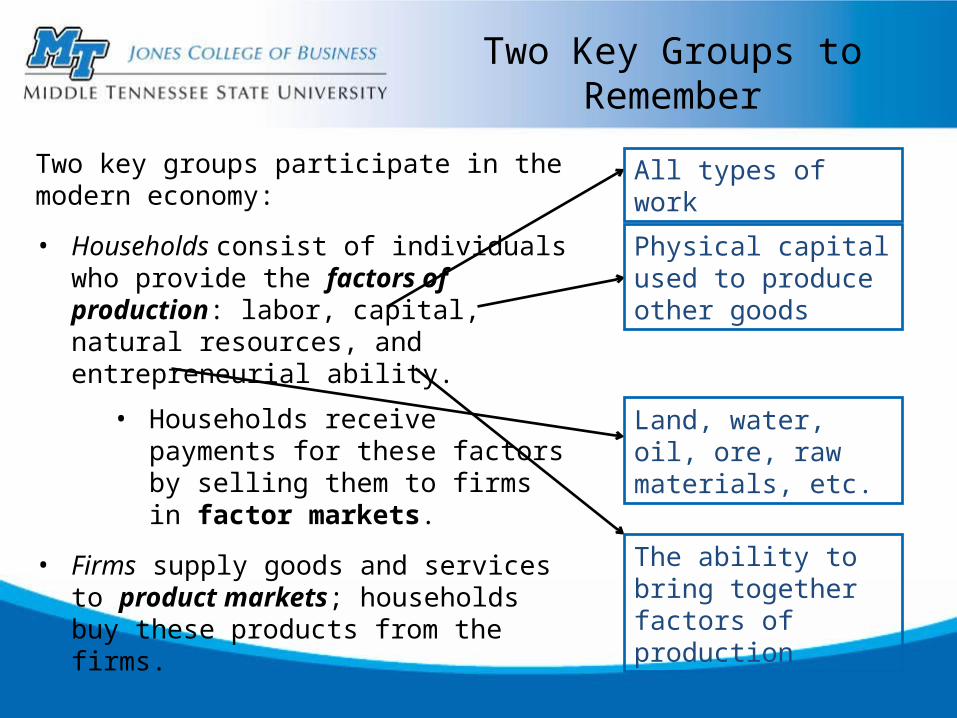
Two Key Groups to Remember
Two key groups participate in the modern economy:
• Households consist of individuals who provide the factors of production: labor, capital, natural resources, and entrepreneurial ability.
• Households receivepayments for these factorsby selling them to firms in factor markets.
• Firms supply goods and services to product markets; households buy these products from the firms.
All types of work
Physical capital used to produce other goods
Land, water, oil, ore, raw materials, etc.
The ability to bring together factors of production
The Circular Flow Diagram
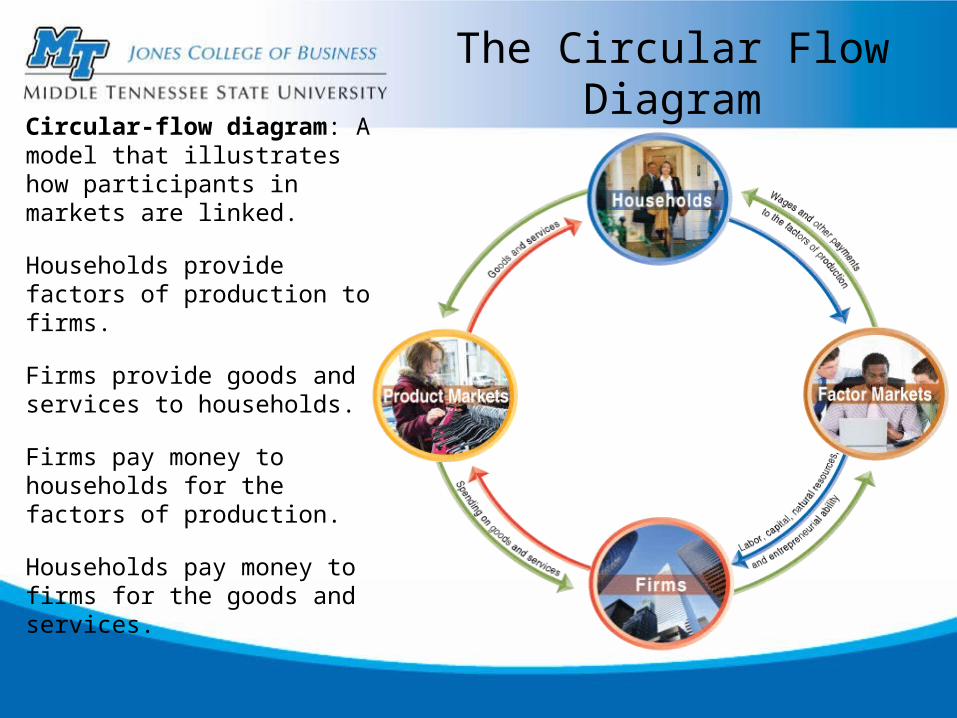
Circular-flow diagram: A model that illustrates how participants inmarkets are linked.
Households provide factors of production to firms.
Firms provide goods andservices to households.
Firms pay money tohouseholds for thefactors of production.
Households pay money tofirms for the goods and services.
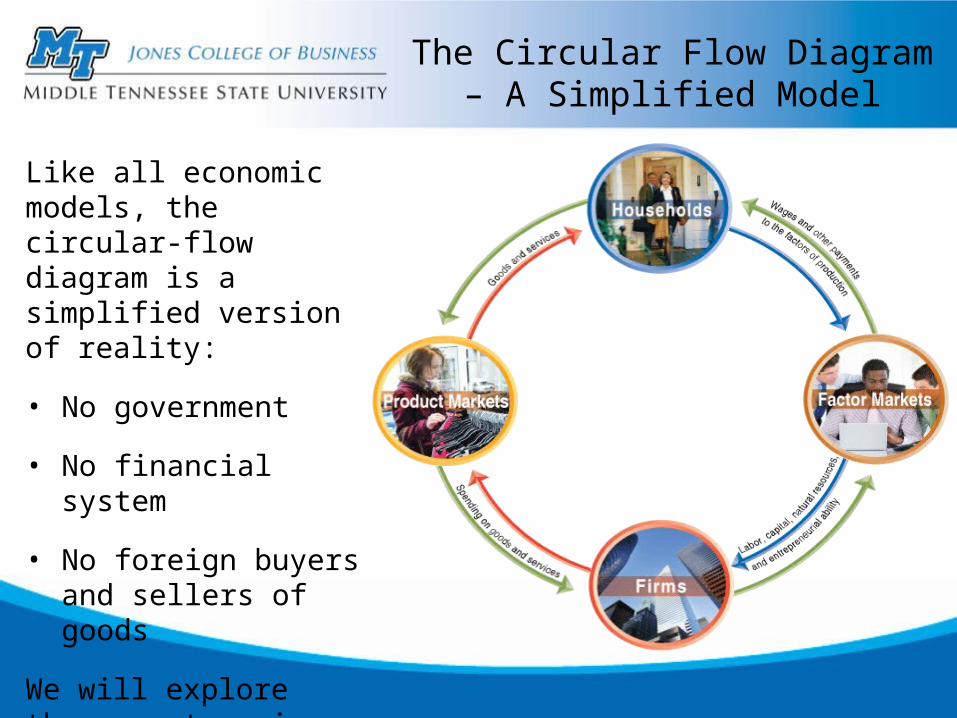
The Circular Flow Diagram – A Simplified Model
Like all economic models, the circular-flow diagram is a simplified version of reality:
• No government
• No financial system
• No foreign buyers and sellers of goods
We will explore these sectors in later chapters.