scalping / altcointrading the current state of the market the majority of traders will stop trading...
TRANSCRIPT
scalping / altcointrading.net
#17 Mar 2018
@altcointrading_
a look into the art of short term
trading for everyone who is thinking
about leaving until the next bull
runs

Page ! of !2 10 �
ScalpingScalping [noun] - trading technique of capitalizing on small price changes. Positions are typically closed as soon as they become profitable, earning a small profit. The year 2017 was the year to buy your crypto in January and hold. Then, maybe, if you felt like it, to spot a range and sell the right bounce to rebuy lower and carry on the Mr Bones’ wild ride. But all things come to an end. In 2018, the first most obvious thing cryptofolks noticed is that everyone’s long-term stacks keep losing their dollar value.
About scalpingWhat is scalping?
Scalping [noun] - trading technique of capitalizing on small price changes. Positions are typically closed as soon as they become profitable, earning a small profit.
Scalping requires a 5M or shorter timeframe chart with indicators that work well for you there (oscillators such as StochRSI tend to be good), stable exchange or API that will not freeze on you and definitely, definitely a reliable stop loss. In a trading strategy where you collect a lot of small profits from a big number of trades losers need to be cut quickly with a discipline as a single large loss could wipe out what you felt was a hard work, putting you psychologically in a bad place.
Why it mattersJudging from Google Trends, a lot of new people got into cryptocurrencies as they started hearing about the Bitcoin doubling…tripling…you what, 10k?…and so on. Another crop, smaller still, came at the start of the Bitcoin’s bull run in late 2016.
The point is there are not many people who went through the previous bull-bear cycle and are still active in the community; the number of crypto-born professionals who trade on a daily basis is also still quite low.
At the current state of the market the majority of traders will stop trading during sideways and negative price actions.
Not only get people frustrated as the price keeps going down and they “cannot do anything” [please buy sirs], consequently losing sleep and perhaps also money on emotional trading. As an overall result the markets also get thinner and the decreased volumes are inviting for trolls and MSM to showcase cryptocurrencies are dying for real this time which can easily spiral into more panic. Good thing is that it is also a trading opportunity for everyone who wants to take it.
It is no doubt good to know when not to trade in order to minimize losses but it should be really the last resort. In the crypto business of 2018 we have stop-loss orders, arbitrage and other direction-independent strategies, or market making and basically any kind of short term trading.
There is still money on the table, why not collect it then?

TensorCharts Candles:
The anatomy of the candle has a lot more information than the simple information of OHCL.
OHCL and colour of the candle only gives you the very superficial averaged-down information.
“

!4 �
To this day your best tool of choice for any short-term crypto trades are TensorCharts - https://tensorcharts.com, hands down. The information you get when watching TensorCharts is far more complete than the thinned-down, averaged-out information one can get from the standard candlesticks charts.
To this day your best tool of choice for any short-term crypto trades are TensorCharts, hands down. The information you get when watching TensorCharts is far more complete than the thinned-down, averaged-out information one can get from the standard candlesticks charts.
Here is a brief intro to the TensorCharts project, but if you are looking more into learning what TensorCharts are and what can they do for you, this Argentinian gentleman called Nico made a series of tutorials on the Learning Nodes YouTube channel. The videos were shot in March 2018 so you will get to learn about the latest version of TensorCharts updated with a bunch of new markets and functionalities.
In this article I will stick to the point of short-term trades and point out the minimum you need to know to work with TensorCharts, starting with a 5-minute video that shows you around the interface.
The tool we will be using is TensorCharts.com. Not a sponsored post, they are simply the best.
Video by @NicoIzco of the Learning Nodes channel on YouTube and learningnodes.com
�
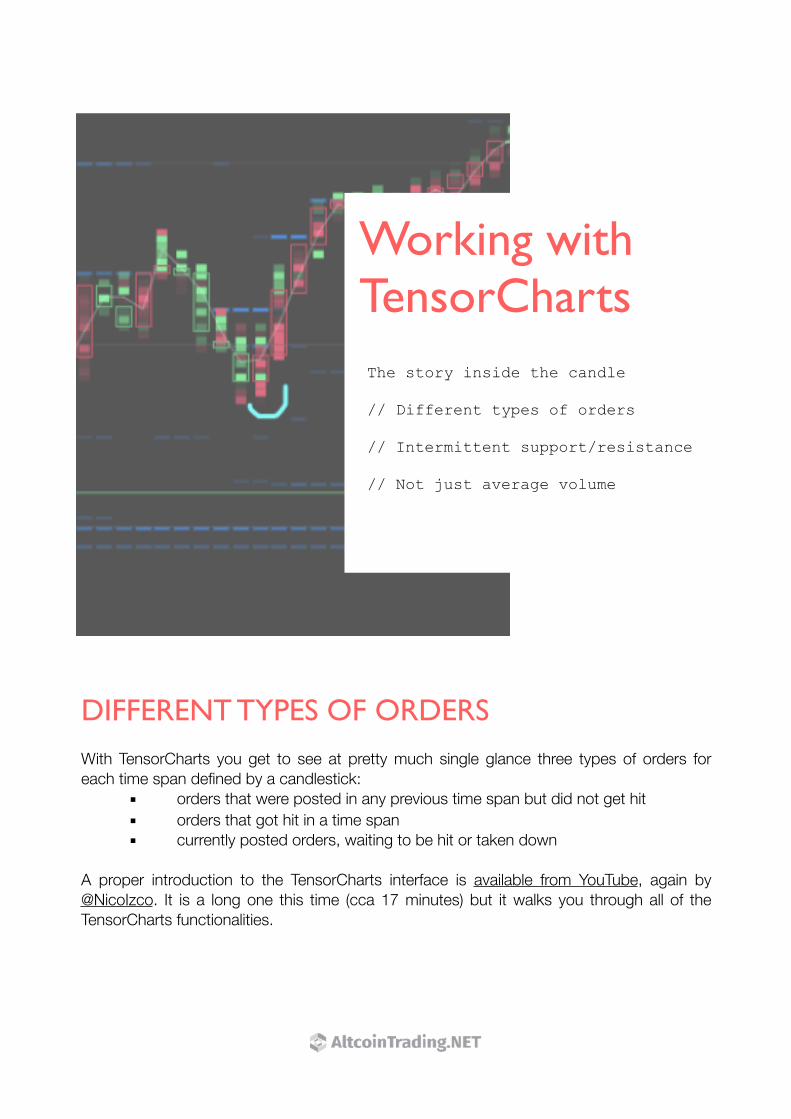
Working with TensorChartsThe story inside the candle
// Different types of orders
// Intermittent support/resistance
// Not just average volume
DIFFERENT TYPES OF ORDERSWith TensorCharts you get to see at pretty much single glance three types of orders for each time span defined by a candlestick: ▪ orders that were posted in any previous time span but did not get hit ▪ orders that got hit in a time span ▪ currently posted orders, waiting to be hit or taken down
A proper introduction to the TensorCharts interface is available from YouTube, again by @NicoIzco. It is a long one this time (cca 17 minutes) but it walks you through all of the TensorCharts functionalities.
!6 �
INTERMITTENT SUPPORT/RESISTANCE LEVELS
How do you leverage these three types of orders for your short-term trades?
You see the orders that were executed and are now creating a near-term history. This history is not only available as the candles but also as the volume profile, which is made of executed trades and gives a clearer view on the volume traded at which level. You also see the limit orders that were not hit and are still posted to the market, waiting for the market to come to them. You can also highlight the largest of these orders in the book, and in complement to that the S/R tool at the bottom will highlight the levels with the largest traded volume. For example, the S/R tool set to 5 will
highlight 5 levels at your current chart window and it starts highlighting from the largest volume. Loop through it to quickly see if the largest volume was at the dips or the rips in your current frame.
Combine this information and have the momentarily support and resistance levels. The idea is to help you decide where exactly to place your limit orders on the 5M timeframe: find a support level, buy around that level. Find the next closest resistance level, sell there.
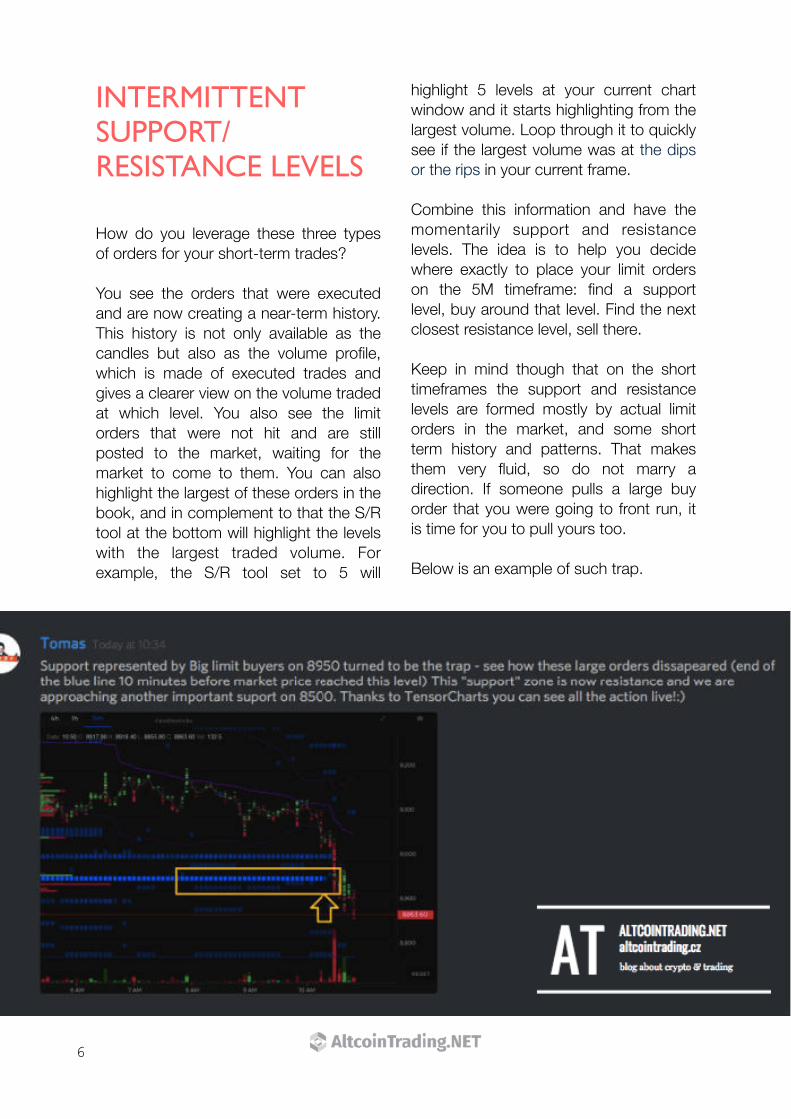
Keep in mind though that on the short timeframes the support and resistance levels are formed mostly by actual limit orders in the market, and some short term history and patterns. That makes them very fluid, so do not marry a direction. If someone pulls a large buy order that you were going to front run, it is time for you to pull yours too.
Below is an example of such trap.
�
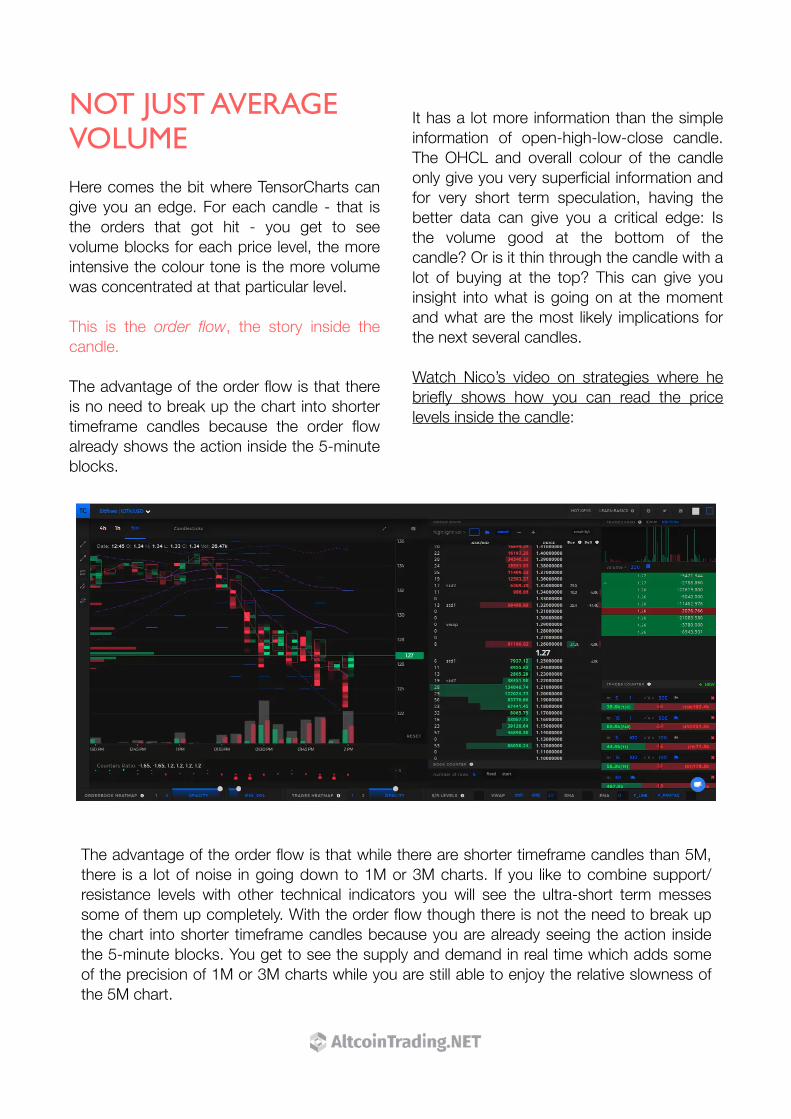
NOT JUST AVERAGE VOLUMEHere comes the bit where TensorCharts can give you an edge. For each candle - that is the orders that got hit - you get to see volume blocks for each price level, the more intensive the colour tone is the more volume was concentrated at that particular level.
This is the order flow, the story inside the candle.
The advantage of the order flow is that there is no need to break up the chart into shorter timeframe candles because the order flow already shows the action inside the 5-minute blocks.
It has a lot more information than the simple information of open-high-low-close candle. The OHCL and overall colour of the candle only give you very superficial information and for very short term speculation, having the better data can give you a critical edge: Is the volume good at the bottom of the candle? Or is it thin through the candle with a lot of buying at the top? This can give you insight into what is going on at the moment and what are the most likely implications for the next several candles.
Watch Nico’s video on strategies where he briefly shows how you can read the price levels inside the candle:
The advantage of the order flow is that while there are shorter timeframe candles than 5M, there is a lot of noise in going down to 1M or 3M charts. If you like to combine support/resistance levels with other technical indicators you will see the ultra-short term messes some of them up completely. With the order flow though there is not the need to break up the chart into shorter timeframe candles because you are already seeing the action inside the 5-minute blocks. You get to see the supply and demand in real time which adds some of the precision of 1M or 3M charts while you are still able to enjoy the relative slowness of the 5M chart.

!8 �
Keeping In Touch With The Bigger Picture
Having explored the 5M chart into details, here is some wisdom from Wikipedia:
Unlike momentum traders, scalpers like stable or silent products. Imagine if its price
does not move all day, scalpers can profit all day simply by placing their orders on the
same bid and ask, making hundreds or thousands of
trades. They do not need to worry about sudden price
changes.
Even when you set your mind to scalping do not lose touch with the bigger picture, the overall state of the market as seen on 4H, 1D or even higher timeframes. The market conditions change but substantial changes never come out of the blue, and you should be ready to see when it might be better to move to longer-term trading.
As a more complex idea, if you are trading on margin on an exchange that lets you use any one of a multitude of tokens as
collateral, you might want to make use of the idea of strategically moving some of your collateral into a token that is gaining value.
Very generally speaking though, simply just stay aware of the state of the market - what is the bias, what kind of players are active, what is happening. Look at the volume, follow momentum indicators, be aware of the volatility index.
With TensorCharts you can also make use of the book counter and the trades counter. Book counter is measuring the orders pressure, trades counter gives the ratio of buy/sell orders at a given interval. The interface lets you set up a bunch of different trades counters at once, each one on a different timeframe. If you then turn on the visualization below the chart you get to see the trades for each particular timeframe. Short timeframes can be filtered by volume - they are too short to implicate long term conclusions but if you follow this for some time you will be able to spot how the market composition changes, what are the big players doing and what the small ones. The counter functionality is explained here.

�
Discipline Needed Even In The
TechnicalitiesOne thing you should not disregard with scalping is a stop loss. You can have a trailing stop loss that will trigger once the price moves by a certain amount against you, or a normal stop loss that you keep adjusting to risk less as your position moves into profit. Although it is more of technique suitable for longer-term positions, in the Bitfinex/Ethfinex interface you can drag and move your orders directly on the chart which makes it easy to adjust the stop within seconds. Make sure the interface is not lagging on you though. If you are located in bizarre countries with strong botnet activity a VPN sometimes helps.
In a trending market this kind of trailing or adjusted stop loss would be a good strategy to let a winning position ride until the stop gets hit. In short timeframe on an undecided market though the stop will most likely be hit soon anyway, and if you are scalping you might prefer not to pay for the market order with the stop loss. There are limit stop losses too but if the market starts acting up they might not get hit and are therefore more risky in a trading setup where you rely on collecting a lot of small profits.
Do not add this risk and set both a stop loss and a take profit. A run-of-the-mill setup is 1:1 risk to reward - set your take-profit limit order as far from the entry as your stop loss (but adjusted for fees).
Coming to another technicality - just as important one: the fees. Traditionally, on exchanges such as Bitfinex or Kraken your fees will decrease with your increased
traded volume over the past 30 days - here the fee schedule on Bitfinex and here on Kraken.
Some exchanges use a different fee setup:
On the ERC20 exchange Ethfinex the fees are staying
the same throughout but for market making (in a very crude way, for using limit orders) a
fully verified trader gets back ERC20 Nectar tokens as a form
of a limit order reward.
On BitMEX the fee also stays the same throughout but makers get a rebate. In the perpetual
swap the situation gets further complicated by the swap funding
payouts - fee schedule here.
If you are trading on an exchange that takes less fees with your growing traded volume, in some situations it is better to start out by closing at breakevens or even for small losses solely to build up that volume which will then let you scalp more freely. The lower your fee, the smaller price movements you can exploit for as long as that remains the best business you can get from the market. The conditions are not good for short term positions all the time; if you can, take the volume build-up as an entrance fee to an event.

Page ! of !10 10 �
SUMMARYScalping can be a very profitable
technique, especially in times when the market is not really doing much.
However, it can also be used to trade inside of predictable short-term structures
such as bull or bear flags.
Important things to focus on are risk management and discipline though.
While the setup might look straightforward - open a position at a support or resistance
level, have a stop loss and a take profit in the 1:1 ratio, work to minimize fees -
problems might occur especially for traders who are not used to taking losses.
Losses are something that could have been pretty much avoided in crypto when
trading big swings in 2017 but as for now it is inevitable with large amounts of quick
trades in choppy markets. Learning to handle this is I believe a work to prepare
you for the future though, as with time some skills, discipline and insight will
matter more and more in the cryptocurrency markets.
This article features TensorCharts tutorials made by Nico of LearningNodes. Go show him some love on Facebook or Twitter and subscribe to his channel on YouTube for more crypto trading tutorials. And once again - you can find the TensorCharts web app right here. Not a sponsored post, TensorCharts genuinely rock.
© AltcoinTrading.NET, all rights reserved. Nothing of this article is intended as an investment advice.
[twitter] @altcointrading_ [reddit] r/altcointrader
CreditsTensorCharts // tensorcharts.com
Videos // @NicoIzco
Originally published // https://www.altcointrading.net/strategy/scalping