scaling up data management: from data to big datajuliana/courses/bigdata2016/... big data technology...
TRANSCRIPT
Scaling up Data Management:
From Data to Big Data
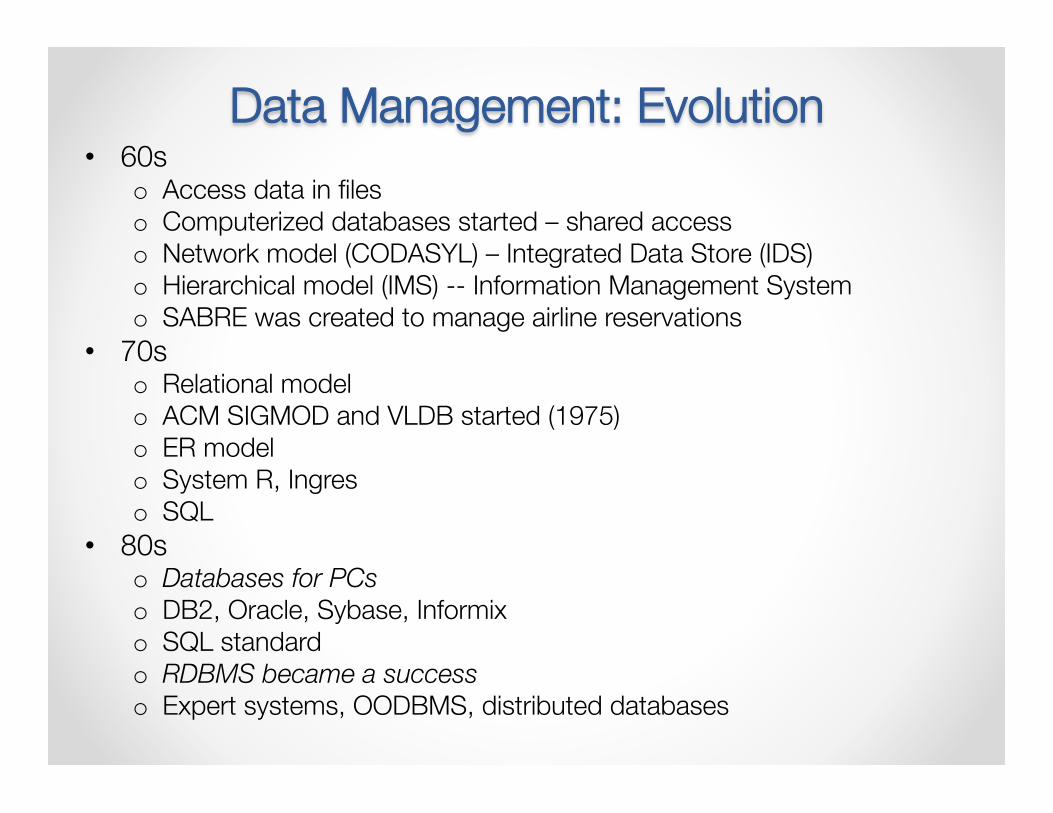
Data Management: Evolution • 60s
o Access data in files o Computerized databases started – shared access o Network model (CODASYL) – Integrated Data Store (IDS) o Hierarchical model (IMS) -- Information Management System o SABRE was created to manage airline reservations
• 70s o Relational model o ACM SIGMOD and VLDB started (1975) o ER model o System R, Ingres o SQL
• 80s o Databases for PCs o DB2, Oracle, Sybase, Informix o SQL standard o RDBMS became a success o Expert systems, OODBMS, distributed databases
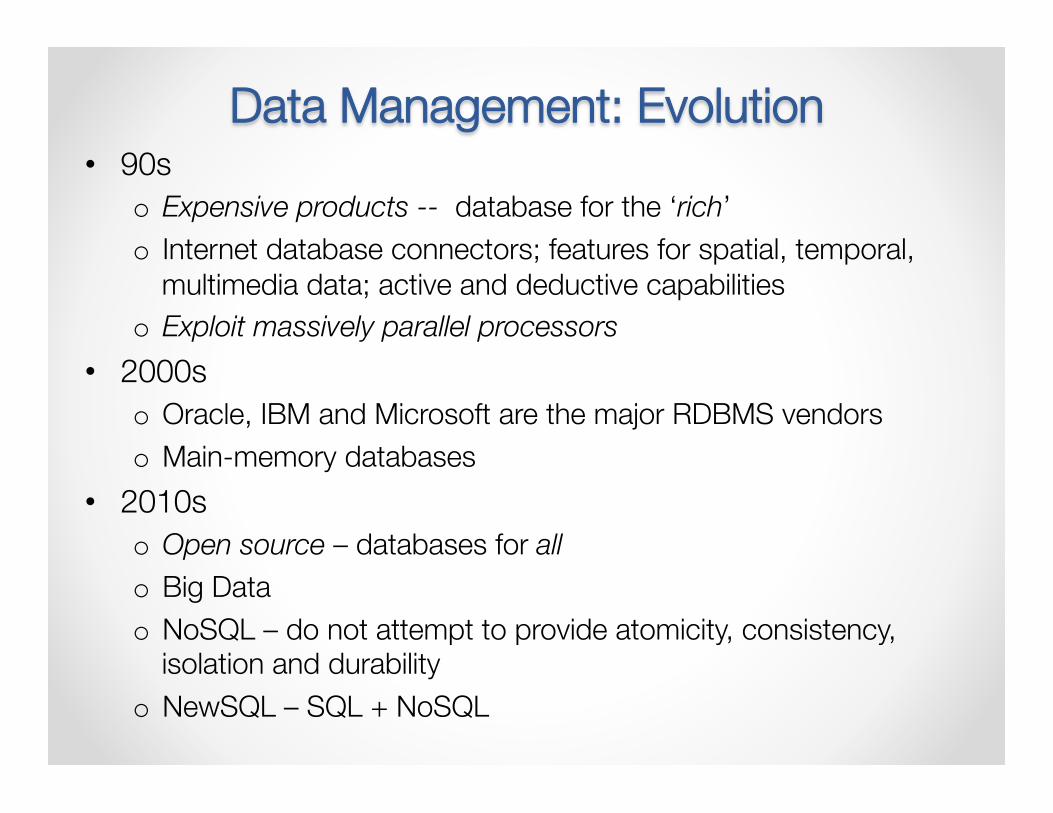
Data Management: Evolution • 90s
o Expensive products -- database for the ‘rich’ o Internet database connectors; features for spatial, temporal,
multimedia data; active and deductive capabilities o Exploit massively parallel processors
• 2000s o Oracle, IBM and Microsoft are the major RDBMS vendors o Main-memory databases
• 2010s o Open source – databases for all o Big Data o NoSQL – do not attempt to provide atomicity, consistency,
isolation and durability o NewSQL – SQL + NoSQL
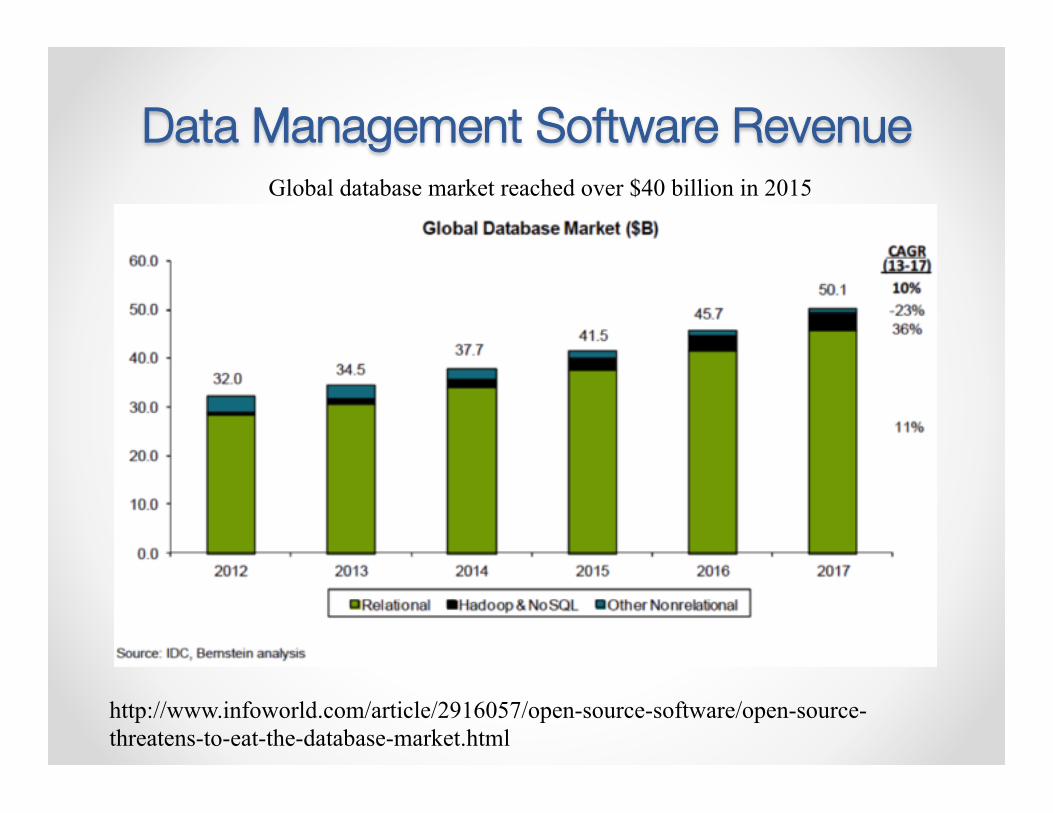
Data Management Software Revenue Global database market reached over $40 billion in 2015 Business analytics software market 2013: $37 billion
http://www.infoworld.com/article/2916057/open-source-software/open-source-threatens-to-eat-the-database-market.html
Big Data Technology
A new forecast from International Data Corporation (IDC ) sees the big data technology and services market growing at a compound annual growth rate (CAGR) of 23.1% over the 2014-2019 forecast period with annual spending reaching $48.6 billion in 2019
http://www.idc.com/getdoc.jsp?containerId=prUS40560115
Big Data
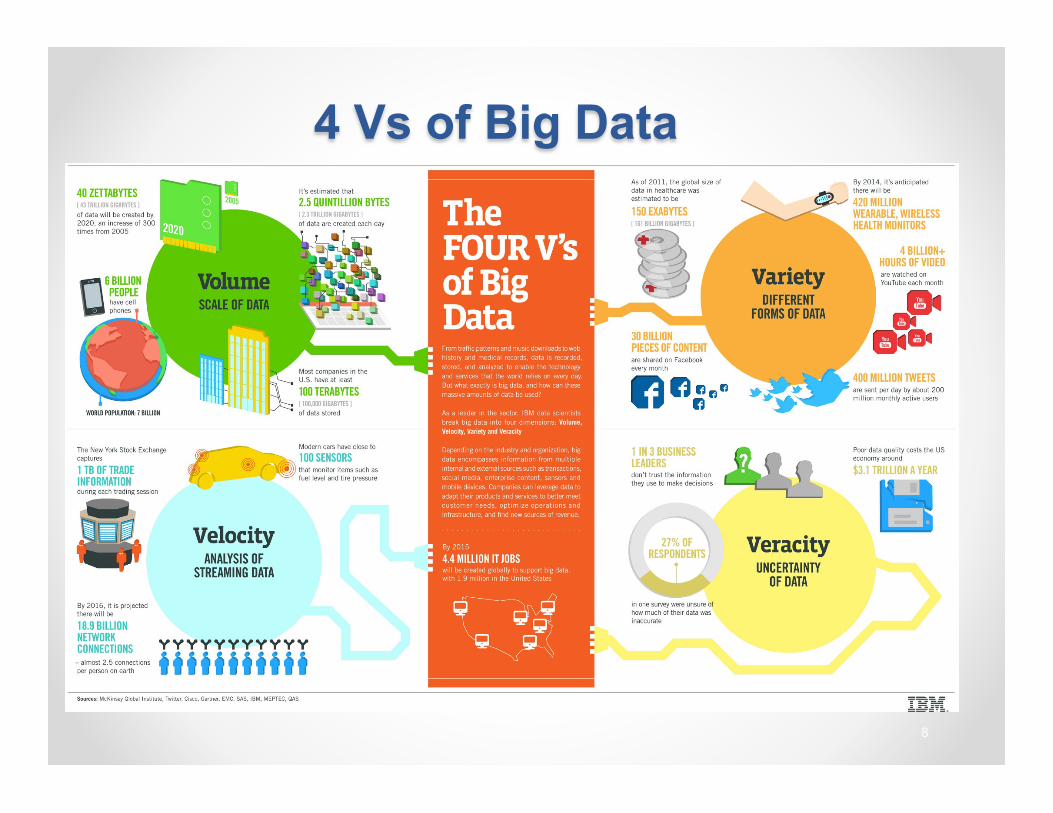
4 Vs of Big Data
8
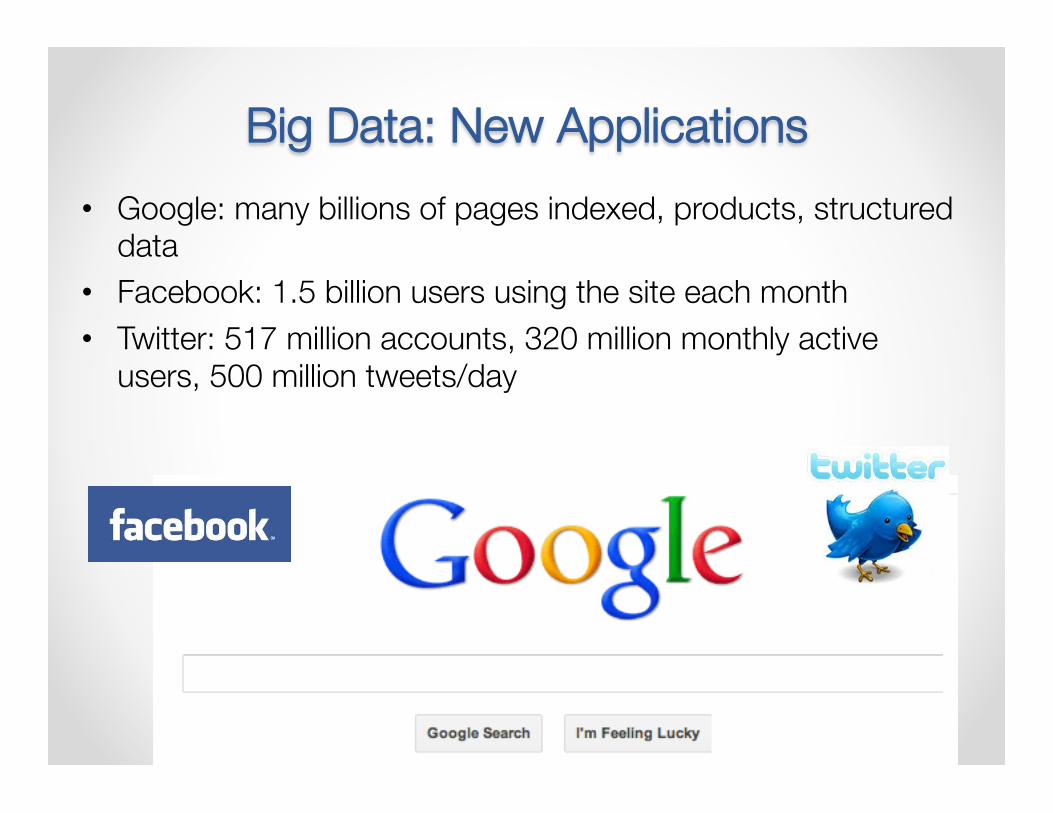
Big Data: New Applications • Google: many billions of pages indexed, products, structured
data • Facebook: 1.5 billion users using the site each month • Twitter: 517 million accounts, 320 million monthly active
users, 500 million tweets/day
Big Data: New Computing Infrastructure • Meet the cloud! • “[Hardware, Infrastructure, Platform] as a service” • Utility Computing: pay-as-you-go computing
o Illusion of infinite resources o No up-front cost o Fine-grained billing (e.g., hourly)
Cloud Computing: Why Now?
• Experience with very large data centers o Unprecedented economies of scale o Transfer of risk
• Technology factors o Pervasive broadband Internet o Maturity in virtualization technology
• Business factors o Minimal capital expenditure o Pay-as-you-go billing model
Agrawal et al., VLDB 2010 Tutorial
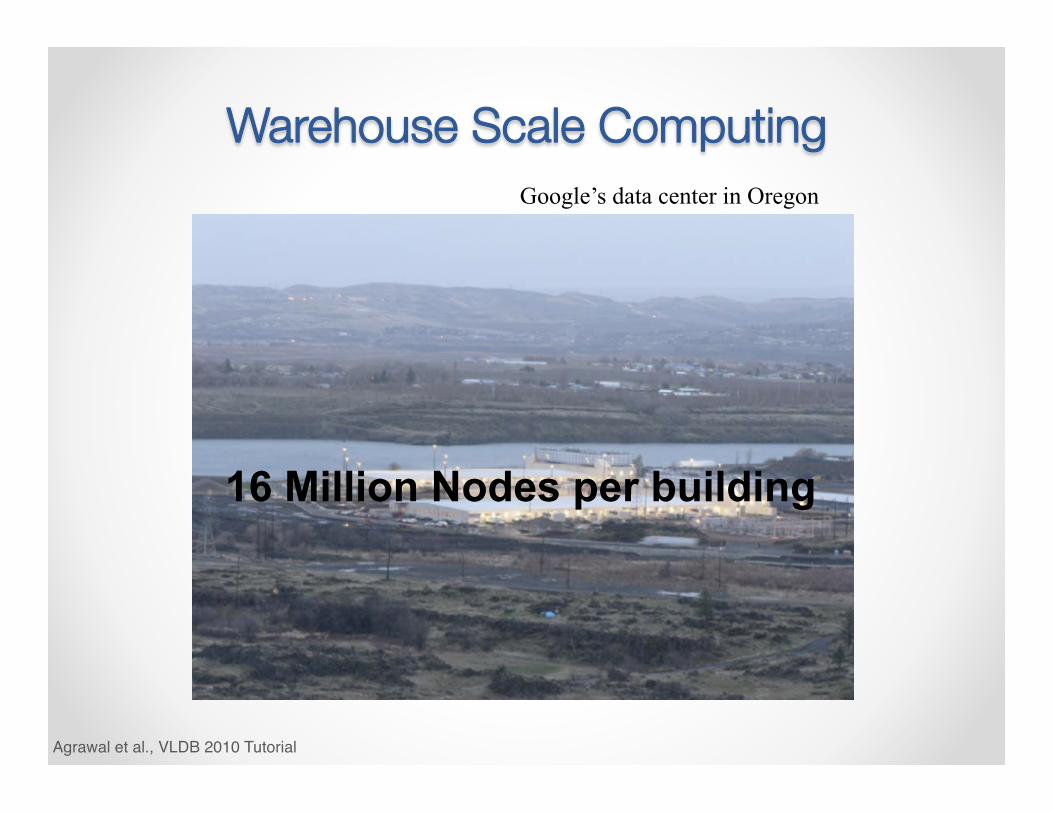
Warehouse Scale Computing
16 Million Nodes per building
Google’s data center in Oregon
Agrawal et al., VLDB 2010 Tutorial
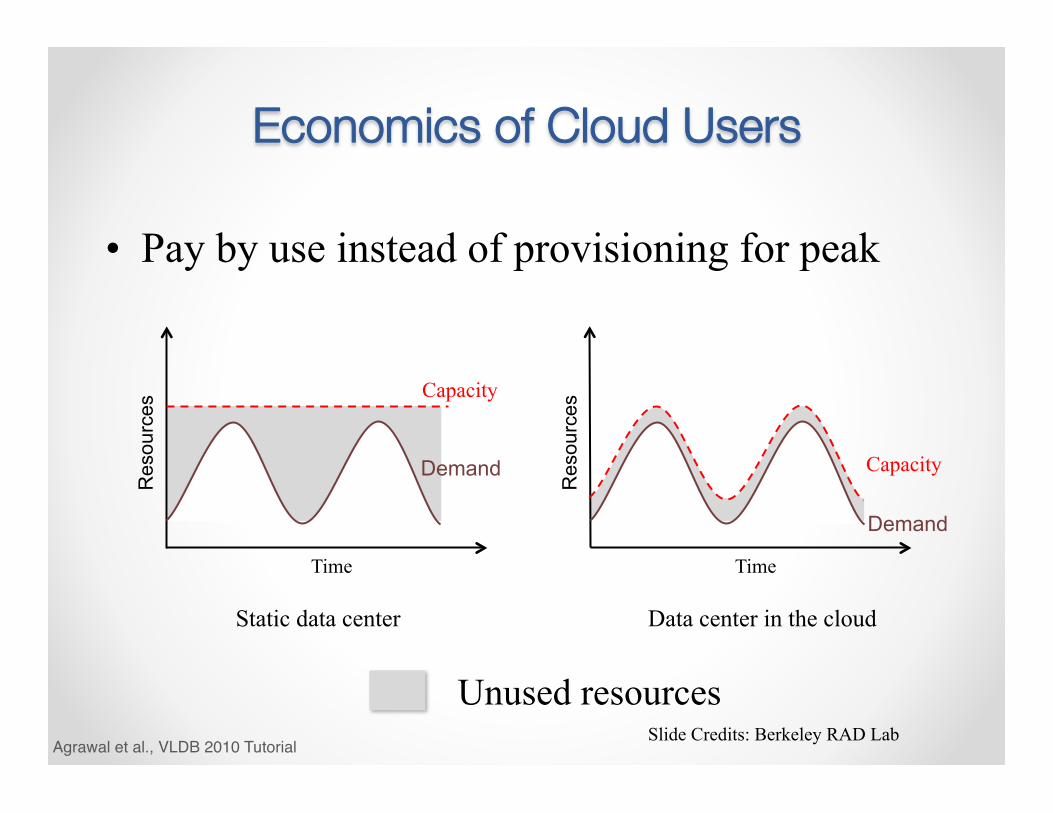
Unused resources
Economics of Cloud Users
• Pay by use instead of provisioning for peak
Static data center Data center in the cloud
Demand
Capacity
Time
Res
ourc
es
Demand
Capacity
Time R
esou
rces
Slide Credits: Berkeley RAD Lab Agrawal et al., VLDB 2010 Tutorial
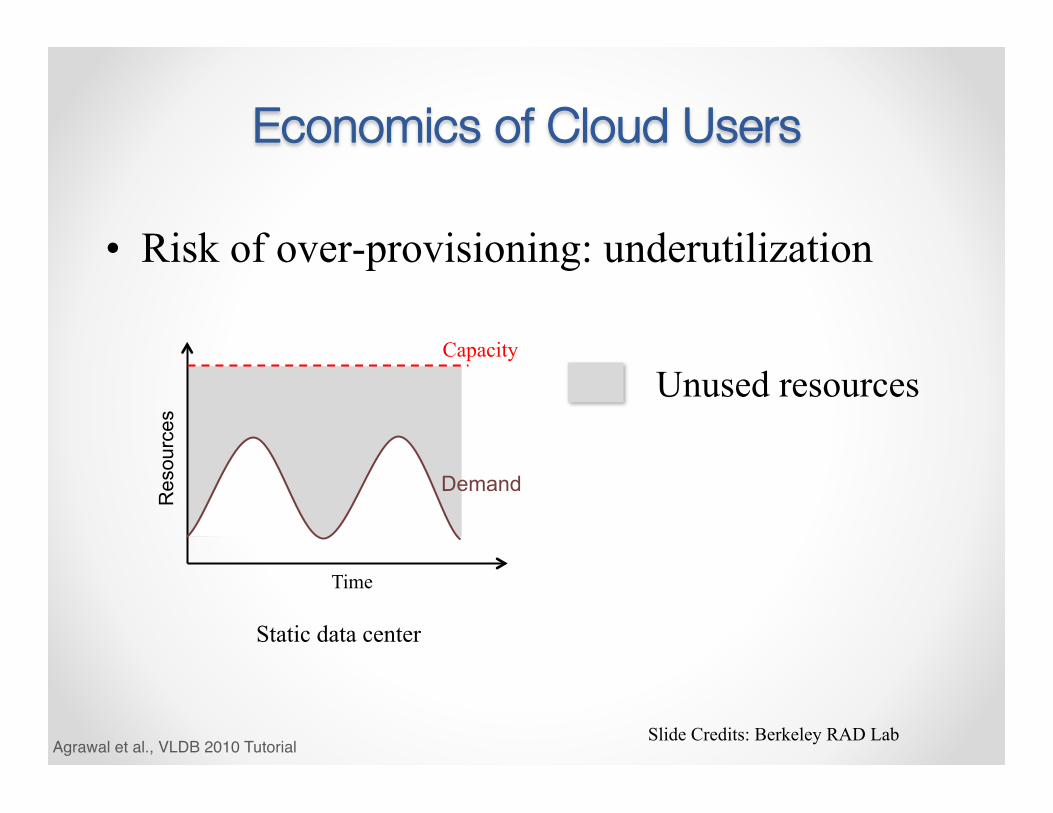
Unused resources
Economics of Cloud Users
• Risk of over-provisioning: underutilization
Static data center
Demand
Capacity
Time
Res
ourc
es
Slide Credits: Berkeley RAD Lab Agrawal et al., VLDB 2010 Tutorial
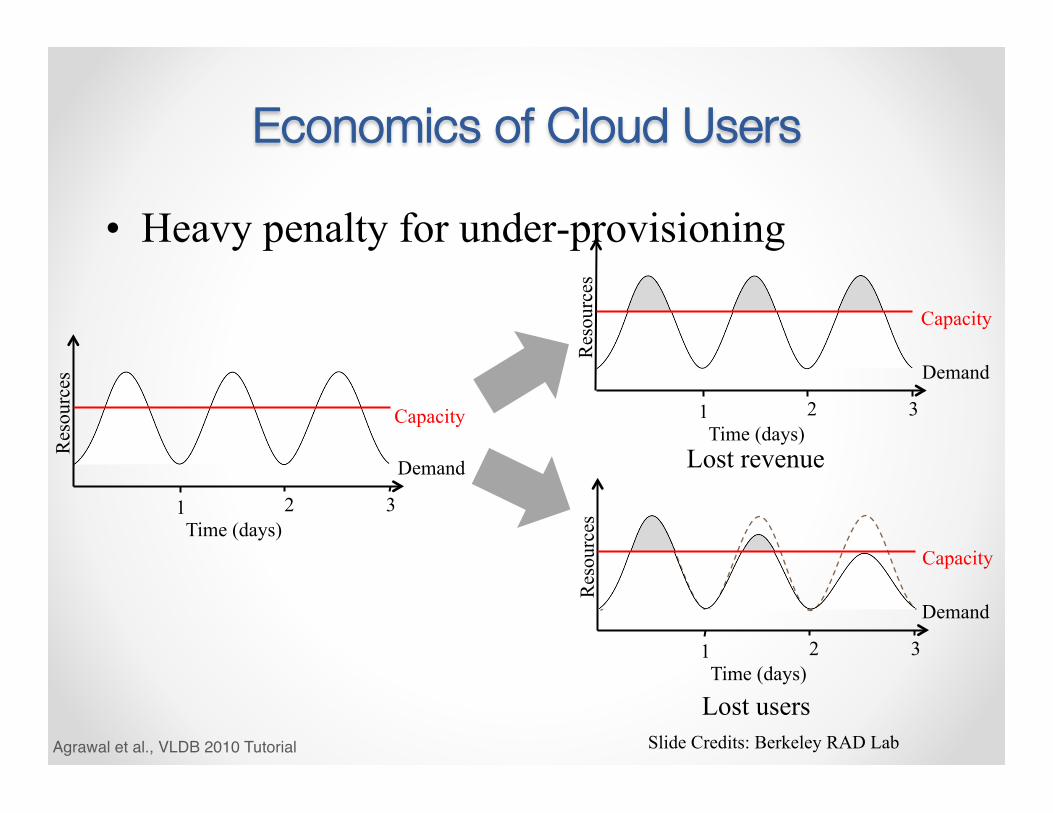
Economics of Cloud Users
• Heavy penalty for under-provisioning
Lost revenue
Lost users
Res
ourc
es
Demand
Capacity
Time (days) 1 2 3
Res
ourc
es
Demand
Capacity
Time (days) 1 2 3
Res
ourc
es
Demand
Capacity
Time (days) 1 2 3
Slide Credits: Berkeley RAD Lab Agrawal et al., VLDB 2010 Tutorial
Cloud Computing: Hype or Reality • Unlike the earlier attempts:
o Distributed Computing o Distributed Databases o Grid Computing
• Cloud Computing is REAL: o Organic growth: Google, Yahoo, Microsoft, and Amazon o Poised to be an integral aspect of National Infrastructure in
US and elsewhere
Agrawal et al., VLDB 2010 Tutorial
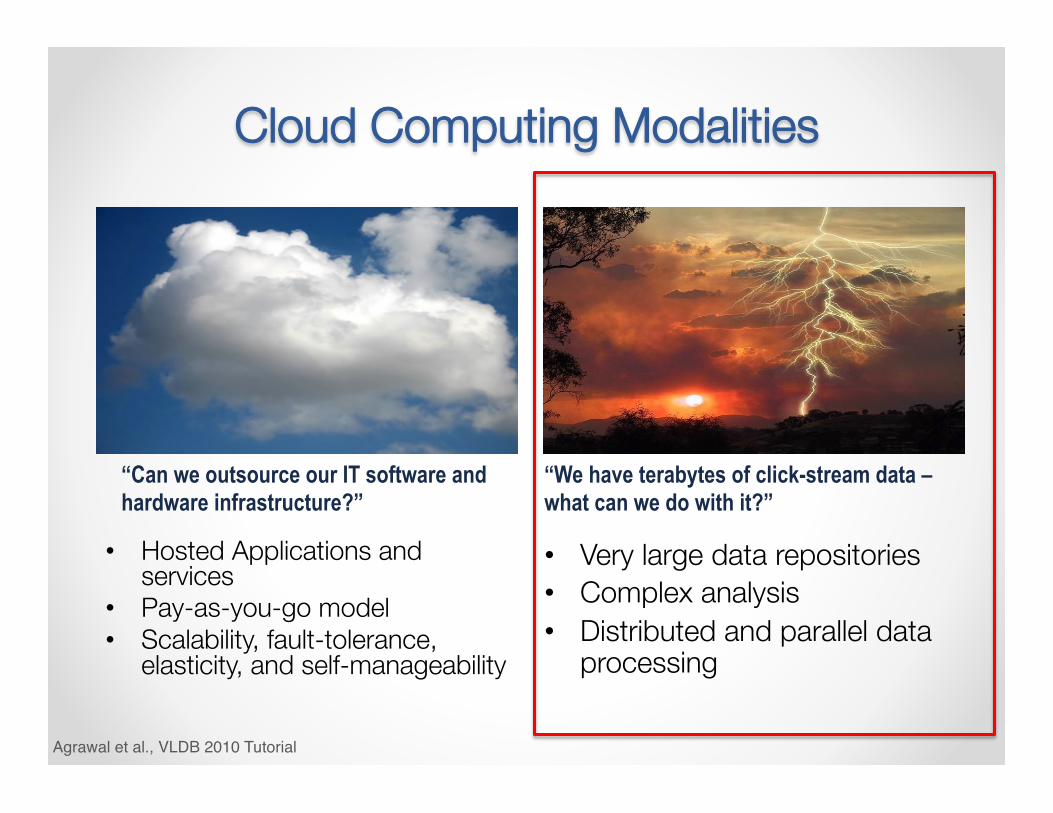
Cloud Computing Modalities
• Hosted Applications and services
• Pay-as-you-go model • Scalability, fault-tolerance,
elasticity, and self-manageability
• Very large data repositories • Complex analysis • Distributed and parallel data
processing
“Can we outsource our IT software and hardware infrastructure?”
“We have terabytes of click-stream data – what can we do with it?”
Agrawal et al., VLDB 2010 Tutorial
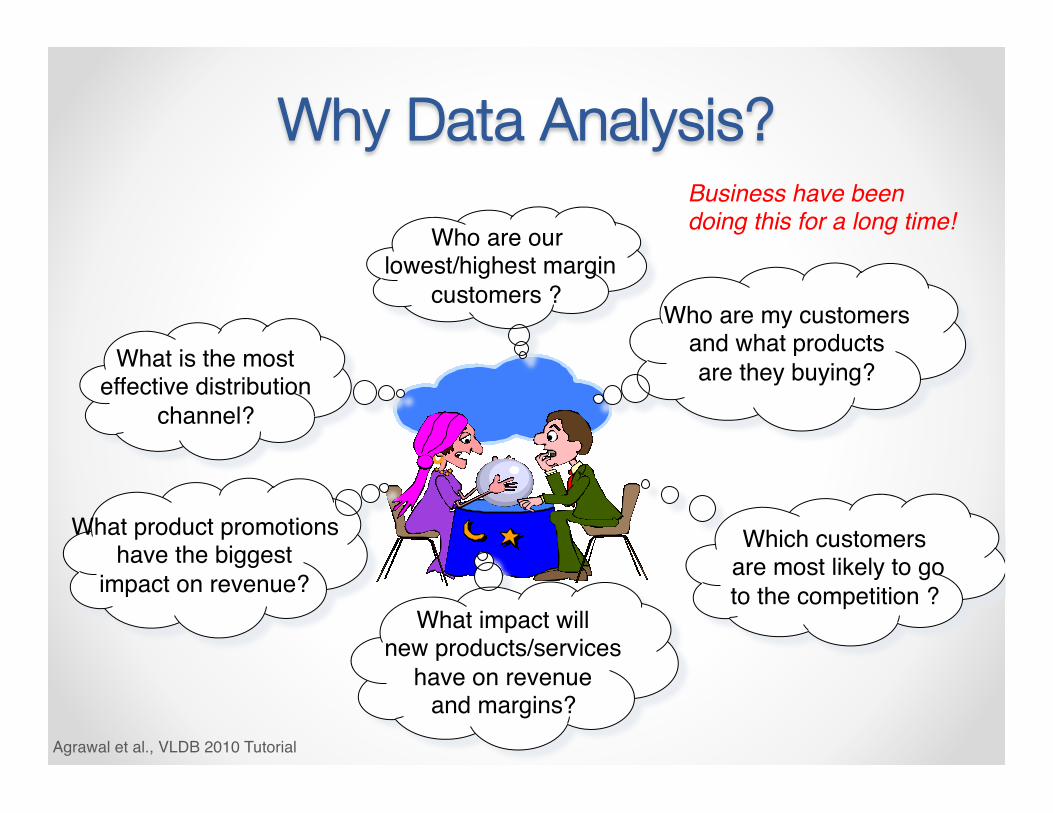
Who are our lowest/highest margin
customers ? Who are my customers
and what products are they buying?
Which customers are most likely to go to the competition ?
What impact will new products/services
have on revenue and margins?
What product promotions have the biggest
impact on revenue?
What is the most effective distribution
channel?
Why Data Analysis?
Agrawal et al., VLDB 2010 Tutorial
Business have been doing this for a long time!
Decision Support • Data analysis in the enterprise context emerged:
o As a tool to build decision support systems o Data-centric decision making instead of using intuition o New term: Business Intelligence
• Used to manage and control business • Data is historical or point-in-time • Optimized for inquiry rather than update • Use of the system is loosely defined and can be ad-hoc • Used by managers and end-users to understand the
business and make judgments
Agrawal et al., VLDB 2010 Tutorial
Decision Support • Traditional approach:
o Decision makers wait for reports from disparate OLTP systems
o Put it all together in a spreadsheet o Manual process
• There are many commercial systems that support analytics and decision support
Agrawal et al., VLDB 2010 Tutorial
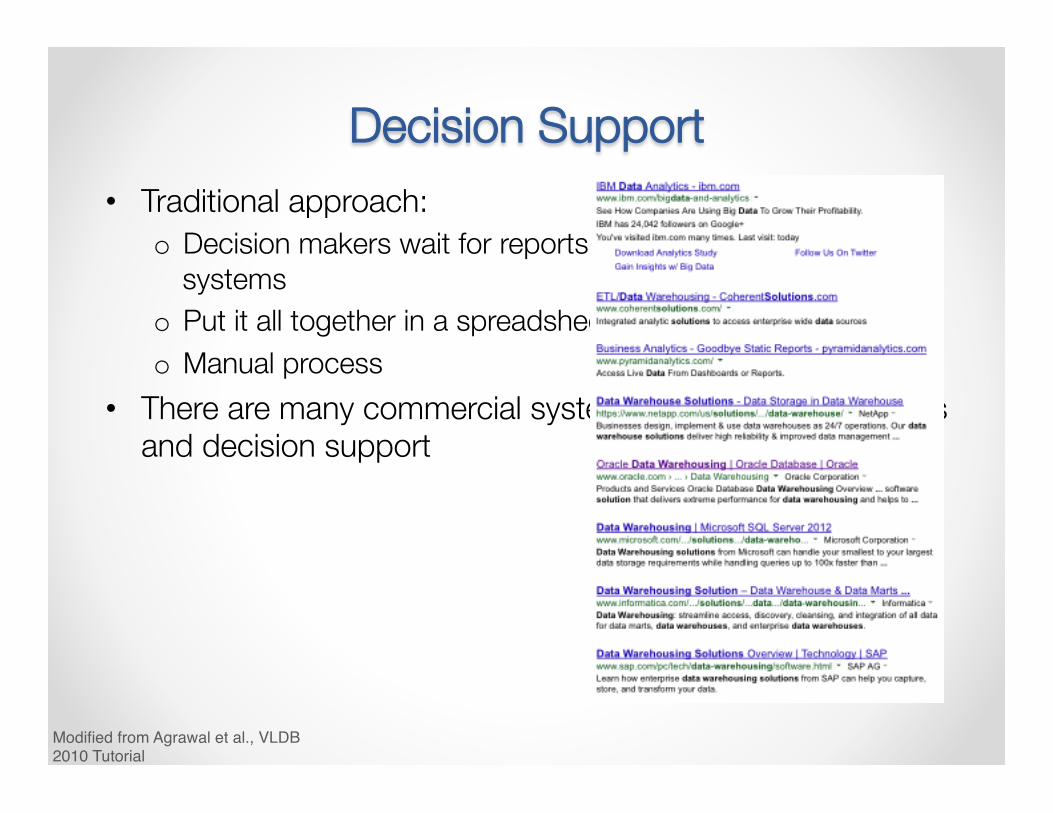
Decision Support • Traditional approach:
o Decision makers wait for reports from disparate OLTP systems
o Put it all together in a spreadsheet o Manual process
• There are many commercial systems that support analytics and decision support
Modified from Agrawal et al., VLDB 2010 Tutorial
Analytics in the Big Data Era • Lots of open data available on the Web! • Data capture at the user interaction level:
o In contrast to the client transaction level in the Enterprise context
o The amount of data increases significantly o Need to analyze such data to understand user behavior
• Cannot afford expensive warehouse solutions
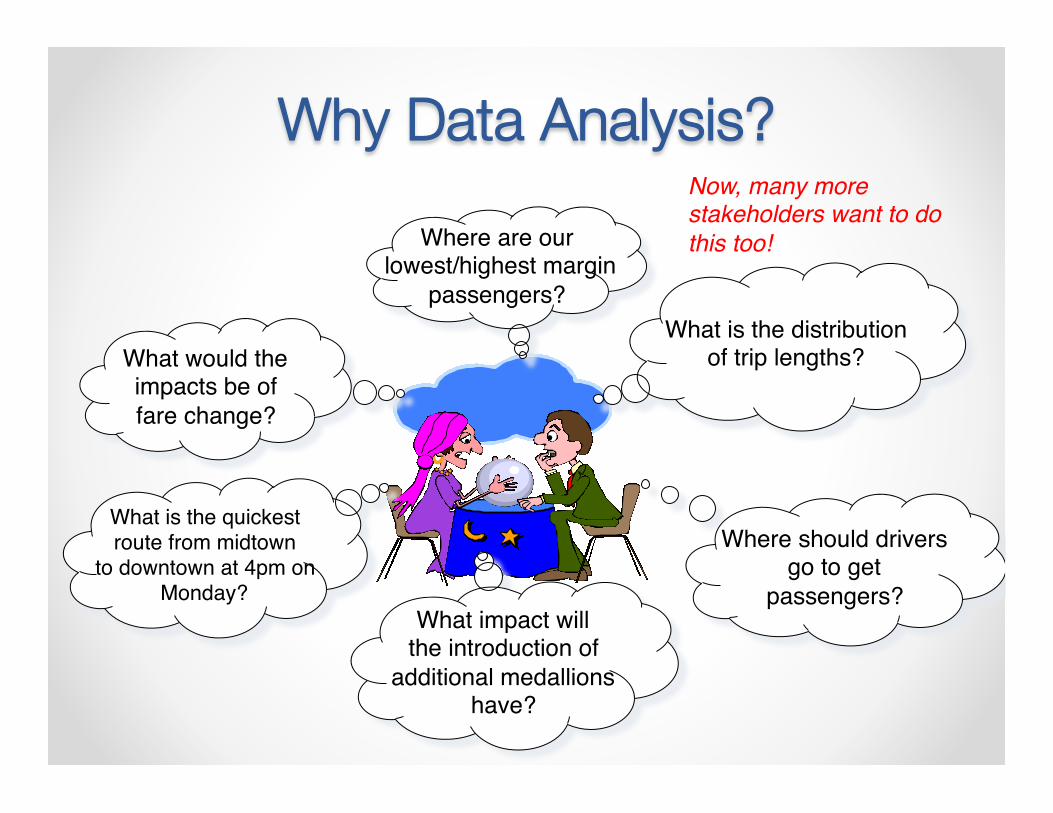
Where are our lowest/highest margin
passengers?
What is the distribution of trip lengths?
Where should driversgo to get
passengers? What impact will
the introduction of additional medallions
have?
What is the quickestroute from midtown
to downtown at 4pm onMonday?
What would the impacts be of fare change?
Why Data Analysis? Now, many more stakeholders want to do this too!
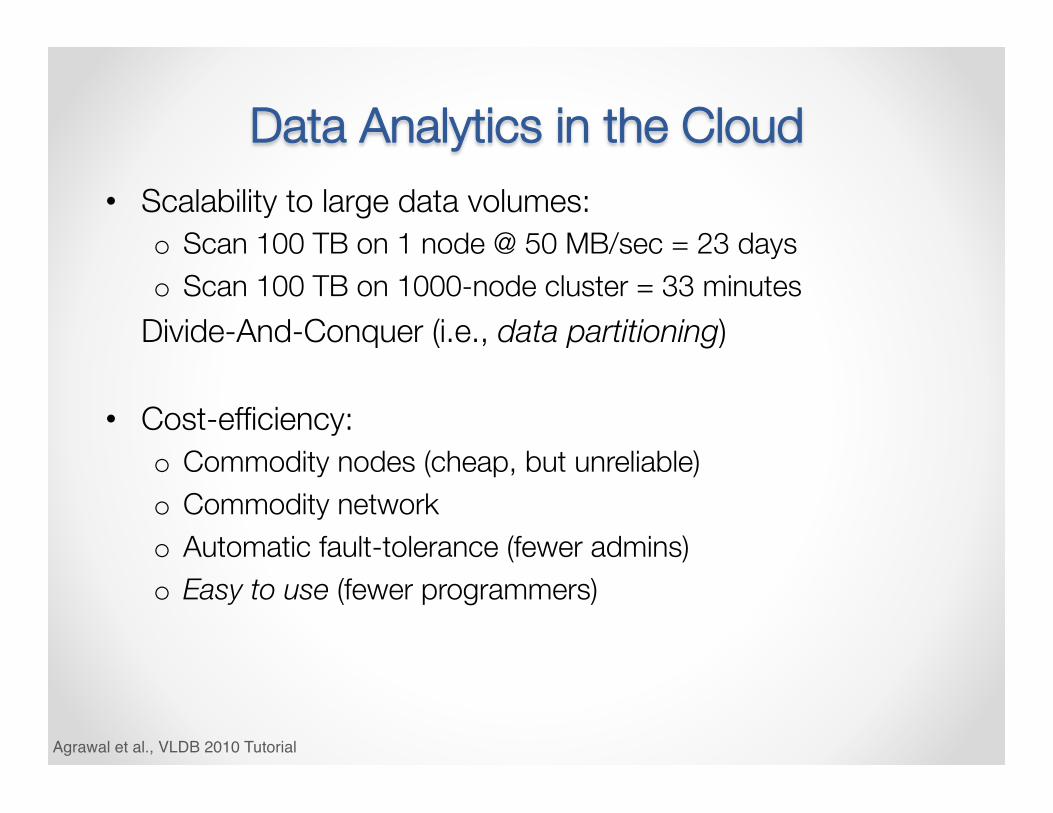
Data Analytics in the Cloud • Scalability to large data volumes:
o Scan 100 TB on 1 node @ 50 MB/sec = 23 days o Scan 100 TB on 1000-node cluster = 33 minutes
Divide-And-Conquer (i.e., data partitioning)
• Cost-efficiency: o Commodity nodes (cheap, but unreliable) o Commodity network o Automatic fault-tolerance (fewer admins) o Easy to use (fewer programmers)
Agrawal et al., VLDB 2010 Tutorial
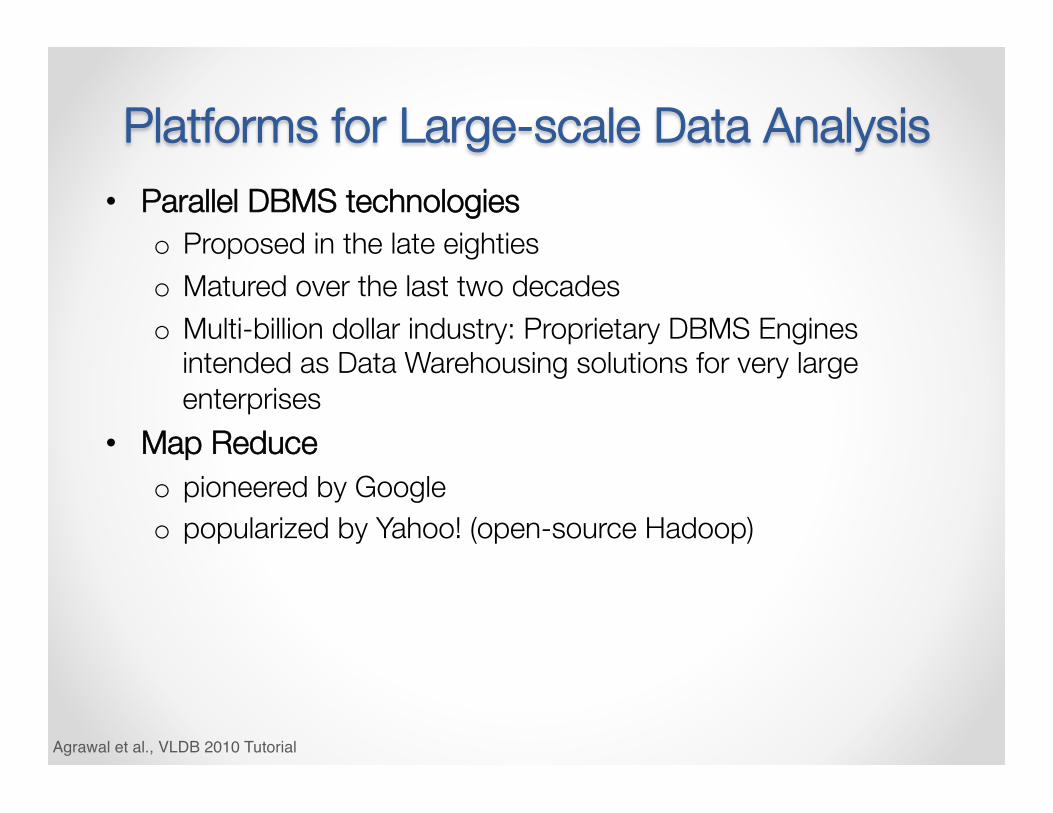
Platforms for Large-scale Data Analysis • Parallel DBMS technologies
o Proposed in the late eighties o Matured over the last two decades o Multi-billion dollar industry: Proprietary DBMS Engines
intended as Data Warehousing solutions for very large enterprises
• Map Reduce o pioneered by Google o popularized by Yahoo! (open-source Hadoop)
Agrawal et al., VLDB 2010 Tutorial
Parallel DBMS technologies • Popularly used for more than two decades
o Research Projects: Gamma, Grace, … o Commercial: Multi-billion dollar industry but access to only a
privileged few • Relational Data Model • Indexing • Familiar SQL interface • Advanced query optimization • Well understood and studied • Very reliable!
Agrawal et al., VLDB 2010 Tutorial
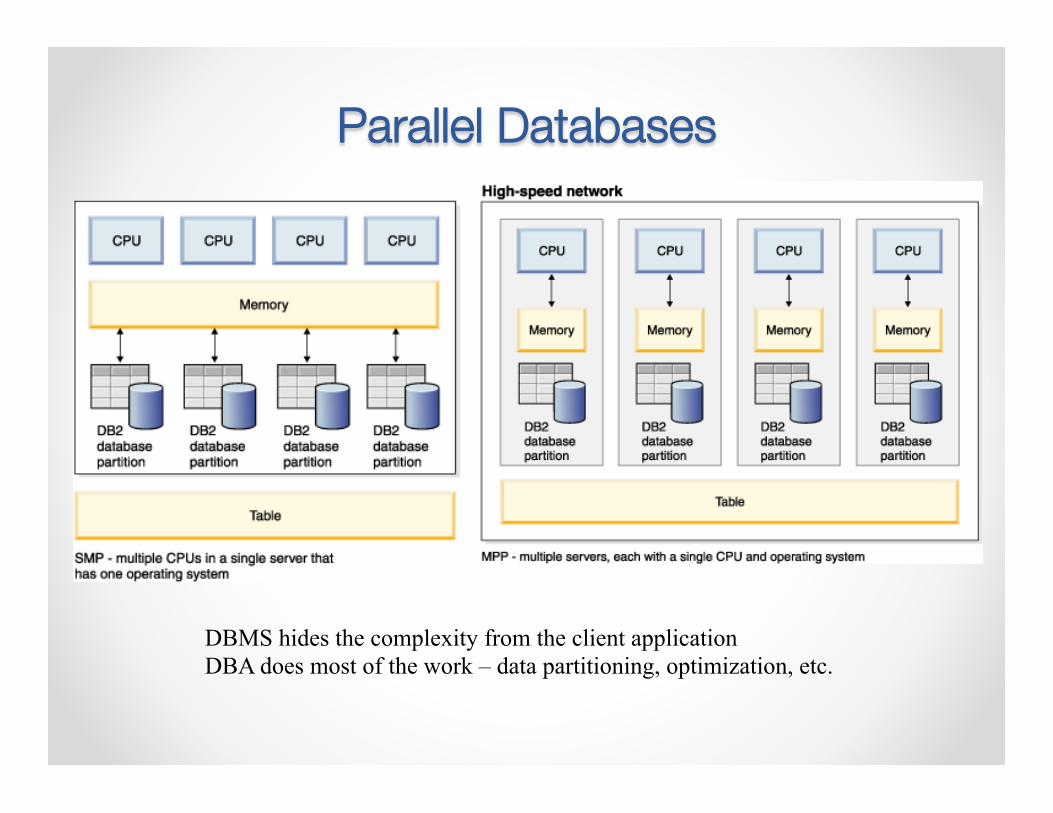
Parallel Databases
DBMS hides the complexity from the client application DBA does most of the work – data partitioning, optimization, etc.
MapReduce • Overview:
o Data-parallel programming model o An associated parallel and distributed implementation for
commodity clusters • Pioneered by Google
o Processing 20 PB of data per day (circa 2008)
[Dean et al., OSDI 2004, CACM Jan 2008, CACM Jan 2010]
Agrawal et al., VLDB 2010 Tutorial
Hadoop• Open source of MapReduce framework of Apache Project • Used by Yahoo!, Facebook, Amazon, and the list is
growing … • Key components
o MapReduce - distributes applications o Hadoop Distributed File System (HDFS) - distributes data
• Hadoop Distributed File System (HDFS) o Store big files across machines o Store each file as a sequence of blocks o Blocks of a file are replicated for fault tolerance
• Distribute processing of large data across thousands of commodity machines
• You have to program your data processing and analysis
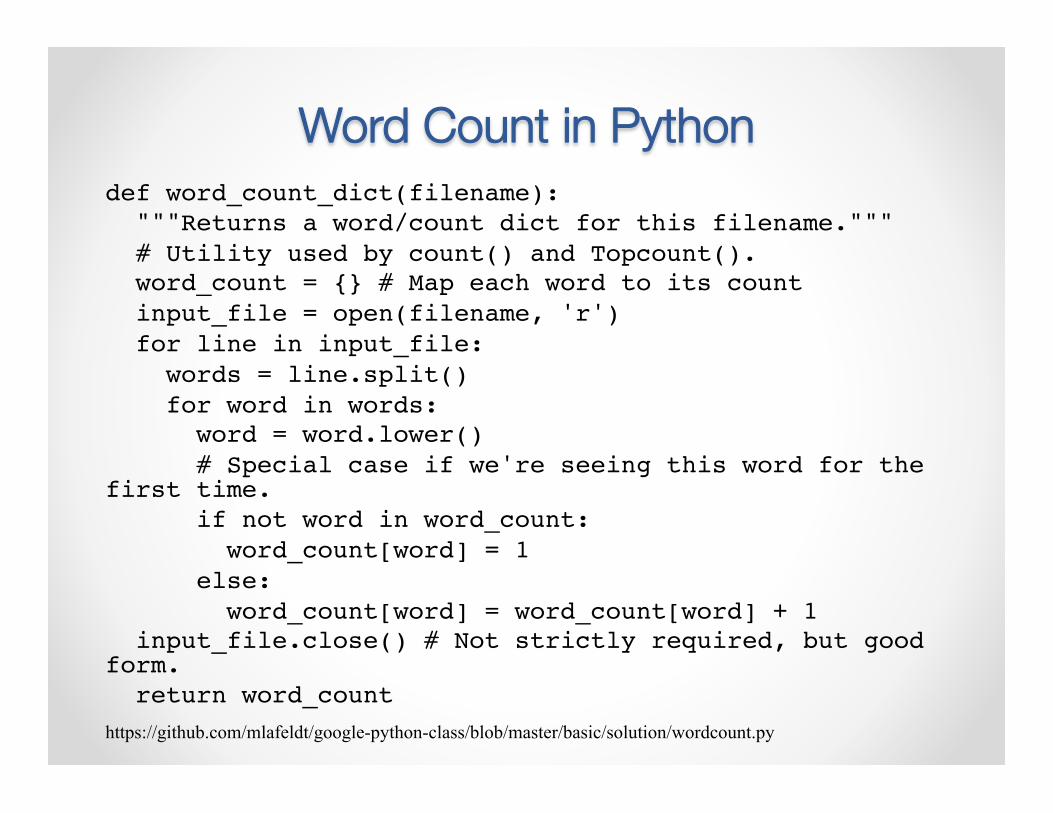
Word Count in Python def word_count_dict(filename): """Returns a word/count dict for this filename.""" # Utility used by count() and Topcount(). word_count = {} # Map each word to its count input_file = open(filename, 'r') for line in input_file: words = line.split() for word in words: word = word.lower() # Special case if we're seeing this word for the first time. if not word in word_count: word_count[word] = 1 else: word_count[word] = word_count[word] + 1 input_file.close() # Not strictly required, but good form. return word_counthttps://github.com/mlafeldt/google-python-class/blob/master/basic/solution/wordcount.py
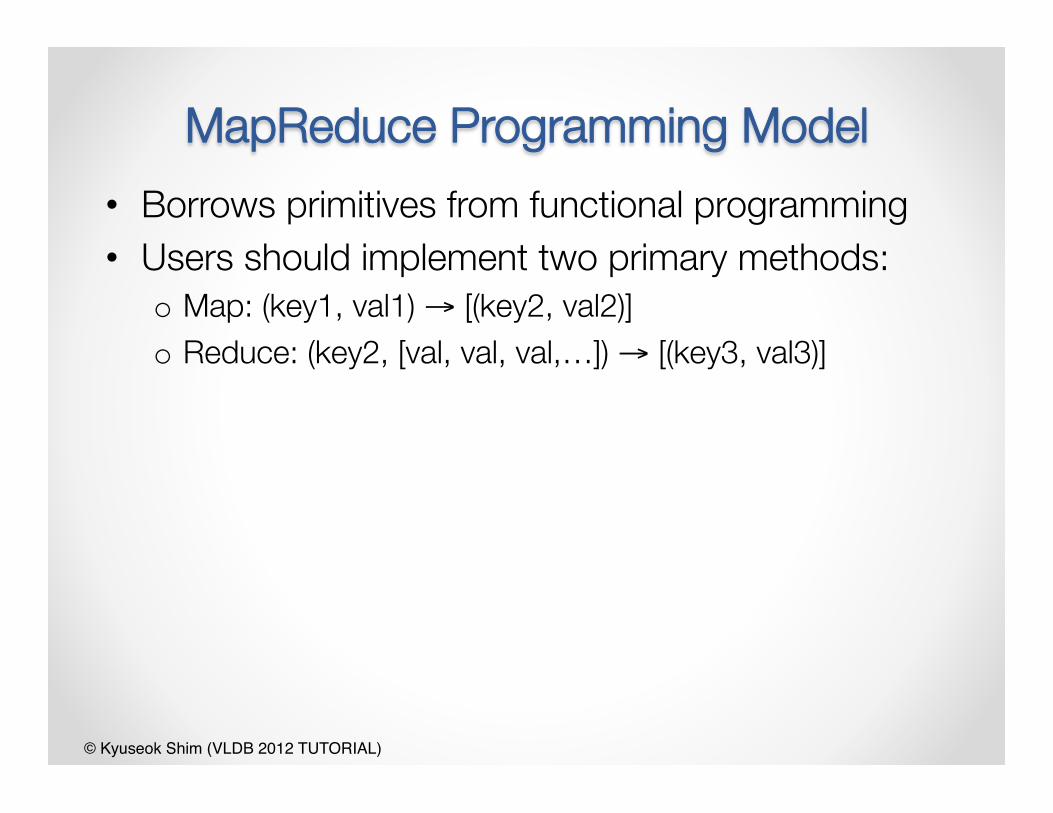
MapReduce Programming Model• Borrows primitives from functional programming • Users should implement two primary methods:
o Map: (key1, val1) → [(key2, val2)] o Reduce: (key2, [val, val, val,…]) → [(key3, val3)]
© Kyuseok Shim (VLDB 2012 TUTORIAL)
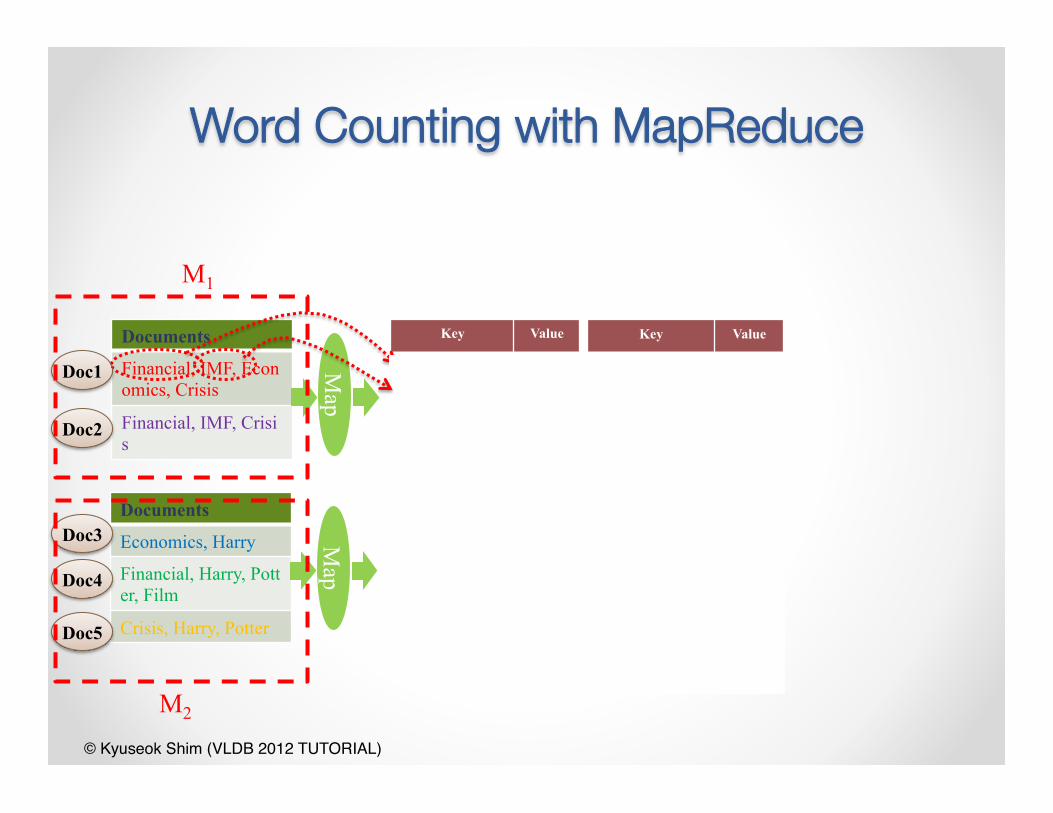
Word Counting with MapReduce
Documents
Financial, IMF, Economics, Crisis
Financial, IMF, Crisis
Map
Key Value
Financial 1
IMF 1
Economics 1
Crisis 1
Financial 1
IMF 1
Crisis 1
Key Value
Economics 1
Harry 1
Financial 1
Harry 1
Potter 1
Film 1
Crisis 1
Harry 1
Potter 1
`
`
`
`
`
`
`Documents
Economics, Harry
Financial, Harry, Potter, Film
Crisis, Harry, Potter
Map
Doc1
Doc2
Doc3
Doc4
Doc5
M1
M2
© Kyuseok Shim (VLDB 2012 TUTORIAL)
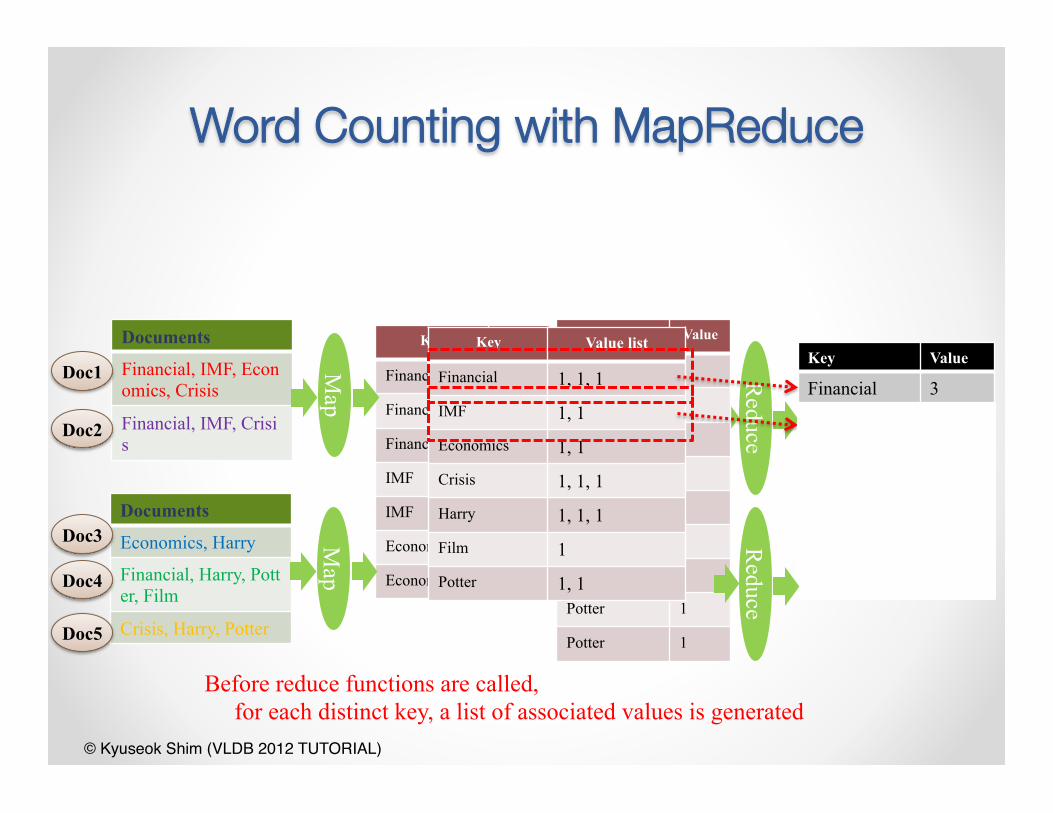
Word Counting with MapReduce
Reduce
Key Value
Financial 3
IMF 2
Economics 2
Crisis 3
Harry 3
Film 1
Potter 2
Key Value
Financial 1
Financial 1
Financial 1
IMF 1
IMF 1
Economics 1
Economics 1
Key Value
Crisis 1
Crisis 1
Crisis 1
Harry 1
Harry 1
Harry 1
Film 1
Potter 1
Potter 1
Before reduce functions are called, for each distinct key, a list of associated values is generated
Key Value list
Financial 1, 1, 1
IMF 1, 1
Economics 1, 1
Crisis 1, 1, 1
Harry 1, 1, 1
Film 1
Potter 1, 1
`̀
`
Documents
Financial, IMF, Economics, Crisis
Financial, IMF, Crisis
Map
Documents
Economics, Harry
Financial, Harry, Potter, Film
Crisis, Harry, Potter
Map
Reduce
Doc1
Doc2
Doc3
Doc4
Doc5
© Kyuseok Shim (VLDB 2012 TUTORIAL)
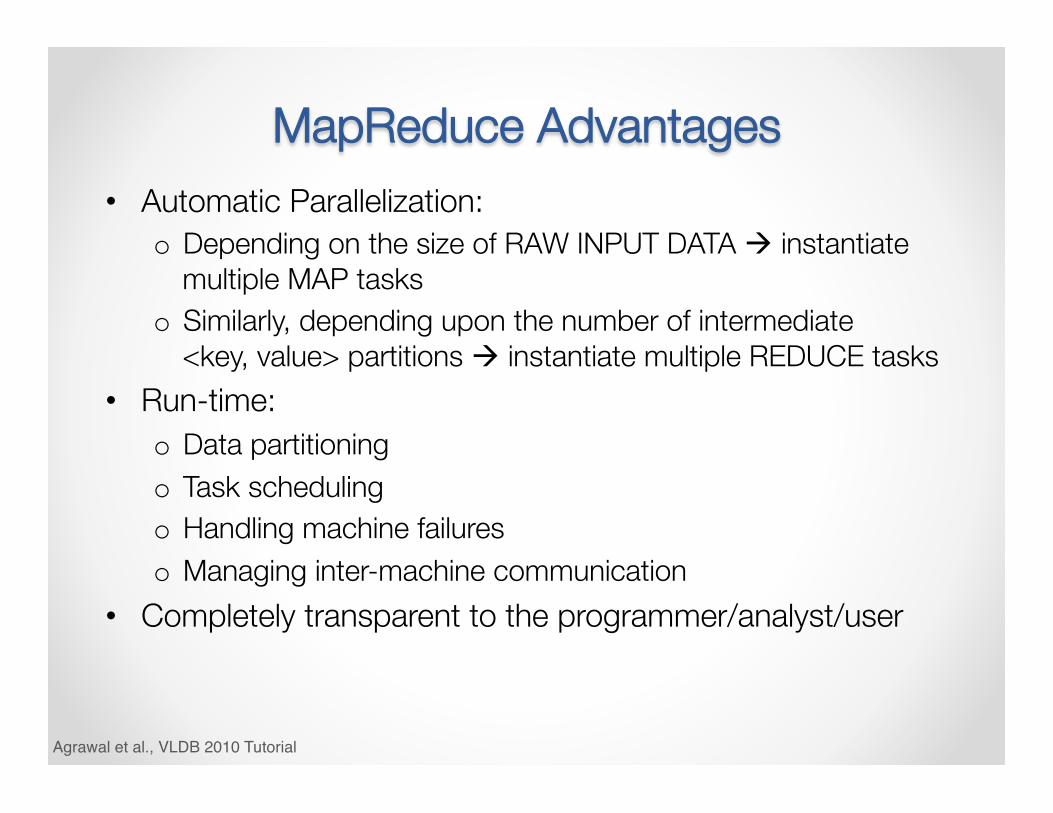
MapReduce Advantages • Automatic Parallelization:
o Depending on the size of RAW INPUT DATA à instantiate multiple MAP tasks
o Similarly, depending upon the number of intermediate <key, value> partitions à instantiate multiple REDUCE tasks
• Run-time: o Data partitioning o Task scheduling o Handling machine failures o Managing inter-machine communication
• Completely transparent to the programmer/analyst/user
Agrawal et al., VLDB 2010 Tutorial
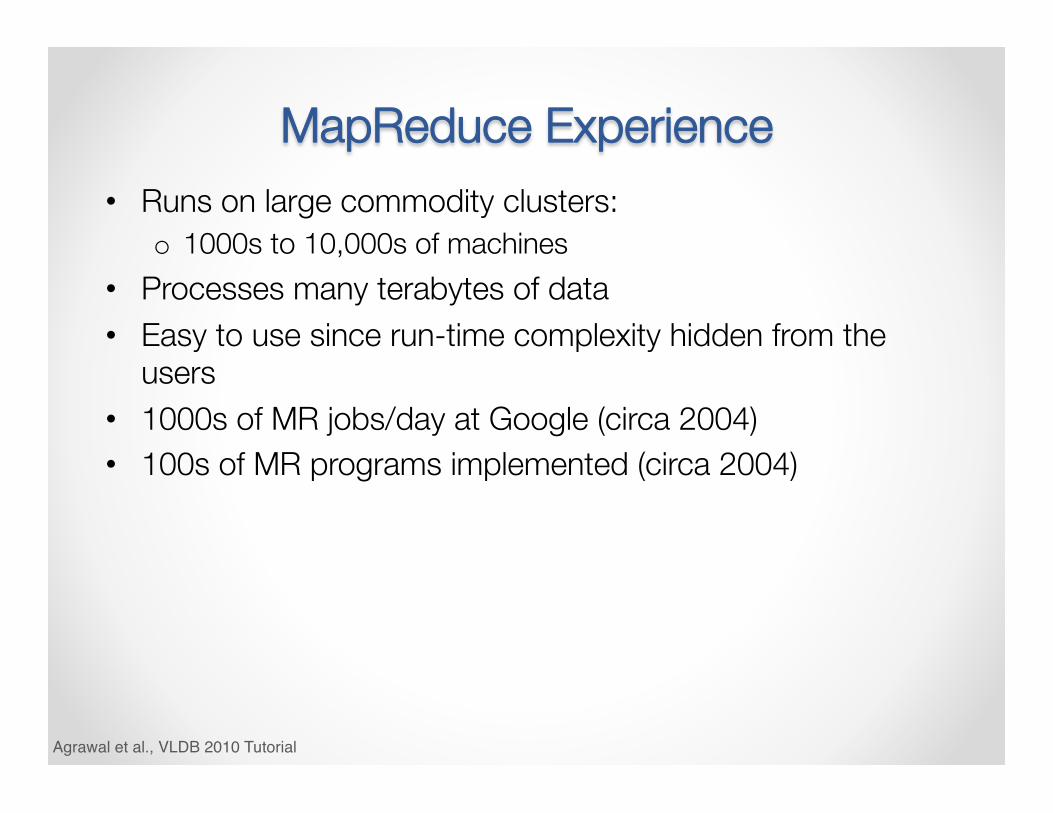
MapReduce Experience • Runs on large commodity clusters:
o 1000s to 10,000s of machines • Processes many terabytes of data • Easy to use since run-time complexity hidden from the
users • 1000s of MR jobs/day at Google (circa 2004) • 100s of MR programs implemented (circa 2004)
Agrawal et al., VLDB 2010 Tutorial
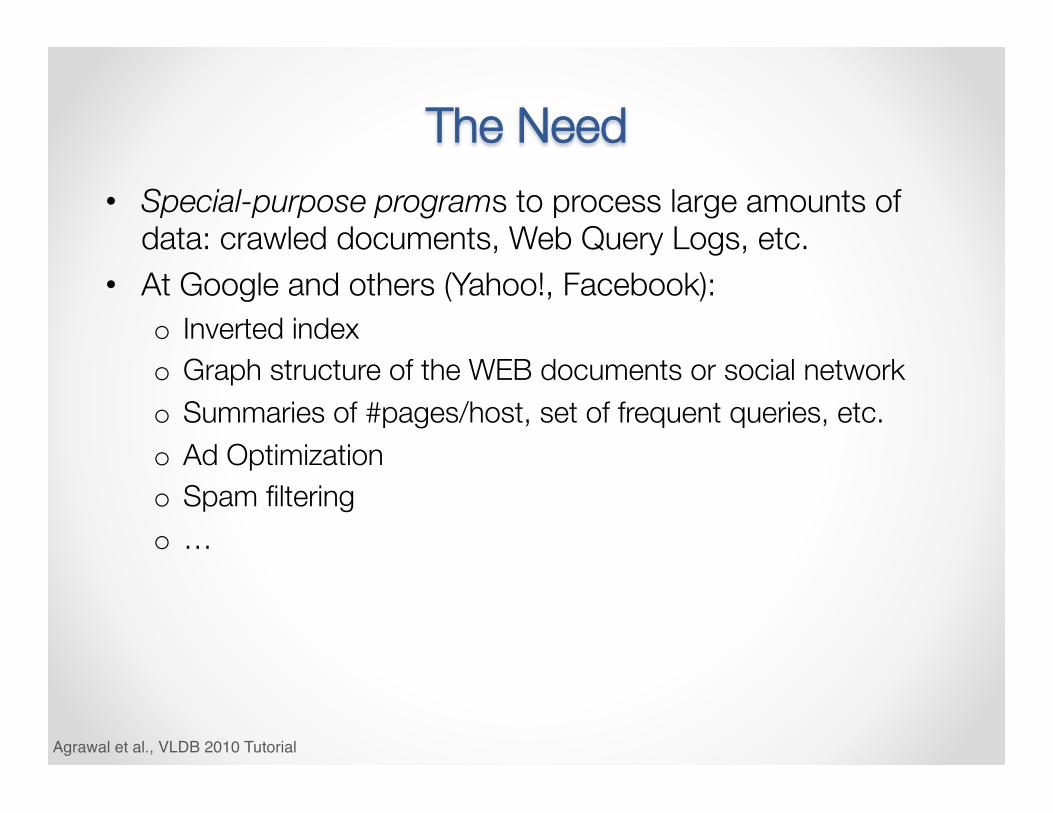
The Need • Special-purpose programs to process large amounts of
data: crawled documents, Web Query Logs, etc. • At Google and others (Yahoo!, Facebook):
o Inverted index o Graph structure of the WEB documents or social network o Summaries of #pages/host, set of frequent queries, etc. o Ad Optimization o Spam filtering o …
Agrawal et al., VLDB 2010 Tutorial
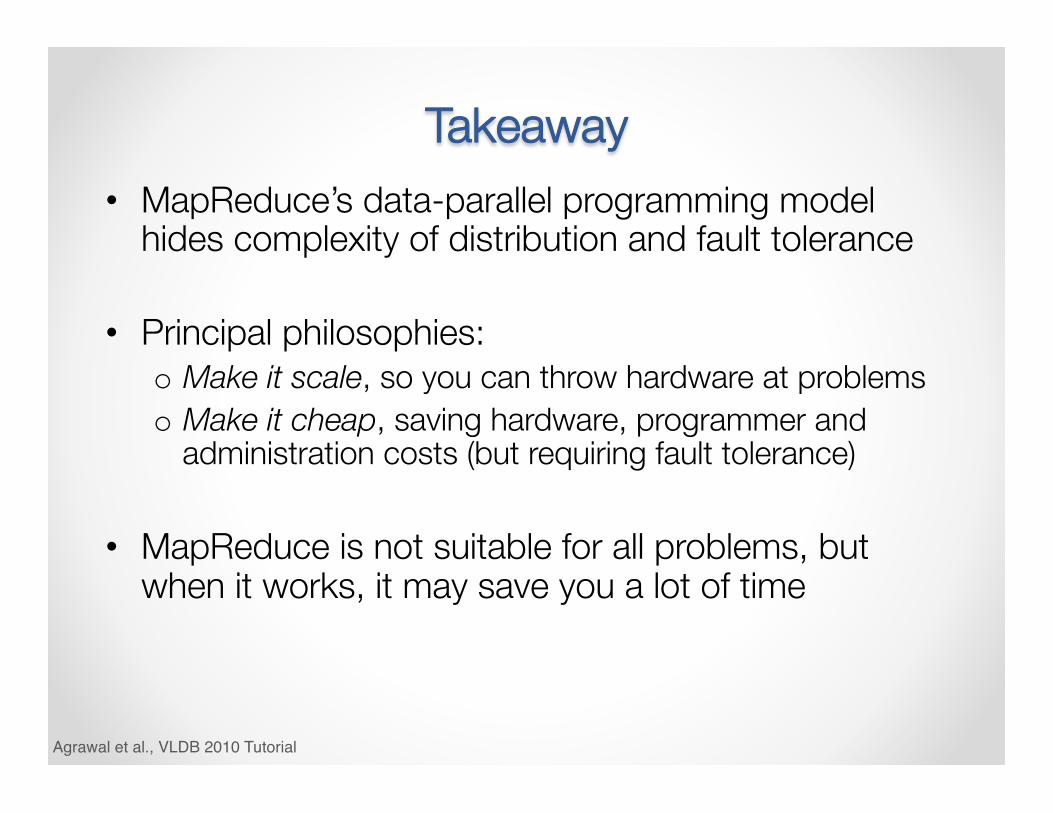
Takeaway • MapReduce’s data-parallel programming model
hides complexity of distribution and fault tolerance
• Principal philosophies: o Make it scale, so you can throw hardware at problems o Make it cheap, saving hardware, programmer and
administration costs (but requiring fault tolerance) • MapReduce is not suitable for all problems, but
when it works, it may save you a lot of time
Agrawal et al., VLDB 2010 Tutorial
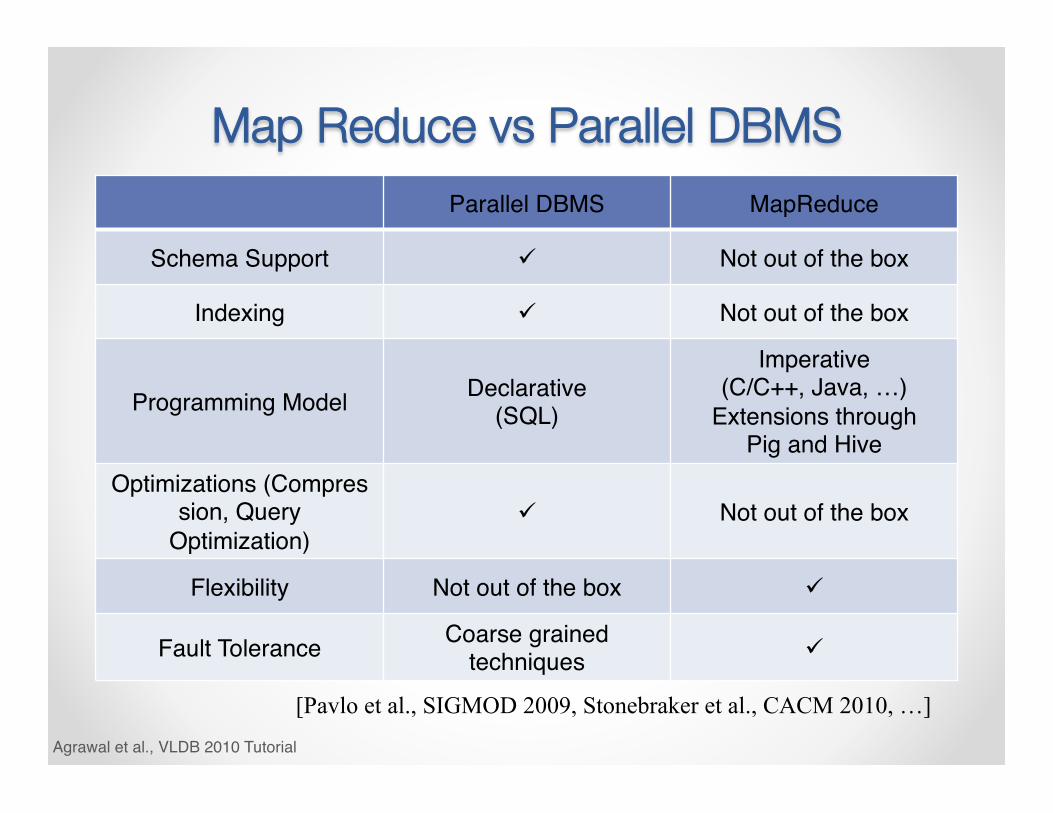
Map Reduce vs Parallel DBMSParallel DBMS MapReduce
Schema Support ü Not out of the box
Indexing ü Not out of the box
Programming Model Declarative(SQL)
Imperative(C/C++, Java, …)
Extensions through Pig and Hive
Optimizations (Compression, Query
Optimization)ü Not out of the box
Flexibility Not out of the box ü
Fault Tolerance Coarse grained techniques ü
Agrawal et al., VLDB 2010 Tutorial
[Pavlo et al., SIGMOD 2009, Stonebraker et al., CACM 2010, …]
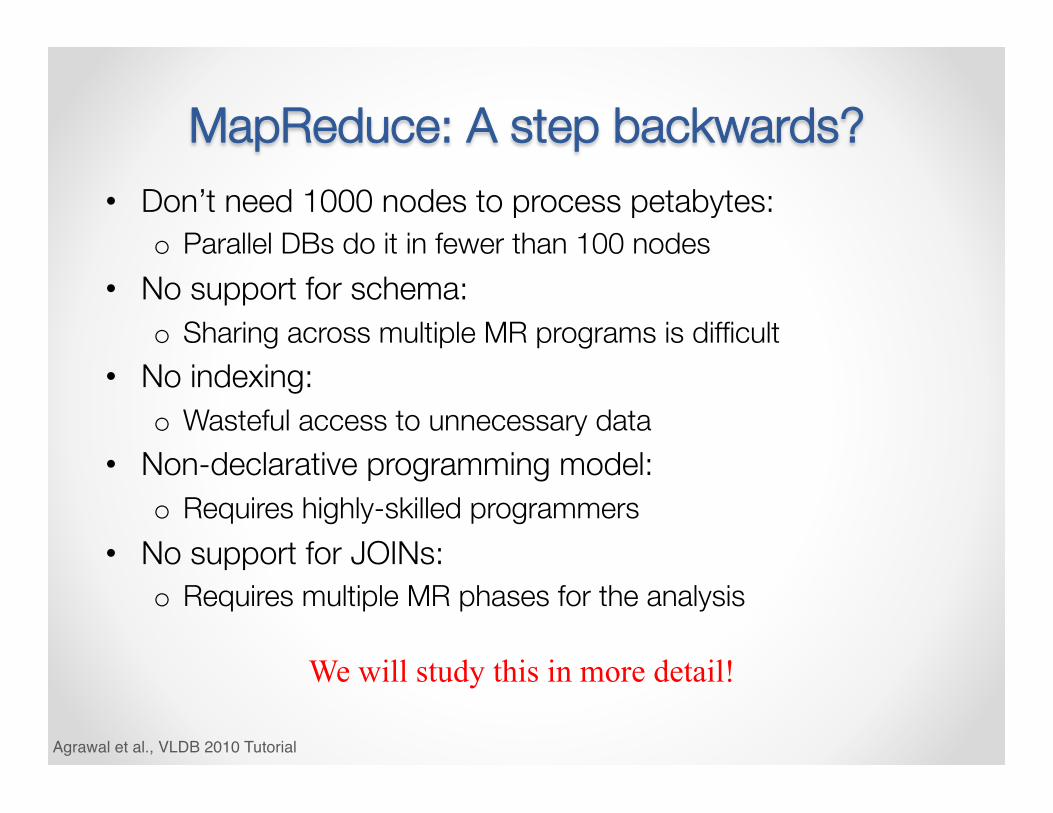
MapReduce: A step backwards? • Don’t need 1000 nodes to process petabytes:
o Parallel DBs do it in fewer than 100 nodes • No support for schema:
o Sharing across multiple MR programs is difficult • No indexing:
o Wasteful access to unnecessary data • Non-declarative programming model:
o Requires highly-skilled programmers • No support for JOINs:
o Requires multiple MR phases for the analysis
Agrawal et al., VLDB 2010 Tutorial
We will study this in more detail!
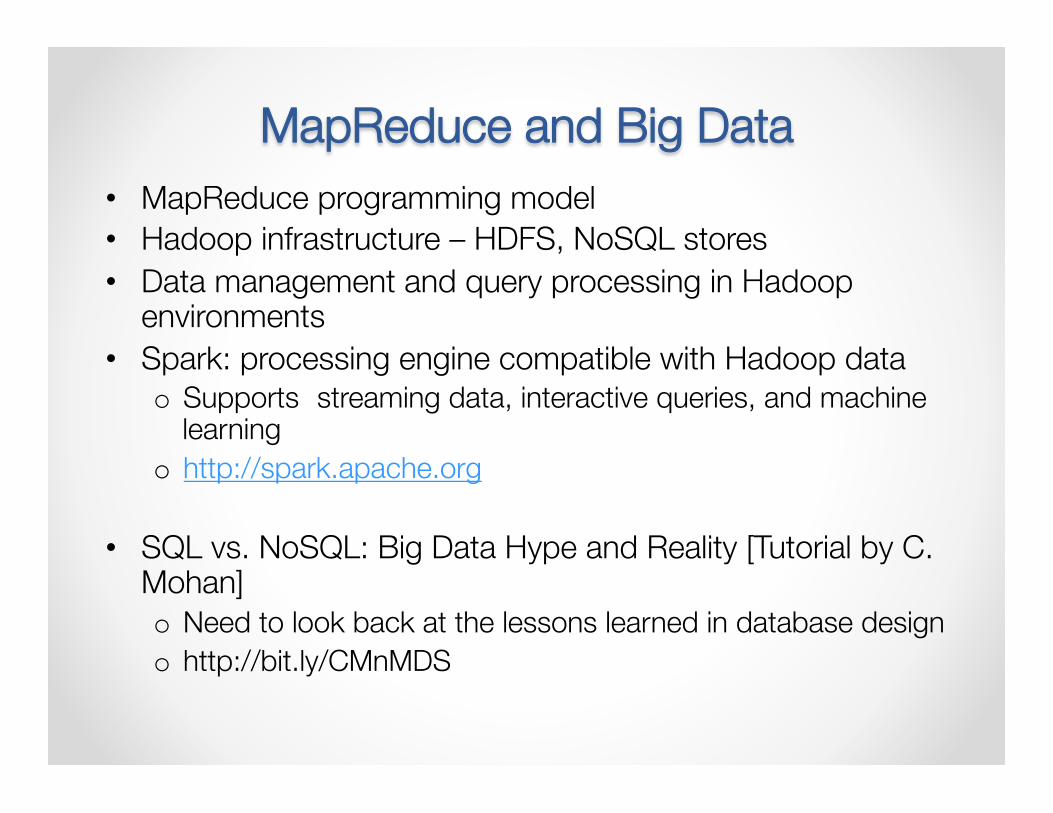
MapReduce and Big Data • MapReduce programming model • Hadoop infrastructure – HDFS, NoSQL stores • Data management and query processing in Hadoop
environments • Spark: processing engine compatible with Hadoop data
o Supports streaming data, interactive queries, and machine learning
o http://spark.apache.org
• SQL vs. NoSQL: Big Data Hype and Reality [Tutorial by C. Mohan] o Need to look back at the lessons learned in database design o http://bit.ly/CMnMDS

Analysis and Mining
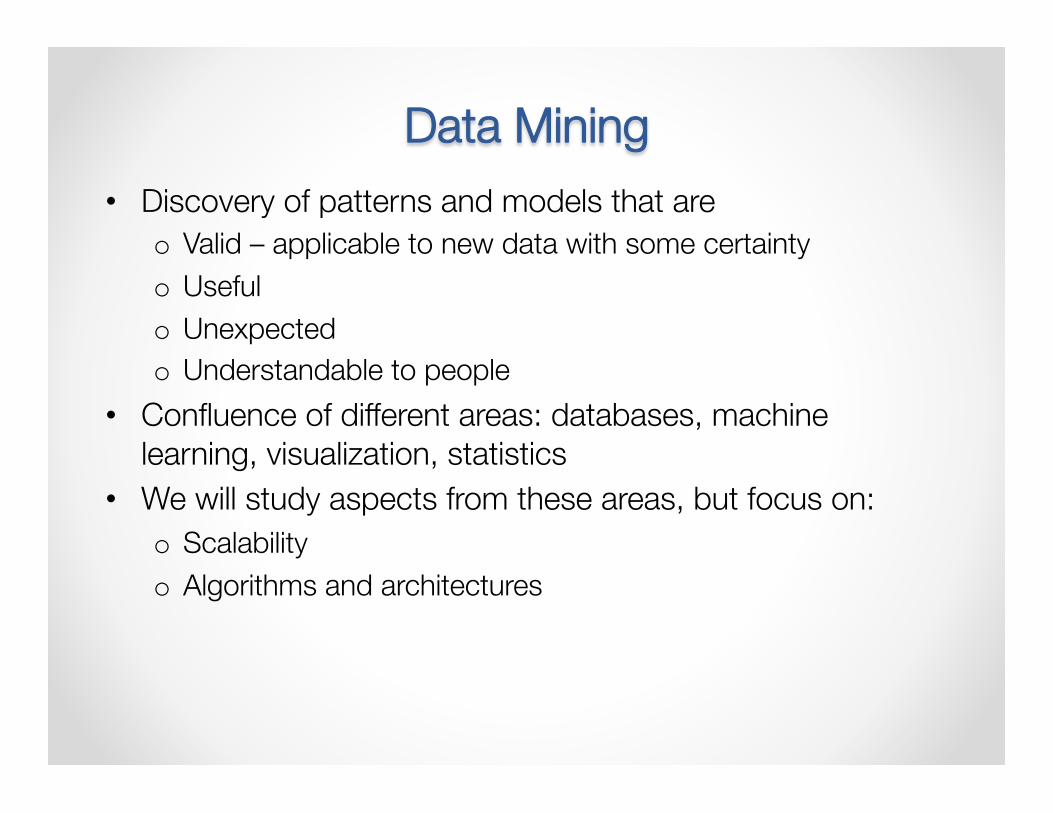
Data Mining • Discovery of patterns and models that are
o Valid – applicable to new data with some certainty o Useful o Unexpected o Understandable to people
• Confluence of different areas: databases, machine learning, visualization, statistics
• We will study aspects from these areas, but focus on: o Scalability o Algorithms and architectures
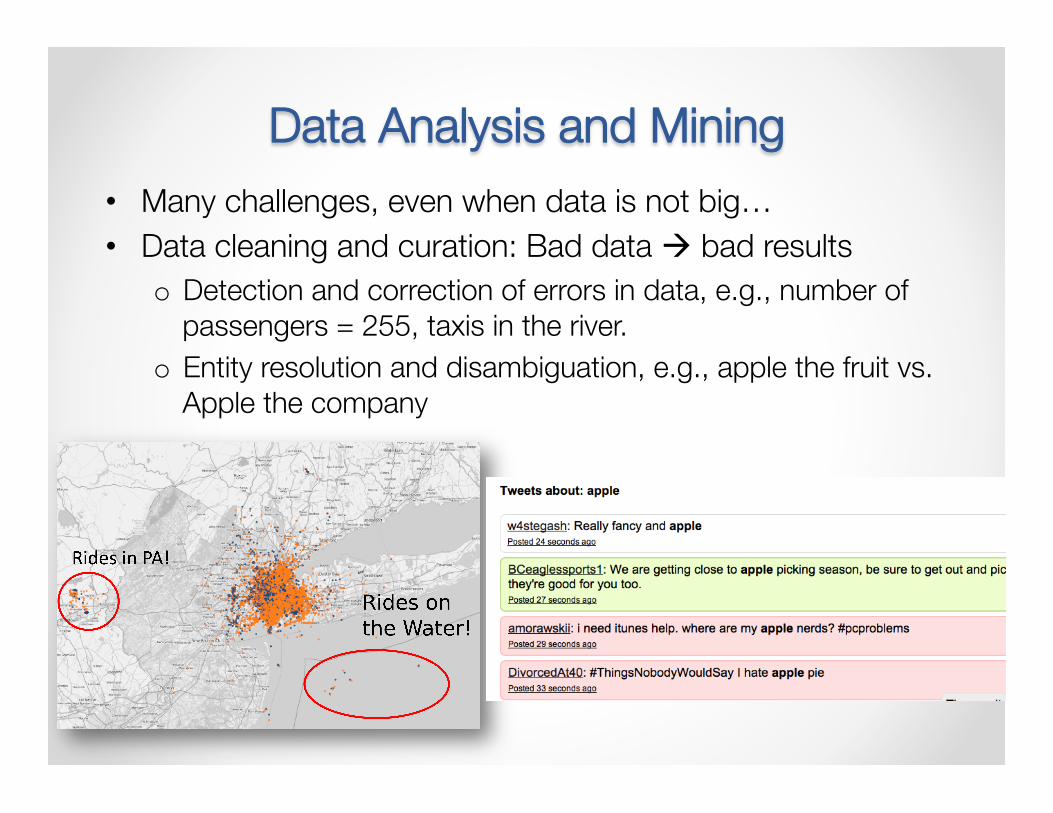
Data Analysis and Mining • Many challenges, even when data is not big… • Data cleaning and curation: Bad data à bad results
o Detection and correction of errors in data, e.g., number of passengers = 255, taxis in the river.
o Entity resolution and disambiguation, e.g., apple the fruit vs. Apple the company
Data Analysis and Mining • Many challenges, even when data is not big… • Data cleaning and curation: Bad data à bad results
o Detection and correction of errors in data E.g., number of passengers = 255, taxis in the river.
o Entity resolution and disambiguation, e.g., apple the fruit vs. Apple the company
• Sometimes it can be hard to distinguish between errors and outliers!
Data Analysis and Mining • Many challenges, even when data is not big… • Data cleaning and curation:
o Detection and correction of errors in data E.g., number of passengers = 255, taxis in the river.
o Entity resolution and disambiguation, e.g., apple the fruit vs. Apple the company
• Sometimes it can be hard to distinguish between errors and outliers!
• Visualization: Pictures help us to think o Substitute perception for cognition o External memory: free up limited cognitive/memory resources for
higher-level problems • Mining: Discovery of useful, possibly unexpected, patterns
in data
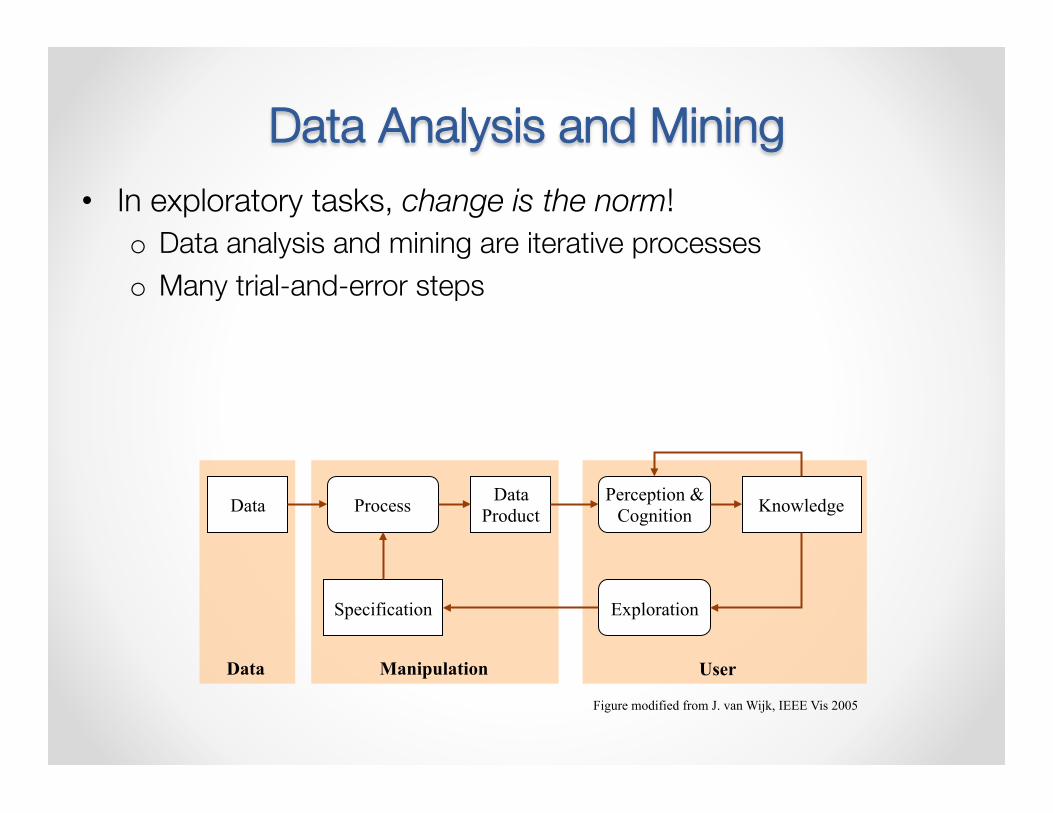
Data Analysis and Mining • In exploratory tasks, change is the norm!
o Data analysis and mining are iterative processes o Many trial-and-error steps
Data Data Product
Specification
Knowledge Process Perception & Cognition
Exploration
Data Manipulation User
Figure modified from J. van Wijk, IEEE Vis 2005
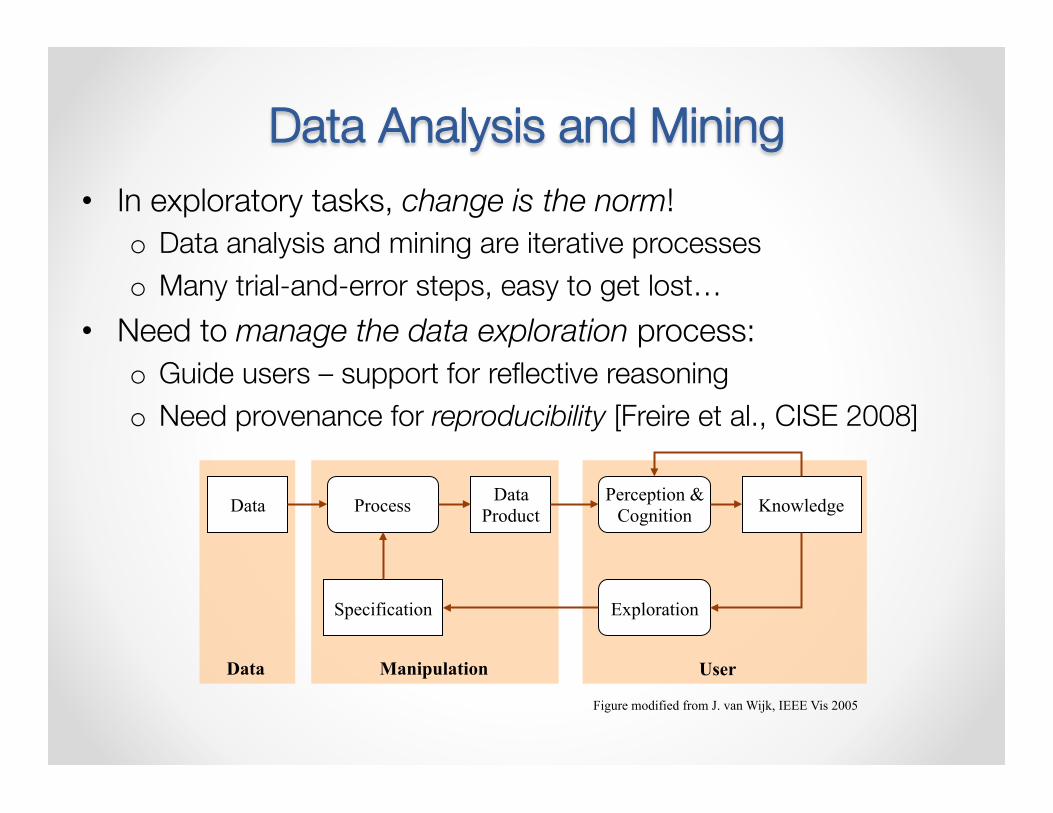
Data Analysis and Mining • In exploratory tasks, change is the norm!
o Data analysis and mining are iterative processes o Many trial-and-error steps, easy to get lost…
• Need to manage the data exploration process: o Guide users – support for reflective reasoning o Need provenance for reproducibility [Freire et al., CISE 2008]
Data Data Product
Specification
Knowledge Process Perception & Cognition
Exploration
Data Manipulation User
Figure modified from J. van Wijk, IEEE Vis 2005
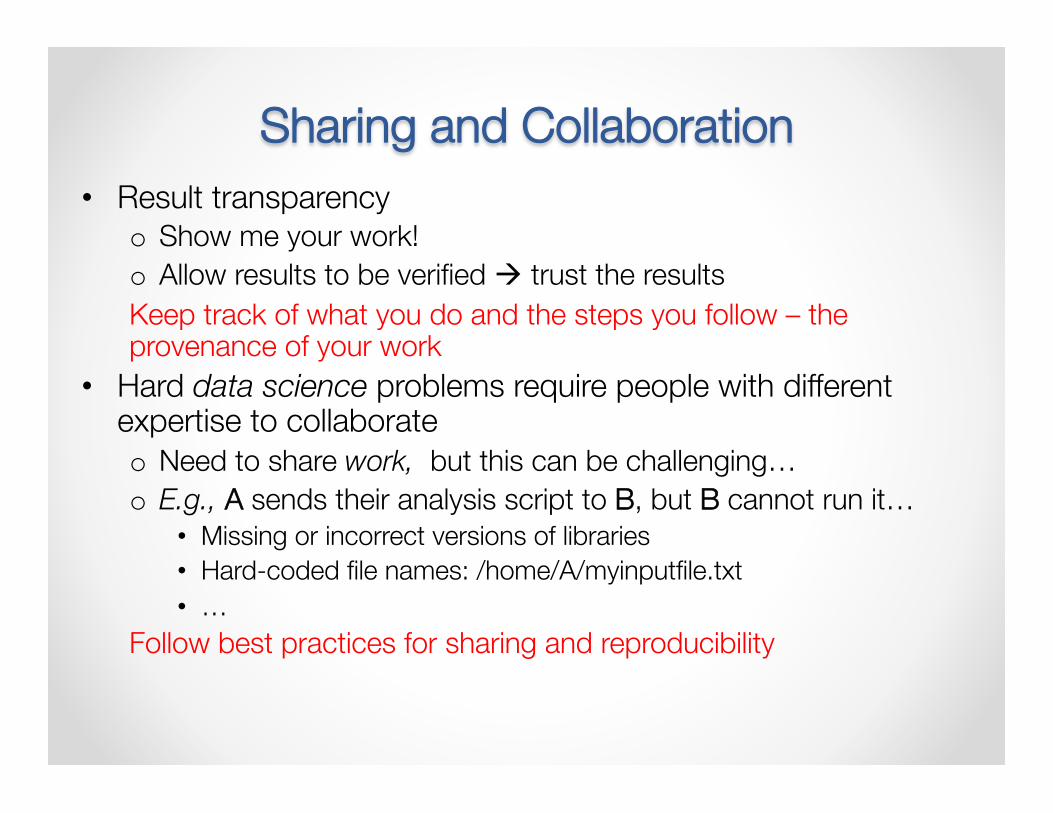
Sharing and Collaboration • Result transparency
o Show me your work! o Allow results to be verified à trust the results Keep track of what you do and the steps you follow – the provenance of your work
• Hard data science problems require people with different expertise to collaborate o Need to share work, but this can be challenging… o E.g., A sends their analysis script to B, but B cannot run it…
• Missing or incorrect versions of libraries • Hard-coded file names: /home/A/myinputfile.txt • …
Follow best practices for sharing and reproducibility

Analyzing and Mining Big Data: Issues • Scalability for algorithms and computations: need to
design/extend algorithms to leverage new computing model o We will cover this in the third module of our course
• A big data-mining risk is that you will“discover” patterns that are meaningless – watch out for bogus patterns/events
• Bonferroni correction gives a statistically sound way to avoid most of these bogus positive responses
Bonferroni’s Principle • Calculate the expected number of occurrences of the
events you are looking for, assuming that data is random • If this number is significantly larger than the number of real
instances you hope to find, then you must expect almost anything you find to be bogus, i.e., a statistical artifact rather than evidence of what you are looking for.
• Read textbook! o Chapter 1 of Mining of Massive Data Analysis