scalableproductionoflargequantitiesof defect-freefew ... · raman spectroscopy show the exfoliated...
TRANSCRIPT

ARTICLESPUBLISHED ONLINE: 20 APRIL 2014 | DOI: 10.1038/NMAT3944
Scalable production of large quantities ofdefect-free few-layer graphene by shearexfoliation in liquidsKeith R. Paton et al.†
To progress from the laboratory to commercial applications, it will be necessary to develop industrially scalable methodsto produce large quantities of defect-free graphene. Here we show that high-shear mixing of graphite in suitable stabilizingliquids results in large-scale exfoliation to give dispersions of graphene nanosheets. X-ray photoelectron spectroscopy andRaman spectroscopy show the exfoliated flakes to be unoxidized and free of basal-plane defects. We have developed a simplemodel that shows exfoliation to occur once the local shear rate exceeds 104 s−1. By fully characterizing the scaling behaviourof the graphene production rate, we show that exfoliation can be achieved in liquid volumes from hundreds of millilitres upto hundreds of litres and beyond. The graphene produced by this method performs well in applications from composites toconductive coatings. This method can be applied to exfoliate BN, MoS2 and a range of other layered crystals.
Owing to its ultrathin, two-dimensional (2D) nature and itsunprecedented properties, graphene has become the moststudied of nanomaterials. In the next decade, graphene
will find commercial applications in many areas from high-frequency electronics to smart coatings1. Some important classes ofapplications, such as printed electronics, conductive coatings andcomposite fillers, will require industrial-scale production of defect-free graphene in a processable form. For example, graphene is likelyto be used as a low-cost electrode material in applications suchas solar cells2, batteries3 and sensors4. Such electrodes will almostcertainly be produced by solution-coating and so will require largequantities of graphene in the form of liquid suspensions, inks ordispersions1. Thus, liquid-exfoliation of graphene will become animportant technology in the near future5,6. However, no scalablemethod exists to give large quantities of graphene that is alsodefect-free. For example, whereas oxidative-exfoliation of graphitecan potentially give large quantities of graphene-like nanosheets,graphene oxide is typically defective7. Although graphene oxide hasproved very useful in applications from composites to catalysis8,9,it is very likely that an equally wide range of applications willrequire graphene that is free of basal-plane defects. Alternatively,sonication of graphite10, or indeed other layered compounds11, incertain stabilizing solvents or aqueous surfactant solutions12,13 givesdefect-free nanosheets. However, the scalability of the latter processis limited by the use of sonication as an energy source.
Thus, solution-exfoliation methods tend to exhibit either highproduction rates or low defect contents, but not both. A detailedliterature survey (Supplementary Section 9) shows that no papersdescribe production rates above 0.4 g h−1 coupled with Raman D/Gintensity ratios (ameasure of defect content) below 0.65. In fact, 80%of the papers surveyed had production rates below 0.04 g h−1, far toolow for commercial production. One possible solution would be tofind a scalable method of exfoliation that, coupled with the use ofstabilizing liquids, could lead to large-scale graphene production.
Here, we demonstrate high-shear mixing (SupplementarySection 1) as a scalable alternative to sonication for the exfoliation
of layered crystals such as graphite. Shear mixing is already widelyused to disperse nanoparticles in liquids. However, in generalthis involves breaking up of nanoparticle agglomerates14 that areweakly bound compared with the intersheet binding strengthin graphite. A number of papers and patents have describedmethods for the exfoliation of graphite or layered compounds thatincorporate shear mixing as part of the process. However, in allsuch cases, the layered crystal was first swelled by intercalation,significantly weakening the interlayer binding strength15–18. Underthese circumstances, shear mixing can be used to exfoliate thecrystal to give dispersed nanosheets. However, such methodologiesjust shift the rate-limiting step from exfoliation to intercalation,limiting the potential for scale-up. Much more useful would be theability to exfoliate untreated layered crystals in liquids using onlyshear mixing. This would allow the application of the well-knownstrategies for the scale-up of shear-mixing processes that arecommonly used in industry19. However, at first glance shear mixingalone seems an unlikely candidate for exfoliation of layered crystals.When using ultrasonic probes to exfoliate graphite, energy densitiesof thousands of watts per litre are typically used20. Laboratory-scaleshear mixers typically deliver hundreds of watts into a few litresof liquid resulting in powder densities of ∼100W l−1. Thus, onewould expect exfoliation under shear to either not occur at all or toproceed at a much lower rate than sonication-induced exfoliation.However, a recent paper has shown that graphite can be exfoliatedto give graphene by generating shear in a very thin liquid layer ina rapidly rotating tube21. However, this method gives very smallquantities of graphene and is inherently un-scalable. Here wedemonstrate a method for shear exfoliation of graphite to givegraphene that is many times more efficient than sonication butwhich can be scaled-up to an industrial level. We show that shearexfoliation can produce large quantities of defect-free, unoxidizedgraphene and develop a model that quantitatively describes theprocess. In addition, this graphene performs very well in a rangeof applications and this method can be used to exfoliate numerousother layered crystals.
†A full list of authors and a�liations appears at the end of the paper.
624 NATUREMATERIALS | VOL 13 | JUNE 2014 | www.nature.com/naturematerials
© 2014 Macmillan Publishers Limited. All rights reserved
NATURE MATERIALS DOI: 10.1038/NMAT3944 ARTICLES
c
500 nm'
Rotor/stator
500 nm
g
Rotor Stator
200 nm
1,000 2,000 3,000
D'
G
D
Inte
nsity
Raman shift (cm−1)
2D
D G
2D
284 288 292
C OC N
Inte
nsity
Binding energy (eV)0 5 10 15 20 25
0
4
8
12
16N high(NMP)
N high(NMP)
Num
ber o
f obj
ects
Flake thickness, N
N high(NaC)
C i lo
wD
low
N lo
wt h
igh
V lo
wD
hig
hV
high
t low
C i h
igh
N h
igh
0.1
1.0
10
⟨NG⟩ (NMP, Raman)
ID /IG (NMP)⟨NG⟩, I D
/IG
, C
C co
nten
t ⟨NG⟩ (NaC, AFM)
2,600 2,800
1 2 3(103 cm−1)
e f h k l
a b d i j
C HC C
C C fraction (NMP)C C fraction (NMP)
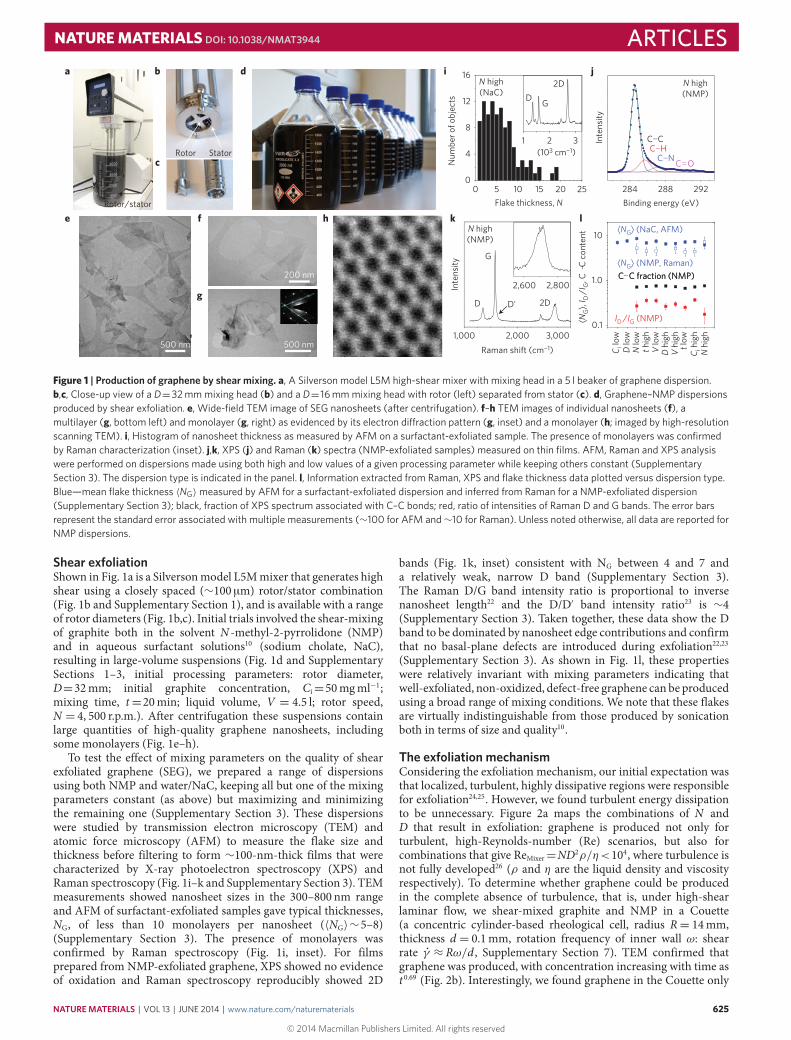
Figure 1 | Production of graphene by shear mixing. a, A Silverson model L5M high-shear mixer with mixing head in a 5 l beaker of graphene dispersion.b,c, Close-up view of a D=32 mm mixing head (b) and a D= 16 mm mixing head with rotor (left) separated from stator (c). d, Graphene–NMP dispersionsproduced by shear exfoliation. e, Wide-field TEM image of SEG nanosheets (after centrifugation). f–h TEM images of individual nanosheets (f), amultilayer (g, bottom left) and monolayer (g, right) as evidenced by its electron di�raction pattern (g, inset) and a monolayer (h; imaged by high-resolutionscanning TEM). i, Histogram of nanosheet thickness as measured by AFM on a surfactant-exfoliated sample. The presence of monolayers was confirmedby Raman characterization (inset). j,k, XPS (j) and Raman (k) spectra (NMP-exfoliated samples) measured on thin films. AFM, Raman and XPS analysiswere performed on dispersions made using both high and low values of a given processing parameter while keeping others constant (SupplementarySection 3). The dispersion type is indicated in the panel. l, Information extracted from Raman, XPS and flake thickness data plotted versus dispersion type.Blue—mean flake thickness 〈NG〉measured by AFM for a surfactant-exfoliated dispersion and inferred from Raman for a NMP-exfoliated dispersion(Supplementary Section 3); black, fraction of XPS spectrum associated with C–C bonds; red, ratio of intensities of Raman D and G bands. The error barsrepresent the standard error associated with multiple measurements (∼100 for AFM and∼10 for Raman). Unless noted otherwise, all data are reported forNMP dispersions.
Shear exfoliationShown in Fig. 1a is a Silversonmodel L5Mmixer that generates highshear using a closely spaced (∼100 µm) rotor/stator combination(Fig. 1b and Supplementary Section 1), and is available with a rangeof rotor diameters (Fig. 1b,c). Initial trials involved the shear-mixingof graphite both in the solvent N -methyl-2-pyrrolidone (NMP)and in aqueous surfactant solutions10 (sodium cholate, NaC),resulting in large-volume suspensions (Fig. 1d and SupplementarySections 1–3, initial processing parameters: rotor diameter,D=32mm; initial graphite concentration, Ci=50mgml−1;mixing time, t=20min; liquid volume, V = 4.5 l; rotor speed,N = 4, 500 r.p.m.). After centrifugation these suspensions containlarge quantities of high-quality graphene nanosheets, includingsome monolayers (Fig. 1e–h).
To test the effect of mixing parameters on the quality of shearexfoliated graphene (SEG), we prepared a range of dispersionsusing both NMP and water/NaC, keeping all but one of the mixingparameters constant (as above) but maximizing and minimizingthe remaining one (Supplementary Section 3). These dispersionswere studied by transmission electron microscopy (TEM) andatomic force microscopy (AFM) to measure the flake size andthickness before filtering to form ∼100-nm-thick films that werecharacterized by X-ray photoelectron spectroscopy (XPS) andRaman spectroscopy (Fig. 1i–k and Supplementary Section 3). TEMmeasurements showed nanosheet sizes in the 300–800 nm rangeand AFM of surfactant-exfoliated samples gave typical thicknesses,NG, of less than 10 monolayers per nanosheet (〈NG〉∼5–8)(Supplementary Section 3). The presence of monolayers wasconfirmed by Raman spectroscopy (Fig. 1i, inset). For filmsprepared from NMP-exfoliated graphene, XPS showed no evidenceof oxidation and Raman spectroscopy reproducibly showed 2D
bands (Fig. 1k, inset) consistent with NG between 4 and 7 anda relatively weak, narrow D band (Supplementary Section 3).The Raman D/G band intensity ratio is proportional to inversenanosheet length22 and the D/D′ band intensity ratio23 is ∼4(Supplementary Section 3). Taken together, these data show the Dband to be dominated by nanosheet edge contributions and confirmthat no basal-plane defects are introduced during exfoliation22,23
(Supplementary Section 3). As shown in Fig. 1l, these propertieswere relatively invariant with mixing parameters indicating thatwell-exfoliated, non-oxidized, defect-free graphene can be producedusing a broad range of mixing conditions. We note that these flakesare virtually indistinguishable from those produced by sonicationboth in terms of size and quality10.
The exfoliation mechanismConsidering the exfoliation mechanism, our initial expectation wasthat localized, turbulent, highly dissipative regions were responsiblefor exfoliation24,25. However, we found turbulent energy dissipationto be unnecessary. Figure 2a maps the combinations of N andD that result in exfoliation: graphene is produced not only forturbulent, high-Reynolds-number (Re) scenarios, but also forcombinations that give ReMixer=ND2ρ/η<104, where turbulence isnot fully developed26 (ρ and η are the liquid density and viscosityrespectively). To determine whether graphene could be producedin the complete absence of turbulence, that is, under high-shearlaminar flow, we shear-mixed graphite and NMP in a Couette(a concentric cylinder-based rheological cell, radius R= 14mm,thickness d = 0.1mm, rotation frequency of inner wall ω: shearrate γ̇ ≈ Rω/d , Supplementary Section 7). TEM confirmed thatgraphene was produced, with concentration increasing with time ast 0.69 (Fig. 2b). Interestingly, we found graphene in the Couette only
NATUREMATERIALS | VOL 13 | JUNE 2014 | www.nature.com/naturematerials 625
© 2014 Macmillan Publishers Limited. All rights reserved

ARTICLES NATURE MATERIALS DOI: 10.1038/NMAT3944
103 1040.4
0.6
0.8
L (μ
m)
N (r.p.m.)
LCF = 900 nm
103 104 105
1
10
C (μ
g m
l−1)
Shear rate (s−1)
b
d e
a c
0 50 100 1500
1
2
3
4
5Laminar flow
C (μ
g m
l−1)
t (min)
∼t0.69
Laminar flow
104 105
10−2
10−3
10−5
D = 32 mmD = 16 mmD = 12 mm
C 1 m
in (m
g m
l−1)
Shear rate (s−1)
10 20 30 40102
103
104
Well-exfoliated graphenePoorly exfoliated/no graphene
N (r
.p.m
.)
D (mm)
ReMixer = 10 4
f
100 nm
200 nm
10−4
= 104 s−1
|ES,G – ES,S| = 1.6 mJ m−2
⋅γ
Figure 2 | Characterization of the exfoliation mechanism. a, Phase diagram of rotor speed, N, versus diameter, D, for dispersions showing good exfoliationaccording to TEM. The region above the black line represents fully developed turbulence, that is, ReMixer> 104, whereas the region above the red linerepresents γ̇min> 104 s−1. b, Concentration (after centrifugation) of graphene produced in a rotating Couette as a function of mixing time (rotation rate3,000 r.p.m.). Inset: TEM of Couette-produced graphene. c, Concentration (after centrifugation) of graphene produced in a rotating Couette as a functionof shear rate (mixing time 60 min). d, Concentration of graphene produced in the Silverson shear mixer as a function of shear rate for rotors with diametersof 32, 16 and 12 mm (mixing time 1 min). All of three data sets are consistent with the same minimum shear rate. e, Mean flake length plotted versus rotorspeed, N (Ci=50 mg ml−1; t=20 min; V=4.5 l; D=32 mm). The error bars represent the standard error associated with∼100 measurements. The solidline is a fit to equation (2); fit constants are given in the panel. f, TEM image of partially exfoliated BN flake, consistent with exfoliation by shear sliding.
above aminimum shear rate of γ̇min≈104 s−1 (Fig. 2c). However, thisrate is low enough to give a Re well within the laminar flow regime(γ̇min=104 s−1: ReCouette= γ̇ d2ρ/η=60; ref. 27) showing turbulenceto be unnecessary for exfoliation.
To determine whether a minimum shear rate is a generalrequirementwe prepared graphene in the shearmixer at a number ofdifferent N and D combinations. The concentration produced after1 minmixing, C1min, is plotted against the shear rate (γ̇ ≈πND/1R,where 1R is the rotor–stator gap) in Fig. 2d. This suggests aminimum shear rate of γ̇min ≈ 104 s−1, implying that the sameexfoliation mechanism occurs in both laminar and turbulentregimes. We note that all of the well-exfoliated samples in Fig. 2aare consistent with γ̇min>104 s−1. This suggests that any mixer thatcan achieve this shear rate can be used to produce graphene. Wedemonstrate this to be true by using a Kenwood kitchen blenderto produce graphene. Here, exfoliation occurs because the rapidlyrotating blade generates local turbulent shear rates significantlylarger than 104 s−1 (Supplementary Section 4).
We can understand these processes by modelling exfoliationas shear-induced interlayer sliding in a solvent21 (SupplementarySection 7). This predicts a minimum shear rate given by:
γ̇min=
[√ES,G−
√ES,L
]2ηL
(1)
where ES,G and ES,L are the surface energies of graphene andliquid (ES,L= 69mJm−2 for NMP; ref. 10), η is the liquid viscosity(0.0017 Pa s forNMP) and L is the flake length. This equation clearlyshows the role of the solvent: for solvents with surface energiesmatching graphene, the exfoliation energy is minimized, facilitatingshear exfoliation at low shear rates. Given the flake size measuredby TEM (∼300–800 nm) and γ̇min= 104 s−1, equation (1) predictsES,G≈70.5–71mJm−2, very close to the expected value10.
Equation (1) can be rewritten to express the minimum flakesize that can be produced by shear exfoliation at a given γ̇
(Supplementary Section 8). Then, the average flake size, 〈L〉, isapproximately the mean of this value and the maximum flake sizeretained after centrifugation, LCF. Writing the resultant equation interms of N and D rather than γ̇ :
〈L〉≈1R
[√ES,G−
√ES,L
]22ηπND
+LCF
2(2)
Shown in Fig. 2e are data for mean flake length measured by TEMas a function of N (Supplementary Section 8). Equation (2) fits thedata extremely well and gives ES,G≈70.6mJm−2 and LCF=900 nm,close to expected values. We note that this expression also fits thedata for L as a function of D (Supplementary Section 8).
This mechanism is general and does not apply only to graphite.In fact, we were able to exfoliate BN, WS2, MoSe2 and MoTe2in NMP using this mixer (Supplementary Section 5 and below).Shown in Fig. 2f is a TEM image of a partially exfoliated BN flakeexhibiting laterally displaced layers consistent with the proposedshear exfoliation method21.
Scaling up shear exfoliationIt is important to understand what controls the amount ofgraphene produced, with the aim of maximizing the productionrate by scale-up. As properties of shear-mixed dispersions tend toscale with processing parameters as power laws28,29, the grapheneconcentration should scale as
C∝Cχ
i tτN nDdV v (3)
To test this, we prepared a wide range of dispersions, controllablyvarying all five mixing parameters. These were centrifuged andthe graphene concentration measured optically (SupplementarySection 4). Keeping Ci, N , D and V constant but varying t showedC∝ t τ , where τ is close to 0.66 (Fig. 3a), very similar to the Couetteexponent (see above and Supplementary Section 7). We note that
626 NATUREMATERIALS | VOL 13 | JUNE 2014 | www.nature.com/naturematerials
© 2014 Macmillan Publishers Limited. All rights reserved

NATURE MATERIALS DOI: 10.1038/NMAT3944 ARTICLES
10 100
10−2
10−1
V = 1,500 ml,Ci = 50 mg ml–1,D = 32 mm
Ci = 50 mg ml–1,N = 4,500 r.p.m.,D = 32 mm
V = 1,500 ml, Ci = 50 mg ml−1
V = 1,500 ml, N = 4,500 r.p.m., D = 32 mm
V = 1,500 ml, Ci = 50 mg ml−1,N = 4,500 r.p.m., D = 32 mm
C (m
g m
l−1)
t (min)
tsat
Nmin
V = 490 ml, Ci = 50 mg ml−1, N = 4,500 r.p.m., D = 32 mm
0.66
0.1 1.0
103
104
t sat (
s)
a
VN−1D−3 (s)
b
100 101 102
10−4
10−3
10−2
Ci (mg ml−1)
C 1 m
in (m
g m
l−1)
1.0
1.0
10 20 30 40
4,500 r.p.m.5,700 r.p.m.7,000 r.p.m.
D (mm)
2.28
103 104
10−5
10−4
10−3
10−2
C 1 m
in (m
g m
l−1)
N (r.p.m.)
1.13
102 103 10410−3
10−2
10−3
10−2
1 l beaker3 l beaker5 l beakerGeometricallysimilar beakers
C 1 m
in (m
g m
l−1)
C 1 m
in (m
g m
l−1)
V (ml)
−0.68
c
ed f
Figure 3 | Scaling of graphene production using a shear mixer. a, Dispersed concentration, C, (after centrifugation) plotted as a function of mixing time, t.The lines denote behaviour of the type: C∝ tτ , where τ is always close to 0.66. b, Graph of the measured values of saturation time, tsat, plotted versuspumping time VN−1D−3. c–f, Values of graphene concentration after 1 min of mixing, C1 min, plotted against initial graphite concentration, Ci (c); rotordiameter, D (d); mixing speed, N (e) and liquid volume, V (f). In c–f the mixing parameters are given in the panels. In e, the minimum required mixingspeed, Nmin, is indicated by the arrow. In f, a number of beakers of di�erent capacity, holding a range of liquid volumes, were used. Geometrically similardenotes beakers holding a specific liquid volume such that the liquid height was equal to the diameter of the beaker. The slope of the fit line is given in eachpanel. In all cases the errors are standard errors associated with multiple measurements as described in the Supplementary Information.
sonication-exfoliation of graphene in solvents givesC∝ t 1/2 (ref. 22),suggesting that time exponents close to 0.5–0.7 may be process-independent and so represent more fundamental behaviour.
In some cases,C saturated for times above a maximum value, tsat,setting a maximummixing time. We found tsat to be proportional toVN−1D−3 (Fig. 3b), a quantity related to the time for the tank volumeto be pumped through the rotor/stator once30. Measurements of Cversus t allowed the calculation of a representative concentrationfor example, that achieved after 1 min mixing, C1min. Measurementsof C1min for different combinations of Ci, D, N and V (Fig. 3c–f)showed that power-law behaviour was observed with exponents:χ=1.0, d=2.28, ν=−0.68.When varyingN , power-law behaviour(n=1.13) was only observed above a minimum r.p.m., Nmin, whichis associated with the minimum shear rate described above.
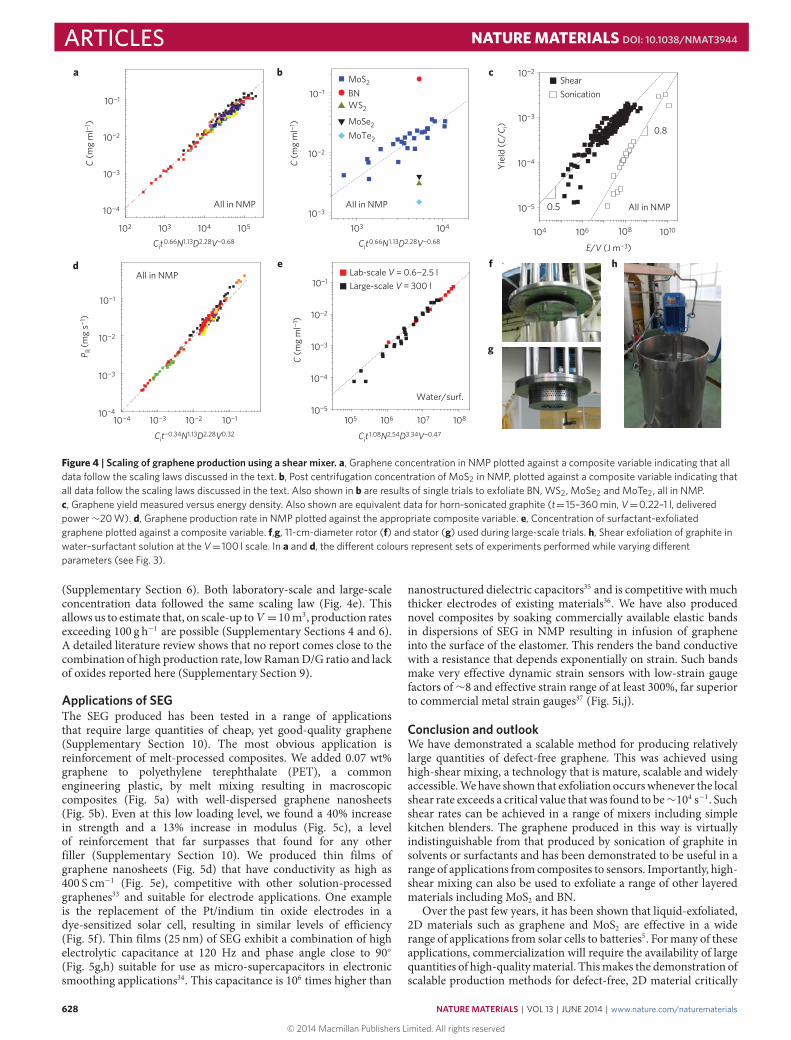
As a result of these scaling laws, the concentration data shouldfall on a master curve when plotted against the scaling factorCit 0.66N 1.13D2.28V−0.68, as confirmed in Fig. 4a. These exponentsare not specific to graphene; we plotted the concentration ofMoS2 exfoliated in NMP versus Cit 0.66N 1.13D2.28V−0.68 (that is, usingthe same exponents as graphene in NMP) finding reasonablelinearity (Fig. 4b).
Studies on the breakage of ceramic materials in rotor statormixers have suggested a link between particle concentration andtotal energy dissipated per volume31,32. The power dissipated by arotor/stator mixer is given by P=NPρN 3D5 where ρ is the solventdensity and NP≈ 2 (ref. 26,28). This expression, coupled with theexponents measured for mixing in NMP, suggest equation (3) tobe approximately equivalent to Y = C/Ci ∝
√E/V , where Y is
the graphene yield and E/V is the total energy dissipated perunit volume (Supplementary Section 9). Plotting Y versus E/Vconfirms this to be approximately true (Fig. 4c). This allows usto compare shear exfoliation to sonication-induced exfoliation(Fig. 4c), showing shear exfoliation to be considerablymore efficientthan ultrasonic exfoliation, becoming more so as the volume isincreased (Supplementary Section 9). In addition to its inherentscalability, this result shows that shear exfoliation gives much
larger quantities of graphene at lower energy cost than is possiblewith sonication-induced exfoliation. It is worth noting that theexfoliation yields are relatively low at<0.1%. However, by recyclinggraphitic sediment at least 3% of the graphite can be transformedinto graphene (Supplementary Section 4).Moreover, the yieldmightbe enhanced markedly by careful choice of the starting graphitematerial or optimization of the rotor.
For commercial production, the most important parameter isthe graphene production rate: PR=VC/t . Figure 4d demonstratesa master curve of production rate plotted versus the scalingfactor Cit τ−1N nDdV v+1 with exponents as above. The maximumproduction rate achieved in laboratory trials was 1.44 g h−1 (forshort mixing times), far higher than any rate previously achieved forsolution processed defect-free graphene (Supplementary Section 9).
It will be more straightforward to scale-up shear exfoliation ofgraphene in aqueous rather than organic solvent environments.Thus, for large-scale studies, we focused on exfoliation by mixing inaqueous solutions of the surfactant NaC (although polymers suchas polyvinylalcohol can also be used, see Supplementary Section 4).For both polymer- and surfactant-stabilized graphene, scalingbehaviourwas found (Supplementary Sections 4 and 6)with the datafor graphene exfoliated in NaC shown in Fig. 4e. Here the scalingexponents are slightly different with C ∝ Cit 1.08N 2.54D3.34V−0.47,possibly reflecting mechanistic differences.
On scale-up, the mixing time should be fixed at tsat∝VN−1D−3,and the rotor/stator diameter should be scaled in proportion totank size (D∝V 1/3, see Supplementary Section 4). This predictsPR∝V v+1+d/3, giving PR∝V 1.1 for NMP and PR∝V 1.6 for surfactant,confirming that production rate can be increased by scaling upthe mixing volume. We performed large-scale trials (Fig. 4f–h),mixing in surfactant solution (Ci = 100mgml−1, t=5min–4 h,N = 3,000 r.p.m., D = 11 cm), with volumes up to V = 300 l(Supplementary Section 6). This yielded up to 21 g of high-quality graphene (Raman D/G ratio of 0.18) per batch withconcentrations up to C = 0.07mgml−1 and production rates ashigh as PR= 5.3 g h−1, significantly better than any reported work
NATUREMATERIALS | VOL 13 | JUNE 2014 | www.nature.com/naturematerials 627
© 2014 Macmillan Publishers Limited. All rights reserved
ARTICLES NATURE MATERIALS DOI: 10.1038/NMAT3944
g
102
10−1
103 104 105
10−4
10−3
10−2
All in NMP
C (m
g m
l−1)
Cit0.66N1.13D2.28V−0.68
103 104
10−1
10−3
10−2
All in NMP
b
Cit0.66N1.13D2.28V−0.68
MoS2
BNWS2
MoSe2
MoTe2
C (m
g m
l−1)
Water/surf.
105 106 107 108
Cit 1.08N2.54D3.34V−0.47
10−5
10−4
10−3
10−2
10−1Lab-scale V = 0.6−2.5 lLarge-scale V = 300 l
C (m
g m
l−1)
10−4 10−3 10−2 10−1
All in NMP
Cit−0.34N1.13D2.28V0.32
P R (m
g s−1
)
10−4
10−3
10−2
10−1
104 106 108 1010
All in NMP
a c
0.8
0.510−5
10−4
10−3
10−2ShearSonication
Yiel
d (C
/Ci)
E/V (J m−3)
d e f h
Figure 4 | Scaling of graphene production using a shear mixer. a, Graphene concentration in NMP plotted against a composite variable indicating that alldata follow the scaling laws discussed in the text. b, Post centrifugation concentration of MoS2 in NMP, plotted against a composite variable indicating thatall data follow the scaling laws discussed in the text. Also shown in b are results of single trials to exfoliate BN, WS2, MoSe2 and MoTe2, all in NMP.c, Graphene yield measured versus energy density. Also shown are equivalent data for horn-sonicated graphite (t= 15–360 min, V=0.22–1 l, deliveredpower∼20 W). d, Graphene production rate in NMP plotted against the appropriate composite variable. e, Concentration of surfactant-exfoliatedgraphene plotted against a composite variable. f,g, 11-cm-diameter rotor (f) and stator (g) used during large-scale trials. h, Shear exfoliation of graphite inwater–surfactant solution at the V= 100 l scale. In a and d, the di�erent colours represent sets of experiments performed while varying di�erentparameters (see Fig. 3).
(Supplementary Section 6). Both laboratory-scale and large-scaleconcentration data followed the same scaling law (Fig. 4e). Thisallows us to estimate that, on scale-up toV =10m3, production ratesexceeding 100 g h−1 are possible (Supplementary Sections 4 and 6).A detailed literature review shows that no report comes close to thecombination of high production rate, lowRamanD/G ratio and lackof oxides reported here (Supplementary Section 9).
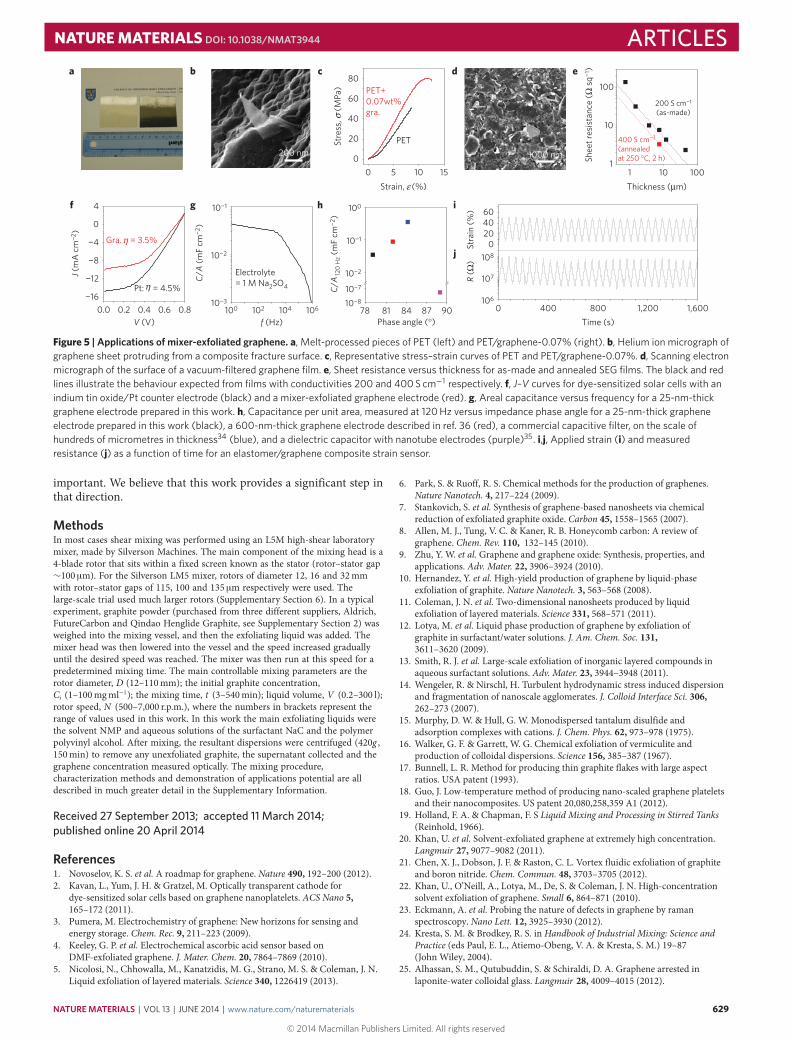
Applications of SEGThe SEG produced has been tested in a range of applicationsthat require large quantities of cheap, yet good-quality graphene(Supplementary Section 10). The most obvious application isreinforcement of melt-processed composites. We added 0.07 wt%graphene to polyethylene terephthalate (PET), a commonengineering plastic, by melt mixing resulting in macroscopiccomposites (Fig. 5a) with well-dispersed graphene nanosheets(Fig. 5b). Even at this low loading level, we found a 40% increasein strength and a 13% increase in modulus (Fig. 5c), a levelof reinforcement that far surpasses that found for any otherfiller (Supplementary Section 10). We produced thin films ofgraphene nanosheets (Fig. 5d) that have conductivity as high as400 S cm−1 (Fig. 5e), competitive with other solution-processedgraphenes33 and suitable for electrode applications. One exampleis the replacement of the Pt/indium tin oxide electrodes in adye-sensitized solar cell, resulting in similar levels of efficiency(Fig. 5f). Thin films (25 nm) of SEG exhibit a combination of highelectrolytic capacitance at 120 Hz and phase angle close to 90◦(Fig. 5g,h) suitable for use as micro-supercapacitors in electronicsmoothing applications34. This capacitance is 106 times higher than
nanostructured dielectric capacitors35 and is competitive withmuchthicker electrodes of existing materials36. We have also producednovel composites by soaking commercially available elastic bandsin dispersions of SEG in NMP resulting in infusion of grapheneinto the surface of the elastomer. This renders the band conductivewith a resistance that depends exponentially on strain. Such bandsmake very effective dynamic strain sensors with low-strain gaugefactors of∼8 and effective strain range of at least 300%, far superiorto commercial metal strain gauges37 (Fig. 5i,j).
Conclusion and outlookWe have demonstrated a scalable method for producing relativelylarge quantities of defect-free graphene. This was achieved usinghigh-shear mixing, a technology that is mature, scalable and widelyaccessible.Wehave shown that exfoliation occurswhenever the localshear rate exceeds a critical value that was found to be∼104 s−1. Suchshear rates can be achieved in a range of mixers including simplekitchen blenders. The graphene produced in this way is virtuallyindistinguishable from that produced by sonication of graphite insolvents or surfactants and has been demonstrated to be useful in arange of applications from composites to sensors. Importantly, high-shear mixing can also be used to exfoliate a range of other layeredmaterials including MoS2 and BN.
Over the past few years, it has been shown that liquid-exfoliated,2D materials such as graphene and MoS2 are effective in a widerange of applications from solar cells to batteries5. Formany of theseapplications, commercialization will require the availability of largequantities of high-qualitymaterial. Thismakes the demonstration ofscalable production methods for defect-free, 2D material critically
628 NATUREMATERIALS | VOL 13 | JUNE 2014 | www.nature.com/naturematerials
© 2014 Macmillan Publishers Limited. All rights reserved
NATURE MATERIALS DOI: 10.1038/NMAT3944 ARTICLES
100 102 104 10610−3
10−2
g 10−1C/
A (m
F cm
−2)
f (Hz)
Electrolyte= 1 M Na2SO4
f
0.0 0.2 0.4 0.6 0.8−16
−12
−8
−4
0
4
Gra. = 3.5%
J (m
A c
m−2
)
V (V)
Pt: = 4.5%
h
78 81 84 87 9010−8
10−7
10−2
10−1
100
C/A
120
Hz (
mF
cm−2
)Phase angle (°)
a
0 5 10 150
20
40
60
80PET+0.07wt%gra.
Stre
ss,
(M
Pa)
Strain, (%)
PET
c
i
j
200
4060
R (Ω
)
0 400 800 1,200 1,600106
107
108
Stra
in (%
)
Time (s)
b
200 nm
1 10 1001
10
100
Shee
t res
ista
nce
(Ω s
q−1)
Thickness (μm)
200 S cm−1
(as-made)
400 S cm−1
(annealedat 250 °C, 2 h)
ed
1000 nm
ε
σ
η
η
Figure 5 | Applications of mixer-exfoliated graphene. a, Melt-processed pieces of PET (left) and PET/graphene-0.07% (right). b, Helium ion micrograph ofgraphene sheet protruding from a composite fracture surface. c, Representative stress–strain curves of PET and PET/graphene-0.07%. d, Scanning electronmicrograph of the surface of a vacuum-filtered graphene film. e, Sheet resistance versus thickness for as-made and annealed SEG films. The black and redlines illustrate the behaviour expected from films with conductivities 200 and 400 S cm−1 respectively. f, J–V curves for dye-sensitized solar cells with anindium tin oxide/Pt counter electrode (black) and a mixer-exfoliated graphene electrode (red). g, Areal capacitance versus frequency for a 25-nm-thickgraphene electrode prepared in this work. h, Capacitance per unit area, measured at 120 Hz versus impedance phase angle for a 25-nm-thick grapheneelectrode prepared in this work (black), a 600-nm-thick graphene electrode described in ref. 36 (red), a commercial capacitive filter, on the scale ofhundreds of micrometres in thickness34 (blue), and a dielectric capacitor with nanotube electrodes (purple)35. i,j, Applied strain (i) and measuredresistance (j) as a function of time for an elastomer/graphene composite strain sensor.
important. We believe that this work provides a significant step inthat direction.
MethodsIn most cases shear mixing was performed using an L5M high-shear laboratorymixer, made by Silverson Machines. The main component of the mixing head is a4-blade rotor that sits within a fixed screen known as the stator (rotor–stator gap∼100 µm). For the Silverson LM5 mixer, rotors of diameter 12, 16 and 32mmwith rotor–stator gaps of 115, 100 and 135 µm respectively were used. Thelarge-scale trial used much larger rotors (Supplementary Section 6). In a typicalexperiment, graphite powder (purchased from three different suppliers, Aldrich,FutureCarbon and Qindao Henglide Graphite, see Supplementary Section 2) wasweighed into the mixing vessel, and then the exfoliating liquid was added. Themixer head was then lowered into the vessel and the speed increased graduallyuntil the desired speed was reached. The mixer was then run at this speed for apredetermined mixing time. The main controllable mixing parameters are therotor diameter, D (12–110mm); the initial graphite concentration,Ci (1–100mgml−1); the mixing time, t (3–540min); liquid volume, V (0.2–300 l);rotor speed, N (500–7,000 r.p.m.), where the numbers in brackets represent therange of values used in this work. In this work the main exfoliating liquids werethe solvent NMP and aqueous solutions of the surfactant NaC and the polymerpolyvinyl alcohol. After mixing, the resultant dispersions were centrifuged (420g ,150min) to remove any unexfoliated graphite, the supernatant collected and thegraphene concentration measured optically. The mixing procedure,characterization methods and demonstration of applications potential are alldescribed in much greater detail in the Supplementary Information.
Received 27 September 2013; accepted 11 March 2014;published online 20 April 2014
References1. Novoselov, K. S. et al. A roadmap for graphene. Nature 490, 192–200 (2012).2. Kavan, L., Yum, J. H. & Gratzel, M. Optically transparent cathode for
dye-sensitized solar cells based on graphene nanoplatelets. ACS Nano 5,165–172 (2011).
3. Pumera, M. Electrochemistry of graphene: New horizons for sensing andenergy storage. Chem. Rec. 9, 211–223 (2009).
4. Keeley, G. P. et al. Electrochemical ascorbic acid sensor based onDMF-exfoliated graphene. J. Mater. Chem. 20, 7864–7869 (2010).
5. Nicolosi, N., Chhowalla, M., Kanatzidis, M. G., Strano, M. S. & Coleman, J. N.Liquid exfoliation of layered materials. Science 340, 1226419 (2013).
6. Park, S. & Ruoff, R. S. Chemical methods for the production of graphenes.Nature Nanotech. 4, 217–224 (2009).
7. Stankovich, S. et al. Synthesis of graphene-based nanosheets via chemicalreduction of exfoliated graphite oxide. Carbon 45, 1558–1565 (2007).
8. Allen, M. J., Tung, V. C. & Kaner, R. B. Honeycomb carbon: A review ofgraphene. Chem. Rev. 110, 132–145 (2010).
9. Zhu, Y. W. et al. Graphene and graphene oxide: Synthesis, properties, andapplications. Adv. Mater. 22, 3906–3924 (2010).
10. Hernandez, Y. et al.High-yield production of graphene by liquid-phaseexfoliation of graphite. Nature Nanotech. 3, 563–568 (2008).
11. Coleman, J. N. et al. Two-dimensional nanosheets produced by liquidexfoliation of layered materials. Science 331, 568–571 (2011).
12. Lotya, M. et al. Liquid phase production of graphene by exfoliation ofgraphite in surfactant/water solutions. J. Am. Chem. Soc. 131,3611–3620 (2009).
13. Smith, R. J. et al. Large-scale exfoliation of inorganic layered compounds inaqueous surfactant solutions. Adv. Mater. 23, 3944–3948 (2011).
14. Wengeler, R. & Nirschl, H. Turbulent hydrodynamic stress induced dispersionand fragmentation of nanoscale agglomerates. J. Colloid Interface Sci. 306,262–273 (2007).
15. Murphy, D. W. & Hull, G. W. Monodispersed tantalum disulfide andadsorption complexes with cations. J. Chem. Phys. 62, 973–978 (1975).
16. Walker, G. F. & Garrett, W. G. Chemical exfoliation of vermiculite andproduction of colloidal dispersions. Science 156, 385–387 (1967).
17. Bunnell, L. R. Method for producing thin graphite flakes with large aspectratios. USA patent (1993).
18. Guo, J. Low-temperature method of producing nano-scaled graphene plateletsand their nanocomposites. US patent 20,080,258,359 A1 (2012).
19. Holland, F. A. & Chapman, F. S Liquid Mixing and Processing in Stirred Tanks(Reinhold, 1966).
20. Khan, U. et al. Solvent-exfoliated graphene at extremely high concentration.Langmuir 27, 9077–9082 (2011).
21. Chen, X. J., Dobson, J. F. & Raston, C. L. Vortex fluidic exfoliation of graphiteand boron nitride. Chem. Commun. 48, 3703–3705 (2012).
22. Khan, U., O’Neill, A., Lotya, M., De, S. & Coleman, J. N. High-concentrationsolvent exfoliation of graphene. Small 6, 864–871 (2010).
23. Eckmann, A. et al. Probing the nature of defects in graphene by ramanspectroscopy. Nano Lett. 12, 3925–3930 (2012).
24. Kresta, S. M. & Brodkey, R. S. in Handbook of Industrial Mixing: Science andPractice (eds Paul, E. L., Atiemo-Obeng, V. A. & Kresta, S. M.) 19–87(John Wiley, 2004).
25. Alhassan, S. M., Qutubuddin, S. & Schiraldi, D. A. Graphene arrested inlaponite-water colloidal glass. Langmuir 28, 4009–4015 (2012).
NATUREMATERIALS | VOL 13 | JUNE 2014 | www.nature.com/naturematerials 629
© 2014 Macmillan Publishers Limited. All rights reserved

ARTICLES NATURE MATERIALS DOI: 10.1038/NMAT3944
26. Utomo, A. T., Baker, M. & Pacek, A. W. Flow pattern, periodicity and energydissipation in a batch rotor-stator mixer. Chem. Eng. Res. Des. 86,1397–1409 (2008).
27. Gollub, J. P. & Swinney, H. L. Onset of turbulencein a rotating fluid. Phys. Rev.Lett. 35, 927–930 (1975).
28. Hall, S., Cooke, M., Pacek, A. W., Kowalski, A. J. & Rothman, D. Scaling up ofSilverson rotor-stator mixers. Can. J. Chem. Eng. 89, 1040–1050 (2011).
29. Leng, D. E. & Calabrese, R. V. in Handbook of Industrial Mixing: Science andPractice (eds Paul, E. L., Atiemo-Obeng, V. A. & Kresta, S. M.) 639–753(John Wiley, 2004).
30. Doran, P. M. Bioprocess Engineering Principles (Academic, 1995).31. Ozcan-Taskin, N. G., Padron, G. & Voelkel, A. Effect of particle type on the
mechanisms of break up of nanoscale particle clusters. Chem. Eng. Res. Des. 87,468–473 (2009).
32. Pohl, M. & Schubert, H. Proceedings of the International Congress for ParticleTechnology 1–4 (Partec, 2004).
33. De, S. & Coleman, J. N. Are there fundamental limitations on the sheetresistance and transmittance of thin graphene films? ACS Nano 4,2713–2720 (2010).
34. Lin, J. et al. 3-dimensional graphene carbon nanotube carpet-basedmicrosupercapacitors with high electrochemical performance. Nano Lett. 13,72–78 (2013).
35. Sorel, S., Khan, U. & Coleman, J. N. Flexible, transparent dielectric capacitorswith nanostructured electrodes. Appl. Phys. Lett. 101, 103106 (2012).
36. Miller, J. R., Outlaw, R. A. & Holloway, B. C. Graphene double-layer capacitorwith ac line-filtering performance. Science 329, 1637–1639 (2010).
37. Li, X. et al. Stretchable and highly sensitive graphene-on-polymer strainsensors. Scientific Rep. 2, 870 (2012).
AcknowledgementsWe thank Science Foundation Ireland (11/PI/1087), the European Research Council(SEMANTICS and 2DNanoCaps), the Graphene Flagship Project (no. 604391) andThomas Swan for financial support. We acknowledge SuperSTEM and the CRANNAdvanced Microscopy Laboratory for technical support.
Author contributionsK.R.P., E.V. and P.P. performed the shear mixing and other experiments. A.O’N., M.L.,P.M., R.J.S., H.P., E.L., J.C., S.E.O’B., B.M.S., E.Mc.G., T.J.P. and V.N. performed electronmicroscopy characterization and analysis. C.D. and A.C. performed XPS characterizationand analysis. U.K., C. Boland, O.M.I., P.K., T.H. and I.A. performed applicationsmeasurements. C. Backes, N.Mc.E. and G.S.D. performed Raman and AFM analysis.S.B. and M.M. performed rheological characterization and analysis. J.N.C. designed theexperiments, derived the models and wrote the paper.
Additional informationSupplementary information is available in the online version of the paper. Reprints andpermissions information is available online at www.nature.com/reprints.Correspondence and requests for materials should be addressed to J.N.C.
Competing financial interestsThe authors declare no competing financial interests.
Keith R. Paton1,2, Eswaraiah Varrla1,3, Claudia Backes1,3, Ronan J. Smith1,3, Umar Khan1,3, Arlene O’Neill1,3, Conor Boland1,3,Mustafa Lotya1,3, Oana M. Istrate1,3, Paul King1,3, Tom Higgins1,3, Sebastian Barwich1,3, Peter May1,3, Pawel Puczkarski1,3,Iftikhar Ahmed3, Matthias Moebius3, Henrik Pettersson1,3, Edmund Long1,3, João Coelho1,4, Sean E. O’Brien1,3,Eva K. McGuire1,3, Beatriz Mendoza Sanchez1,4, Georg S. Duesberg1,4, Niall McEvoy1,4, Timothy J. Pennycook5,6,Clive Downing1, Alison Crossley6, Valeria Nicolosi1,3,4 and Jonathan N. Coleman1,3*1Centre for Research on Adaptive Nanostructures and Nanodevices (CRANN), Trinity College Dublin, Dublin 2, Ireland, 2Thomas Swan and CompanyLimited, Rotary Way, Consett DH8 7ND, UK, 3School of Physics, Trinity College Dublin, Dublin 2, Ireland, 4School of Chemistry, Trinity College Dublin,Dublin 2, Ireland, 5SuperSTEM, STFC Daresbury Laboratories, Keckwick Lane, Warrington WA4 4AD, UK, 6Department of Materials, University of Oxford,Parks Road, Oxford OX1 3PH, UK. *e-mail: [email protected]
630 NATUREMATERIALS | VOL 13 | JUNE 2014 | www.nature.com/naturematerials
© 2014 Macmillan Publishers Limited. All rights reserved