scalable visualization and interaction for c berfor cyber...
TRANSCRIPT

UC Santa Barbara
Scalable Visualization and Interaction for C ber Mission A arenessfor Cyber-Mission Awareness
ARO MURI on Cyber Situation AwarenessKick Off Meeting
Tobias HöllererFour Eyes Laboratory (Imaging, Interaction, and Innovative Interfaces), Computer Science Department, Media Arts & Technology Program,UC Santa Barbara

Fi K C tUC Santa Barbara
Five Key Concepts
1. Up-to-date views of the available cyber-assets2. A comprehensive analysis of the dependencies
between cyber missions and cyber assetsbetween cyber-missions and cyber-assets,3. An accurate understanding of the impact of cyber-
attacks4. Actionable cyber-attack forecasts5. A semantically-rich, easy-to-grasp view of the cyber-
i i t tmission status.

A hUC Santa Barbara
Approach
Scalable Visualization and Interaction
• Effective information and knowledge presentation by tailoringEffective information and knowledge presentation by tailoringinterfaces to user’s information needs, context, and cognitive state.
– User models (e.g. war fighters, network security officers, command center personnel)– Display and interaction platforms (mobile interfaces, desktop, immersive situation rooms)
• Our integrative framework and the data structures we will share (from data modeling and acquisition, extraction and abstraction, and analysis and presentation) enables such dynamic tailoringand analysis and presentation) enables such dynamic tailoring.
• Users will be able to interactively explore the information l dlandscape.
3

Usability EngineeringUC Santa Barbara
Usability Engineering
• Domain analysis User Analysis, Task Analysis• Identify scenarios to drive user & system requirements• Platform Recommendations
D l S l bl Vi li ti T h i
4
Develop Scalable Visualization TechniquesSupport Interactive “What-If” Analysis

D t M d lUC Santa Barbara
Data Models
ThreadReconstructionAlert VerificationAlert FusionPre-ProcessingNormalizationSensor Alerts
Mission Model Cyber-AssetsModel
Attack Sessionzatio
n
Reconstruction
aren
ess
Visu
aliz
Impact AnalysisCyber-Triaging Multi-StepCorrelation
FocusRecognition
COAs
Situ
atio
n Aw
a

M bil Pl tfUC Santa Barbara
Mobile Platforms

D kt I t fUC Santa Barbara
Desktop Interfaces

Application: Interactive
UC Santa BarbaraNetwork Health Monitoring

W b I t fUC Santa Barbara
Web Interfaces
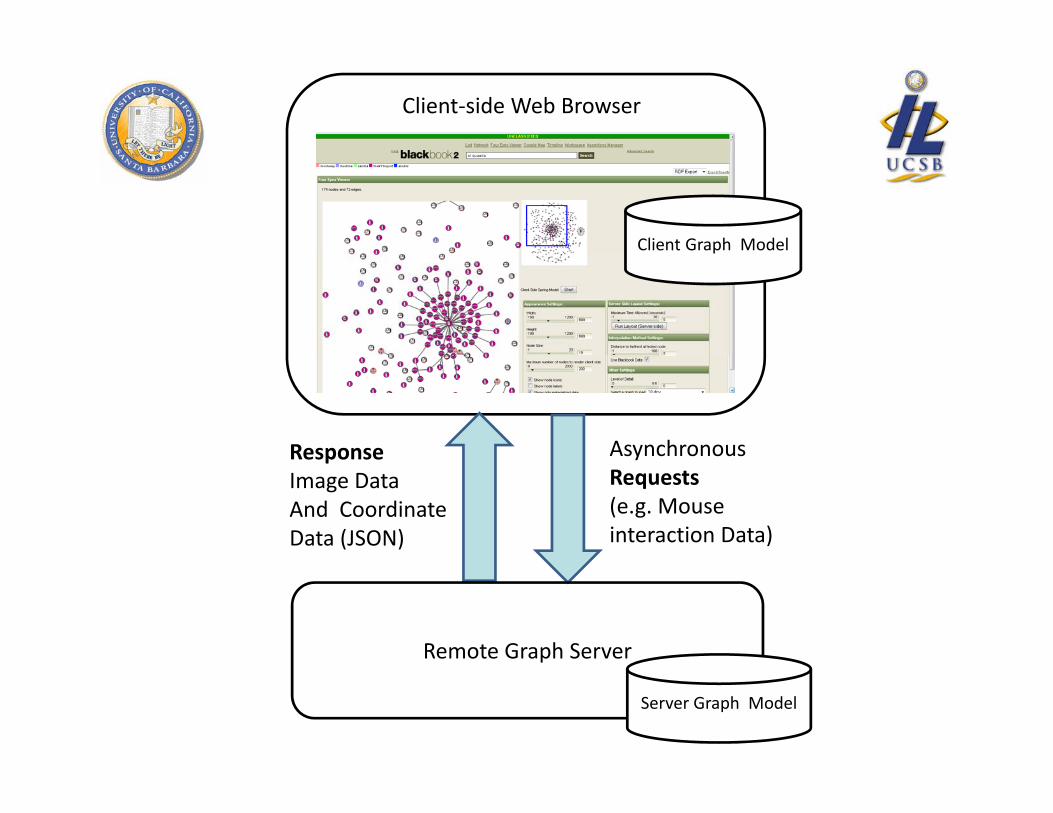
Client‐side Web Browser
Remote Graph Server Client Graph Modelp p
Asynchronous Response yRequests(e.g. Mouse interaction Data)
ResponseImage DataAnd Coordinate Data (JSON)
Remote Graph Server
Server Graph Model

Scalable Graph VisualizationUC Santa Barbara
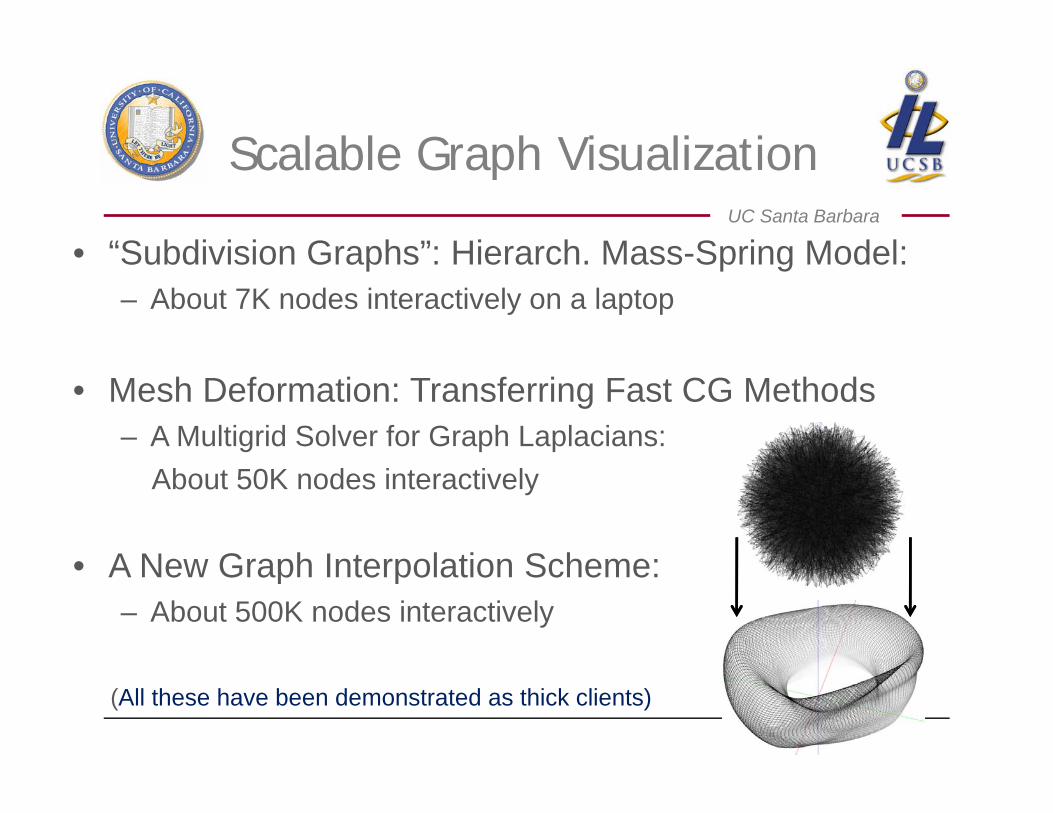
Scalable Graph Visualization
• “Subdivision Graphs”: Hierarch Mass Spring Model:• Subdivision Graphs : Hierarch. Mass-Spring Model:– About 7K nodes interactively on a laptop
1111

Scalable Graph VisualizationUC Santa Barbara
• “Subdivision Graphs”: Hierarch Mass Spring Model:
Scalable Graph Visualization
• Subdivision Graphs : Hierarch. Mass-Spring Model:– About 7K nodes interactively on a laptop
• Mesh Deformation: Transferring Fast CG Methods – A Multigrid Solver for Graph Laplacians:
About 50K nodes interactively
1212
Scalable Graph VisualizationUC Santa Barbara
• “Subdivision Graphs”: Hierarch Mass Spring Model:
Scalable Graph Visualization
• Subdivision Graphs : Hierarch. Mass-Spring Model:– About 7K nodes interactively on a laptop
• Mesh Deformation: Transferring Fast CG Methods – A Multigrid Solver for Graph Laplacians:
About 50K nodes interactively
A New Graph Interpolation Scheme:• A New Graph Interpolation Scheme:– About 500K nodes interactively
1313
(All these have been demonstrated as thick clients)

The UCSB Allosphere
Three-story near-to-anechoicThree-story near-to-anechoic sphere, ten meters in diameter, containing a built-in spherical screen and a 7-feet-wide bridge through the center.

Distinguishing Ch t i ti
UC Santa Barbara
Characteristics
• Multi User Environment• Multi-User Environment– Up to 25 analysts on the bridge– Active collaboration possibilities
• Seamless Surround-View Design – Extreme sense of immersion with little encumbrance – Large sweet spotLarge sweet spot
• Multi-modal Interaction Environment – Carefully designed near-to-anechoic chamber, perforated screen
S ti li d di t i id b d t ki d i t ti– Spatialized audio, stereoscopic video, unencumbered tracking and interaction
• High Sensory Resolution– Ideally, eye-limited video resolution, ear-limited audio resolution– Currently, only subset of sphere covered with 4 projectors and 30 speakers

Sit ti l AUC Santa Barbara
Situational Awareness
L S l I i Vi li i• Large-Scale Interactive Visualizations • Remote Presence• Visual Data Mining / Sonification / Exploration:• Visual Data Mining / Sonification / Exploration:
– Geographic Overviews– Timelines– Resources– Threats and Adversary Modeling– Interactive “What-If” Scenarios

User Context & Cognitive StateUC Santa Barbara
User Context & Cognitive State
Example Factors:• How many people are viewing and discussing the visualization simultaneously? • How time critical is the next decision? • Does this situation call for more focus on overview material, or for details? • Is the mission straightforward or riddled with choice points?
• Cognitive Models of Information Intake (and Overload)
• Weigh amount of information to present and cognitive capacity of the• Weigh amount of information to present and cognitive capacity of the audience
18

Other SynergyUC Santa Barbara
Other Synergy
• IARPA KDD Project on Scalable Graph Interaction
• ARL Network Science Center Proposal on Knowledge Discovery in Information Networks (UIUC / UCSB / IBM / SUNY …)
• ONR contract for Evaluating Factors of Immersion for Military Training Simulators
19

C l iUC Santa Barbara
Conclusion
• Scalable Information Presentation– Mobile Platforms– Desktop Environments– Immersive Situation Rooms
• Usability EngineeringC iti M d li– Cognitive Modeling
– Iterative Design– Evaluation
• Support for Interactive Situational Awareness– Resources– Adversary ModelingAdversary Modeling– “What-If” Scenarios
20