sbsta workshop on national systems data improvements: canada’s experience art jaques greenhouse...
TRANSCRIPT

SBSTA Workshop onSBSTA Workshop on National Systems National Systems
Data Improvements: Canada’s Data Improvements: Canada’s ExperienceExperience
Art Jaques
Greenhouse Gas Division
Environment Canada
Bonn, Germany April 13-14 2005

2
Outline of Presentation Key Points Context Data Collection and Improvements- introduction Roles and Responsibilities in Canada’s Inventory Canadian experience with data collection and
improvements: Energy Industrial Processes Agriculture Waste LULUCF Additional Area

3
Key Points Institutional Arrangements are a Pillar for Data
Collection Improvements in quality, comprehensiveness and
availability of data are the key focus of improvements to the Canadian Inventory
Unique Challenges in Land Use, Land-Use Change and Forestry:
New Partnerships to develop estimates Good Practice Guidance requirement for consistency of land
representation, KP requirements for spatially referenced reporting Availability of consistent data sets (across time, space and scales) Gap between research and operational methods

4
Context

5
Canada’s GHG Emissions Profile
N2O7%
PFCs0.4%
CH412.7%
CO278.8%
SF60.5%
HFCs0.4%
2003 Profile
ENERGY INDUSTRIALPROCESSES
SOLVENT &OTHER
PRODUCT USE
AGRICULTURE WASTE Land Use, Land-use Change and
Forestry
1990 2002 2003
6
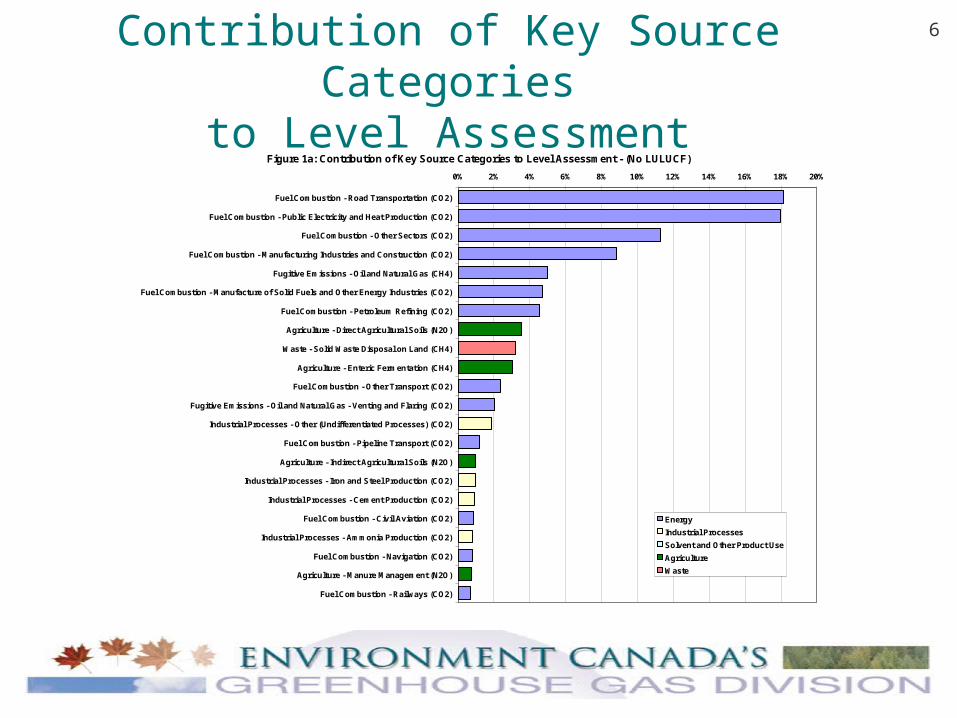
Contribution of Key Source Categoriesto Level Assessment
Figure 1a: Contribution of Key Source Categories to Level Assessment - (No LULUCF)
0% 2% 4% 6% 8% 10% 12% 14% 16% 18% 20%
Fuel Combustion - Road Transportation (CO2)
Fuel Combustion - Public Electricity and Heat Production (CO2)
Fuel Combustion - Other Sectors (CO2)
Fuel Combustion - Manufacturing Industries and Construction (CO2)
Fugitive Emissions - Oil and Natural Gas (CH4)
Fuel Combustion - Manufacture of Solid Fuels and Other Energy Industries (CO2)
Fuel Combustion - Petroleum Refining (CO2)
Agriculture - Direct Agricultural Soils (N2O)
Waste - Solid Waste Disposal on Land (CH4)
Agriculture - Enteric Fermentation (CH4)
Fuel Combustion - Other Transport (CO2)
Fugitive Emissions - Oil and Natural Gas - Venting and Flaring (CO2)
Industrial Processes - Other (Undifferentiated Processes) (CO2)
Fuel Combustion - Pipeline Transport (CO2)
Agriculture - Indirect Agricultural Soils (N2O)
Industrial Processes - Iron and Steel Production (CO2)
Industrial Processes - Cement Production (CO2)
Fuel Combustion - Civil Aviation (CO2)
Industrial Processes - Ammonia Production (CO2)
Fuel Combustion - Navigation (CO2)
Agriculture - Manure Management (N2O)
Fuel Combustion - Railways (CO2)
Energy
Industrial Processes
Solvent and Other Product Use
Agriculture
Waste
7
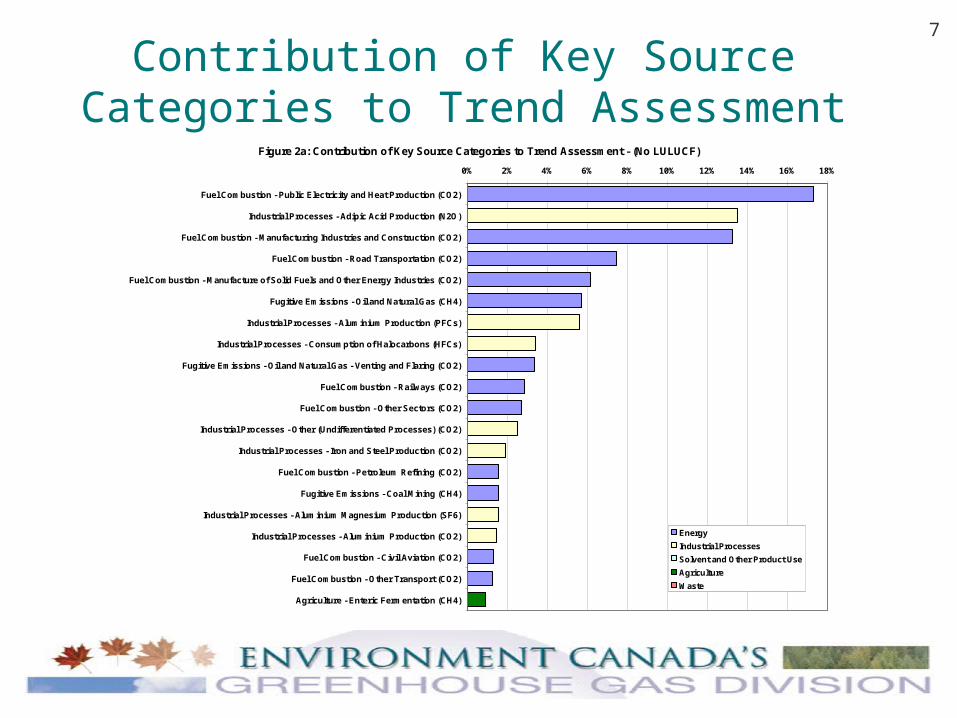
Contribution of Key Source Categories to Trend Assessment
Figure 2a: Contribution of Key Source Categories to Trend Assessment - (No LULUCF)
0% 2% 4% 6% 8% 10% 12% 14% 16% 18%
Fuel Combustion - Public Electricity and Heat Production (CO2)
Industrial Processes - Adipic Acid Production (N2O)
Fuel Combustion - Manufacturing Industries and Construction (CO2)
Fuel Combustion - Road Transportation (CO2)
Fuel Combustion - Manufacture of Solid Fuels and Other Energy Industries (CO2)
Fugitive Emissions - Oil and Natural Gas (CH4)
Industrial Processes - Aluminium Production (PFCs)
Industrial Processes - Consumption of Halocarbons (HFCs)
Fugitive Emissions - Oil and Natural Gas - Venting and Flaring (CO2)
Fuel Combustion - Railways (CO2)
Fuel Combustion - Other Sectors (CO2)
Industrial Processes - Other (Undifferentiated Processes) (CO2)
Industrial Processes - Iron and Steel Production (CO2)
Fuel Combustion - Petroleum Refining (CO2)
Fugitive Emissions - Coal Mining (CH4)
Industrial Processes - Aluminium Magnesium Production (SF6)
Industrial Processes - Aluminium Production (CO2)
Fuel Combustion - Civil Aviation (CO2)
Fuel Combustion - Other Transport (CO2)
Agriculture - Enteric Fermentation (CH4)
Energy
Industrial Processes
Solvent and Other Product Use
Agriculture
Waste
8
Data Collection and Improvements:
introduction

9
Data Collection and Improvements
FCCC Article 4, KP Article 10 and IPCC Guidelines and Good Practice Guidance require ongoing data improvements
Data quality improvement is an integral part of national inventory planning and inventory quality management cycleGoals are to: Increase the accuracy and quality of inventory, activity data and
emission factors Ensure completeness of inventory Refinement of estimation models Implementation of GPG
Strategy begins with assessment of UNFCCC ERT reviews and domestic reviews (quality assurance)
Focus on key categories for the most efficient use of resources Collection of Meta data also important (on methods, assumptions,
circumstances, scale of the data collected etc.)

10
Data Improvements - Challenges Institutional arrangements:
Constitute a pillar to ensure data collection needs are met
Contribute to ensuring consistency, continuity and quality in data provision/delivery
Time and Resource Constraints: Delegation of Roles & Responsibilities Quality control on new incoming data Temporal and spatial consistency of data sets

11
Institutional Arrangements for
Canada’s Inventory

12
Environment CanadaGreenhouse Gas Division
National Greenhouse Gas
Inventory •National Inventory Report (NIR)
•Trends Fact Sheets & GHG Indicators
•Reporting Guidance
PR
OD
UC
TS
Exchange
Natural Resources Canada
Energy Forecasting Division
Emissions Data & Energy Analysis
Energy & Greenhouse Gas Forecast
Environment Canada
(Other Groups)Specialty Surveys &
ResearchSpecific Emissions
Data
Review
Additional Peer Review•Environmental and Industry Stakeholders informal QA•Federal/Provincial Colleagues (Other – MARs partners)•Federal Departments (NRCan; AgCan, Industry Canada)
(Inventory Agency)
•Determines appropriate methods, EF’s and data –performs QC / QA•Develops emission/removal estimation methods and GHG estimates.•Prepares, publishes & reports National Inventory, Fact Sheets, and GHG Indicators•Develops standards & protocols for estimating and verifying domestic greenhouse gas emission reductions and •Provides guidance & outreach services
The GHG Inventory – Current Roles & Responsibilities
INP
UT
S
Agriculture CanadaAgriculture Research Data
Some Emissions & Removals
Consulting GroupsSpecialty Emissions Expertise
Natural Resources Canada
Canadian Forest Service (CFS) Activity Data
Statistics CanadaEnergy & Other Activity Data
Census of Agriculture
Industries & Associations
Some Emission Data, Activity Data,
Research & Information
Ind
us
try
Mandatory Facility Reporting
(GHG System)
(June 1, 2005)

13
Data Improvements - Energy

14
Energy Statistics – Strengths & Weaknesses
Annual Report on Energy Supply & Demand – Key Source of Data.
Strengths Captures all energy use including internally produced and consumed energy. Differentiates between fuels used for industrial processes and fuels used for electricity. Differentiates between energy products used for energy purposes and non-fuel use
(e.g. natural gas and petroleum coke). Provides information for a large number of energy commodities at a fine level of detail.
Weaknesses Reliance on information provided by suppliers of energy Energy consumption data for key sectors such as oil and gas More industry detail required for key sectors Alternative and emerging transportation fuels Little provincial energy consumption data
15
Energy Sector - Data Improvements
Joint Working Groups Federal Government (Statistics Canada/Natural Resources
Canada and Environment Canada) Improvement and refinement of energy and fossil fuel data
by: Additional Quality Assurances through enhanced reviews of
national energy balances, and reviews of the industrial consumption of energy balance Providing technical input to the energy surveys’ reporting
instruction Canadian Industrial Energy End Use Analysis Centre
University Centre of Excellence, Industry and Government Refinement of non-commercial refinery fuel emission factors
16
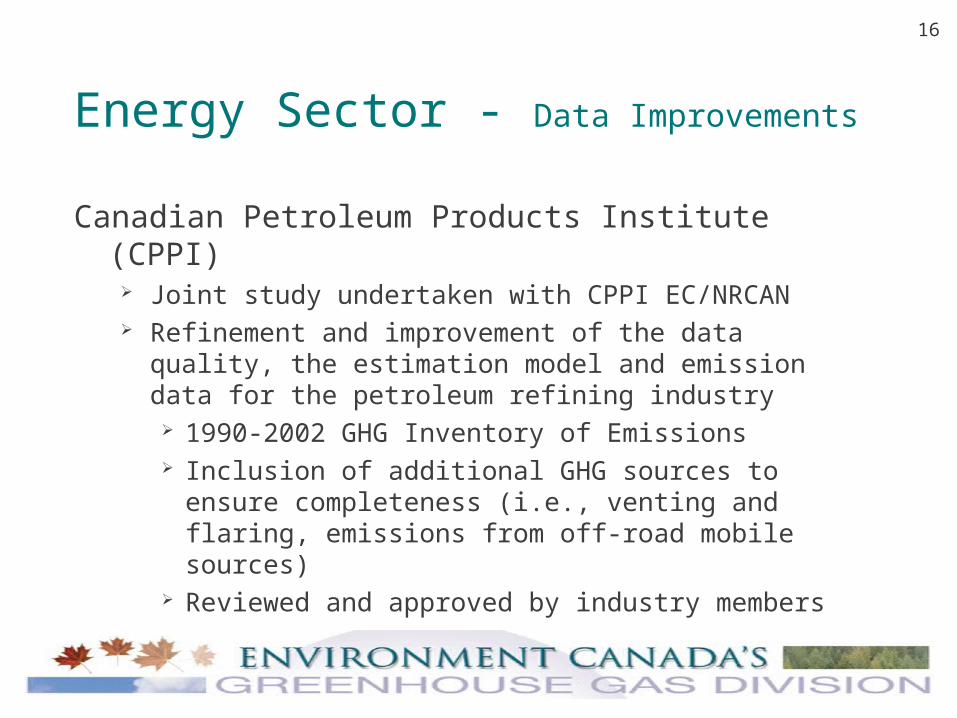
Energy Sector - Data Improvements
Canadian Petroleum Products Institute (CPPI) Joint study undertaken with CPPI EC/NRCAN Refinement and improvement of the data quality, the
estimation model and emission data for the petroleum refining industry
1990-2002 GHG Inventory of Emissions Inclusion of additional GHG sources to ensure
completeness (i.e., venting and flaring, emissions from off-road mobile sources)
Reviewed and approved by industry members

17
Energy Sector - Data Improvements
Aviation Methodology
Revised method to improve allocation between domestic and international
Incorporates the use of tonne-kilometer activity data reported by Canadian airlines both domestically and abroad
Allocates the fuel sold using a comparison of passenger traffic. Initial assumption that 50% of total international tonne-
kilometers flown by Canadian airlines, subsequently revised to 69%.
Comparison with data generated by external fuel consumption models (SAGE – USA and AERO2K – UK) which employ a “Flight Path by Aircraft type” evaluation.
.
18
Data Improvements – Industrial Processes

19
Industrial Processes - Data Improvements
PFCs and CO2 from Aluminium Production
Previously plant specific emissions not available and estimates derived from national production, and national EFs and prorated to plants based on capacity
Aluminium Association of Canada (AAC) provided data in 2004 on PFC and CO2 process emissions for 1990-2003, at plant level.
Plant production data and documentation provided in support of estimates.
Third party audit reports also provided on GHG emission accounting methods and estimates.
An agreement to secure continuation of voluntary data delivery for future years is being negotiated.

20
Industrial Processes - Data Improvements
Consumption of HFCs
Previously activity data for HFC consumption collected through periodic surveys – details on data use patterns uncertain.
Estimation model for HFCs emitted from cooling and refrigeration systems was not adequately addressing the growth in the stock of HFCs as held within the existing systems.
Recent survey undertaken to obtain updated HFC activity data
Estimation model for HFC emissions reviewed and modified by industry experts to capture a higher rate of replacement of CFCs by HFCs.
An agreement to secure continuation of voluntary data delivery for future years is being negotiated.
21
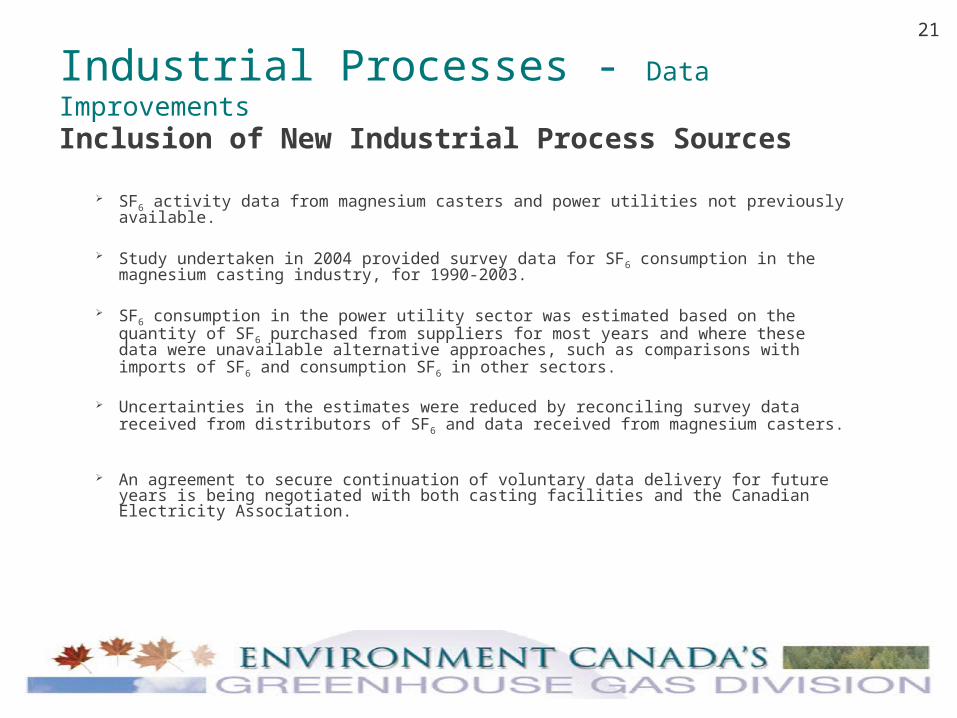
Industrial Processes - Data Improvements
Inclusion of New Industrial Process Sources
SF6 activity data from magnesium casters and power utilities not previously available.
Study undertaken in 2004 provided survey data for SF6 consumption in the magnesium casting industry, for 1990-2003.
SF6 consumption in the power utility sector was estimated based on the quantity of SF6 purchased from suppliers for most years and where these data were unavailable alternative approaches, such as comparisons with imports of SF6 and consumption SF6 in other sectors.
Uncertainties in the estimates were reduced by reconciling survey data received from distributors of SF6 and data received from magnesium casters.
An agreement to secure continuation of voluntary data delivery for future years is being negotiated with both casting facilities and the Canadian Electricity Association.

22
Data Improvements – Agriculture and Waste Sectors
23
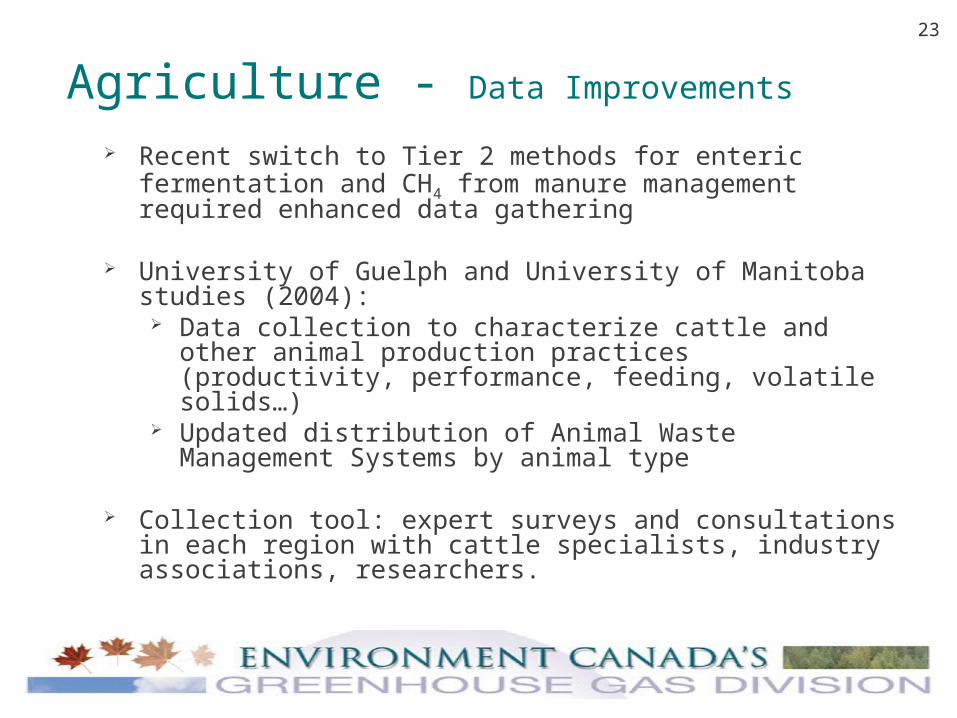
Agriculture - Data Improvements
Recent switch to Tier 2 methods for enteric fermentation and CH4 from manure management required enhanced data gathering
University of Guelph and University of Manitoba studies (2004): Data collection to characterize cattle and other animal
production practices (productivity, performance, feeding, volatile solids…)
Updated distribution of Animal Waste Management Systems by animal type
Collection tool: expert surveys and consultations in each region with cattle specialists, industry associations, researchers.

24
Waste - Data Improvements
CH4 Emissions from Solid Waste Disposal on Land
Landfill per capita disposal rate not updated since 1994 Waste model parameters (CH4 generation rate constant k)
and CH4 generation potential Lo) also require updating to reflect wide ranging conditions across the country.
Studies underway to move towards a statistical basis for waste disposal data collection rather than extrapolated values from waste generation rates.
Study to be initiated this year to examine waste model parameters (methane generation rate constant k) and methane generation potential Lo)
Landfill sites owners and operators are being asked to provide annual landfill gas capture data.

25
Data Improvements – Land Use, Land-Use Change and
Forestry

26
Agriculture Working Group
Forestry Working Group
Land Use, Land- Use Change
Working-Group
Monitoring, Accounting and Reporting System (MARS)
for LULUCF
Steering Committee
Earth Science Sector -NRCan
Canadian Wildlife Service- EC
Statistics Canada
Environment Canada
Agriculture Canada Canadian Forest Service
Canadian Space Agency

27
LULUCF – Data and Model Improvements (Forests)
Forest Inventory: CanFi, provincial inventories, new
National Forest Inventory
Growth and Yield information (including from provincial
and corporate sources)
Disturbance data (fires, insects outbreaks, harvesting...)
National Afforestation Inventory
Into CBM-CFS3

28
Census of Agriculture as basis Targeted surveys (tillage data, farm management
practices...) Satellite imagery: 22 agriculture “stack sites” being
put in place for complete enumeration (rule setting and uncertainty analysis)
Into Century Model → emission factors
LULUCF – Data and Model Improvements
(Cropland and Grasslands)

29
LULUCF – Data Improvements(Land Use and Land-Use Change)
Large number of widely diverse, inconsistent and incomplete data sets, either planned or existing:
Inventories: Forest, Census of Ag Earth Observation data: Forest 2000, Ag “stack sites”, limited
deforestation Large effort needed for data integration in spatially
consistent LU and LUC datasets Trends toward greater role of EO-based measurements Gaps to fill: settlements, wetlands, northern lands

GPG requirement for consistency of land representation, KP requirements for spatially referenced reporting
Size of country, diversity of ecozones and LU/LUC patterns
Data reconciliation (across time, space and scales)
Gap between research and operational methods (models, remote sensing)
Complexity of multi-partner initiatives
LULUCF – Challenges and Limitations
31
Data Improvements – Additional Areas

32
Mandatory GHG Reporting from Large Facilities
On March 13, 2004, the Minister of the Environment, on behalf of the government of Canada, announced Phase 1 of the GHG reporting system in the Canada Gazette
requires reporting of 2004 GHG emissions by June 1, 2005 targets largest emitters - reporting threshold of 100 kilotonnes annually captures all 6 GHGs (CO2, CH4, N2O, HFCs, PFCs, SF6) national coverage at the facility level data will be published by facility, except where confidential
Phase 2, to be in place by 2007, will: Collect more information, other than GHG emissions, such as energy and fuel
use Prescribe standard methods for calculating GHG emissions Lower threshold for reporting which would increase coverage of emitters
Ultimate System will increase precision of national inventory & support compliance with reduction targets