sbi magnum income fund : debt mutual fund - apr 2016
TRANSCRIPT

SBI Magnum Income Fund

This product is suitable for investors who are seeking:
Investment in debt and money- market securities
Regular income for medium term
Low risk
Disclaimer: Investors should consult their financial advisors if in doubt whether this product is suitable for them.
SBI Magnum Income Fund

Performance against benchmark
Data as on March 31, 2016
Past performance may or may not be sustained in future. Returns (in %) other than since inception are absolute, calculated for growth option of regular plan and in INR are point-to-point (PTP) returns calculated on a standard investment of 10,000/-. Additional benchmark as prescribed by SEBI for long-term debt schemes is used for comparison purposes.
31-Mar-2015 To 31-Mar-2016
31-Mar-2014 To 31-Mar-2015
28-Mar-2013 To 31-Mar-2014
Since Inception
Absolute Returns (%) CAGR Returns (%) PTP Returns (INR)SBI Magnum Income Fund 5.86 13.09 2.81 7.59 35,607Crisil Composite Bond Fund Index (Scheme Benchmark) 8.24 14.59 4.39 N.A. N.A.Crisil 10 year Gilt Index (Additional benchmark) 7.97 14.57 -0.96 N.A. N.A.
31-Mar-2015 To 31-Mar-2016
31-Mar-2014 To 31-Mar-2015
28-Mar-2013 To 31-Mar-2014
Since Inception-2
0
2
4
6
8
10
12
14
16
SBI Magnum Income Fund
Crisil Composite Bond Fund Index (Scheme Benchmark)
Crisil 10 year Gilt Index (Additional benchmark)

Type of Instrument % of Total Corpus Risk Profile
Corporate debentures & Bonds / PSU / FI / Govt. Guaranteed Bonds / Other including securitized Debt
Upto 90% Low to Medium
Securitized debt No more than 10% of the investment in debt
Medium to High
Government securities Upto 90% Low
Cash and call money^ Upto 25% Low
Money-market instruments* Upto 25% Low
Units of other mutual funds Upto 5% Low
Broad Asset Allocation of the Portfolio
^ Pursuant to RBI Guidelines, presently Mutual Funds are not allowed to participate in Call Money.* Money Market Instruments will include Commercial Paper, Certificates of Deposit, Treasury Bills, Bills Rediscounting, Repos, short term bank deposits, short-term Government securities (of maturities less than 1 year) and any other such short-term instruments as may be allowed under the regulations prevailing from time to time.

Detailed Asset Allocation of the Portfolio
Data as on: April 30, 2016
Interest
Rate Sensitivity
Credit QualityHigh Medium Low
High
Medium
Low
1.72
43.94
47.09
3.90 3.36 CP
Dated Govt Securities
NCD
ZCB
NCA/CBLO/Reverse Repo
31.41
2.3862.85
3.36
Below AA+AA+SOV,AAA and Equiva-lentNCA(Incl. Cash,Deposits)

Bond Spreads Favoring Investment in G-Sec
Source: Reuters/Bloomberg as on April 30, 2016
Corporate Bonds spreads have narrowed significantly due to fall in interest rates. We found spreads narrowing from 150bps to 50 bps during this period.
We expect spreads to remain at current levels and could widen on resumption of fresh supply.
May-14
May-14
Jun-14Jul-1
4
Aug-14
Aug-14
Sep-14
Oct-14
Nov-14
Nov-14
Dec-14Jan
-15
Feb-15
Feb-15
Mar-15
Apr-15
May-15
May-15
Jun-15Jul-1
5
Aug-15
Aug-15
Sep-15
Oct-15
Nov-15
Nov-15
Dec-15Jan
-16
Feb-16
Feb-16
Mar-16
Apr-16
0.00
0.20
0.40
0.60
0.80
1.00
1.20
3 Year Spread 5 Year Spread 10 Year Spread
Perc
enta
ge
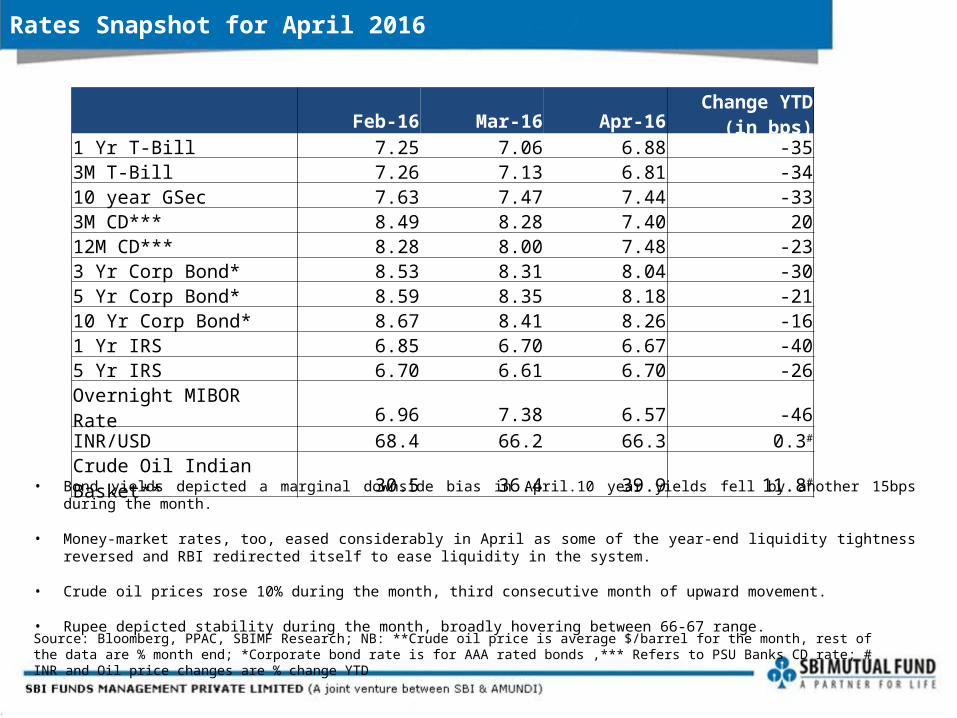
Rates Snapshot for April 2016
• Bond yields depicted a marginal downside bias in April.10 year yields fell by another 15bps during the month.
• Money-market rates, too, eased considerably in April as some of the year-end liquidity tightness reversed and RBI redirected itself to ease liquidity in the system.
• Crude oil prices rose 10% during the month, third consecutive month of upward movement.
• Rupee depicted stability during the month, broadly hovering between 66-67 range.
Source: Bloomberg, PPAC, SBIMF Research; NB: **Crude oil price is average $/barrel for the month, rest of the data are % month end; *Corporate bond rate is for AAA rated bonds ,*** Refers to PSU Banks CD rate; # INR and Oil price changes are % change YTD
Feb-16 Mar-16 Apr-16Change YTD (in
bps)1 Yr T-Bill 7.25 7.06 6.88 -353M T-Bill 7.26 7.13 6.81 -3410 year GSec 7.63 7.47 7.44 -333M CD*** 8.49 8.28 7.40 2012M CD*** 8.28 8.00 7.48 -233 Yr Corp Bond* 8.53 8.31 8.04 -305 Yr Corp Bond* 8.59 8.35 8.18 -2110 Yr Corp Bond* 8.67 8.41 8.26 -161 Yr IRS 6.85 6.70 6.67 -405 Yr IRS 6.70 6.61 6.70 -26Overnight MIBOR Rate 6.96 7.38 6.57 -46INR/USD 68.4 66.2 66.3 0.3#
Crude Oil Indian Basket** 30.5 36.4 39.9 11.8#

RBI has cut Repo rate by 25bps in April and cumulatively delivered 150bps of rate cut in this easing cycle thus far.
The G-sec 10 year yield moved within a narrow range of 7.40%-7.50% during the month of April displaying the market sentiments which have been bearish even after the 25 bps cut by RBI at the beginning of the month and March CPI inflation being more benign than expected.
Supply of DISCOM bonds and likelihood of increased state bonds supply continues to prevent any meaningful rally. The near term direction of yields would largely be determined by the OMO schedule as also the domestic banking system’s credit.
In the money market, liquidity conditions eased at the margin on account of reversal of year end tightness. Government’s cash balances came back into the system and RBI conducted Rs. 300bn of OMO to diffuse liquidity into the system. This was partially offset by higher currency withdrawals and seasonal increase in CRR requirement. Easing of liquidity has helped to considerably ease the short-term rates.
Given the current demand-supply dynamics of bonds and our view on evolution of inflation trajectory, we have reduced duration in bond funds by switching to front-end of the curve (5-7 year segment) that looks attractive from a valuation perspective.
Market Outlook
Source: RBI, Bloomberg, SBIFM Research
Jan-11
May-11
Sep-11
Jan-12
May-12
Sep-12
Jan-13
May-13
Sep-13
Jan-14
May-14
Sep-14
Jan-15
May-15
Sep-15
Jan-16
6.00
6.50
7.00
7.50
8.00
8.50
9.00
9.50
10 year GSec yield (mth end, %)Repo Rate (mth end, %)
Average spread between G-sec and Repo in last 5 years: 75bps

Synopsis
Post the monetary policy, duration in the fund was increased. The RBI stated that going ahead the focus would be on providing liquidity and to bring the systemic liquidity to a neutral level via foreign exchange operations and open market purchases of bonds.
We expect the RBI to conduct around Rs.1.00 – 1.25 lakh crores of bond purchases during the financial year. While this would provide a cap on the higher level of bond yields, large supply and uncertain global environment should prevent bond yields from rallying significantly.
With a view of easing liquidity scenario and the RBI conducting regular bond purchases, we expect the 5 – 10 year of the government bond curve to deliver reasonable risk adjusted returns, and thus increased exposure to the segment. The average maturity of the fund currently stands at 7 years.

Current Investment Strategy
Portfolio Tactical Allocation: 50% to 60%
Strategic Allocation : 30% - 40 % ₌ ₊
The fund manager will actively manage the duration of the portfolio based on the combination of the above two strategies
This portion of the funds is invested in 2-5 years Corporate Bonds
Strategic Allocation : Accruals
Tactical Allocation : Long Bonds
The segment currently looks attractive on account of comfortable liquidity outlook.
This portion of the portfolio provides stable returns without too much volatility
The allocation to the long bonds/ GSecs would provide trading opportunities
Long bonds yields may remain volatile in the near term. Attractive absolute yield levels provide an opportunity from a long term perspective.
This portion of the portfolio may also be used to take defensive positions as per fund managers outlook
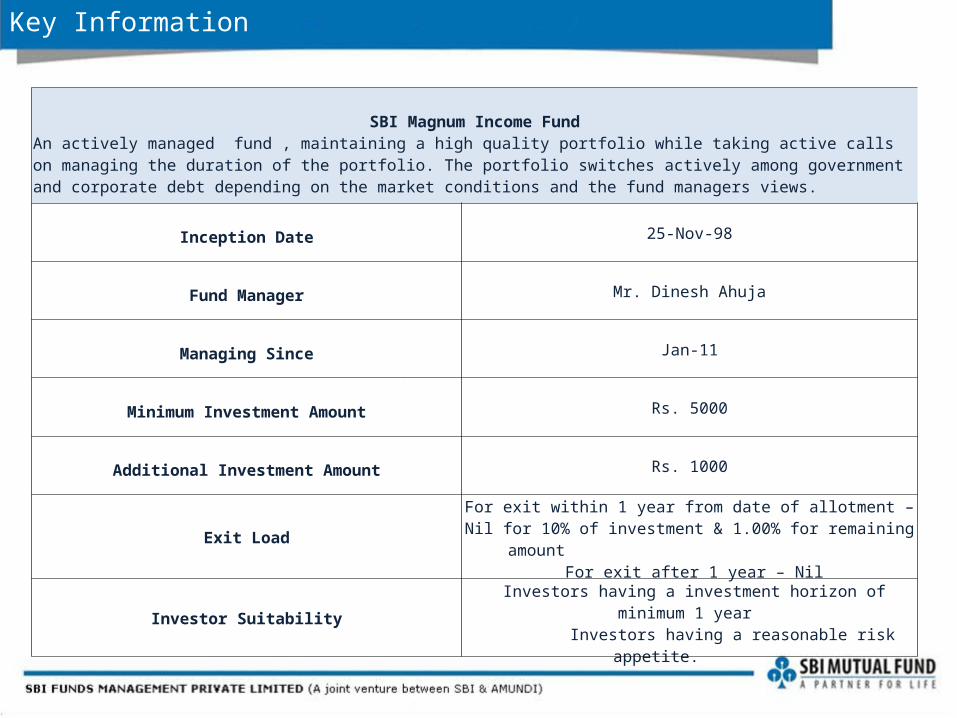
Key Information
SBI Magnum Income FundAn actively managed fund , maintaining a high quality portfolio while taking active calls on managing the duration of the portfolio. The portfolio switches actively among government and corporate debt depending on the market conditions and the fund managers views.
Inception Date 25-Nov-98
Fund Manager Mr. Dinesh Ahuja
Managing Since Jan-11
Minimum Investment Amount Rs. 5000
Additional Investment Amount Rs. 1000
Exit LoadFor exit within 1 year from date of allotment –
Nil for 10% of investment & 1.00% for remaining amount
For exit after 1 year – Nil
Investor Suitability Investors having a investment horizon of minimum 1 year Investors having a reasonable risk appetite.
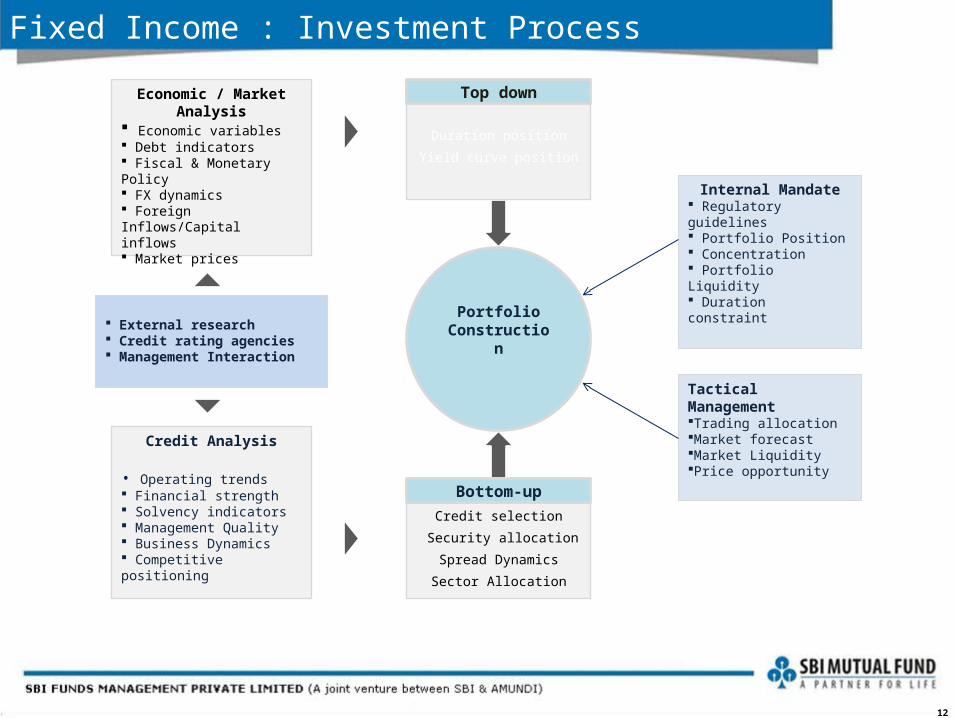
Economic / Market Analysis
Economic variables Debt indicators Fiscal & Monetary Policy FX dynamics Foreign Inflows/Capital inflows Market prices
Credit selection Security allocationSpread DynamicsSector Allocation
12
Internal Mandate Regulatory guidelines Portfolio Position Concentration Portfolio Liquidity Duration constraint
Tactical ManagementTrading allocationMarket forecastMarket LiquidityPrice opportunity
Credit Analysis
• Operating trends Financial strength Solvency indicators Management Quality Business Dynamics Competitive positioning
External research Credit rating agencies Management Interaction
Duration positionYield curve position
Portfolio Construction
Top down
Bottom-up
Fixed Income : Investment Process

Performance of other schemes managed by Mr. Dinesh Ahuja
Past performance may or may not be sustained in the future. Returns (in %) other than since inception are absolute calculated for growth option and in INR are point-to-point (PTP) returns calculated on a standard investment of 10, 000/-. Additional benchmark as prescribed by SEBI for long-term and short-term debt schemes is used for comparison purposes only. Performance calculated for regular plan.
*Returns for scheme benchmark index I Sec and Li-BEX is calculated using CRISIL Fund Analyser*Returns for scheme benchmark index Isec and SI-BEX is calculated using CRISIL Fund Analyser
Managing since January, 2011
31-Mar-2015 To 31-Mar-
2016
31-Mar-2014 To 31-Mar-2015
28-Mar-2013 To 31-Mar-
2014
Since Inception
Absolute Returns (%)CAGR
Returns (%)
PTP Returns (INR)
Dynamic Bond Fund5.57 13.69 2.56 5.02 18,131
Crisil Composite Bond Fund Index (Scheme Benchmark) 8.24 14.59 4.39 6.41 21,259Crisil 10 year Gilt Index (Additional benchmark) 7.97 14.57 -0.96 5.32 18,767
Managing since January, 2011
31-Mar-2015 To 31-Mar-2016
31-Mar-2014 To 31-Mar-
2015
28-Mar-2013 To 31-Mar-
2014
Since Inception
Absolute Returns (%)CAGR
Returns (%)
PTP Returns (INR)
SBI Magnum Gilt Fund - Short Term - Growth 8.93 13.20 8.76 7.71 31,003
I Sec Si-BEX* (Scheme Benchmark)
9.06 9.75 6.66 N.A. N.A.
Crisil 1 Year T-Bill Index (Additional benchmark)
7.69 8.74 5.84 6.25 25,192
Managing since January, 2011
31-Mar-2015 To 31-Mar-2016
31-Mar-2014 To 31-Mar-2015
28-Mar-2013 To 31-Mar-
2014
Since Inception
Absolute Returns (%)CAGR
Returns (%)
PTP Returns (INR)
SBI Magnum Gilt Fund - Long Term - Growth 5.90 21.34 5.38 7.95 32,155
I Sec Li-BEX* (Scheme Benchmark)
7.26 19.88 1.77 N.A. N.A.
Crisil 10 Year Gilt Index (Additional benchmark)
7.97 14.57 -0.96 N.A. N.A.

Mr. Navneet Munot - CIO
Navneet Munot joined SBI Funds Management as Chief Investment Officer in December 2008. He brings with him over 15 years of rich experience in Financial Markets. In his previous assignment, he was the Executive Director & Head - multi - strategy boutique with Morgan Stanley Investment Management. Prior to joining Morgan Stanley Investment Management, he worked as the CIO - Fixed Income and Hybrid Funds at Birla Sun Life Asset Management Company Ltd. Navneet had been associated with the financial services business of the group for over 13 years and worked in various areas such as fixed income, equities and foreign exchange. Navneet is a postgraduate in Accountancy and Business Statistics and a qualified Chartered Accountant. He is also a Charter holder of the CFA Institute USA and CAIA Institute USA. He is also an FRM Charter holder of Global Association of Risk Professionals (GARP).
Mr. Dinesh Ahuja – Portfolio Manager
Dinesh Ahuja joined SBIFM in 2010. Prior to joining SBIFM, Dinesh was a portfolio manager at L&T Asset Management and Reliance Group for four years. Dinesh started his career in 1998 as a fixed income dealer on the sell side. Thereafter he worked in leading broking outfits for eight years before moving on the buy side in 2006. Dinesh is a Commerce graduate and holds his Masters degree in Finance from Mumbai University.
Biographies
Disclaimer
Mutual Fund investments are subject to market risks, read all scheme related documents carefully.
This presentation is for information purposes only and is not an offer to sell or a solicitation to buy any mutual fund units/securities. These views alone are not sufficient and should not be used for the development or implementation of an investment strategy. It should not be construed as investment advice to any party. All opinions and estimates included here constitute our view as of this date and are subject to change without notice. Neither SBI Funds Management Private Limited, nor any person connected with it, accepts any liability arising from the use of this information. The recipient of this material should rely on their investigations and take their own professional advice
SBI Funds Management Private Limited(A joint venture between SBI and AMUNDI)
Registered Office:9th Floor, Crescenzo, C-38 & 39, ‘G’ Block,Bandra Kurla Complex, Bandra (E), Mumbai - 400 051
Board line: +91 22 61793000Fax: +91 22 67425687
Call: 1800 425 5425
SMS: “SBIMF” to 56161
Email: [email protected]
Visit us @ www.facebook.com/SBIMF
www.sbimf.com Website
Visit us @ www.youtube.com/user/sbimutualfund