saving customers money so they can live better · 2016-04-21 · saving customers money so they can...
TRANSCRIPT
Saving customers money so they can live better
Integrated Annual Report for the year ended December 2015

Saving customers money so they can live better

Use this icon to refer to articles onlineUse this icon to refer to articles in this reportThis icon highlights definitions
In addition to the content that appears in this report, the following can be found online:
Group Annual Financial Statements and notes www.massmart.co.za/iar2015/groupafs
Company Annual Financial Statements and noteswww.massmart.co.za/iar2015/companyafs
Five year reviewwww.massmart.co.za/iar2015/5yearreview
These items are all included in the ‘Our performance’ section, under ‘Financial capital’
Our business at a glanceScope, materiality, assurance and approval 4Our performance highlights 6Our purpose 8Our business model 10Our Divisions 12Our footprint 14How we add value 16Our strategic priorities 18Managing our risk 20
01 Leadership reviewA message from our Chairman 24Our CEO’s letter to our stakeholders 27Our Board 34Our Executive Committee 36
02 Our performanceDefining the capitals 40Financial capital 41Manufactured capital 70Human capital 88Natural capital 106Social and Relationship capital 110Intellectual capital 117
03 Transparency and accountabilityCorporate Governance 122Our assessment of the principles of King III 122Our Board 123Our Board Committees 126Board and Committee attendance 127
04 Shareholder informationNotice of Annual General Meeting 130Form of proxy 135Notes to the form of proxy 136Definitions and formulas 137
Full assessment of the application of King IIIwww.massmart.co.za/iar2015/kingiii
The Audit Committeewww.massmart.co.za/iar2015/auditcom
The Risk Committeewww.massmart.co.za/iar2015/riskcom
The Nomination Committeewww.massmart.co.za/iar2015/nomcom
Compliance, transparency and accountabilitywww.massmart.co.za/iar2015/compliance
These items are all included in the ‘Transparency and accountability’ section
Visit our annual report website at www.massmart.co.za/iar2015
What’s on our website
Contents
CFO Review p44
Directors’ Report p64
Independent Auditors Report p68
Remuneration report p92 - p105
R3.95 mInvestment in early childhood developmentsp115
Energy efficiencies deliver results p107
Divisional Reviews p72 - p87
2 3
AssuranceMassmart applies a combined assurance model, introduced by King III, which seeks to optimise the assurance obtained from Management and internal and external assurance providers. The Group’s Risk Committee monitors all the significant risks facing the Group and with the help of Management, provides the Massmart Board of Directors with assurance that it has implemented and monitored the Group’s risk management plan, and that it is integrated into day-to-day activities. They are also responsible for monitoring and implementing the necessary internal controls.
The internal audit function, overseen by the Group’s Audit Committee, assesses the effectiveness of Massmart’s system of internal control. The Group receives external assurance on certain aspects of the business. For example, the Group’s external auditors, Ernst & Young Inc. provide an opinion on the fair presentation of the Group and Company Annual Financial Statements. The Group’s Audit Committee ensures that the combined assurance model is applied throughout the Group to provide a co-ordinated approach to all assurance activities and this Committee also monitors the relationship between the external service providers and the Group.
For more information regarding the Group Audit Committee’s mandate, including the Committee’s assessment of the expertise of the Chief Financial Officer and finance function; the appropriateness of the Group and Company Annual Financial Statements, the accounting practices and the internal financial controls of the Group; and the Committee’s recommendation of this Integrated Annual Report for approval by the Massmart Board of Directors, refer to ‘The Audit Committee’, available on the web: www.massmart.co.za/iar2015/auditcom
Approval of the Integrated Annual Report and summary consolidated Annual Financial StatementsThe Massmart Board of Directors confirm that they have collectively assessed the content of this Integrated Annual Report and have approved it for release to our shareholders. This Massmart Integrated Annual Report for December 2015 contains audited summary consolidated Annual Financial Statements which comprise a summary of the audited consolidated Group Annual Financial Statements prepared for the year ended December 2015.
The preparation of the audited consolidated Group and separate Annual Financial Statements, from which these audited summary consolidated Annual Financial Statements were derived, was supervised by the Chief Financial Officer, Johannes van Lierop.
The accounting policies and methods of computation used in the preparation of these audited summary consolidated Annual Financial Statements are consistent in all material respects with those applied in the prior year, as none of the amendments coming into effect in the current financial year have had a material impact on the financial reporting of the Group.
A full set of the audited consolidated Group Annual Financial Statements for the year ended December 2015 can be found at: www.massmart.co.za/iar2015/groupafs
The audited summary consolidated Annual Financial Statements for the year ended December 2015, as described above, were approved by the Board of Directors on 1 April 2016 and signed on its behalf by:
Guy Hayward Johannes van LieropChief Executive Officer Chief Financial Officer
Forward looking statementsThe Massmart Integrated Annual Report includes forward looking statements which relate to the possible future financial position and results of the Group’s operations. These statements by their nature involve known and unknown risks, uncertainties and other important factors that could cause the actual results, performance or achievements of the Group to be materially different from the future results, performance or achievements expressed or implied by such forward looking statements, as they relate to events and depend on circumstances that may or may not occur in the future.
Factors that could cause actual results to differ materially from those in forward looking statements include, but are not limited to, global and national economic and market conditions, competitive conditions, the cyclical nature of the retail sector, consumer and trade credit and the associated costs and risks of lending, inventory levels and regulatory factors.
The Group is not under any obligation to update or alter any forward looking statements publicly, whether as a result of new information, future events or otherwise. Investors are cautioned not to place undue reliance on any forward looking statements contained herein, as they have not been reviewed or reported on by the Group’s external auditors.
Chairman’s overview
On behalf of the Massmart Board of Directors, I am proud to present Massmart’s 2015 Integrated Annual Report.
We have a diverse range of stakeholders including shareholders, customers, employees, suppliers and communities, with varied information needs. This Integrated Annual Report is our primary report to stakeholders and is aimed at addressing our stakeholders’ interests.
It aims to demonstrate how the material matters in relation to our financial and non-financial performance, governance, risks and strategy can lead to the creation of value in the short, medium and long term.
Kuseni DlaminiChairman
Scope of the Report The scope of the Massmart Integrated Annual Report includes the Group’s four Divisions and key functions. With respect to comparability, all significant items are reported in a consistent manner with the previous financial year, with no material restatements. Where applicable, this report has been prepared in accordance with the framework concepts and the measurement and recognition requirements of International Financial Reporting Standards (IFRS), specifically IAS 34 Interim Financial Reporting, Interpretations issued by the International Accounting Standards Board, the SAICA Financial Reporting Guides as issued by the Accounting Practices Committee, the Financial Reporting Pronouncements as issued by the Financial Reporting Standards Council, the JSE Listing Requirements and the requirements of the South African Companies Act, No. 71 (as amended), as well as the King Code of Governance Principles (King III).
Content of the ReportThe Massmart Integrated Annual Report is our primary report to stakeholders and, as per the practice adopted last year, includes summarised financial information. The following content is available on our website:
www.massmart.co.za/iar2015• Register documenting the assessment of all
75 principles of King III;• Corporate Governance Report;• Approval of the Audited Annual Financial Statements
(including the independent auditors’ report);• Group Annual Financial Statements and notes; and• Company Annual Financial Statements and notes.
MaterialityManagement’s interpretation of materiality, being those transactions, balances and information that are significant in terms of Rand value, the Group’s risk profile or the Group’s strategic intent, such that Management believe omission of disclosure thereof would influence the Group’s stakeholders’ decisions, has been applied in determining the financial and non-financial content and disclosure in this Report.
Introduction
4 5Massmart Integrated Annual Report 2015

Social and Relationship performance
Human performance
48,035Number of employeesIncreased 1.7% (2014: 47,209)
R2,963.6 Estimated annual per capita training investment (permanent employees)(2014: R 3,778.7)
Financial highlights
R84,731.8 millionSalesIncreased 8.4% (2014: R78,173.2 million)
R2,300.2 millionOperating profit before foreign exchange movements (taxed) and interestIncreased 14.1% (2014: R2,015.9 million)
2.8%Trading profit before interest and taxationIncreased 0.2% (2014: 2.6%)
R3,272.1 millionEarnings before interest, tax, depreciation, amortisation and impairmentsIncreased 13.3% (2014: R2,887.1 million)
R1,229.8 millionHeadline earnings before foreign exchange movements (taxed)Increased 7.7% (2014: R1,141.4 million)
R1,118.8 millionHeadline earningsIncreased 1.2% (2014: R1,105.5 million)
567.5 centsHeadline earnings per share before foreign exchange movements (taxed)Increased 7.8% (2014: 526.2 cents)
258.2 centsDividend per shareDecreased 38.7% (2014: 421.0 cents)
2,595.6 centsNet asset value per shareIncreased 5.7% (2014: 2,456.9 cents)
22.4%Return on equity before foreign exchange movements (taxed)Increased 0.7% (2014: 21.7%)
30.5%Return on capital employed before foreign exchange movements (taxed)Increased 1.8% (2014: 28.7%)
R3,756.4 millionCash generated from operationsIncreased 39.7% (2014: R2,688.3 million)
17.8%Return on invested capital Increased 0.1% (2014: 17.7%)
More information on our definitions and formulas on p137
In meeting these performance highlights, we acknowledge the following challenges:• Rising interest rates and slowing economic
growth impacting consumer confidence and spending
• Significant cost pressures across many categories of operating costs
• Price deflation in commodities for most of the year
• Tough economic conditions and currency weakness across most African countries for the first half of 2015
We are proud of the following success stories:• Despite South African economic challenges,
all Divisions recorded good sales and volume growth
• Strengthened several Divisional management teams with great hires of external talent
• Online sales growth accelerating fast, now totalling R182 million
• Most African economies and currencies stabilised in second half of 2015 and our stores in those countries performed well. Also had very successful store openings in three African countries
Intellectual performance
8.3%Private Label as a percentage of total salesunchanged from 2014
R182.7 milliononline sales
65%Traffic on the Makro site grew by more than 65% and had 11 million unique visitors during 2015
Manufactured performance
Our performance highlights Natural performance
215.27 kWh/m2
Store purchased energy consumption (2014: 203.53 kWh/m2)
0.36 kl/m2
Estimated water consumption(2014: 0.59 kl/m2)
Our business at a glance: Our performance highlights
10.8BBBEE: Employment equity score(2014: 10.5)
625Customer complaints (e.g. price errors, false adverts, etc.)(2014: 2,093)
403 Number of storesIncreased 2.8% (2014: 392)
R199.8 million Average sales per storeIncreased 5.3% (2014: 189.8 million)
8,883Active suppliersIncreased 6.1% (2014: 8,372)
6 7Massmart Integrated Annual Report 2015

Our purpose
Massmart’s commitment to our customers:
Massmart’s definition of purpose:
What sets us apart:
Our values guide how we work:
How we do this:
How we measure our performance:
Saving customers money so they can live better
To be the most trusted, high volume, lowest cost, wholesale and retail Group in sub-Saharan Africa, delivering exceptional value to mass market consumers
ETHICAL & RESPECTFULGood business at the centre of everything we do
• Good governance and compliance
• Best partner and stakeholder engagement
• Excellent delivery against commitments
We nurture exceptional partner and stakeholder loyalty enabling long-term relationships
• Highest partner and stakeholder likelihood to recommend
• Smart Group leverage • Best operational execution• Excellent cost control
Our high sales density formats and cost-efficient route to market drive price leadership
• Lowest costs as % of sales
• Best space productivity
EXCELLENCESmart ideas that inspire everyday excellence
• Smart Group-wide category management
• Best customer activation• Excellent omni-channel
executionOur procurement scale optimises supplier distribution and price efficiencies
• Best stock velocity • High market shares
RESPONSIBILITYThoughtful choices for a better future
• Complementary and differentiated formats
• Best customer experience• Excellent assortment clarity
and valueWe exceed expectations of value amongst the widest consumer market in sub-Saharan Africa
• High customer satisfaction
• Lowest comparable basket price
INCLUSIVITY Creating opportunities for everyone to prosper
MOST TRUSTED
HIGH VOLUME
LOWEST COST
EXCEPTIONAL MASS MARKET VALUE
8 9Massmart Integrated Annual Report 2015Our business at a glance: Our purpose

Strategic operating and financial frameworkdefined by Group management to guide Group’s activities (Massmart Holdings)
Collaboration via our forumsto ensure Group-wide sharing of capabilities, knowledge and information (Massmart Channel)
Implementation of Group-wide agreementsenabling greater extraction of value across Divisions, the most important of which is Group supplier negotiations (Massmart Shared Services)
Ensure Group-wide consistent compliance with best governance and national legislative requirements (Massmart Compliance)
• Ethical and experienced leadership and management
• A robust, flexible business strategy• Four focused independent Divisions,
differentiated as retail or wholesale formats addressing different customer and market profiles
• Proven high volume, low-cost model• Effective supply chain and leading
IT solutions• Established brands in a growing
consumer market • Diverse geographical footprint• Walmart partnership
• Exceptional value goods that meet our customers’ needs, through accessible retail and wholesale formats and online
• Efficient routes to market• Responsible corporate citizenship
• Savings for our customers, so they can live better lives
• Job creation and employee development• Retail excellence • Supplier development and growth• A more sustainable future • Positive shareholder returns • Government revenue collection
Our business model
Our unique investment proposition is based on strategic and structural clarity; management depth, quality and diversity; product category leadership; format and geographic diversification; relatively lower risk; and growth, and is enabled by good governance. Our proven business model ensures that we are able to deliver stakeholder value.
INPUT
OUR BUSINESS DRIVERS HOW WE DO BUSINESS
BUSINESS ACTIVITIES
WHAT WE DELIVER
OUTPUT
WHAT WE ENABLE
OUTCOMES
10 11Massmart Integrated Annual Report 2015Our business at a glance: Our business model

Makro sells general merchandise primarily to retail customers and food and liquor to wholesale customers, although retail customers’ participation in Food and Liquor is growing strongly. This blend gives it a robustness that enables it to trade comfortably in most economic cycles. The warehouse club format, with a no-frills approach, keeps costs down and provides the platform for a high volume, high margin sales offering of quality branded merchandise. The customer database of Makro store cards used at the point of purchase helps to keep track of active members.
The Fruitspot is an established wholesaler and distributor of fresh and cut fruit and vegetables. It provides customers with quality products at best prices.
The wholesale brands include:
CBW and Trident sell wholesale food, liquor and cosmetics in bulk to independent dealers, government feeding schemes, franchise members, small traders and hawkers.
Jumbo sells mainly cosmetics, toiletries and haircare products to individual customers and independent general dealers.
Shield is a voluntary buying association that buys products in bulk on behalf of 554 members who own wholesale or retail businesses.
Retail brands, which target the lower LSM group, include:
Cambridge Food consists of an on-site bakery, butchery and fresh fruit and vegetable offering. It sells a range of high quality national and Private Labelled brands across all major categories.
Game offers customers the widest range of branded products, at the best price, with a quality guarantee for customers.
DionWired offers the widest range of the world’s leading hi-tech brands such as Samsung, LG, Apple, SMEG and Bose to the South African high-income consumer. DionWired offers buyers an interactive shopping experience with tech experts on-hand to provide the best advice and on-site repairs and services.
Massbuild has four store formats that cater to different markets.
Builders Warehouse follows the warehouse retail format, offering an extensive range of competitively priced products with a large garden centre display and builders supply yard.
Builders Express caters to the homeowner and DIY enthusiast, focuses on a convenient location, a customer-friendly store layout with pleasing displays and personalised service and advice.
Builders Superstore focuses on the lower-income population in under-served markets around the country. These stores are conveniently located near commuter nodes.
Builders Trade Depot caters mostly for medium-to large-sized contractors and tradesmen engaged in building, maintenance and renovation projects. It trades from large regional low-cost outlets.
Massdiscounters is a multi-category general merchandise discounter and food retailer.
Masswarehouse is a warehouse club trading in food, general merchandise and liquor.
Massbuild is a home improvement retailer and building materials supplier.
Masscash is a food wholesaler, retailer and buying association. It comprises two Divisions, wholesale and retail.
6-10Makro primary customers
2-8Makro secondary customers, via trade
5-10Game
8-10DionWired
2-5Wholesale
2-6Retail
161 Stores20 outside South Africa(153 stores in 2014)
13,796Full-time employees(14,214 in 2014)
19 Storesall in South Africa(19 stores in 2014)
9,952Full-time employees(9,500 in 2014)
121 Stores12 outside South Africa(120 stores in 2014)
13,187Full-time employees(12,863 in 2014)
5-10Builders Warehouse
5-10Builders Express
4-8Builders Trade Depot
2-6Builders Superstore
102 Stores6 outside South Africa(100 stores in 2014)
10,648Full-time employees(10,187 in 2014)
Our Divisions
Geographic presence: South Africa, Botswana, Ghana, Kenya, Lesotho, Malawi, Mozambique, Namibia, Nigeria, Tanzania, Uganda, Zambia
Geographic presence: South Africa, Botswana, Mozambique, Zambia
Geographic presence: South Africa, Botswana, Lesotho, Mozambique, Namibia, Swaziland
Geographic presence: South Africa
CASH & CARRY
12 13Massmart Integrated Annual Report 2015Our business at a glance: Our Divisions

Our footprint
Massmart is an African retailer that operates through 403 stores in 13 countries across sub-Saharan Africa.
365 of our stores are in South Africa, in both urban and rural areas, enabling access to a broad consumer base. We operate a further 38 stores across the rest of sub-Saharan Africa.
NORTHERN CAPE
EASTERN CAPE
FREE STATEKWAZULU-NATAL
MPUMALANGAGAUTENG
LIMPOPO
NORTHWEST
WESTERN CAPE
Our business at a glance: Our footprint
24 Total storesTotal 23 in 2014
24 in South Africa23 in 2014
403 Total storesTotal 392 in 2014
365 in South Africa359 in 2014
38 in Africa33 in 2014
14 Total storesTotal 16 in 2014
14 in South Africa16 in 2014
137 Total storesTotal 130 in 2014
117 in South Africa114 in 2014
20 in Africa16 in 2014
8 Total storesTotal 8 in 2014
8 in South Africa8 in 2014
19 Total storesTotal 19 in 2014
19 in South Africa19 in 2014
39 Total storesTotal 35 in 2014
33 in South Africa30 in 2014
6 in Africa5 in 2014
41 Total storesTotal 41 in 2014
41 in South Africa41 in 2014
51 Total storesTotal 47 in 2014
51 in South Africa47 in 2014
70 Total storesTotal 73 in 2014
58 in South Africa61 in 2014
12 in Africa12 in 2014
CASH & CARRY
14 15Massmart Integrated Annual Report 2015

Integrated thinking is intrinsic to the way we manage our business, and is supported by our internal reporting processes. In combination, these priorities ensure that we manage the needs and expectations of our key stakeholders and the trade-offs between them, to create long-term value for our shareholders.
We recognise the interdependencies between the six capitals and the fact that there are trade-offs between the costs and benefits offered by the six capitals that we have to manage responsibly. We rely heavily on our intellectual and manufactured capitals as these are the capitals that generate new products, build the inherent value of our brands and through good governance, protect our reputation.
How we add value
R84,731.8 millionSalesIncreased 8.4% (2014: R78,173.2)
– R68,689.6 millionCost of salesIncreased 8.0% (2014: R63,610.8)
+ R158.0 millionOther revenue and interest receivedDecreased 15.6% (2014: R187.3)
– R6,263.3 millionNet costs of services and other operating expensesIncreased 8.5% (2014: R5,771.1)
R9,936.9 millionValue addedIncreased 10.7% (2014: R8,978.6)
Calculating the value we added:
How we share the value amongst our stakeholders:
Determining how we add value has called for co-ordinated thinking to ensure that the trade-offs that are inevitable in managing the competing interests of stakeholders, ultimately result in the ethical and responsible creation of shared value.
We believe integrated thinking is critical to effectively manage the opportunities, risks, resources and relationships – and particularly the trade-offs between these – that are required to drive growth and create value for all our stakeholders.
How each capital distributes value:
Our business at a glance: How we add value
To employees as salaries, wages and other benefits
R6,784.3 mIncreased 11.1% (2014: R6,109.0 million)
Depreciation and amortisation
R946.2 mIncreased 11.8% (2014: R846.6 million)
To shareholders as dividends
R914.1 munchanged (2014: R 914.0 million)
To lenders as interest
R507.7 mIncreased 31.3% (2014: R386.8 million)
To Government as taxation*
R505.9 mIncreased 4.7% (2014: R483.4 million)
Net earnings retained
R198.6 mIncreased 19.7% (2014: R165.9 million)
Non-controlling interests
R56.4 mDecreased 2.1% (2014: R57.6 million)
CSI
R23.7 mIncreased 54.9% (2014: R15.3 million)
R9.9 billion
Cost to finance distribution of value
p41-69
FINANCIAL CAPITAL
The Divisions would be primarily responsible for generating the value to
be distributed
p70-87
MANUFACTURED CAPITAL
Cost incurred to remunerate and
train staff
p88-105
HUMAN CAPITAL
Cost savings derived from promotions
p117-119
INTELLECTUAL CAPITAL
Costs of CSI initiatives
p110-116
SOCIAL & RELATIONSHIP CAPITAL
Environmental cost saving initiatives
p106-109
NATURAL CAPITAL
* excluding value added tax of R7.8 million (2014: R8.5 million)
16 17Massmart Integrated Annual Report 2015

Our business at a glance: Our strategic priorities
Our strategic priorities
Linked risks:
We remain focussed on these four key strategic priorities:
In 2015, we delivered on these priorities by:
More information on these risks can be found on
p20-21
More information on our values can be found on p8-9
Our strategic priorities for 2016 remain unchanged and we will deliver on these using our four values:
We will also deliver on these priorities by:2015
We see the following continuing opportunities:
Working towards building a profitable omni-channel presence synergistic with Massmart category- and market-leadership, and customer needs
Did you know?Traffic on the Makro site grew by more than 65% and had 11 million unique visitors during 2015
GROW ONLINE
8 9
1
Responding to the growing presence of online shopping and digital activation in our customers’ lives and how it affects their shopping behaviour and needs
SAP online project initiated in Builders Warehouse to improve our offering to trade customers Masscash is trialling store-based online ordering capability
2016
ETHICAL & RESPECTFUL
EXCELLENCE
RESPONSIBILITY
INCLUSIVITY
Focussing on sales, operating margin and expenses
Did you know?Massmart has the highest annual sales densities in South African retail at R201 million per store and the lowest operating costs as a % of sales at 16.4%
IMPROVE PROFITABILITY
1 3
6 8
Addressing cost structures and processes in each of the Divisions and ensuring that we collaborate across the Divisions to reduce cost duplication and inefficiency
Remaining relevant to customers by offering blatant value through well-priced and relevant merchandise
Leveraging our investment in Builders and building a Retail Food proposition on the General Merchandise and Wholesale platforms
Did you know?In 2015, Massbuild and Masscash Retail had gross South African space growth of 4.7% and 5.6% respectively
GROW BUILDERS AND RETAIL FOOD IN SOUTH AFRICA
1 3
7 8
Continuing to roll-out Builders’ offering through three formats – Builders Warehouse, Builders Express and Builders Superstore
Rolling out Retail Food through adding the Fresh category to Game and Makro stores, and by opening more Rhino and Cambridge stores
Authoritative range and best-in-market pricing on Known Value Items (KVI’s) in Builders. Our Marketside brand is now implemented across fresh produce, bakery and butchery in Game, Makro and Cambridge Food in Gauteng
Leveraging South African market leadership and operating strengths in sub-Saharan Africa
Did you know?Builders’ Rest of Africa store sales are fast approaching R1 billion out of 6 stores after just 3 years
GROW INTO AFRICA
10
1
8
6
Opening five new stores in four countries outside South Africa during 2016
Bespoke African Retail study confirms significant potential of our formats across key African countries – and need for measured and longer-term approach
18 19Massmart Integrated Annual Report 2015

Managing our risk
1 23
465
9
10
78
12
4
7
8 6
59
10
1Non-adherence to business model or poor strategic execution
FINANCIAL IMPACT
Responsibility of Group CEO, Massmart Board and Massmart Executive CommitteeMitigationThe Group insists on strategic clarity at the Divisions and Massmart Corporate. The strategies of all Divisions and the Group are formally documented and are reviewed annually at Divisional level, at Group Executive Committee level and then by the Board. A Division’s strategies dictate management’s operational tactics and priorities. The annual budget process is an output of these reviews and ongoing monthly monitoring of annual financial results and comparison to budget at Divisional Boards and Group Executive Committee level takes place.
Risk
Risks are numbered in order of priority
Risk after mitigation
IMPA
CT
PROBABILITY MaximumMinimum
Maximum
2Talent retention and succession
FINANCIAL & OPERATIONAL IMPACT
Responsibility of Human Capital Executive and Massmart Executive CommitteeMitigationThis remains a major focus area. The Executive Committee actively monitors the progress, development and possible succession plans for the ‘Top 200’ employees, as well as monitoring a further 200 employees. There are in-house education programmes prepared and presented in conjunction with local and international business schools that focus on developing middle and junior executives, and there is an in-house graduate recruitment programme in place. Annual ‘fire-side chats’ are held with each Executive in the Group. The Group’s remuneration policy, incorporating short- and longer-term incentives, is designed to reward significant out-performance and provides an opportunity for staff to accumulate wealth. The Share Incentive Plan also acts as a retention mechanism.
4
Failure to address in-store health & safety issues including store or distribution centre (DC) fire
OPERATIONAL & REPUTATIONAL IMPACT
Responsibility of Chief Ethics & Compliance Officer and Divisional CEO’sMitigationIncrease Executive, staff and customer awareness in stores. Internal Audit reviews. Use of professional third parties to assess in-store health and safety issues, including legislative and regulatory compliance. Supply chain focus to reduce inventory volumes.All Makro stores are Automatic Sprinkler Inspection Bureau (ASIB) compliant. High awareness across Group, ongoing monitoring of system maintenance and testing. Replacement of roof insulation with appropriate fire retardant insulation in Massbuild stores. Work with external risk assessors and insurance brokers.Focus on storage of flammable products. Proper location and management of electricity generators.
5Insufficient progress with transformation
REPUTATIONAL IMPACT
Responsibility of Human Capital Executive and Massmart Executive CommitteeMitigationThe Board sets appropriate targets and expectations in the context of new BBBEE codes. Transformation of our senior leadership and management teams remains a key focus, and is monitored and supported by the Group CEO and the Human Capital Executive.
6Volatility of key economic variables
FINANCIAL & OPERATIONAL IMPACT
Responsibility of Group CFO and Divisional CEO’sMitigationExtreme movements in economic variables including interest rates, currencies and raw material or food prices can materially affect consumer behaviour and cause disruption in the sourcing, supply and sale of raw and finished products. Careful monitoring and management of inventory pricing, levels and supply dynamics. All direct foreign exchange import liabilities are covered forward. We have fixed interest rates on the Group’s medium-term debt. Purchase of key stand-alone stores to avoid permanent escalation of the associated lease charges. Keep the net assets of our African operations to a minimum, to avoid potentially large translation effects from currency movements.
7Food safety and hygiene
FINANCIAL & REPUTATIONAL IMPACT
Responsibility of Chief Ethics & Compliance Officer and Divisional CEO’sMitigationSupplier compliance audits. Use of QA tests by third parties (Food Consulting Services). Food safety management system audited by Diversey. Formulated product-recall procedure. Massmart Internal Audit Services focus.
8Inefficient or ineffective supply chain or a failure in the supply chain
FINANCIAL & OPERATIONAL IMPACT
Responsibility of Group CEO and Supply Chain ForumMitigation Large RDC’s represent potential single points of failure. High fixed costs are best annuitised through significant volume throughput. Business continuity plans in place for RDC’s. Stable forecasting and replenishment systems. Ongoing review and clearing of dated products.
3Competitor attack on our major merchandise categories
FINANCIAL IMPACT
Responsibility of Group CEO and Divisional CEO’sMitigationMaintain a relevant and competitive product offering that offers affordable value to our customers. Invest in brand awareness and loyalty. Manage low-cost efficient operations. Ensure suppliers believe that our stores and associated supply chain offer an ideal route to market. Optimise our store locations, and ensure regular store refurbishments and format renewal.
9Reliance on information technology (IT)
FINANCIAL & OPERATIONAL IMPACT
Responsibility of Group Commercial Executive and Technology, Information and Process (TIP) ForumMitigationTIP Forum approves all major IT developments in Group. IT plans must be aligned with strategy. Ensure adequate resourcing of internal IT management. Massmart Internal Audit Services has significant IT expertise and assesses all IT developments and is part of the ‘go-live’ decision on any project.
10Complexity of the Group’s African operations
FINANCIAL & OPERATIONAL IMPACT
Possibility of some reputational risk in-country.Responsibility of Group CEO and Africa ForumMitigationCareful pre-selection of countries and locations for new stores, with a thorough evaluation of customs, tax, exchange control and business legislation. Regular repatriation of cash. Dedicated Executives across several functions monitor and manage the African operations. Keep supply chain as short as practical. Develop appropriate relationships with key government and regulatory authorities in those countries.
Definitions of each risk can be found at www.massmart.co.za/iar2015/riskdef
3
20 21Massmart Integrated Annual Report 2015Our business at a glance: Managing our risk

Leadership review
01
A message from our Chairman 24
Our CEO’s letter to our stakeholders 27
Our Board 34
Our Executive Committee 36
22 23Massmart Integrated Annual Report 2015Leadership review

A message from our Chairman
Although the year under review was very challenging and difficult for most businesses, including ours, across different sectors of the market, I am pleased to report that Massmart delivered solid results and market share gains across its Divisions.
This means that our customers, the pillars of our business, continue to trust us to help them save money and live better. Total and comparable sales grew by 8.4% and 6.7% respectively while Group operating profit excluding foreign exchange change movements and interest, went up by 14.1%.
These impressive results were delivered by our team of committed colleagues across our 403 stores in South Africa and the other 12 countries across Africa in which we operate. Our teams delivered these encouraging results in an environment marked by low growth in most developed markets and slowing growth across Emerging Markets, especially China which has been a major source of demand for African commodities during the super cycle.
Growth in Africa has been tempered by falling commodity prices and declining foreign investment. The anaemic growth in South Africa of 1.3% underscored the challenges in the local economy and society. Growth is key. South Africa needs to elevate growth to a national strategic priority and get all social partners to play a very positive, active and constructive role in the growth of the local economy. Growth is everyone’s problem.
Government, business and labour leaders must all be accountable for what they do or do not do to drive the growth and expansion of the local economy. They must account for, and be held accountable for, their actions and inaction. We need high inclusive growth to create and retain decent jobs, alleviate poverty, reduce inequality and fund our education and healthcare systems. At Massmart, we employ over 48,000 colleagues across our businesses.
If the economy had grown higher than it did, we would have employed more people. The even weaker outlook for growth in 2016 is a serious cause for concern that requires innovative interventions to boost local and foreign investor confidence. South Africa and Africa have what it takes to grow their economies and societies out of unemployment, poverty and inequality.
Bold, courageous and decisive leadership and interventions that create an investor-friendly climate is what is needed to unlock the full growth potential of our economies and societies. Massmart will continue to work and partner with governments and other stakeholders to actively promote and positively contribute to the growth and development of the economy and society.
We are proud of the work of our Supplier Development Programme which invests in, and partners with, entrepreneurs in manufacturing and agriculture, whose various products end up on the shelves of our stores. The manufacturing and agriculture sectors are key to the attainment of the job creation and growth targets set in our National Development Plan (NDP).
Massmart will continue to play an active and meaningful role in the successful implementation of the NDP. Our stores in Africa actively look for, and partner with, local suppliers to source goods from the local economies in all the countries in which we operate. This is Massmart’s philosophy.
We want countries and communities to be better off for us having been there. We believe in shared value. We want to constantly expand the circle of beneficiaries from our business activities in the countries and communities in which we operate.
Operating environment The operating environment facing Massmart and other retailers is marked by declining consumer confidence which is at a 14-year low. CPI is range-bound and the outlook for Food inflation indicates a likely increase as the impact of the drought takes its toll. The manufacturing sector is in a technical recession. This does not augur well for job creation and retention. We need to redouble our efforts to retain existing jobs and create new ones.
The four increases in interest rates since our last IAR, accumulating to an increase of 125 basis points, will impact on consumers and their spending power and patterns. The regulatory and legislative environment continues to be in flux and to exert its impact on business. We need smart regulations that enable businesses to be globally competitive so that they can maximise their contribution to growth and development.
AfricaMany African countries have been adversely affected by the double dip of commodities prices and US Dollar strength. As if that was not enough, we have also seen weak and volatile currencies across different African markets with the US Dollar becoming a de facto currency in some African markets. The resilience of African markets has been tested and so has the Africa Rising narrative which has been a dominant theme in local and global investment circles over the past few years. The increasing diversification of African economies has insulated Africa from the worst effects of the decline in the price of commodities and pedestrian global and local economic growth. Africa is better off today than it was 10-15 years ago. That’s a good sign. We need sustained, highly-inclusive and job-rich growth to be part of the ‘new normal’ in Africa.
The deepening of democracy and rule of law across Africa augurs well for the long-term growth prospects of the continent. However, there are disturbing trends in some countries where some presidents orchestrate changes in constitutions against the will of their people to enable them to run third and further terms in office. Growth and investment in Africa are also threatened by terrorist movement in East and West Africa.
Democracy and peace are key ingredients to growth and development. The democratic and peace projects need to be harnessed and deepened across Africa. Notwithstanding the current challenges facing the African marketplace, we remain confident on the medium- to long-term prospects of African economies.
StrategyThe Group is delivering on its strategy. At the core of our strategy is growing our penetration of the Food Retail market through Makro, Masscash Retail and Game, who have both delivered improved performances, which we are very confident will be sustained into the future. Masscash Retail continues to outperform its peers in terms of price and value perception.
Secondly, our strategy also focuses on growing our DIY/Home Improvement footprint in South Africa and Africa through Massbuild. We opened a Builders Warehouse store in Lusaka, Zambia, in 2015 which was well received by our customers and the authorities alike.
Thirdly, the profitable growth and expansion of business across Africa is a key part of our strategy. Our path to Africa is through our Game, Builders Warehouse and Masscash Wholesale formats.
Fourth, ecommerce is also crucial to our strategy. Our different teams are leading the charge in innovating across formats to enable our customers to have more convenience in shopping with us in ways that make the shopping experience as hassle free as possible. We are pleased with the progress we have made in this space and will continue to position ourselves in the forefront of innovation.
At the heart of all four of these priorities is improving the profitability of the business, which remains a constant focus point.
Board and Executive changesThe Board of Massmart continues to work efficiently in providing strategic oversight and supporting our Executive team in the execution of Group Strategy. Guy Hayward, our CEO, and his Executive team continue to do a commendable job in positioning Massmart as a trusted and admired retailer of note.
During the year under review, Moses Kgosana joined the Board and became a member of our Audit and Risk Committees. Moses is a welcome addition to our Board and has already started making a valuable contribution.
Another notable development was the resignation of Shelley Broader from the Board which was linked to her resignation from the Walmart organisation. Shelley was an invaluable member of the Board who made an immense contribution to the Board and the entire Massmart organisation. We wish her well in her new endeavours.
We were pleased to welcome Johannes van Lierop who joined Massmart as our Chief Financial Officer and a member of the Board. He brings a wealth of experience in international business and first-hand experience of working and living in Africa.
Lastly, in February 2016, we announced the appointment of Enrique Ostalé to the Board. He has also become a member of our Nomination and Remuneration Committees, and we welcome him to our Board.
Kuseni DlaminiGroup Chairman
I AM PLEASED TO REPORT THAT MASSMART DELIVERED SOLID RESULTS AND MARKET SHARE GAINS ACROSS ITS DIVISIONS.
“
”
24 25Massmart Integrated Annual Report 2015Leadership review: A message from our Chairman
A message from our Chairmancontinued
Governance Massmart is committed to good corporate governance. Our Board is actively engaged and encourages management to profitably grow Massmart in the best interest of all stakeholders. I am delighted to report that most of the Directors attended most Board and Committee meetings. Our Board conducts regular reviews of our effectiveness, composition, strategy, structure and the talent within Massmart.
Our Board’s diversity is one of Massmart’s strengths. From global retail experience to race, gender, business experience and length of service, Massmart’s Board is well-positioned to add value to the business. The debates are enriched by the mosaic of perspectives and experiences which the different Board members bring.
Dedicated to valueMassmart continues to pride itself on its commitment to innovation and excellence, in everything that we do. We encourage all our colleagues to contribute smart ideas that drive excellence and good customer service.
From operating for less so that we can sell for less, to understanding our different customers’ unique and generic needs, we continue to lead the way in helping our customers to save more so that they can live better. We are proud to have the lowest operating cost as a proportion of sales in the retail industry.
We believe in making well-considered and informed choices to shape a better future for our business and stakeholders alike. We are fully committed to sustainable business practices and continuously monitor and measure our impact on the planet, people and our communities at large. We want Massmart to be a powerful and positive force for good in the economy and society at large.
Our people come first. We believe in empowering them to live their dreams. An inspired and motivated team is key to excellent customer service and value creation. We invest immensely in the development of our colleagues so that they have the skills and experiences they need, to advance their careers and add value to our customers.
We believe in doing well by doing good. Good business is at the core of our philosophy and strategy. We continue to make good savings in energy and water consumption across our business. With the drought experienced in 2015 we took a decision to sell water at cost and made donations to communities that experienced severe water shortages.
ConclusionWe are very committed to continue to execute our strategy and deliver on our promises. Although the outlook for 2016 is challenging, we are determined to stay on course and deliver value and benefit to shareholders and stakeholders respectively.
I would like to thank my Board colleagues, management, staff and our various stakeholders for their support, without which it would have been difficult to deliver the good results contained in this Integrated Annual Report. We look forward to your continued support.
Kuseni DlaminiChairman1 April 2016
MASSMART CONTINUES TO PRIDE ITSELF ON ITS COMMITMENT TO INNOVATION AND EXCELLENCE, IN EVERYTHING THAT WE DO. WE ENCOURAGE ALL OUR COLLEAGUES TO CONTRIBUTE SMART IDEAS THAT DRIVE EXCELLENCE AND GOOD CUSTOMER SERVICE.
“
”Guy HaywardGroup CEO
Our socio-economic backdrop The causes and symptoms of South Africa’s deteriorating economic outlook have been aired thoroughly by commentators. It seems likely that 2016 will prove to be South Africa’s recent economic nadir as the economy is buffeted by weak growth from key international export markets, weak mineral commodity prices, greater risk-aversion towards Emerging Markets, and our own softening economic growth which registered recently only 1.3% GDP growth for 2015 (and only 0.7% and 0.6% GDP growth for Q3 and Q4 of the same year). This already difficult scenario will be compounded by South Africa’s worst drought in several decades which will have a direct economic impact and, possibly more worryingly, a severe social impact, as prices of basic foodstuff escalate in the short-term.
The South African Government’s recent efforts, together with big business, to avoid a recession in 2016 and a possible sovereign credit rating downgrade, are welcomed. Whilst there are forums for useful dialogue between Government, Business and Labour as the key stakeholders in the delivery of economic growth and prosperity, it is Government that sets the platform and policies for that longer-term growth and prosperity. In South Africa’s case, this has become muddled and unclear which is destabilising for business – management and investors – which both require policy certainty in order to plan, fund and execute long-term strategic initiatives.
The apparent unease within Government and our ruling political party needs to be resolved in order that South Africa’s economic trajectory can be planned. Good stakeholder protocol requires that business always supports the government of the day, and Massmart is no different. In the absence of clear and cogent long-term socio-economic policies however, business necessarily becomes short-termist and risk-averse, avoids marginal longer-term expansion plans, and/or may seek alternative growth markets.
We continue to closely track economic and political developments in the 12 African countries, other than South Africa, that collectively contribute 8.4% toward Group sales. Many larger African countries have been adversely affected by the same global economic impacts described earlier but their own economic contraction tends to be deeper and sharper, as a result of their relatively illiquid currencies. Despite this, we note that most African countries where we operate have stabilised economically apart from one or two of those countries where there may potentially be further currency devaluations.
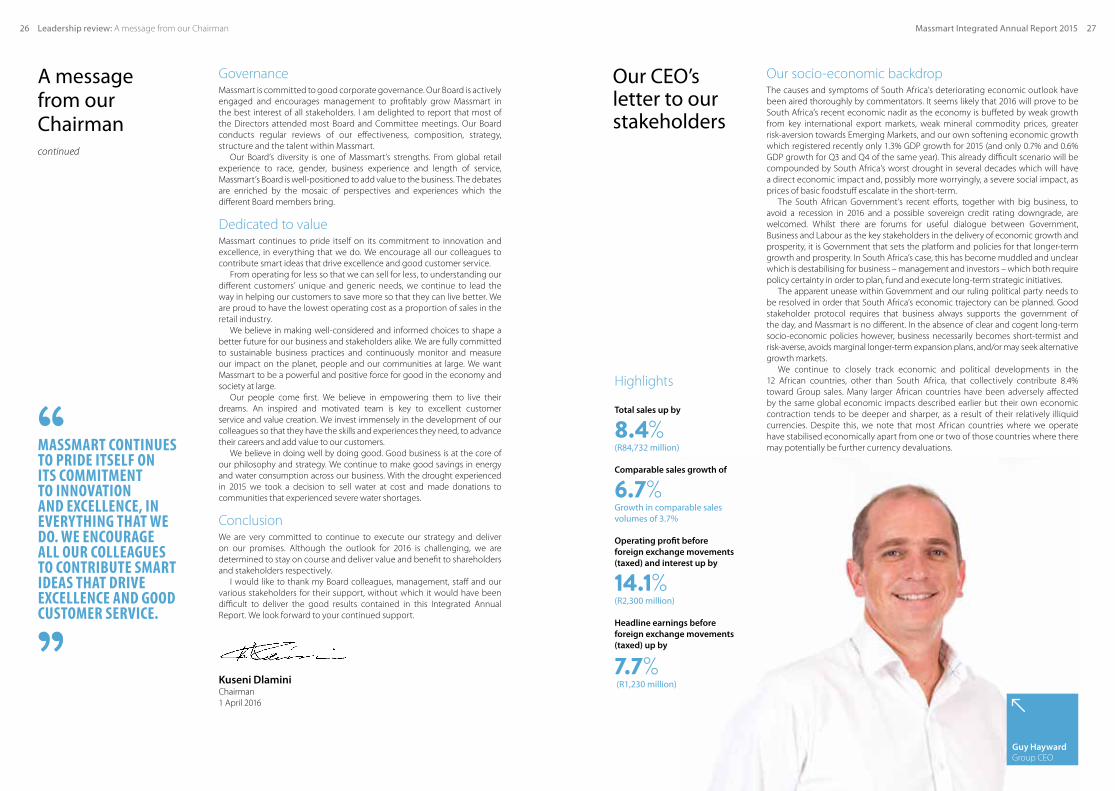
Total sales up by
8.4%(R84,732 million)
Comparable sales growth of
6.7%Growth in comparable sales volumes of 3.7%
Operating profit before foreign exchange movements (taxed) and interest up by
14.1%(R2,300 million)
Headline earnings before foreign exchange movements (taxed) up by
7.7% (R1,230 million)
Highlights
Our CEO’s letter to our stakeholders
26 27Massmart Integrated Annual Report 2015Leadership review: A message from our Chairman
Our response Massmart’s leadership across major merchandise categories, including General Merchandise, Wholesale Food & Liquor and DIY / Home Improvement, and our different retail and wholesale formats enables us to respond effectively, and in a differentiated manner, to the anticipated socio-economic environment depicted earlier. In South Africa, our large and mature businesses like Game, Makro and Masscash Wholesale, provide a powerful underpin to the Group’s profitability and cash earnings, whilst our other businesses like Massbuild and Cambridge Food offer good growth and profit prospects. And beyond our borders, we are growing our Game, Builders Warehouse and Wholesale (Cash & Carry) stores and are participating in the sub-continent’s significant long-term growth potential.
Later in this letter we describe the four strategic priorities we are pursuing being: improving profitability; growing Food Retail and Builders Warehouse in South Africa; growth into sub-Saharan Africa; and ecommerce. In the immediate term however, we placing most emphasis on: • Keeping operating costs as a % of sales as low as feasible. This is achieved in
multiple ways but key focus areas include supply chain and logistics efficiency and effectiveness, reducing store construction and in-store operating costs, and effective labour-scheduling of our store employees;
• Maintaining a competitive price-gap against our major competitors across KVI’s enabled by the fact that Massmart’s operating costs (as a % of sales) are the lowest in South African retail;
• Working closely with key suppliers to ensure that we invest energy and resources into areas of common interest, including supply chain efficiency, to ensure their products reach their desired target markets cost effectively; and
• Being selective about our South African store footprint. Only opening stores that we are confident will be sustainably profitable and closing those with permanently compromised profitability.
The year in reviewAs noted, the outlook for the South African consumer economy in 2016 and likely part of 2017 has weakened considerably and we anticipate further negative pressures, including compromised economic growth, higher inflation from the weaker Rand, and higher interest rates.
As with most local retailers, Massmart’s sales growth slowed in the latter part of 2015, in our case caused mainly by softening sales in our General Merchandise and DIY categories. By contrast Food sales growth accelerated on the back of effective trading in Masscash Retail and Wholesale. Internal Food inflation remained steady but is expected to increase in the early part of 2016 and probably rise sharply in drought-affected commodities.
The weaker Rand and declining upper-income consumer confidence levels in South Africa will adversely impact sales of large appliances, hi-tech and multimedia due to accelerated imported price inflation. We are closely monitoring the South African bonded housing market – its price movements, supply and demand, and consumer confidence – and will respond proactively as required. Our businesses place an intense focus on sourcing well-priced merchandise and formulating deals that offer our customers exceptional value.
Most Massmart Divisions performed exceptionally well in the tough South African consumer environment where we effectively managed the fine line between growing sales and maintaining profitability, and controlled comparable cost growth in the face of severe cost-pressures.
During the 2015 year, 21 new stores were opened, including five outside South Africa, representing new space growth of 4.2%. Ten South African stores were closed resulting in a net space increase of only 0.7%. We continue to carefully review store lease renewals and are closing stores we consider incapable of achieving sustainable profitability. At December 2015 our total portfolio of 403 stores includes 38 stores outside South Africa.
Sales in our non-SA stores remain robust with total sales growth for the 2015 year in local currencies of 13.8% (12.6% in Rands) and comparable sales growth of 5.6% (4.8% in Rands). Non-SA sales currently represent 19.7% of Game’s total sales, 6.2% of Massbuild and 12.9% of Masscash Wholesale respectively.
We remain excited, but measured, about the long-term growth opportunities across selected African countries and expect to open five new stores outside South Africa during 2016.
Overview of financial performance In his report included on pages 44-63 our Chief Financial Officer, Johannes van Lierop, addresses in useful detail the key financial issues necessary to understanding and interpreting the Group’s 2015 performance. Briefly however, Massmart’s total sales were R84.7 billion, an increase of 8.4% over the prior year. Comparable stores’ sales growth was 6.7% and product inflation 3.0%, reflecting continued good volume growth.
Group operating profit, excluding foreign exchange movements (taxed) and interest, grew by 14.1% to R2.3 billion. This performance was achieved by effective margin management and good expense control across all Divisions, as well as some margin recovery in Game.
Higher net interest paid from funding significant property acquisitions in 2012-14, and an adverse movement in foreign exchange translations, resulted in headline earnings increasing by 1.2% to R1.1 billion while headline earnings, excluding foreign exchange movements, increased by 7.7%.
Operational highlights • All Divisions reported positive sales volume growth and
grew market share• Three of the Divisions grew operating profit ahead of
their own sales growth • Our non-SA stores had strong second-half sales and
profit performances • Private Label sales represent 8.3% of Group sales• 21 new stores opened, including five outside South Africa,
increasing space by 4.2% • Effective inventory management saw stock days of 63 at
December 2015, better than 64 days a year earlier • Total ecommerce sales now R183 million
Divisional operational review
Massdiscounters Game: 137-store General Merchandise discounter and Food retailer. Trades in South Africa, Botswana, Ghana, Kenya, Lesotho, Malawi, Mozambique, Namibia, Nigeria, Tanzania, Uganda and Zambia.DionWired: 24-store Hi-tech retailer. Trades in South Africa.
Total sales for the 2015 year increased by 8.7% and comparable sales grew by 3.9% with product inflation of 1.7%. Trading profit before interest and tax increased by 30.3% from improving margin management, solid expense control and a good performance from Game Africa, particularly in the second-half of the year.
GameGame SA traded well in a difficult domestic consumer environment and reported total sales growth of 7.8%. Better management of everyday and promotional sales mix and pricing benefited trading margins which, combined with great cost control, saw trading profit up 29.8% which is a
tribute to the energy and focus of Game Chief Executive Officer (CEO), Robin Wright, and his team. Game Africa’s total Rand sales and sales in local currencies increased by 13.5% and 17.5% respectively, with trading profit up 23.8%. We are particularly pleased with the trading performances of our new Game stores in Kitwe (Zambia) and Matola (Mozambique). Despite the difficult economic situation in Nigeria, we are trading at acceptable levels in all four stores in that country. The central bank’s restrictions on foreign currency have had minimal impact on our sourcing because more than 80% of our product is procured locally.
The roll-out of Fresh continues with 84 Game stores now offering this category, and Food and Liquor sales now comprise 21.3% of Game’s total sales and grew at 19% in 2015.
Our SAP IT project takes a material step forward in the second half of 2016 when we commence the point-of-sale software replacement across our stores. The more critical SAP ERP implementation is scheduled for 2017. Our migration from old legacy IT systems towards SAP is a very significant journey in fundamentally improving Game’s customer offering, merchandise control, promotional management, and in-store processes. Whilst this project will cost capital of about R330 million in 2016 and 2017, it will initially only slightly increase IT costs as a % of sales in 2017 and 2018, and then this ratio will decrease steadily.
DionWiredDionWired has consolidated its position as South Africa’s best Appliances and Electronics’ boutique. Given the difficult upper-income consumer environment, we are pleased with total sales growth of 7.8% and saw trading profit growing at a similar level. This format is now ten years old and as we reach the end of the ten-year leases of some of our earliest stores, we will consider closing or reducing space in selected stores. We are conscious of the likely impact of ecommerce on this retail format and so manage our store footprint and offering with that opportunity in mind.
Anti-competitive challengesDuring 2015 there were several developments regarding lease exclusivities and Mike Spivey, our General Counsel, has expertly navigated these issues. These lease exclusivities are legal arrangements contained within certain shopping centre lease agreements that appear to entrench the incumbent major food supermarkets in certain localities within South Africa. In 2014 Massmart formally requested the Competition Commission to investigate these market practices and in mid-2015 self-referred this complaint to the Competition Tribunal. At about the same time the Commission announced its intention to hold a formal inquiry into these tenancy arrangements and in February 2016 announced the names of the panel members who will lead this process. Finally, we have successfully appealed the November 2015 decision of the Supreme Court of Appeal regarding lease exclusivities at the Cape Gate shopping centre.
Store changesEight Game stores (including one each in Kenya, Mozambique, Nigeria and Zambia) were opened and one store was closed; and two DionWired stores were opened and one store was closed, increasing trading space by 5.3% to 533,078m².
Leadership review: Our CEO’s letter to our stakeholders
Our CEO’s letter to our stakeholders continued
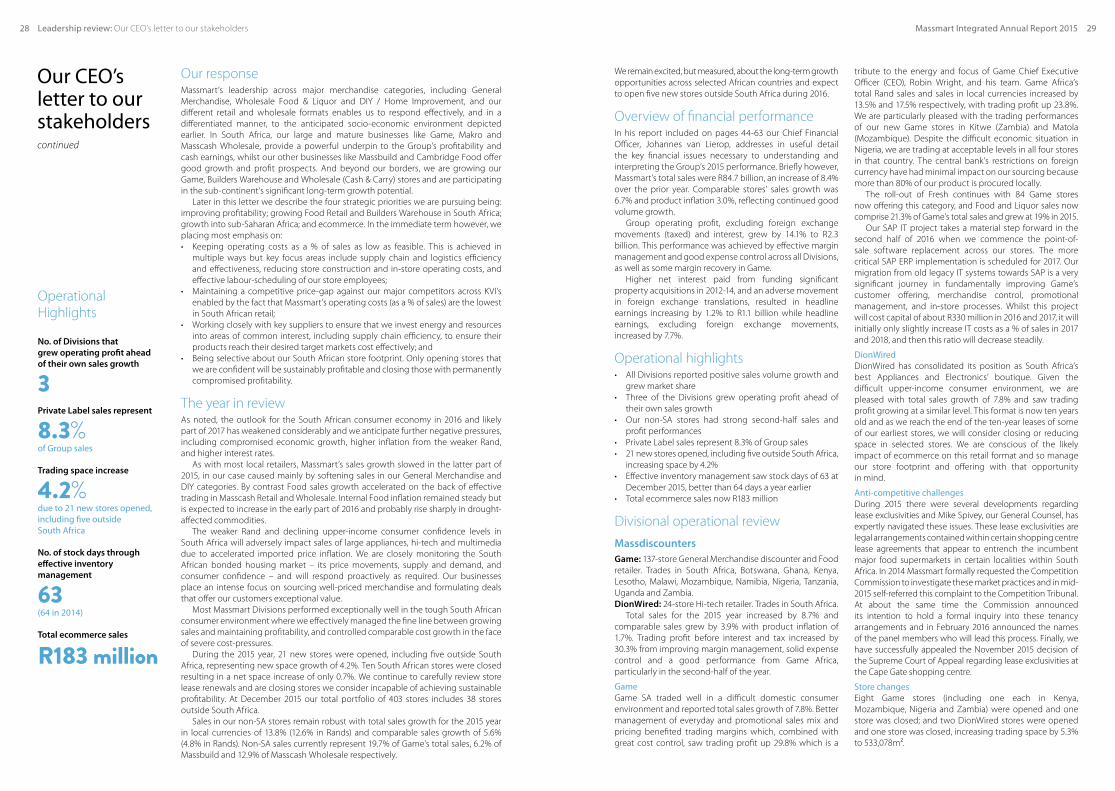
No. of Divisions that grew operating profit ahead of their own sales growth
3Private Label sales represent
8.3%of Group sales
Trading space increase
4.2%due to 21 new stores opened, including five outside South Africa
No. of stock days through effective inventory management
63(64 in 2014)
Total ecommerce sales
R183 million
Operational Highlights
28 29Massmart Integrated Annual Report 2015

Masswarehouse Makro: 19-store Makro warehouse-club trading in Food, General Merchandise and Liquor. Trades in South Africa.The Fruitspot: established wholesaler and distributor of fresh and cut fruit and vegetables. Trades In South Africa.
MakroWith no new stores in 2014 or 2015, Makro’s total and comparable sales growth for the 2015 financial year was 9.8%, with product inflation of 3.4%. The suggested volume growth of 6.4% shows how our customers, both retail and wholesale, continue to respond strongly to Makro’s value proposition. The growth in Makro’s R1.2 billion trading profit before interest and tax was good at 14.8% and was assisted by excellent expense control in the face of trading margin pressure.
The operational efficacy of Makro stores remains breath-taking – 19 stores combined produced annual sales of R23.7 billion – and forms the cornerstone of our lowest cost to operate which, in turn, empowers our ability to trade at margins sustainably lower than major competitors. Makro CEO, Doug Jones, and his team are clear on the need to sustainably maintain this low-cost philosophy.
Online sales, a business unit that is not yet two years old, now represent about 2% of total sales in those categories that form part of the online offering. Makro customer card data indicates that online shoppers continue to visit and shop in our stores, and we see that click & collect remains a popular choice. We are delighted with the response to our new B2B online commercial customer offering, launched in November 2015, which aims to use ecommerce as an enabler for us to better serve the needs of customers like restaurants, caterers, offices and schools.
Fruitspot Although small, Fruitspot is a strategically significant fruit and vegetable distributor and processor for the Group’s Gauteng retail operations. We serve many of the Makro, Game, Cambridge and Masscash stores in the greater Gauteng region and our common Private Label, Marketside, is found in most of these stores. Importantly, it continues to serve third parties which ensure we keep relevant with current pricing and market trends.
Store changesThere was no store movement in 2015 but we are looking forward to opening a new store in April 2016, near Carnival Mall in the east of Johannesburg.
Massbuild 39 Builders Warehouse stores, 41 Builders Express stores, 14 Builders Trade Depot stores and 8 Builders Superstore stores. Offer includes DIY, Home Improvement and Building Materials. Trades in South Africa, Botswana, Mozambique and Zambia.
Massbuild grew total sales for the period by 11.0%, with comparable sales increasing by 7.4% and product inflation of 3.8%. Sales growth in our significant Builders Warehouse format slowed in the later part of 2015. Whilst some of the slowing was in our retail customer base, there was a marked drop-off in commercial and contractor sales particularly those serving local and provincial governments. Also impacting sales growth, by about 1%, is significantly lower generator sales following the welcome recent stabilisation of South African electricity supply. Interestingly, Builders Express sales remain steady which suggests that confidence levels within the South African housing market is stable.
As seen globally, in the short-term the prospects of the DIY / Home Improvement format is closely tied to the health and growth – both in supply and prices – of the bonded residential housing market. Given that the South African housing market may come under pressure this year, there is potential for low but positive sales growth in this Division.
The success and consumer acceptance of the Builders Warehouse format outside South Africa continues to exceed expectations and CEO, Llewellyn Walters, and his team are resolute in their desire to open more of these stores. Total sales in non-SA stores grew by almost 50% and annualised sales may reach R1 billion soon. We have two stores in Botswana, three stores in Mozambique, and in late 2015 opened our first Zambian store.
Massbuild’s trading profit before interest and tax increased by 29.0% on the back of focused margin management and effective expense control.
Leadership review: Our CEO’s letter to our stakeholders
Builders Trade Depot and Builders Superstore For several years we have gradually reduced the number of Builders Trade Depot stores to leave a core of 14 stores focused on being large regional suppliers of building materials and hardware. Whilst this format has good sales, it has undoubtedly been impacted by the success and dominance of Builders Warehouse and Builders Express. The new Superstore format – bringing DIY to middle-income customers in outlying metropolitan areas – continues to exceed expectations and we are expanding this store format beyond the Gauteng province within South Africa.
Store ChangesFour Builders Warehouse stores were opened (including one in Zambia); two Builders Express stores were opened and two closed; and two Builders Trade Depot stores were
closed. Net trading space increased by 2.9% to 449,133m².
Masscash 70 Wholesale Cash and Carry stores. 51 Retail stores, most operating under the Cambridge or Rhino banners. Trades in South Africa, Botswana, Lesotho, Mozambique, Namibia and Swaziland.
Shield, a voluntary buying association trades in South Africa, Botswana, Namibia and Swaziland.In the very competitive South African Wholesale and Retail Food environments, total sales increased by 6.1% and comparable sales increased by 5.8% with product inflation of 2.9%. Product inflation began to increase in the latter part of 2015 as commodity price movements moved from deflation into inflation. This price trend may unfortunately now accelerate as categories like maize, sugar and potatoes are likely to be affected by the drought.
Masscash’s trading profit before interest and tax decreased by 25.8%.
Masscash Wholesale As a consequence of more aggressive trading and some price inflation, Masscash Wholesale’s sales growth accelerated towards the end of the financial year. Wholesale CEO, Neville Dunn, and his team have dealt well with an extremely aggressive and very fluid South African wholesale market, which has recently been plagued by poor tax compliance by some independent industry participants,
and the prevalence of grey or illicit product. This intense trading pressure adversely impacted our margins and we recorded a large profit decline in Wholesale. The modernisation of South African retail necessarily involved some decline in the extent of participation by wholesalers in the distribution of FMCG, and consequently within our business we have been deliberate in closing marginal or unprofitable stores when leases are up for renewal.
Masscash Retail Masscash Retail, trading mostly through the Cambridge and Rhino formats, traded very well, reporting comparable sales growth of 7.3% which is higher than similar figures reported recently by other major South African food retailers. Kevin Vyvyan-Day, the Cambridge CEO, and his team did a superb job in introducing SAP into the KwaZulu-Natal stores during 2015 and still saw growth in sales and profit for 2015.
Store changesThree Wholesale stores were closed and a number were re-sized; whilst five Retail stores were opened and one was closed, resulting in net trading space decreasing by 7.0% to 372,714m².
Other significant achievements In a recent panel discussion hosted by Trialogue, dealing with Sustainability in the Supply Chain, a significant multi-national supplier commented that Massmart is the only South African retailer that regularly requires suppliers to disclose their own environmental progress. We do this through an annual environmental advocacy survey that is supplemented by random site visits which results in the recognition of the top ten environmentally focused suppliers in the Massmart supply chain. The top-performing supplier in 2015 was Belgotex Carpets who were recognised for their installation of a 1MW solar energy plant at their KwaZulu-Natal facility.
This is just one way in which we are working towards advocating responsible practise in our supply chain; other advocacy initiatives include timber and seafood procurement screening, and third party responsible sourcing audits of Private Label, direct import and exclusive brand products.
MOST MASSMART DIVISIONS PERFORMED EXCEPTIONALLY WELL IN THE TOUGH SOUTH AFRICAN CONSUMER ENVIRONMENT...
“
”
Our CEO’s letter to our stakeholders continued
Right:Makro, Alberton
30 31Massmart Integrated Annual Report 2015
33Massmart Integrated Annual Report 2015Leadership review: Our CEO’s letter to our stakeholders
We are equally focused upon ensuring responsible environmental practices in our own operations in which we have long running waste re-cycling, water conservation and energy efficiency programmes. In 2015 we diverted 20,000 tons of operational waste from landfill, saved approximately 17 million litres of water through rain water and condensate harvesting and have avoided 52 million kw/h of electricity consumption equating to 53,000 tons of indirect carbon emissions. I am most proud that in 2016 we will pilot three grid-tied photovoltaic renewable energy projects that we estimate will generate 2.4 million kw/h per annum.
Meanwhile our small business development programme, under the guidance of Brian Leroni, Group Corporate Affairs Executive, continues to seek opportunities to develop and integrate small enterprises into our supply chain. This currently comprises a portfolio of 28 small manufacturers of merchandise such as cooler boxes, clothing, nails, bricks, hollow core doors, charcoal, plumbers tape, fire-gel, maize meal and noodles.
Strategic prioritiesFor the longer-term, our key areas of strategic focus remain unchanged: • Improve the profitability of the core South African business • Continue growing Retail Food and Builders Warehouse in South Africa • Further growth into sub-Saharan Africa • Continue to expand and improve our ecommerce offerings
Group profitability There are two dimensions to this objective – to improve where possible the profitability of each of the Divisions and to ensure that we collaborate across the Divisions to reduce cost duplication and inefficiency. While Makro and Massbuild are operating at acceptable profit margins, the profit margins of Game and Masscash Wholesale and Retail need improvement. Each business has clear short- and medium-term objectives that will enable this. Our collaboration efforts are overseen by our Group Commercial Executive, Llewellyn Steeneveldt, and involve our core functional areas across each Division – like IT, Supply Chain, Real Estate, Merchandise, Private Label – working together. Collaboration takes many forms: negotiating with a single supplier across the Group for best price and service; aligning around a single instance of product master-data; using software to optimally manage primary and secondary transport and logistics; or enforcing a peer-review for new IT projects.
Grow Retail Food and Builders Warehouse in South AfricaWe remain excited at the growth opportunities presented by both Retail Food and Builders Warehouse in South Africa Although still small, Builders Warehouse has a significant relative market share in South African DIY / Home Improvement and we will continue to roll-out this wonderful retail offering through three formats – Builders Warehouse, Builders Express and Builders Superstore. Retail Food, already a R15 billion sales category across the Group, is being rolled-out through adding the Fresh category to Game and Makro stores, and by opening more Rhino and Cambridge stores on a regional basis.
Growth into sub-Saharan Africa As noted elsewhere, our 2015 sales growth from our non-SA stores was strong at 12.6% (and 13.8% in local currencies) which is well above the 8.0% total sales growth reported from our South African stores for the same period. Non-SA sales currently represent 19.7% of Game’s total sales, 6.2% of Massbuild and 12.9% of Masscash Wholesale respectively.
We remain excited, but measured, about the long-term growth opportunities across selected African countries and expect to open five new stores in four countries outside South Africa during 2016.
eCommerce We are alert to the growing presence of online shopping and digital activation in our customers’ lives and how it affects their shopping behaviour and needs. Similarly, we are clear that internationally customer purchases of one of our largest merchandise categories, General Merchandise, have moved significantly online. In response, there are three current ecommerce offerings within Massmart: B2B, General Merchandise and Liquor in Makro; DionWired’s Hi-tech merchandise range; and, in Masscash, Shield’s B2B platform.
Combined these represented sales of R183 million in 2015 and we are seeing significant acceleration in this sales growth. Makro’s online sales, for example, in the fourth quarter of 2015 were double those for the same 2014 period. In Massbuild a project is underway to provide our contractor and commercial customers an online platform to enable and expedite online shopping including access to credit and associated services.
Linked to ecommerce and digital is the provision of a broad array of financial services to our retail customers. We are pleased that a seasoned executive with many years’ experience in this area of retail, Gerhard Hayes, has joined the Group and work is already underway to improve our offering.
The Board and Executive CommitteesMy Board and Executive Committee colleagues are a source of great counsel and support. At Board level we have ready access to skills and experience across diverse areas including international retail, multinationals, corporate governance and risk, public policy and transformation, and real estate. This counsel, of course, extends beyond me to my Executive Committee colleagues and senior management. I formally thank and acknowledge the support the business and I have received from my Board colleagues, and I recognise the leadership, strategic debate and operational execution that comes from my Executive Committee colleagues.
Following the November 2015 resignation of Mrs. Shelley Broader, I was pleased that Walmart appointed Mr. Enrique Ostalé to the Board in February 2016. Enrique is the President and Chief Executive Officer of the Walmart Latam, India and Africa Region and I look forward to his contribution to Board deliberations, and to me as CEO.
Earlier in 2015 we announced the appointment of Mr. Moses Kgosana as an independent non-Executive Director and member of the Audit and Risk Committees, and he has already made an impact on the Board and sub-committees. I have previously acknowledged the enormous and extended impact on Massmart of our former Group Finance Director, Mr. Ilan Zwarenstein, who resigned in early 2015.
Mrs. Pearl Maphoshe resigned from Massmart and the Executive Committee in early 2015. Pearl was instrumental in designing and implementing most aspects of Massmart’s very successful Executive and Management Training & Development programmes, and was also a strong advocate for racial and gender transformation with the Group. We were fortunate in that Pearl had groomed a very competent successor in Jane Bruyns who readily stepped into her role.
Our people and transformationThe retail and wholesale environment in South Africa and many African countries has been, even for our demanding industry, exceptionally difficult in recent times. This places additional pressure on our 48,000 colleagues whose dedication and hard work ensure Massmart’s ability to consistently exceed the expectations of the customers who shop in our stores. It is as a direct result of their commitment that Massmart has been able to report this improved financial performance in 2015. I would like to thank every one of them for their loyalty and support.
During 2016 we anticipate finalising the insourcing of several categories of employees currently employed by labour-brokers. It is likely that this decision, which we consider to be the right thing to do for those employees, will place some pressure on our employment costs. This important and complex process is being managed by our Group Human Capital Executive, Jane Bruyns, and her HR community.
For a business to be sustainable it must reflect, and be responsive to the needs, nature and direction of the society within which it operates. We believe that diversity, or transformation, makes a business stronger, more resilient and more responsive. As a major South African corporate, we continue to focus on the transformation of our senior and Executive management.
ProspectsFor the 13 weeks to 29 March 2016, total sales increased by 9.0% and comparable sales increased by 7.2%. This year’s Easter period is earlier than in the prior year and has likely bolstered recent sales growths. We continue to see strong sales growth from our non-SA stores.
We remain of the view that for 2016 and possibly 2017, the anticipated South African economic environment will constrain consumer spending across several key Group categories including General Merchandise and Home Improvement / DIY, whilst our substantial Food and Liquor categories may perform relatively better. There may be severe pricing pressure on lower-income households and we are resolved to keep our baskets affordable for those households.
The financial information on which this outlook statement is based has not been reviewed or reported on by the Company’s external auditors.
ConclusionOur appreciation and gratitude is due to all our stakeholders for their contribution and commitment to Massmart during this period.
Guy HaywardChief Executive Officer 1 April 2016
GROW ONLINE
GROW INTO AFRICA
IMPROVE PROFITABILITY
GROW BUILDERS AND RETAIL FOOD IN SOUTH AFRICA
More information on our strategic priorities can be found on p18-19
Our CEO’s letter to our stakeholders continued
See p114 for more about SDP initiatives and other programmes.
32

Our BoardThe Board of Massmart is responsible for directing the Group towards achieving Massmart’s vision and mission.
A Audit
E Executive
M Remuneration
N Nomination
R Risk
SE Social and EthicsFor the complete and detailed CVs of the Board members, please visit
www.massmart.co.za/iar2015/CVs
Guy Hayward (50)Chief Executive Officer
Employee since 2000/Appointed 15 May 2001 BCom, CTA (UCT), CA(SA)
SEE R
Johannes van Lierop (49)
Chief Financial Officer
Employee since 2015/Appointed 12 March 2015Hotel and Catering Management Degree, Bachelor of Business Economics, Chartered Accountant – RA (Amsterdam)
E
R
Phumzile Langeni (41)Appointed 25 August 2004BCom (Natal), BCom Hons (Unisa)
A RSE
Raboijane (Moses) Kgosana (57)1 September 2015BCompt (Unisa), BCompt Hons (Unisa), CA(SA)
A R
Dr Nolulamo (Lulu) Gwagwa (57)Appointed 1 November 2006MTRP (Natal), MSc (LSE), PhD (UCL)
RAChris Seabrooke (63)Deputy Chairman of the Board
Appointed 1 February 2000BCom, BAcc, MBA, FCMA
A
M
N
R
Kuseni Dlamini (48)Chairman of the Board
Appointed 10 April 2014BA (Hons) (Natal), MPhil (Oxon)
M
N
Enrique Ostalé (55)President and CEO of Walmart Latam, India & Africa and Chairman of the board of directors of Walmart Mexico, Central America and Chile
Appointed 24 February 2016Commercial Engineering, Major in Business Administration (Adolfo Ibáñez University, Chile) and MSc in Accounting and Finance (LSE)
M
N
JP Suarez (52)Senior Vice President of Realty and Walmart US
Appointed 20 June 2011BA (Hons) (Tufts University) JD (University of Pennsylvania)
SE
Andy Clarke (52)President and Chief Executive Officer of ASDA
Appointed 16 July 2014
INDEPENDENT NON-EXECUTIVE DIRECTORS
NON-INDEPENDENT NON-EXECUTIVE DIRECTORS
EXECUTIVE DIRECTORS
Leadership review: Our Board34 35Massmart Integrated Annual Report 2015

Leadership review: Our Executive Committee
Our Executive Committee
The Massmart Executive Committee assist the CEO and CFO as they deliberate, take decisions or make recommendations on all matters of strategy and operations.
R Risk
SE Social and Ethics
Guy Hayward (50)Chief Executive Officer
Appointed 2001BCom, CTA (UCT), CA(SA)
R
SE
Johannes van Lierop (49)Chief Financial Officer
Appointed 2015Hotel and Catering Management Degree, Bachelor of Business Economics, Chartered Accountant – RA (Amsterdam)
R
Gerhard Hayes (40)Group Financial Services Executive
Appointed 2015BCom Hons, Economics, (Unisa) BEc, Economics (Stellenbosch University)
Doug Jones (43)Divisional Chief Executive of Masswarehouse
Appointed 2012BCom, PGDA (UCT), CA(SA)
Chairman of the Food Forum and Chairman of Massmart Corporate University’s School of Management Development
Mike Spivey (52)Massmart General Counsel
Appointed 2011 BSc and Juris Doctorate (University of Arkansas), Master’s in Law in International Banking and Finance (Boston University)
R
Jane Bruyns (55)Group Human Capital Executive
Appointed 2015Henley Management College – MBA, Business; Diploma in Management, Business
Chairman of the HR Forum
Kevin Vyvyan-Day (51)Divisional Chief Executive of Masscash Retail
Appointed 2005BCom, BAcc (Wits), CA(SA)
Chairman of the General Merchandise Forum
Llewellyn Walters (52)Divisional Chief Executive of Massbuild
Appointed 2008BA, LLB (Wits)
Chairman of the Africa and the Supply Chain Forums
Robin Wright (60)Divisional Chief Executive of Massdiscounters
Appointed 1998BCom (Natal), CA(SA)
Chairman of the Cellular Forum
For the complete and detailed CVs of the Executive Committee, please visit www.massmart.co.za/iar2015/CVs
Neville Dunn (47)Divisional Chief Executive of Masscash Wholesale
Appointed 2012BCom (Natal), CA(SA)
Chairman of the Liquor Forum
Norman Gray (59)Chief Ethics & Compliance Officer
Appointed 2015MBA (UK), FCMI (UK), Dip Mgmt (UK), CRMA & Certified Ethics Officer
R
Brian Leroni (51)Group Corporate Affairs Executive
Appointed 2007BA (Wits), MPhil (Stellenbosch)
Llewellyn Steeneveldt (47) Group Commercial Executive
Appointed 2009BSc Eng (Phys Met), GDE (Industrial), MBA
Chairman of the Real Estate Committee and Chairman of the TIP and Operations Forums
36 37Massmart Integrated Annual Report 2015
38 39Massmart Integrated Annual Report 2015Our performance
02Our performance
Defining the capitals 40Financial capital 41Manufactured capital 70Human capital 88Natural capital 106Social and Relationship capital 110Intellectual capital 117
We have structured this section to demonstrate our performance
against the six types of capitals. These capitals represent an
important picture of our organisation’s value creation.

40 41Massmart Integrated Annual Report 2015Our performance: Defining the capitals
For the year ended December 2015 Massmart’s total sales of R84.7 million grew by 8.4% over the prior year, while comparable stores’ sales grew by 6.7%. Group operating profit, excluding foreign exchange movements and interest, grew by 14.1% to R2.3 billion. Headline earnings before foreign exchange movements (taxed) increased by 7.7%.
Financial capital
In 2015…
What we did well:We maintained or grew market share in each major category in which we trade.
We increased our Africa sales component from 8.1% to 8.4% of total Group sales and grew our African sales in ZAR by 12.6% and in constant local currencies by 13.8%. Despite an increased asset base as a result of our key property acquisitions in recent years and new store roll-outs, comparable expenses were well controlled at 6.0%, below comparable sales of 6.7%.
Our stringent application of our philosophy “we operate for less” resulted in operating profit before interest and foreign exchange movements (taxed) increasing by 14.1%, up from R2,015.9 million in 2014.
We continued our measured approach to store roll-outs as we expanded our store footprint, opening 21 stores during the year, five of which were in Africa.In line with our strategic priority of growth in ecommerce, we maintained our focused investment in IT infrastructure.
The improvements we made:We improved our funding gap by increasing our creditor days, reducing our inventory days and maintaining our debtor days.
As a result of our recent key property acquisitions, we were able to control the growth in our occupancy costs at 7.0% with a comparable growth of 4.4%.
The challenges we’re facing:As our African footprint has expanded, so too has our exposure to foreign currency fluctuations and in response, we are actively managing the value and currency of our foreign-denominated loan balances, where practicable, and we take out foreign exchange contracts on selected exposures.
Our increased level of gearing, coupled with recent interest rates hikes, has increased our net finance costs by 37.6%.
Defining the capitals
FINANCIAL CAPITAL
as the funds available to and utilised by the Group
MANUFACTURED CAPITAL
as our Divisional structure through which we sell our products and services
HUMAN CAPITAL
as our commitment to our people
INTELLECTUAL CAPITAL
as how, through innovation, we pass on benefits to our customers
SOCIAL & RELATIONSHIP CAPITAL
as our commitment to champion social equality initiatives in our business and through our supply chain, as well as the value added to our business through our relationship with our stakeholders
NATURAL CAPITAL
as our commitment to collectively reduce our environmental footprint and to enable a sustainable supply and consumerism
Massmart defines….

42 43Massmart Integrated Annual Report 2015
Financial performance by Division
R19,514.1 mUp 8.7% (2014: R17,955.2 m)
23.0%
R235.4 mUp 30.3% (2014: R180.7 m)
10.0%
R8,234.5 mIncreased from R7,985.5 m in 2014
R7,999.0 mIncreased from R7,820.9 m in 2014
R527.4 mDecreased from R542.2 m in 2014
533,078 m2Increased 5.3%(2014: 506,188 m2)
161 Increased by 8 stores (2014: 153 stores)
R23,675.9 mUp 9.8% (2014: R21,554.8 m)
27.9%
R1,198.7 mUp 14.8% (2014: R1,044.3 m)
51.0%
R8,314.0 mIncreased from R7,689.0 m in 2014
R7,865.3 mIncreased from R7,312.1 m in 2014
R234.4 mIncreased from R70.3 m in 2014
195,794 m2no change(2014: 195,794 m2)
19 no change(2014: 19 stores)
R12,010.6 mUp 11.0% (2014: R10,822.8 m)
14.2%
R693.6 mUp 29.0% (2014: R537.6 m)
29.5%
R5,122.1 mIncreased from R5,027.7 m in 2014
R4,602.8 mDecreased from R 4,730.6 m in 2014
R351.6 mIncreased from R296.8 m in 2014
449,133 m2Increased 2.9% (2014: 436,538 m2)
102 Increased by 2 stores (2014: 100 stores)
R29,531.2 mUp 6.1% (2014: R27,840.4 m)
34.9%
R222.0 mDown 25.8% (2014: R299.1 m)
9.5%
R9,686.4 mIncreased from R8,529.8 m in 2014
R9,081.0 mIncreased from R7,882.0 m in 2014
R349.4 mIncreased from R269.9 m in 2014
372,714 m2Down 7.0% (2014: 400,775 m2)
121 Increased by 1 store (2014: 120 stores)
Sales R84,731.8 mUp 8.4% (2014: R78,173.2 m)
Trading profit before interest and tax
R2,349.7 mUp 14.0% (2014: R2,061.7 m)
Total assets* R30,730.3 mIncreased from R28,906.4 m in 2014
Total liabilities* R24,939.2 mIncreased from R23,379.2 m in 2014
Net capital expenditure*
R1,649.6 mDecreased from R2,147.0 m in 2014
Trading space 1,550,719 m2Increased 0.7%(2014: 1,539,295 m2)
Number of stores 403 Increased by 11 stores (2014: 392 stores)
Our performance: Financial capital
* Group consolidating entries: Total assets -R0.6 bn (2014: -R0.3 bn) / Total liabilities -R4.6 bn (2014: -R4.4 bn) / Net capital expenditure R0.2 bn (2014: R1.0 bn)
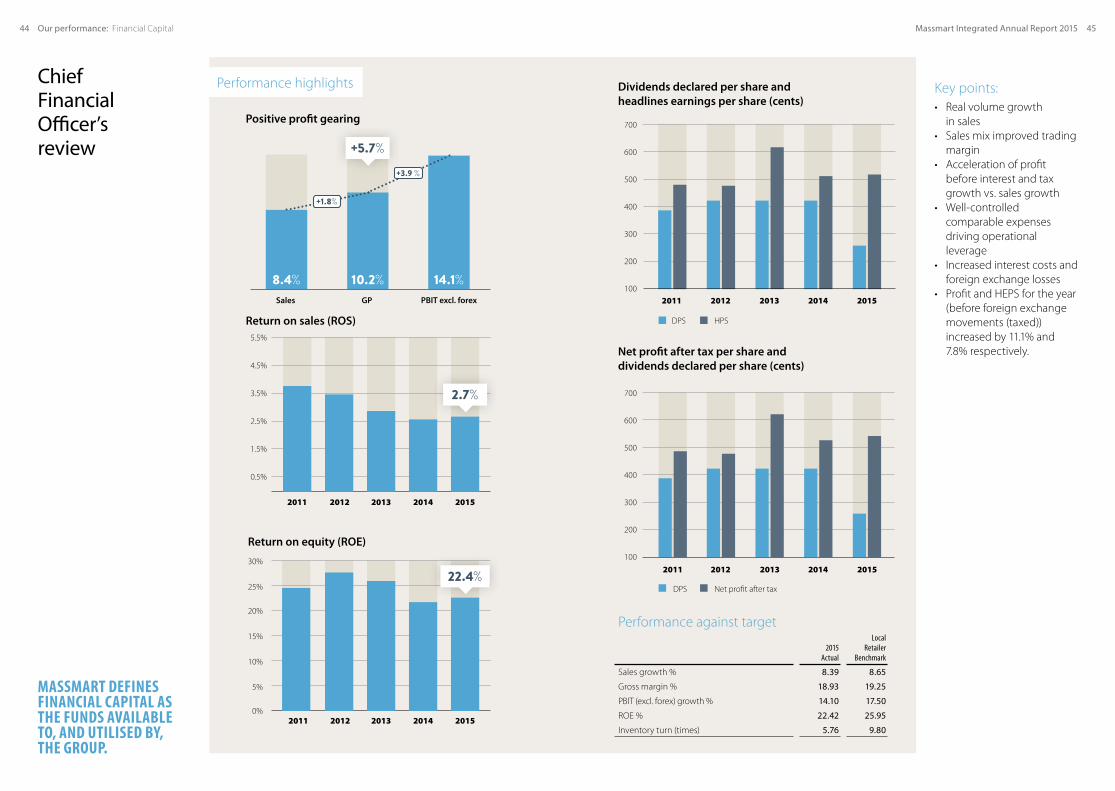
44 45Massmart Integrated Annual Report 2015Our performance: Financial Capital
Performance against target
2015 Actual
Local Retailer
Benchmark
Sales growth % 8.39 8.65
Gross margin % 18.93 19.25
PBIT (excl. forex) growth % 14.10 17.50
ROE % 22.42 25.95
Inventory turn (times) 5.76 9.80
Key points:• Real volume growth
in sales• Sales mix improved trading
margin • Acceleration of profit
before interest and tax growth vs. sales growth
• Well-controlled comparable expenses driving operational leverage
• Increased interest costs and foreign exchange losses
• Profit and HEPS for the year (before foreign exchange movements (taxed)) increased by 11.1% and 7.8% respectively.
Performance highlightsChief Financial Officer’s review
MASSMART DEFINES FINANCIAL CAPITAL AS THE FUNDS AVAILABLE TO, AND UTILISED BY, THE GROUP.
22.4%
Return on equity (ROE)
2011 2012 2013 2014 2015
30%
25%
20%
15%
10%
5%
0%
Dividends declared per share and headlines earnings per share (cents)
2011 2012 2013 2014 2015
700
600
500
400
300
200
100
700
600
500
400
300
200
100
Net profit after tax per share and dividends declared per share (cents)
2011 2012 2013 2014 2015
2.7%
Return on sales (ROS)
2011 2012 2013 2014 2015
5.5%
4.5%
3.5%
2.5%
1.5%
0.5%
Positive profit gearing
8.4% 10.2% 14.1%
+1.8%
+3.9 %
+5.7%
DPS HPS
Net profit after taxDPS
Sales GP PBIT excl. forex

46 47Massmart Integrated Annual Report 2015Our performance: Financial Capital
SalesDespite the precarious South African economy and ebbing consumer confidence, total Group sales increased by 8.4% over the prior year, with comparable sales growing by 6.7%. Product inflation dropped from 4.8% in the prior year to 3.0%, as a result of commodity deflation experienced during the year and suggests real comparable volume growth of 3.7% in the current year. As the impact of the weaker Rand and the lack of rain is passed on in the form of an increase in food prices this year, we expect food inflation to increase. General Merchandise, Food & Liquor and Home Improvement inflation decreased over the prior year to 2.5%, 3.2% and 3.8% respectively. Sales in our other African businesses represented 8.4% (2014: 8.1%) of total sales and increased by 12.6% in Rands. The Group maintained or grew market share in each major category in which it trades during the year.
Definition: A store is considered comparable in the 13th month of trading and is removed from the calculation of comparable sales from the first day of the month of closure.
Inflation
%
December 2015
52 weeks
December 2014
52 weeks
Group product inflation 3.0 4.8
Food and Liquor inflation 3.2 5.1
Home Improvement inflation 3.8 6.0
General Merchandise inflation 2.5 3.6
More information relating to sales can be found in note 5 of the Group’s Annual Financial Statements www.massmart.co.za/iar2015/groupafs
Summary consolidated income statement
Rm
December2015
(Audited)
December2014
(Audited) %
change
Revenue 84,857.4 78,319.0 8.3
Sales 84,731.8 78,173.2 8.4
Cost of sales (68,689.6) (63,610.8) (8.0)
Gross profit 16,042.2 14,562.4 10.2
Other income 125.6 145.8 (13.9)
Depreciation and amortisation (946.2) (846.6) (11.8)
Impairment of assets (25.7) (24.6) (4.5)
Employment costs (6,784.3) (6,109.0) (11.1)
Occupancy costs (2,865.6) (2,678.8) (7.0)
Other operating costs (3,245.8) (3,033.3) (7.0)
Operating profit before foreign exchange movements and interest 2,300.2 2,015.9 14.1
Foreign exchange loss (149.8) (49.8) (200.8)
Operating profit before interest 2,150.4 1,966.1 9.4
– Finance costs (507.7) (386.8) (31.3)
– Finance income 32.4 41.5 (21.9)
Net finance costs (475.3) (345.3) (37.6)
Profit before taxation 1,675.1 1,620.8 3.4
Taxation (505.9) (483.4) (4.7)
Profit for the year 1,169.2 1,137.4 2.8
Profit attributable to:
– Owners of the parent 1,112.8 1,079.8 3.1
– Non-controlling interests 56.4 57.6 (2.1)
Profit for the year 1,169.2 1,137.4 2.8
Basic EPS (cents) 513.5 497.8 3.2
Diluted basic EPS (cents) 506.1 492.9 2.7
Dividend (cents):
– Interim 146.0 146.0 –
– Final 112.2 275.0 (59.2)
– Total 258.2 421.0 (38.7)
Sales split
Owned vs. leased store sales
Leased
Owned30.9%
69.1%
Leased
Owned30.7%
69.3%
Leased
Owned27.3%
72.7%
Leased
Owned12.6%
87.4%
South African sales
Rest of Africa8.1%
91.9%2014
2015
2014
2013
2012
South African sales
Rest of Africa8.4%
91.6%2015
Rest of Africa sales grew by 12.6% in ZAR and 13.8% in local currency. Comparable sales growth of 6.7%
Includes dividends from unlisted investments.
Gross profit % increased from 18.6% to 18.9%
Rand weakened against the US Dollar by 17.6% over the year
A consequence of our key property acquisitions as well as interest rate hikes. Average interest-bearing borrowings increased to R3.5 billion
Impairment of tangible assets in Masscash due to store closures
Increased as a percentage of sales from 16.2% to 16.4%. Comparable operating expense growth reduced from 7.1% to 6.0%. Growth in total operating expenses down to 9.3%, however still ahead of sales growth
Chief Financial Officer’s review continued

48 49Massmart Integrated Annual Report 2015Our performance: Financial Capital
Gross profitThe Group’s gross profit of 18.9% is higher than the prior year of 18.6%. The Group’s gross margin is dependent upon the sales mix across the Divisions and the trading aggression occasioned by us and our competitors’ activity. Most of this increase is as a result of the portfolio effect where our highest margin business, Massbuild, grew sales the fastest. In addition, better margin management within Game also contributed to this increase. Gross profit includes rebates and other forms of income earned from suppliers.
Other income and operating expensesIncluded within other income are dividends from unlisted investments. Total operating expenses (excluding foreign exchange movements) increased by 9.3% over the prior year. Comparable operating expenses were well-controlled and increased by 6.0%. Year-on-year, expenses as a percentage of sales has increased from 16.2% to 16.4%. The increase in total expenses is as a result of the Group’s continued investment in new stores (including five new stores in Africa); the acquisition of key properties during the second half of the prior year and first half of the current year; the investment in Food Retail (an additional 18 new/converted stores including a Food offering); the roll-out of SAP across some of the Divisions; and the development of an online platform for Massbuild SA. Occupancy costs increased by 7.0% (comparable increase of 4.4%). This is reflecting the impact of the recent acquisition of some of our key properties. In the year a net 11 new stores and one new DC were opened.
Massmart stores 2015 in numbers
21Total new stores opened
5New stores opened in Africa
403Total stores
0.7%Net trading space increase
1.55 millionm2 net trading space
Above:Jumbo East London
Game margin management
Product and business mix
2014 actual
0.1%0.2%
18.6%18.6%
+0.3%
18.6% 18.9%2014 2015
More information on activities within the four Divisions can be found on p72-87
• December 2014: Operating profit before foreign exchange movements (taxed) of R2,015.9 million
• Total Group sales for the period increased by 8.4%• Gross profit for the period increased by 10.2%
• Total increase of 11.1% / Comparable increase of 7.7%• Increase in staff (Full-Time Equivalents) of 1.7% to +/-
48,000 FTE’s• IFRS2 charge represents 1.3% of the increase
• Total increase of 7.0% / Comparable increase of 4.4%• Property purchases in the last 24 months have contributed
to this improvement• 0.7% increase of net new trading space since Dec 2014 to a
total of 1,550,719m²• Electricity, rates and taxes increased by approximately 13.8%
• Depreciation growth of 11.8% / Comparable increase of 8.0%• Increase in line with property purchases
• Total increase of 7.0% / Comparable increase of 3.4%• Increased investment in IT infrastructure across the Group
• December 2015: Operating profit before foreign exchange movements (taxed) of R2,300.2 million
• R284 million improvement/increase of 14.1%
Operating profit before foreign exchange movements and interest
December 2014
Sales-related gross margin
Price-and-mix-related gross margin
Employment costs
Occupancy costs
Depreciation, Amortisation and Impairment of Assets
Other operating costs
December 2015
Rbn
Chief Financial Officer’s review continued
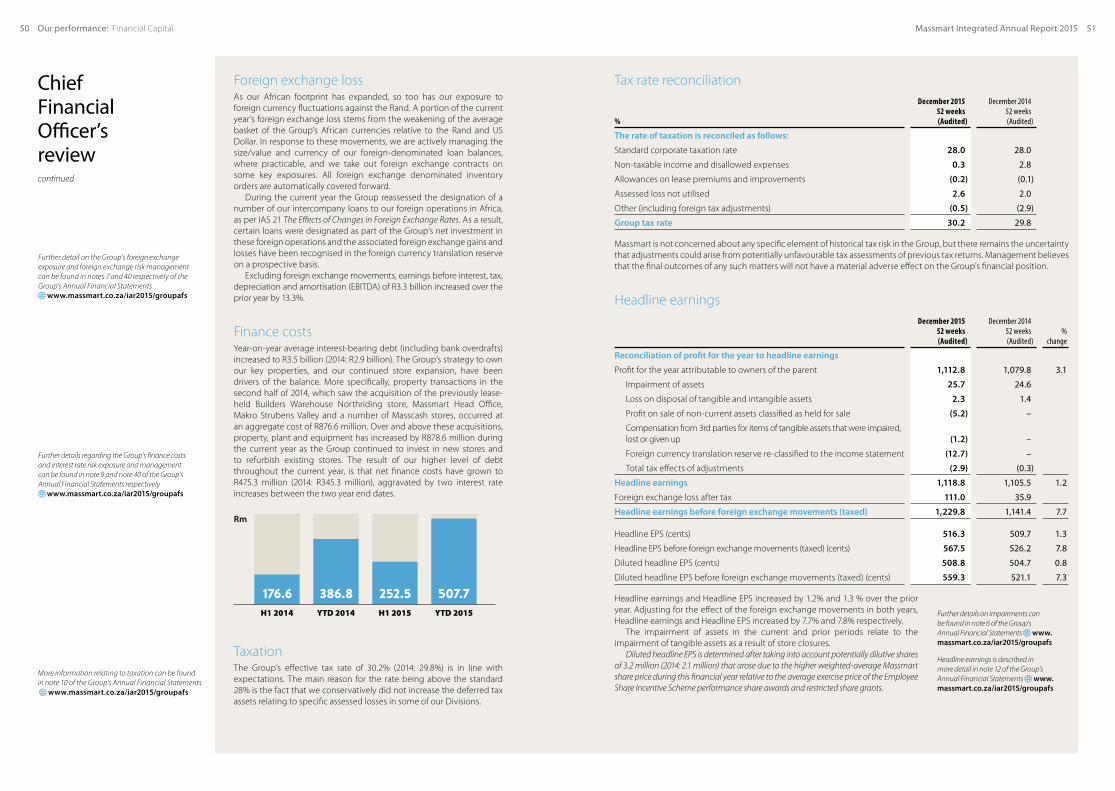
50 51Massmart Integrated Annual Report 2015Our performance: Financial Capital
Foreign exchange lossAs our African footprint has expanded, so too has our exposure to foreign currency fluctuations against the Rand. A portion of the current year’s foreign exchange loss stems from the weakening of the average basket of the Group’s African currencies relative to the Rand and US Dollar. In response to these movements, we are actively managing the size/value and currency of our foreign-denominated loan balances, where practicable, and we take out foreign exchange contracts on some key exposures. All foreign exchange denominated inventory orders are automatically covered forward.
During the current year the Group reassessed the designation of a number of our intercompany loans to our foreign operations in Africa, as per IAS 21 The Effects of Changes in Foreign Exchange Rates. As a result, certain loans were designated as part of the Group’s net investment in these foreign operations and the associated foreign exchange gains and losses have been recognised in the foreign currency translation reserve on a prospective basis.
Excluding foreign exchange movements, earnings before interest, tax, depreciation and amortisation (EBITDA) of R3.3 billion increased over the prior year by 13.3%.
Finance costs Year-on-year average interest-bearing debt (including bank overdrafts) increased to R3.5 billion (2014: R2.9 billion). The Group’s strategy to own our key properties, and our continued store expansion, have been drivers of the balance. More specifically, property transactions in the second half of 2014, which saw the acquisition of the previously lease-held Builders Warehouse Northriding store, Massmart Head Office, Makro Strubens Valley and a number of Masscash stores, occurred at an aggregate cost of R876.6 million. Over and above these acquisitions, property, plant and equipment has increased by R878.6 million during the current year as the Group continued to invest in new stores and to refurbish existing stores. The result of our higher level of debt throughout the current year, is that net finance costs have grown to R475.3 million (2014: R345.3 million), aggravated by two interest rate increases between the two year end dates.
Tax rate reconciliation
%
December 201552 weeks(Audited)
December 201452 weeks(Audited)
The rate of taxation is reconciled as follows:
Standard corporate taxation rate 28.0 28.0
Non-taxable income and disallowed expenses 0.3 2.8
Allowances on lease premiums and improvements (0.2) (0.1)
Assessed loss not utilised 2.6 2.0
Other (including foreign tax adjustments) (0.5) (2.9)
Group tax rate 30.2 29.8
Massmart is not concerned about any specific element of historical tax risk in the Group, but there remains the uncertainty that adjustments could arise from potentially unfavourable tax assessments of previous tax returns. Management believes that the final outcomes of any such matters will not have a material adverse effect on the Group’s financial position.
Headline earningsDecember 2015
52 weeks(Audited)
December 201452 weeks(Audited)
% change
Reconciliation of profit for the year to headline earnings
Profit for the year attributable to owners of the parent 1,112.8 1,079.8 3.1
Impairment of assets 25.7 24.6
Loss on disposal of tangible and intangible assets 2.3 1.4
Profit on sale of non-current assets classified as held for sale (5.2) –
Compensation from 3rd parties for items of tangible assets that were impaired, lost or given up (1.2) –
Foreign currency translation reserve re-classified to the income statement (12.7) –
Total tax effects of adjustments (2.9) (0.3)
Headline earnings 1,118.8 1,105.5 1.2
Foreign exchange loss after tax 111.0 35.9
Headline earnings before foreign exchange movements (taxed) 1,229.8 1,141.4 7.7
Headline EPS (cents) 516.3 509.7 1.3
Headline EPS before foreign exchange movements (taxed) (cents) 567.5 526.2 7.8
Diluted headline EPS (cents) 508.8 504.7 0.8
Diluted headline EPS before foreign exchange movements (taxed) (cents) 559.3 521.1 7.3
Headline earnings and Headline EPS increased by 1.2% and 1.3 % over the prior year. Adjusting for the effect of the foreign exchange movements in both years, Headline earnings and Headline EPS increased by 7.7% and 7.8% respectively.
The impairment of assets in the current and prior periods relate to the impairment of tangible assets as a result of store closures.
Diluted headline EPS is determined after taking into account potentially dilutive shares of 3.2 million (2014: 2.1 million) that arose due to the higher weighted-average Massmart share price during this financial year relative to the average exercise price of the Employee Share Incentive Scheme performance share awards and restricted share grants.
Chief Financial Officer’s review continued
Further details regarding the Group’s finance costs and interest rate risk exposure and management can be found in note 9 and note 40 of the Group’s Annual Financial Statements respectively
www.massmart.co.za/iar2015/groupafs
H1 2014 YTD 2014 H1 2015 YTD 2015
507.7252.5386.8176.6
Further detail on the Group’s foreign exchange exposure and foreign exchange risk management can be found in notes 7 and 40 respectively of the Group’s Annual Financial Statements
www.massmart.co.za/iar2015/groupafs
TaxationThe Group’s effective tax rate of 30.2% (2014: 29.8%) is in line with expectations. The main reason for the rate being above the standard 28% is the fact that we conservatively did not increase the deferred tax assets relating to specific assessed losses in some of our Divisions.
More information relating to taxation can be found in note 10 of the Group’s Annual Financial Statements www.massmart.co.za/iar2015/groupafs
Further details on impairments can be found in note 6 of the Group’s Annual Financial Statements www.massmart.co.za/iar2015/groupafs
Headline earnings is described in more detail in note 12 of the Group’s Annual Financial Statements www.massmart.co.za/iar2015/groupafs
Rm

52 53Massmart Integrated Annual Report 2015Our performance: Financial Capital
EBITDA and EBITDAR
Rm
December2015
52 weeks(Audited)
December 2014
52 weeks(Audited)
%change
Operating profit before foreign exchange movements 2,300.2 2,015.9 14.1%
Depreciation and amortisation 946.2 846.6 11.8%
Impairment of assets 25.7 24.6
EBITDA 3,272.1 2,887.1 13.3%
Occupancy costs 2,865.6 2,678.8 7.0%
EBITDAR 6,137.7 5,565.9 10.3%
Summary consolidated statement of comprehensive income
Rm
December2015
(Audited)
December2014
(Audited) %
change
Profit for the year 1,169.2 1,137.4 2.8
Items that will not subsequently be re-classified to the income statement: 5.0 (8.9)
Net post retirement medical aid actuarial profit/(loss) 5.0 (8.9)
Items that will subsequently be re-classified to the income statement: (21.2) (55.6)
Foreign currency translation reserve (24.2) (53.7)
Cash flow hedges – effective portion of changes in fair value 4.4 1.4
Fair value movement on available-for-sale financial assets (3.5) (3.7)
Income tax relating to components of other comprehensive income 2.1 0.4
Total other comprehensive loss for the year, net of tax (16.2) (64.5)
Total comprehensive income for the year 1,153.0 1,072.9 7.5
Total comprehensive income attributable to:
– Owners of the parent 1,096.6 1,015.3
– Non-controlling interests 56.4 57.6
Total comprehensive income for the year 1,153.0 1,072.9 7.5
Summary consolidated statement of financial position
Rm
December2015
(Audited)
December2014
(Audited)%
change
Non-current assets 12,031.2 11,018.3
Property, plant and equipment 8,117.8 7,239.2 12.1
Goodwill and other intangible assets 2,999.1 2,958.7
Investments and other financial assets 165.1 158.2
Deferred taxation 749.2 662.2
Current assets 18,687.6 17,870.1
Other current financial assets – 229.3
Inventories 11,934.5 11,228.8 6.3
Trade and other receivables 4,697.4 4,288.3 9.5
Taxation 50.8 56.3
Cash on hand and bank balances 2,004.9 2,067.4
Non-current assets classified as held for sale 11.5 18.0
Total assets 30,730.3 28,906.4
Total equity 5,791.1 5,527.2
Equity attributable to owners of the parent 5,636.0 5,334.4 5.7
Non-controlling interests 155.1 192.8
Non-current liabilities 3,053.4 3,236.8
Interest-bearing borrowings 1,819.6 2,133.9
Deferred taxation 73.5 61.3
Other non-current liabilities and provisions 1,160.3 1,041.6
Current liabilities 21,885.8 20,142.4
Trade, other payables and provisions 20,077.7 18,518.9 8.4
Taxation 155.6 208.3
Bank overdrafts 446.4 584.0
Interest-bearing borrowings 1,206.1 831.2
Total equity and liabilities 30,730.3 28,906.4
Loan asset of R214m transferred to property, plant and equipment upon legal transfer of the Makro Amanzimtoti store during the current year
Inventory days decreased to 63 days (2014: 64 days);the 6.3% increase in inventory is below the sales increase of 8.4%
Average interest-bearing debt increased to R3.5 billion and gearing ratio increased from 44.5% to 54.6%
Increase in lease smoothing liability of R110.7 million
Creditors’ days increased from 75 to 76 days
Includes additions of R1.7 billion relating to new store openings, improvements to existing stores and a DC.
Acquisition of businesses within Masscash Division as well as the acquisition of an insurance brokerage company resulted in an increase in goodwill of R43.9 million
Reconciliation between trading profit and operating profit before foreign exchange movements, interest and taxation
Rm
December2015
(Audited)
December 2014
(Audited)
Profit before interest and taxation
Trading profit before interest and taxation 2,349.7 2,061.7
Impairment of assets (25.7) (24.6)
BEE transaction IFRS 2 charge (23.8) (21.2)
Operating profit before foreign exchange movements and interest 2,300.2 2,015.9
Chief Financial Officer’s review continued

54 55Massmart Integrated Annual Report 2015Our performance: Financial Capital
Property, plant and equipment and other intangible assets The net book value of property, plant and equipment has increased by 12.1% since 2014, mainly as a result of our investment in new stores and the refurbishment of some of our existing stores.
More information relating to property, plant and equipment and other intangible assets can be found in notes 13 and 15 of the Group’s Annual Financial Statements respectively www.massmart.co.za/iar2015/groupafs.
Acquisition of subsidiaries and businessesIn the current financial year upon the acquisition of Unison Risk Management Alliance Proprietary Limited, goodwill of R0.6 million arose. The acquisition of liquor businesses within the Massdiscounters Division resulted in goodwill of R6.7 million and the acquisition of general merchandising and food businesses within the Masscash Division a further R36.6 million. These business combinations are not considered to be significant.
Acquisition of subsidiaries and businesses including goodwill are described in more detail in notes 4 and 14 of the Group’s Annual Financial Statements www.massmart.co.za/iar2015/groupafs
Investments and other financial assetsThe Group sells extended warranties and places general insurance through vehicles facilitated by Mutual & Federal. In addition, the Group will sell credit life insurance through a vehicle by arrangement with Guardrisk. The cell arrangement was capitalised in the current year with no life products sold during the current financial year. The Group’s investment in insurance cell captives amounted to R139.2million (2014: R125.2 million).
The Group also holds other listed and unlisted investments to the value of R6.3 million (2014: R10.1 million).
At year end, interest-free Employee Share Trust Loans of R18.9 million (2014: R37.6 million) are owed by participants in terms of the old Massmart Employee Share Incentive Schemes.
During the current year the property loan of R214 million was realised when the Makro store to which it related was legally transferred to the Group.
More information relating to investments can be found in note 16 of the Group’s Annual Financial Statements www.massmart.co.za/iar2015/groupafs
More information relating to the fair value of the above investments can be found in note 39 of the Group’s Annual Financial Statements www.massmart.co.za/iar2015/groupafs
More information relating to other financial assets can be found in note 17 of the Group’s Annual Financial Statements www.massmart.co.za/iar2015/groupafs
More information relating to the credit risk exposure and management of the above other financial assets can be found in note 40 of the Group’s Annual Financial Statements
www.massmart.co.za/iar2015/groupafs
Fair value hierarchyFor financial instruments traded in an active market (Level 1), fair value is determined using stock exchange quoted prices. For other financial instruments (Level 2), appropriate valuation techniques, including recent market transaction and other valuation models, have been applied and significant inputs include market yield curves and exchange rates. For non-current assets classified as held for sale (Level 3) fair value has been determined based on the sale agreement. The table alongside reflects financial instruments and non-current assets classified as held for sale carried at fair value, and those financial instruments and non-current assets classified as held for sale that have carrying amounts that differ from their fair values, in the statement of financial position.
Rm
December2015
(Audited) Level 1 Level 2 Level 3
December2014
(Audited) Level 1 Level 2 Level 3
Financial assets at fair value through profit or loss 188.1 – 188.1 – 155.1 – 155.1 –
– Investment in cell captives and other 139.3 – 139.3 – 125.2 – 125.2 –
– FEC asset (de-designated) 48.8 – 48.8 – 29.9 – 29.9 –
Financial asset designated as a cash flow hedging instrument 20.7 – 20.7 – 13.7 – 13.7 –
– FEC asset 20.7 – 20.7 – 13.7 – 13.7 –
Loans and receivables 13.9 – 13.9 – 30.3 – 30.3 –
– Employee share trust loans 13.9 – 13.9 – 30.3 – 30.3 –
Available-for-sale financial assets 4.9 4.9 – – 8.4 8.4 – –
– Listed investments 4.9 4.9 – – 8.4 8.4 – –
Non-current assets classified as held for sale 11.5 – – 11.5 22.0 – – 22.0
239.1 4.9 222.7 11.5 229.5 8.4 199.1 22.0
Financial liabilities at amortised cost 2,522.0 – 2,522.0 – 2,653.0 – 2,653.0 –
– Medium-term loan and bank loans 2,522.0 – 2,522.0 – 2,653.0 – 2,653.0 –
Financial liabilities at fair value through profit or loss 5.6 – 5.6 – 4.5 – 4.5 –
– FEC liability (de-designated) 5.6 – 5.6 – 4.5 – 4.5 –
Financial liability designated as a cash flow hedging instrument 2.1 – 2.1 – 2.2 – 2.2 –
– FEC liability 2.1 – 2.1 – 2.2 – 2.2 –
2,529.7 – 2,529.7 – 2,659.7 – 2,659.7 –
There were no transfers of financial instruments between Level 1, Level 2 and Level 3 fair value measurements during the current or prior year.
More information relating to the fair value of the assets and liabilities reflected above can be found in note 39 of the Group’s Annual Financial Statements www.massmart.co.za/iar2015/groupafs
Chief Financial Officer’s review continued
24.6%Land and buildings/leasehold improvements
4.7%Vehicles
55.5%Fixtures, fittings, plant and equipment
8.0%Computer hardware
7.2%Computer software
Capital expansion composition
2015

56 57Massmart Integrated Annual Report 2015Our performance: Financial Capital
Interest-bearing liabilities comprise mostly of medium-term bank loans (excluding bank overdrafts) and have remained flat at R3.0 billion. The Group’s gearing ratio (average debt:equity) increased to 54.6% (2014: 44.5%) at the end of the current year, in part as a result of base effects. This metric is calculated with debt averaged over two years as a numerator. In the two years since December 2013 we have invested significantly in capital expansion including a number of property acquisitions, some of which have already been highlighted. The annual rolling return on equity was 20.4% at December 2015 (2014: 21.0%). Excluding foreign exchange movements, this figure was 22.4% (2014: 21.7%).
The largest non-interest-bearing liability is the net operating lease liability of R1.0 billion (2014: R912.5 million) arising from the lease smoothing adjustment and which will be reversed over the remaining period of the Group’s operating leases. The increase in the operating lease liability is in most part due to the renewal of existing leases during the second half of the prior year and the first half of the current year at higher rates, as well as due to the roll-out of new stores.
At year end, the actuarial valuation of the Group’s potential unfunded liability arising from post-retirement medical aid contributions owed to current and future retirees amounted to R104.2 million (2014: R101.7 million), R2.8 million of which has been reflected as a current provision.
At the end of the current year, the Group’s onerous lease provision increased from R16.0 million to R23.4 million due to planned store closures.
Trade and other payables and provisionsTrade creditor days increased from 75 days to 76 days. The figure is representative of the Group’s supplier terms and we continue to monitor this ratio very closely.
The Supplier Development Programme, a separate fund created in response to the judgement of the Competition Appeal Court at the time of the Walmart transaction, had a closing balance of R111.6 million (2014: R157.2 million) and is reported on annually to the Competition Tribunal highlighting our expenditure and achievements.
Other current liabilities Included within other current liabilities are medium term loans of R463.9 million (2014: R249.7 million), the majority of which relate to foreign variable-rate bank loans. The increase in the current year relates to an additional US Dollar 9.5 million drawdown on an existing facility.
Also included is the current portion of medium-term bank loans and capitalised finance lease liabilities of R737.1 million (2014: R576.7 million).
Lease exclusivity and contingent liabilitiesWe have previously disclosed various litigation and regulatory referrals related to restrictive lease clauses involving Massdiscounters/Game, three of the major food retailers in South Africa and certain South African landlords. Most of these proceedings are ongoing. During 2015 we received an adverse judgment in one of the interdict applications involving Pick ‘n Pay in the Supreme Court of Appeal. We successfully appealed this ruling to the Constitutional Court and our leave to appeal has been granted. The Competition Commission market enquiry into the potential anti-competitive effect of excluding new market entrants by means of lease usage and exclusivity clauses is underway. We have subsequently also proceeded to self-refer the matter to the Competition Tribunal and have named Pick ‘n Pay, Shoprite and Spar as respondents. If the conclusion of these proceedings is not in our favour – in whole or in part – then a adding the Fresh Food category to certain Game stores in certain localities in South Africa could be delayed or curtailed.
In addition to this matter, the Group is party to a variety of legal, administrative, regulatory and government proceedings, claims and inquiries arising in the normal course of business. While the results of these proceedings, claims and inquiries cannot be predicted with certainty, management believes that the final outcomes of these matters will not have a material adverse effect on the Group’s financial position.
Chief Financial Officer’s review continued
Inventory composition
15.7%Home improvement(2014: 16.2%)
44.8%General Merchandise(2014: 45.3%)
9.1%Liquor(2014: 8.8%)
30.4%Food (2014: 29.7%)
More information relating to inventories can be found in note 19 of the Group’s Annual Financial Statements www.massmart.co.za/iar2015/groupafs
Trade, other receivables and prepayments are described in more detail in note 20 of the Group’s Annual Financial Statements www.massmart.co.za/iar2015/groupafs
More information on the Group’s credit risk exposure and management can be found in note 40 of the Group’s Annual Financial Statements www.massmart.co.za/iar2015/groupafs
More information relating to non-current liabilities can be found in note 24 of the Group’s Annual Financial Statements www.massmart.co.za/iar2015/groupafs
More information relating to other current liabilities can be found in note 28 of the Group’s Annual Financial Statements www.massmart.co.za/iar2015/groupafs
More information relating to trade and other payables can be found in note 26 of the Group’s Annual Financial Statements www.massmart.co.za/iar2015/groupafs
Further information relating to non-current provisions can be found in note 25 of the Group’s Annual Financial Statements www.massmart.co.za/iar2015/groupafs
2015
Deferred taxationThe deferred tax asset includes the operating lease liability arising from lease smoothing, and unutilised assessed losses. This net asset will reduce over time as the associated tax benefits are utilised. The net deferred tax asset increased from R600.9 million at December 2014 to R675.7 million at December 2015.
More information relating to deferred taxation can be found in note 18 of the Group’s Annual Financial Statements www.massmart.co.za/iar2015/groupafs
InventoryAlthough inventories have increased year-on-year as a result of new stores, effective inventory management resulted in inventory days decreasing from 64 days to 63 days. Despite the significant focus on and efforts to clear older stock in Massdiscounters, the Division still has a considerable amount of work to do to achieve optimal inventory levels. Massdiscounters’ overstock position remains a priority for us in the upcoming year.
Trade and other receivables and prepaymentsExcluding the FEC asset and the increase in amounts due from Walmart, trade and other receivables increased in line with sales. Despite the 9.5% increase in trade and other receivables, debtors’ days have remained stable at nine days.
Trade debtors is a key area of focus for management and there is no significant concentration of trade debtors.
Non-current liabilities and provisions
2011 2012 2013 2014 2015
21.6% 22.7% 29.7% 44.5% 54.6%
Debt: Equity
Closing stock
Effective stock reduction
Sales growth
Inflation
New Stores
Opening stock
13,000.0
12,500.0
12,000.0
11,500.0
11,000.0
10,500.0
10,000.0
Rm
More information relating to the Group’s liquidity risk management can be found in note 40 of the Group’s Annual Financial Statements www.massmart.co.za/iar2015/groupafs
More information relating to current provisions can be found in note 27 of the Group’s Annual Financial Statements www.massmart.co.za/iar2015/groupafs

58 59Massmart Integrated Annual Report 2015Our performance: Financial Capital
Commitments
Rm
December 2015
(Audited)
December 2014
(Audited)
Commitments in respect of capital expenditure approved by Directors:
Contracted for 953.4 864.1
Not contracted for 1,033.9 1,155.1
Total commitments 1,987.3 2,019.2
Massmart has the right of first refusal on the sale of any shares by the non-controlling interest holders in various Masscash stores. Historically Massmart has exercised this right. All capital commitments will be funded using current facilities.
Working capital movements
Rm
December2015
52 weeks(Audited)
December 2014
53 weeks(Audited)
Net movement in working capital 372.0 (295.1)
Increase in inventories (705.7) (1,112.4)
Increase in trade receivables (481.0) (697.8)
Increase in trade payables 1,617.3 1,658.3
Decrease in provisions (58.6) (143.2)
The Group continually refurbishes its older stores and where possible builds its stores, and in doing so incurred expenditure of R1.7 billion (2014: R2.2 billion). Of this R1.0 billion (2014: R857.4 million) was replacement capital expenditure, whilst the balance of R0.7 billion (2014: R1.3 billion) was invested in new capital assets, including new stores and a DC. The reduction in expansionary capital assets can largely be attributed to the acquisition of the Masscash stores and three other key properties in the prior year.
Planned capital expenditure has begun to slow down as we begin to realise some of the benefits of the investments we have made during the last few years. We will continue to invest in line with Group’s strategic drive to: own more of our key properties; roll out Food Retail stores; grow online; increase our rate of expansion in Africa; and open more lower-income Home Improvement stores in South Africa.
As a result of the R1.2 billion increase in interest-bearing borrowings in the prior year, and our maintenance of this level of interest-bearing borrowings including bank overdrafts at R3.5 billion, cash flows from financing activities reflected an outflow of R25.5 million in the current year (2014: R1.3 billion inflow).
Summary consolidated statement of cash flowsDue to the high levels of trading experienced over the December holiday period, the Group banks a large amount of cash. This explains the large cash and bank balances reflected in the statement of financial position in both 2015 and 2014.
Cash generated from operations amounted to R3.8 billion, an improvement of 39.7% on the prior year, driven by improved profitability and working capital management.
The non-controlling interests comprise store managers’ holdings in Masscash stores and non-controlling interests in acquired Masscash businesses. These have reduced by R41.4 million during the year as a result of buy-outs of non-controlling interests.
Chief Financial Officer’s review continued
Summary consolidated statement of changes in equity
RmShare
capitalShare
premiumOther
reservesRetained
profit
Equity attributable
to ownersof the parent
Non-controlling
interests Total
Balance as at December 2013 (Audited) 2.2 743.3 517.6 3,909.9 5,173.0 196.6 5,369.6
Dividends declared – – – (914.0) (914.0) – (914.0)
Total comprehensive income – – (64.5) 1,079.8 1,015.3 57.6 1,072.9
Changes in non-controlling interests – – (27.6) – (27.6) (11.0) (38.6)
Distribution to non-controlling interests – – – – – (50.4) (50.4)
IFRS 2 charge and Share Trust transactions – – 125.1 (27.4) 97.7 – 97.7
Treasury shares acquired – (9.9) (0.1) – (10.0) – (10.0)
Balance as at December 2014 (Audited) 2.2 733.4 550.5 4,048.3 5,334.4 192.8 5,527.2
Dividends declared – – – (914.1) (914.1) – (914.1)
Total comprehensive income – – (16.2) 1,112.8 1,096.6 56.4 1,153.0
Changes in non-controlling interests – – (18.7) – (18.7) (41.4) (60.1)
Distribution to non-controlling interests – – – – – (52.7) (52.7)
IFRS 2 charge and Share Trust transactions – – 218.5 (23.6) 194.9 – 194.9
Treasury shares acquired – (58.3) 1.2 – (57.1) – (57.1)
Year ended December 2015 (Audited) 2.2 675.1 735.3 4,223.4 5,636.0 155.1 5,791.1
Summary consolidated statement of cash flows
Rm
December 2015
(Audited)
December2014
(Audited)
Operating cash before working capital movements 3,384.4 2,983.4
Working capital movements 372.0 (295.1)
Cash generated from operations 3,756.4 2,688.3
Taxation paid (631.0) (683.4)
Net interest paid (437.0) (345.3)
Investment income 40.3 –
Dividends paid (958.3) (914.0)
Cash inflow from operating activities 1,770.4 745.6
Investment to maintain operations (983.7) (857.4)
Investment to expand operations (710.7) (1,322.1)
Investment in subsidiaries and businesses (16.9) (14.4)
Proceeds on disposal of property, plant and equipment 38.7 32.5
Proceeds on disposal of assets classified as held for sale 23.1 –
Other net investing activities 3.9 14.9
Cash outflow from investing activities (1,645.6) (2,146.5)
Cash (outflow)/inflow from financing activities (25.5) 1,349.7
Net increase/(decrease) in cash and cash equivalents 99.3 (51.2)
Foreign exchange movements (24.2) (53.7)
Opening cash and cash equivalents 1,483.4 1,588.3
Closing cash and cash equivalents 1,558.5 1,483.4
Dividend income on unlisted investments
Investment to expand and maintain operations amounts to 2.0% of sales (2014: 2.8%)
Current year outflow is as a result of term debt repayments
More information relating to these capital expenditure commitments can be found in note 31 of the Group’s Annual Financial Statements www.massmart.co.za/iar2015/groupafs
Further information relating to the movements in the cash flow statement can be found in note 38 of the Group’s Annual Financial Statements www.massmart.co.za/iar2015/groupafs
Further information relating to the movements in the statement of changes in equity can be found in notes 22 and 23 of the Group’s Annual Financial Statements www.massmart.co.za/iar2015/groupafs

60 61Massmart Integrated Annual Report 2015Our performance: Financial Capital
Business segment
Rm Total OtherMass-
discountersMass-
warehouse Massbuild Masscash
December 2015
Sales 84,731.8 – 19,514.1 23,675.9 12,010.6 29,531.2
Operating profit before foreign exchange movements and interest 2,300.2 (39.8) 235.4 1,198.7 693.6 212.3
Trading profit before interest and taxation 2,349.7 – 235.4 1,198.7 693.6 222.0
Net foreign exchange loss (149.8) (78.1) (65.4) – (3.4) (2.9)
Net finance (costs)/income (475.3) (292.6) (49.5) 53.0 (100.7) (85.5)
Operating profit/(loss) before taxation 1,675.1 (410.5) 120.5 1,251.7 589.5 123.9
Trading profit/(loss) before taxation 1,874.4 (292.6) 185.9 1,251.7 592.9 136.5
Inventory 11,934.5 22.1 4,064.7 3,095.7 1,865.3 2,886.7
Total assets 30,730.3 (626.7) 8,234.5 8,314.0 5,122.1 9,686.4
Non-current asset held for sale 11.5 11.5 – – – –
Total liabilities 24,939.2 (4,608.9) 7,999.0 7,865.3 4,602.8 9,081.0
Net capital expenditure 1,649.6 186.8 527.4 234.4 351.6 349.4
Depreciation and amortisation 946.2 62.0 336.0 169.5 184.8 193.9
Impairment losses 25.7 16.0 – – – 9.7
Non-cash items other than depreciation and impairment 316.6 101.7 133.0 39.7 6.6 35.6
Cash flow from operating activities 1,770.4 450.6 276.1 259.0 1,095.1 (310.4)
Cash flow from investing activities (1,645.6) (183.2) (527.2) (234.4) (351.6) (349.2)
Cash flow from financing activities (25.5) (60.9) 166.2 (71.5) (712.0) 652.7
Inventory days 63.4 – 102.3 57.2 80.0 39.6
Number of stores 403 – 161 19 102 121
Trading area (m2) 1,550,719 – 533,078 195,794 449,133 372,714
Average trading area per store (m2) 3,848 – 3,311 10,305 4,403 3,080
Distribution centre space (m2) 346,660 – 178,488 58,475 60,235 49,462
Distribution centre space (m2) increase on December 2014 5.6% – – 14.0% (2.4%) 34.9%
• The ‘Other’ column includes consolidation entries.• All intercompany transactions have been eliminated in the above results.• Trading profit before taxation is earnings before corporate net interest, asset impairments, BEE transaction IFRS 2 charges and foreign exchange movements.• Net capital expenditure is defined as capital expenditure less disposal proceeds.
Rm Total OtherMass-
discountersMass-
warehouse Massbuild Masscash
December 2014
Sales 78,173.2 – 17,955.2 21,554.8 10,822.8 27,840.4
Operating profit before foreign exchange movements and interest 2,015.9 (30.6) 180.7 1,044.3 537.6 283.9
Trading profit before interest and taxation 2,061.7 – 180.7 1,044.3 537.6 299.1
Net foreign exchange (loss) / gain (49.8) (48.4) (5.8) – 2.5 1.9
Net finance (costs)/income (345.3) (211.0) (29.4) 44.4 (63.2) (86.1)
Operating profit before taxation 1,620.8 (290.0) 145.5 1,088.7 476.9 199.7
Trading profit before taxation 1,716.4 (211.0) 151.3 1,088.7 474.4 213.0
Inventory 11,228.8 30.5 3,984.9 2,845.7 1,785.6 2,582.1
Total assets 28,906.4 (325.6) 7,985.5 7,689.0 5,027.7 8,529.8
Non-current asset held for sale 18.0 15.0 – – 3.0 –
Total liabilities 23,379.2 (4,366.5) 7,820.9 7,312.1 4,730.6 7,882.0
Net capital expenditure 2,147.0 967.8 542.2 70.3 296.8 269.9
Depreciation and amortisation 846.6 43.2 293.1 171.6 154.0 184.7
Impairment losses 24.6 9.4 – – – 15.2
Non-cash items other than depreciation and impairment 146.1 (16.2) 112.0 46.9 12.6 (9.2)
Cash flow from operating activities 745.6 (446.2) 473.4 (103.8) 707.4 114.8
Cash flow from investing activities (2,146.5) (980.8) (545.0) (70.1) (296.8) (253.8)
Cash flow from financing activities 1,349.7 1,163.0 112.9 161.8 (369.3) 281.3
Inventory days 64.4 – 107.6 57.1 84.6 37.1
Number of stores 392 – 153 19 100 120
Trading area (m2) 1,539,295 – 506,188 195,794 436,538 400,775
Trading area (m2) increase on December 2013 (excluding re-measurements) 3.9% – 6.5% – 6.3% 0.3%
Average trading area per store (m2) 3,927 – 3,308 10,305 4,365 3,340
Distribution centre space (m2) 328,175 – 178,488 51,300 61,733 36,654
Distribution centre space (m2) increase on December 2013 1.3% – – – – 13.5%
Geographic segmentThe Group’s four Divisions operate in two principal geographical areas – South Africa and the Rest of Africa.
December 2015 December 2014
Total South Africa Rest of Africa Total South Africa Rest of Africa
Sales 84,731.8 77,579.2 7,152.6 78,173.2 71,822.4 6,350.8
Segment assets (Total) 23,387.8 21,541.2 1,846.6 21,764.8 20,226.3 1,538.5
Segment assets (Non-current) 11,128.4 10,118.7 1,009.7 10,197.9 9,576.5 621.4
Net capital expenditure 1,649.6 1,366.1 283.5 2,147.0 1,936.6 210.4
More information relating to segmental reporting can be found in note 41 of the Group’s Annual Financial Statements www.massmart.co.za/iar2015/groupafs
Segmental reviewThe Group is organised into four Divisions for operational and management purposes, being Massdiscounters, Masswarehouse, Massbuild and Masscash. Massmart reports its business segment information on this basis. The principal offering for each Division is as follows:• Massdiscounters – general merchandise discounter and food retailer• Masswarehouse – warehouse club trading in food, general merchandise
and liquor• Massbuild – home improvement retailer and building materials supplier• Masscash – food wholesaler, retailer and buying association
No single customer represented more than 10% of any of one of the Divisions’ sales in the current or prior financial year.
Chief Financial Officer’s review continued

62 63Massmart Integrated Annual Report 2015Our performance: Financial Capital
Chief Financial Officer’s review continued
Related-party transactionsMassmart and its Divisions enter into certain transactions with related parties in the normal course of business. Details of these are disclosed in more detail in Massmart’s Annual Financial Statements. A net amount of R292.7 million remains unpaid to Walmart (2014: R206.2 million), which has been accounted for in ‘trade, other receivables and prepayments’ and ‘trade, other payables and provisions’. The Group has a medium-term loan with Walmart repayable after five years, on which interest of 7.46% is paid quarterly. The loan of R600.0 million is accounted for under interest-bearing non-current liabilities. As a 52.4% shareholder, Main Street 830 Proprietary Limited, a subsidiary of Walmart, will also be receiving the ordinary dividend based on their number of shares held.
Directors’ emolumentsA detailed breakdown can be found in the Remuneration Report on p102-103.
Accounting policies, critical judgements and key sources of estimation uncertaintyThese audited summary consolidated results have been prepared in accordance with the framework concepts and the measurement and recognition requirements of International Financial Reporting Standards (IFRS), its interpretations issued by the IFRS Interpretations Committee, the SAICA Financial Reporting Guides as issued by the Accounting Practices Committee and Financial Pronouncements as issued by the Financial Reporting Standards Council, presentation and disclosure as required by International Accounting Standard (IAS) 34 Interim Financial Reporting, the JSE Limited Listings Requirements and the requirements of the Companies Act 71 of 2008 of South Africa. The accounting policies and methods of computation used in the preparation of these audited summary consolidated results are in terms of IFRS and are consistent in all material respects with those applied in the most recent Annual Financial Statements, as none of the amendments coming into effect in the current financial year have had a material impact on the financial reporting of the Group, besides impacting disclosure within the Annual Financial Statements.
DividendIn August 2015 Massmart indicated to shareholders that the Group’s future dividend policy would likely be changed to levels similar to South African retail peers. This adjustment was necessary as a result of significant property acquisitions between 2012 and 2015 and store growth into Africa which increasingly entail investing in real estate. Therefore, with effect from this dividend cycle, the dividend cover was amended to 2.00 x cover. A gross final cash dividend of 112.16 cents per share (December 2014: 275.00 cents), in respect of the year ended December 2015, was declared out of income reserves as defined in the Income Tax Act, 1962, and was subject to the South African dividend withholding tax rate of 15%. This was distributed to shareholders registered in the books of the Company on 18 March 2016.
Going-concern assertionThe Board has formally considered the going-concern assertion for Massmart and its subsidiaries and believes that it is appropriate for the forthcoming financial year.
The year aheadFor 2016 and possibly 2017, the anticipated South African economic environment will heavily constrain consumer spending across several key Group categories including General Merchandise and Home Improvement/DIY, whilst our substantial Food and Liquor categories may perform relatively better. We expect there to be severe pricing pressure on lower-income households and we are resolved to keep our baskets affordable for those households.
Johannes van LieropCFO
As the new year unfolds, we continue to implement our strategic priorities and tackle our strategic, environmental and operational risks head-on. We continue to focus on targeting new customer groups; experimenting with new formats; increasing our Private Label offering; reducing the cost of our value-chain; increasing our property portfolio; and reducing the cost of our new store openings.
Massdiscounters’ overstock position and profitability remains a priority for us in the coming year. The impact of the introduction of Food, the appointment of experienced key personnel, and the revision of our store segmentation and merchandise range in the current year is already evident as we see the profitability of Massdiscounters improve dramatically. A key area of focus for us this year is to improve our working capital management, particularly in our African operations. We actively manage our positions, as the impact of our exposure to currency devaluations and foreign currency liquidity constraints in Africa becomes more prolific.
Our strategic priorities to improve profitability; roll-out our Retail Food proposition and Massbuild formats in South Africa; expand our African footprint and grow our online offering will continue to require extensive capital investment for which we are well positioned.
AppreciationIt has been a great year for Massmart in which we delivered some good growth in business performance as well as in our people. The team in Finance, made up of new and internally-grown talent, strongly supported the strong control environment in 2015 and further improved upon it. The challenge of making this Integrated Annual Report an even better one than last year was taken up and its fruits are visible for the reader.
The contribution and efforts of the Group Finance teams, both at the Divisions and the corporate office, have once again been outstanding. I want to express my gratitude for their ways of working together as a team and putting business performance, as well as personal and collective development, at the same level. The result of this is fully to their benefit and to the advantage of all of our stakeholders.
Johannes van LieropChief Financial Officer1 April 2016
WE EXPECT THERE TO BE SEVERE PRICING PRESSURE ON LOWER-INCOME HOUSEHOLDS AND WE ARE RESOLVED TO KEEP OUR BASKETS AFFORDABLE FOR THOSE HOUSEHOLDS.
“
”More detail on the Group’s accounting policies, critical judgments and key sources of estimation uncertainty is provided in note 1 and 2 of the Group’s Annual Financial Statements www.massmart.co.za/iar2015/groupafs
The going concern assertion can be found in the Directors’ Report on p66
More information on related-party transactions can be found in note 34 of the Group’s Annual Financial Statements www.massmart.co.za/iar2015/groupafs
More information on Directors’ emoluments can also be found in note 35 of the Group’s Annual Financial Statements www.massmart.co.za/iar2015/groupafs
64 65Massmart Integrated Annual Report 2015Our performance: Financial Capital
Directors’ report for the year ended December 2015
Directors’ responsibilitiesThe Directors acknowledge responsibility for the preparation of the Annual Financial Statements, which, in their opinion, fairly present the results and cash flows for the year ended December 2015 and the state of affairs of Massmart Holdings Limited and its subsidiaries at the end of the financial year. The external auditors are responsible for reporting on the fair presentation of these financial statements.
The Company and its subsidiaries have maintained satisfactory accounting records and an effective system of internal controls to ensure the integrity of the underlying information. Appropriate accounting policies, supported by sound and prudent managerial judgments and estimates, have been consistently applied.
The Board’s Audit Committee reviews the financial information presented and ensures that there has been adherence to International Financial Reporting Standards and the South African Companies Act. Internal and external auditors of Group companies have unrestricted access to the Committee.
Group financial resultsThe financial results of the Group are set out in the income statement, statement of comprehensive income, the statement of cash flows and the statement of changes in equity. The financial position of the Group is set out in the statement of financial position and accompanying notes.
Shares in issuePlease find the movement in ordinary and preference shares for the financial year under review below:
Ordinary sharesBalance at December 2013 217,109,044
Converted preference shares1 9,028
Balance at December 2014 217,118,072
Converted preference shares 1 18,262
Ordinary shares in issue at December 2015 217,136,334
Preference shares1
Balance at December 2013 2,867,773
Converted to ordinary shares (9,028)
Balance at December 2014 2,858,745
Converted to ordinary shares (18,262)
Preference shares in issue at December 2015 2,840,483
1The preference shares relate to Massmart’s Black Scarce Skills Trust
Directorate and Company SecretaryThe Board comprises ten Directors at the time of this Report of whom eight are non-Executive and five are independent. In addition, each Board committee is chaired by an independent Director.
The Company Secretary provides a central source of guidance and advice to the Board, and within the Company, on matters of ethics and good governance. The Company Secretary is Philip Sigsworth, CA(SA), whose business and postal addresses are the same as that of the Company, and he was appointed on 7 May 2012.
Following the August 2014 announcement of the intended resignation of Ilan Zwarenstein from his role as Group Finance Director, the Massmart Board announced the appointment of Johannes van Lierop as CFO of Massmart with effect from 12 March 2015, at which date Ilan accordingly resigned.
Shelley Broader left Walmart in October 2015 and as such, resigned from the Massmart Board and relevant sub-committees on 9 November 2015.
Moses Kgosana was appointed as an independent non-Executive Director with effect from 1 September 2015. Moses is the former Chief Executive and Senior Partner of KPMG South Africa and Chairman of KPMG Africa.
Enrique Ostalé was appointed to the Board of Directors of Massmart with effect from 24 February 2016. Enrique is the President and Chief Executive Officer of Walmart Latin America, India and Africa regions, as well as chairman of the board of directors of Walmart Mexico and Central America.
At least one-third of the non-Executive Directors are required to retire every year and the Executive Directors have
elected to also retire on this basis. As a result, all Directors retire by rotation at least every three years and are then eligible for re-election. In addition, shareholders must ratify the initial appointment of each Director at the first Annual General Meeting following that Director’s appointment. As a result of these requirements, at the 26 May 2016 Annual General Meeting, Chris Seabrooke retires by rotation; while Moses Kgosana and Enrique Ostalé will retire due to having been appointed during the applicable year. Being eligible, they all offer themselves for re-election.
Interests of Directors in the Company’s sharesAt December 2015, the following Directors owned, directly or indirectly, ordinary shares or options over ordinary shares in the Company. These holdings were all beneficial and are aggregated in the table below:
Dec-15 Dec-14
Non-Executive Directors SharesOptions/
Share Awards SharesOptions/
Share Awards
K Dlamini 9,800 – 9,800 – NN Gwagwa 9,800 – 9,800 –
Executive DirectorsGM Pattison1 – – 643,473 196,877 GRC Hayward 222,894 384,376 222,894 342,619 JJM van Lierop2 – 107,678 – – I Zwarenstein3 – – – 201,029
At the date of this report, the Directors’ beneficial holdings were as follows :Apr 16 Apr 15
Non-Executive Directors SharesOptions/
Share Awards SharesOptions/
Share Awards
K Dlamini 9,800 – 9,800 – NN Gwagwa 9,800 – 9,800 –
Executive DirectorsGRC Hayward 222,894 422,095 222,894 342,619 JJM van Lierop2 – 144,877 – 95,327
There were no non-beneficial interests in either of these periods.1 Resigned with effect from 31 December 2014.2 Appointed with effect from 12 March 2015.3 Resigned with effect from 12 March 2015.
Details of the Company’s interests in material subsidiaries are set out in note 37 www.massmart.co.za/iar2015/groupafs
SubsidiariesAs at the date hereof, the following companies are material subsidiaries of the Company:
Massbuild Proprietary Limited 2004/035206/07Masscash Proprietary Limited 1997/014716/07Massmart International Holdings Limited (incorporated in Mauritius) 47902 C1/GBLMassmart Management & Finance Company Proprietary Limited 1992/004084/07Masstores Proprietary Limited 1991/006805/07Wild Developments Proprietary Limited 1973/000178/07
Biographical details of the Directors can be found on p34-35 and on the Company’s website at: www. massmart.co.za/iar2015/CVs
Information on the Group’s dividend can be found in the Chief Financial Officer’s review on p62

66 67Massmart Integrated Annual Report 2015Our performance: Financial Capital
Borrowing powersIn terms of the Memorandum of Incorporation, the Group has unlimited borrowing powers. At December 2015, borrowings were R3.5 billion (2014: R3.6 billion).
Going concernThe Directors are of the opinion that the business will be a going concern in the year ahead. In reaching this opinion, the Directors considered the following factors:• strong positive cash flows from trading;• no recurring operating losses at Divisional and Group level;• well-controlled working capital and good quality inventory;• approved short- and long-term financing, with sufficient additional
short-term borrowing capacity if required;• key Executive Management in place;• there have been no material changes that may affect the Group in any
of its customer, product or geographic markets; and• budgets to December 2016 reflect a continuation of the above
positive factors.
Direct and ultimate holding companiesThe Company’s direct holding company is Main Street 830 Proprietary Limited, incorporated in South Africa, and the Company’s ultimate holding company is Wal-Mart Stores, Inc., incorporated in the United States.
Subsequent eventsThe Group concluded a Term Loan Facility Agreement with Standard Bank as lender in February 2016. In terms of the agreement Standard Bank has advanced R2.0 billion to the Group on 26 February 2016. The agreement includes a R600 million facility that will mature in three years and a R1.4 billion facility that will mature in five years.
A fire was reported at the Jumbo Cash & Carry store in Crown Mines, Johannesburg, on 25 February 2016. All night shift employees were safely evacuated, fully accounted for and no one was injured. In situations such as this the cause of the fire is investigated after the site has been declared to be safe. The investigation is typically conducted by teams from the Fire Department, South African Police Services and the insurers. The value of stock that was carried in the store is estimated, at this early stage, to be approximately R100 million. The store, assets and stock are fully insured and we have Business Interruption Cover.
With the exception of the above, there were no significant subsequent events after the year end.
On behalf of the Board
Philip SigsworthCompany Secretary1 April 2016
Company Secretary certificateIn terms of section 88(e) of the Companies Act No. 71 of 2008, as amended (“Companies Act”), I, Philip Sigsworth, in my capacity as Company Secretary of Massmart Holdings Limited, confirm that, to the best of my knowledge and belief, in respect of the year under review, Massmart Holdings Limited has filed with the Companies and Intellectual Property Commission all such returns and notices as are required of a public company in terms of the Companies Act and that all such returns and notices appear to be true, correct and up to date.
The Audit Committee met three times during the year ended December 2015. The internal and external auditors presented formal reports to the Committee and attended these meetings by invitation. In response to the requirements of the Companies Act, King III and in terms of its charter, the Committee can report as follows:• The scope, independence and objectivity of the external auditors was reviewed;• The audit firm Ernst and Young Inc. and audit partner Allister Jon Carshagen,
are, in the Committee’s opinion, independent of the Company. They have been proposed to the shareholders for approval to be the Group’s auditor for the 2016 financial year;
• On an ongoing basis, the Committee reviews and approves the fees proposed by the external auditors;
• The appointment of the external auditor complies with the Companies Act and with all other legislation relating to the appointment of external auditors;
• The nature and extent of non-audit services provided by the external auditors has been reviewed to ensure that the fees for such services do not become so significant as to call into question their independence;
• The nature and extent of future non-audit services have been defined and pre-approved;
• No reportable irregularities were identified and reported by the external auditors to the Committee;
• The Committee is satisfied that the internal financial controls of the Divisions and Group operated effectively throughout the year ended December 2015 and can be relied upon. In addition, the Committee is satisfied with the Group’s accounting policies and that these have been appropriately and consistently applied throughout the year ended December 2015;
• The Committee reviewed this Integrated Annual Report and recommended it to the Board for approval;
• As at the date of this report, no complaints have been received relating to accounting practices and internal audit of the Company or to the content or auditing of the Company’s financial statements, or to any related matter; and
• The Massmart website (www.massmart.co.za) has a link enabling the general public to lodge complaints with the Committee. Since establishing this functionality in 2009, no complaints have been received.
Chris SeabrookeChairman of the Audit Committee1 April 2016
Audit Committee report
Directors’ report for the year ended December 2015
continued
Massmart addressThe Company’s registered office and postal address are as follows:
Registered office:
Massmart House16 Peltier DriveSunninghill Ext 6Sandton, 2146South Africa
Postal address:Private Bag X4Sunninghill2157South Africa
More information on the Audit Committee responsibilities can be found on p126 and on the Company’s website at
www.massmart.co.za/iar2015/auditcom
A
The Audit Committee comprises:
Mr Chris Seabrooke ChairmanMember since 2000
Ms Phumzile Langeni Member since 2009
Dr Lulu GwagwaMember since 2011
Mr Moses KgosanaMember since 2015
All are independent non-Executive Directors. They each have the requisite financial and commercial skills and experience to contribute to the Committee’s deliberations. The Audit Committee formally met three times in the year ended December 2015.

68 69Massmart Integrated Annual Report 2015Our performance: Financial Capital
Independent auditor’s report on the summary consolidated Annual Financial Statements for the year ended December 2015
To the Shareholders of Massmart Holdings LimitedThe audited summary consolidated Annual Financial Statements of Massmart Holdings Limited, incorporated in the ‘Financial Capital’ section, which comprise the summary consolidated statement of financial position as at 27 December 2015, the summary consolidated income statement, summary consolidated statements of comprehensive income, changes in equity and cash flows for the year then ended on pages 53, 46, 52 and 59 respectively, and related notes on pages 51-62, are derived from the audited consolidated Annual Financial Statements of Massmart Holdings Limited for the year ended 27 December 2015. We expressed an unmodified audit opinion on those consolidated Annual Financial Statements in our report dated 1 April 2016. Our auditor’s report on the audited consolidated Annual Financial Statements contained an Other Matters paragraph: “Other reports required by the Companies Act” (refer below).
The audited summary consolidated Annual Financial Statements do not contain all the disclosures required by IFRS and the requirements of the Companies Act of South Africa as applicable to annual financial statements. Reading the audited summary consolidated Annual Financial Statements, therefore, is not a substitute for reading the audited consolidated Annual Financial Statements of Massmart Holdings Limited.
Directors’ Responsibility for the audited summary consolidated Annual Financial StatementsThe Directors are responsible for the preparation of the audited summary consolidated Annual Financial Statements in accordance with the requirements of the JSE Limited Listings Requirements for abridged reports, set out in the ‘Approval of the Integrated Annual Report and summary consolidated Annual Financial Statements’ on page 5, and the requirements of the Companies Act of South Africa as applicable to summary financial statements, and for such internal control as the Directors determine is necessary to enable the preparation of the audited summary consolidated Annual Financial Statements that are free from material misstatement, whether due to fraud or error.
Auditor’s ResponsibilityOur responsibility is to express an opinion on the audited summary consolidated Annual Financial Statements based on our procedures, which were conducted in accordance with International Standard on Auditing (ISA) 810, Engagements to Report on Summary Financial Statements.
OpinionIn our opinion, the audited summary consolidated Annual Financial Statements derived from the audited consolidated Annual Financial Statements of Massmart Holdings Limited for the year ended 27 December 2015 are consistent, in all material respects, with those consolidated Annual Financial Statements, in accordance with the requirements of the JSE Limited Listings Requirements for abridged reports, set out in the ‘Approval of the Integrated Annual Report and summary consolidated Annual Financial Statements’ on page 5, and the requirements of the Companies Act of South Africa as applicable to summary financial statements.
Other reports required by the Companies Act The “Other information” paragraph in our audit report dated 1 April 2016 states that as part of our audit of the consolidated Annual Financial Statements for the year ended 27 December 2015, we have read the Directors’ Report, the Audit Committee’s Report and the Company Secretary’s Certificate for the purpose of identifying whether there are material inconsistencies between these reports and the audited consolidated Annual Financial Statements. These reports are the responsibility of the respective preparers. The paragraph also states that, based on reading these reports, we have not identified material inconsistencies between these reports and the audited consolidated Annual Financial Statements. The paragraph furthermore states that we have not audited these reports and accordingly do not express an opinion on these reports. The paragraph does not have an effect on the audited summary consolidated Annual Financial Statements or our opinion thereon.
Ernst & Young Inc.
Per: Allister Jon CarshagenDirector Registered Auditor1 April 2016
102 Rivonia RoadJohannesburgGautengSouth Africa
Shareholder analysis
The following analysis of shareholders was extracted from the shareholders’ register:
Numberof holders %
Number of shares %
Shareholder spread
1 – 1,000 shares 3,509 82.7 671,904 0.3
1,001 – 10,000 shares 521 12.3 1,644,550 0.8
10,001 – 100,000 shares 130 3.1 4,311,634 2.0
100,001 – 1,000,000 shares 59 1.4 19,244,746 8.9
1,000,001 shares and over 23 0.5 191,263,500 88.0
4,242 100.0 217,136,334 100.0
Public/non-public shareholders
Non-public shareholders:
Walmart subsidiary: Main Street 830 Proprietary Limited 1 – 113,859,293 52.4
Directors and Group Executives of the Company 3 0.1 242,494 0.1
Share trusts 1 – 575,563 0.3
Public shareholders 4,237 99.9 102,458,984 47.2
4,242 100.0 217,136,334 100.0
Distribution of shareholders
Walmart subsidiary: Main Street 830 Proprietary Limited 1 – 113,859,293 52.4
Unit Trusts/Mutual Funds 91 2.2 51,401,292 23.7
Pension Funds 57 1.3 23,539,015 10.8
Other Managed Funds 46 1.1 7,252,920 3.3
Sovereign Wealth 14 0.3 7,243,931 3.3
Custodians 10 0.2 4,550,139 2.1
Private Investors 11 0.3 1,910,514 0.9
Hedge Fund 1 – 1,930,510 0.9
Investment Trusts 3 0.1 1,185,192 0.5
Insurance Companies 4 0.1 1,012,682 0.5
Charities 3 0.1 776,622 0.4
Exchange-Traded Fund Total 4 0.1 557,532 0.3
University 1 – 144,925 0.1
Local Authorities 1 – 30,166 –
Remainder 3,995 94.2 1,741,601 0.8
4,242 100.0 217,136,334 100.0
Custodians and managers holding 3% or more
The following custodians and managers held beneficially, directly or indirectly, equal to or in excess of 3% of the Company's shares:
Walmart subsidiary: Main Street 830 Proprietary Limited 113,859,293 52.4
Aberdeen Asset Management Group 45,503,632 21.0
Public Investment Corporation 12,839,524 5.9
Westwood Global Investments LLC 6,782,752 3.1
Shareholder Spread (%)
Public/Non-public Shareholders (%)
Distribution of Shareholders (%)
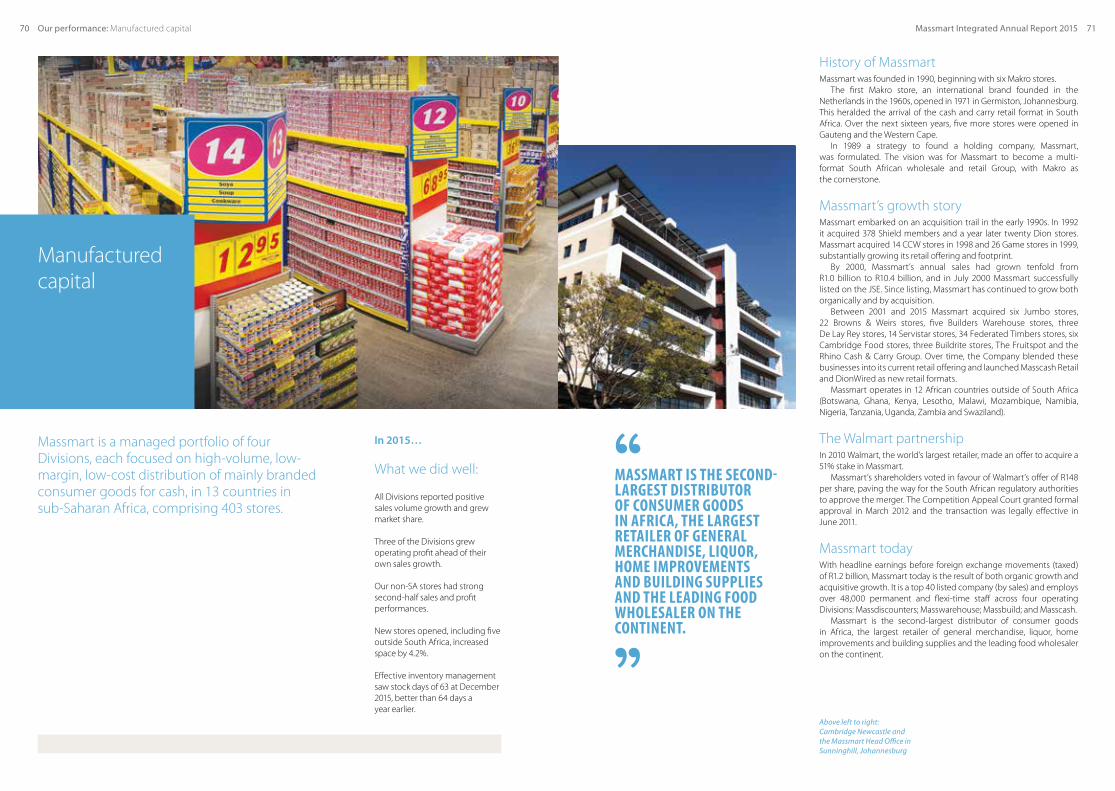
70 71Massmart Integrated Annual Report 2015
In 2015…
What we did well:
All Divisions reported positive sales volume growth and grew market share.
Three of the Divisions grew operating profit ahead of their own sales growth.
Our non-SA stores had strong second-half sales and profit performances.
New stores opened, including five outside South Africa, increased space by 4.2%.
Effective inventory management saw stock days of 63 at December 2015, better than 64 days a year earlier.
Our performance: Manufactured capital
Massmart is a managed portfolio of four Divisions, each focused on high-volume, low-margin, low-cost distribution of mainly branded consumer goods for cash, in 13 countries in sub-Saharan Africa, comprising 403 stores.
Manufactured capital
History of MassmartMassmart was founded in 1990, beginning with six Makro stores.
The first Makro store, an international brand founded in the Netherlands in the 1960s, opened in 1971 in Germiston, Johannesburg. This heralded the arrival of the cash and carry retail format in South Africa. Over the next sixteen years, five more stores were opened in Gauteng and the Western Cape.
In 1989 a strategy to found a holding company, Massmart, was formulated. The vision was for Massmart to become a multi-format South African wholesale and retail Group, with Makro as the cornerstone.
Massmart’s growth storyMassmart embarked on an acquisition trail in the early 1990s. In 1992 it acquired 378 Shield members and a year later twenty Dion stores. Massmart acquired 14 CCW stores in 1998 and 26 Game stores in 1999, substantially growing its retail offering and footprint.
By 2000, Massmart’s annual sales had grown tenfold from R1.0 billion to R10.4 billion, and in July 2000 Massmart successfully listed on the JSE. Since listing, Massmart has continued to grow both organically and by acquisition.
Between 2001 and 2015 Massmart acquired six Jumbo stores, 22 Browns & Weirs stores, five Builders Warehouse stores, three De Lay Rey stores, 14 Servistar stores, 34 Federated Timbers stores, six Cambridge Food stores, three Buildrite stores, The Fruitspot and the Rhino Cash & Carry Group. Over time, the Company blended these businesses into its current retail offering and launched Masscash Retail and DionWired as new retail formats.
Massmart operates in 12 African countries outside of South Africa (Botswana, Ghana, Kenya, Lesotho, Malawi, Mozambique, Namibia, Nigeria, Tanzania, Uganda, Zambia and Swaziland).
The Walmart partnershipIn 2010 Walmart, the world’s largest retailer, made an offer to acquire a 51% stake in Massmart.
Massmart’s shareholders voted in favour of Walmart’s offer of R148 per share, paving the way for the South African regulatory authorities to approve the merger. The Competition Appeal Court granted formal approval in March 2012 and the transaction was legally effective in June 2011.
Massmart todayWith headline earnings before foreign exchange movements (taxed) of R1.2 billion, Massmart today is the result of both organic growth and acquisitive growth. It is a top 40 listed company (by sales) and employs over 48,000 permanent and flexi-time staff across four operating Divisions: Massdiscounters; Masswarehouse; Massbuild; and Masscash.
Massmart is the second-largest distributor of consumer goods in Africa, the largest retailer of general merchandise, liquor, home improvements and building supplies and the leading food wholesaler on the continent.
MASSMART IS THE SECOND-LARGEST DISTRIBUTOR OF CONSUMER GOODS IN AFRICA, THE LARGEST RETAILER OF GENERAL MERCHANDISE, LIQUOR, HOME IMPROVEMENTS AND BUILDING SUPPLIES AND THE LEADING FOOD WHOLESALER ON THE CONTINENT.
“
”Above left to right:Cambridge Newcastle and the Massmart Head Office in Sunninghill, Johannesburg

72 73Massmart Integrated Annual Report 2015
Future outlook Game will continue to roll-out Fresh Food. We will refurbish some current stores, whilst limiting the number of new store openings as we focus on consolidating our footprint to optimise profitability. We will continue to consolidate the Hi-Tech and Multimedia categories, and we intend to expand the space allocated to Food and selected Homeware categories. A further 20 Liquor stores are planned. At DionWired we will focus on reinvigorating our customer experience through focusing on our core purpose to “simplify life by obsessively sharing the joy of technology”.
Management team Guy Hayward Non-Executive Chairman, Robin Wright Chief Executive Officer, Nazim Cassim DionWired, Richard Fuller Store Operations, Norman Gray Non-Executive, John Hart Planning, Mark Huxtable IT, Andrew Jackson Merchandise, Erdi Kursunoglu Finance, Rogany Ramiah Human Resources, Mike Spivey Non-Executive, Mark Turner Marketing, Alan van der Bergh Food, Johannes van Lierop Non-Executive
Focussed customer-centric approach; further aligned product offering, in-store experience, stock availability and value proposition
Massdiscounters operates through two retail formats, Game and DionWired. Game is a discount multi-category format retailer of General Merchandise, Fresh Food, Groceries and Liquor, operating throughout South Africa and in 19 cities in sub-Saharan Africa. DionWired sells complete technological solution in Multimedia and Hi-Tech.
Food continues to grow strongly
Healthy profit growth of 30.3% amidst tough economic trading conditions
Improvements in the supply chain enabling a reduction in stockholding levels, whilst achieving improved on-shelf stock availability
Our performance: Manufactured capital
What we did well:• Re-energised our Cellular, Homeware and Liquor offering• Collaborated with our suppliers to improve supply chain efficiencies• Mobilised the entire business around delivering our strategic plan
The improvements we made: • Significant growth in both sales and margin of our Food and
Liquor offering• Improved in-stock coupled with reduced stock level• Improved supply chain efficiencies
The challenges we’re facing: • Tough South African economic environment pressurising our core
middle-class customer• Slowing African economies resulting from weaker resource prices • Planned roll-out of SAP Point-of-Sale system across all stores,
commencing in 2016
Our strategic focus for 2016: • Continue to improve our customer’s shopping experience• Simplify our systems and processes as we invest in best-of-class
information technologies• Build the best team to deliver value to our customers,
shareholders and communities whom we serve• Improve the supply chain efficiencies to further reduce stock
levels, improve stock availability to our customers and improve efficiencies
Our 2015 strategy:• Deliver real value to our core customer through consistently
low prices• Offer a good retail experience which guarantees quality• Provide focused ranges that meet all our customers’
household needs • Ensure an effective supply chain, enabled by efficient information
systems and processes
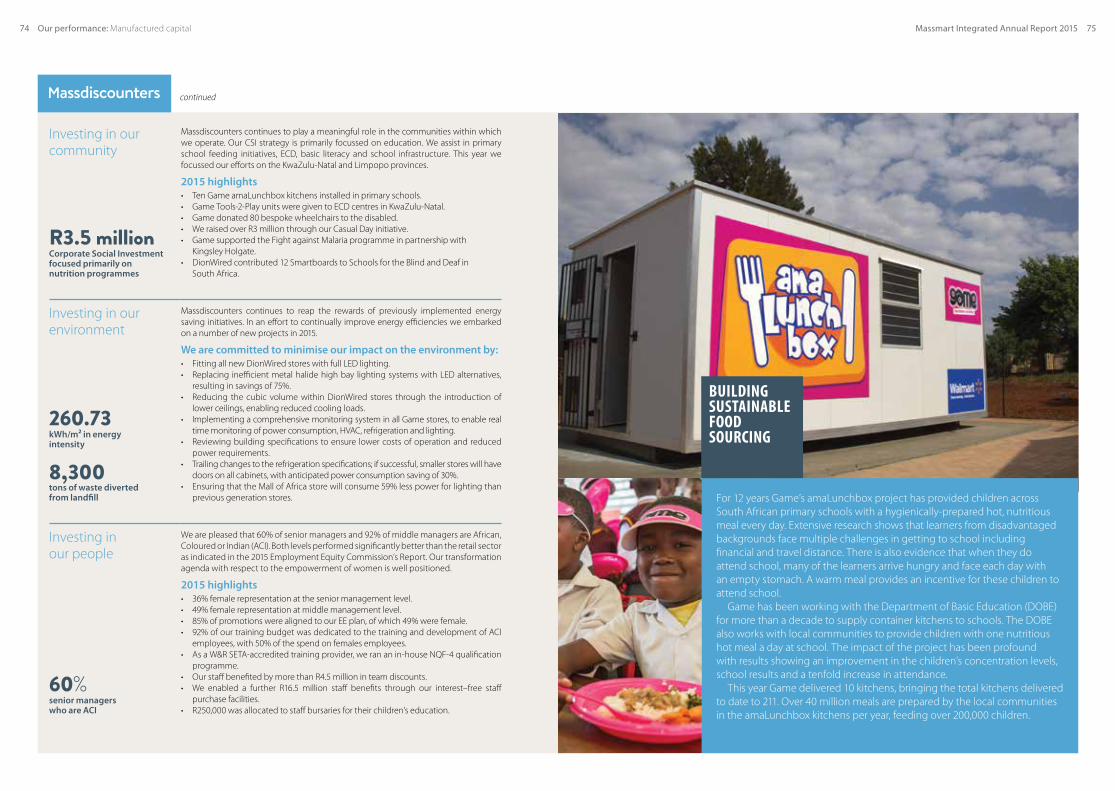
74 75Massmart Integrated Annual Report 2015
For 12 years Game’s amaLunchbox project has provided children across South African primary schools with a hygienically-prepared hot, nutritious meal every day. Extensive research shows that learners from disadvantaged backgrounds face multiple challenges in getting to school including financial and travel distance. There is also evidence that when they do attend school, many of the learners arrive hungry and face each day with an empty stomach. A warm meal provides an incentive for these children to attend school.
Game has been working with the Department of Basic Education (DOBE) for more than a decade to supply container kitchens to schools. The DOBE also works with local communities to provide children with one nutritious hot meal a day at school. The impact of the project has been profound with results showing an improvement in the children’s concentration levels, school results and a tenfold increase in attendance.
This year Game delivered 10 kitchens, bringing the total kitchens delivered to date to 211. Over 40 million meals are prepared by the local communities in the amaLunchbox kitchens per year, feeding over 200,000 children.
BUILDING SUSTAINABLE FOOD SOURCING
continued
Our performance: Manufactured capital
Investing in our community
Massdiscounters continues to play a meaningful role in the communities within which we operate. Our CSI strategy is primarily focussed on education. We assist in primary school feeding initiatives, ECD, basic literacy and school infrastructure. This year we focussed our efforts on the KwaZulu-Natal and Limpopo provinces.
2015 highlights • Ten Game amaLunchbox kitchens installed in primary schools.• Game Tools-2-Play units were given to ECD centres in KwaZulu-Natal.• Game donated 80 bespoke wheelchairs to the disabled.• We raised over R3 million through our Casual Day initiative.• Game supported the Fight against Malaria programme in partnership with
Kingsley Holgate.• DionWired contributed 12 Smartboards to Schools for the Blind and Deaf in
South Africa.
R3.5 millionCorporate Social Investment focused primarily on nutrition programmes
Investing in our environment
Massdiscounters continues to reap the rewards of previously implemented energy saving initiatives. In an effort to continually improve energy efficiencies we embarked on a number of new projects in 2015.
We are committed to minimise our impact on the environment by:• Fitting all new DionWired stores with full LED lighting.• Replacing inefficient metal halide high bay lighting systems with LED alternatives,
resulting in savings of 75%. • Reducing the cubic volume within DionWired stores through the introduction of
lower ceilings, enabling reduced cooling loads.• Implementing a comprehensive monitoring system in all Game stores, to enable real
time monitoring of power consumption, HVAC, refrigeration and lighting.• Reviewing building specifications to ensure lower costs of operation and reduced
power requirements.• Trailing changes to the refrigeration specifications; if successful, smaller stores will have
doors on all cabinets, with anticipated power consumption saving of 30%. • Ensuring that the Mall of Africa store will consume 59% less power for lighting than
previous generation stores.
260.73 kWh/m² in energy intensity
8,300 tons of waste diverted from landfill
Investing in our people
We are pleased that 60% of senior managers and 92% of middle managers are African, Coloured or Indian (ACI). Both levels performed significantly better than the retail sector as indicated in the 2015 Employment Equity Commission’s Report. Our transformation agenda with respect to the empowerment of women is well positioned.
2015 highlights• 36% female representation at the senior management level.• 49% female representation at middle management level.• 85% of promotions were aligned to our EE plan, of which 49% were female.• 92% of our training budget was dedicated to the training and development of ACI
employees, with 50% of the spend on females employees.• As a W&R SETA-accredited training provider, we ran an in-house NQF-4 qualification
programme.• Our staff benefited by more than R4.5 million in team discounts.• We enabled a further R16.5 million staff benefits through our interest–free staff
purchase facilities.• R250,000 was allocated to staff bursaries for their children’s education.
60%senior managers who are ACI

76 77Massmart Integrated Annual Report 2015
Future outlook Makro remains focused on bringing the benefits of scale to all our customers. We will do this by offering them products and brands that they know and trust, at prices that save them money.
Makro will continue to work on providing access to our proposition to all customers, and on building relevant and cost-effective fulfilment capability to support this.
At Fruitspot we will grow the business by ensuring it becomes a supplier of choice to the retail and hospitality industry, and in the Group.
What we did well:• Delivered online commercial functionality • Improved fulfilment capability• Tested new fulfilment methods
The improvements we made: • Fresh fruit and vegetable offering expanded and now available at 18 stores• Improved forecasting and replenishment capabilities• Improved mature stores’ profitability • Improved the employment equity profile of Executive and senior
management teams• Increasingly used customer and market data to better optimise
promotional and pricing activity
The challenges we’re facing: • High and variable inflation, particularly in food commodities• Weak Rand causing import price challenges• Aggressive trading practices from independent wholesale competitors• Availability of real estate for new stores in South Africa
Our strategic focus for 2016: • Ensure we balance our investment in inventory for availability and price• Invest in our owned brands so that we continue to bring relevant products
at best value to our customers• Explore innovative ways to provide customers access to our value proposition• Build and operate our stores in an environmentally responsible manner• Complete the construction of the new Makro store near the Carnival Mall
area to serve eastern Gauteng• Drive down costs per transactions, while investing in simplifying processes
and systems• Continue to work hard to remain relevant to all our customers
Our 2015 strategy:• Develop our commercial sales and customer service offerings• Improve fulfilment capabilities, to better serve online and commercial
customers whilst balancing the need to achieve scale and operate at lowest possible cost per transaction
• Continue to improve the Food offering to retail customers, and deepen the Fresh and Butchery offering
• Grow market share in Food and Liquor• Optimise working capital through replenishment and supply chain
investments, while ensuring adequate inventory levels during periods of higher inflation volatility
• Drive value through data-led insights into customer behaviours and needs• Invest in technology to better serve customers, manage our supply chain
and coordinate commercial sales and fulfilment
Continued development and maturation in the Makro B2B and B2C online channels
Masswarehouse comprises Makro and The Fruitspot. Makro sells national and owned brands in the Food, Liquor and General Merchandise categories, catering for personal, commercial and trading customers. The Fruitspot is a wholesaler and distributor of fresh and cut fruit and vegetables.
Launch of the Makro Pick-Up locker fulfilment channel
Strong growth from older, established stores as we gain share in food retail and in the commercial market
Opening of a new DC in KwaZulu-Natal
Management team Guy Hayward Non-Executive Chairman,Doug Jones Chief Executive Officer,Dean Bauer Supply Chain, Norman Gray Non-Executive,Garry Hendry Merchandise: Food,Stuart Jowett Merchandise: General Merchandise,Jonathan Koff Merchandise: Liquor,Gert Lourens Operations,Pieter Schoeman IT and Projects,Mike Spivey Non-Executive,Craig Stewart Commercial, Johannes van Lierop Non-Executive,Melanie van Rooy Marketing,Julie Wilford Finance,Donovan Wright Human Resources
Our performance: Manufactured capital
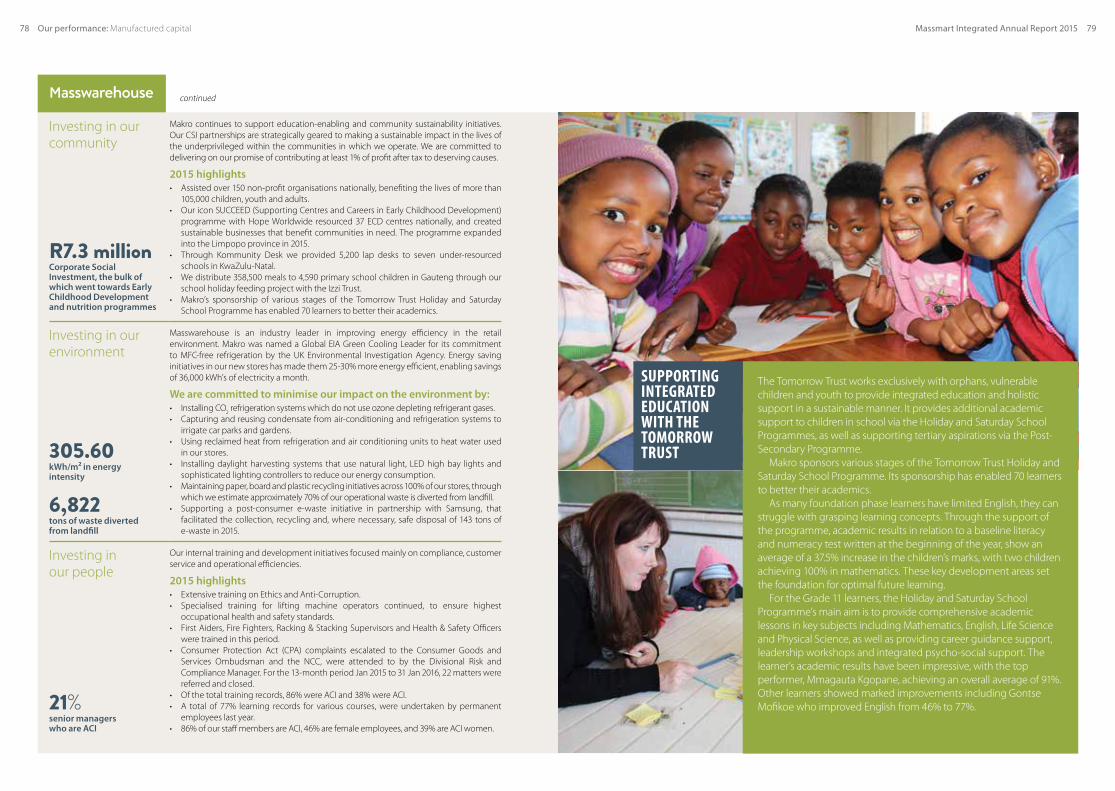
78 79Massmart Integrated Annual Report 2015
The Tomorrow Trust works exclusively with orphans, vulnerable children and youth to provide integrated education and holistic support in a sustainable manner. It provides additional academic support to children in school via the Holiday and Saturday School Programmes, as well as supporting tertiary aspirations via the Post-Secondary Programme.
Makro sponsors various stages of the Tomorrow Trust Holiday and Saturday School Programme. Its sponsorship has enabled 70 learners to better their academics.
As many foundation phase learners have limited English, they can struggle with grasping learning concepts. Through the support of the programme, academic results in relation to a baseline literacy and numeracy test written at the beginning of the year, show an average of a 37.5% increase in the children’s marks, with two children achieving 100% in mathematics. These key development areas set the foundation for optimal future learning.
For the Grade 11 learners, the Holiday and Saturday School Programme’s main aim is to provide comprehensive academic lessons in key subjects including Mathematics, English, Life Science and Physical Science, as well as providing career guidance support, leadership workshops and integrated psycho-social support. The learner’s academic results have been impressive, with the top performer, Mmagauta Kgopane, achieving an overall average of 91%. Other learners showed marked improvements including Gontse Mofikoe who improved English from 46% to 77%.
SUPPORTING INTEGRATED EDUCATION WITH THE TOMORROW TRUST
Our performance: Manufactured capital
continued
Investing in our community
Makro continues to support education-enabling and community sustainability initiatives. Our CSI partnerships are strategically geared to making a sustainable impact in the lives of the underprivileged within the communities in which we operate. We are committed to delivering on our promise of contributing at least 1% of profit after tax to deserving causes.
2015 highlights• Assisted over 150 non-profit organisations nationally, benefiting the lives of more than
105,000 children, youth and adults. • Our icon SUCCEED (Supporting Centres and Careers in Early Childhood Development)
programme with Hope Worldwide resourced 37 ECD centres nationally, and created sustainable businesses that benefit communities in need. The programme expanded into the Limpopo province in 2015.
• Through Kommunity Desk we provided 5,200 lap desks to seven under-resourced schools in KwaZulu-Natal.
• We distribute 358,500 meals to 4,590 primary school children in Gauteng through our school holiday feeding project with the Izzi Trust.
• Makro’s sponsorship of various stages of the Tomorrow Trust Holiday and Saturday School Programme has enabled 70 learners to better their academics.
R7.3 millionCorporate Social Investment, the bulk of which went towards Early Childhood Development and nutrition programmes
Investing in our environment
Masswarehouse is an industry leader in improving energy efficiency in the retail environment. Makro was named a Global EIA Green Cooling Leader for its commitment to MFC-free refrigeration by the UK Environmental Investigation Agency. Energy saving initiatives in our new stores has made them 25-30% more energy efficient, enabling savings of 36,000 kWh’s of electricity a month.
We are committed to minimise our impact on the environment by:• Installing CO
2 refrigeration systems which do not use ozone depleting refrigerant gases.
• Capturing and reusing condensate from air-conditioning and refrigeration systems to irrigate car parks and gardens.
• Using reclaimed heat from refrigeration and air conditioning units to heat water used in our stores.
• Installing daylight harvesting systems that use natural light, LED high bay lights and sophisticated lighting controllers to reduce our energy consumption.
• Maintaining paper, board and plastic recycling initiatives across 100% of our stores, through which we estimate approximately 70% of our operational waste is diverted from landfill.
• Supporting a post-consumer e-waste initiative in partnership with Samsung, that facilitated the collection, recycling and, where necessary, safe disposal of 143 tons of e-waste in 2015.
305.60 kWh/m² in energy intensity
6,822 tons of waste diverted from landfill
Investing in our people
Our internal training and development initiatives focused mainly on compliance, customer service and operational efficiencies.
2015 highlights• Extensive training on Ethics and Anti-Corruption.• Specialised training for lifting machine operators continued, to ensure highest
occupational health and safety standards.• First Aiders, Fire Fighters, Racking & Stacking Supervisors and Health & Safety Officers
were trained in this period.• Consumer Protection Act (CPA) complaints escalated to the Consumer Goods and
Services Ombudsman and the NCC, were attended to by the Divisional Risk and Compliance Manager. For the 13-month period Jan 2015 to 31 Jan 2016, 22 matters were referred and closed.
• Of the total training records, 86% were ACI and 38% were ACI.• A total of 77% learning records for various courses, were undertaken by permanent
employees last year.• 86% of our staff members are ACI, 46% are female employees, and 39% are ACI women.
21%senior managers who are ACI

80 81Massmart Integrated Annual Report 2015
New import and distribution facility opened in KwaZulu-Natal
Private Label sales grew by 15%, accounting for 18% of total sales
Four new stores opened in South Africa, and Builders Warehouse opened in Zambia
Alignment of operations to support the ‘Builders’ single brand
Future outlook Massbuild remains committed to growth. We will increase our footprint by opening new stores in South Africa and Southern Africa. We aim to increase our market penetration in rural areas through the Builders Superstore format. Massbuild’s overall objective remains to be Southern Africa’s market leader in home improvement, DIY and building materials.
Massbuild is a leader in Home Improvement, DIY and Building Materials offering complete project solutions. Four store formats cater to different markets with their own personalised feel and service offerings. Massbuild promises exceptional value and offers a comprehensive range of competitively priced products, with experts on hand to provide advice on home, DIY and gardening needs.
Management team Guy Hayward Non-Executive Chairman,Llewellyn Walters Chief Executive Officer, Karen Ferrini Africa, Norman Gray Non-Executive,Neville Hatfield Merchandise,Diane Hoffman Supply Chain,Chris Lourens Operations, Mncane Mthunzi Builders Superstore, Lizelle Petersen Finance, Alex Rymaszewski Store Development, Mike Spivey Non-Executive,Andre Steyn Marketing & Innovation, Cristina Tomaz Weeden Human Resources,Chris Tugman IT,Johannes van Lierop Non-Executive
Our performance: Manufactured capital
What we did well:• Managed stock growth at half the rate of sales growth• Grew PBIT by 23.5%, providing robust shareholder return• Expansion and optimisation of the warehouse and distribution network• Smooth implementation and transition of a ‘Single Brand’ Builders
The improvements we made: • Profitability of Builders Trade Depot• Savings in the Gauteng distribution centre through improvements
in productivity • ‘Builders’ single brand has enabled improved efficiencies across the
brands
The challenges we’re facing: • Tough South African economic environment pressurising our core
middle class customer• Slowing African economies from weaker global prices for resources
and strong US Dollar• Planned roll-out of SAP Point-of-Sale system across all stores in South
Africa, commencing in early 2016
Our strategic focus for 2016: • Offer our customers a compelling value proposition• Grow Massbuild Private Label sales• Optimise the single Builders’ brand to extract value• Expand omni-channel offer; online pilot planned for 3rd quarter• Help people build better lives• Be the best place to work for most talented people• Be the best route to market for quality building materials and
products for our suppliers• Grow market share in a tough economic environment• Roll-out space planning
Our strategy for 2015 was:• Private Label expansion: continue with roll-out of key programmes• Grow South Africa and Africa store footprint• Extend and optimise the supply chain network• Builders’ single brand alignment roll-out, rebranding programme
for Builders Trade Depot and Builders Express• Optimise Builders Trade Depot, focus on inventory and leverage IT
platform• Optimise Superstore offering and grow the brand• Focus on Trade Customer and Business-to-Business• Development of omni-channel

82 83Massmart Integrated Annual Report 2015
Reaching the end of a ground breaking CSI initiative, Massbuild is proud to have completed the final classroom for the Build-a-Class initiative. Over a period of three years, Massbuild successfully built, renovated or expanded a total of 15 classrooms across schools in South Africa.
Klopper Park Primary in Isando is a non fee-paying school, which accommodates poverty-stricken learners residing in the Klopper Park, Elandsfontein and Tembisa areas. Initially opened as a pre-primary school, it was converted into a primary school in 2001. The Build-a-Class project provided an additional classroom that will be used for special needs teaching.
Edward Matyeke Primary School in Witbank opened in 1990 and is a non fee-paying school catering for learners from nearby squatter camps. There are 92 Grade R learners accommodated across two classrooms, with one being a small corrugated iron shack, previously used for storage. With the additional classrooms from Massbuild, the Grade R learners are now placed in three classrooms, improving the learning environment, and allowing the teachers to have a limited number of learners per class.
In 2015 there were 585 young learners at Wonderboom Suide Laerskool and the numbers are growing. A new classroom donated by Massbuild will provide additional space for new learners.
BUILDING BRIGHTER FUTURES… ONE CLASSROOM AT A TIME
Our performance: Manufactured capital
continued
Investing in our community
Massbuild aims to make a relevant and notable contribution to the social development agenda. Our CSI projects are aligned with our business strategy; we focus our initiatives on improving education infrastructure in South Africa. Our CSI programme includes infrastructure renovations, building of schools and ECD centres. In 2015 Massbuild invested over R5 million in CSI projects.
2015 highlights• The Build-a-Class project was successfully completed with six schools receiving a
new classroom. The new space available will help to alleviate the number of learners per class, enabling a better ratio of learners to teacher.
• In partnership with Carte Blanche, we provided Swallows Nest Baby Centre with R20,000 worth of power sources (e.g. inverters and outside security lights) to help manage electricity issues during load shedding. Ellies, a supplier to Massbuild, assisted with renovation aspects of the project and provided additional stock.
• Partnering with Super Sport and Hitachi, Massbuild provided a much needed sports field to Aquadene Secondary School in Richards Bay. Completed in 2015, the sports field now provides the space for the learners to engage in a variety of new sporting activities.
• As part of our annual commitment to Mandela Day, we partnered with SAFM, Gift of the Givers, Nedbank Alliance and Mercedes Benz East Rand to provide a borehole and establish a vegetable garden for Retshwenyegile Centre for the Aged in the North West province.
• Following a devastating fire where over 100 shacks were destroyed, we donated R30,000 worth of building materials to the community of Cosmo City.
• The Star Child Crèche, based in Alexander, received a much-needed playground from Massbuild. We also revamped the kitchen and tiled the classrooms, providing a more conducive learning environment.
R5.1 millionCorporate Social Investment,targeted at school infrastructure and maintenance programmes
Investing in our environment
Our energy saving initiatives are gaining traction: so far approximately 30% of our stores utilise daylight harvesting. 25% of our stores have building management systems in place that control in-store energy usage, as well as providing early warning on fire alarms and intrusions. 13% of our stores use either LED or T5 lighting. This is set to increase as upgrades are carried out at our stores in the future.
We are committed to minimise our impact on the environment by:• Using natural light and efficient LED lighting systems to save energy.• Investing in air-conditioning technologies that do not emit greenhouse gases.• Harvesting rain water that is used for watering our garden centres.• Recycling our bulk packaging, paper and plastic.
88.55 kWh/m² in energy intensity
2,041 tons of waste diverted from landfill
Investing in our people
Massbuild is committed to the training and development of our employees. Through our CEO’s Women’s Council Mentoring programme we are committed to a balanced employee management gender profile. Our CEO’s Massbuild School Leavers’ Academy offers training for disadvantaged unemployed young people.
2015 highlights• R27.5 million was spent on training. • 765 Massbuild managers, of which 294 were women, attended management and
leadership courses.• 3,171 employees attended safety courses. • Employees participated in W&R SETA-funded retail management programmes
provided by University of Johannesburg and University of Pretoria.
33%senior managers who are ACI

84 85Massmart Integrated Annual Report 2015
Shield is a leading voluntary buying association, with strong sales and profit growth
First Northern Cape Retail store opened, now operating in seven of South Africa’s nine provinces
Significant growth in Retail Division’s operating profit over 2014
Cash and Carry business unit piloted online ordering for trade customers
Future outlook Cambridge Food has a strong store roll-out plan for the next two years. We anticipate opening ten new stores in 2016, and a further ten in 2017. We will strengthen our Fresh operating model, roll-out significant IT projects, develop store management and improve supply chain capability, to provide leverage for this future growth.On the Wholesale side, we anticipate a continuation of aggressive trading from the corporate Food retailers serving the low-income customer, but are cautiously optimistic about our growth over the next year.
Masscash consists of a Wholesale Division with Cash & Carry Food and Cosmetics businesses, and a Retail Division, which comprises Food outlets targeting lower LSM groups. The Wholesale Division includes CBW, Jumbo Cash & Carry, Trident and Shield. The Retail Division consists of the Cambridge Food and Rhino Cash & Carry brands.
Management team Retail Guy Hayward Non-Executive Chairman,Kevin Vyvyan-Day Chief Executive Officer,Bronwynne Bester Human Resources,Norman Gray Non-Executive,Chris Knight Regional Gauteng,Mike Marshall Commercial,Matthew Petit Finance, Mike Spivey Non-Executive,Andrew Stein Marketing, Craig Surmon Regional KZN, Johannes van Lierop Non-Executive
WholesaleGuy Hayward Non-Executive Chairman,Neville Dunn Chief Executive Officer, Andrew Mardon Merchandise, Thiruvashani Naicker Finance,Jane Bruyns Human Capital Non-Executive,Norman Gray Non-Executive,Mike Spivey Non-Executive,Robin Wright Non-Executive,Johannes van Lierop Non-Executive
Our strategic focus for 2016: • On the Retail side of our business, we are committed to opening
new regions, and growing profitable regions• We are committed to enhancing our Fresh Food assortment• We are committed to completing our Wholesale organisational
transformation plan• We are committed to building a superior
route to market for our supplier brands
Our strategy for 2015 was:• Grow profitable Retail regions• Improve Fresh Food assortment• Roll-out single platform on SAP• Reorganise Wholesale buying structure • Optimise Wholesale store portfolio• Improve Wholesale supply chain and logistics capability• Focus on Saverite franchise
What we did well:• Significantly improved Retail profitability in Gauteng, KwaZulu-
Natal and Free State • Strengthened Fresh department offering, including butchery, fruit
and vegetable• Successfully reorganised the Wholesale buying structure• Grew membership of Wholesale Food and Liquor franchise
including number of members and their sales contribution
The improvements we made: • Better on-shelf Retail stock availability• Fresh department execution• Customer service improvements for Shield and franchise members
The challenges we’re facing: • Increasing debt burden facing consumers due to higher
interest rates • Significantly higher Food inflation expected• Weak job growth at lower-income levels• Disposable income squeeze in target customer base
Our performance: Manufactured capital
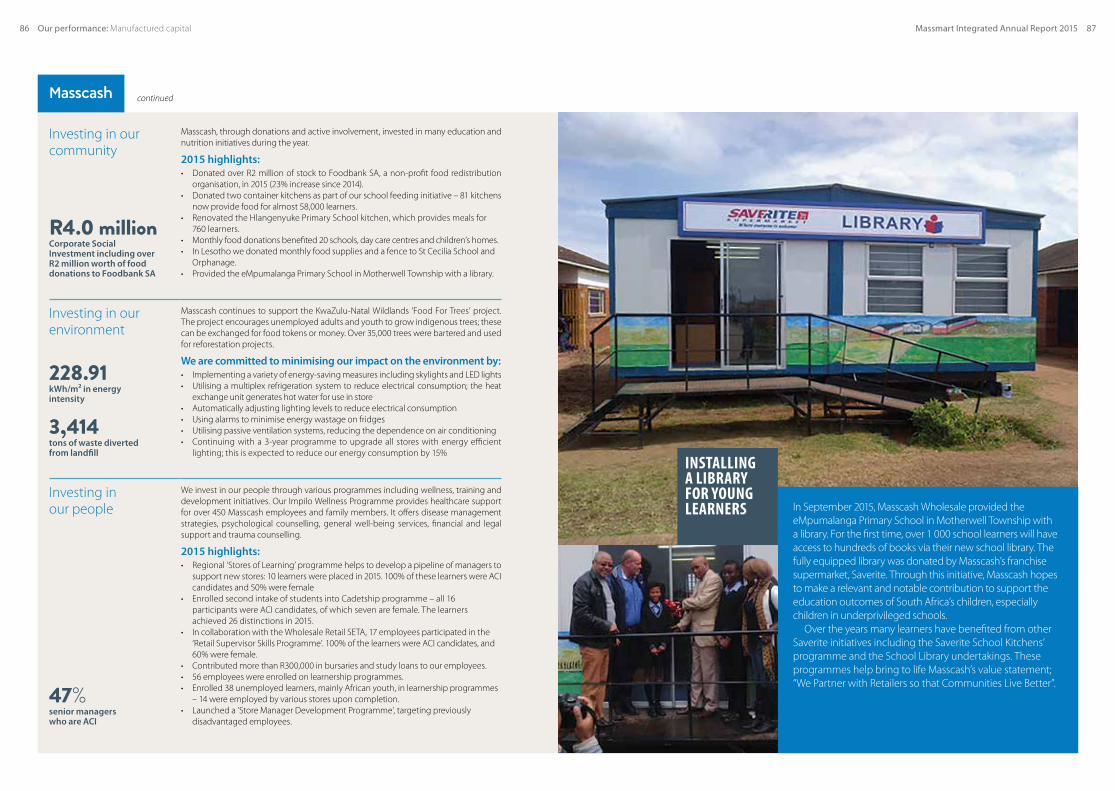
86 87Massmart Integrated Annual Report 2015
In September 2015, Masscash Wholesale provided the eMpumalanga Primary School in Motherwell Township with a library. For the first time, over 1 000 school learners will have access to hundreds of books via their new school library. The fully equipped library was donated by Masscash’s franchise supermarket, Saverite. Through this initiative, Masscash hopes to make a relevant and notable contribution to support the education outcomes of South Africa’s children, especially children in underprivileged schools.
Over the years many learners have benefited from other Saverite initiatives including the Saverite School Kitchens’ programme and the School Library undertakings. These programmes help bring to life Masscash’s value statement; “We Partner with Retailers so that Communities Live Better”.
INSTALLING A LIBRARY FOR YOUNG LEARNERS
Our performance: Manufactured capital
continued
Investing in our community
Masscash, through donations and active involvement, invested in many education and nutrition initiatives during the year.
2015 highlights:• Donated over R2 million of stock to Foodbank SA, a non-profit food redistribution
organisation, in 2015 (23% increase since 2014).• Donated two container kitchens as part of our school feeding initiative – 81 kitchens
now provide food for almost 58,000 learners. • Renovated the Hlangenyuke Primary School kitchen, which provides meals for
760 learners. • Monthly food donations benefited 20 schools, day care centres and children’s homes.• In Lesotho we donated monthly food supplies and a fence to St Cecilia School and
Orphanage. • Provided the eMpumalanga Primary School in Motherwell Township with a library.
R4.0 millionCorporate Social Investment including overR2 million worth of food donations to Foodbank SA
Investing in our environment
Masscash continues to support the KwaZulu-Natal Wildlands ‘Food For Trees’ project. The project encourages unemployed adults and youth to grow indigenous trees; these can be exchanged for food tokens or money. Over 35,000 trees were bartered and used for reforestation projects.
We are committed to minimising our impact on the environment by:• Implementing a variety of energy-saving measures including skylights and LED lights• Utilising a multiplex refrigeration system to reduce electrical consumption; the heat
exchange unit generates hot water for use in store • Automatically adjusting lighting levels to reduce electrical consumption• Using alarms to minimise energy wastage on fridges• Utilising passive ventilation systems, reducing the dependence on air conditioning • Continuing with a 3-year programme to upgrade all stores with energy efficient
lighting; this is expected to reduce our energy consumption by 15%
228.91 kWh/m² in energy intensity
3,414tons of waste diverted from landfill
Investing in our people
We invest in our people through various programmes including wellness, training and development initiatives. Our Impilo Wellness Programme provides healthcare support for over 450 Masscash employees and family members. It offers disease management strategies, psychological counselling, general well-being services, financial and legal support and trauma counselling.
2015 highlights:• Regional ‘Stores of Learning’ programme helps to develop a pipeline of managers to
support new stores: 10 learners were placed in 2015. 100% of these learners were ACI candidates and 50% were female
• Enrolled second intake of students into Cadetship programme – all 16 participants were ACI candidates, of which seven are female. The learners achieved 26 distinctions in 2015.
• In collaboration with the Wholesale Retail SETA, 17 employees participated in the ‘Retail Supervisor Skills Programme’. 100% of the learners were ACI candidates, and 60% were female.
• Contributed more than R300,000 in bursaries and study loans to our employees. • 56 employees were enrolled on learnership programmes. • Enrolled 38 unemployed learners, mainly African youth, in learnership programmes
– 14 were employed by various stores upon completion. • Launched a ‘Store Manager Development Programme’, targeting previously
disadvantaged employees.
47%senior managers who are ACI

88 89Massmart Integrated Annual Report 2016Our performance: Human capital
Human capital
We offer an authentic retail experience which encourages a spirit of entrepreneurship. We recognise that a diverse and inclusive workforce is crucial for sustained business growth.
The Group actively seeks the continuous improvement of performance in the portfolio and its parts, through strategic and structural clarity, high market shares, excellent management, principle-driven ethical leadership, cost-effective technology and the sharing or accumulation of capabilities, knowledge, resources, influence and information.
To this end, thought-leadership, individual and collective performance, and collaboration throughout the Group are appropriately recognised, valued and rewarded. Our vision as an organisation is to deliver value to our customers, suppliers, employees, investors, communities and other social partners at large. We share people-centric values that define our behaviour and shape our culture, allowing us to: service our customers; show respect for the individual; and strive for excellence and integrity. Our adherence to these principles has created a unique work culture within our business. These are built on a foundation of integrity where the principles of honesty, fairness and objectivity guide how we apply these values in the workplace.
Massmart offers diverse career choices such as: Marketing, Business Intelligence, Accounting, Information Systems and Business Processes, Supply Chain, Operations, Legal, Compliance, Human Capital, Merchandising and International Commerce; to name but a few. This is what differentiates us and strengthens our value proposition to our employees. We aspire to be the most trusted retailer in Africa and the ultimate home of the career retailer. This goal can only be achieved when excellence is demonstrated through inspired and engaged people.
Talent management At Massmart talent management refers to a set of integrated organisational Human Resources’ processes designed to attract, assess, develop, motivate, and retain productive, engaged employees. Through these processes we create a high-performance, sustainable organisation by having the right people in the right place at the right time. This requires an accurate forecast of the demand for talent in core, critical and scarce skill functions, and an understanding of the talent supply we already have.Our objective is to: • Align strategic Group talent management initiatives with current and future
business requirements;• Provide accurate, useful, actionable “People Intelligence” to the business for the
purpose of human capital risk management and succession planning;• Accelerate the development of high potential leadership talent through
individual career management discussions, and customised executive development programmes;
• Build a diverse organisation that mirrors the customers and communities that we serve; and
• Enable the operating Divisions by providing best practice talent management processes, tools and training.
Our bi-annual Executive talent review and succession planning process is the foundation of talent management. Leadership talent data from across the organisation is collected, analysed and calibrated by the Massmart Executive Committee for the purpose of identifying, developing and retaining top talent. The focus this year has been on understanding leadership talent risk at a functional level, identifying a technology solution to support the management of the data and the process, and aligning learning and development solutions with the gaps identified through the talent review process.
Massmart Corporate University (MCU)The MCU has grown and evolved into a key element of our talent management strategy, as it provides a framework in which we can make focussed contributions to the development of people at all levels, while building internal succession.
Furthermore, positioned as it is at the intersection of all Divisions, the MCU provides us with a unique opportunity to influence our organisational culture that has as its foundation the values of mutual respect, collaboration and empowerment.
WE OFFER AN AUTHENTIC RETAIL EXPERIENCE WHICH ENCOURAGES A SPIRIT OF ENTREPRENEURSHIP. WE RECOGNISE THAT A DIVERSE AND INCLUSIVE WORKFORCE IS CRUCIAL FOR SUSTAINED BUSINESS GROWTH.
“
”We believe that each of our associates brings a unique set of skills, experiences, perspectives and ideas that gives us the competitive edge. We believe people drive their own development, but it is our duty to provide an environment that is conducive for nurturing their talent and creating opportunities for them.
In 2015…
What we did well:The focus of the talent management team this year has been on understanding leadership talent risk at a functional level, identifying a technology solution to support the management of the data and the process, and aligning learning and development solutions with the gaps identified through the talent review process.
The Massmart Corporate University has grown and evolved into a key element of our talent management strategy, as it provides a framework in which we can make focussed contributions to the development of people at all levels, while building internal succession.
The improvements we made:In 2015 Massmart embarked on a project of job evaluation, and the setting of remuneration structures that are market related, affordable to the business and that encourage an environment of performance related pay.
The challenges we’re facing:Prompted by changes to section 198 of the Labour Relations Act (No. 66 of 1995) each Massmart Division has undertaken a comprehensive assessment of their employment contract composition.

90 91Massmart Integrated Annual Report 2016Our performance: Human capital
Human capital performance indicators
68.55%Estimated % employees with medical benefits
63.7 in 2014, 53.6 in 2013, 48.4 in 2012, 41.9 in 2011
38.83%Unionised Staff
38.8 in 2014, 36.0 in 2013, 36.2 in 2012, 37.3 in 2011
13.07%Estimated staff turnover
15.9 in 2014, 10.2 in 2013, 10.0 in 2012, 10.2 in 2011
35.84%Flexi-timers
37.0 in 2014, 37.5 in 2013, 33.9 in 2012, 32.1 in 2011
6.50%HIV Prevalence
5.8 in 2014, 5.5 in 2013, 6.6 in 2012, 5.6 in 2011
93.44%Local management in non-South African operations as a % of total management
88.7 in 2014, 90.5 in 2013, 89.3 in 2012, 86.7 in 2011
60.13%Black management as a % of all management and professionals
61.7 in 2014, 74.8 in 2013, 78.5 in 2012, 77.7 in 2011
R2,963.61Estimated annual per capita training investment – permanent (R)
R3,778.66 in 2014, R2,935.00 in 2013, R3,012 in 2012, R1,879 in 2011
R3,221.91Average monthly Minimum Wage (R)
R3,108.00 in 2014, R2,688.00 in 2013, R2,953 in 2012, R2,859 in 2011
As employees enhance their personal capacity they are encouraged to network and build relationships across the Divisions. The MCU consists of four schools that are closely aligned to our business strategy: • The School of Leadership Development: Advanced leadership development is
critical to our growth strategy. This school addresses the ongoing development needs of senior Executives through a variety of interventions, under the guidance of faculty at some of South Africa’s best business schools;
• The School of Management Development: Acknowledging that many of our best leaders have emerged from inside the business, this school provides them with the opportunity to attend accredited courses that equip them with the tools to optimise their own and their team’s performance;
• The School of Retail Excellence: Keeping in mind the shortage of core retail skills in the country, this school aims to provide development to merchants at all levels, ensuring strength in this critical team; and
• The School of Career Development: In South Africa, with our history of systemic discrimination, the management of talent cannot be seen in isolation from our journey towards transformation. The School of Career Development has to date primarily been responsible for driving our Graduate Development Programme, and Graduate Alumni Programme. As we move our diversity and inclusion strategy forward, we will now offer a framework for the development of all emerging talent candidates.
We believe that this systematic approach to the development of talent will serve Massmart’s needs to build core competencies in support of our growth strategy.
Remuneration and benefit structuresAt Massmart we believe in remunerating employees fairly for their roles. In 2015 Massmart embarked on a project of job evaluation, and the setting of remuneration structures that are market related, affordable to the business and that encourage an environment of performance related pay. In 2016 Massmart will begin the formal implementation of these remuneration structures.
People First projectThe HR Forum embarked on a project to implement a new Group-wide HR/Payroll system. The motivation was to replace the existing legacy payroll systems, while providing additional HR functionality to facilitate clean data, standardised processes and richer reporting. This project was a first for Massmart as HR, Payroll, Finance and IT from all Divisions collaborated, ensuring a single payroll instance and simplifying ways of working for the benefit of the Massmart Group in all countries in which we trade. Synergies have already been realised in new HR and Payroll processes and templates, reports that all areas can benefit from, alignment to policies and legislation, and implementing best practice. The project is due for completion mid 2016 where phase two will look at additional functionality like Employee Self Service.
BUA employee engagement surveyMassmart participates in an employee engagement survey with all companies working within the Walmart group to help understand how our employees feel about working for Massmart. The survey covers themes that impact on the Massmart Brand namely; teamwork, work environment, career and development, support, leadership, direct supervisor, action planning, and ethics. The last survey was held in 2014; leaders have worked with their teams throughout 2015 to improve on our engagement scores.
Labour brokersPrompted by changes to the section 198 of the Labour Relations Act (No. 66 of 1995) each Massmart Division has undertaken a comprehensive assessment of their employment contract composition. This has resulted in the decision to phase out the use of labour brokers in core roles. Divisional Human Resources’ leaders are working on projects with labour brokers and unions in their business to accommodate the new legislation.
Human capital data is based on Group and Divisional payroll data. Due to the large number and geographical positioning of stores, testing is not conducted at all stores every year. Data is internally audited prior to publication. Comparative data represents the best available performance disclosed by South African retailers, except otherwise noted. HIV prevalence is based on Healthy Choices VCT testing figures.
Prevalence has decreased and remains well below the national prevalence rate.
This indicates the percentage of local management in our African operations outside of South Africa.
There has been a slight decrease % in black management as the Company is aligning with globally recognised job evaluation and grading processes.
Above:Fikile Sikhosana, Makro Corporate Brand Controller and Graduate Development Programme alumnus

92 93Massmart Integrated Annual Report 2016Our performance: Human Capital
Remuneration report
I am pleased to present the Massmart Remuneration Report for the year ended December 2015. This year we have changed the layout of the report aligning it closer to market trends by separating the report into the following three sections:• Section A is the Remuneration Committee Chairman’s report; • Section B covers Massmart’s remuneration philosophy and policy; and • Section C reports on Massmart’s application of the remuneration policy
during 2015.
Introduction to the Remuneration ReportThis report details information applicable to Massmart’s remuneration philosophy, policy and practice for Executive and non-Executive Directors. It sets out the actual payments, accruals and awards for the year ended December 2015.
The Remuneration Report is aligned with the Remuneration guidelines of the King Code of Governance Principles (King III) and it is compliant with the Companies Act.The report seeks to provide the following: • A summary of the Group’s remuneration policy, philosophy and objectives; • The Remuneration Committee and its role;• Key remuneration decisions taken during the 2015 financial year;• Key remuneration priorities for the 2016 financial year;• Executive Directors’ contractual arrangements, pay-mix and earnings; and• Non-Executive Directors’ contracts and payments.
Massmart Group performance For the year ended December 2015 Massmart’s total sales were R84.7 billion, an increase of 8.4% over the prior year (2014: R78.2 billion and 2013: R72.3 billion). Pleasingly, Group operating profit, excluding foreign exchange movements and interest, grew by 14.1% to R2.3 billion (2014: R2.0 billion and 2013: R1.9 billion).
Both the Short Term Incentives (STI’s) and Long Term Incentives (LTI’s) in Massmart are linked to the performance of the Massmart Group. Further details on the 2015 STI pay-out and the LTI vesting are included in Section C.
Director changesWe are pleased to announce the appointment of Enrique Ostalé to the Board of Directors of Massmart with effect from 24 February 2016. Enrique is the President and Chief Executive Officer of the Walmart Latam, India and Africa Region. Enrique will be sitting on both the Nomination and Remuneration Committees, following the resignation of Shelley Broader on 9 November 2015.
During 2015 there were separate announcements concerning the appointments of Johannes van Lierop and Moses Kgosana, as well as the resignation of Ilan Zwarenstein. Johannes was appointed as Chief Financial Officer with effect from 12 March 2015 and his remuneration, as set out in this Report, has accordingly been included from this date.
Massmart acknowledges that employing expatriates in South Africa, a country with high unemployment, is a sensitive and difficult decision. However Massmart feels that to meet the challenges lying ahead, as described in Our CEO’s letter to our stakeholders, global skills, especially those with experience of the African continent, are required to achieve the goals of the Company.
Section A: Report from the Chairman of the Remuneration Committee
Key decisions taken during 2015
Remuneration structure: • In 2014 Massmart introduced a formal salary structure. This has been
further entrenched and applied in 2015. This structure has been used to measure employees’ Total Guaranteed Package (TGP) or basic salaries and to ensure internal equity as well as market competitiveness.
• During 2015 Massmart conducted detailed salary and incentive benchmarking to determine market competitiveness and fairness of salaries compared to market.
Key remuneration priorities approved by the Remuneration Committee for 2016:• In January 2016 Massmart introduced truCARE. This is an occupational
health-offering providing our permanent employees access and services, at no cost to the employee, to private primary healthcare at practitioners located close to their place of work. The truCARE offering is available only to employees who earn below a predetermined threshold and who are not on one of the Company-approved and subsidised medical aid options.
• In 2016 Massmart plans to transition management employees from awarding increases on basic salary to awarding increases on TGP.
• The ability to implement a non-financial Annual Incentive Plan (AIP) metric to employees at Executive level in future. These non-financial metrics are aimed at driving business strategy. All metrics, targets and their measures will be approved by the Remuneration Committee. Such metrics will remain in place for one year and new proposals will be tabled to the Remuneration Committee each year.
• To implement additional LTI participation opportunities for high-performing talented BBBEE permanent employees who would not be eligible to participate in the existing LTI participation opportunities.
• Implement occupational health and wellness benefits to all permanently-appointed employees earning below the tax threshold.
• Implement the retirement reform proposals as promulgated in the Taxation Laws Amendment Bill of 2015.
The information provided in this report has been approved by the Board on the recommendation of the Remuneration Committee.
Chris SeabrookeChairman of the Remuneration Committee1 April 2016
Chris SeabrookeChairman of the Remuneration Committee

94 95Massmart Integrated Annual Report 2016Our performance: Human capital
Section B: Remuneration policy
Remuneration report continued Remuneration philosophy
The purpose of Massmart’s remuneration philosophy is to establish fair and equitable reward levels that will attract, motivate and retain high calibre employees. This is in line with the Group’s culture and values, whilst aligning remuneration with shareholder interests and best practice in the retail environment.
We strive to ensure that our remuneration policy supports the development and retention of top talent and critical skills. Its purpose is to ensure a workforce that is motivated to successfully develop, implement and support the Group’s business strategy. The focus is on ensuring the long-term growth and success of the Group and the enhancement of stakeholder value.
Each year at the Annual General Meeting (AGM), in accordance with King III, the Group remuneration policy is put to a non-binding advisory vote. This non-binding advisory vote allows shareholders to express their views on the remuneration policies adopted by the Group. For more information on the Group’s remuneration policy, please contact the Chairman of the Remuneration Committee.
Primary objectives of our remuneration programmes: • Provide competitive and equitable remuneration, based on an employee’s skills,
performance and contributions to the Group, among other factors; • Attract and retain the talent necessary to achieve the Group’s business objectives;• Develop a sense of Group ownership and align the interests of employees with
those of its shareholders; and• Provide opportunities for the potential of greater financial rewards to those who
perform well within their job responsibilities.
Massmart is committed to maintaining market-related pay levels that reflect a job’s worth to the Group. This includes incentives that recognise and reward individuals for business and individual performance against targets. Within this context, Massmart’s total reward offering comprises the following elements:
TGP is benchmarked to the median, but if stretch performance is achieved for the STI’s and LTI’s, the total reward package is intended to pay out at the 75th percentile.
AdvisorsThe Remuneration Committee makes use of external advisors, namely:• PwC Remchannel• Hay Group• Deloitte
Massmart remains committed to ensuing competitive remuneration packages whilst managing costs. Massmart participates in a number of annual Remuneration and Benefit Surveys to ensure the remuneration, benefits and incentives on offer are maintained at market-competitive levels. Remuneration packages as a whole are regularly measured against the national market, with additional comparisons within the retail industry and against similar-sized South African listed companies.
Basic Salary The basic salary provides a fixed income as determined to be appropriate and market-aligned for each particular level and or role. Salaries are reviewed annually against market data. Increases are awarded on basic salary in July each year. The actual percentage increases awarded are determined by taking CPI, business performance, market trends and individual merit into account, whilst also considering salary positioning against the Massmart salary structure and market data. Expatriate employees working for Massmart in South Africa receive a basic salary denominated in US Dollars as well as additional non-cash benefits e.g. housing, schooling and home leave. The TGP is benchmarked around the market median.
Retirement Benefits
All permanent employees are required to belong to a Group-approved retirement fund. The current Group-approved funds are all defined contribution schemes. The funds provide the employee an opportunity to save for retirement. Life, disability and funeral cover are also provided to all permanent employees. Alexander Forbes has administered the Massmart funds for a number of years. A formal service level agreement is in place that regulates this relationship. The trustees of the funds monitor fund performance on a quarterly basis. The Company contributes 10.5% of Pensionable Salary to the retirement fund and related insurances. Employees contribute at least 7%.
Medical Aid Benefits
It is compulsory for all new permanent Massmart Group employees to join a Company-approved medical plan. The Group has the responsibility of ensuring that appropriate plans are offered by the Massmart Health Plan and that contribution levels are sustainable and affordable for all levels of employees. Expatriate employees are covered by a separate international medical insurance. The Company contributes a portion of the medical aid fund contribution; the difference is contributed by the employee.
Car / Travel Benefits
Travel allowances, or company cars, are provided to nominated employees to enable them to perform their duties, as required. The quantum of the allowance or company car value is determined based on the requirements of each specific level and/or role.
TOTAL GUARANTEED PACKAGE (TGP)
• Basic Salary• Retirement and Medical Aid Benefits• Car/Travel Benefits• Other expatriate benefitsAppropriate for the level of each employee Aims to attract and reward
SHORT TERM INCENTIVES (STI)
• One year Annual Incentive Plan (AIP)• Bonus is expressed as a multiple of basic monthly salaryAligned to the achievement of financial and non-financial targets
LONG TERM INCENTIVES (LTI)
• Performance and Restricted share awards• Award is expressed as a percentage of the TGPAligned to Company financial performance and shareholder returns
TOTAL GUARANTEED PACKAGE (TGP)MASSMART’S TOTAL REWARD OFFERING

96 97Massmart Integrated Annual Report 2016
Purpose The SIP is a long-term equity-based incentive plan. A combination of Performance Shares and Restricted shares is awarded to qualifying employees.
Eligibility Full-value share rights are awarded bi-annually to qualifying permanent employees.In 2015, initial qualification is based on a minimum earning criteria as well as motivation by the
Executive Committees of each of the Divisions. Final approval for participation is provided by the Remuneration Committee.
Eligibility and award values have been benchmarked to the PwC-reported LTI awards and Massmart is positioned in the upper quartile.
Operation and instruments
Performance Shares The performance share metrics have been designed to align with Walmart’s metrics and are measured individually against approved Group-level annual nominal sales and Return on Investment (ROI) targets, over three separate years, with an equal weighting. Each target has a range and the final awards are calculated based on a sliding scale in the range of 50%-150%. If achieved, the awards are equity-settled at the end of the third year. If performance against either of the targets falls under the minimum of the range, no performance share awards will be provided against that target.
Restricted SharesRestricted share grants are specifically utilised for retention purposes and vest on a time basis, being one third each at the end of years 3, 4 and 5.
Mix of awards The plan provides for a mix of performance shares, which are awarded annually in March and grants of restricted shares which are granted annually in September, based on the level of the employee. At Executive levels, the mix is 75% performance shares/25% restricted shares and at other levels, 50%/50%.
Value of awards Currently, at Executive level, the award value of the award ranges between 40%-100% of TGP. At other levels, the award is based on 12.5%-25% of TGP.
Limits In aggregate all participants, under all Plans, may not exceed 39.5 million shares.Individually, one participant may not exceed 4 million shares.
Settlement The settlement of grants and awards are done primarily through on-market share purchases.
Discretion of the Remuneration Committee
The Remuneration Committee may approve special restricted share awards to employees which the Company wishes to recognise for extraordinary achievements.
Purpose The AIP aims to incentivise and reward the achievement of the approved annual operating income targets. Massmart places particular emphasis on generous annual incentives for high performance.
Eligibility Executives and employees from a certain staff level are able to participate in the AIP, subject to Remuneration Committee approval.
Components The AIP opportunity is 100% linked to the approved annual operating income targets for both the Massmart Group and its Divisions. Group Executives are 100% incentivised on Group Performance, while Divisional Executives are incentivised on 75% of Divisional performance and 25% of Group performance.
Formula Participating employees can earn an increasing multiple of their monthly basic salary dependent upon achievement against the agreed targets.
Financial performance
In order to align with Walmart’s metrics, performance against planned operating income targets was selected as the performance measure.
For business performance below 90% of planned operating income, no incentives are earned and incentives are capped at 107% of planned operating income, unless the Remuneration Committee has approved a super maximum target for a specific year.
Individual performance
At the lower levels of the AIP an individual metric, based on employee performance, is included.
Bonus pay-outs At Executive level the bonus pay-outs per achievement level are:
*A super-maximum level may be agreed and approved by the Remuneration Committee.
Discretion of the Remuneration Committee
Outside of the AIP, the Remuneration Committee also has the option to provide discretionary awards to reward individual performance. The discretionary awards are capped at not more than 25% of target AIP. If awarded, these incentives are paid annually.
SHARE INCENTIVE PLAN (SIP)ANNUAL INCENTIVE PLAN (AIP)
Long Term IncentiveMassmart believes in rewarding employees for performance that is aligned to shareholders’ interests, in particular the sustained creation of shareholder value. In prior years, various share schemes were established to recognise and reward different levels of employees. In May 2013, the Massmart Share Incentive Plan that is more closely aligned to the Walmart approach, was approved and replaced all other share schemes.
No further share options are issued from either the Massmart Holdings Limited Employee Share Trust; the Massmart Black Scarce Skills Trust; or the Massmart Thuthukani Empowerment Trust. Those options which have not yet vested through the above-mentioned Trusts will still vest according to the relevant rules and plans.Short Term Incentive
Remuneration report continued
Our performance: Human capital
13.5 to 18*months’ salary
Maximum
4.5 to 6months’ salary
Threshold
9 to 12months’ salary
Target
90% 100% 107%
Business performance is a percentage of planned operating income

98 99Massmart Integrated Annual Report 2016
Non-Executive DirectorsOne-third of the non-Executive Directors are required to retire every year and Massmart Executive Directors have elected to also retire on this basis. As a result, all Directors retire by rotation at least every three years and are then eligible to offer themselves for re-election. In addition, shareholders must ratify the initial appointment of each Director at the first AGM following that Director’s appointment.
All Committee members complete detailed self-assessments covering the composition, duties, responsibilities, process and effectiveness of the relevant committees. The results of these assessments are collated by the Company Secretary and sent in summarised form to the Chairman for a formal written response. The summarised results, together with the Chairman’s written response, are included in the Board papers at the November Board meeting.
Non-Executive Director feesThese fees remunerate the non-Executive Directors for their time, responsibilities and commitment to Massmart.
Each independent non-Executive Director receives a fixed fee for their services based on their Board membership and membership of the Board Committees.
The Board has elected to pay a fixed fee only, without the payment of additional attendance fees. This decision was taken on the basis that many Directors provide expertise that extends beyond the boardroom. The Walmart-appointed non-Executive Directors do not receive fees from Massmart.
The remuneration of non-Executive Directors is reviewed annually by the Remuneration Committee and the Board, after a benchmarking exercise against market. Fees are required to be competitive but not necessarily in the top quartile of the market. Recommendations for increases are made to shareholders at the AGM for consideration and approval.
Non-Executive Directors do not qualify for participation in any share plan or incentive scheme.
Proposed fees 2016Following a market benchmarking of fees as mentioned above, a few changes have been proposed:
Role 2016 Fee (R) 2015 Fee (R) % Change
Chairman of the Board 1,270,000 1,200,000 5.8
Deputy Chairman of the Board 660,000 625,000 5.6
Independent non-Executive Directors 350,000 275,000 27.3
Audit and Risk Committee Chairmen 267,100 252,000 6.0
Other Board Committee Chairmen 252,000 252,000 –
Board Committee Members 128,000 128,000 –
The Remuneration Committee and its roleCompositionThe Remuneration Committee consists of three non-Executive Directors, two of whom are independent. Meetings are held four times per year and more often if deemed necessary. The CEO is a permanent invitee to all Committee meetings. Other nominated Executives attend meetings by invitation. Neither the CEO nor nominated invitees are present when matters relating to their own remuneration are discussed. The Group General Counsel acts as secretary for the Committee.
ResponsibilitiesIn accordance with the Remuneration Committee Charter, as approved by the Board, the responsibilities of the Committee include:• Reviewing the Group remuneration strategy and policies
to ensure alignment with the Group strategic, operating and financial objectives and remuneration best practice principles;
• Evaluating the remuneration packages of the Executive Directors and Group Executive Committee members to ensure base pay and benefits are market-competitive and fair, and STI’s and LTI’s are equitably related to relevant performance indicators;
• Approving performance-related STI and LTI targets;• Making recommendations to the Board on amendments
to STI and LTI schemes;• Reviewing and recommending independent non-
Executive Directors’ and Board Committee members’ fees and also the fees of any Director-related entities providing services to the Group;
• Reviewing Group remuneration practices and policies; and• Selecting independent consultants to advise the Board
where appropriate.
A full account of the role and responsibilities of the Remuneration Committee is described in the Remuneration Committee Charter and is available on request.
Executive pay mix
Anticipated contribution to total annual packagesThe Committee believes that over an extended period and subject to business performance, Executives’ total annual remuneration (TAR) should comprise approximately equal amounts from TGP, AIP and SIP. The amounts received annually under AIP will vary depending on business, and to some extent personal, performance, while those received under the SIP will also vary depending on business performance and the growth of the Massmart share price.
It is anticipated that about two thirds of Executives’ remuneration should be variable and conditional upon sustainably improving business performance.
Section C: Application of the remuneration policyIn this section we report on the application of Massmart’s remuneration policy during the year ended December 2015.
Basic Salary
The Committee remains alert to the concentrated and highly competitive nature of the South African retail market, as well as a shortage of retail-specific skills, and sets remuneration levels accordingly.
Following the detailed salary benchmarking conducted, a number of Executive salaries were adjusted to compensate changes in roles and additional responsibilities assumed during the past year, or to align them against the national market, or a combination of the two. In July 2015 increases awarded to Massmart’s Executive Committee and Divisional Directorates averaged 11.2%.
This average includes market-related adjustments for six of the Executive team members following the detailed salary and incentive benchmarking explained above. If the market adjustments for these six Executives are excluded from the metrics, the average annual increase percentage awarded to these Executives amounts to 6.6%. The average percentage increase to salaries across the Group was 6.0%.
Retirement Fund
The following table shows the percentage distribution of retirement fund membership for 2014 and 2015:
Fund Name
% of Employee Base 2015
% of Employee Base 2014
Massmart Pension Fund 16 15
Massmart Provident Fund 77 77
SACCAWU National Provident Fund 7 8
Medical Aid
The following table shows the percentage distribution of medical cover and medical aid fund membership for 2014 and 2015:
Fund Name
No of employees
in 2015
No of employees
in 2014
Ocsacare 3,967 3,635
Massmart Health Plan – Choice 3,410 3,091
Massmart Health Plan – Network 2,468 1,555
Massmart Health Plan – Essential 2,620 –
Africa other approved 272 45
Total 12,737 8,326
Closed schemes, existing members only:
Fund Name
No of employees
in 2015
No ofemployees
in 2014
Resolution Health 1,743 3,109
Compcare NetworX 1,475 2,315
Other 369 402
Total 3,587 5,826
TOTAL GUARANTEED PACKAGE (TGP)
Actual pay-outs and increases
Group CEO and CFO
Our performance: Human capital
Potential award mixThe following chart shows the potential mix of Total Annual Remuneration (TAR) for Executive Directors:
Maximum performance
Target performance
Threshold
28% 34% 38%
36% 29% 35%
49% 20% 31%
TGP AIP SIP
Remuneration report continued

100 101Massmart Integrated Annual Report 2016
Remuneration report continued
Executive Directors’ contracts and earnings The comments below provide further background and context to the figures disclosed in the tables which follow and the composition of remuneration outcomes in 2015 for the CEO and CFO are represented graphically alongside.
Guy Hayward Guy was awarded a 7.0% annual salary increase in July 2015.
In terms of Massmart’s AIP, Guy received an incentive payment of R5.3 million (equivalent to 11.8 months of salary) based solely on the Group’s actual operating income performance against the 2015 plan.
During the year to December 2015 Guy did not convert or sell any Massmart options or shares.
Through the Employee Share Trust, Guy holds 456,906 Massmart shares and options of which 19,912 shares are held by the Bluett-Hayward Trust, of which Guy is a discretionary beneficiary. The average length of time that he has held these is 4.26 years and the average strike price is R124.67 per share. Guy also owns 36,517 Massmart shares directly.
Through the SIP, Guy was awarded 27,559 performance share awards on 16 March 2015 and 14,198 restricted share grants on 15 September 2015.
Guy is contractually bound by a notice period of twelve months.
Johannes van Lierop Johannes was appointed as Chief Financial Officer on 12 March 2015 and did not receive an annual salary increase in July 2015.
In terms of Massmart’s AIP, Johannes received an incentive payment of R5.6 million (equivalent to 11.8 months of salary) based solely on the Group’s actual operating income performance against the 2015 plan.
During the year to December 2015 Johannes did not sell any Massmart shares.
Through the SIP, Johannes was awarded 71,495 performance share awards and 23,832 special restricted share grants on 16 March 2015 and 12,351 restricted share grants on 15 September 2015.
Johannes is contractually bound by a notice period of twelve months.
Non-Executive Directors’ contracts and paymentsAs approved by the shareholders at Massmart’s May 2015 AGM, the following fees were paid to non-Executive Directors in the financial year ending December 2015:
2016 Fee (R)
Chairman of the Board 1,200,000
Deputy Chairman 625,000
Independent non-Executive Directors 275,000
Committee Chairpersons 252,000
Committee Members 128,000
As disclosed on page 96, the AIP is linked to the approved annual operating income targets for both the Massmart Group and its Divisions. Pay-outs in relation to the variances to these targets are demonstrated here:
The SIP was established in September 2013 and is linked to approved ROI and Sales targets (refer to page 97 for more information). The first vesting of this new plan will therefore take place during 2016. Performance against target will result in the pay-out of performance shares equivalent to:• 35.9% for 2013• 108.2% for 2014• 100.1% for 2015
Vesting of Long Term Incentives
STI payments made to Executive Directors
Company performance measure
Below threshold
Threshold6 months
Target12 months
Above target18 months
Maximum>18 months
Operating income (100% weighting)
11.8 months
Our performance: Human capital
ANNUAL INCENTIVE PLAN (AIP)
SHARE INCENTIVE PLAN (SIP)
5,273
8,043
7,517
7,517
7,517Maximum potential
Actual pay-out
Minimum potential
5,582
8,515
6,684
6,684
6,684Maximum potential
Actual pay-out
Minimum potential
TGP AIP
The composition of remuneration outcomes in 2015:
R’000
R’000
CEO
CFO
Company performance measures
ROI (50% weighting) Sales (50% weighting)
TotalThreshold Target Maximum Threshold Target Maximum
2013 0% 35.9% 35.9%
2014 46.9% 61.3% 108.2%
2015 55.2% 44.9% 100.1%
Pay-out % (Sliding scale) 92% 100% 107% 92% 100% 107%

102 103Massmart Integrated Annual Report 2016
Remuneration report continued
Directors’ emoluments The following disbursements were made by Massmart Holdings Limited to Massmart’s Directors in the years ending December 2015 and December 2014 respectively:
Services as Directors
of Massmart
Holdings Limited
Salary and
allowances
Bonuses and
perfor-mance
relatedpayments1
Other benefits
Retirement and related
benefits Subtotal
Fringe benefit of
interest- free
loans used to finance
shares2
Gains on exercise of share options and on shares
purchased by Directors Total
December 2015
Executive Directors
Hayward, GRC – 5,175 5,273 965 543 11,956 834 – 12,790
Zwarenstein, I3 – 671 – – 63 734 – – 734
van Lierop JJM4 – 4,106 5,582 2,222 356 12,266 – – 12,266
– 9,952 10,855 3,187 962 24,956 834 – 25,790
Non-Executive Directors
Dlamini, KD 1,440 – – – – 1,440 – – 1,440
Seabrooke, CS 1,531 – – – – 1,531 – – 1,531
Broader, S5 – – – – – – – – –
Clarke, A6 – – – – – – – – –
Gwagwa, NN 543 – – – – 543 – – 543
Kgosana M7 185 – – – – 185 – – 185
Langeni, P 795 – – – – 795 – – 795
Suarez, JP – – – – – – – – –
4,494 – – – – 4,494 – – 4,494
Total 4,494 9,952 10,855 3,187 962 29,450 834 – 30,284
1 In order to match incentive awards with the performance to which they relate, bonuses above reflect the amounts accrued in respect of each year and not amounts paid in that year.
2 Held in terms of the rules of the Company’s share scheme.3 Resigned with effect from 12 March 2015.4 Appointed with effect from 12 March 2015.5 Resigned with effect from 9 November 2015.6 Appointed with effect from 16 July 2014.7 Appointed with effect from 1 September 2015.8 Resigned with effect from 31 December 2014. As a past Director GM Pattison earned a gain on the exercise of share options and on
shares purchased of R29.4 million, as well as a fringe benefit of R0.2 million in the current year. 9 Resigned with effect from 16 July 2014.10 Resigned with effect from 10 April 2014.
Services as Directors of
Massmart Holdings Limited
Salary and allowances
Bonuses and per-
formance related
payments1
Other benefits
Retirement and related
benefits Subtotal
Fringe benefit of
interest-free loans
used to finance shares2
Gains on exercise of share
options and on shares
purchased by Directors Total
December 2014
Executive Directors
Pattison, GM8 – 5,215 – 692 365 6,272 1,365 15,788 23,425
Hayward, GRC – 4,443 5,916 667 337 11,363 844 – 12,207
Zwarenstein, I3 – 2,603 2,827 103 162 5,695 – – 5,695
– 12,262 8,743 1,462 864 23,330 2,209 15,788 41,327
Non-Executive Directors
Dlamini, KD 892 – – – – 892 – – 892
Seabrooke, CS 1,491 – – – – 1,491 – – 1,491
Broader, S5 – – – – – – – – –
Clarke, A6 – – – – – – – – –
Gwagwa, NN 512 – – – – 512 – – 512
Langeni, P 758 – – – – 758 – – 758
Suarez, JP – – – – – – – – –
Cheesewright, D9 – – – – – – – – –
Davis, JA9 – – – – – – – – –
Lamberti, MJ10 359 – – – – 359 – – 359
4,012 – – – – 4,012 – – 4,012
Total 4,012 12,262 8,743 1,462 864 27,343 2,209 15,788 45,340
The Board is wholly responsible for the formulation, development and effective implementation of Group strategy. The Board has gained progressive insight into the definition of a ‘prescribed officer’ following the issuance of guidance from SAICA and, in turn, delegates operational strategy implementation and general Executive management of the business to its Executive Directors. As such, in terms of section 38 of the Companies Act 2008, those previously designated as prescribed officers are no longer deemed to be. For ease of reference, the 2014 cost relating to those previously designated as prescribed officers was R72.2 million.
Our performance: Human capital

104 105Massmart Integrated Annual Report 2016
Remuneration report continued
Grantdates
Subscriptionprice (R)
Marketprice
(R)
Number ofshares/
shareoptions
Gainon sale/exercise(R 000's)
Expirydate
Hayward, GRC
Employee Share Trust
Balance at December 2013 456,906
Shares sold – – – – – –
Balance at December 2014 456,906
Options exercised/ shares sold – – – – –
Balance at December 2015 456,906 –
Comprising: 24 May 2007 94 – 24,444 – 23 May 2017
1 April 2008 67 – 19,912 – 31 March 2018
26 May 2008 73 – 36,573 – 25 May 2018
27 May 2009 78 – 105,448 – 26 May 2019
1 September 2011 154 – 120,987 – 31 August 2021
16 May 2012 160 – 149,542 – 15 May 2022
Employee Share Plan
Balance at December 2013 27,798
Performance share awards 17 March 2014 – – 32,786 – 16 March 2017
Restricted share grants 15 September 2014 – – 11,506 – 14 September 2019
Balance at December 2014 72,090
Performance share awards 16 March 2015 – – 27,559 – 16 March 2018
Restricted share grants 15 September 2015 – – 14,198 – 15 September 2020
Balance at December 2015 113,847
Comprising: Performance share awards 16 September 2013 – – 20,848 – 15 September 2016
Restricted share grants 16 September 2013 – – 6,950 – 15 September 2018
Performance share awards 17 March 2014 – – 32,786 – 16 March 2017
Restricted share grants 15 September 2014 – – 11,506 – 14 September 2019
Performance share awards 16 March 2015 – – 27,559 – 16 March 2018
Restricted share grants 15 September 2015 – – 14,198 – 15 September 2020
van Lierop, JJM
Employee Share Trust
Balance at December 2014 –
Performance share awards 16 March 2015 – – 71,495 – 16 March 2018
Restricted share grants 16 March 2015 – – 23,832 – 16 March 2020
Restricted share grants 15 September 2015 – – 12,351 – 15 September 2020
Balance at December 2015 107,678
Comprising: Performance share awards 16 March 2015 – – 71,495 – 16 March 2018
Restricted share grants 16 March 2015 – – 23,832 – 16 March 2020
Restricted share grants 15 September 2015 – – 12,351 – 15 September 2020
Grantdates
Subscriptionprice (R)
Marketprice
(R)
Number ofshares/
shareoptions
Gainon sale/exercise(R 000's)
Expirydate
Pattison, GM
Employee Share Trust
Balance at December 2013 684,021
Options exercised/shares sold – – – (230,750) –
Balance at December 2014 453,271
Options forfeited Various 154 – (79,303) –
Options exercised 1 September 2011 154 162 (79,300) 618
Shares sold 23 May 2006 54 162 (183,750) 19,752
Shares sold 24 May 2007 94 162 (26,948) 1,816
Shares sold 26 May 2008 73 162 (41,768) 3,708
Shares sold 27 May 2009 78 162 (42,202) 3,547
Balance at December 2015 – 29,441
Employee Share Plan
Balance at December 2013 38,274
Share awards/ Share grants – – – – – –
Balance at December 2014 38,274
Performance share awards forfeited 16 September 2013 – – (28,705) – 15 September 2016
Restricted share grants forfeited 16 September 2013 – – (9,569) – 15 September 2018
Balance at December 2015 –
Zwarenstein, I
Employee Share Trust
Balance at December 2013 167,331
Options exercised – – – – –
Balance at December 2014 167,331 –
Options exercised – – – – – –
Balance at December 2015 167,331
Comprising: 26 May 2008 73 – 8,037 – 25 May 2018
27 May 2009 78 – 3,677 – 26 May 2019
1 September 2011 154 – 63,941 – 31 August 2021
16 May 2012 160 – 91,676 – 15 May 2022
Employee Share Plan
Balance at December 2013 17,012
Performance share awards 17 March 2014 – – 16,686 – 16 March 2017
Balance at December 2014 33,698
Performance share awards – – – – – –
Balance at December 2015 33,698
Comprising: Performance share awards 16 September 2013 – – 12,759 – 15 September 2016
Restricted share grants 16 September 2013 – – 4,253 – 15 September 2018
Performance awards 17 March 2014 – – 16,686 – 16 March 2017
The Directors’ interests in the Company's shares and options held at reporting date can be found in the Directors’ Report.
Our performance: Human capital
Details of Directors’ shares and share options per Director:

106 107Massmart Integrated Annual Report 2015
MASSMART DEFINES NATURAL CAPITAL AS OUR COMMITMENT TO COLLECTIVELY REDUCE OUR ENVIRONMENTAL FOOTPRINT AND TO ENABLE SUSTAINABLE SUPPLY AND CONSUMERISM.
“
”
Our performance: Natural capital
Natural capital
Minimising Massmart’s environmental footprint
Water conservation Water conservation remains a key focus for Massmart, particularly in light of the significant water security challenges currently impacting large parts of our country.
During the period, we continued to make progress in the area of water conservation through the introduction of rain water and condensate harvesting at our more water intensive standalone formats. At present, a total of 82 Builders and Makro stores have implemented water harvesting programmes, which resulted in estimated savings of 17 million litres of water.
In 2016 Massmart will complete a store level water risk review to highlight further water conservation opportunities and ensure that our stores are appropriately prepared in the event of shortages.
Energy efficiency Massmart continues to optimise operational energy efficiency through the establishment of format specific energy targets and the installation of a variety of energy saving technologies such as: LED sales floor lights; daylight harvesting; high performance refrigeration plants; and Building and Energy Management systems. In 2015, a further eight Builders Warehouse stores were equipped with daylight harvesting cells, while our Makro Crown Mines store underwent a comprehensive energy retrofit which included the installation of LED sales floor lights, a high performance CO
2 refrigeration plant and daylight harvesting. At the
end of 2015, 25 Builders Warehouse stores now make use of natural lighting while 14 of Makro’s 19 stores have transitioned to high-bay LED lights.
Overall Group energy intensity increased by 5% as compared with 2014. This increase can in large part be attributed to unusually high ambient temperatures leading to an increase in air conditioning related energy consumption. Notwithstanding this, at 215 kWh/m2, Massmart’s per square meter electricity consumption remains the lowest reported in the South African retail sector and we are currently tracking 15.8% below our 2020 Business as Usual (BAU) energy targets.
In line with our commitment to explore commercially viable renewable energy opportunities, we indicated in 2014 that we had prioritised the implementation of a proof of concept Solar Photo-Voltaic pilot project.
As a result, we have successfully identified three potential Solar Photo-Voltaic pilot opportunities; which include a plant proposed for Builders Warehouse, and two further installations for our Makro Woodmead and Makro Carnival Mall stores.
Collectively we forecast that these three plants will generate in excess of 2.4 million kilowatt hours of electricity a year. They are expected to come into operation during the second quarter of 2016.
Operational waste recycling To reduce the volume of waste we send to landfill, Massmart has prioritised the recycling of secondary packaging, paper, plastic and board at our stores and DC’s. During the period, the percentage of stores engaged in waste separation and recycling initiatives increased to 83%, a 9% improvement over 2014.
As previously reported, quantifying overall waste diversion rates remains a challenge due to difficulties associated with obtaining accurate waste collection and recycling data from waste service providers. As a result we have implemented an annual waste management review process across all of our facilities and have developed and distributed a waste reporting template to all waste providers. On the basis of the waste data provided by waste vendors we estimate that we diverted approximately 43% of our operational waste from landfill in 2015, we calculate that this amounted to approximately 20,000 tons of paper, board and plastic.
In addition to tracking waste recycling efforts across the Group, we have embarked on a store level waste training programme to improve store recycling and waste management procedures. A total of 91 store and regional managers received waste management and recycling training in 2015.
Beyond our current paper, plastic and board waste recycling interventions, the enhancement of food donation programmes aimed at reducing food product waste will be a key priority in 2016.
Our environmental initiatives are driven by an understanding that advocating more sustainable practices and product choices is fundamental to our commitment to enable sustainable supply and consumerism. We recognise that minimising our own environmental footprint builds credibility for advocacy with our suppliers and customers.
In 2015…
What we did well: Helped customers avoid approximately 50,000 tCO
2e of
emissions through the sale of energy efficient and alternative energy products.
Conserved an estimated 17 million litres of water through rainwater and condensate harvesting programmes at participating stores.
Identified three potential solar Photo-Voltaic pilots that will generate an estimated 2.4 million kWh of electricity a year.
Assisted our customers to recycle and responsibly dispose of 143 tons of post-consumer e-waste.
Above left:Evaporative coolers installed in Builders Warehouse Rivonia are 20-30% more efficient than conventional HVAC systems.
Above right:LED sales floor lights, daylight harvesting and high performance CO
2 refrigeration systems combine
to make new Makro stores 25% more energy efficient.

108 109Massmart Integrated Annual Report 2015Our performance: Natural capital
Post-consumer e-waste recyclingE-waste, which includes consumer items such as mobile phones, IT equipment, entertainment electronics, and household appliances, is considered to be one of the fastest growing waste streams worldwide. Although accurate statistics regarding the volume of e-waste produced and recycled in South Africa are not available, given its rapid growth, the South African government has declared e-waste a priority waste stream.
In 2008 Makro launched a post-consumer e-waste project, in partnership with Fujitsu-Siemens and electronic recyclers Desco. In 2013 Makro and Desco, together with, Samsung Electronics expanded the e-waste project to 19 Makro stores countrywide. In 2015 more than 143 tons of post-consumer e-waste was collected and recycled through the programme, bringing the total volume of e-waste collected since inception to 739 tons.
In 2015 the Department of Environmental Affairs called for the submission of an Industry Waste Management Plan (IWMP) aimed at achieving a reduction in the generation of e-waste in South Africa. In acknowledgement of Makro’s long running post-consumer e-waste take back programme, Massmart was asked to join the steering committee tasked with drafting the IWMP for e-waste. Based on initial discussions, we believe convenient e-waste drop off sites are likely to play an integral part of the proposed IWMP. We are currently assessing opportunities to replicate the project at selected Builders Warehouse and standalone Game stores.
Primary product packaging rationalisation We recognise that our customers are concerned with the progress we are making with regards to the design and introduction of more recyclable and resource efficient primary product packaging.
Although Massmart has focused attention on this area including development of a Group Private Label packaging scorecard; exposing Divisional buyers to packaging innovation opportunities through focused workshops; and the introduction of a Private Label Packaging Rationalisation Policy, our recent progress has been indifferent.
Our objective in 2016 is to re-emphasise this process to ensure that, as we expand our Private Label product offering, we continue to design resource efficient and recyclable packaging. With this in mind, we will review packaging of all Private Label products launched during the past 18 months. We will also engage closely with the Packaging Association of South Africa to better understand the packaging implications of the IWMP that has been requested by the Department of Environmental Affairs.
Enable sustainable supply and consumerism
Environmental supplier advocacy and product screeningWe are committed to working with willing suppliers to advocate the adoption of more sustainable manufacturing and sourcing practices.
Since 2013 we have profiled the sustainability performance of over 660 unique suppliers through our various environmental advocacy and screening programmes. Our advocacy programme includes the distribution of a bespoke environmental survey to the top 30 suppliers by value across all product categories. We also issue advocacy surveys and product screening reviews targeted at our Seafood and Timber product suppliers. Beyond supplier profiling and product screening reviews, we are committed to encouraging the adoption of sustainable supply chain practices and we have therefore incorporated environmental supplier site visits and workshops into the programme. In 2015, we expanded the survey process to include all Massmart Private Label suppliers and going forward, we have prioritised the establishment of a more formal Private Label supplier advocacy and engagement programme.
As noted in our 2014 update, Massmart has taken the decision to publicly recognise those suppliers who we have noted are industry leading when it comes to implementing sustainable practices in their respective industries. In line with this, Massmart successfully hosted its second Environmental Supplier Awards ceremony in 2015, at which Belgotex Floorcoverings was recognised as the Massmart Environmental Supplier of the Year for, among other things, the installation of a 1MW solar energy plant at their KwaZulu-Natal facility.
Timber and seafood advocacyWith respect to timber and seafood product screening, a key challenge has been the paucity of sustainability data available for many of the species we source. To address this, Massmart completed a comprehensive in-house sustainability review of the timber and seafood products which do not currently have sustainability ratings. A key outcome was the introduction of a Group Sustainable Timber sourcing policy and the roll-out of environmental training to timber buyers across the Group. We are aware that the efficacy of our various product screening programmes relies heavily on supply chain transparency and the accuracy of the information provided to us by our suppliers. To ensure that we have complete visibility of the origins and species that we procure, we will request chain of custody documentation from our suppliers for select timber and seafood products.
Eco-friendly merchandiseMassmart is uniquely positioned to offer customers a wide range of products that assist them to not only reduce their environmental footprint but also to save money. Over the last three years our portfolio of environmentally sensitive product options has grown considerably. Collectively, we offer well in excess of 1,250 products ranging from low Volatile Organic Compound paints to solar geysers and energy efficient lighting options.
We have previously noted that the sales of green products, particularly energy efficient lamps and appliances, are strongly correlated to national energy security and specifically load shedding. In 2015 total sales of green products for the year exceeding R300 million across our Makro and Builders Warehouse Divisions. We estimate that the sale of energy efficient light bulbs will result in the avoidance of approximately 50,000 tCO
2e in carbon emissions per annum. Building
on our learnings in this area, our priority in 2016 is to place more emphasis on identifying and marketing water saving products that confer a material benefit to end users.
Scope 1 and 2 emissions figures are calculated externally by GCX Africa consultants. Scope 1 emissions relate to direct emissions resulting from company-owned vehicles, generators and refrigerant gas emissions. Scope 2 figures are derived from Divisional electricity consumption figures. Energy consumption data is annualised and normalised (outlying data excluded). Consequently the margin of error is considered to be between 10% - 15%. Eskom Scope 2 emissions factor has been updated from 1.03 to 1.01. Total Group sales are used to calculate Scope 1 and 2 emissions’ intensity per Rand million (Rm). Water usage has been calculated from the cost of water consumed (excluding. accruals) divided by average commercial water tariffs (regional). Square meterage (m²) is reported as a function of gross lettable area (GLA).
More information on our natural capital can be found on p74, p78, p82 and p86For a more information regarding our carbon footprint, please visit the
Carbon Disclosure Project website where a comprehensive summary is available.
JSE Socially Responsible Investment Index
Massmart qualified for inclusion in the JSE Socially Responsible Investment Index (Equivalent of FTSE4good). We are proud to have been members of the Index since its inception. This year we achieved ‘Best Practise’ status in the area of environmental performance and climate change, within the medium impact category. Massmart met 64 of the 65 indicators that measure environmental governance and sustainability practices.
Environmental advocacy supply chain survey findings
35% of environmental survey respondents are actively assessing their supply chain to better understand their products environmental impacts.
55%of suppliers surveyed last year indicated that they had established systems and processes to optimise logistics and reduce total transport related energy consumption.
50% of responding suppliers have invested in energy and water
64%of the suppliers we surveyed in 2015 have taken steps to minimise the volume of waste they produce.
Increase in energy intensity can be attributed to higher ambient temperatures resulting in greater air-conditioning related energy demands.
Climate change and environmental performance indicators
0.36Estimated water consumption (KL/m2)
0.59 in 2014, 1.7 in 2013, 2.6 in 2012, 2.6 in 2011
215.27Store purchased energy consumption (kWh/m2)
203.53 in 2014, 209 in 2013, 184 in 2012, 178 in 2011
0.60Scope 1 emissions intensity (CO
2/Rm)
0.70 in 2014, 0.6 in 2013, 0.4 in 2012, 0.5 in 2011
0.02Scope 1 emissions intensity (CO
2/GLA)
0.03 in 2014, 0.03 in 2013, 0.02 in 2012, 0.02 in 2011
4.83Scope 2 emissions intensity (CO
2/Rm)
4.77 in 2014, 5.3 in 2013, 5.0 in 2012, 5.3 in 2011
0.22Scope 2 emissions intensity (CO
2/GLA)
0.21 in 2014, 0.21 in 2013, 0.18 in 2012, 0.18 in 2011

110 111Massmart Integrated Annual Report 2015Our performance: Social and Relationship capital
Social and Relationship capital
We aim to create transparent trust-based relationships with our stakeholders, recognising that by learning from their insights we are able to make thoughtful choices for a better future for our planet and the people whose lives we touch. Our approach is, as far as possible, to practise an open-door policy with all stakeholders. This is supplemented by a pro-active programme of engagement that includes stakeholder workshops, surveys and one-on-one issue specific meetings.
Engaging our stakeholdersOur stakeholder engagement covers a range of topics enabling customers, suppliers, civil society and employees to provide input and feedback in areas of mutual interest including: • Customer satisfaction: covering price competitiveness, product quality &
safety, product availability, online shopping and Consumer Protection Act compliance. We also placed significant emphasis on measuring customer trust in 2015, specifically the extent to which customers trust our trading brands to act ethically;
• Supplier partnering: dealing with supply chain ethics, brand custodianship, logistics efficiency and operational practices. An additional area of discussion with suppliers in 2015 related to exploring opportunities to co-ordinate our socio-economic development initiatives for better social impact;
• Employee engagement: career development, equal opportunities, status of temporary employees and ethical practise in the workplace;
• Environmental sustainability: covering waste management in the supply chain, energy efficiency, sustainable seafood and timber sourcing. This year we also, in response to consumer feedback, focussed more attention on improving our understanding of their perspective relating to animal welfare in the retail supply chain;
• Socio-economic development: involving our corporate social investment priorities, our BBBEE progress and our approach to small enterprise supplier development; and
• Citizens bribery survey: specifically the launch, in partnership with Ethics Institute of South Africa, of the South African Citizens Bribery Survey which aimed to gain a clearer picture of the extent of bribery in South Africa as experienced by ordinary citizens.
MASSMART DEFINES SOCIAL CAPITAL AS OUR COMMITMENT TO CHAMPION SOCIAL EQUALITY INITIATIVES IN OUR BUSINESS AND OUR SUPPLY CHAIN. RELATIONSHIP CAPITAL IS DEFINED AS THE VALUE ADDED TO OUR BUSINESS THROUGH OUR RELATIONSHIP WITH STAKEHOLDERS.
“
”At the heart of our social sustainability approach is a desire to support social equality initiatives. We believe creating opportunities for our employees, and emerging suppliers is fundamental to realising this significant objective. We aim to create transparent trust-based relationships with our stakeholders through ongoing engagement to understand their views, and inform our corporate accountability approach.
In 2015…
What we did well:Our school mobile kitchen programme enabled the hygienic preparation of 40 million meals supplied through the National School Nutrition Programme.
Supported 3,805 young learners through the Makro and Hope Worldwide Early Childhood Development partnership.
Invested in developing the capabilities of 28 local small business suppliers.
Conducted 14,000 face-to-face interviews with customers.
Right:Reapso is 100% Black woman-owned business that manufactures chefs’ jackets for Makro under the Aro, Bakers and Chef Private Label brands. The SDP funding has supported them in acquiring upgraded machinery and fulfilling Massmart’s Responsible Sourcing and ISO compliance and certification requirements.
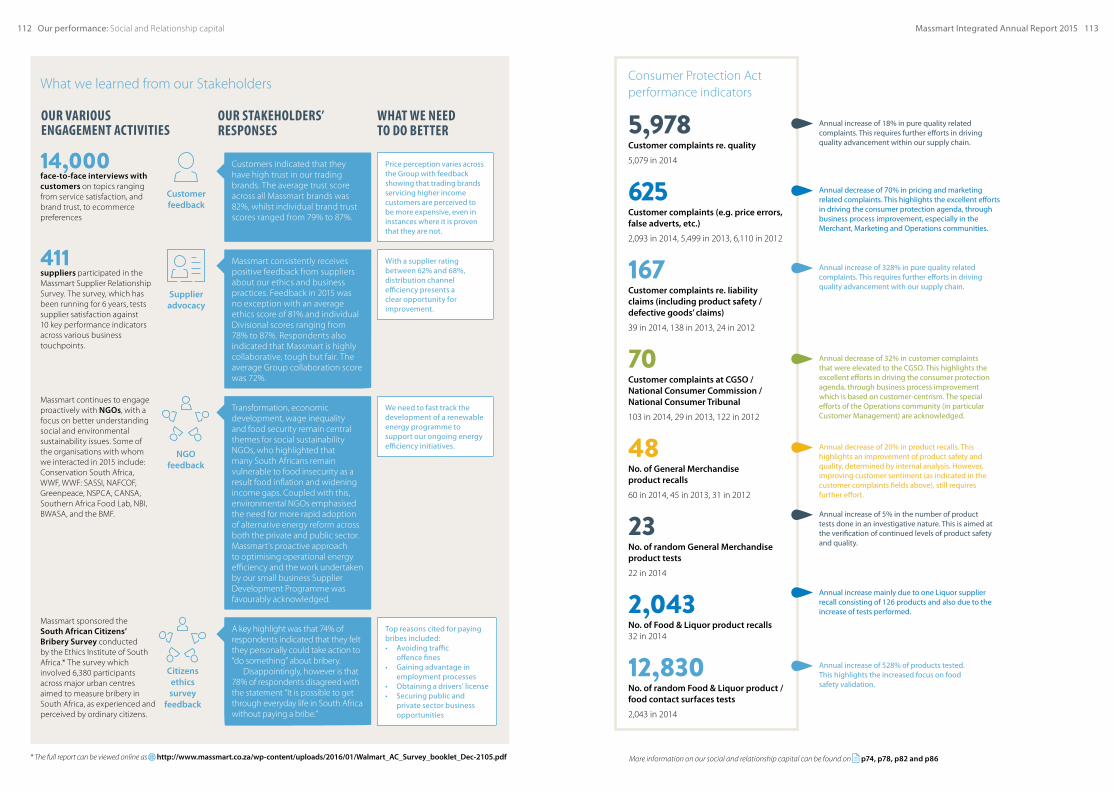
112 113Massmart Integrated Annual Report 2015Our performance: Social and Relationship capital
Annual increase of 18% in pure quality related complaints. This requires further efforts in driving quality advancement within our supply chain.
Annual decrease of 70% in pricing and marketing related complaints. This highlights the excellent efforts in driving the consumer protection agenda, through business process improvement, especially in the Merchant, Marketing and Operations communities.
Consumer Protection Act performance indicators
5,978Customer complaints re. quality
5,079 in 2014
625Customer complaints (e.g. price errors, false adverts, etc.)
2,093 in 2014, 5,499 in 2013, 6,110 in 2012
167Customer complaints re. liability claims (including product safety / defective goods’ claims)
39 in 2014, 138 in 2013, 24 in 2012
70Customer complaints at CGSO / National Consumer Commission / National Consumer Tribunal
103 in 2014, 29 in 2013, 122 in 2012
48No. of General Merchandise product recalls
60 in 2014, 45 in 2013, 31 in 2012
23No. of random General Merchandise product tests
22 in 2014
2,043No. of Food & Liquor product recalls 32 in 2014
12,830No. of random Food & Liquor product / food contact surfaces tests
2,043 in 2014
Annual increase of 328% in pure quality related complaints. This requires further efforts in driving quality advancement with our supply chain.
Annual decrease of 32% in customer complaints that were elevated to the CGSO. This highlights the excellent efforts in driving the consumer protection agenda, through business process improvement which is based on customer-centrism. The special efforts of the Operations community (in particular Customer Management) are acknowledged.
Annual decrease of 20% in product recalls. This highlights an improvement of product safety and quality, determined by internal analysis. However, improving customer sentiment (as indicated in the customer complaints fields above), still requires further effort.
Annual increase of 5% in the number of product tests done in an investigative nature. This is aimed at the verification of continued levels of product safety and quality.
Annual increase mainly due to one Liquor supplier recall consisting of 126 products and also due to the increase of tests performed.
Annual increase of 528% of products tested. This highlights the increased focus on food safety validation.
What we learned from our Stakeholders
* The full report can be viewed online as http://www.massmart.co.za/wp-content/uploads/2016/01/Walmart_AC_Survey_booklet_Dec-2105.pdf
Massmart sponsored the South African Citizens’ Bribery Survey conducted by the Ethics Institute of South Africa.* The survey which involved 6,380 participants across major urban centres aimed to measure bribery in South Africa, as experienced and perceived by ordinary citizens.
Top reasons cited for paying bribes included:• Avoiding traffic
offence fines• Gaining advantage in
employment processes• Obtaining a drivers’ license• Securing public and
private sector business opportunities
Citizens ethics survey
feedback
A key highlight was that 74% of respondents indicated that they felt they personally could take action to “do something” about bribery.
Disappointingly, however is that 78% of respondents disagreed with the statement “It is possible to get through everyday life in South Africa without paying a bribe.”
NGO feedback
Massmart continues to engage proactively with NGOs, with a focus on better understanding social and environmental sustainability issues. Some of the organisations with whom we interacted in 2015 include: Conservation South Africa, WWF, WWF: SASSI, NAFCOF, Greenpeace, NSPCA, CANSA, Southern Africa Food Lab, NBI, BWASA, and the BMF.
We need to fast track the development of a renewable energy programme to support our ongoing energy efficiency initiatives.
Transformation, economic development, wage inequality and food security remain central themes for social sustainability NGOs, who highlighted that many South Africans remain vulnerable to food insecurity as a result food inflation and widening income gaps. Coupled with this, environmental NGOs emphasised the need for more rapid adoption of alternative energy reform across both the private and public sector. Massmart’s proactive approach to optimising operational energy efficiency and the work undertaken by our small business Supplier Development Programme was favourably acknowledged.
411suppliers participated in the Massmart Supplier Relationship Survey. The survey, which has been running for 6 years, tests supplier satisfaction against 10 key performance indicators across various business touchpoints.
Massmart consistently receives positive feedback from suppliers about our ethics and business practices. Feedback in 2015 was no exception with an average ethics score of 81% and individual Divisional scores ranging from 78% to 87%. Respondents also indicated that Massmart is highly collaborative, tough but fair. The average Group collaboration score was 72%.
With a supplier rating between 62% and 68%, distribution channel efficiency presents a clear opportunity for improvement.
Supplier advocacy
OUR VARIOUS ENGAGEMENT ACTIVITIES
WHAT WE NEED TO DO BETTER
OUR STAKEHOLDERS’ RESPONSES
Customer feedback
14,000 face-to-face interviews with customers on topics ranging from service satisfaction, and brand trust, to ecommerce preferences
Customers indicated that they have high trust in our trading brands. The average trust score across all Massmart brands was 82%, whilst individual brand trust scores ranged from 79% to 87%.
Price perception varies across the Group with feedback showing that trading brands servicing higher income customers are perceived to be more expensive, even in instances where it is proven that they are not.
More information on our social and relationship capital can be found on p74, p78, p82 and p86
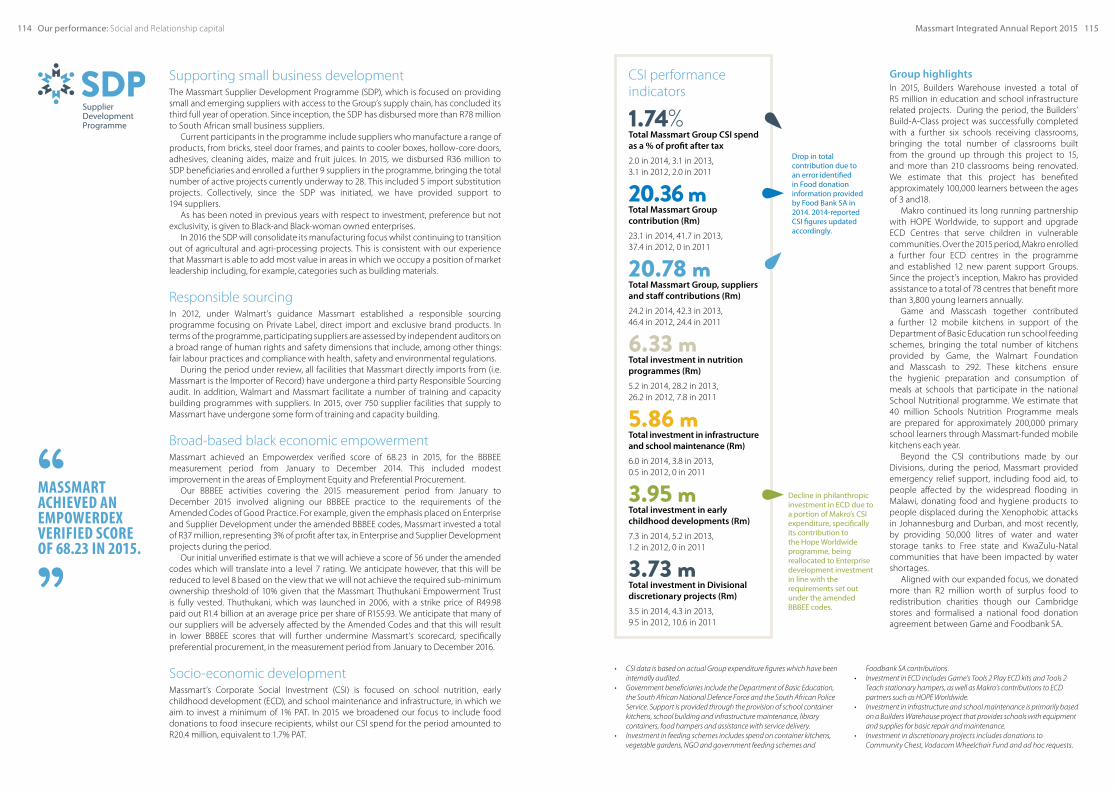
114 115Massmart Integrated Annual Report 2015
Supporting small business developmentThe Massmart Supplier Development Programme (SDP), which is focused on providing small and emerging suppliers with access to the Group’s supply chain, has concluded its third full year of operation. Since inception, the SDP has disbursed more than R78 million to South African small business suppliers.
Current participants in the programme include suppliers who manufacture a range of products, from bricks, steel door frames, and paints to cooler boxes, hollow-core doors, adhesives, cleaning aides, maize and fruit juices. In 2015, we disbursed R36 million to SDP beneficiaries and enrolled a further 9 suppliers in the programme, bringing the total number of active projects currently underway to 28. This included 5 import substitution projects. Collectively, since the SDP was initiated, we have provided support to 194 suppliers.
As has been noted in previous years with respect to investment, preference but not exclusivity, is given to Black-and Black-woman owned enterprises.
In 2016 the SDP will consolidate its manufacturing focus whilst continuing to transition out of agricultural and agri-processing projects. This is consistent with our experience that Massmart is able to add most value in areas in which we occupy a position of market leadership including, for example, categories such as building materials.
Responsible sourcingIn 2012, under Walmart’s guidance Massmart established a responsible sourcing programme focusing on Private Label, direct import and exclusive brand products. In terms of the programme, participating suppliers are assessed by independent auditors on a broad range of human rights and safety dimensions that include, among other things: fair labour practices and compliance with health, safety and environmental regulations.
During the period under review, all facilities that Massmart directly imports from (i.e. Massmart is the Importer of Record) have undergone a third party Responsible Sourcing audit. In addition, Walmart and Massmart facilitate a number of training and capacity building programmes with suppliers. In 2015, over 750 supplier facilities that supply to Massmart have undergone some form of training and capacity building.
Broad-based black economic empowermentMassmart achieved an Empowerdex verified score of 68.23 in 2015, for the BBBEE measurement period from January to December 2014. This included modest improvement in the areas of Employment Equity and Preferential Procurement.
Our BBBEE activities covering the 2015 measurement period from January to December 2015 involved aligning our BBBEE practice to the requirements of the Amended Codes of Good Practice. For example, given the emphasis placed on Enterprise and Supplier Development under the amended BBBEE codes, Massmart invested a total of R37 million, representing 3% of profit after tax, in Enterprise and Supplier Development projects during the period.
Our initial unverified estimate is that we will achieve a score of 56 under the amended codes which will translate into a level 7 rating. We anticipate however, that this will be reduced to level 8 based on the view that we will not achieve the required sub-minimum ownership threshold of 10% given that the Massmart Thuthukani Empowerment Trust is fully vested. Thuthukani, which was launched in 2006, with a strike price of R49.98 paid out R1.4 billion at an average price per share of R155.93. We anticipate that many of our suppliers will be adversely affected by the Amended Codes and that this will result in lower BBBEE scores that will further undermine Massmart’s scorecard, specifically preferential procurement, in the measurement period from January to December 2016.
Socio-economic development Massmart’s Corporate Social Investment (CSI) is focused on school nutrition, early childhood development (ECD), and school maintenance and infrastructure, in which we aim to invest a minimum of 1% PAT. In 2015 we broadened our focus to include food donations to food insecure recipients, whilst our CSI spend for the period amounted to R20.4 million, equivalent to 1.7% PAT.
MASSMART ACHIEVED AN EMPOWERDEX VERIFIED SCORE OF 68.23 IN 2015.
“
”
Group highlights In 2015, Builders Warehouse invested a total of R5 million in education and school infrastructure related projects. During the period, the Builders’ Build-A-Class project was successfully completed with a further six schools receiving classrooms, bringing the total number of classrooms built from the ground up through this project to 15, and more than 210 classrooms being renovated. We estimate that this project has benefited approximately 100,000 learners between the ages of 3 and18.
Makro continued its long running partnership with HOPE Worldwide, to support and upgrade ECD Centres that serve children in vulnerable communities. Over the 2015 period, Makro enrolled a further four ECD centres in the programme and established 12 new parent support Groups. Since the project’s inception, Makro has provided assistance to a total of 78 centres that benefit more than 3,800 young learners annually.
Game and Masscash together contributed a further 12 mobile kitchens in support of the Department of Basic Education run school feeding schemes, bringing the total number of kitchens provided by Game, the Walmart Foundation and Masscash to 292. These kitchens ensure the hygienic preparation and consumption of meals at schools that participate in the national School Nutritional programme. We estimate that 40 million Schools Nutrition Programme meals are prepared for approximately 200,000 primary school learners through Massmart-funded mobile kitchens each year.
Beyond the CSI contributions made by our Divisions, during the period, Massmart provided emergency relief support, including food aid, to people affected by the widespread flooding in Malawi, donating food and hygiene products to people displaced during the Xenophobic attacks in Johannesburg and Durban, and most recently, by providing 50,000 litres of water and water storage tanks to Free state and KwaZulu-Natal communities that have been impacted by water shortages.
Aligned with our expanded focus, we donated more than R2 million worth of surplus food to redistribution charities though our Cambridge stores and formalised a national food donation agreement between Game and Foodbank SA.
• CSI data is based on actual Group expenditure figures which have been internally audited.
• Government beneficiaries include the Department of Basic Education, the South African National Defence Force and the South African Police Service. Support is provided through the provision of school container kitchens, school building and infrastructure maintenance, library containers, food hampers and assistance with service delivery.
• Investment in feeding schemes includes spend on container kitchens, vegetable gardens, NGO and government feeding schemes and
Foodbank SA contributions.• Investment in ECD includes Game’s Tools 2 Play ECD kits and Tools 2
Teach stationary hampers, as well as Makro’s contributions to ECD partners such as HOPE Worldwide.
• Investment in infrastructure and school maintenance is primarily based on a Builders Warehouse project that provides schools with equipment and supplies for basic repair and maintenance.
• Investment in discretionary projects includes donations to Community Chest, Vodacom Wheelchair Fund and ad hoc requests.
Decline in philanthropic investment in ECD due to a portion of Makro’s CSI expenditure, specifically its contribution to the Hope Worldwide programme, being reallocated to Enterprise development investment in line with the requirements set out under the amended BBBEE codes.
Drop in total contribution due to an error identified in Food donation information provided by Food Bank SA in 2014. 2014-reported CSI figures updated accordingly.
CSI performance indicators
1.74%Total Massmart Group CSI spend as a % of profit after tax
2.0 in 2014, 3.1 in 2013, 3.1 in 2012, 2.0 in 2011
20.36 mTotal Massmart Group contribution (Rm)
23.1 in 2014, 41.7 in 2013, 37.4 in 2012, 0 in 2011
20.78 mTotal Massmart Group, suppliers and staff contributions (Rm)
24.2 in 2014, 42.3 in 2013, 46.4 in 2012, 24.4 in 2011
6.33 mTotal investment in nutrition programmes (Rm)
5.2 in 2014, 28.2 in 2013, 26.2 in 2012, 7.8 in 2011
5.86 mTotal investment in infrastructure and school maintenance (Rm)
6.0 in 2014, 3.8 in 2013, 0.5 in 2012, 0 in 2011
3.95 mTotal investment in early childhood developments (Rm)
7.3 in 2014, 5.2 in 2013, 1.2 in 2012, 0 in 2011
3.73 mTotal investment in Divisional discretionary projects (Rm)
3.5 in 2014, 4.3 in 2013, 9.5 in 2012, 10.6 in 2011
Our performance: Social and Relationship capital

116 117Massmart Integrated Annual Report 2015Our performance: Social and Relationship capital
BBBEE performance indicators
6.32Ownership
5.7 in 2014, 6.0 in 2013, 7.6 in 2012, 14.8 in 2011
4.06Management control
5.1 in 2014, 4.5 in 2013, 5.2 in 2012, 5.2 in 2011
10.76Employment equity
10.5 in 2014, 10.2 in 2013,12.6 in 2012, 12.3 in 2011 12.71 comparative
11.36Skills development
12.5 in 2014, 11.0 in 2013,12.2 in 2012, 10.6 in 2011 12.12 comparative
15.77Preferential procurement
15.0 in 2014, 14.8 in 2013,15.0 in 2012, 12.9 in 2011 17.53 comparative
15.0Enterprise development
15.0 in 2014, 15.0 in 2013, 15.0 in 2012, 15.0 in 2011 15.0 comparative
5.0Socio-economic development
5.0 in 2014, 5.0 in 2013, 5.0 in 2012, 5.0 in 2011 5.0 comparative
68.27BBBEE score
68.8 in 2014, 66.3 in 2013,72.8 in 2012, 75.9 in 2011 77.2 comparative
Massmart’s BBBEE figures are calculated externally by Empowerdex Economic Empowerment Rating Agency. These figures are based on actual staff numbers (not estimates). BBBEE scores are calculated retrospectively, therefore the data reported is based on the scorecard compiled in February 2015 for the period January – December 2014.
Social and Ethics Committee report for the year ended December 2015
The Massmart Social and Ethics Committee comprises the Massmart CEO and two non-Executive Directors. The Committee is chaired by an independent non-Executive Director. An independent external advisor, the Chief Ethics and Compliance Officer, the Group Corporate Affairs Executive, the Group General Counsel and the Group Human Capital Executive attended meetings by invitation.
The Committee is governed by a charter and monitors Group performance in terms of defined Social and Ethics performance indicators that have been formulated with reference to Regulation 43(5) of the Companies Act.
These indicators, which include but are not limited to, OECD anti-corruption guidelines, United Nations Global Compact principles, the Employment Equity Act, Johannesburg Stock Exchange Socially Responsible Index criteria and Broad-based Black Economic Empowerment elements, are reviewed by the Committee, on a rotational or core agenda basis.
The Committee met twice during the year ended December 2015, at which meetings performance in the following areas were reviewed, in response to the requirements of the Companies Act:• JSE Socially Responsible Investment Index;• Anti-corruption Compliance;• Consumer & Product Safety;• Human Capital Management;• Regulatory and Compliance Matters;• Stakeholder Relations;• Broad-Based Black Economic Empowerment (BBBEE) and Socio-
Economic Development; and• Environmental Impact.
These meetings were supplemented by regular management briefings to the Committee Chairman regarding key topics including; Massmart Employee Engagement Survey Results, Equal Work for Equal Pay, Temporary Employment Services, Response to Updated BBBEE Codes, Economic Freedom Fighters (EFF) Memorandum to Johannesburg Stock Exchange Limited, Fees Must Fall, Responsible Sourcing, Supply Chain Advocacy, Response to African Drought Conditions, Energy Efficiency and Renewable Energy Opportunities.
The Committee confirms that no material issues were identified by the Social and Ethics Committee during the period.
Phumzile LangeniChairman of the Social and Ethics Committee1 April 2016
We predict a drop in BBBEE level as result of the introduction of the Amended Codes of Good Practice.
Intellectual capital
In a highly competitive retail market, it is imperative that we create and improve products and services which appeal to our customers.
In 2015…
What we did well:Makro online sales are growing rapidly, sales in the fourth quarter were double for the same period in 2014.
The Private Label space in our Food business is very exciting, we recently launched Marketside into Fresh, Bakery and Butchery and the Equate brand into Health and Beauty.
Massbuild’s first two Price-Lock campaigns saved customers R7 million in discounted pricing over the duration of each campaign. Sales lifted an average of 35% per campaign, showing customer satisfaction with this approach.
Makro’s R100 promotions were very well received, and enjoyed 19.3% growth, saving our customers over R100 million.
The improvements we made:Makro Pick up lockers have been extended to sites in the Cape and KwaZulu-Natal. Makro Commercial functionality (B2B) is showing a great response after it went live in 2015.
Massbuild is initiating a SAP online project in Builders Warehouse to improve their offering to trade customers.
The challenges we’re facing:Online shopping in the markets we serve has been relatively slow, however we remain committed to providing an online offering and are developing the supporting systems to support omni-channel as it ramps up.

118 119Massmart Integrated Annual Report 2015
eCommerce / onlineIn order to remain relevant to a rapidly evolving and digitally connected Customer 2.0, Massmart must understand and stay in touch with the technology innovations impacting retail formats, and the increasingly complex omni-channel paths to purchase. We recognise that smartphone penetration and declining costs of bandwidth are creating a digitally-connected customer that will be ubiquitous in every market segment we serve. Put simply, the internet and mobile phone have created new dimensions in retail that enable us to raise the bar on convenience, service, choice and communication.
To take advantage of the opportunity to win, serve and retain customers in new ways, we must become literate in the new dimensions of retail, acquire new competencies and adapt existing assets, in order to retain and advance our leadership in the categories we trade, and market segments we serve. To this end we have spent time in various Walmart markets around the world to understand the context, trends, best practices and competency gaps impacting retail operations like ours, in order to inform our strategic choices. We have identified the need to evolve our formats to synthesise the physical and digital elements of retail, in ways that create compelling new value propositions for customers, and to align with their expectations of a digitally-augmented shopping experience; and new standards for convenience, choice and service.
Whilst the strategic choices and directions are clear, online shopping adoption in the markets we serve has been relatively slow. Consequently there is no urgent need to drive an online shopping agenda. We therefore have the time to develop important foundation competencies and implement new systems in a phase of omni-channel readiness. In support of this, all of our operating Divisions have brought strong focus to the acquisition of these competencies, and the development of supporting systems required to prepare their operations for omni-channel.Highlights in the 2015 financial year included:• Total online sales of R183 million;• Visits to DionWired site are up 13% and the average basket size is up 12%;• Makro online sales are growing rapidly. Sales in the fourth quarter were double those for
the same period in 2014. Their Pick-up lockers have been extended to include sites in the Cape and KwaZulu-Natal. Commercial functionality (B2B) is showing a great response after it went live during November 2015;
• Masscash are trialling a store-based online ordering capability; and• Massbuild are initiating a SAP online project in Builders Warehouse to improve their
offering to trade customers.
MASSMART DEFINES INTELLECTUAL CAPITAL AS HOW WE PASS ON BENEFITS TO OUR CUSTOMERS.
“
”
Our performance: Intellectual capital
Intellectual capital continued
Private LabelShared Private Label has always been an important focus for our business, as can been seen from the growth numbers across our Camp Master and Garden Master brands, as well as small exercise equipment under the Trojan brand. We strive for brand excellence whether through product innovation, world class social media or website platforms off which our customers can not merely view product range, but also engage directly with us. With our Campmaster and Trojan health repair centres we are unrivalled in the space of post-purchase customer care.
The Private Label space in our Food business is very exciting right now with the recent launch of Marketside into Fresh, Bakery and Butchery and the Equate brand into Health and Beauty.
Shared Private Label has a dual role: it excites and delights our customers with an outstanding brand encounter; and it allows our business to leverage our strength in terms of joint buying, expansion of brand footprint and ultimately being able to bring our customer more-for-less. We are continually searching for new products, brands and initiatives that both fulfil our customers’ needs and give Massmart Private Label a sustainable advantage.
Camp Master raised a total of R250,000 for the Rhino Action Group Effort (RAGE) through the sale of vehicle mirror socks at selected Massmart stores. Camp Master matched the contributions from Game, Makro and Builders’ customers to reach a grand total of R250,000, to aid RAGE’s anti-poaching initiatives and help create awareness about the need to combat rhino poaching.
EDLPThe “Price-Lock” campaign was initiated in Massbuild 12 months ago following insights from the UK market. The concept is to choose about 50 products, negotiate with suppliers to hold their cost prices for at least six months, and then in turn hold the reduced selling price for the full six months. Customers were asked about promotional campaigns which lasted longer than the traditional one to three weeks and feedback was overwhelmingly in favour of an extended period of promotional activity. Customers felt that the extended campaigns gave them more time to prepare, and also enabled them to budget for a project that they might be busy with for a period of months.
The first two campaigns saved customers R7 million in discounted pricing over the duration of each campaign. Sales lifted by an average of 35% per campaign, which pointed to the customer satisfaction with the long-term campaign. The Price-Lock campaign also enabled Massbuild to strengthen their EDLP philosophy of being best-priced on a basket of goods.
Makro R100 promotionsThe 2015 R100 promotion ran during July and August. There were 313 R100 deals across a number of categories. Food deals drove by far the most baskets and also units per basket. 11% of sales were from new launches, with the majority coming from General Merchandise, which accelerated growth in the category. The R100 deals accounted for 27% of all baskets in Makro over the period, up from 15.5% during 2014.• 1.65 million baskets contained a R100 deal during the
2015 promo• 19.3% R100 deal sales growth recorded• Saving to our customers of over R100 million
Highlights
R183 millionTotal Group online sales
13%Increase in visits to the DionWired site
12%Increase in average basket size on the DionWired site
65%Increase in online sales for Makro
11 millionNumber of unique visits to Makro online
14Makro Pick-up lockers as at December 2015

120 121Massmart Integrated Annual Report 2015Transparency and Accountability
Corporate Governance 122
Our assessment of the principles of King III 122
Our Board 123
Our Board Committees 126
Board and Committee attendance 127
Massmart believes that the first steps towards good corporate
governance must include embracing the requirements of
the relevant governance and regulatory frameworks, as well
as corporate best practice.
03Transparency and accountability
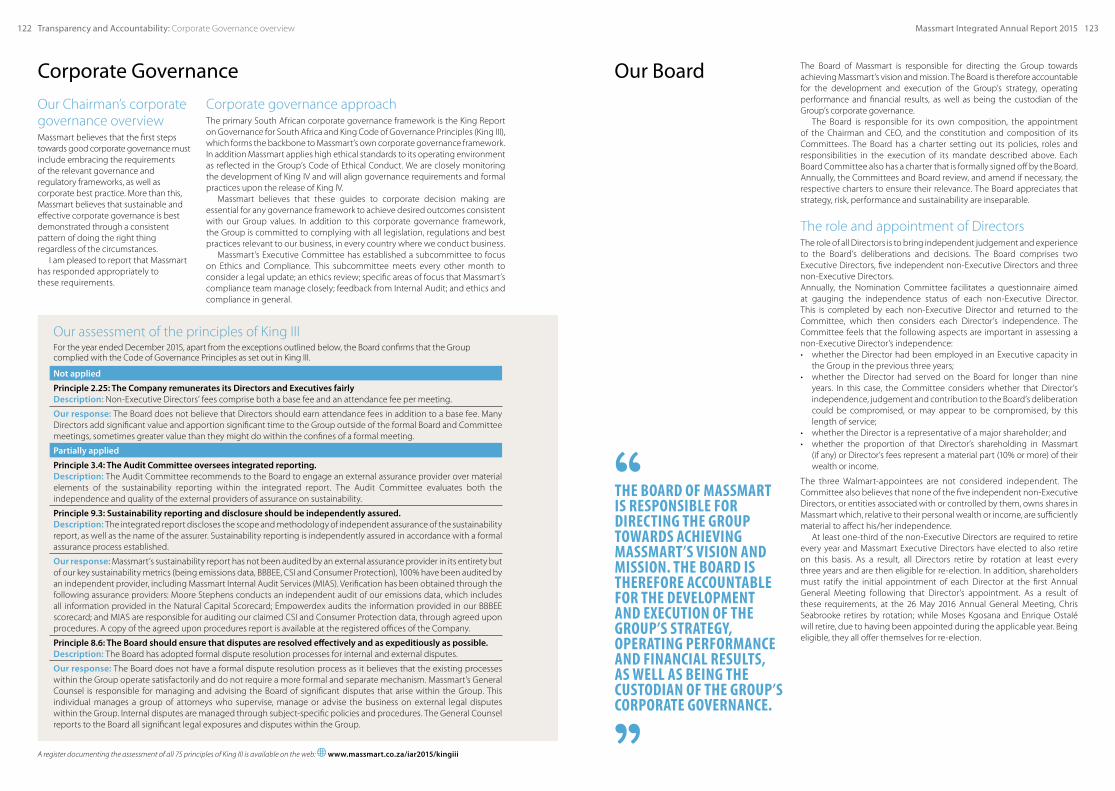
122 123Massmart Integrated Annual Report 2015Transparency and Accountability: Corporate Governance overview
Our assessment of the principles of King IIIFor the year ended December 2015, apart from the exceptions outlined below, the Board confirms that the Group complied with the Code of Governance Principles as set out in King III.
Not applied
Principle 2.25: The Company remunerates its Directors and Executives fairlyDescription: Non-Executive Directors’ fees comprise both a base fee and an attendance fee per meeting.
Our response: The Board does not believe that Directors should earn attendance fees in addition to a base fee. Many Directors add significant value and apportion significant time to the Group outside of the formal Board and Committee meetings, sometimes greater value than they might do within the confines of a formal meeting.
Partially applied
Principle 3.4: The Audit Committee oversees integrated reporting.Description: The Audit Committee recommends to the Board to engage an external assurance provider over material elements of the sustainability reporting within the integrated report. The Audit Committee evaluates both the independence and quality of the external providers of assurance on sustainability.
Principle 9.3: Sustainability reporting and disclosure should be independently assured.Description: The integrated report discloses the scope and methodology of independent assurance of the sustainability report, as well as the name of the assurer. Sustainability reporting is independently assured in accordance with a formal assurance process established.
Our response: Massmart’s sustainability report has not been audited by an external assurance provider in its entirety but of our key sustainability metrics (being emissions data, BBBEE, CSI and Consumer Protection), 100% have been audited by an independent provider, including Massmart Internal Audit Services (MIAS). Verification has been obtained through the following assurance providers: Moore Stephens conducts an independent audit of our emissions data, which includes all information provided in the Natural Capital Scorecard; Empowerdex audits the information provided in our BBBEE scorecard; and MIAS are responsible for auditing our claimed CSI and Consumer Protection data, through agreed upon procedures. A copy of the agreed upon procedures report is available at the registered offices of the Company.
Principle 8.6: The Board should ensure that disputes are resolved effectively and as expeditiously as possible.Description: The Board has adopted formal dispute resolution processes for internal and external disputes.
Our response: The Board does not have a formal dispute resolution process as it believes that the existing processes within the Group operate satisfactorily and do not require a more formal and separate mechanism. Massmart’s General Counsel is responsible for managing and advising the Board of significant disputes that arise within the Group. This individual manages a group of attorneys who supervise, manage or advise the business on external legal disputes within the Group. Internal disputes are managed through subject-specific policies and procedures. The General Counsel reports to the Board all significant legal exposures and disputes within the Group.
Corporate Governance
Our Chairman’s corporate governance overview Massmart believes that the first steps towards good corporate governance must include embracing the requirements of the relevant governance and regulatory frameworks, as well as corporate best practice. More than this, Massmart believes that sustainable and effective corporate governance is best demonstrated through a consistent pattern of doing the right thing regardless of the circumstances.
I am pleased to report that Massmart has responded appropriately to these requirements.
A register documenting the assessment of all 75 principles of King III is available on the web: www.massmart.co.za/iar2015/kingiii
Our Board The Board of Massmart is responsible for directing the Group towards achieving Massmart’s vision and mission. The Board is therefore accountable for the development and execution of the Group’s strategy, operating performance and financial results, as well as being the custodian of the Group’s corporate governance.
The Board is responsible for its own composition, the appointment of the Chairman and CEO, and the constitution and composition of its Committees. The Board has a charter setting out its policies, roles and responsibilities in the execution of its mandate described above. Each Board Committee also has a charter that is formally signed off by the Board. Annually, the Committees and Board review, and amend if necessary, the respective charters to ensure their relevance. The Board appreciates that strategy, risk, performance and sustainability are inseparable.
The role and appointment of DirectorsThe role of all Directors is to bring independent judgement and experience to the Board’s deliberations and decisions. The Board comprises two Executive Directors, five independent non-Executive Directors and three non-Executive Directors.Annually, the Nomination Committee facilitates a questionnaire aimed at gauging the independence status of each non-Executive Director. This is completed by each non-Executive Director and returned to the Committee, which then considers each Director’s independence. The Committee feels that the following aspects are important in assessing a non-Executive Director’s independence:• whether the Director had been employed in an Executive capacity in
the Group in the previous three years;• whether the Director had served on the Board for longer than nine
years. In this case, the Committee considers whether that Director’s independence, judgement and contribution to the Board’s deliberation could be compromised, or may appear to be compromised, by this length of service;
• whether the Director is a representative of a major shareholder; and• whether the proportion of that Director’s shareholding in Massmart
(if any) or Director’s fees represent a material part (10% or more) of their wealth or income.
The three Walmart-appointees are not considered independent. The Committee also believes that none of the five independent non-Executive Directors, or entities associated with or controlled by them, owns shares in Massmart which, relative to their personal wealth or income, are sufficiently material to affect his/her independence.
At least one-third of the non-Executive Directors are required to retire every year and Massmart Executive Directors have elected to also retire on this basis. As a result, all Directors retire by rotation at least every three years and are then eligible for re-election. In addition, shareholders must ratify the initial appointment of each Director at the first Annual General Meeting following that Director’s appointment. As a result of these requirements, at the 26 May 2016 Annual General Meeting, Chris Seabrooke retires by rotation; while Moses Kgosana and Enrique Ostalé will retire, due to having been appointed during the applicable year. Being eligible, they all offer themselves for re-election.
THE BOARD OF MASSMART IS RESPONSIBLE FOR DIRECTING THE GROUP TOWARDS ACHIEVING MASSMART’S VISION AND MISSION. THE BOARD IS THEREFORE ACCOUNTABLE FOR THE DEVELOPMENT AND EXECUTION OF THE GROUP’S STRATEGY, OPERATING PERFORMANCE AND FINANCIAL RESULTS, AS WELL AS BEING THE CUSTODIAN OF THE GROUP’S CORPORATE GOVERNANCE.
“
”
Corporate governance approach The primary South African corporate governance framework is the King Report on Governance for South Africa and King Code of Governance Principles (King III), which forms the backbone to Massmart’s own corporate governance framework. In addition Massmart applies high ethical standards to its operating environment as reflected in the Group’s Code of Ethical Conduct. We are closely monitoring the development of King IV and will align governance requirements and formal practices upon the release of King IV.
Massmart believes that these guides to corporate decision making are essential for any governance framework to achieve desired outcomes consistent with our Group values. In addition to this corporate governance framework, the Group is committed to complying with all legislation, regulations and best practices relevant to our business, in every country where we conduct business.
Massmart’s Executive Committee has established a subcommittee to focus on Ethics and Compliance. This subcommittee meets every other month to consider a legal update; an ethics review; specific areas of focus that Massmart’s compliance team manage closely; feedback from Internal Audit; and ethics and compliance in general.

124 125Massmart Integrated Annual Report 2015Transparency and Accountability: Our Board
Board process and evaluationThe Board meets four times a year and on an ad hoc basis should a particular issue demand its attention. In addition, the Board meets annually to formally consider and approve the strategies of the Massmart Divisions and Group.
The Board’s authority is devolved sequentially through the Massmart Executive Committee, the Divisional Boards and the Divisional Executive Committees, as formally prescribed by the Massmart Delegation of Authority (described below). In addition, the Board has delegated certain specific responsibilities to five Board Committees, described more fully over the page. These Committees assist the Board and Directors in discharging their duties and responsibilities under King III and the Delegation of Authority. Full transparency of the Committees’ deliberations is encouraged and the minutes of all Committee meetings are included in the formal Board papers at the ensuing Board meeting. All Directors are welcome to attend any Board Committee meeting or Divisional Board meeting.
The Massmart Delegation of Authority describes the specific levels of authority and required approvals for all major decisions at both Group and Divisional level. It clarifies which Executive position, Committee or Board needs to be consulted prior to taking the decision, which body makes the decision and which bodies should thereafter be informed of the decision. Where appropriate, it includes Walmart’s position on the decision.
The Board has also adopted a policy which describes Walmart’s access to the Massmart business. This policy is fully described on the Company’s website under FAQ.
The Board works to a formal agenda that covers strategy, structure, operating performance, growth initiatives, sustainability, investor relations, risk and governance, and any other key activities of the Group. An annual agenda structure ensures that other areas including IT and compliance are addressed. Formal Board papers are prepared for every discussion item on the meeting’s agenda and are distributed timeously to Board members.
Directors are encouraged to take independent advice, at the Company’s cost, for the proper execution of their duties and responsibilities.
Directors have unrestricted access to any Executive, manager or employee in the Group.
Annually in October, the Nomination Committee facilitates a comprehensive formal performance evaluation of the CEO, comprising a questionnaire evaluating the CEO by every non-Executive Director, and an appraisal of the CEO by each of his direct reports using a different questionnaire. The Board Chairman provides the summary and feedback of the above to the CEO, and he is encouraged to probe and debate any aspect of the evaluation with the Board.
At the same time, all Board members and permanent invitees complete a detailed Board self-assessment, covering the composition, duties, responsibilities, process and effectiveness of the Board. Similarly, all Board Committee members and permanent invitees complete detailed self-assessments covering the same aspects of their Committees. The results of these assessments are collated by the Company Secretary and sent in summarised form to the respective Board and Committee Chairpersons for discussion and review by that Committee. The summarised results are included in the Board papers at the November meeting.
Finally, all Board members formally assess the Chairman’s performance. The Deputy Chairman provides feedback from this process to the Chairman. Assessments are approached in a constructive manner and provide valuable input that enhances the effectiveness of the Chairman, the Board and its Committees.
Our Executive CommitteeIn 2015 the Executive Committee was chaired by the CEO (Guy Hayward) and comprised the CFO (Johannes van Lierop), the Group Human Capital Executive (Jane Bruyns), the Chief Ethics and Compliance Officer (Norman Gray), the Group Financial Services Executive (Gerhard Hayes), the Group Corporate Affairs Executive (Brian Leroni), the five Divisional Chief Executives (Neville Dunn, Doug Jones, Kevin Vyvyan-Day, Llewellyn Walters and Robin Wright), General Counsel (Mike Spivey) and the Group Commercial Executive (Llewellyn Steeneveldt).
The CEO and CFO are the most senior Executive decision-making Executives in the Group. With the help of the Committee they deliberate, take decisions or make recommendations on all matters of strategy and operations. Within the parameters described by the Board-approved Delegation of Authority, the decisions or recommendations are sometimes referred to the Board or its relevant Committee for final approval, while in other cases the power to take decisions is delegated to the CEO and CFO.The Executive Committee assists the CEO and CFO with specific responsibilities, inter alia:• monitoring and measuring the structures, trends and performance of markets
and competition;• strategic planning;• defining, configuring, financing and structuring the Group’s portfolio of assets;• shaping and approving the competitive strategies, growth and operating plans
and budgets of the Divisions and functional departments;• measuring, monitoring and taking proactive corrective action on Divisional
performance;• ensuring adequate risk management, internal controls, governance, compliance
and ethical behaviour throughout the Group; and• shaping and approving succession plans and senior executive management
appointments.
Our Company SecretaryThe Board is comfortable that it meets the King III principle of having an arm’s length relationship with the Company Secretary and confirms that the Company Secretary is not a Director of any of the main operating companies within the Group. Based on the outcome of a formal assessment of the Company Secretary, which was completed by the Chairman of the Board, the CEO, the CFO and the Chairman of the Audit Committee, the Board confirms that it has assessed and is happy with the qualification, competence and expertise of the Company Secretary, Philip Sigsworth, CA(SA).
The Company Secretary assists the Board in fulfilling its functions and is empowered by the Board to perform his duties. The Company Secretary, directly or indirectly:• assists the Chairman, CEO and CFO with the induction of new Directors;• assists the Board with Director orientation, development and education;• ensures that the Group complies with all legislation applicable/relevant to it;• monitors the legal and regulatory environment and communicates new
legislation, and any changes to existing legislation, relevant to the Board and the Divisions; and
• provides the Board with a central source of guidance and assistance.
THE BOARD IS COMFORTABLE THAT IT MEETS THE KING III PRINCIPLE OF HAVING AN ARM’S LENGTH RELATIONSHIP WITH THE COMPANY SECRETARY AND CONFIRMS THAT THE COMPANY SECRETARY IS NOT A DIRECTOR OF ANY OF THE MAIN OPERATING COMPANIES WITHIN THE GROUP.
Our Boardcontinued
“
”From top:Andy Clarke, a non-Executive Director and Philip Sigsworth, Group Company Secretary

127Massmart Integrated Annual Report 2015126
Our Board Committees
More information on the activities and responsibilities of the Audit, Risk and Nomination Committees can be found on the web at www.massmart.co.za/iar2015/t&a
More information on the activities and responsibilities of the Executive, Remuneration and Social and Ethics Committees can be found on
p125, p92 and p116 respectively.
R
E
A
SE
M
N
AUDIT COMMITTEE Meets 3 times per year
• Overseeing the effectiveness of the Group’s internal control systems.
• Reviewing the scope and effectiveness of the external and
internal audit functions.• Ensuring that adequate accounting
records have been maintained.• Ensuring the appropriate accounting
policies have been adopted and consistently applied.
• Overseeing the quality and integrity of the Annual Financial Statements.• Testing that the Group’s going-
concern assertion remains appropriate.
CS Seabrooke, NN Gwagwa, R Kgosana,
P Langeni
RISK COMMITTEE Meets twice per year
• Reviewing and reporting on compliance with King III.
• Overseeing the Group’s risk management programme as
contemplated in King III.
CS Seabrooke NN Gwagwa, G Hayward,
R Kgosana, P Langeni, J van Lierop, N Gray, D Moodley, M Spivey
NOMINATION COMMITTEE Meets 4 times per year
• Assessment, recruitment and nomination of new Executive and
non-Executive Directors.• Making recommendations as
to the composition of the Board.• Formulating succession plans for the
approval of the Board for the appointment of new Executive and non-Executive
Directors, including the Chairman, CEO and the Group’s Executives.
K DlaminiE Ostalé (member from 24/02/16),
CS Seabrooke, (S Broader member until 09/11/15)
REMUNERATION COMMITTEE Meets 4 times per year
• Designing, monitoring and communicating the Group’s
remuneration policies.• Considering and approving
Executive remuneration including short- and long-term incentives.
CS SeabrookeK Dlamini,
E Ostalé (member from 24/02/16), (S. Broader member until 09/11/15)
SOCIAL AND ETHICS COMMITTEE Meets twice per year
• Assists the Group with its responsibility towards sustainability with respect to
practices that are consistent with good corporate citizenship.
• Considers the Group’s standing in terms of consumer relationships, with
particular attention to the United Nations Global Compact Principles
and the OECD recommendations concerning corruption.
• Considers the Group’s contribution to the social and economic development
within our communities.• Monitoring the Group’s activities
relating to labour and employment, the environment, health and public safety,
and consumer relationships.
P Langeni, G Hayward, JP Suarez
EXECUTIVE COMMITTEE Meets monthly
Assist the CEO and CFO in deliberating and taking decisions
or making recommendations on all matters affecting Group strategy, growth, performance and operations, including risk
management, and Executive and senior management succession.
G Hayward, J van Lierop, J Bruyns, N Dunn,
N Gray, G Hayes, D Jones, B Leroni, M Spivey, L Steeneveldt,
K Vyvyan-Day, L Walters, R Wright
Board and Committee attendance
CChairman*Invitee1Resigned with effect from 9 November 2015 and as such was only invited to meetings prior to that date in the 2015 financial year2Appointed with effect from 1 September 2015 and as such was only invited to meetings post that date in the 2015 financial year3Appointed with effect from 12 March 2015 and as such was only invited to meetings post that date in the 2015 financial year4Resigned with effect from 12 March 2015 and as such was only invited to meetings prior to that date in the 2015 financial year
E Ostalé was appointed with effect from 24 February 2016 and as such was not invited to meetings in the 2015 financial year
The table below reflects the Board members’ attendance at the meetings for the year ended December 2015
Status / Position Board AGM Audit Risk Nomination RemunerationSocial
and Ethics
Board Members
K DlaminiIndependent non-Executive 4/4C 1/1C – – 4/4C 4/4 –
CS Seabrooke Independent non-Executive 4/4 1/1 3/3C 2/2C 4/4 4/4C –
S Broader1 Non-Executive 3/3 1/1 – – 3/3 3/3 1/1*
A Clarke Non-Executive 4/4 1/1 – – 1/1* 1/1* –
NN Gwagwa Independent non-Executive 3/4 0/1 2/3 2/2 – – –
GRC Hayward Executive 4/4 1/1 3/3* 2/2 4/4* 4/4* 2/2
R Kgosana2
Independent non-Executive 1/1 – 1/1 – – – –
P Langeni Independent non-Executive 4/4 1/1 1/3 1/2 – – 2/2C
JP Suarez Non-Executive 3/4 1/1 – – – – 2/2
J van Lierop3 Executive 3/3 1/1 2/2* 1/1 – – –
I Zwarenstein4 Executive 1/1 – 1/1* 1/1 – – –
Management
J BruynsGroup Human Capital Executive – – – – – – 2/2*
N GrayChief Ethics and Compliance Officer – 1/1 3/3* 2/2 – – 2/2*
B LeroniGroup Corporate Affairs Executive – 1/1 – – – – 2/2*
D Moodley Chief Audit Executive – – 3/3* 2/2 – – –
P Sigsworth Company Secretary 4/4* 1/1 3/3* 2/2* – – –
M Spivey General Counsel 4/4* 1/1 3/3* 2/2 4/4* 4/4* 2/2*
No. of meetings 4 1 3 2 4 4 2
Transparency and Accountability: Our Board Committees
Notice is hereby given that the Annual General Meeting of
holders of all classes of shares of the Company will be held on Thursday, 26 May 2016 at 09h00
at Massmart House, 16 Peltier Drive, Sunninghill Ext 6, Sandton.
Notice of AGM 130
Form of proxy 135
Notes to the form of proxy 136
Definitions and formulas 137
04Shareholder information
129Massmart Integrated Annual Report 2015128 Shareholder information

Notice is hereby given that the Annual General Meeting of holders of all classes of shares of the Company will be held on Thursday, 26 May 2016 at 09h00 at Massmart House, 16 Peltier Drive, Sunninghill Ext 6, Sandton, for purposes of:1. Transacting the following business:
1.1 presenting the audited consolidated Annual Financial Statements of the Company and its subsidiaries (Group) for the year ended December 2015, and the associated Directors’ report and Independent Auditors’ report, the Audit Committee report and the Social and Ethics Committee report;
1.2 electing Directors in the place of those resigning and retiring in accordance with the Company’s Memorandum of Incorporation; and
1.3 such other business as may be transacted at an annual general meeting.2. Considering and, if deemed fit, passing, with or without modification, the
below mentioned ordinary and special resolutions.
The Board of Directors of the Company has determined, in accordance with section 59 of the Companies Act 71 of 2008, as amended (Act), that the respective record dates for shareholders to be recorded as shareholders in the securities register of the Company in order to: (i) be entitled to receive this notice of Annual General Meeting is Friday, 15 April 2016; and (ii) be entitled to attend, participate and vote at the Annual General Meeting is Friday, 20 May 2016. The last date to trade to be entitled to attend, participate and vote at the Annual General Meeting is Friday, 13 May 2016.
Ordinary businessThe audited summary consolidated Annual Financial Statements of the Company and the Group (as approved by the Directors of the Company), including the Directors’ report and Independent Auditors’ report, the Audit Committee report and the Social and Ethics Committee report for the year ended December 2015, circulated together with this notice of Annual General Meeting, are presented to the shareholders for their consideration.
Ordinary resolutionsOrdinary Resolution Number 1“Resolved that Raboijane (Moses) Kgosana, who retires due to him having been appointed during the applicable year and has offered himself for re-election, be and is hereby re-elected to the Board of Directors of the Company.”
In terms of the Act, more than 50% of the voting rights exercised on this resolution must be cast in favour of ordinary resolution number 1 for it to be adopted.
Ordinary Resolution Number 2“Resolved that Enrique Ostalé, who retires due to him having been appointed during the applicable year and has offered himself for re-election, be and is hereby re-elected to the Board of Directors of the Company.”
In terms of the Act, more than 50% of the voting rights exercised on this resolution must be cast in favour of ordinary resolution number 2 for it to be adopted.
Ordinary Resolution Number 3“Resolved that Chris Seabrooke, who retires by rotation and has offered himself for re-election, be and is hereby re-elected to the Board of Directors of the Company.”
In terms of the Act, more than 50% of the voting rights exercised on this resolution must be cast in favour of ordinary resolution number 3 for it to be adopted.
Ordinary Resolution Number 4“Resolved that Ernst & Young Inc. (with Mr Allister Jon Carshagen as the Audit Partner) be and are hereby elected as the Company’s external auditors for the ensuing financial year to hold office until the Company’s next Annual General Meeting, as approved by the Audit Committee and recommended to shareholders.”
In terms of the Act, more than 50% of the voting rights exercised on this resolution must be cast in favour of ordinary resolution number 4 for it to be adopted.
Ordinary Resolution Number 5“Resolved that the following persons be and are hereby appointed, each by way of a separate vote, as members of the Audit Committee:
5.1 Chris Seabrooke (Chairman)*5.2 Lulu Gwagwa5.3 Raboijane (Moses) Kgosana*5.4 Phumzile Langeni *Subject to their re-election as Directors pursuant to
ordinary resolutions number 1 and number 3.”In terms of the Act, more than 50% of the voting rights exercised on each of these resolutions must be cast in favour of each of ordinary resolution numbers 5.1, 5.2, 5.3 and 5.4 for such resolutions to be adopted.
Ordinary Resolution Number 6“Resolved that, subject to the JSE Limited (JSE) Listings Requirements (JSE Listing Requirements), the Directors be and are hereby authorised to issue ordinary shares in the authorised but unissued shares of the Company (or to issue options or convertible securities convertible into ordinary shares) for cash to such person or persons on such terms and conditions as they may deem fit, subject to the following:6.1 the securities shall be of a class already in issue, or
convertible into a class already in issue;6.2 the securities shall be issued to public shareholders
(as defined in the JSE Listings Requirements) and not to related parties (as defined in the JSE Listings Requirements);
6.3 the issues of securities in the aggregate under the authority of this resolution during the period in 6.5 below shall not exceed 5% of the number of securities of that class already in issue as at the date of this notice of Annual General Meeting, being 217,136,334 ordinary shares, determined in accordance with the relevant provisions of the JSE Listings Requirements, provided that:6.3.1 any equity securities issued under the authority
during the period contemplated in 6.5 below must be deducted from such number in 6.3 above; and
6.3.2 in the event of a sub-division or consolidation of the issued equity securities during the period contemplated in 6.5 below, the existing authority must be adjusted accordingly to represent the same allocation ratio;
6.4 the maximum discount at which the shares may be issued shall be 10% of the weighted average traded price of the shares of the Company measured over the 30 business days prior to the date that the price of the issue is agreed between the Company and the party subscribing for the shares (or, if no shares of the Company have been traded in that period, subject to a ruling by the JSE);
6.5 the authority hereby granted will be valid until the Company’s next Annual General Meeting, provided that it will not extend beyond 15 months from the date on which this resolution is passed; and
6.6 once shares representing, on a cumulative basis within the period contemplated in 6.5 above, 5% or more of the Company’s issued ordinary and/or preference shares prior to that issue, have been issued, the Company shall publish an announcement in accordance with the JSE Listings Requirements.”
Pursuant to the JSE Listings Requirements, the Company will only be entitled to implement this general authority to allot and issue ordinary shares for cash if this ordinary resolution number 6 is passed by a majority of 75% or more of the votes
cast by all shareholders present or represented by proxy at the Annual General Meeting, excluding any votes cast by the Massmart Holdings Limited Employee Share Trust.
Ordinary Resolution Number 7“Resolved that, by way of a non-binding advisory vote, the remuneration policy of the Company, as outlined in the Remuneration Report on pages 92 to 105 of the Integrated Annual Report, is endorsed.”
As this is a non-binding advisory vote, no minimum voting threshold is required. Nevertheless, for record purposes, in terms of the King Report on Governance for South Africa (King III) more than 50% of the voting rights exercised on this resolution must be cast in favour of ordinary resolution number 7 for it to be adopted. This non-binding advisory vote allows shareholders to express their views on the remuneration policies adopted by the Company and on their implementation.
Special resolutionsSpecial Resolution Number 1“Resolved, as a special resolution, that the Company and/or its subsidiaries be and are hereby authorised to generally repurchase the ordinary and/or preference shares in the issued shares of the Company from such shareholder/s, at such price, in such manner and subject to such terms and conditions as the Directors may deem fit, but subject to the Memorandum of Incorporation of the Company, the Act and the JSE Listings Requirements, and provided that:1.1 the authority hereby granted will be valid until the
Company’s next Annual General Meeting or for 15 months from the date of this special resolution, whichever period is shorter;
1.2 repurchases may not be made at a price greater than 10% above the weighted average of the market value for the shares determined over the 5 business days immediately preceding the date that the repurchase is effected (or, if no shares of the Company have been traded in that period, subject to a ruling by the JSE);
1.3 repurchases in the aggregate in any one financial year shall not exceed 15% of that class of the Company’s issued shares;
1.4 the repurchase of shares will be effected through the order book operated by the JSE trading system and will be done without any prior understanding or arrangement between the Company and the counterparty;
1.5 the Company may only appoint one agent, at any point in time, to effect the repurchases on the Company’s behalf;
1.6 neither the Company nor its subsidiaries may repurchase shares during a prohibited period (as defined in the JSE Listings Requirements) unless a repurchase programme is in place where the dates and quantities of shares to be traded during the relevant period are fixed (not subject to any variation) and has been submitted to the JSE in writing prior to the commencement of the prohibited period. The Company will instruct an independent third party, which makes its investment decisions in relation to the Company’s securities independently of, and uninfluenced by, the Company, prior to the commencement of the prohibited period to execute the repurchase programme submitted to the JSE;
The audited summary consolidated Annual Financial Statements for the year ended December 2015 are set out in the “Chief Financial Officer’s Review” on p44-63 of the Integrated Annual Report. The audited consolidated Annual Financial Statements for the year ended December 2015 can be found on the Company’s website at: www.massmart.co.za/iar2015/groupafs
Biographical details of the Directors retiring can be found on the Company’s website at:
www.massmart.co.za/iar2015/CVs
Notice of Annual General Meeting
130 131Massmart Integrated Annual Report 2015Shareholder information: Notice of AGM
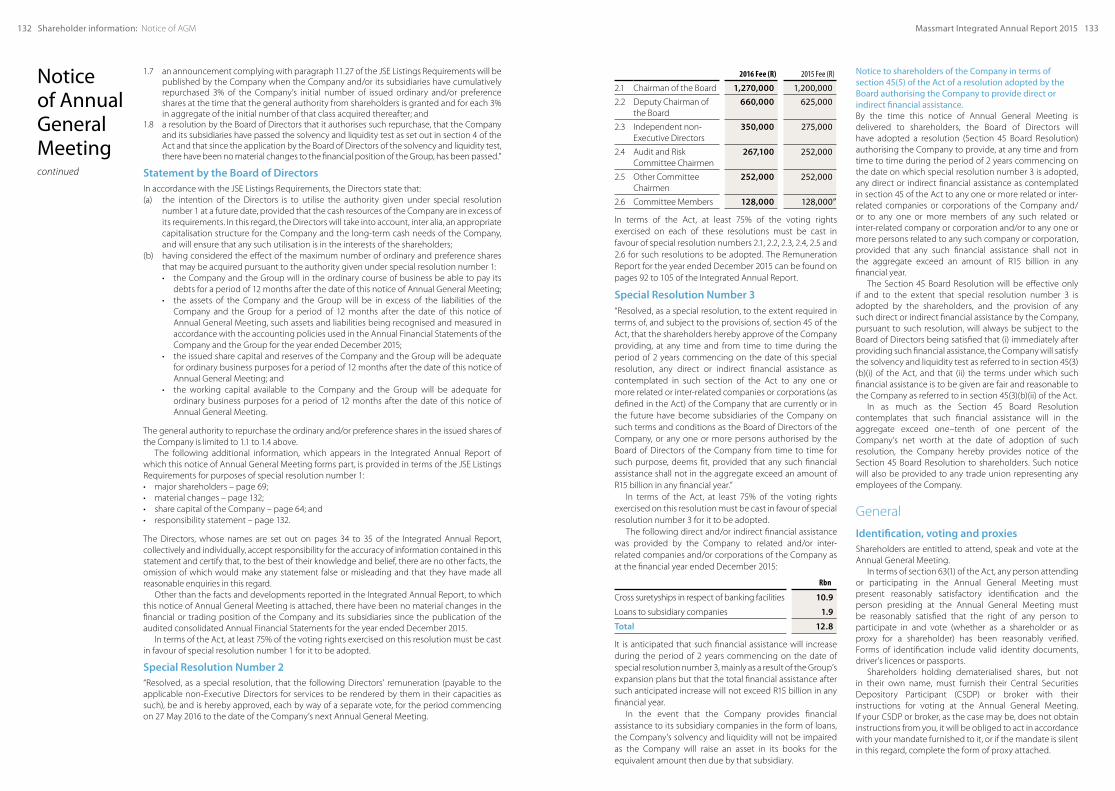
1.7 an announcement complying with paragraph 11.27 of the JSE Listings Requirements will be published by the Company when the Company and/or its subsidiaries have cumulatively repurchased 3% of the Company’s initial number of issued ordinary and/or preference shares at the time that the general authority from shareholders is granted and for each 3% in aggregate of the initial number of that class acquired thereafter; and
1.8 a resolution by the Board of Directors that it authorises such repurchase, that the Company and its subsidiaries have passed the solvency and liquidity test as set out in section 4 of the Act and that since the application by the Board of Directors of the solvency and liquidity test, there have been no material changes to the financial position of the Group, has been passed.”
Statement by the Board of DirectorsIn accordance with the JSE Listings Requirements, the Directors state that:(a) the intention of the Directors is to utilise the authority given under special resolution
number 1 at a future date, provided that the cash resources of the Company are in excess of its requirements. In this regard, the Directors will take into account, inter alia, an appropriate capitalisation structure for the Company and the long-term cash needs of the Company, and will ensure that any such utilisation is in the interests of the shareholders;
(b) having considered the effect of the maximum number of ordinary and preference shares that may be acquired pursuant to the authority given under special resolution number 1:• the Company and the Group will in the ordinary course of business be able to pay its
debts for a period of 12 months after the date of this notice of Annual General Meeting;• the assets of the Company and the Group will be in excess of the liabilities of the
Company and the Group for a period of 12 months after the date of this notice of Annual General Meeting, such assets and liabilities being recognised and measured in accordance with the accounting policies used in the Annual Financial Statements of the Company and the Group for the year ended December 2015;
• the issued share capital and reserves of the Company and the Group will be adequate for ordinary business purposes for a period of 12 months after the date of this notice of Annual General Meeting; and
• the working capital available to the Company and the Group will be adequate for ordinary business purposes for a period of 12 months after the date of this notice of Annual General Meeting.
The general authority to repurchase the ordinary and/or preference shares in the issued shares of the Company is limited to 1.1 to 1.4 above.
The following additional information, which appears in the Integrated Annual Report of which this notice of Annual General Meeting forms part, is provided in terms of the JSE Listings Requirements for purposes of special resolution number 1:• major shareholders – page 69;• material changes – page 132;• share capital of the Company – page 64; and• responsibility statement – page 132.
The Directors, whose names are set out on pages 34 to 35 of the Integrated Annual Report, collectively and individually, accept responsibility for the accuracy of information contained in this statement and certify that, to the best of their knowledge and belief, there are no other facts, the omission of which would make any statement false or misleading and that they have made all reasonable enquiries in this regard.
Other than the facts and developments reported in the Integrated Annual Report, to which this notice of Annual General Meeting is attached, there have been no material changes in the financial or trading position of the Company and its subsidiaries since the publication of the audited consolidated Annual Financial Statements for the year ended December 2015.
In terms of the Act, at least 75% of the voting rights exercised on this resolution must be cast in favour of special resolution number 1 for it to be adopted.
Special Resolution Number 2“Resolved, as a special resolution, that the following Directors’ remuneration (payable to the applicable non-Executive Directors for services to be rendered by them in their capacities as such), be and is hereby approved, each by way of a separate vote, for the period commencing on 27 May 2016 to the date of the Company’s next Annual General Meeting.
2016 Fee (R) 2015 Fee (R)
2.1 Chairman of the Board 1,270,000 1,200,000
2.2 Deputy Chairman of the Board
660,000 625,000
2.3 Independent non-Executive Directors
350,000 275,000
2.4 Audit and Risk Committee Chairmen
267,100 252,000
2.5 Other Committee Chairmen
252,000 252,000
2.6 Committee Members 128,000 128,000”
In terms of the Act, at least 75% of the voting rights exercised on each of these resolutions must be cast in favour of special resolution numbers 2.1, 2.2, 2.3, 2.4, 2.5 and 2.6 for such resolutions to be adopted. The Remuneration Report for the year ended December 2015 can be found on pages 92 to 105 of the Integrated Annual Report.
Special Resolution Number 3“Resolved, as a special resolution, to the extent required in terms of, and subject to the provisions of, section 45 of the Act, that the shareholders hereby approve of the Company providing, at any time and from time to time during the period of 2 years commencing on the date of this special resolution, any direct or indirect financial assistance as contemplated in such section of the Act to any one or more related or inter-related companies or corporations (as defined in the Act) of the Company that are currently or in the future have become subsidiaries of the Company on such terms and conditions as the Board of Directors of the Company, or any one or more persons authorised by the Board of Directors of the Company from time to time for such purpose, deems fit, provided that any such financial assistance shall not in the aggregate exceed an amount of R15 billion in any financial year.”
In terms of the Act, at least 75% of the voting rights exercised on this resolution must be cast in favour of special resolution number 3 for it to be adopted.
The following direct and/or indirect financial assistance was provided by the Company to related and/or inter-related companies and/or corporations of the Company as at the financial year ended December 2015:
Rbn
Cross suretyships in respect of banking facilities 10.9
Loans to subsidiary companies 1.9
Total 12.8
It is anticipated that such financial assistance will increase during the period of 2 years commencing on the date of special resolution number 3, mainly as a result of the Group’s expansion plans but that the total financial assistance after such anticipated increase will not exceed R15 billion in any financial year.
In the event that the Company provides financial assistance to its subsidiary companies in the form of loans, the Company’s solvency and liquidity will not be impaired as the Company will raise an asset in its books for the equivalent amount then due by that subsidiary.
Notice to shareholders of the Company in terms of section 45(5) of the Act of a resolution adopted by the Board authorising the Company to provide direct or indirect financial assistance.By the time this notice of Annual General Meeting is delivered to shareholders, the Board of Directors will have adopted a resolution (Section 45 Board Resolution) authorising the Company to provide, at any time and from time to time during the period of 2 years commencing on the date on which special resolution number 3 is adopted, any direct or indirect financial assistance as contemplated in section 45 of the Act to any one or more related or inter-related companies or corporations of the Company and/or to any one or more members of any such related or inter-related company or corporation and/or to any one or more persons related to any such company or corporation, provided that any such financial assistance shall not in the aggregate exceed an amount of R15 billion in any financial year.
The Section 45 Board Resolution will be effective only if and to the extent that special resolution number 3 is adopted by the shareholders, and the provision of any such direct or indirect financial assistance by the Company, pursuant to such resolution, will always be subject to the Board of Directors being satisfied that (i) immediately after providing such financial assistance, the Company will satisfy the solvency and liquidity test as referred to in section 45(3)(b)(i) of the Act, and that (ii) the terms under which such financial assistance is to be given are fair and reasonable to the Company as referred to in section 45(3)(b)(ii) of the Act.
In as much as the Section 45 Board Resolution contemplates that such financial assistance will in the aggregate exceed one–tenth of one percent of the Company’s net worth at the date of adoption of such resolution, the Company hereby provides notice of the Section 45 Board Resolution to shareholders. Such notice will also be provided to any trade union representing any employees of the Company.
General
Identification, voting and proxiesShareholders are entitled to attend, speak and vote at the Annual General Meeting.
In terms of section 63(1) of the Act, any person attending or participating in the Annual General Meeting must present reasonably satisfactory identification and the person presiding at the Annual General Meeting must be reasonably satisfied that the right of any person to participate in and vote (whether as a shareholder or as proxy for a shareholder) has been reasonably verified. Forms of identification include valid identity documents, driver’s licences or passports.
Shareholders holding dematerialised shares, but not in their own name, must furnish their Central Securities Depository Participant (CSDP) or broker with their instructions for voting at the Annual General Meeting. If your CSDP or broker, as the case may be, does not obtain instructions from you, it will be obliged to act in accordance with your mandate furnished to it, or if the mandate is silent in this regard, complete the form of proxy attached.
Notice of Annual General Meeting continued
132 133Massmart Integrated Annual Report 2015Shareholder information: Notice of AGM

Unless you advise your CSDP or broker, in terms of the agreement between you and your CSDP or broker by the cut-off time stipulated therein, that you wish to attend the Annual General Meeting or send a proxy to represent you at the Annual General Meeting, your CSDP or broker will assume that you do not wish to attend the Annual General Meeting or send a proxy.
If you wish to attend the Annual General Meeting or send a proxy, you must request your CSDP or broker to issue the necessary letter of authority to you. Shareholders holding dematerialised shares, and who are unable to attend the Annual General Meeting and wish to be represented thereat, must complete the form of proxy attached in accordance with the instructions therein and lodge it with or mail it to the transfer secretaries, Computershare Investor Services Proprietary Limited (Computershare).
A form of proxy (which is attached) must be dated and signed by the shareholder appointing a proxy and should be forwarded to reach Computershare by no later than 09h00 on Tuesday, 24 May 2016. Before a proxy exercises any rights of a shareholder at the Annual General Meeting, such form of proxy must be so delivered.
In compliance with the provisions of section 58(8) (b) (i) of the Act, a summary of the rights of a shareholder to be represented by proxy, as set out in section 58 of the Act, is set out immediately hereunder:• A shareholder entitled to attend and vote at the Annual General Meeting may appoint any
individual (or two or more individuals) as a proxy or as proxies to attend, participate in and vote at the Annual General Meeting in the place of the shareholder. A proxy need not be a shareholder of the Company.
• A proxy appointment must be in writing, dated and signed by the shareholder appointing a proxy and, subject to the rights of a shareholder to revoke such appointment (as set out below), remains valid only until the end of the Annual General Meeting.
• A proxy may delegate the proxy’s authority to act on behalf of a shareholder to another person, subject to any restrictions set out in the instrument appointing the proxy.
• The appointment of a proxy is suspended at any time and to the extent that the shareholder who appointed such proxy chooses to act directly and in person in the exercise of any rights as a shareholder.
• The appointment of a proxy is revocable by the shareholder in question cancelling it in writing, or making a later inconsistent appointment of a proxy, and delivering a copy of the revocation instrument to the proxy and to Computershare. The revocation of a proxy appointment constitutes a complete and final cancellation of the proxy’s authority to act on behalf of the shareholder as of the later of: (i) the date stated in the revocation instrument, if any and (ii) the date on which the revocation instrument is delivered to Computershare as required in the first sentence of this paragraph.
• If the instrument appointing the proxy or proxies has been delivered to Computershare, as long as that appointment remains in effect, any notice that is required by the Act or the Company’s Memorandum of Incorporation to be delivered by the Company to the shareholder, must be delivered by the Company to: (i) the shareholder or (ii) the proxy or proxies, if the shareholder has: (a) directed the Company to do so in writing and (b) paid any reasonable fee charged by the Company for doing so.
• Attention is also drawn to the “Notes to the form of proxy”.• The completion of a form of proxy does not preclude any shareholder from attending the
Annual General Meeting.
Shareholders may participate (but not vote) electronically in the Annual General Meeting. Shareholders wishing to participate in the Annual General Meeting electronically should contact the Assistant Company Secretary on [email protected] or +27 11 517 0000 not less than five business days prior to the Annual General Meeting and are required to provide identification reasonably satisfactory to the Assistant Company Secretary for purposes of verifying that shareholders’ right to participate. Access to the Annual General Meeting by way of electronic participation will be at the shareholder’s expense. Only persons physically present at the Annual General Meeting or represented by a valid proxy shall be entitled to cast a vote on any matter put to a vote of shareholders.
By order of the Board
Philip SigsworthCompany Secretary1 April 2016
Notice of Annual General Meeting continued
Form of proxy Massmart Holdings Limited Incorporated in the Republic of South AfricaRegistration number 1940/014066/06
JSE share code MSM ISIN ZAE000152617(“Massmart” or “the Company”)
For use by certificated and dematerialised shareholders who have ‘own name’ registration of shares on Friday, 20 May 2016 at the Annual General Meeting to be held on Thursday, 26 May 2016 at 09h00 at Massmart House, 16 Peltier Drive, Sunninghill Ext 6, Sandton.
I/We (Please PRINT full names)
of (address) being the
holders of ordinary shares/‘B’ preference shares, hereby appoint (see note 3),
1. or failing him/her,
2. or failing him/her,
the chairman of the Annual General Meeting as my/our proxy to participate in, speak and vote for me/us on my/our behalf at the Annual General Meeting which will be held for the purpose of considering and, if deemed fit, passing the ordinary and special resolutions to be proposed and at each adjournment of the Annual General Meeting and to vote for or against the ordinary and special resolutions or to abstain from voting in respect of the shares in the issued capital of the Company registered in my/our name/s, in accordance with the instructions as set out in note 4.
For Against AbstainOS PS OS PS OS PS
Ordinary resolutions1. Re-election of Raboijane (Moses) Kgosana to the Board of Directors 2. Re-election of Enrique Ostalé to the Board of Directors3. Re-election of Chris Seabrooke to the Board of Directors4. Election of Ernst & Young Inc. as the Company’s auditors5. Appointment of the Audit Committee members:
5.1 Chris Seabrooke 5.2 Lulu Gwagwa 5.3 Raboijane (Moses) Kgosana5.4 Phumzile Langeni
6. Authorisation for the Directors to issue ordinary shares for cash, not exceeding 5% of the shares in issue
7. Endorsement of the Company’s remuneration policySpecial resolutions
1. Authorisation for the Company and/or its subsidiaries to repurchase its own shares 2. Approval of non-Executive Directors’ remuneration
2.1 Chairman of the Board2.2 Deputy Chairman of the Board2.3 Independent non-Executive Directors2.4 Audit and Risk Committee Chairmen2.5 Other Committee Chairmen2.6 Committee Members
3. Authorisation to provide financial assistance
Indicate with an “X” or the relevant number of ordinary or ‘B’ preference shares, in the applicable space, how you wish your votes to be cast (see note 4). If you return this form duly signed, without any specific directions, the proxy will vote as he/she thinks fit.
Signed at on 2016
Signature Assisted by me (where applicable)
Tel: Cell:
Email:
Completed forms of proxy must be lodged with Computershare Investor Services Proprietary Limited, not less than 48 (forty-eight) hours before the time for holding the Annual General Meeting, i.e. by no later than 09h00 on Tuesday, 24 May 2016.
Please read the notes on the reverse side of this form of proxy.
OS – Ordinary shares PS – ‘B’ Preference shares
134 135Massmart Integrated Annual Report 2015Shareholder information: Notice of AGM

Transfer secretariesComputershare Investor Services Proprietary LimitedGround Floor70 Marshall StreetJohannesburg 2011PO Box 61051, Marshalltown 2107Telephone: 011 370 5000Call Centre: 086 110 09818
Notes to the form of proxy
1. A form of proxy is only to be completed by those shareholders who are:1.1 holding shares in certificated form; or1.2 recorded on the sub-register of the Company in dematerialised electronic form in
“own name” on the record date for attending, participating and voting at the Annual General Meeting.
2. If you have already dematerialised your shares through a Central Securities Depository Participant (CSDP) or broker and wish to attend the Annual General Meeting, you must request your CSDP or broker to provide you with a letter of representation or you must instruct your CSDP or broker to vote by proxy on your behalf in terms of the agreement between yourself and your CSDP or broker.
3. A shareholder may insert the name of a proxy or the names of alternative proxies of the shareholder’s choice in the space/s provided, with or without deleting ‘the Chairman of the Annual General Meeting’ but any such deletion must be initialled by the shareholder. The person whose name stands first on this form of proxy and who is present at the Annual General Meeting will be entitled to act as proxy to the exclusion of those whose names follow.
4. Please insert an ‘X’ in the relevant space according to how you wish your votes to be cast. However, if you wish to cast your votes in respect of a lesser number of shares than you own in the Company, insert the number of shares held in respect of which you wish to vote. Failure to comply with the above will be deemed to authorise the proxy to vote or to abstain from voting at the Annual General Meeting as he/she deems fit in respect of all the shareholders’ votes exercisable at the Annual General Meeting. A shareholder or his/her proxy is not obliged to use all the votes exercisable by the shareholder or by his/her proxy, but the total of the votes cast and in respect of which an abstention is recorded may not exceed the total of the votes exercisable by the shareholder or by his/her proxy.
5. Forms of proxy must be received by the transfer secretaries, Computershare Investor Services Proprietary Limited (Computershare), Ground Floor, 70 Marshall Street, Johannesburg 2001 (PO Box 61051, Marshalltown 2107) by no later than 09h00 on Tuesday, 24 May 2016.
6. The completion and lodging of this form of proxy will not preclude the relevant shareholder from attending the Annual General Meeting and speaking and voting in person at such meeting to the exclusion of any proxy appointed in terms of this form of proxy.
7. Documentary evidence establishing the authority of a person signing this form of proxy in a representative capacity or other legal capacity must be attached to this form of proxy unless previously recorded by Computershare or waived by the Chairman of the Annual General Meeting.
8. Any alterations or corrections made to this form of proxy must be initialled by the signatory/ies.
9. A minor must be assisted by his/her parent or guardian unless the relevant documents establishing his/her legal capacity are produced or have been registered by Computershare.
10. The Chairman of the Annual General Meeting may accept any form of proxy which is completed other than in accordance with these notes if the Chairman is satisfied as to the manner in which the shareholder wishes to vote.
11. If any shares are jointly held, the first name appearing in the register shall, in the event of a dispute, be taken as a shareholder.
Definitions and formulas
Employment costs
Includes the IFRS 2 Share-based Payment expense.
Net finance costs
Interest received less interest paid.
EBITDA
Earnings before interest, taxation, depreciation, amortisation and asset impairments.
EBITDAR
Earnings before interest, taxation, depreciation, amortisation, asset impairments and occupancy costs.
Trading profit before interest and taxation
Earnings before interest, taxation, asset impairments, the BEE IFRS 2 charge, foreign exchange movements, loss on disposal of business and assets classified as held for sale and Walmart related costs. Comparable sales
Sales figures quoted for stores that have traded, and will trade, for all 12 months of the current and prior year.
FTE (full-time equivalents)
Includes all permanent employees and the permanent equivalent of temporary employees and contracted workers.
Trading space (m2)
Trading space excludes parking, yard, warehouse space, office space and receiving areas.
Regional distribution centre space (m2)
Distribution centre space excludes parking and yard space.
Sales per store (R000)
Sales Number of stores
Sales for Shield, CellShack and Kangela are excluded as they do not have stores.
Sales per FTE (R000)
Sales FTEs
Sales per trading m2 (R000)
Sales Trading m2
Sales for Shield, CellShack, Saverite and Kangela are excluded as they do not have stores.
Net asset turn
Sales Net assets
The Group defines net assets as total equity and interest-bearing LT liabilities.
Gross margin (%)
Gross profit Sales
Operating margin (%)
Operating profit Sales
Trading profit before interest and taxation margin (%)
Trading profit before interest and taxation
Sales
EBITDA margin (%)
EBITDA Sales
Effective tax rate (%)
Taxation Profit before tax
The tax rate reconciliation
can be found on p51
Return on average shareholders’ equity (%)
Headline earningsAverage of opening and closing
equity attributable to equity holders of the parent
Return on capital employed (%)
Operating profit before asset impairments
Average of opening and closing capital employed balances
The Group defines capital employed as the average of opening and closing equity
Return on invested capital (%)
Adjusted operating profit Average invested capital
Adjusted operating profit includes finance income and adds back depreciation, amortisation and occupancy costs.
Average invested capital is average total assets of continuing operations plus average accumulated depreciation and amortisation less average accounts payable less average accrued liabilities plus occupancy costs x8.
Debt: Equity (%)
Average debt Average of opening and closing
equity attributable to equity holders of the parent
Debt comprises non-current interest-bearing liabilities.
Cash earnings cover
Operating cash flow per share Headline earnings per share
Net cash to total equity (%)
Cash and cash equivalents, net of borrowings
Total equity at the end of the financial year
Current ratio
Current assets Current liabilities
Quick ratio
Current assets excluding inventory Current liabilities
136 Shareholder information: Notes to the form of proxy 137Massmart Integrated Annual Report 2015
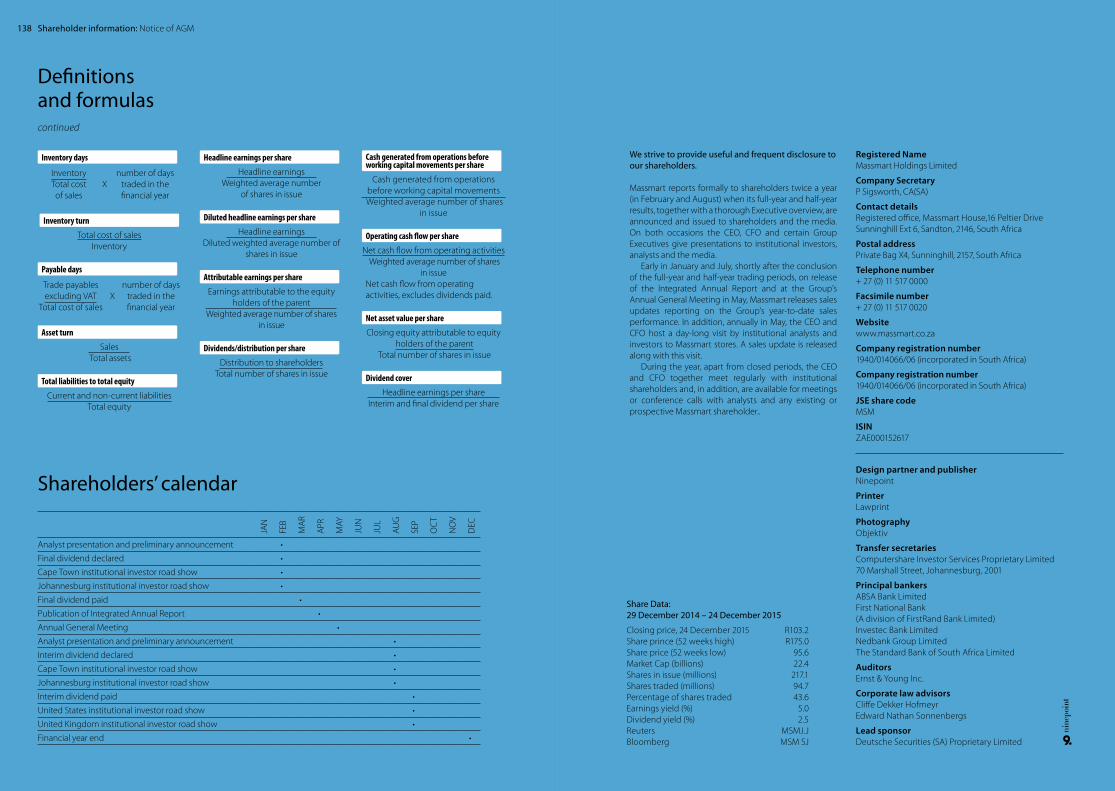
Definitions and formulascontinued
We strive to provide useful and frequent disclosure to our shareholders.
Massmart reports formally to shareholders twice a year (in February and August) when its full-year and half-year results, together with a thorough Executive overview, are announced and issued to shareholders and the media. On both occasions the CEO, CFO and certain Group Executives give presentations to institutional investors, analysts and the media.
Early in January and July, shortly after the conclusion of the full-year and half-year trading periods, on release of the Integrated Annual Report and at the Group’s Annual General Meeting in May, Massmart releases sales updates reporting on the Group’s year-to-date sales performance. In addition, annually in May, the CEO and CFO host a day-long visit by institutional analysts and investors to Massmart stores. A sales update is released along with this visit.
During the year, apart from closed periods, the CEO and CFO together meet regularly with institutional shareholders and, in addition, are available for meetings or conference calls with analysts and any existing or prospective Massmart shareholder..
Registered NameMassmart Holdings Limited
Company SecretaryP Sigsworth, CA(SA)
Contact details Registered office, Massmart House,16 Peltier Drive Sunninghill Ext 6, Sandton, 2146, South Africa
Postal addressPrivate Bag X4, Sunninghill, 2157, South Africa
Telephone number + 27 (0) 11 517 0000
Facsimile number + 27 (0) 11 517 0020
Website www.massmart.co.za
Company registration number 1940/014066/06 (incorporated in South Africa)
Company registration number 1940/014066/06 (incorporated in South Africa)
JSE share code MSM
ISIN ZAE000152617
Design partner and publisherNinepoint
PrinterLawprint
PhotographyObjektiv
Transfer secretariesComputershare Investor Services Proprietary Limited70 Marshall Street, Johannesburg, 2001
Principal bankers ABSA Bank LimitedFirst National Bank (A division of FirstRand Bank Limited) Investec Bank LimitedNedbank Group Limited The Standard Bank of South Africa Limited
AuditorsErnst & Young Inc.
Corporate law advisors Cliffe Dekker HofmeyrEdward Nathan Sonnenbergs
Lead sponsorDeutsche Securities (SA) Proprietary Limited
Share Data: 29 December 2014 – 24 December 2015
Closing price, 24 December 2015 R103.2Share prince (52 weeks high) R175.0Share price (52 weeks low) 95.6Market Cap (billions) 22.4Shares in issue (millions) 217.1Shares traded (millions) 94.7Percentage of shares traded 43.6Earnings yield (%) 5.0Dividend yield (%) 2.5Reuters MSMJ.JBloomberg MSM SJ
Inventory days
Inventory Total cost of sales
Xnumber of days
traded in the financial year
Inventory turn
Total cost of sales Inventory
Payable days
Trade payables excluding VAT
Total cost of salesX
number of days traded in the financial year
Asset turn
Sales Total assets
Total liabilities to total equity
Current and non-current liabilities Total equity
Headline earnings per share
Headline earnings Weighted average number
of shares in issue
Diluted headline earnings per share
Headline earnings Diluted weighted average number of
shares in issue
Attributable earnings per share
Earnings attributable to the equity holders of the parent
Weighted average number of shares in issue
Dividends/distribution per share
Distribution to shareholders Total number of shares in issue
Cash generated from operations before working capital movements per share
Cash generated from operations before working capital movements
Weighted average number of shares in issue
Operating cash flow per share
Net cash flow from operating activities Weighted average number of shares
in issueNet cash flow from operating activities, excludes dividends paid.
Net asset value per share
Closing equity attributable to equity holders of the parent
Total number of shares in issue
Dividend cover
Headline earnings per share Interim and final dividend per share
JAN
FEB
MA
R
APR
MAY
JUN
JUL
AUG
SEP
OC
T
NO
V
DEC
Analyst presentation and preliminary announcement •
Final dividend declared •
Cape Town institutional investor road show •
Johannesburg institutional investor road show •
Final dividend paid •
Publication of Integrated Annual Report •
Annual General Meeting •
Analyst presentation and preliminary announcement •
Interim dividend declared •
Cape Town institutional investor road show •
Johannesburg institutional investor road show •
Interim dividend paid •
United States institutional investor road show •
United Kingdom institutional investor road show •
Financial year end •
Shareholders’ calendar
138 Shareholder information: Notice of AGM

www.massmart.co.zawww.massmart.co.za/iar2015
Massmart values your feedbackDo you have any questions or suggestions regarding Massmart’s Integrated Annual Report 2015? Email: [email protected]