saurashtra university - core · saurashtra university ... most organizations used only financial...
TRANSCRIPT

Saurashtra University Re – Accredited Grade ‘B’ by NAAC (CGPA 2.93)
Ramanuj, Nandkumjar K., 2012, “Measuring the total performance of Reliance
Communications - through balanced scorecard”, thesis PhD, Saurashtra
University
http://etheses.saurashtrauniversity.edu/id/eprint/760 Copyright and moral rights for this thesis are retained by the author A copy can be downloaded for personal non-commercial research or study, without prior permission or charge. This thesis cannot be reproduced or quoted extensively from without first obtaining permission in writing from the Author. The content must not be changed in any way or sold commercially in any format or medium without the formal permission of the Author When referring to this work, full bibliographic details including the author, title, awarding institution and date of the thesis must be given.
Saurashtra University Theses Service http://etheses.saurashtrauniversity.edu
© The Author

i
“MEASURING THE TOTAL PERFORMANCE OF
RELIANCE COMMUNICATIONS –THROUGH
BALANCED SCORECARD”
:: SUBMITTED TO::
SAURASHTRA UNIVERSITY
FOR THE AWARD OF THE DEGREE OF
DOCTOR OF PHILOSOPHY
UNDER THE FACULTY OF MANAGEMENT
BY
NANDKUMAR K. RAMANUJ
(Registration No.: 3830 Dated: 28th February 2008)
UNDER THE SUPERVISION OF
Dr. HITESH J. SHUKLA
PROFESSOR
DEPARTMENT OF BUSINESS MANAGEMENT
SAURASHTRA UNIVERSITY, RAJKOT – 360 005
INDIA
May - 2012

ii
Structure of The Thesis
Certificate by The Guide iii
Declaration by Research Scholar iv
Acknowledgement v
Executive Summary vi
List of Abbreviations xi
Contents xiii
List of Tables xiv
Details of Thesis 1-254
Annexure: Questionnaire i-vi

iii
Certificate by The Guide
This is to certify that Mr. Nandkumar K. Ramanuj has carried out the
research study as presented in this thesis under my supervision and the
presentation is his contribution. It is a standard piece of work, which
embraces a fresh approach towards analysis and interpretation of facts,
which provides the candidate’s capacity for critical examination and sound
judgment over the problem studies by him.
He has devoted himself to the conduct of this research study under my
guidance and supervision as per the stipulated norms of Saurashtra
University, and this work has not been submitted for the award of any
degree to any other university.
Date:
Place: Rajkot DR. HITESH J. SHUKLA
Professor,
Department of Business Management,
MBA Program,
Saurashtra University,
Rajkot – 360 005

iv
Declaration by Research Scholar
I, the undersigned Mr. Nandkumar K. Ramanuj, a research student of
Doctor of Philosophy, Department of Business Management, Saurashtra
University, Rajkot here by declare that the research work embodied in this
thesis is the outcome of my endeavor and it was supervised by Dr. Hitesh J.
Shukla, Professor, Department of Business Management, Saurashtra
University, Rajkot.
I further declare that this thesis not in any form has been submitted to any
other institution of higher learning for the award of any degree or diploma.
Date: Nandkumar K. Ramanuj
Place: Rajkot

v
Acknowledgement
First of all, I acknowledge the grace of God, to make me always charged whenever my strength goes down.
How can I express my sincere and informal thanks to my guide, really there is no word or there are no words that to say heartily “Thanks” to my guide Dr. Hitesh J Shukla, Professor, Department of Business Management, Saurashtra University, Rajkot. I have really no meaning of subject without his continuous, valuable and strong conceptual base guidance. No doubt it was my dream to reach to this level but there was only hope, he is the only person who has shown me real path and ladder to reach to the level of this kind and generated learning desire in me. His ability to motivate me and make me understand about such difficult and current topic has triggered my desire of undertaking research. I am really thankful for his guidance.
I would like to express my deep sense and guidance to Prof. Pratapsinh L.Chauhan, Professor, Department of Business Management, Saurashtra University, Rajkot. Prof. D C Gohil, Head, Department of Commerce and Business Administration, Saurashtra University, Rajkot and Dr. Sanjay J. Bhayani, Professor, Department of Business Management, Saurashtra University.
I am indeed thankful to all members of Reliance Communications. I have received due support from Mr.Ruchir Vyas (General Manager) and Mr. Kaushik Thakker (Sr. Manager) from RCOM. I thank my all colleagues and team members of Reliance Communications, with whom I have worked. I thank to Dr. Haresh Tank, for his support in analysis.
I am also thankful to my parents, wife, son, sisters and brothers without their kind support this cannot be possible.
Nandkumar K. Ramanuj

vi
Executive Summary
In today’s competitive environment, markets are becoming more
international, dynamic and customer-driven. Customers are demanding
more variety, and better quality and service, including both reliability and
faster delivery. To achieve this, companies require innovative methods of
performance measurement.
Performance measurement is a mean of assessing progress against stated
goals and objectives in a way that is unbiased and quantifiable. It is a
process of developing indicators that report on the accomplishment and
progress of the organization. It includes both the setting of targets for
designed performance and review of performance against these targets.
There are four purposes of performance measurement as follow: (1) to
gauge success in achieving goals.(2) to provide recommendations for
organizational change.(3) to give feedback to management.(4) to assess
internal inputs and outcomes.
The performance measurement systems have been mainly on the design of
different types of such systems where measurement frameworks have been
advocated to have specific key characteristics in helping organizations
identify appropriate measurement sets in assessing their performance.
Before 1990, most organizations used only financial measures or indicators
for the performance measurement. But financial data typically reflect an
organization’s past performance. Therefore, they may not accurately
represent the current state of the organization or what is likely to happen to
vii
the organization in the future. Traditional financial measures do not cover
intangible assets, but the management of intangible assets such as skills and
knowledge of employees, customer relationship, and innovative process
became the major sources of competitive advantage.
Consequently, there have been various attempts to solve this problem by
developing new performance measurement techniques, such as Strategic
Measurement and Reporting Technique – SMART (Lynch and Cross,
1991), the Balanced Scorecard (Kaplan and Norton, 1992) and the European
and Foundation for Quality Management’s (EFQM) Excellence Model
(Lewis, 1999).
The Balanced scorecard retains the traditional financial measures and
complements them with measures that are drivers of future performance.
The objectives and measures of the scorecard are derived from an
organizations vision and strategy and these view organizational performance
from four perspectives: financial, customer, internal business process and
learning and growth. These four perspectives provide the framework for the
Balanced Scorecard.
The first chapter gives an overview of performance measurement system
and Balanced Scorecard. It discusses objectives of performance
measurement system, a review of major reference model in performance
measurement system and why Balanced Scorecard as a total performance
management system. Finally the chapter describes about Balanced
Scorecard, evolution of the concept, definitions, approaches and criticism of
viii
the Balanced Scorecard. The chapter also contains Balanced Scorecard
application in the industry and BSC is used by Fortune 500 companies.
The second chapter is about the telecom industry and Reliance
Communications. It discusses global telecom industry, current scenario of
global telecom industry and Indian telecom industry. History of Indian
telecom industry from first operational land lines in year 1851 to launched
3G service in year 2011. There is growth story of Indian telecom industry,
subscriber growth during the past decade (2000-2010) and details of major
telecom players in India. This chapter also contains about Reliance
Communications from starting phase to current position of the company.
The third chapter is about research plan and procedure. It includes the
research problem, review of literature and objectives of the study. The
broader objective of the study is to measure total performance of Reliance
Communications through Balanced Scorecard, which is sub divided into; (1)
To Measure Customer Perspective of RCOM, (2) To Measure Learning and
Growth Perspective of RCOM, (3) To Measure Internal Business Process
Perspective of RCOM and (4) To Measure Financial Perspective of RCOM.
Researcher has used primary and secondary data. This data is collected from
various sources especially from published annual reports of the sample
company and structured questionnaire. The period for measurement of
financial performance is from FY 2006-07 to 2010-11 and other related data
are collected through structured questionnaire filled up by customers and
employees of Reliance Communications respectively at Mumbai and
working at head quarter (Mumbai). The collected data are then classified

ix
and used statistical tools like F-test, T-test and Chi-square technique was
used.
The forth chapter analyses customer perspective measurement of RCOM.
Based on structure questionnaire, collect the data from 317 RCOM
customers at Mumbai city for measuring customer satisfaction score.
Hypotheses are also tested using various techniques.
The fifth chapter analyses learning and growth perspective and internal
business process perspective measurement of RCOM. Based on structure
questionnaire, collect the data from 100 employees of RCOM working at
head quarter Mumbai for measuring job satisfaction score and
organizational perception score. Hypotheses are also tested using various
techniques. Hypotheses are also tested using various techniques.
The sixth chapter is about the measuring financial performance RCOM. The
researcher has considered key financial performance indicator for measure
financial performance. Key indicators are Return on Asset, Return on
Equity, Return on Investment, Earnings per Share and Market value of the
firm.
The seventh chapter is overall summary, findings and conclusion. Finally
researcher provides Balanced Scorecard of Reliance Communications. The
chapter also contains study of customer perspective, study of learning and
growth perspective, study of internal business process and study of financial

x
perspective. Finally the chapter describes overall conclusion of the study.
As an outcome of the study the researcher provides Balanced Scorecard of
RCOM as below:
RELIANCE COMMUNICATIONS LIMITED FINANCIAL PERSPECTIVE
STRATEGIC OBJECTIVE STRETEGIC MEASURE PERFORMANCE
By 2015, be amongst the top 3 most valued
Indian companies
ROA 189.81% ROE 6.16% ROI 5.68% EPS 9.24
Market Value Rs. 56762.81 cr
CUSTOMER PERSPECTIVE STRATEGIC OBJECTIVE STRETEGIC MEASURE PERFORMANCE
Customer experience Customer Satisfaction Score 76%
LEARNING AND GROWTH PERSPECTIVE STRATEGIC OBJECTIVE STRETEGIC MEASURE PERFORMANCE
Employees centercity Job Satisfaction Score 76%
Organizational Perception Score 75%
INTERNAL BUSINESS PROCESS PERSPECTIVE STRATEGIC OBJECTIVE STRETEGIC MEASURE PERFORMANCE
Customer experience
Connection with good voice quality 98.14% Resolution of billing / charging / validity
complaints 100% Accessibility of call center / customer care 95.23%

xi
List of Abbreviations
VAS : Value Added Service
WAP : Wireless Application Protocol
DoT : Department of Telecom
TRAI : Telecom Regulatory Authority of India
EPS : Earning Per Share
RCOM: Reliance Communications
IRT : Indian Radio Telegraph Company
PTT : Post, Telephone and Telegraph
VSNL : Videsh Sanchar Nigam Limited
MTNL: Mahanagar Telephone Nigam Limited
BSNL : Bharat Sanchar Nigam Limited
NTP : National Telecommunications Policy
GSM : Global System for Mobile Communications
CDMA: Code Division Multiple Access
COAL : Cellular Operators Association of India
GCC : Global Calling Card
WLL: Wireless Local Loop
VPN: Virtual Private Network
NLD: National Long Distance
WAN: Wide Area Network
ISP: Internet Service Provider
WI-Fi: Wireless Fidelity

xii
DEL: Direct Exchange Line
FDI: Foreign Direct Investment
IP: Internet Protocol
VAS: Value Added Services
VASP: Value Added Services Provider
SMS: Short Message Service
xiii
Contents
Titles Page No.
Chapter : 1 Performance Measurement System 01 - 63
Chapter : 2 Telecom Industry and Reliance Communications 64 - 130
Chapter : 3 Research Plan and Procedure 131 - 151
Chapter : 4 Customer Perspective Measurement 152 - 170
Chapter : 5 Learning and Growth and Internal Business Process 171 - 206
Perspective Measurement.
Chapter : 6 Financial Perspective Measurement 207 - 227
Chapter : 7 Summary, Findings and Conclusion 228 - 242
Bibliography 243 - 254
Annexure i - vi

xiv
List of Tables
Table
No.
Particulars Page No.
2.1 Quick Facts 77 2.2 Yearly Revenue of Indian Telecom Industry 77 2.3 Financial Performance of RCOM 114 4.1 Age Group of RCOM Customers 154 4.2 Occupation of Customers 155 4.3 Sex of Customers 156 4.4 Information about Customer Satisfaction Level 157 4.5 Age and Customers’ Satisfaction 160 4.6 Occupation and Customers’ satisfaction 162 4.7 Gender and Customers’ Satisfaction 164 4.8 Types of Mobile Technology and Customer’s Satisfaction 165 4.9 Types of Mobile Connection and Customers’ Satisfaction 167 4.10 Time Period of Mobile Connection and Customers’
Satisfaction 169
5.1 Departments wise Employees in RCOM 174 5.2 Designation wise Employees in RCOM 175 5.3 Level wise Employees in RCOM 175 5.4 Educational Qualification of RCOM Employees 176 5.5 Length of service of RCOM Employees 177 5.6 Marital status of RCOM Employees 178 5.7 Information about Employees’ Job Satisfaction Level 180 5.8 Age and Employees’ satisfaction 182 5.9 Department and Employees’ satisfaction 183 5.10 Designation and Job satisfaction 185 5.11 Educational qualification and Job satisfaction 187 5.12 Length of services and job satisfaction 189 5.13 Information about employees’ Organizational Perception
Level 192
5.14 Age and Organizational Perception 194 5.15 Department and Organizational Perception 196 5.16 Designation and organizational Perception 198 5.17 Educational qualification and Organizational Perception 200 5.18 Length of Services and Organizational Perception 202 5.19 Strategic measures and Benchmark 205 5.20 Strategic measures and Performance of RCOM 206 6.1 Trends of Return on Assets 210 6.2 Trends of Return on Equity 214

xv
6.3 Trends of Return on Investment 217 6.4 Trends of Earnings per Share 221 6.5 Trend of Market Value 224 7.1 Balanced Scorecard of RCOM 230

Chapter: 1 Performance Measurement System
[ 1 ]
Chapter 1
Performance Measurement System
1.1 Performance Measurement: Introduction
• Performance measurement from management literature and understanding
1.2 Performance Measurement System
• Objective of performance measurement system • A review of major reference model in performance
measurement system • Different types of performance measurement tools • Balanced Scorecard as a total performance
measurement system
1.3 Balanced Scorecard: An Understanding
• Evolution of the concept • Definitions • The Balanced Scorecard approaches • The Balanced Scorecard as a measurement & management
system • The Balanced Scorecard as a medium for communication • Criticism of the Balanced Scorecard • Balanced Scorecard application in the industry
1.4 Conclusion References

Chapter: 1 Performance Measurement System
[ 2 ]
1.1 PERFORMANCE MEASUREMENT: INTRODUCTION
The concept of performance measurement is straight forward: you
get what you measure, and you cannot manage a system unless
you measure it.
The U.S.General Accounting Office (GAO) provides the
following definition: 1
“Performance measurement is the ongoing monitoring and
reporting of program accomplishments, particularly progress
towards pre-established goals. It is typically conducted by
program or agency Management. Performance measures may
address the type or level of program activities conducted (Process),
the direct products and services delivered by a program (outputs),
and/or the results of those Products and services (outcomes). A
Program may be any activity, project, function, or policy that has
an identifiable purpose or set of objectives”.
Moullin defined performance measurement: 2
“Performance measurement is evaluating how well organizations
are managed and the value they deliver for customers and other
stakeholders”

Chapter: 1 Performance Measurement System
[ 3 ]
In definition “evaluating how well” means not only measuring but
also making a judgment. In order to evaluate performance we need
not only to measure it but also to know the context in which that
performance has been achieved. Performance measurement can be
considered a sort of primary process and can be part of larger and
different processes: we measure performance to evaluate the
performance of the organization inside, to evaluate the
performance from outside, and to manage the performance. So the
aims of performance measurement could be quite different.
For years organizations have sought ways to effectively measure
their performance against plan and to then clearly understand the
meaning and cause for any resulting variances. Over time this
requirement has been transformed from ad hoc approaches to the
development and adoption of formal methodologies for
performance measurement. Performance measures are tools to
understand, manage, and improve organization activities.
Effective performance measures can know as:
• How well we are doing? (Correct process representation);
• Are we meeting our goals? (Identification of the goals and
the reference standards);

Chapter: 1 Performance Measurement System
[ 4 ]
• Are our customers satisfied? (Control of the process
development);
• Are our processes in control? (Control organization
effectiveness and efficiency parameters);
• Where improvements are necessary? (Identification and
correction of problems).
They provide us the information necessary to make intelligent
decisions about what we do. A performance measure is composed
of a number and a unit of measure. The number gives us a
magnitude (how much) and the unit gives the number a meaning
(what). Performance measures are always tied to a goal or an
objective (the target).
• PERFORMANCE MEASUREMENT FROM
MANAGEMENT LITERATURE AND
UNDERSTANDING 3
Despite the importance of accurately measuring organizational
performance in most areas of academic research, there have been
very few studies that have directly addressed the question of how
overall organizational performance is or should be measured.
Perhaps more importantly, none of these studies seems to have
Chapter: 1 Performance Measurement System
[ 5 ]
significantly influenced how overall organizational performance is
actually measured in most of the empirical research that uses this
construct as dependent measures.
In total, seven empirical studies on the measurement of
organizational performance were identified during this study: Dess
and Robinson (1984), Rawley and Lipson (1985), Chakravarthy
(1986), Venkatraman and Ramanujam (1987), Brush and
Vanderwerf (1992), Robinson (1995) and Murphy et al. (1996). A
brief study of the same is as under.
DESS AND ROBINSON’S RESEARCH4
Dess and Robinson examined the usefulness of subjective
performance measures, specifically; they investigated the
relationship between objective and subjective measures of return
on assets (ROA), growth in sales and global performance
measures. This study involved three phases of data collection from
26 manufacturing organizations using onsite interviews of CEOs
mail surveys of the top management teams and a mail survey of
CEOs. Conclusions were drawn from examining the zero-order
correlations between the six variables of interest.
Dess and Robonson found that top management’s subjective
evaluation of performance was highly correlated with objective

Chapter: 1 Performance Measurement System
[ 6 ]
measures, suggesting that researchers may consider using
subjective perceptual measures of ROA and sales growth under
certain conditions. The conditions include when objective
measures are not available and when the alternative is to remove
the consideration of performance from the research design.
Another finding reported in the study was that there is some
evidence that the global measures of organizational performance
overlap with subjective and objective measures of ROA and sales
growth. However, the amount of unshared variance between the
constructs implies that the global measures may capture some
broader conceptualization of performance. In other words, there
are more dimensions to overall organizational performance than
ROA and sales growth.
RAWLEY AND LIPSON’S RESEARCH 5
Rawley and Lipson examined the relationships among several
combinations of performance measures to demonstrate that
different common measures of financial performance did not
represent the same attributes. Of these comparisons, the only
overall performance measures that they found to be related to each
other at statistically significant levels were the Q ratio versus cash
flow return on investment. The other measures that compared

Chapter: 1 Performance Measurement System
[ 7 ]
were clearly discriminate and do not measure the same construct.
The Q Ratio was proposed by Callard and kleinman (1985) as a
substitute for Tobin’s Q, and is calculated as the ratio of the value
of individual business units divided by the inflation-adjusted
purchase cost of assets.
CHAKRAVARTHY’S RESEARCH 6
Chakravarthy empirically compared seven exemplar firms with
seven ‘maladapted’ firms in the computer industry, as determined
by corporate reputation. The criteria for selecting the samples
were criteria proposed by Peters and Waterman (1982)7 for
excellent firms. Chakravatthy’s hypothesized that the means of the
two groups, excellent and non-excellent firms, would differ along
common measures of performance. Accordingly, those measures
of performance that demonstrated that the means of the two
groups were statistically different would be the best measures of
performance for use in strategic management research.
VENKATRAMAN AND RAMANUJAM’S RESEARCH 8
Venkatraman and Ramanujam’s empirically examined the degree
of convergence across methods of measuring business economic
performance and in so doing demonstrated the sales growth, profit
growth and profitability were discriminate measures of different

Chapter: 1 Performance Measurement System
[ 8 ]
dimensions of business economic performance. The purpose of
this study was not to empirically derive the best measures of
business economic performance in the context of the variables
selected by researchers, but rather to test the convergence of
methods used to obtain data on business economic performance.
BRUSH AND VANDERWERF’S RESEARCH9
Brush and Vanderwerf’ sexamined 34 different studies in the
entrepreneurship literature that explicitly used firm performance
as the dependent variable. They found that 35 different measures
of performance were used in those studies. The indicated that
researchers perceived many different dimensions of performance,
and that there was no agreement on what measures actually
represent overall organizational performance. The most frequently
used measures of performance were changes in sales,
organizational survival, changes in number of employees and
profitability. Multiple objective measures were much more
frequently employed that were subjective or perceptual measures
of performance. Further, the primary means of data collection was
mail survey, and the primary sources of performance information
were managers, executives, founders or owners.

Chapter: 1 Performance Measurement System
[ 9 ]
Brush and Vanderwerf conclude by stating that they did not
attempt to sort out the problem of which performance measures to
use. They note that the fact that 35 different performance
measures were used in just 34 studies indicates that more work
needs to be done to identify measures that make sense for use
across the studies.
ROBINSON’S RESEARCH10
Robinson examined ten different new venture performance
measures to determine which individual measure was the most
effective in accurately assessing long-term economic value
creation. Each of performance measures were calculated for the
three year period.
MURPHY, TRAILER AND HILL’S RESEARCH 11
Murphy examined the variables used to measure organizational
performance in entrepreneurship research in the years 1987-1993.
They identified 51 articles published in the Academy of
Management Journal, the American Journal of small Business,
Entrepreneurship Theory and practice, the Journal of Business
venturing and the strategic Management Journal that explicitly
used firm performance as dependent variables. They identified 71
different dependent variables used to measure performance in their
Chapter: 1 Performance Measurement System
[ 10 ]
sample. They subsequently categorized these variables into eight
separate dimensions of performance. They also found that 75
percent of the sample articles used primary data sources, 29
percent used secondary data sources and only 6 percent used both.
The high dependence upon primary data sources is typical in
entrepreneurship research, since there were generally no publicly
available financial data sources for non-public companies.
Another finding was that the performance variables used were
primarily financial rather that operational.
1.2 PERFORMANCE MEASUREMENT SYSTEMS
The performance measurement systems have been mainly on the
design of different types of such systems where measurement
frameworks have been advocated to have specific key
characteristics in helping organizations identify appropriate
measurement sets in assessing their performance. Such
frameworks include the use of a) strategy, b) measuring both
tangible and intangible factors to build a balanced view of the
organization, c) multi-dimensional systems reflecting all areas of
performance, d) systems encouraging comparisons between goals
and actions, and e) monitoring past and future performance.12
Chapter: 1 Performance Measurement System
[ 11 ]
There is consensus among researchers that performance measures
enable managers to best know their exact position in terms current
enterprise progress towards attainment of vision, mission and
strategy. Researchers also state that an organization’s strategy and
performance measures must be in alignment for performance
measurement systems to succeed. This alignment occurs when
senior managers are able to convey the company’s mission and
vision, values and strategic direction effectively to employees and
other external stakeholders thus giving life to those mission and
strategy and making each employee aware of how much they
contribute to the success of the company and its stakeholders’
measurable expectation.13
According to some authors, performance measures can be broken
down into a number of individual performance measures and can
be generally categorized into one of the following: effectiveness,
efficiency, quality, timeliness, productivity, reliability, price,
flexibility and safety.14 However, the importance lies in
positioning performance measures in a strategic context as they
influence what people do.7 According to the authors, literature on
performance measures is diverse with each individual author
Chapter: 1 Performance Measurement System
[ 12 ]
tending to focus on different aspects of performance measurement
system design.
• OBJECTIVE OF PERFORMANCE MEASUREMENT
SYSTEM
1. Performance measurement system improves the bottom line by
reducing process cost and improving productivity and mission
effectiveness.
2. A performance measurement system allows an agency to align
its strategic activities to the strategic plan.
3. Measurement of process efficiency provides a rational basis for
selecting what business process improvements to make first.
4. Performance measurement system allows managers to identify
best practices in an organization and expand their usage
elsewhere.
5. The visibility provided by a measurement system supports
better and faster budget decisions and control of processes in the
organization. This means it can reduce risk.
6. Visibility provides accountability and incentives based on real
data, not anecdotes and subjective judgments. This serves for
reinforcement and the motivation that comes from competition.
Chapter: 1 Performance Measurement System
[ 13 ]
7. It permits benchmarking of process performance against outside
organizations.
8. Collection of process cost data for many past projects allows us
to learn how to estimate costs more accurately for future projects.
9. If you are in a US Federal agency, it’s the law. The Government
Performance and Results Act of 199315 require a strategic plan,
and a method of measuring the performance of strategic
initiatives.
10. Performance measurement system can raise you
agency’s score, which can serve to increase its long-term chances
of survival.
• A REVIEW OF THE MAJOR REFERENCE MODELS IN
PERFORMANCE MEASUREMENT SYSTEM 16
Developing a performance system, you should consider a
conceptual reference model. Experience has shown that a
reference model is particularly important when you are beginning
to develop a measurement system for the first time. In literature,
you can find different approaches. Following are some of
reference models

Chapter: 1 Performance Measurement System
[ 14 ]
THE BALANCED SCORECARD METHOD 17
In 1992, Robert Kaplan and David Norton introduced the
Balanced Scorecard concepts as a way of motivating and
measuring an organization’s performance. The concept takes a
systematic approach in assessing internal results, while probing
the external environment. It focuses as much on the process of
arriving at successful results, as on the results themselves.
The method looks at four interconnected perspective (Dimensions).
These are:
• Financial – How do we look to our stakeholders?
• Customer – How well do we satisfy our internal and external
customer’s needs?
• Internal Business process: How well do we perform at key internal
business processes?
• Learning and Growth: Are we able to sustain innovation, change,
and continuous improvement?
The Balanced scorecard provides a way for management to look at
the well-being of their organization from the four identified
perspectives. Each perspective is directly linked to performance
targets.

Chapter: 1 Performance Measurement System
[ 15 ]
THE “CRITICAL FEW” METHOD 18
Managing too many indicators may produce different drawbacks:
(1) losing sight of all the indicator impact (2) distracting
management’s focus from those indicators that are the most
critical to organizational success, (3) no identifying the
correlation/influence between two indicators. The process of
simplifying and distilling a large number of performance measures
across the organization to select a “Critical few” should be viewed
as part of the performance measurement process.
The selection of a critical few set of performance indicators
highlights the need for a balance between internal and external
requirements, as well as financial and non financial measures.
PERFORMANCE DASHBOARDS19
A performance dashboard is an executive information system that
synthetically captures the performance level of a system. The
concept of the basis of performance dashboards is that being good
leader is like driving a car. After all, there are not many gauges on
the dashboard. While you are driving, you take note of the level of
fuel, you watch the water level, and if an emergency light were to
come on, you would notice that as well. These all are secondary

Chapter: 1 Performance Measurement System
[ 16 ]
observations, however, to the Driver’s primary focus of moving
the car safely in one direction while watching for obstacles in the
road, including other drivers.
That is exactly what a good leader in an organization should be
doing. A balanced set of performance indicators is like the gauges
on the car; the mission is the destination’. Each of these gauges
represents an aggregation of measures, which give an overall
indicator of the performance. For example, the temperature gauge
could represent customer satisfaction. It is an indicator made up of
several components, the number of last costumers, firm reputation,
etc.
THE EFQM (EUROPEAN FOUNDATION FOR QUALITY
MANAGEMENT) MODEL 20
The European Foundation for Quality Management (EFQM) is a
membership based not for profit organization, created in 1988 by
fourteen leading European businesses. Its mission was to be the
driving force for sustainable excellence in Europe concerning
Quality management.
The EFQM model can be used to assess an organization’s
progress towards excellence, independently of the organization’s
type, size, structure and maturity. The model is a no prescriptive

Chapter: 1 Performance Measurement System
[ 17 ]
framework and recognizes there are many approaches to achieving
sustainable excellence in all aspects of performance. The model is
based on nine criteria (dimensions). Five of these are classified as
‘Enablers’ and four as ‘Results’. The ‘Enabler’ criteria cover what
an organization does; the ‘Result’ criteria what an organization
achieves. Feedback from ‘Results’ help to improve ‘Enablers’.
• DIFFERENT TYPES OF PERFORMANCE
MEASUREMENT TOOLS:
Description –“Approaches are Performance Efforts Depending On
How They Are Used”. Any or all of the following approaches will
improve organizational performance depending on if they are
implemented comprehensively and remain focused on
organizational results. Some of the following, e.g., organizational
learning and knowledge management, might be interpreted more
as movements than organization performance strategies because
there are wide interpretations of the concepts, not all of which
include focusing on achieving top-level organizational results.
However, if these two concepts are instilled across the
organization and focus on organizational results, they contribute
strongly to organizational performance. On the other hand, the

Chapter: 1 Performance Measurement System
[ 18 ]
Balanced Scorecard is deliberately designed to be comprehensive
and focused on organizational results.
Balanced Scorecard: Focuses on four indicators, including
customer perspective, internal-business processes, learning and
growth and financials, to monitor progress toward organization's
strategic goals
Benchmarking: Using standard measurements in a service or
industry for comparison to other organizations in order to gain
perspective on organizational performance. For example, there are
emerging standard benchmarks for universities, hospitals, etc. In
and of itself, this is not an overall comprehensive process assured
to improve performance; rather the results from benchmark
comparisons can be used in more overall processes.
Benchmarking is often perceived as a quality initiative.
Business Process Reengineering: Aims to increase performance
by radically re-designing the organization's structures and
processes, including by starting over from the ground up.
Continuous Improvement: Focuses on improving customer
satisfaction through continuous and incremental improvements to
processes, including by removing unnecessary activities and
Chapter: 1 Performance Measurement System
[ 19 ]
variations. Continuous improvement is often perceived as a
quality initiative.
Cultural Change: Cultural change is a form of organizational
transformation, that is, radical and fundamental form of change.
Cultural change involves changing the basic values, norms, beliefs,
etc., among members of the organization.
ISO-9000: Is an internationally recognized standard of quality,
and includes guidelines to accomplish the ISO-9000 standard.
Organizations can be optionally audited to earn ISO9000
certification. Another major quality standard is the Baldridge
Award. ISO-9000 is a quality initiative.
Knowledge Management: Focuses on collection and
management of critical knowledge in an organization to increase
its capacity for achieving results. Knowledge management often
includes extensive use of computer technology. In and of itself,
this is not an overall comprehensive process assured to improve
performance. Its effectiveness toward reaching overall results for
the organization depends on how well the enhanced, critical
knowledge is applied in the organization.
Talent Management: Talent management is a complex collection
of connected HR processes that delivers a simple fundamental
Chapter: 1 Performance Measurement System
[ 20 ]
benefit for any organization. Talent management refers to the
skills of attracting highly skilled workers, of integrating new
workers, and developing and retaining current workers to meet
current and future business objectives. Talent management in this
context does not refer to the management of entertainers.
Companies engaging in a talent management strategy shift the
responsibility of employees from the human resources department
to all managers throughout the organization. The process of
attracting and retaining profitable employees, as it is increasingly
more competitive between firms and of strategic importance, has
come to be known as "the war for talent." Talent management is
also known as HCM (Human Capital Management).
Learning Organization: Focuses on enhancing organizations
systems (including people) to increase an organization's capacity
for performance. Includes extensive use of principles of systems
theory. In and of it, this is not an overall comprehensive process
assured to improve performance. Its effectiveness toward reaching
overall results for the organization depends on how well the
enhanced ability to learn is applied in the organization.
Management by Objectives (MBO): Aims to align goals and
subordinate objectives throughout the organization. Ideally,

Chapter: 1 Performance Measurement System
[ 21 ]
employees get strong input to identifying their objectives, time
lines for completion, etc. Includes ongoing tracking and feedback
in process to reach objectives. MBO's are often perceived as a
form of planning.
Outcome-Based Evaluation (particularly for nonprofits):
Outcomes-based evaluation is increasingly used, particularly by
nonprofit organizations, to assess the impact of their services and
products on their target communities. The process includes
identifying preferred outcomes to accomplish with a certain target
market, associate indicators as measures for each of those
outcomes and then carry out the measures to assess the extent of
outcomes reached.
Program Evaluation: Program evaluation is used for a wide
variety of applications, e.g., to increase efficiencies of program
processes and thereby cut costs, to assess if program goals were
reached or not, to quality programs for accreditation, etc.
Strategic Planning: Organization-wide process to identify
strategic direction, including vision, mission, values and overall
goals. Direction is pursued by implementing associated action
plans, including multi-level goals, objectives, time lines and

Chapter: 1 Performance Measurement System
[ 22 ]
responsibilities. Strategic planning is, of course, a form of
planning.
Total Quality Management (TQM): Set of management
practices throughout the organization to ensure the organization
consistently meets or exceeds customer requirements. Strong
focus on process measurement and controls as means of
continuous improvement. TQM is a quality initiative.
Total Productive Management (TPM): TPM is a systematic
approach to eliminate waste associated with production equipment
and machinery. TPM focuses on involving machine operator in
the routine checks and cleaning of the machine to detect problems
earlier. Other areas of emphasis include minimizing machine
"downtime" resulting from unexpected breakdowns, fully utilizing
a machine's capabilities, and tracking life cycle cost. TPM is a
maintenance process developed for improving productivity by
making processes more reliable and less wasteful. TPM is an
extension of TQM (Total Quality Management). The objective of
TPM is to maintain the plant or equipment in good condition
without interfering the daily process. To achieve this objective,
preventive and predictive maintenance is required

Chapter: 1 Performance Measurement System
[ 23 ]
• BALANCED SCORECARD AS A TOTAL
PERFORMANCE MANAGEMENT SYSTEM 21
Many of above improvement models have yielded disappointing
results. The models are often fragmented. They may not be linked
to the organization’s strategy, not to achieving specific financial
and economic outcomes. Breakthroughs in performance require
major change, and that includes changes in the measurement and
management system used by an organization. Navigating to a
more competitive, technological and capability – driven future
cannot be accomplished merely by monitoring and controlling
financial measures of a past performance.
Financial accounting model should have been expanded to
incorporate the valuation of a company’s intangible and
intellectual asset, such as high-quality products and services,
motivated and skilled employees, responsive and predictable
internal processes, and satisfied and loyal customers. Such a
valuation of intangible assets and company capabilities would be
especially helpful since for information age companies, these
assets are more critical to success than traditional physical and
tangible assets. If tangible assets and company capabilities could
be valued within the financial accounting model, organization that
Chapter: 1 Performance Measurement System
[ 24 ]
enhanced these assets and capabilities could communicate this
improvement to employee, shareholders, creditors, and
communities.
The collision between the irresistible force to build long-range
competitive capabilities and the immovable object of the
historical-cost financial accounting model has created a new
synthesis: Balanced Scorecard. The Balanced Scorecard retains
traditional financial measures. But financial measures tell the story
of past events, an adequate story for industrial age companies for
which investments in long term capabilities and customer
relationship was not critical for success. These financial measures
are inadequate, however, for guiding and evaluating the journey
that information age companies must make to create future value
through investment in customer, suppliers, employees, processes,
technology and innovation.
The Balanced Scorecard complements financial measures of past
performance with measures of the drivers of future performance.
The objectives and measures of the scorecard are derived from an
organization’s vision and strategy.

Chapter: 1 Performance Measurement System
[ 25 ]
1.3 BALANCED SCORECARD: AN UNDERSTANDING
• EVOLUTION OF THE CONCEPT
Understanding how the concept of the BSC evolved is helpful in
appreciating the thought process of researchers in this field and
how the BSC evolved in scope. The Balanced Scorecard builds on
some key concepts of management ideas of the past such as the
Total Quality Management (TQM) approach, customer defined
quality, continuous improvement, employee empowerment as well
as the basing of management and feedback on measurement
(Balanced Scorecard Institute, 2007).22 Originating with the work
of the American statistician Edwards Deming, the TQM approach
encompasses employees and suppliers as well as customers and
creates an organization committed to continuous improvement.
Quality improvement is achieved through the statistical control
and the reduction in variability of business processes. According
to the Total Quality Management approach, quality involves
everyone and all activities in an organization; must meet agreed
requirements, both formal and informal at the lowest cost, first
time and every time; and quality must be managed.23
The basic idea of the Balanced Scorecard by Kaplan and Norton
(1992)24 was simple and straightforward. Kaplan and Norton

Chapter: 1 Performance Measurement System
[ 26 ]
argued that ‘what you measure is what you get’ and that ‘an
organization’s measurement system strongly affected the
behaviors of its managers and employees’. The evolution of the
concept of Balanced Scorecard from a rather radical performance
measurement tool to a comprehensive strategic management tool
can be understood from the four Harvard Business Review articles
published by Norton and Kaplan in 1992, 1993, 1994 and 1996.25
According to Norton and Kaplan, the traditional financial
accounting measures (eg. ROI and EPS) can give misleading
signals for continuous improvement and innovation. To defy the
heavy reliance on financial accounting measures, the authors
argued that senior managers establish a scorecard taking multiple
measures into account. The authors proposed a scorecard that used
both financial and non-financial metrics in measuring performance
of organizations. They also focused on how managers might
identify the best measures in each of the four perspectives and
how to communicate it within the organization. Figure 1.1 shows a
diagrammatic representation of Kaplan and Norton's original
Balanced Scorecard design, based on that which appears in their
1992 article.

Chapter: 1 Performance Measurement System
[ 27 ]
Figure No. 1.1
(Source: Robert S. Kaplan and David P. Norton, The Balanced
Scorecard – Harvard Business Review, January-February, 1992)
Kaplan and Norton have gradually refined a methodology that
seeks to align a balanced set of measures to an organization's
strategy. They use a top down method that emphasizes starting
with the executive team and defining the organization's strategic
goals, and then passing those goals downward, using the Balanced
Scorecard. They argue that success results from a Strategy-
Focused Organization, which, in turn, results from Strategy Maps
and Balanced Scorecards. Figure 1.2 shows provide an overview
of a strategy map. Kaplan and Norton claim that this generic map
reflects a generalization of their work with a large number of

Chapter: 1 Performance Measurement System
[ 28 ]
companies for whom they have developed specific strategy maps.
Notice that the four sets of Balanced Scorecard measures are now
arranged in a hierarchical fashion, with financial measures at the
top, driven by customer measures, which are, in turn, the result of
Internal (Process) Measures, and are supported by innovation and
learning measures.
Figure No. 1.2
Strategy Map
(Source: Strategy Maps by Robert S. Kaplan and David P. Norton,
September 2004)

Chapter: 1 Performance Measurement System
[ 29 ]
Some authors refer to this Balance Scorecard as the ‘1st
Generation Balanced Scorecard’ (Lawrie and Cobbold, 2004).26
According Lawrie and Cobbold, Kaplan and Norton’s design of
the 1st Generation Balanced Scorecard had the following attributes;
a) a mixture of financial and non-financial measures, b) a limited
number of measures, c) measures clustered into four groups called
perspectives, d) measures that are chosen relate to specific goals
which are usually documented in tables with one or more
measures associated with each goal, e) measures chosen in a way
that gains the active endorsement of the senior managers of the
organization and, f) some attempt to represent causality between
performance driver (lead) measures and outcome (lag) measures.
Figure 1.3 illustrates a scorecard of a hypothetical company
discussed in Kaplan and Norton’s January-February 1992 article,
Electronic Circuits Inc (ECI)

Chapter: 1 Performance Measurement System
[ 30 ]
ECI’S BALANCED BUSINESS SCORECARD27
Figure No. 1.3
(Source: Business Process Trends, 2003)
The idea of the Balanced Scorecard came at a time when there was
an emphasis on business process re-engineering and taking
measurements, but with no specific directions as to how to
accomplish it. The Balanced Scorecard was thus well received
and accepted among business gurus as a tool to align strategies,
processes and measures (Harmon, 2003).28 The Balanced
Scorecard approach rapidly grew into a minor industry with the

Chapter: 1 Performance Measurement System
[ 31 ]
authors continuing to write articles and later went on to publish
two books.
In course of time the Balanced Scorecard evolved from a simple
performance measurement framework to a full strategic planning
and management system with the capability of transforming an
organization’s strategic plan from a mere passive document to a
set of daily actions. In their article in the Harvard Business
Review in 1993, Kaplan and Norton offered an overview on
linking the Balanced Scorecard to corporate strategies. An
overview of the proposed approach is given in figure No. 1.4.
Figure No. 1.4
Linking Strategies to Balanced Scorecard Measures
(Source: Business Process Trends, 2003)
Chapter: 1 Performance Measurement System
[ 32 ]
In 1996 Kaplan and Norton proposed that the Balanced Scorecard
be used as a strategic management system supporting four
management processes namely (Kaplan and Norton, Harvard
Business Review 1996).29
a) Translating the vision of the organization – the Balanced
Scorecard forced managers to further clarify their vision until they
were able to translate their vision into a set of objectives and
operational measures on a scorecard,
b) Communicating and linking strategy – communicating the strategy
within the organization and educating those responsible to execute
it. The strategy must be translated into measurable goals and
performance measures linked to rewards before it can be executed,
c) Business planning process – strategic initiatives are identified in
order to achieve long term objectives and necessary resources
allocated to those initiatives,
d) Feedback and learning process – these are strategies based on
assumptions of cause-and-effect relationships. Feedback is
gathered and hypothesis on which strategy is based is revisited and
necessary changes made (Veltman, 2005).30

Chapter: 1 Performance Measurement System
[ 33 ]
In the year 2000, Kaplan and Norton31 published an HBR article
and a book in which they suggest what they term “Balanced
Scorecard Strategy Maps.” The new hierarchical model which
suggested that “some measures contribute to others and are
summed up in shareholder value” has been looked at as rather
dubious by some authors (Harmon, 2003).32 According to Harmon,
the new model placed financial measures at the top of the
hierarchy resulting in increasing reliance on financial measures by
senior management, while delegating other non-financial,
supportive measures, to subordinates at lower management.
Harmon argues that the continual elaboration of the simple idea of
the balanced scorecard has resulted in it gradually escaping the
control of its authors and that it should have been tied more
closely to processes.
Lawrie and Cobbold (2004)33 refer to these Balanced Scorecards
as the 2nd Generation Balanced Scorecard. According to the
authors, two key enhancements were made by Kaplan and Norton
to the 1st Generation Balanced Scorecard; a) measures relating to
specific strategic objectives were chosen with the aim of
identifying about 20-25 strategic objectives of which each were
associated with one or more measures and assigned to one of the

Chapter: 1 Performance Measurement System
[ 34 ]
four perspectives, b) attempts were made to visually document the
major causal relationships between strategic objectives and laying
out the results in a 'strategic linkage model' or 'strategy map
diagram’.
According to Kaplan and Norton (Harvard Business School Press,
2001)34
“The evolution from balanced scorecard to strategic balanced
scorecard results from a desire to achieve a revitalized strategic
focus and alignment. This process is supported by five common
principles: (i) translate the strategy to operational terms, (ii) align
the organization to the strategy, (iii) make strategy everyone’s
everyday job; (iv) make strategy a continual process, and (v)
mobilize change through executive leadership.”
The frame work not only provided performance measurements,
but helped planners identify what should be done and how it can
be measured, thus enabling senior management to clarify their
vision and truly execute their strategies. By presenting an
innovative management perspective that can be used to translate
strategies for growth into operational terms, the balanced
scorecard presented a comprehensive and actionable theory of
governance.(Hepworth, P, 1998)35

Chapter: 1 Performance Measurement System
[ 35 ]
Further, using the basic Balanced Scorecard concepts to build an
independent process performance measurement system is easier.
Consider the basic Balanced Scorecard. It suggests that companies
should consider additional measures beyond financial measures.
Most companies that have Balanced Scorecard initiatives have
created a strategy level scorecard with financial, customer, process
and learning and growth goals / measures. In a similar way, most
companies have created a hierarchy of scorecards, including
division or department scorecards and scorecards for specific
functional units and managers. Logically, one should be able to
track the goals and measures from the organization's scorecard to
the functional unit's scorecard and on down to the specific activity.
At each level, the same scorecard that describes the goals and
measures for the unit can also serve to describe how the manager
responsible for that unit is to be evaluated. Most organizations that
have adopted the Balanced Scorecard approach have put this
overall alignment structure in place. (See Figure No. 1.5)

Chapter: 1 Performance Measurement System
[ 36 ]
Figure No. 1.5
The Beginnings of an Aligned Balanced Scorecard System
(Source: Business Process Trends, 2007)
• DEFINITIONS
Several definitions of the Balanced Scorecard can be found in the
literature with some variations in scope. Williams, Haka and
Bettner (2004)36 define:
“The Balanced Scorecard as “a system for performance
measurement that links a company’s strategy to specific goals and
objectives, provides measures for assessing progress toward those
goals, and indicates specific initiatives to achieve those goals.”
Chapter: 1 Performance Measurement System
[ 37 ]
The Balanced Scorecard Institute defines it as “a strategic
planning and management system used to align business activities
to the vision and strategy of the organization, improve internal and
external communications, and monitor organizational performance
against strategic goals.” According to McNamara, “the Balanced
Scorecard is a performance management approach that focuses on
various overall performance indicators, often including customer
perspective, internal-business processes, learning and growth and
financials, to monitor progress toward organization's strategic
goals.” There is consensus in the literature that the Balanced
Scorecard is a performance management and measurement system
that is used in the strategic planning and the achievement of
strategic goals.
According to Bourne and Bourne (2007)37 the Balanced Scorecard,
which started as a simple framework in 1992 to help companies
structure their performance measures, rapidly gained popularity
over the years and has now been developed into a much more
encompassing strategic management and measurement tool. As
per the authors, the Balanced Scorecard measures the activities,
processes and output that are important to the success of the
organization.

Chapter: 1 Performance Measurement System
[ 38 ]
• THE BALANCED SCORECARD APPROACHES 38
The collision between the irresistible force to build long-range
competitive capabilities and the immovable object of the
historical-cost financial accounting model has created a new
synthesis: the Balanced Scorecard. The Balanced Scorecard
retains traditional financial measures, but financial measures tell
the story of past events, an adequate story of industrial age
companies for which investments in long term capabilities and
customer relationship were not critical for success. These financial
measures are inadequate, however, for guiding and evaluating the
journey that information age companies must make to create
future value through investment in customer, suppliers, employees,
processes, technology and innovation.
The Balanced Scorecard complements financial measures of past
performance with measures of the drivers of future performance.
The objectives and measures of the scorecard are derived from an
organization’s vision and strategy. The objectives and measures
view organizational performance from four perspectives: financial,
customer, internal business process, and learning and growth.
These four perspectives provide the framework for the Balanced
Scorecard (Figure 1.5). The Balanced Scorecard provides

Chapter: 1 Performance Measurement System
[ 39 ]
executives with a comprehensive framework that translates a
company’s vision and strategy into a coherent set of performance
measures. The BSC emphasizes that financial and non-financial
measures must be part of the information system for employees at
all levels of the organization. Front-line employees must
understand the financial consequences of their decision and
actions: senior executives must understand the drivers of long-
term financial success. The objectives and the measures for the
Balanced Scorecard are more than just a somewhat adhoc
collection of financial and no financial performance measures;
they are derived from top-down process driven by mission and
strategy of the business unit. The Balanced Scorecard should
translate a business unit’s mission and strategy into tangible
objectives and measures. The measures represent a balance
between external measures for shareholders and customers, and
internal measures of critical business processes, innovation, and
learning and growth. The BSC should be used as a communicative,
informing, and learning system, and not as a controlling system.
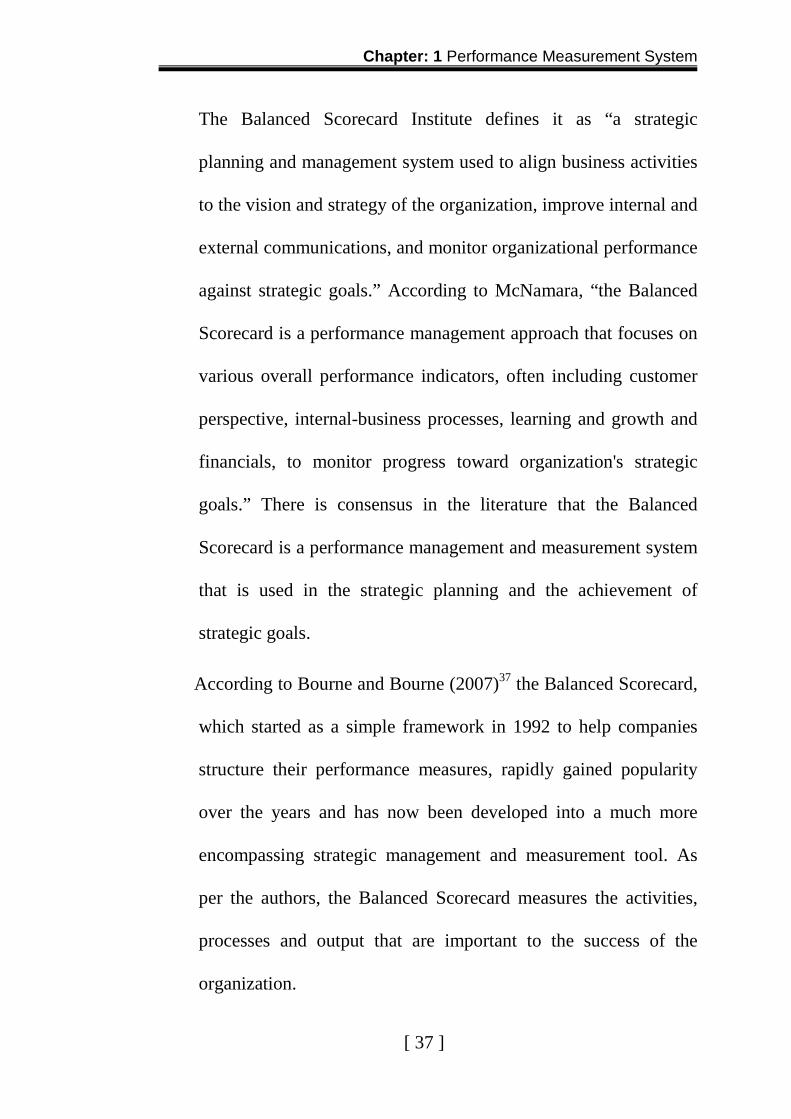
The four perspectives of scorecard permit a Balance between short
and long-term objectives between outcomes desired and the
Chapter: 1 Performance Measurement System
[ 40 ]
performance drivers of those outcomes, and between hard
objectives measures and softer, more subjective measures.
Figure No. 1.6
(Source: The Balanced Scorecard Framework, Kaplan and Norton 1996)
(1) FINANCIAL PERSPECTIVE
The BSC retains the financial perspective since financial measures
are valuable in summarizing the readily measurable economic
consequences of actions already taken. Financial performance
measures indicate whether a company’s strategy, implementation,

Chapter: 1 Performance Measurement System
[ 41 ]
and execution are contributing to bottom line improvement.
Financial objective typically relate to profitability – measured, for
example, by operating income, return-on-capital employed, or,
more recently, economic value-added. Alternative financial
objectives can be rapid sales growth or generation of cash flow.
(2) CUSTOMER PERSPECTIVE
In the customer perspective of the Balanced Scorecard, managers
identify the customer and market segments in which the business
unit will compete and the measures of the business unit’s
performance in these targeted segments. This perspective typically
includes several core or generic measures of the successful
outcomes from a well-formulated and implemented strategy. The
core outcome measures include customer satisfaction, customer
retention, new customer acquisition, customer profitability, and
market and account share in targeted segments. But the customer
perspective should include specific measures of the value
propositions that the company will deliver to customers in targeted
market segments. The segment-specific drivers of core customer
outcomes represent those factors that are critical for customers to
switch to or remain loyal to their suppliers.
Chapter: 1 Performance Measurement System
[ 42 ]
(3) INTERNAL-BUSINESS-PROCESS PERSPECTIVE
In the internal-business-process perspective, executives identify
the critical internal processes in which the organization must excel.
These processes enable the business unit to:
• Deliver the value propositions that will attract and retain
customers in targeted market segments
• Satisfy shareholders expectations of excellent returns.
The internal-business-process measures focus on the internal
processes that will have the greatest impact on customer
satisfaction and achieving an organization’s financial objectives.
The internal-business-process perspective reveals two
fundamentals differences between traditional and the BSC
approaches to performance measurement. Traditional approaches
attempt to monitor and improve existing business processes. They
may go beyond financial measures of performance by
incorporating quality and time-based metrics. But they still focus
on improvements existing processes. The scorecard approach,
however, will usually identify entirely new processes at which an
organization must excel to meet customer and financial objectives.
For example, a company may realize that it must develop a
Chapter: 1 Performance Measurement System
[ 43 ]
process to anticipate customer needs or one to deliver new
services that target customer’s value. The BSC internal business-
process objectives highlight the processes, several of which it may
not be currently be performing at all, that are most critical for an
organization’s strategy to succeed.
(4) LEARNING AND GROWTH PERSPECTIVE
The fourth perspective of the Balanced Scorecard, learning and
growth, identifies the infrastructure that the organization must
build to create long-term growth and improvement. The customer
and internal-business-process perspectives identify the factors
most critical for current and future success. Businesses are
unlikely to be able to meet their long-term targets for customers
and internal processes using today’s technologies and capabilities.
Also, intense global competition requires that companies
continually improve their capabilities for delivering value to
customers and shareholders.
Organizational learning and growth come from three principal
sources: people, system, and organizational procedures, the
financial, customer, and internal-business-process objectives on
the Balanced Scorecard typically will reveal large gaps between
the existing capabilities of people, system, and procedures and

Chapter: 1 Performance Measurement System
[ 44 ]
what will be required to achieve breakthrough performance. To
close these gaps, businesses will have to invest in re-skilling
employees, enhancing information technology and systems, and
aligning organizational procedures and routines. These objectives
are articulated in the learning and growth perspective of the
Balanced Scorecard.
Kaplan argues that eventually, the balanced scorecard evolved
from an innovative measurement system into a proven
management system. The balanced scorecard was developed as an
innovative business performance measurement system in the
belief that the existing approach to performance measurement
relied primarily on financial measures and was becoming obsolete.
The new approach (the balanced scorecard) was able to
incorporate the intangible or ‘soft’ factors that were previously
immeasurable and had little value to managers, thus reflecting a
balance between short term and long-term goals, tangible and
intangible measures, lagging and leading indicators, as well as
external and internal performance perspectives. It also has the
ability to identify linkages between key business areas and exploit
the linkages that deliver success (Hepworth, 1998).39 According to
Bloomquist and Yeager (2008)40, an effectively used balanced

Chapter: 1 Performance Measurement System
[ 45 ]
scorecard can serve as a component of a measurement-based
strategic management and learning system which can be used to
further the organization’s ability to achieve its strategic objectives.
The authors state that the development of the scorecard itself
should form part of the strategic planning process with the focus
on the full range of issues facing the organization.
There is a tendency to confuse between and also use
interchangeably the terms scorecards and dashboards. There are
differences in the context in which they are applied and main
difference between the two is that "scorecards chart progress
toward strategic objectives" while "dashboards monitor and
measure processes." According to Schmidt (2005)41, dashboard
applications grew out of the need to automate the balanced
scorecard processes used by organizations to define their goals
and quantify, measure, monitor, and report progress over time.
The balanced scorecard and its natural subset, the dashboard, can
help keep managers focused on the critical areas that affect a
hospital's overall performance (O Cleverley and O Cleverley,
2005).42

Chapter: 1 Performance Measurement System
[ 46 ]
• THE BALANCED SCORECARD AS A MEDIUM FOR
COMMUNICATION
According to Artley and Stroh (2001)43, document the key role
played by effective internal and external communications in
successful performance measurement. Executives use the
measures on a Balanced Scorecard to articulate the strategy of a
business, communicate the strategy and thereby help align
individual, organizational, and cross departmental objectives to
achieve a common goal. In this way the Balanced Scorecard is a
means of communication, information, and learning that puts the
business strategy at the center. A properly deployed Balanced
Scorecard can act as an organization wide communication
platform (Amaratunga, Sarshar, and Baldry 2000).44 This view is
shared by Pieper in his statement that in healthcare organizations,
the use of balances scorecards can enhance communication with
key stakeholder groups from consumers to employees. The author
also states that the lack of communication within an organization
can have serious implications on the effectiveness of the balanced
scorecard. According to Shulver and Antarkar45, “the Scorecard
framework, and the processes associated with Scorecard design
are more fundamentally concerned with communication and

Chapter: 1 Performance Measurement System
[ 47 ]
articulation of strategy at operational levels.” The need for clear
and timely communication in medical care and the problems of
poor communication have been documented by Wicks, Clair and
Kinney (2007).46 It is important that information is made freely
and easily available to anyone within the company through
internal communication and technological tools that make
communication easier (Smith and kim).47
Kocakülâh and Austill (2007)48 state that in measuring
performance, there are many financial tools and applications to
choose from, but there are very few tools, that can view the
organization holistically and strategically. Holistically viewing the
organization enables a better understanding of what is happening
both inside and outside of the organization. The use of the
balanced scorecard as a holistic methodology in converting an
organization's vision and strategy into a comprehensive set of
linked performance and action measures that provide the basis for
successful strategic measurement and management has been
documented. Designing a BSC forces management to look at the
organization holistically, as part of a larger system, and to
determine which factors are critical for success, thereby helping to
clarify assumptions and build a shared vision. The inability to

Chapter: 1 Performance Measurement System
[ 48 ]
view the organization holistically can result in difficulties in
implementing the balanced scorecard. This holistic viewing of the
organization makes it conceptually appealing and applicable in the
healthcare sector (Ashton).49
• CRITICISMS OF THE BALANCED SCORECARD
Several authors have criticized the top-down approach to
implementing the BSC as a less democratic and rather
commanding approach to performance management. The BSC
methodology has inconsistencies and the arbitrary nature of the
framework results in crucial measures being almost inevitably
overlooked. The author continues to say that the BSC lacks a
theoretical framework to guide executive input resulting in
managers being left to their own devices. Another criticism of the
BSC is that the scores are not based on any proven economic or
financial theory, which makes the BSC process entirely subjective
with no provision to assess quantities like risk and economic value
in a way that is actuarially or economically well founded (Jensen,
2001).50 Jensen states that the BSC does not provide a bottom line
score or a unified view with any clear recommendations and hence
must be viewed simply as a list of metrics.

Chapter: 1 Performance Measurement System
[ 49 ]
Common pitfalls of the BSC have also been highlighted by
authors. These include a) the lack of a well-defined strategy, b)
only using lagging indicators and c) adopting generic metrics used
by other firms. Other potential pitfalls include overlooking costs
over benefits of initiatives placed in the BSC, ignoring non-
financial measures when evaluating employees, using too many
measures, wrongly assuming that cause-and-effect linkages are
precise rather than hypothetical, seeking improvements across all
measures all the time and using only objective measures and
ignoring subjective measures.
Furthermore, over reliance on measures of any type may hamper
the application of tacit knowledge and wisdom. With heavily
regulated measures, management is restricted in its use of tacit
knowledge, as it must justify its decisions by reference to
measures. These problems can be avoided simply by not tying
measures to performance, and by using measures as guide rather
than a straitjacket. However, problems with the BSC model go
deeper.
Another criticism of the BSC model is its complexity, the time and
cost required for its implementation compared to its “low ease of
use.” The complexity and difficulty lie in the choice of effective
Chapter: 1 Performance Measurement System
[ 50 ]
measures. Performance measures to be effective they have to be
reliable and consistent with the actions of the unit, and with the
short-and long-term goals of the whole organization. Finding
measures that are specific to the unit, yet general enough to reflect
the strategy of the organization, and that incorporate long and
short-term views seems to be too optimistic.
• BALANCED SCORECARD APPLICATION IN THE
INDUSTRY
There is widespread acceptance among researchers and
practitioners from different management disciplines that the use of
the Balanced Scorecard approach will help organizations build a
comprehensive view of its performance and that the balanced
scorecard methodology will enable organizations to clarify their
vision and strategy and translate them into action. The BSC has
been successfully applied across many diverse industries within
the private and public sector in the USA and is slowly gaining
ground in the UK and across an international audience (Hepworth,
1998)23. A modified form of the BSC is being used by the Swedish
National Audit Office51 which is built around four focal points
namely; internal (process focus), external (customer focus),
historical (results focus) and future (development focus). Several

Chapter: 1 Performance Measurement System
[ 51 ]
Australian agencies have successfully adopted the BSC approach
in the private and public sector including the Department of
Defense. In discussing the applicability of the BSC concept in the
public sector have documented examples of several successful
applications of the BSC approach in the public sector. Despite its
benefits, there are also barriers to its effective use in the public
sector (Field, Buchbach and Weert, 2007).52
The BSC is used by more than 70% of the Fortune 500 companies.
Additionally, numerous studies and BSC implementations have
proven the effectiveness of the BSC.53 For example,
• Mobil Oil (North America) increased cash flow by $1.2 billion
and return on investment from 6% to 16% between years 2 and 5
after implementing the BSC. Within 2 years of implementing the
BSC, Mobil moved from last place in industry profitability to first
place. Mobil North America held that first place position for 5
straight years, before it was acquired by Exxon.
• United Parcel Service (UPS) increased revenues by 9% and
net income by 33% within two years after BSC
implementation.
• Three years after implementing the BSC, Wells Fargo Bank
increased its customer base by 450% and was rated the Best

Chapter: 1 Performance Measurement System
[ 52 ]
Online Bank. Also, as a result of the BSC implementation,
the company added 750,000 online customers over a 2-year
period and decreased its costs per customer by 22%.
• Chemical Bank increased its group company profits 20-fold
over a 4-year period after implementing the BSC. The
Chemical Bank vice-chairman, Michael Hegarty54stated:
“The Balanced Scorecard has become an integral part of our
change management process, enablingus to look beyond
financial measures and concentrate on factors that create
economic value: quality, organizational learning, and focus
in gon customers. The scorecard has delivered on our major
goals in communication, teamwork, learning, and
commitment.”
• The world famous advertising firm Saatchi and Saatchi55
achieved a five-fold increase in market capitalization to
$2.5 billion within 3 years of implementing the BSC. The
company—which won major awards at the Cannes
International Advertising Festival, the leading industry
benchmark—was ranked as the #1 creative agency 2 years
in a row after implementing the BSC. William H.
Cochrane,56 Chief Financial Officer, stated:

Chapter: 1 Performance Measurement System
[ 53 ]
“The balanced scorecard has not only helped us manage our
human capital, it has transformed our agencies into being action-
oriented and client-focused. And it has put everyone in the same
ballpark with a consistent definition of what we call ‘permanently
infatuated clients’ and consistency in measures.”
• Texaco Refining and Marketing increased profitability by $29
million in 1 year—a 1,500% return on investment from their BSC
initiative. Al Derden,57 Director of Quality and Productivity,
stated: “If we truly believed that the only difference between our
competition and ourselves was our people, then we had to find a
way to tap into what Federal Express CEO Frederick W. Smith
described as ‘discretionary effort.” Texaco used the BSC
Methodology’s five principles for creating a strategy focused
organization to mobilize and focus this “discretionary effort.”
•Siemens IC mobile increased sales 76% to euro 9 billion within 1
year of BSC implementation. Rudi Lamprecht, member of the
managing board at Siemens AG and President of Siemens IC
Mobile, 58 stated: “We’ve always had strategies, but through the
Balanced Scorecard we bring them to life.”
ACCORDING TO ASHTON (1998),59

Chapter: 1 Performance Measurement System
[ 54 ]
“Three factors make us believe that this [BSC] management tool
can contribute substantial value to healthcare organizations. Firstly,
many instances of successful application in service organizations.
Second, the approach of developing an integrated set of
performance measures is conceptually appealing and would seem
to be consistent with the thrust of viewing organizations in a
holistic fashion. Third, both top-level healthcare administrators
and laboratory administrators who participated in our survey
uniformly reported that they see great potential value from
implementing this approach in their organizations.”
1.4 CONCLUSION
In conclusion, chapter one provided a brief review of literature
related to our research. This brief chapter also provided a
conceptualized frame of reference for the study. The aim of this
chapter was to select relevant theories and concepts that will be
used in research.
To assess the impact to financial and non-financial perspectives on
performance, the approach here is look at the flow in terms of the
cause-and-effect framework. That is an organizations with proper
learning and growth structures is to able to empower its employees
to deliver efficient services, which in term create satisfied
Chapter: 1 Performance Measurement System
[ 55 ]
customer, which will result into strong financial performance. This
can be summarized below as:
1. Knowledge & skills employees is the foundation of all innovations
and improvements;
2. Skilled and empowered employees will improve the way they
work;
3. Improved work processes will lead to increased customer
satisfaction; and
4. Increased customer satisfaction will lead to better financial results.

Chapter: 1 Performance Measurement System
[ 56 ]
REFERENCES
1. www.gao.gov/about/index.html
2. FabrizioBocci – Bocci consulting – [email protected]
3. Fiorenzo Franceschini, Maurizio Galetto, Domenico Maisano,
“Management by measurement” p. 109.
4. Dess, G. G., and Robinson, R. 1984. “Measuring Organizational
Performance in the Absence of Objective Measures: The Case of
the Privately-Held Firm and Conglomerate Business Unit.”
Strategic Management Journal, 5: 265–273.
5. Fiorenzo Franceschini, Maurizio Galetto, Domenico Maisano,
“Management by measurement” p. 111.
6. IBID
7. Peters and Waterman, 1982, “ Industrial Management”,
8. Venkatraman, N., and Ramanujam, V. 1987. “Measurement of
Business Economic Performance: An Examination of Method
Convergence.” Journal of Management, 13: 109–122.
9. Brush, Candida G.; Vanderwerf, Pieter A. (1992): “A Comparison
of Methods and Sources for Obtaining Estimates of New Venture
Performance”, Journal of Business Venturing, 7,157-170.
Chapter: 1 Performance Measurement System
[ 57 ]
10. Fiorenzo Franceschini, Maurizio Galetto, Domenico Maisano,
“Management by measurement” p. 112.
11. IBID
12. Fitzgerald, L. and Moon, P. (1996). Performance Measurement in
Service Industries: Making it Work. London: The Chartered
Institute of Management Accountants.
13. Artley, W. and Stroh, A. (2001). The Performance-Based
Management Handbook: Establishing an Integrated Performance
Measurement System. Retrieved April 9, 2008-
14. Leong, G.K., Snyder, D.L. and Ward, P.T. (1990). Research in the
process and content of manufacturing strategy. OMEGA
International Journal of Management Science, 18 (2), 109-22.
15. www.usa.gov/directory/federal/index.shtml
16. Performance – based management special interest – Group 2001
17. Kaplan, R. S. and Norton, D. P (1992). The Balanced Scorecard -
Measures that Drive Performance. Harvard Business Review,
January - February.
18. The Critical Few Method – http://book.personalmba.com/critical-
few/

Chapter: 1 Performance Measurement System
[ 58 ]
19. Performance Dashboards: Measuring, Monitoring and Managing
your Business by Wayne W. Eckerson
20. www.efqm.org/en/tabid/
21. Rampersad, H.K., Total Performance Scorecard; Redefining
Management to Achieve Performance with Integrity, Butterworth-
Heinemann Business Books, Elsevier Science, Massachusetts,
May 2003.
22. www.balancedscorecard.org
23. Brevis, T., Ngambi, H.C., Vrba, M.J. & Naicker, K.S. (2002).
Management principles: A contemporary edition for Africa (P.J.
Smit & G.J.de J. Cronje, Eds.). Cape Town: Juta Academic.
24. Kaplan, R. S. and Norton, D. P.(1992). The Balanced Scorecard -
Measures that Drive Performance. Harvard Business Review,
January - February.
25. Kaplan, R. S. and Norton, D. P. (1996). Using the Balanced
Scorecard as a Strategic Management System. Harvard Business
Review, January – February, 75-85.
26. Lawrie, G. and Cobbold, I. (2004). Development of the 3rd
Generation Balanced Scorecard: Evolution of the Balanced
Chapter: 1 Performance Measurement System
[ 59 ]
Scorecard into an effective strategic performance management
tool. Retrieved April 6, 2008,
27. Business Process Trends, 2003.
28. Harmon, P. (2003). The evolution of the balanced scorecard.
Business process trends. Retrieved April 5, 2008.
29. Kaplan, R. S. and Norton, D. P. (1996). Using the Balanced
Scorecard as a Strategic Management System. Harvard Business
Review, January – February, 75-85.
30. Veltman, M. (2005). Balanced Scorecard. Retrieved April 5, 2008.
31. Kaplan, R. S. and Norton, D. P. (2000). Balanced Scorecard
Strategy Maps. Harvard Business Review.
32. Harmon, P. (2003). The evolution of the balanced scorecard.
Business process trends. Retrieved April 5, 2008.
33. Lawrie, G. and Cobbold, I. (2004). Development of the 3rd
Generation Balanced Scorecard: Evolution of the Balanced
Scorecard into an effective strategic performance management
tool. Retrieved April 6, 2008.
34. Kaplan, R. S. and Norton, D. P. (2001). The Strategy Focused
Organization. Harvard Business School Press.
Chapter: 1 Performance Measurement System
[ 60 ]
35. Hepworth, P. (1998). Weighing it up - a literature review for the
balanced scorecard. The Journal of Management Development, 17
(8), 559.
36. Williams, J. R., Haka, S. F. and Bettner, M.S. (2005). Financial
and Managerial Accounting: the basis for business decisions.
London: McGraw-Hill.
37. Bourne, M. & Bourne, P. (2007). Instant Manager: Balanced
Scorecard. London: Hodder Arnold.
38. Anthony, R. N. and Govindarajan, V. (2000). Management
Control Systems. London: McGraw Hill Higher Education.
39. Hepworth, P. (1998). Weighing it up - a literature review for the
balanced scorecard. The Journal of Management Development, 17
(8), 559.
40. Bloomquist. P. and Yeager, J. (2008). Using Balanced Scorecards
to Align Organizational Strategies. Healthcare Executive, Jan/Feb,
23 (1), 24-26, 28.
41. Schmidt, C. (2005). The Driver's View. The Internal Auditor, 62
(3), 29-31.
Chapter: 1 Performance Measurement System
[ 61 ]
42. O Cleverley, W. and O Cleverley, J. (2005). Scorecards and
dashboards: using financial metrics to improve performance.
Healthcare Financial Management, 59 (7), 64-69.
43. Artley, W. and Stroh, A. (2001). The Performance-Based
Management Handbook: Establishing an Integrated Performance
Measurement System. Retrieved April 9, 2008.
44. Amaratunga,D.,Baldry, D. & Sarshar, M. (2000). Performance
evaluation in facilities management: Using the Balanced
Scorecard Approach. COBRA 2000 Conference, University of
Greenwich, 30 August to 1 September. Retreived March 18, 2008.
45. Shulver, M. and Antarkar, N. (2001). The Balanced Scorecard as a
Communication Protocol for Managing Across Intra-
Organizational Borders. Proceedings of the Twelfth Annual
Conference of the Production and O Perations Management
Society, Orlando.
46. Wicks, A. M., St Clair, L. and Kinney, C. S. (2007). Competing
Values in Healthcare: Balancing the (Un) Balanced
Scorecard/Practitioner Application. Journal of Healthcare
Management, Sep/Oct, 52 (5), 309-323; discussion 323-324.

Chapter: 1 Performance Measurement System
[ 62 ]
47. Smith, H. And Kim, I. (2005). Balanced scorecard at Summa
health system. The Journal of Corporate Accounting & Finance,
16 (5), 65-72.
48. Kocakülâh, M.C. and Austill, A.D. (2007). Balanced Scorecard
Application in the Health Care Industry: A Case Study. Journal of
Health Care Finance, 34 (1), 72-99.
49. Ashton, C. (1998). Balanced scorecard benefits NatWest Bank.
Human Resource Management International Digest, 6 (3), 11-13.
50. Jensen, M.C. (2001). Value Maximization, Stakeholder Theory,
and the Corporate Objective Function. Journal of Applied
Corporate Finance, 14 (3).
51. www.nao.org.uk/idoc.ash
52. Field, T., Buchbach, R. and Weert, A.V. (2007). Literature review:
measuring compliance effectiveness: Balanced scorecard.
Australian Taxation Office, Australian Government. Retrieved
April 12, 2008.
53. http://www.balancedscorecard.org/bscresources/examplessuccesss
tories/tabid/57/default.aspx
54. IBID
55. http://www.saatchi.com/about_saatchi_and_saatchi

Chapter: 1 Performance Measurement System
[ 63 ]
56. http://www.balancedscorecard.org/bscresources/examplessuccesss
tories/tabid/57/default.aspx
57. IBID
58. Harvard Business Publishing Newsletters, 2002 3 pages, by
Lauren Keller Johnson
59. Ashton, C. (1998). Balanced scorecard benefits NatWest Bank.
Human Resource Management International Digest, 6 (3), 11-13.

Chapter: 2 Telecom Industry and Reliance Communication
64
Chapter 2
Telecom Industry and Reliance Communications
2.1 Global Telecom industry: Introduction 2.2 Global Scenario 2.3 Indian Telecom Industry 2.4 Growth in Indian Telecom Industry 2.5 Major Players in Telecom Sector 2.6 Future Growth in Telecom Segments
2.7 Reliance Communications 2.8 Financial Performance of Reliance Communications
2.9 Business details of Reliance Communications References

Chapter: 2 Telecom Industry and Reliance Communication
65
2.1 GLOBAL TELECOM INDUSTRY: INTRODUCTION
Telecom industry is a rapidly expanding industry, proceeding
towards a goal of achieving two third of the world's telecom
connections. Over the past few years information and
communications technology has changed in a dramatic manner
and as a result of that world telecom industry is going to be a
booming industry. Substantial economic growth and mounting
population has enabled the rapid growth of this industry.
The world telecommunications market is expected to rise at an 11
percent compound annual growth rate at the end of year 2012.1
Global leading telecom companies like AT&T, Vodafone,
Verizon, SBC Communications, Bell South and Qwest
Communications are trying to take the advantage of this growth.
These companies are working on telecommunication fields like
broadband technologies, EDGE(Enhanced Data rates for Global
Evolution) technologies, LAN-WAN inter networking, optical
networking, voice over Internet protocol, wireless data service etc.
World telecom industry is taking a crucial part of world economy.
The total revenue earned from this industry is 3 percent of the
gross world products and is aiming at attaining more revenues.

Chapter: 2 Telecom Industry and Reliance Communication
66
One statistical report reveals that approximately 16.9% of the
world population has access to the Internet2
Over the last couple of years, world telecommunication industry
has been consolidating by allowing private organizations the
opportunities to run their businesses with this industry. The
Government monopolies are now being privatized and
consequently competition is developing. Among all, the domestic
and small business markets are the hardest.
2.2 GLOBAL SCENARIO
Until the 1980s the world telecommunications systems had a
simple administrative structure. The United States telephone
service was supplied by a regulated monopoly, American
Telephone and Telegraph (AT&T). Telegraph service was
provided mainly by the Western Union Corporation. In almost all
other countries both services were the monopolies of government
agencies known as PTTs (for Post, Telephone, and Telegraph). In
the United States beginning in 19833, AT&T agreed in a court
settlement to divest itself of the local operating companies that
provided basic telephonic service. They remained regulated local
monopolies, grouped together into eight regional companies.
Chapter: 2 Telecom Industry and Reliance Communication
67
AT&T now offers long distance service in competition with half a
dozen major and many minor competitors while retaining
ownership of a subsidiary that produces telephonic equipment,
computers and other electronic devices. During the same period
Great Britain’s national telephone company was sold to private
investors as was Japan’s NTT telephone monopoly. For telegraphy
and data transmission, Western Union was joined by other major
companies, while many multinational firms formed their own
telecommunications services that link offices scattered throughout
the world. New technology also brought continuing changes in the
providers of telecommunication. Private companies such as
Comsat in the United States were organized to provide satellite
communication links within the country.
Around the world we are witnessing remarkable changes to the
telecoms environment. After years of debate, structural separation
is now taking place in many parts of the world including Hong
Kong, New Zealand, Singapore and some European markets.
Structural separation or at least full-blown operational separation
is required to advance the entire industry and to create new
business opportunities and innovations which will benefit our
society, our economy and ultimately our industry.
Chapter: 2 Telecom Industry and Reliance Communication
68
The focus is also shifting away from broadband to what it can
actually achieve. Next generation telecommunications better
describes this new environment and is essential for the emerging
digital economy. Important services that depend on NGT include
tele health, e-education, e-business, digital media, e-government
and environmental applications such as smart utility meters.
In order to meet this burgeoning consumer demand for NGT
applications, we are seeing increasing investment in All-IP Next
Generation Networks and fiber networks. A proper inventory of
national infrastructure assets is required if we want to establish an
efficient and economically viable national broadband structure for
these services. In the developing markets, next generations
telecoms will take the form of wireless (WiMAX).4
These are some of the elements of the broader ICT revolution that
is unfolding before our very eyes. We are right in the midst of the
transition from old communications structures (mainly one-way
streets) to new structures that are fully-interactive and video-
based.
One of the drivers behind the industry changes are the declining
revenues experienced by the telecom companies in their traditional
markets. Over the past 10 years or so, fixed-line operators have

Chapter: 2 Telecom Industry and Reliance Communication
69
been affected by deregulation, a severe industry downturn,
declining prices and major inroads by mobile services. In addition,
people are drifting to other forms of communication, such as
email, online chat, and mobile text messaging instead of the
traditional phone.
This has also led to an increased need for bandwidth, which in
turn has revived the submarine cable sector. In recent times there
have been many cable build-out announcements around the world,
and some major systems are again being constructed. Over 25
systems are expected to be built over the next two to three years
and network upgrades are also on the agenda for some existing
systems.
It is clear that the mobile industry is also undergoing profound
changes. The saturated developed markets are forcing the industry
to find new revenue streams and we are now seeing other
organizations such as media companies, content providers,
Internet media companies and private equity companies becoming
involved in this market.
For the time being however, voice will remain the killer
application for mobile with some data services included as support
services and niche market services. 4G (ie, WiMAX) is the real

Chapter: 2 Telecom Industry and Reliance Communication
70
solution for mobile data and by 2015 it is expected that the
majority of mobile revenues will come from data.5
With the Internet economy, digital media and other
telecommunications activities becoming further established, the
need for modern and efficient infrastructure is becoming more
critical.
2.3 INDIAN TELECOM INDUSTRY
The Indian telecommunications industry is one of the fastest
growing in the world and India is projected to become the second
largest telecom market globally by 2012.6
India added 225.04 million new customers in 20117, the largest
globally. In fact, in April 2008, India had already overtaken the
US as the second largest wireless market. To put this growth into
perspective, the country’s cellular base witnessed 50 per cent
growth in 2010, with an average 15 million8 customers added
every month in finance year 2009-10. According to the Telecom
Regulatory Authority of India (TRAI), the total number of
telephone connections (mobile as well as fixed) had touched
846.32 million9 as of March 2011, taking the telecom penetration
to over 52 per cent.10 According to CRISIL research estimates,
Chapter: 2 Telecom Industry and Reliance Communication
71
eight infrastructure sectors, which include the telecom sector, are
expected to draw more than US$ 345.28 billion investment in
India by 2012.11
With the rural India growth story unfolding, the telecom sector is
likely to see tremendous growth in India's rural and semi-urban
areas in the years to come. By 2012, India is likely to have 300
million rural telecom connections at a penetration rate of 25 per
cent.12 And according to a report jointly released by Confederation
of Indian Industry (CII) and Ernst & Young, by 201213, rural users
will account for over 60 per cent of the total telecom subscriber
base.
According to Business Monitor International, India is currently
adding 12-15 million mobile subscribers every month.14 It is
estimated that by mid 2012, around 75 per cent country’s
population will own a mobile phone. The overall tele-density in
India has reached 70.89 as on 31st March 2011.15
Chapter: 2 Telecom Industry and Reliance Communication
72
• HISTORY
Year Event
1851 First operational land lines were laid by the
Government near Calcutta (seat of British power)
1881 Telephone service introduced in India
1883 Merger with the postal system
1923 Formation of Indian Radio Telegraph Company
(IRT)
1932 Merger of ETC and IRT into the Indian Radio and
Cable Communication Company (IRCC)
1947 Foreign Telecom Companies nationalized to form
PTT
1980 Tele-density in 1980-81: 0.3%, Introduction of
public pay phones, Private Sector allowed
1986 Conversion of DOT into two wholly government-
Owned companies: the Videsh Sanchar Nigam
Limited (VSNL) for international
telecommunications and Mahanagar Telephone
Nigam Limited (MTNL) for Service in India
Early to
Mid-90's:
Telecom policy 1994
Basic telephony service to private operators

Chapter: 2 Telecom Industry and Reliance Communication
73
49% FDI
Late 90's Birth of a regulator: TRAI NTP 1999 (New Telecom
Policy)
2000+ CAGR of around 85% since 1999 FDI: 74% (2005)
2007-2010
Having the world’s lowest call rates the fastest
growth In the number of subscribers (45 million in 4
months), The fastest sale of million mobile phones
(in a week), The world's cheapest mobile handset,
The world's most affordable color phone.
2011 3G service launched in India.
(Source: www.ibef.org/industry/telecommunications.aspx)
2.4 GROWTH IN INDIAN TELECOM INDUSTRY
According to a Frost & Sullivan industry analyst, by 2012, fixed
line revenues are expected to touch US$ 12.2 billion while mobile
revenues will reach US$ 39.8 billion in India. Fixed line capex is
projected to be US$ 3.2 billion, and mobile capex is likely to
touch US$ 9.4 billion.16
Further, according to a report by Gartner Inc., India is likely to
remain the world's second largest wireless market after China in
terms of mobile connections. According to recent data released by

Chapter: 2 Telecom Industry and Reliance Communication
74
the TRAI, Indian telecom operators added a total of 192.56
million wireless subscribers in the financial year 2009-10. Further,
the total wireless subscriber base stood at 811.59 million at the
end of 31st March 2011.17
Chart No. 2.1
Growth of Wireless Subscriber (in million)
(Source: TRAI annual report, 2010-11)
The overall cellular services revenue in India is projected to grow
at a CAGR of 18 per cent from 2008-2012 to exceed US$ 37
billion. Cellular market penetration will rise to 60.7 per cent from
19.8 per cent in 2007.18
The Indian telecommunications industry is on a growth trajectory
with the GSM operators adding a record 219.39 million new
subscribers mark at the end of March 2011, taking the total user

Chapter: 2 Telecom Industry and Reliance Communication
75
base to 697.98 million, according to the data released by TRAI. In
CDMA services, in terms of subscriber base and market share M/s
RCOM with 56.05 million subscriber base remains the largest
CDMA operator.19
Chart No. 2.2
Market Share (%) of GSM Operators as on 31st March 2011
(Source: TRAI annual report, 2010-11)

Chapter: 2 Telecom Industry and Reliance Communication
76
Chart No. 2.3
Market Share (%) of CDMA Operators as on 31st March 2011
(Source: TRAI annual report, 2010-11)
In Wi-Max, India is slated to become the largest Wi-MAX market
in the Asia-Pacific by 2013. A recent study sees India's Wi-MAX
subscriber base hitting 14 million by 2013 and growing annually
at nearly 130 per cent. And investments in Wi-MAX ventures are
slated to top US$ 500 million in India, according to a report by
US-based research and consulting firm, Strategy Analytics.20

Chapter: 2 Telecom Industry and Reliance Communication
77
Table No. 2.1
Quick Facts
(As on 31st March 2011) Total telecom subscribers 846.32 million Wireless subscribers 811.59 million Wire line subscribers 34.73 million Tele density 70.89 per cent Internet subscribers 19.67 million No. of Broadband connections 11.89 million India's Rural Mobile Phone Users 282.23 Million
(Source: www.trai.gov.in/Content/Annual_Report.aspx)
Table No. 2.2
Year Revenue (US$ Billions)
2002-03 09 2003-04 10 2004-05 11 2005-06 15 2006-07 20 2008-09 32 2009-10 43 2010-11 88
(Source: www.trai.gov.in/Content/Annual_Report.aspx)
• SUBSCRIBER GROWTH
India added 225.04 million new customers in 2010-11, the largest
globally the country's cellular base witnessed close to 40 per cent
growth in 2011, with an average 18 million customers added every
month.21

Chapter: 2 Telecom Industry and Reliance Communication
78
The overall telephone connection figure stood at 846.32 million at
the end of the financial year 2010-11. Out of this the share of
wireless subscribers stood at 811.59 million as compared to
584.32 million a year before. The growth was 227.27 million or
38%. The rural market has reached the 282.23 million mark as
against 190.88 million in the previous year excluding CDMA
which works out to a growth of about 71% over last year. It was
reported that 32.67% of total wireless subscribers are now in rural
areas. The total numbers of wire line connections were 34.73
million while in the rural areas it stood at 8.69 million. The wire
line segment has been stagnating or declining in the last few years
but a positive aspect is that the decline has reduced from -3.69%
to -2.65%. During the last year, though BSNL and MTNL have
registered decline, private operators have jointly had a growth of
11.51% increasing the connections from 5.04 million to 5.62
million. The growth of subscriber base during the past decade
(2000-2010) is indicated below.22

Chapter: 2 Telecom Industry and Reliance Communication
79
Chart No.2.4
Growth of Telecom Subscriber Base (in million)
(Source: www.trai.gov.in/Content/Annual_Report.aspx)
Chart No. 2.5
Growth of Tele-density
(Source: www.trai.gov.in/Content/Annual_Report.aspx)

Chapter: 2 Telecom Industry and Reliance Communication
80
2.5 MAJOR PLAYERS IN TELECOM SERVICES
There are three types of players in telecom services:
• State owned companies - BSNL and MTNL
• Private Indian owned companies - Reliance Communication &
Tata Teleservices
• Foreign invested companies - Hutchison-Essar, Bharti Tele-
Ventures, Idea Cellular, BPL Mobile, Unitech, HFCL, Shyam &
Videocon.
Chart No. 2.6
Subscriber Base (figure in millions) of Wireless Services
(Source: www.trai.gov.in/Content/Annual_Report.aspx)

Chapter: 2 Telecom Industry and Reliance Communication
81
• BHARAT SANCHAR NIGAM LIMITED (BSNL) 23
Bharat Sanchar Nigam limited popularly also known as BSNL is
an India-based telecommunication service providing company.
BSNL operates under the guardianship of the Ministry of
Communication, Government of India and Department of
Telecommunication, Government of India. Bharat Sanchar Nigam
Limited operates according to the telecommunication policy laid
as per the Indian Telecommunication Acts and Rules. Bharat
Sanchar Nigam Limited was established on 1.10.2000, as a result
of the revamping of the erstwhile Department of
Telecommunication, Government of India. Bharat Sanchar Nigam
Limited is world's seventh largest telecommunications company,
with a huge bouquet of telecommunications services. The services
offered by BSNL includes wire line, CDMA mobile, GSM
Mobile, Internet, broadband, carrier service, MPLS-VPN, VSAT,
VoIP services, IN services etc. It is one of the fast growing and
most profitable organization of Government of India.
BSNL enjoys market leadership amongst all telecommunication
operators in India and has grown in leaps and bounds. This
gigantic Indian telecommunication company offers seamless
service to its customers and it and enjoys market dominance in the
Chapter: 2 Telecom Industry and Reliance Communication
82
area of basic telephony, rural telephony and Internet connection.
Bharat Sanchar Nigam Limited is dedicatedly working towards
bridging the gap between the rural and urban India digital divide
in the ICT sector. This Indian telecommunication company is one
of the market leaders in the Indian telecommunication industry.
Further, it has gain tremendous popularity due to its competitive
pricing of tariffs. Further, to retain its market dominance as a
market leader it has formulated aggressive plans for expansion of
its cellular network as per the policy laid in the tenth
telecommunication plan of India. BSNL has one of the widest and
deepest telecommunication networks in India. The governing body
has ratified a huge budgetary allocation of Rs.733 crore in the next
three years for the development of telecommunication
infrastructure in India. BSNL is market leader and is vastly
experienced in planning, installation, network integration and
maintenance of switching and transmission networks. Further the
company is equipped with a state-of-the-art Telecommunication
Training Institute, which holds ISO 9000 certification.
Some of the key notable points about BSNL are as follows: 24
• Bharat Sanchar Nigam Limited has around 47.3 million line
basic telephone capacity

Chapter: 2 Telecom Industry and Reliance Communication
83
• BSNL has around 4 million WLL capacity and 20.1 million
Global System for Mobile Communications (GSM) capacity
• It is equipped with more than 37382 fixed telephone
exchanges, 18000 BTS, 287 satellite stations, 480196 Rkm
of OFC cable and 63730 Rkm of microwave network
• Its network serves 7330 cities and towns, 602 districts and
5.5 lakh villages across India
• Cell One cellular service has more than 17.8 million
subscribers representing around 25% of all mobile users of
India
• BSNL has 35.1 million of basic telephony subscribers
representing 85% of the landline subscriber base of India
• It has more than 2.5 million WLL customers
• It has 2.5 million Internet subscribers, using access modes
like Dial-up, leased line, DIAS, account less Internet
The products and services offered by Bharat Sanchar Nigam
Limited are as follows:-
• BSNL Landline, BSNL Mobile, BSNL WLL,BSNL
Internet, BSNL Broadband, BSNL MPLS, VPN,ISDN,

Chapter: 2 Telecom Industry and Reliance Communication
84
• Leased line, Intelligent Network, Video conferencing,
• Audio conferencing, Enterprise solutions,I-Net,Telegraph,
• EPABX and Data communication.
• VIDESH SANCHAR NIGAM LIMITED (VSNL) 25
Videsh Sanchar Nigam Limited popularly known as VSNL is an
India based telecommunication service providing company. VSNL
operates under the guardianship of the Ministry of
Communication, Government of India and Department of
Telecommunication, Government of India. Videsh Sanchar Nigam
Limited operates according to the telecommunication policy laid
as per the Indian Telecommunication Acts and Rules. The
Government of India holds 75 % of equity shares of the Videsh
Sanchar Nigam Limited and the remaining 25 % equity shares are
with Tata Teleservices Ltd - the legendary industry conglomerate
the 'Tata Group '. Videsh Sanchar Nigam Limited was
incorporated in 1986 under the Indian Companies Act, 1956. Soon
after its inception, VSNL took over the control of the 'Overseas
Communication Services' (OCS) the main Government of India
telecommunication company.26
This gigantic telecommunication company of India has grown in
leaps and bounds and it offers seamless service to its customers
Chapter: 2 Telecom Industry and Reliance Communication
85
spread around the globe. This Indian telecommunication company
is one of the market leaders in the Indian telecommunication
industry and enjoys market dominance in the area of basic
telephony, rural telephony and Internet connection. Further, it has
gain tremendous popularity due to its competitive pricing of
tariffs. The company is also into the business of cellular phone
connection business and offers code directory multiple access
(CDMA) connections for its mobile subscribers. Further, the
company is planning to launch GSM mobile connections for its
mobile subscribers.
The products and services offered by Videsh Sanchar Nigam
Limited are as follows - International Private Leased Circuit
(IPLC) Service
• National Private Leased Circuit (NPLC),Internet Leased
Line Service, Bandwidth on Demand, Managed Data
Network Service, Virtual Private Network Service, Inmarsat
(International Maritime Satellite Organization),Broadcast,
• Data Center Services (IDC),Video Conferencing, Corporate
Net Telephony, ISDN, Corporate Dial-up Solution,
• Submarine Telecommunication Cables Access

Chapter: 2 Telecom Industry and Reliance Communication
86
Facilitation,International Long Distance, National Long
Distance and Calling Cards.
MAHANAGAR TELEPHONE NIGAM LIMITED (MTNL) 27
Mahanagar Telephone Nigam Limited popularly known as MTNL
is an India-based telecommunication service providing company.
MTNL operates under the guardianship of the Ministry of
Communication, Government of India and Department of
Telecommunication, Government of India. Mahanagar Telephone
Nigam Limited operates according to the telecommunication
policy laid as per the Indian Telecommunication Acts and Rules.
MTNL enjoyed virtual market monopoly till the end of the year
2000.
Mahanagar Telephone Nigam Limited operates in two major
metro cities of India, Mumbai and Delhi and this giant
telecommunication company enjoyed complete market leadership
till the aforesaid time. With the entry of private players in the
cities of Mumbai and Delhi, Mahanagar Telephone Nigam
Limited lost its market monopoly. Competitive tariff schemes and
lightening fast services are the main strengths of these private
players and they took away with a major chunk of Mahanagar
Chapter: 2 Telecom Industry and Reliance Communication
87
Telephone Nigam Limited market share of subscribers. This led to
lowering of tariff by the Mahanagar Telephone Nigam Limited.
This gigantic telecommunication company of India has grown in
leaps and bounds and it offers seamless service to its customers.
This Indian telecommunication company is one of the market
leaders in the Indian telecommunication industry and enjoys
market dominance in the area of basic telephony, rural telephony
and Internet connection. Further, it has gain tremendous popularity
due to its competitive pricing of tariffs. Further, to retain its
market dominance as a market leader in Mumbai and Delhi,
MTNL has aggressive plans of expansions of its cellular network
as per the policy laid in the Tenth Telecommunication Plan of
India. Furthermore, the company is also planning to expand its
Internet services and IT related services to help it grow along the
lines of other major telecommunication players operating in India.
As per the latest company policy in accordance with the tenth
telecommunication plan of India, the company is expected to add
27.56 lakh basic telephone connections along with 11.57 lakh
cellular phone connections. Moreover, Mahanagar Telephone
Nigam Limited is making in roads in the field of M-commerce,

Chapter: 2 Telecom Industry and Reliance Communication
88
which will eventually facilitate its customers to transact business
via mobile phone or equivalent hand held devices.28
The products and services offered by Mahanagar Telephone
Nigam Limited are as follows:-
• Triband Broadband, Internet Services ,Internet Express, Bol
Anmol Internet Telephony, Leased Line, Dolphin Mobile,
• Garuda WLL, Basic Telephony, ISDN, INET, International
Private Leased Circuit (IPLC) Service, National Private
Leased Circuit (NPLC),Internet Leased Line Service,
• Managed Data Network Service, Virtual Private Network
Service, Broadcast, Data Center Services, Video
Conferencing, Corporate Net Telephony, Messaging and
Collaboration Services, Ethernet WAN Services,
• International Long Distance, National Long Distance and
• Calling Cards.
• BHARTI AIRTEL 29
Bharti Airtel is one of the topmost companies in the telecom
sector in India and is under the Bharti Enterprises Group. Airtel
Bharti has been ranked as the best performance company in the
whole world by the Business Week magazine in 2007.

Chapter: 2 Telecom Industry and Reliance Communication
89
The Company Bharti Airtel is in India the biggest integrated and
also the 1st telephone service provider in the private sector, which
has footprint in around 23 telecom circles. Bharti Airtel Limited
has been since its very beginning using the latest technology and
thus the company has paved the way for the telecom sector in
India with its world-class services and products. This has helped
Bharti Airtel Company to grow for the number of its customers
has increased very rapidly over the years.
The Company Bharti Airtel is divided into 3 business units that
are:-
• Broadband & Telephone (B&T) services
• Enterprise services
• Mobile services
Among the various services that the Bharti Airtel Limited
Company provides to its customers, the services of broadband and
telephone (B&T) are 1 of them. The company provides broadband
Internet services of high speed for it has the best network in India.
The company Bharti Airtel also provides telephone services in
around 94 cities of the country and this helps the people to stay
connected with one another. The company plans to expand its

Chapter: 2 Telecom Industry and Reliance Communication
90
broadband and telephone services by providing IPTV services and
DTH operations.
Further Bharti Airtel provides enterprise services to its customers.
The services of enterprise provide telecom end-to-end solutions to
customers who belong to the corporate sector and also long
distance services to international and national carriers. The
company Bharti Airtel has more than 35,016 kilometers of optic
fiber, a submarine landing station, and is also a member of South
East Asia- Middle East- Western Europe- 4. All this has helped
the company to provide the best enterprise services to its
customers. The company Bharti Airtel Limited plans to expand its
enterprise services so that it can achieve the status of a global
carrier within a period of 2 - 3 years.
The company Bharti Airtel Limited provides mobile services to its
customers. The company provides fixed and mobile wireless
services in around 23 telecom circles by using the GSM
technology. Bharti Airtel Company has become the biggest mobile
service provider in India on the basis of the number of customers.
The company in the future plans to expand its network in order to
establish its presence in more than 500,000 villages all across the

Chapter: 2 Telecom Industry and Reliance Communication
91
country by 2012.
Bharti Airtel has become a leading company in the telecom sector
in India due to the fact that it has provided the best quality of
services to its customers. And this has been possible for the
company has a wide telecom network that is of the latest
technology. The Company Bharti Airtel Limited in the future also
should continue to upgrade its facilities for this will ensure that
high grade of services are provided to its customers.
• VODAFONE 30
Vodafone started its operations in India in 1994 and is under the
Vodafone Group. The company Vodafone India Limited has
become one of the leading companies in the telecom sector in
India due to its high standard of services that it provides to its
customers.
The company Vodafone has its operations in 16 telecom circles of
the country, which covers around 86% of the customer mobile
base in India. The company offers both postpaid and prepaid GSM
cellular mobile coverage all across India and its hold is especially
strong in the metropolitan cities. The company Vodafone India
Limited provides services like 2G, which are based on 1800 Mhz

Chapter: 2 Telecom Industry and Reliance Communication
92
and 900 Mhz GSM digital technology. The company Vodafone
also offers voice and data services.31
Vodafone India Limited has received many awards over the years
such as the best mobile service in India, Most effective and most
creative advertiser of the year, and most respected telecom
company.
The company Vodafone India Limited plans to spend more than
Rs.250 crore in launching low price cell phones in India. The
company's objective in doing this is to bring in millions of cheap
mobile handsets from around the world into the country and then
sell them under the Vodafone brand name in order to maximize
sales. It is expected that the company Vodafone India Limited will
price the handsets in the range of Rs.666, Rs.999, and Rs.888.
Vodafone India plans to sell the low price handsets from its 4
lakhs distribution outlets. The company will buy the low cost cell
phones from the firm ZTE that is located in China. The Company
ZTE will ship more than 10 million low cost cell phones to India
that will then be sold by the company Vodafone. Vodafone
company also has plans to expand in the near future and for this it
is planning to take a loan overseas of around US$ 500 million.
The company Vodafone India Limited will use the money to

Chapter: 2 Telecom Industry and Reliance Communication
93
expand the company's network, better its technology, and open
more distribution centers. All these measures will help to increase
the customer base of the company Vodafone.
Vodafone is one of the top most companies in the telecom sector
in India and is well known for the best quality of products and
services offered to its customers. And this is the reason that the
customer base of the company Vodafone India Limited has been
increasing at a very rapid pace. The company is planning to launch
low price cell phones in the country and also expand its
operations.
• RELIANCE COMMUNICATIONS 32
Reliance Communications started its operations in 1999 and is
under the Anil Dhirubhai Ambani Group (ADAG) of companies.
The company Reliance Communications Limited has been set up
with the aim of providing communication and information to
people at affordable price.
The company Reliance Communications business includes the
whole range of services related to the telecom sector such as fixed
line telephones and mobiles. The business of the company also
includes services like broadband, data services, international and

Chapter: 2 Telecom Industry and Reliance Communication
94
national long distance services. Reliance Communications also
provides to its customers a wide range of value added applications
and services.
The company is able to provide such a vast range of services to its
customers for it has a high- capacity, reliable, convergent, and
integrated digital network.
The company Reliance Communications Limited in order to
provide the best quality of services to its customers laid down
60,000 kilometers of optic fiber all across India. The company
launched the Reliance mobile services in December 2002 and this
has helped to increase the subscriber base of the company. The
company Reliance Communications Limited's subscriber base has
increased a lot over the years and at present stands at 38 million.
The company provides telecommunication services to individuals
and enterprises. Reliance Communications Company has become
the leading telecommunication integrated company in India and
the chairman of the company is Anil Ambani.
Reliance Communications Company's total revenue amounted to
Rs.35,260 million in 2005-2006 and the next year, this figure
stood at Rs.45,785 million. The net profit of the company
amounted to Rs.7,023 million and the next year, this figure

Chapter: 2 Telecom Industry and Reliance Communication
95
increased to Rs.13,046 million. This shows that the company
Reliance Communications Limited's total revenue and net profit
has registered a significant growth in one year. The company is
listed on the Bombay stock Exchange and National Stock
Exchange. The company Reliance Communications Limited
added a record number of subscribers in December 2006 that was
1.4 million.33
The company Reliance Communications Limited's market
capitalization reached the top with Rs.1 lakh crore on the Bombay
Stock Exchange in February 2007. The company has bagged the
E- Governance project of the West Bengal government in May
2007. The company Reliance Communications has won the Frost
and Sullivan market leadership award in October 2005 and also
the CDMA industry achievement award for international
leadership in October 2004. This shows that Reliance
Communications has been doing very good work that has been
recognized by the industry. And this is the reason that the
company has received so many awards.
Reliance Communications Limited further plans to expand its
operations and also plans to upgrade its technology. This is sure to
help the company serve its customers better and will also increase

Chapter: 2 Telecom Industry and Reliance Communication
96
its subscriber base. The company Reliance Communications
Limited should always try to provide the best quality of services to
its customers for this would lead to customer satisfaction and
loyalty. And this will in turn help the company to grow and
prosper even more.
• TATA TELE SERVICES 34
Tata Teleservices was set up in 1996 and is under the Tata Group,
which is a group worth around US$ 22 billion and has more than
96 companies. The company Tata Teleservices Limited has been
formed with an investment of around US$ 7.5 billion.
The company Tata Teleservices has helped the Tata Group to have
a strong presence in the telecom sector in India and the chairman
of the company is Mr. Ratan N. Tata. The company was the 1st
company in the country to launch the CDMA mobile services
within the state of Andhra Pradesh. Tata Teleservices Limited
offers various kinds of telephone services to its customers such as
wireless desktop phones, wire line services, mobile services, and
public booth telephony. Further the company also offers other
services like value added services such as roaming, group calling,
voice portal, data cards, and Internet post paid services, 3-way

Chapter: 2 Telecom Industry and Reliance Communication
97
conferencing, enterprise services, USB modem, Wi-Fi Internet,
and calling card services.
Tata Teleservices Company provides certain other products to its
customers like new data and voice services which include picture
messaging, ring tones, polyphonic, and interactive applications.
The company pioneered the CDMA technology in the country and
has reliable infrastructure that ensures the quality services
received by the customers. The Company Tata Teleservices
Limited has provided only high quality services to its customers
and this has helped the company to become a market leader in the
telephony fixed wireless market. The total subscriber base of Tata
Teleservices is more than 3.8 million.
The company Tata Teleservices Limited in order to expand its
domain, has acquired the company Hughes Telecoms (India)
Limited in December 2002. Further the company has made a total
investment of around Rs.19,924 crore in making an all India
presence in around 20 telecom circle. The major telecom circles
where the Company Tata Teleservices has its presence are
Gujarat, West Bengal, Uttar Pradesh, Himachal Pradesh,
Rajasthan, Haryana, Punjab, Madhya Pradesh, and Tamil Nadu.
The company provides employment to more than 6000 people and
Chapter: 2 Telecom Industry and Reliance Communication
98
as the company is expanding it is going to create over 20,000 jobs
in the near future.
Tata Teleservices Limited launched the scheme of non-stop
mobile that allows a subscriber to receive incoming calls free of
cost. The company has become the biggest telecom branded retail
chain and is also the 1st telecom service provider in India that
offers postpaid mobile connections on line. The company Tata
Teleservices Limited in order to expand its operations has
partnered with Ericsson, ECI Telecom, Lucent, and Motorola so
that it can deploy reliable network that is technologically very
advanced. The company has become a leading company in the
telecom sector in India for the quality of its services that it
provides to its customers. And as the company Tata Teleservices
Limited is expanding and upgrading its technology it sure will
help the company to provide even better services to its customers.
Tata Teleservices must continue to provide the best quality of
services to its customers for this will lead to customer satisfaction
and loyalty and this in turn will help the company to grow and
prosper.

Chapter: 2 Telecom Industry and Reliance Communication
99
• IDEA CELLULAR 35
Idea Cellular started its operations in 1995 and is under the Aditya
Birla Group, which holds 98.3% stake in the company. The
company Idea Cellular Limited is one of the telephony wireless
companies that functions in many states in India.
The company Idea Cellular is the leading mobile services GSM
operator in the country. The Company Idea Cellular Limited is the
only cellular operator in India to launch EDGE and GPRS. The
chairman of the company is Mr.Kumar Mangalam Birla and the
managing director is Mr. Sanjeev Aga. Idea Cellular Limited has
the license to provide services in 11 telecom circles in the country.
The telecom circles where the Company Idea Cellular has
operations are Goa, Maharashtra, Andhra- Pradesh, Chattisgarh,
Kerala, Haryana, Uttaranchal, Gujarat, Delhi, UP- West, and
Madhya Pradesh. The company's footprint at present covers
around 45% of the population of India and more than 50% of the
telecom market.
Idea Cellular Limited was the 1st cellular company in the country
to launch the scheme of music messaging with background tones,
cellular jockey, and group talk. The company was also the 1st to
launch mobile email services and voice portal. Idea Cellular

Chapter: 2 Telecom Industry and Reliance Communication
100
Company offers various services to its customers that include
prepaid and post paid mobile services. The company also offers
roaming, value added services, and call management services to
its customers. The Company Idea Cellular Limited has offered
revolutionary tariff plans to its customers such as Lifetime Idea,
Super Power, Women's Card, Lifelong offer, and Outdoing 2
Minutes Free.
Idea Cellular in call management services offers various services
to its customers such as call conference, CLIP, CLIR, call divert,
itemized bill, and call wait facilities. The company provides
roaming facility to its customers who are very efficient for the
company has a very wide network, which covers more than 530
cities in the country and also in around 80 countries across the
world. The Company Idea Cellular also provides it customers with
the facility that they can pay their mobile bills on line through the
company's website. As the company provides the best services to
its customers, the subscriber base of the company has increased at
a very rapid pace.
The Company Idea Cellular Limited has won the GSM
Association Award in the category of Bill Flash. The company is
the 1st cellular operator in the country who has won an award on

Chapter: 2 Telecom Industry and Reliance Communication
101
such a big platform. Idea Cellular Limited in order to expand even
more has acquired the Company Escotel in 2004. The number of
telecom circles where the company operates has increased with
this acquisition and thus it has helped the company to have a pan
India presence. The Company Idea Cellular is also planning to
upgrade its network that will ensure that the best quality of service
is provided to its customers.
Idea Cellular has become the topmost company in the telecom
sector in India on the basis of the quality of its services. And so in
the future also, the company must continue to provide its
customers with better facilities for this will help the company to
grow and prosper.
• AIRCEL 36
The Aircel Group is a result of alliance between Maxis
Communications Berhad of Malaysia (74% equity) and Apollo
Hospital Enterprise Ltd of India (26% equity).
The Aircel Group, formed in 1994, offers affordable and
outstanding mobile services to a vast subscriber base in India.
Aircel has a vision of delighting its customers by giving them the
respect they deserve. Aircel commenced operations in 1999.
Today, Aircel operates in 18 telecommunication circles and the

Chapter: 2 Telecom Industry and Reliance Communication
102
company is ready to embark on a dynamic expansion plan, swiftly
rolling out in new circles in the near future.
• VIDEOCON 37
Videocon Telecommunications Limited, a Videocon group
company offers GSM mobile services GSM service under the
brand name Videocon. The services are already up and running in
Tamil Nadu, Punjab, Haryana, Mumbai, Gujarat, Kerala, Madhya
Pradesh, UP East, UP West, Himachal Pradesh and soon will be
present across the country.
The Videocon Group is a $4 billion, global business conglomerate
with a strong presence in Household Consumer Goods, Oil & Gas,
Retail, Telecom, DTH and the Power sector.
The Videocon group has constantly leveraged a culture of
innovation to develop a range of market re-defining products. The
Group has several manufacturing facilities globally and R&D
centers spread across Americas, Europe and Australasia that are
constantly working towards creating global quality products
deploying the most up-to-date technology.
The Group is rated among India’s Top 15 Business Houses and is
listed among the 100 Emerging Giants of the World according to a

Chapter: 2 Telecom Industry and Reliance Communication
103
Boston Consulting Group study in addition to being rated amongst
the Top 15 of India’s ‘buzziest brands’ by agency faqs in 2010.
• BPL MOBILE COMMUNICATIONS 38
BPL Mobile Communications Limited offers GSM wireless
facilities in three states of India besides offering broadband
facilities via wireless bpl net with an ADSL internet competence.
Based in Bangalore, the firm is the subordinate of Vodafone Essar
Ltd. BPL Mobile has had the opportunity of providing the
communications requirements of the fiscal center of India for the
past 13 years. Later, in the year 2009, BPL Mobile rebranded itself
as Loop Mobile and has been operating since then in Mumbai.
Its latest identity, Loop Mobile symbolizes development with
stability. The firm incessantly functions towards providing their
subscribers an excellent set of connections, inventive products and
a better-quality cellular telephony understanding. It pledges to
sustain the same focus and dedication in offering the excellent
network connectivity, billing precision, and a matchless custom-
made client service.
In an attempt to offer best of customer service practices, BPL
Mobile Communications Limited have endowed more than Rs 300

Chapter: 2 Telecom Industry and Reliance Communication
104
crore to improvise to Next Generation IP (NGIP) set-up. This
extremely competent network improvisation allows the provider to
provide supreme voice clearness and wide-ranging coverage along
with prompt data facilities. The firm is the only one in India to
have fulfilled the TRAI yardsticks on a set-up and service
excellence constraints. BPL Mobile Communications has also
been ranked as the best set-up by Voice & Data, a primary
Telecom periodical, in their 2008 SAARC mobile users'
agreement review.
BPL Mobile Communications Limited has achieved a
considerable Mumbai market share of additional subscribers. The
importance on expansion is evidently replicated in the firm's
increasing subscriber base. In 2009, the brand name changed from
BPL mobile to Loop mobile.
2.6 FUTURE GROWTH IN TELECOM SEGMENTS
According to a Frost & Sullivan industry analyst, by 2012, fixed
line revenues are expected to touch US$ 12.2 billion while mobile
revenues will reach US$ 39.8 billion in India. Fixed line capex is
projected to be US$ 3.2 billion, and mobile capex is likely to
touch US$ 9.4 billion.39

Chapter: 2 Telecom Industry and Reliance Communication
105
Further, according to a report by Gartner Inc., India is likely to
remain the world's second largest wireless market after China in
terms of mobile connections. According to recent data released by
the COAI, Indian telecom operators added a total of 10.66 million
wireless subscribers in December 2008. Further, the total wireless
subscriber base stood at 811.59 million at the end of March
2011.40
The overall cellular services revenue in India is projected to grow
at a CAGR of 18 per cent from 2008-2012 to exceed US$ 37
billion. Cellular market penetration will rise to 60.7 per cent from
19.8 per cent in 2007.
The Indian telecommunications industry is on a growth trajectory
with the GSM operators adding a record 9.3 million new
subscribers in January 2009, taking the total user base to 267.5
million, according to the data released by COAI.41
In WiMax, India is slated to become the largest WiMAX market
in the Asia-Pacific by 2013. A recent study sees India's WiMAX
subscriber base hitting 14 million by 2013 and growing annually
at nearly 130 per cent. And investments in WiMAX ventures are
slated to top US$ 500 million in India, according to a report by
US-based research and consulting firm, Strategy Analytics.

Chapter: 2 Telecom Industry and Reliance Communication
106
• VALUE-ADDED SERVICES IN TELECOM INDUSTRY
A report by market research firm IMRB stated that the mobile
value-added services (MVAS) industry was valued at US$ 1.15
billion in June 2008, and is expected to grow rapidly at 70 per cent
to touch US$ 2.96 billion by June 2012.42
Currently, MVAS in India accounts for 10 per cent of the
operator's revenue, which is expected to reach 18 per cent by
2012. According to a study by Stanford University and consulting
firm BDA, the Indian MVAS is poised to touch US$ 3.74 billion
by 2012.43
Mobile advertising, which is an important VAS segment, offers
great potential to become an important revenue source. Marketers
are increasingly using MVAS as a step ahead of SMS-based
marketing to sell soaps and shampoos, banking, insurance
products and also entertainment services, and rural markets are
proving to be very receptive for such marketing.
Further, Venture Capitalists like Canaan Partners, Draper Fisher
Juvertson, Helion, and Nexus India are also innovating with
services like mobile payment options, advertising, voice-based
SMS and satellite video streaming.
Chapter: 2 Telecom Industry and Reliance Communication
107
2.7 RELIANCE COMMUNICATIONS
The Late Dhirubhai Ambani dreamt of a digital India — an India
where the common man would have access to affordable means of
information and communication. Dhirubhai, who single-handedly
built India’s largest private sector company virtually from scratch,
had stated as early as 199944: “Make the tools of information and
communication available to people at an affordable cost. They will
overcome the handicaps of illiteracy and lack of mobility.”
It was with this belief in mind that Reliance Communications
(formerly Reliance Infocomm) started laying 60,000 route
kilometers of a pan-India fiber optic backbone. This backbone was
commissioned on 28 December 2002, the auspicious occasion of
Dhirubhai’s 70th birthday, though sadly after his unexpected
demise on 6 July 2002.45
Reliance Communications has a reliable, high-capacity, integrated
(both wireless and wireline) and convergent (voice, data and
video) digital network. It is capable of delivering a range of
services spanning the entire infocomm (information and
communication) value chain, including infrastructure and services
for enterprises as well as individuals, applications, and consulting.

Chapter: 2 Telecom Industry and Reliance Communication
108
Today, Reliance Communications is revolutionizing the way India
communicates and networks, truly bringing about a new way of
life.
• ABOUT ADAG
Few men in history have made as dramatic a contribution to their
country’s economic fortunes as did the founder of Reliance, Sh.
Dhirubhai H Ambani. Fewer still have left behind a legacy that is
more enduring and timeless.
When Dhirubhai embarked on his first business venture, he had a
seed capital of barely US$ 300 (around Rs 14,000). Over the next
three and a half decades, he converted this fledgling enterprise
into a Rs 60,000 crore colossus—an achievement which earned
Reliance a place on the global Fortune 500 list, the first ever
Indian private company to do so.
Under Dhirubhai’s extraordinary vision and leadership, Reliance
scripted one of the greatest growth stories in corporate history
anywhere in the world, and went on to become India’s largest
private sector enterprise.
.Reliance Communications is the flagship company of the Anil
Dhirubhai Ambani Group (ADAG) of companies. Listed on the
Chapter: 2 Telecom Industry and Reliance Communication
109
National Stock Exchange and the Bombay Stock Exchange, it is
India’s leading integrated telecommunication company with over
100 million customers.
Business encompasses a complete range of telecom services
covering mobile and fixed line telephony. It includes broadband,
national and international long distance services and data services
along with an exhaustive range of value-added services and
applications. Our constant endeavor is to achieve customer delight
by enhancing the productivity of the enterprises and individuals
we serve.
Reliance Mobile (formerly Reliance India Mobile), launched on
28 December 2002, coinciding with the joyous occasion of the late
DhirubhaI Ambani’s 70th birthday, was among the initial
initiatives of Reliance Communications. It marked the auspicious
beginning of Dhirubhai’s dream of ushering in a digital revolution
in India.
Reliance–ADA Group’s flagship company, Reliance
Communications, is India's largest private sector information and
communications company, with over 100 million subscribers. It
has established a pan-India, high-capacity, integrated (wireless

Chapter: 2 Telecom Industry and Reliance Communication
110
and wire-line), convergent (voice, data and video) digital network,
to offer services spanning the entire infocomm value chain.
Other major group companies — Reliance Capital and Reliance
Infrastructure — are widely acknowledged as the market leaders
in their respective areas of operation.
• VISION OF THE COMPANY
By 2015, be amongst the top 3 most valued
Indian companies, Providing Information, Communication &
Entertainment services, and being the industry benchmark in
Customer Experience, Employee Centricity and Innovation.
• CHAIRMAN'S PROFILE
Regarded as one of the foremost corporate leaders of
contemporary India, Shri Anil D. Ambani ,48, is the chairman of
all the listed companies of the Reliance ADA Group, namely
Reliance Communications, Reliance Capital, Reliance Energy and
Reliance Power limited.
He is also Chairman of the Board of Governors of Dhirubhai
Ambani Institute of Information and Communication Technology,
Gandhinagar, Gujarat.

Chapter: 2 Telecom Industry and Reliance Communication
111
Anil D Ambani joined Reliance in 1983 as Co-Chief Executive
Officer, and was centrally involved in every aspect of the
company’s management over the next 22 years. He is credited
with having pioneered a number of path-breaking financial
innovations in the Indian capital markets. He spearheaded the
country’s first forays into the overseas capital markets with
international public offerings of global depositary receipts,
convertibles and bonds. Starting in 1991, he directed Reliance
Industries in its efforts to raise over US$ 2 billion. He also steered
the 100-year Yankee bond issue for the company in January 1997.
• CORPORATE GOVERNANCE
Organizations, like individuals, depend for their survival,
sustenance and growth on the support and goodwill of the
communities of which they are an integral part, and must pay back
this generosity in every way they can…
This ethical standpoint, derived from the vision of our founder,
lies at the heart of the CSR philosophy of the Reliance – ADA
Group.
While we strongly believe that our primary obligation or duty as
corporate entities is to our shareholders – we are just as mindful of

Chapter: 2 Telecom Industry and Reliance Communication
112
the fact that this imperative does not exist in isolation; it is part of
a much larger compact which we have with our entire body of
stakeholders: From employees, customers and vendors to business
partners, eco-system, local communities, and society at large.
We evaluate and assess each critical business decision or choice
from the point of view of diverse stakeholder interest, driven by
the need to minimize risk and to pro-actively address long-term
social, economic and environmental costs and concerns.
For us, being socially responsible is not an occasional act of
charity or that one-time token financial contribution to the local
school, hospital or environmental NGO. It is an ongoing year-
round commitment, which is integrated into the very core of our
business objectives and strategy.
Because we believe that there is no contradiction between doing
well and doing right. Indeed, doing right is a necessary condition
for doing well.
• CODE OF CONDUCT
Reliance – ADAG continually reviews corporate governance best
practices to ensure that they reflect global developments. It takes
feedback into account, in its periodic reviews of the guidelines to

Chapter: 2 Telecom Industry and Reliance Communication
113
ensure their continuing relevance, effectiveness and
responsiveness to the needs of local and international investors
and other stakeholders.
Our code of conduct and business policies encompasses the
following areas:-
� Values and commitments
� Code of ethics
� Business policies
� Ethics management
� Prevention of sexual harassment
� Policy on insider trading
We endeavor to further extend our efforts beyond the traditional
value chain by developing and deploying complete telecom
solutions for the entire spectrum of society.
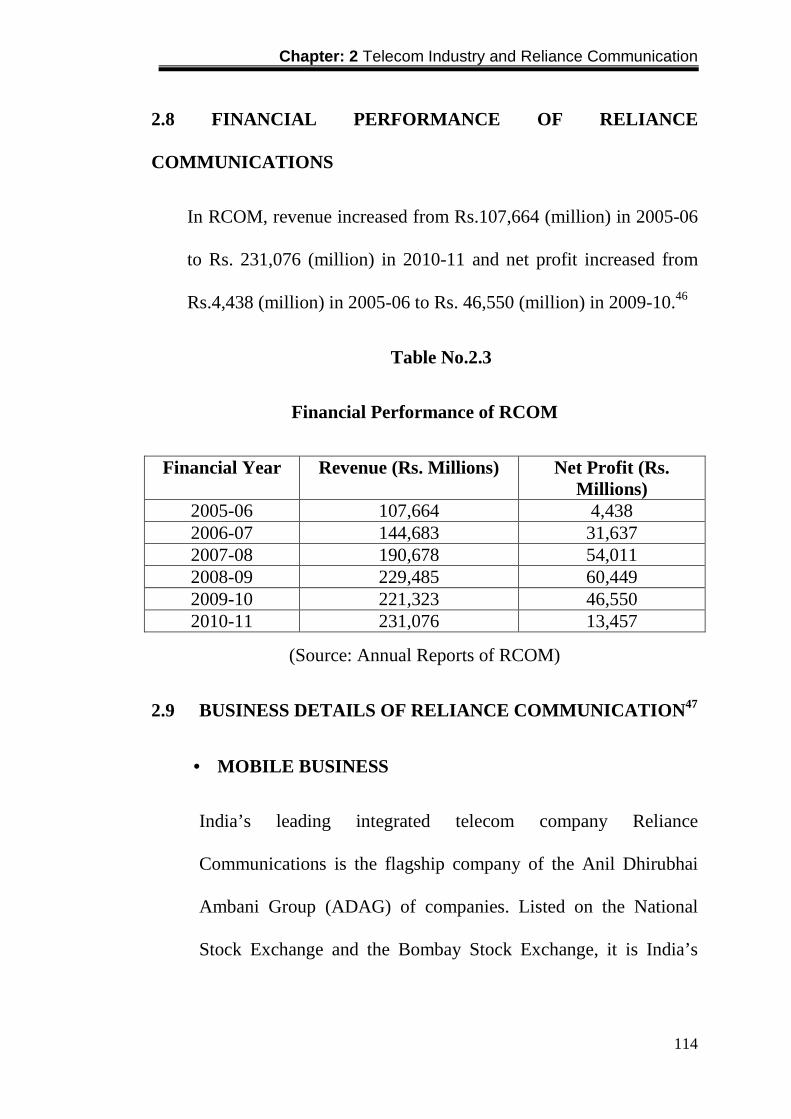
Chapter: 2 Telecom Industry and Reliance Communication
114
2.8 FINANCIAL PERFORMANCE OF RELIANCE
COMMUNICATIONS
In RCOM, revenue increased from Rs.107,664 (million) in 2005-06
to Rs. 231,076 (million) in 2010-11 and net profit increased from
Rs.4,438 (million) in 2005-06 to Rs. 46,550 (million) in 2009-10.46
Table No.2.3
Financial Performance of RCOM
Financial Year Revenue (Rs. Millions) Net Profit (Rs. Millions)
2005-06 107,664 4,438 2006-07 144,683 31,637 2007-08 190,678 54,011 2008-09 229,485 60,449 2009-10 221,323 46,550 2010-11 231,076 13,457
(Source: Annual Reports of RCOM)
2.9 BUSINESS DETAILS OF RELIANCE COMMUNICATION 47
• MOBILE BUSINESS
India’s leading integrated telecom company Reliance
Communications is the flagship company of the Anil Dhirubhai
Ambani Group (ADAG) of companies. Listed on the National
Stock Exchange and the Bombay Stock Exchange, it is India’s

Chapter: 2 Telecom Industry and Reliance Communication
115
leading integrated telecommunication company with over 100
million customers.
Our business encompasses a complete range of telecom services
covering mobile and fixed line telephony. It includes broadband,
national and international long distance services and data services
along with an exhaustive range of value-added services and
applications. Our constant endeavor is to provide an enhanced
customer experience and achieve customer satisfaction by
upscaling the productivity of the enterprises and individuals we
serve.
Reliance Mobile (formerly Reliance India Mobile), launched on
28 December 2002, coinciding with the joyous occasion of the late
Dhirubhai Ambani’s70th birthday, was among the initial
initiatives of Reliance Communications. It marked the auspicious
beginning of Dhirubhai’s dream of ushering in a digital revolution
in India. Today, we can proudly claim that we were instrumental
in harnessing the true power of information and communication,
by bestowing it in the hands of the common man at affordable
rates.

Chapter: 2 Telecom Industry and Reliance Communication
116
• WIRELESS RELIANCE MOBILE
With over 110 million subscribers across India, Reliance Mobile is
India’s largest mobile service brand. Reliance Mobile services
now cover over 24,000 town, 6 lakh villages and still counting.
What sets Reliance Mobile apart is the fact that nearly 90 per cent
of our handsets are data-enabled, and can access hundreds of Java
applications on Reliance Mobile World.
Reliance Mobile has ushered in a mobile revolution by offering
advanced multimedia handsets to the common man at very
affordable rates. This innovative low pricing has increased the
number of mobile phone users and its result is clearly reflected in
the meteoric rise in India’s tele-density over the past four years.
Our pan-India wireless network runs on CDMA 2000 1x
technology, which has superior voice and data capabilities
compared to other cellular mobile technologies. CDMA 2000 1x is
more cost-effective as it utilizes the scarce radio spectrum more
efficiently than other technologies do. Enhanced voice clarity,
superior data speed of up to 144 kbps and seamless migration to
newer generations of mobile technologies is some of its key
differentiators.

Chapter: 2 Telecom Industry and Reliance Communication
117
• R-WORLD
With over 150 data applications offering varied services - unique
to any wireless service in India - R World is truly a treasure house
of knowledge, information, entertainment and commerce.
• INTERNET
The successful rolling out of real broadband services across the
nation marks the second chapter of Reliance Communications’
commitment to usher in a digital revolution in India. Reliance
Communications is setting new standards for the world to follow
through inventive use of cutting-edge technologies in the field of
fibre optics, Ethernet, microwave radios, switching, routing,
digital compression and encoding.
The mass roll out of broadband being carried out by Reliance
Communications across the length and breadth of the country,
offering speeds of up to 100 Mbps to millions of users, in itself is
a technological marvel.
The uniqueness of Reliance Communications’ broadband initiative
lies in the fact that our entire nationwide network is being
conceptualized and built from ground zero. It is designed to
deliver affordable quality education, drive governance, transform

Chapter: 2 Telecom Industry and Reliance Communication
118
healthcare, enhance efficiency in business and finally, generate
new job opportunities for millions of unemployed Indians.
Reliance Communications’ broadband service is set to
revolutionize Indian society by removing the traditional
bottlenecks of development including lack of capital and weak
infrastructure, and help tide over the challenges of distribution in a
vast country like India.
• E-HEALTHCARE
Reliance broadband is set to offer timely quality healthcare
facilities at very affordable rates to large sections of the Indian
population irrespective of their geographical location. Our
broadband connectivity is committed to usher in a new generation
of online healthcare delivery system.
Access to advance medical expertise can no longer be constrained
by geography. A patient can seek medical advice sitting in the
comforts of home. Doctors can attend to patients anywhere in the
world on real-time basis. At the click of the mouse, medical
records and documents can be digitally dispatched thousands of
miles away.
Chapter: 2 Telecom Industry and Reliance Communication
119
Recently, the Apollo Group of Hospitals joined hands with
Reliance Communications to offer its top-of-the-line healthcare
facilities online to the benefits of millions of Indians.
• INTEGRATED ENTERPRISE SOLUTION
Reliance Communications’ Integrated Enterprise Solution offering
is currently being rolled out in 30 cities across India. It consists of
an integrated voice, data and video solution. Our target is to
expand its service to cover the entire country eventually.
For Indian enterprises, our convergent voice-data-video solution
framework, delivered through fibre-to-the-building (FTTB)
architecture introduces true broadband connectivity. Our
enterprise broadband is delivered using Metro Ethernet
technology. However, based on specific customer requirement
other high-end technologies including Digital Subscriber Line
(DSL), Local Multipoint Distribution Services (LMDS) and
Integrated Service Digital Network (ISDN) are also being depl
As per specific requirements of enterprises we provide customized
solutions be it a simple voice solution or complex data solutions
that involves nationwide networking of all branches, sales and
field executives, vendors, suppliers and customers at data speeds

Chapter: 2 Telecom Industry and Reliance Communication
120
scalable from 64 Kbps to 100 Mbps. Reliance Communications’
core broadband products include MPLS based VPN, leased lines,
Gigabit Internet connectivity, video conferencing and video
telephony.
• ENTERTAINMENT-IPTV
Reliance IPTV is powered by Microsoft media room, which is the
preferred IPTV Platform world over. Leading IPTV Service
Providers like AT&T, BT, DT and SingTel operate on the Media
room Platform. Features and functionalities on the Reliance IPTV
differentiate us from all the other IPTV Players in the country.
Reliance IPTV is uniquely placed to cater to the growing & varied
needs of consumers and become India’s leading IPTV service
provider.
Reliance IPTV comes loaded with unique features and
functionalities that are built to provide the user an amazing TV
experience.
Following features differentiate Reliance IPTV from competition:
• LIVE TV
Reliance IPTV Service has the capability to deliver over 500 Live
TV channels and will carry around 200 Channels at launch – the

Chapter: 2 Telecom Industry and Reliance Communication
121
highest by any Television Service Provider in India. We are
targeting to carry at least 250 channels, including 5-10 HD
Channels, within a year of launch.
• VIDEO ON DEMAND
Reliance IPTV can host over 5,000 hours of VoD at current
capacity. Around 500 VoD Titles will be available at launch and the
library will be expanded on an ongoing basis. Within a year of
launch, we intend to carry at least 1500 Titles.
• DVR
Reliance IPTV has functionality to support recording of 3 streams
simultaneously while watching Live TV/VOD
• INSTANT CHANNEL CHANGE (ICC)
A unique feature of Reliance IPTV which enables channel change
over in micro seconds. Typical channel change times are at least 2-4
seconds.
• TIME-SHIFT TV
Catch-up TV allows a subscriber to go back in time and watch
programs that were screened earlier in the day or in the week.

Chapter: 2 Telecom Industry and Reliance Communication
122
Reliance IPTV has the capability to allow a subscriber to go back a
week in time.
Reliance IPTV has been tested and is running successfully in more
than 200 Homes in Mumbai. Initially, our services will be launched
in Mumbai and Delhi and then expanded to Pune, Bangalore,
Hyderabad and Ahmadabad in the next one year.
• ENTERPRISE SOLUTION
Our business encompasses a complete range of telecom services for
an Enterprise. These include bouquet of services in the area of
telephony, networked telephony, data connectivity, video, Internet
and managed services. In a short span of time since its initialization
Enterprise Business has become market leader in chosen verticals.
For Enterprises, RCOM created a convergent voice-data-video
network – a first in the country’s history, delivered through fibre-to-
the-building (FTTB) architecture. This enabled us to offer next
generation services based on Metro Ethernet Technology apart from
delivering traditional telco services. This unique architecture has
enabled Indian enterprise customer to have unlimited capacity
available. Network based on cutting edge technologies, backed by
systems and processes designed for performance is our strength.

Chapter: 2 Telecom Industry and Reliance Communication
123
RCOM is the service providers in the country which owns and
controls all the three components of connectivity namely – local
access, national long distance and international connectivity, thus
enabling us to offer meaningful service level commitments to
customer.
Our constant endeavor is to achieve customer delight by enhancing
the productivity of the enterprises and individuals we serve.
Today, we can proudly claim that we were instrumental in enabling
our customers to harness true power of information and
communication technology.
• NETWORKING
Global network Reliance Communications is a National Long
Distance (NLD) and International Long Distance (ILD) service
provider, rendering national and international transport links
between other telecommunication service providers' networks. It is
also an infrastructure provider for end-to-end bandwidth
requirements as well as providing dark duct and dark fibre on lease
to service providers and companies.
Chapter: 2 Telecom Industry and Reliance Communication
124
The acquisition of Flag Telecom by Reliance in January 2004 has
strengthened the bouquet of our service offerings to national and
global service providers and companies.
Our wholesale customers include Indian and international telephony
service providers, Internet service providers, long-distance carriers,
call centre operators, multinational companies, business process
outsourcing (BPO) companies, IT-enabled service (ITES) providers
and government and quasi-government organizations.
DATA CENETR
Reliance is India's largest Internet Data Center (IDC) service
provider, hosting business critical IT Infrastructure and
applications of Indian and foreign blue chip companies, financial
institutions and other important organizations. Reliance Internet
Data Centers are truly world class Level 3 (highest) IDC facilities,
with more than 6, 50,000 sq ft of hosting space. Total of nine
IDC's including four IDC's with total hosting space of 256000 sq
ft— are functioning in Mumbai, three with hosting space of
1,00,000 sq ft- are functioning at Bangalore, one IDC of hosting
space of 56,000 sq ft is functioning in Chennai and one IDC of
hosting space of 2,60,000 sq ft is functioning in Hyderabad.
Reliance is also setting up world-class data centers in other major

Chapter: 2 Telecom Industry and Reliance Communication
125
cities in India making a total of more than 1.4 million sq ft of
hosting space available over the next year.
Reliance data centers, on a daily basis, manage more than 25,000
servers, 350 firewalls and 1600 terabyte of data transfer. All data
center's are internationally benchmarked on all parameters —
physical and network security, infrastructure, facilities, network
connectivity and operations.
Reliance Internet Data Centers offer a range of standard and
advanced managed hosting services. The services range from
offering bulk co-location space to fully managed hosting of
servers on rent/lease model. Further, a whole range of managed
value added services are offered like firewall, intrusion detection,
backup, streaming, mailing, system administration, data base
administration, load balancing, storage services and disaster
recovery / BCP solutions.
Internet Data Centers are critical components of Reliance
Communications’ vision to herald a digital revolution in India.
The Data centers are connected to Reliance's pan-India, optic
fibre-based, high capacity IP network. The data center is further
connected to 52 countries including US, UK, Mid-east and Asia-
Pac through Flag Telecom (A Reliance Communications group
Chapter: 2 Telecom Industry and Reliance Communication
126
company) backbone and other undersea cable systems. It also has
private peering relationship with the largest Tier 1 Internet Service
Providers (ISPs) and public peering at more than 15 Internet
Exchange points across the globe, apart from peering relationship
with domestic ISPs on STM-1 bandwidth.

Chapter: 2 Telecom Industry and Reliance Communication
127
REFERENCES:
1. http://www.budde.com.au/Research/Global-Industry-An-
Introduction-to-Telecommunications.html
2. http://www.telecomsmarketresearch.com/research/TMAAATMX-
Hot-Telecom-Global-Telecom-Market-Status-Forecast-2008-
2013.shtml
3. Mobile Communications by Joohen Schiller –second edition
4. http://www.economywatch.com/worldindustries/telecommunicatio
ns/ world-telecom-industry.html
5. IBID
6. http://business.mapsofindai.com/indai-industry/telecom.html
7. http://www.trai.gov.in/WriteReadData/UserFiles/Documents/Anu
ualReports/ar_10_11.pdf
8. IBID
9. IBID
10. IBID
11. http://www.crisil.com/CRISIL-ratings_indian-telecom-sector-
faqs.pdf
Chapter: 2 Telecom Industry and Reliance Communication
128
12. http://www.trai.gov.in/WriteReadData/UserFiles/Documents/Anu
ualReports/ar_10_11.pdf
13. http://www.ey.com/IN/en/Industries/Telecommunications/Teleco
mmunications_Overview
14. http://store.businessmonitor.com/telecommunications/india_teleco
mmunications_report/
15. http://www.trai.gov.in/WriteReadData/UserFiles/Documents/Anu
ualReports/ar_10_11.pdf
16. www.ibef.org/industry/telecommunications.aspx
17. http://www.trai.gov.in/WriteReadData/UserFiles/Documents/Anu
ualReports/ar_10_11.pdf
18. IBID
19. IBID
20. http://www.telecomsmarketresearch.com/research/TMAAATMX-
Hot-Telecom-Global-Telecom-Market-Status-Forecast-2008-
2013.shtml
21. http://www.trai.gov.in/WriteReadData/UserFiles/Documents/Anu
ualReports/ar_10_11.pdf, page 20-40
22. http://www.trai.gov.in/WriteReadData/UserFiles/Documents/Anu
ualReports/ar_10_11.pdf, page 9-35
23. http://www.bsnl.co.in/about.htm

Chapter: 2 Telecom Industry and Reliance Communication
129
24. http://www.bsnl.co.in/company/growth.htm
25. http://www.tataindicomextra.in/index_interim_new.html
26. IBID
27. http://mtnl.net.in/history.htm
28. http://mtnl.in/growth/index.htm
29. http://www.airtel.in/wps/wcm/connect/about+bharti+airtel/
30. www.vodafone.in
31. IBID
32. http://www.rcom.co.in/Rcom/personal/home/index.html
33. http://www.rcom.co.in/Rcom/aboutus/overview/overview_relianc
egroup.html
34. http://www.tataindicom.com/
35. www.ideacelluar.com
36. www.aircel.com
37. Www. videocon.com
38. www.loopmobile.in
39. http://www.frost.com/prod/servlet/svcg.pag/IT00
40. http://www.gartner.com/technology/research/
41. http://www.coai.com/revenue.php
42. http://www.imrbint.com/index.

Chapter: 2 Telecom Industry and Reliance Communication
130
43. www.siliconindia.com/.../Characteristics_of_Successful_MVAS_c
om
44. http://www.rcom.co.in/Rcom/aboutus/overview/overview_busines
s.html
45. IBID
46. http://www.rcom.co.in/Rcom/aboutus/ir/ir_financials.html
47. http://www.rcom.co.in/Rcom/business/HTML/index.html

Chapter: 3 Formulation of Research Plan and Procedure
131
Chapter 3
Research Plan and Procedure
3.1 Introduction
3.2 Research Problem
3.3 Review of Literature
3.4 Objectives of the Study
3.5 Source of the Data
3.6 Significant of the Study
3.7 Research Methodology
3.8 Hypotheses
3.9 Sample
3.10 Chapter Plan
3.11 Limitations
References

Chapter: 3 Formulation of Research Plan and Procedure
132
3.1 INTRODUCTION
Research methodology that is the heart of the study that includes the
basic assumptions, gap in the existing knowledge and the procedures
used by the researcher to fill the gap that even includes data
collections, interpretation and reaching to conclusions. It is a basic
plan for action, or a series of actions chalked out, in order to
accomplishes the objective efficiently and effectively with in a time
framework, without deviating from the original target. In other
words; one can say that, where we are at this moment and where we
want to go, the process involved is carefully transformed in to a blue
print called the research design.
3.2 RESEARCH PROBLEM: for measuring performance we have
various parameters i.e. finance, customers satisfaction, employ
satisfaction, and many more areas through that we can measure
performance of any organization. In this study researcher tries to find
the total performance of the sample unit - Reliance Communications
by using the Balance Scorecard. Title of the research is;
“MEASURING THE TOTAL PERFORMANCE OF
RELIANCE COMMUNICATIONS–THROUGH BALANCED
SCORECARD.”

Chapter: 3 Formulation of Research Plan and Procedure
133
The reason behind selecting the unit is; as Indian telecom industry is
passing through critical position and effort to improve the
profitability and performance. The year under review witnessed
further dramatic drop in telecom tariffs. That forces the units
working in this industry to focus on value added services along with
their main business. With the help of several new operators in the
year 2010-11, the total number of operators in the market stands at
No. 15. Hence, analysis of performance of Reliance communications
is contemporary. We might need more balanced performance
information to fully assess an organization’s success. Traditionally,
the measurement of all organizations has been financial. To overcome
this limitation, the balanced scorecard will be used to give a balanced
and holistic approach to assessing performance of Reliance
Communications.
Performance measurement can be defined as the process of measuring
efficiency, effectiveness and capability, of an action or a process or a
system, against given norm or target. Balanced scorecard is a
strategic management and measurement system that links strategic
objectives to a comprehensive range of key performance indicators,
to provide a balanced view.1

Chapter: 3 Formulation of Research Plan and Procedure
134
3.3 REVIEW OF LITERATURE
The Balanced Scorecard has generated much interest since its
introduction in the early 1990s. Researchers have used surveys, field
research and experiments in the quest to understand the Balanced
Scorecard.
Letza (1996)2 conducted a study that examined companies which
designed and implemented the Balanced Scorecard. The companies
in this study were: MC-Bauchemie Műller GmbH & Co; Rexam
Custom Europe; AT & T EMEA (Europe/Middle East/Africa). He
found that there were similarities in the processes adopted by all
three companies in the designing and subsequent implementation, of
their individual Balanced Scorecard. He added that in all cases it was
clear that good communication and building of commitment was of
the utmost importance. It was also very clear that the unique culture
and existing company philosophy had to be incorporated into the
Balanced Scorecard for it to be acceptable to managers. Closely
aligned to this was a need to link performance measures with
company strategy.

Chapter: 3 Formulation of Research Plan and Procedure
135
Hoque and James (2000)3 surveyed 66 Australian manufacturing
firms. Balanced Scorecard usage was measured using a 20 items scale
similar to that developed by him. This study used the balance
attribute to determine Balanced Scorecard use by the responding
organization. Hoque and James find support for the hypothesis that
larger organizations tend to make more use of the Balanced Scorecard
and it suggests that greater Balanced Scorecard usage is associated
with improved performance.
Chan and Ho (2000)4, in their survey of 121 Canadian hospitals,
queried the respondent about their perceptions with respect to
Balanced Scorecard. They reported that the Balanced Scorecard
implementers made use of all four Balanced Scorecard perspectives
and used a relatively balanced mix of outcome measures and
performance drivers. They also reported that there was no significant
difference between implementers and non-implementers of Balanced
Scorecard with respect to the respondent’s perceptions about the
following two statements: (1) there is a direct link between your
organizations long term strategy and performance measures, and (2)
the performance measures reflect a clear, articulated strategy. This is
meaningful because it is possible that organizations that have not

Chapter: 3 Formulation of Research Plan and Procedure
136
formally implemented a Balanced Scorecard may already be using at
least some of the Balanced Scorecard attributes.
Ittner and Larcker (2003)5 conducted field research in more than 60
manufacturing and services companies supplemented with survey
responses from 297 senior executives. Casual linkages were a major
focus of this study which reported that only 23 percentage of the
surveyed companies consistently built and verified causal models.
They reported that four common mistake companies make when
trying to measure nonfinancial performance. These are (1) no linking
measures to strategy, (2) not validating the links between the
measures, (3) not setting the right performance targets, (4) measuring
incorrectly. Further reported that at least 70 percentage of companies
use measures that lack statistical validity and reliability.
A Norwegian study by Stemsrudhagen (2004)6, surveyed 83
Norwegian manufacturing companies. This study set out to explore
the degree to which performance measurement systems have the
structural properties which are inherent in the Balanced Scorecard.
The study also asked whether the properties of the performance
measurement systems in Balanced Scorecard companies are different
from properties found in non- Balanced Scorecard companies.
Stemsrudhagen reported that the structures of performance

Chapter: 3 Formulation of Research Plan and Procedure
137
measurement systems comprise many of the measures found in
Balanced Scorecard, irrespective of whether or not the companies
have in fact implemented this system.
Speckbacher et al. (2003)7 surveyed publicly traded firms in
Germany, Austria and Switzerland on their usage of the Balanced
Scorecard. Almost all of these organizations used three of the four
Kaplan and Norton Balanced Scorecard perspective: Financial,
Customer and Internal Business perspective. Speckbacher et al.
(2003) reported that “Improved alignment of strategic objectives with
strategy” and Improved company results in the Long-term” were
common expected benefits of Balanced Scorecard use.
Malina and Selto (2001)8 conducted field research in a Fortune 500
company for the purpose of answering the following research
question: (RQ1) Is the Balanced Scorecard an (in) effective
communication device, creating strategic (non) alignment, (in)
effective motivation, and positive organizational outcomes? (RQ2) Is
the Balanced Scorecard an (in) effective management control device,
creating strategic (non) alignment, (in) effective motivation, and
(negative) positive organizational outcomes? They found support for
RQ2: Effective management control appears to cause Aligned with
strategy and Effective motivation, which in turn appears to cause

Chapter: 3 Formulation of Research Plan and Procedure
138
positive outcomes. In other words, effective management control
appears to contribute to positive motivation of the employees and to
an organization working with the organizations strategy which leads
to positive results. In summary, they found that in at least one
corporate setting, the Balanced Scorecard presents significant
opportunities to develop, communicate and implement strategy.
Ittner, Larcker and Meyer (2003)9 provide, one of the first detailed
studies of Balanced Scorecard based compensation plan. The perform
field research in one organizations and find that, even in a Balanced
Scorecard setting, short-term financial measures are the primary
determinant of bonuses. They also find that a large proportion of
branch manager’ performance evaluations are based on factors other
than the Balanced Scorecard measures, even though discretion to
consider other factors was not a component of the bonus plan.
3.4 OBJECTIVES OF THE STUDY
The broader objective of the study is to measure total performance of
Reliance Communications through Balanced Scorecard, which is sub
divided into four main key performance indicators (KPI) as:
(a) Financial Perspective,
(b) Customer Perspective,

Chapter: 3 Formulation of Research Plan and Procedure
139
(c) Internal Business Processes and
(d) Learning and Growth Perspectives.
Under each KPI, the organization must select metrics that will align
business performance to its strategic objectives and vision. The
reason behind selecting this topic is that the researcher was working
at the Reliance Communication at Mumbai and was involved in the
team that decides the strategic vision of Reliance Communications
Limited. The vision which was decided in the year 2006 is as under10:
By 2015, be amongst the top 3 most valued Indian companies, Providing Information, Communication and Entertainment services, and being the industry benchmark in Customer Experience, Employee Centricity and Innovation.
The first objective of the study is:
To Measure customer satisfaction level of Reliance Communication
– this objective is in line with customers Perspective of BSC.
As per the vision of the company, RCOM emphasizes on “Customer
Experience.” It is an area which can give a sustainable competitive
advantage and hence it is one of the key thrust areas for RCOM
business. Researcher has taken strategic measures is customer
satisfaction level for measurement of customer experience

Chapter: 3 Formulation of Research Plan and Procedure
140
Second objective of the study is:
To Measure employee satisfaction level and also to Measure
organizational perception level of employee. This is in line with the
learning and growth perspective of BSC.
As per the vision of the company, RCOM emphasizes on “Employee
Centricity” and in this line two strategic measures selected by
researcher, employee satisfaction and organizational perception level.
Third objective of the study is:
To Measure Performance of Connection with good voice quality,
Performance for Resolution of billing / charging / validity complaints
and to Accessibility of call centre / customer care. This objective is to
measure Internal Business Process Perspective of BSC. To achieve an
efficient internal business processes that deliver services to the
customer in a timely fashion and adequately meets the customer’s
needs and allow the RCOM to comply with its social responsibilities
while meeting all regulatory requirements. As per vision of the
company, “Customer Experience” is enhanced through very high
standards and quality in all customer interactions. The relevant
strategic measures under this perspective are connection with good
voice quality, metering and billing credibility and accessibility of call
centre / customer care.
Forth objective of the study is:
To measure company’s financial performance in line with the
Financial Perspective of BSC.

Chapter: 3 Formulation of Research Plan and Procedure
141
As per the vision of the company, “By 2015, be among the top 3 most
valued Indian companies.” Strategic measures selected by researcher
for the purpose are: Earning per share, Return on Assets, Return on
equity, Return on Investment and Market value.
3.5 SOURCE OF THE DATA
The methodologies adopted for this study is a combination of
quantitative and qualitative methods. For the primary data source,
structured questionnaires were designed to collect data on the
strategic objectives of the company in order to identify relevant
measures being used under the four perspectives of the balanced
scorecard. Customers and employees survey of RCOM to collect data
on the identified measures in order to calculate them for the purpose
of analysis. This was most specifically targeted at collecting data on
metrics under customer perspective, the internal business processes
and, learning and growth perspectives.
3.6 SIGNIFICENT OF THE STUDY
We might need more balanced performance information to fully
assess an organization’s success. It seems that for all we have
learned, we remain stuck in the quagmire of financial measurements.
Perhaps tradition is serving as a guide unwilling to yield to the
present realities. Traditionally, the measurement of all organisations

Chapter: 3 Formulation of Research Plan and Procedure
142
has been financial. Bookkeeping records that are being used to
facilitate financial transactions can be traced back thousands of
years. At the turn of the twentieth century, financial measurement
innovations were critical to the success of the early industrial giants
like General Motors. The financial measures created at that time
were the perfect complement to the machinelike nature of the
corporate entities and management philosophy of the day.
Competition was ruled by scope and economic of scale, with
financial measures providing the yardsticks of success.
The situation is not different with what is happening in the Indian
telecom industry. The industry has failed to grow with changing
times. Performance of RCOM is not up to the mark and profitability
of RCOM was decreasing last two year. This is therefore a
debilitating factor to assessing true performance of RCOM with
respect to their strategies and goals. To overcome this limitation, the
Balanced Scorecard will be used to give a balanced and more holistic
approach to assessing performance of RCOM. Balanced Scorecard as
a carefully set of quantifiable measures derived from an
organisation’s strategy. The measures selected for the Scorecard
represent a tool for leaders to use in communicating to employees
and external stakeholders the outcomes and performance drivers by

Chapter: 3 Formulation of Research Plan and Procedure
143
which the organisation will achieve its mission and strategic
objectives. There are three elements to this tool thus it can be
implemented as measurement system, strategic management system,
communication tool or information tool.
This study will therefore focus on investigating in what respects the
balanced scorecard and measures in several dimensions provide
stakeholder with additional information regarding performance of
RCOM. The use of common measures is to provide for fairness,
standardization and ease of presentation on reporting performance of
RCOM.
3.7 RESEARCH METHODOLOGY
This study is based on the primary and secondary data. This data is
collected from various sources especially from published financial
annual report of company and structured questionnaire. The period
for measurement of financial performance is from FY 2006-07 to
2010-11and other related data are collected through Structured
Questionnaire filled up by Customers and Employees of Reliance
Communications respectively at Mumbai and working at the head
quarter of the (Mumbai) sample unit.
For collection of data for total performance measurement, balanced
scorecard for an organization, four main key performance indicators

Chapter: 3 Formulation of Research Plan and Procedure
144
(KPI) which are financial perspective, customer perspective, internal
business processes and learning and growth perspective are
considered in addition to the main strategic objectives of the
organization
Evaluating financial performance is a difficult task for researcher.
However the researcher has considered following key financial
performance indicator to measure financial performance.
1. Return on Asset (ROA) ;
2. Return on Equity (ROE)
3. Return on Investment (ROI)
4. Earnings Per Share (EPS)
5. Market Value
Those are describing at relevant chapter in details.
Questionnaire (for customers and employees perspectives)
To evaluate three key performance indicators (KPI) which are
customer perspective, internal business processes and learning &
growth perspective, structured questionnaires for customers and
employees of Reliance Communications will be prepared for
measuring the performance of above three performance indicators of
balanced scorecard. The researcher has prepared a structured
questionnaire in five point scaling technique.

Chapter: 3 Formulation of Research Plan and Procedure
145
For making the study more scientific and accurate, statistical tools
like F-Test and T-Test technique will be used.
An F-test is statistical test in which the test statistic has an F-
distribution under the null hypothesis. It is most often used when
comparing statistical models that have been fit to a data set, in order
to identify the model that best fits the population from which the data
were sampled.
A t-test is any statistical hypothesis test in which the test statistic
follows a Student's t distribution if the null hypothesis is supported. It
is most commonly applied when the test statistic would follow a
normal distribution if the value of a scaling term in the test statistic
were known. When the scaling term is unknown and is replaced by an
estimate based on the data, the test statistic (under certain conditions)
follows a Student's t distribution.
3.8 HYPOTHESES
Hypothesis is an important for any research work, as it is an
assumption in the mind of researcher before starting research. “A
hypothesis is a special proposition, formulated to be tested in a
certain given situation as a part of research which states what the
researcher is looking for.”2

Chapter: 3 Formulation of Research Plan and Procedure
146
In the present study following hypotheses have been tested:
Ho1: There is no significant difference in the mean score of
customers satisfaction of RCOM.
Ho2: There is no significant difference in the mean score of
Employees satisfaction of RCOM.
Ho3: There is no significant difference in the mean score of
Organisational perception of RCOM.
Ho4: The financial performance of RCOM is same during the
study period.
3.9 SAMPLE
Reliance Communications is one of the big telecom companies in
India. It has started its operation activity on December - 2002 on
the 70th birthday of Late Dhirubhai Ambani. Reliance
Communications has a reliable, high-capacity, integrated (Both
wireless & Wire line) and convergent (Voice, Data & Video)
digital network. It is capable of delivering a range of services
spanning the entire Infocomm (Information & Communication)
value chain, including infrastructure & services for enterprise as
well as individual’s application & consulting.11
The data collection would be as under:
Current Employee of Reliance Communications: researcher
approached 160 employee working at different level of which

Chapter: 3 Formulation of Research Plan and Procedure
147
final 100 questioners were considered for the study. (Working at
Head quarter of Reliance Communications, Mumbai)
Customers of Reliance communications: the researcher has
approached 500 customers of Mumbai city and collected data of
which 317 customers finally considered for the study.
3.10 CHAPTER PLAN
The present research study is presented in seven chapters, which are
as follow:
Chapter One: “Performance Measurement System”
This chapter covers: Performance Measurement: Introduction –
Performance Measurement in Management Literature – Performance
Measurement system – Objectives - Major Reference Model in
Performance Measurement system: Balanced Scorecard – Balanced
Scorecard Approaches – Criticism of the Balanced Scorecard -
Balanced scorecard Application in Industry.
Chapter Two: “Telecom Industry and Reliance
Communications”
This chapter covers: Global Telecom Industry – Indian Telecom
Industry – Growth in Indian Telecom Industry – Major Players in
Telecom Sector: Reliance Communications – Vision of the Company
– Financial Performance of Reliance Communications - Business
details of Reliance Communications.

Chapter: 3 Formulation of Research Plan and Procedure
148
Chapter Three: “Research Plan and Procedure”
This chapter deals with: Introduction – Research Problem – Review
of Literature - Objectives of the Study –Source of the Data –
Significant of the Study – Research Methodology – Hypotheses –
Chapter Plan – Limitations.
Chapter Four: “Customer Perspective Measurement”
This chapter contains: Introduction – Sample Profile – Responses of
the Customer regarding Preferences – Hypotheses Testing
Chapter Five: “Learning and Growth and Internal Business
process Perspective Measurement”
This chapter covers: Introduction: Learning and Growth Perspective
Measurement– Sample Profile –Analysis of Job Satisfaction –
Hypotheses Testing – Analysis of Organizational Perception –
Hypotheses Testing – Introduction: Internal Business Process
Perspective Measurement – Analysis of Internal Business Process
Perspective.
Chapter Six: “Financial Perspective Measurement”
This chapter deals with: Introduction – Financial Perspective
measurement
Chapter Seven: Summary, Findings and Conclusion
This chapter deals with: Balanced Scorecard of RCOM – Study of
Customer Perspective – Study of Learning and Growth Perspective –
Study of Internal Business Process Perspective - Study of Financial
Perspective – Overall Conclusion

Chapter: 3 Formulation of Research Plan and Procedure
149
3.11 LIMITATIONS
1. The study is conducted based on secondary data taken from
financial published in Annual report, so limitations of data will
affect the conclusion of research.
2. Customer perspective and Learning and Growth perspective is
measured through primary data, so limitations of data will affect
the conclusion of research.
3. Performance measurement is based on employees and customers
living in Mumbai, its conclusion may not be applicable for whole
market.
Chapter: 3 Formulation of Research Plan and Procedure
150
REFERENCES:
1. Kaplan, R. S. and Norton, D. P. (1996). Using the Balanced
Scorecard as a Strategic Management System. Harvard Business
Review, January – February, 75-85.
2. Letza, S. R. 1996. The design and implementation of the balanced
business scorecard: An analysis of three companies in practice.
Business Process Re-engineering & Management Journal 2 (3):
54-76.
3. Hoque, Z. and James, W. (2000), ‘‘Linking balanced scorecard
measures to size and market factors: impact on organizational
performance’’, Journal of Management Accounting Research,
Vol. 12, pp. 1-17.
4. www.balancedscorecard.org
5. Ittner, C. D., D. F. Larcker, and M. Meyer. 2003. Subjectivity and
the weighting of performance measures: Evidence from a balanced
scorecard. The Accounting Review 78 (3): 725-758.
6. Kaplan, R. S. and Norton, D. P.(1992). The Balanced Scorecard -
Measures that Drive Performance. Harvard Business Review,
January - February.

Chapter: 3 Formulation of Research Plan and Procedure
151
7. Speckbacher, G., Bischof, J. and Pfeiffer, T. (2003) ‘A descriptive
analysis on the implementation of Balanced Scorecards in
German-speaking countries’ Management Accounting Research,
Vol. 14 Issue 4, p361-389.
8. Malina, M. A., and F. H. Selto. 2001. Communicating and
controlling strategy: An empirical study of the effectiveness of the
balanced scorecard. Journal of Management Accounting Research
13: 47-90.
9. Ittner, C. D., D. F. Larcker, and M. Meyer. 2003. Subjectivity and
the weighting of performance measures: Evidence from a balanced
scorecard. The Accounting Review 78 (3): 725-758.
10. http://www.rcom.co.in/Rcom/personal/home/index.html
11. IBID
Chapter: 4 Customer Perspective Measurement
152
Chapter 4
Customer Perspective Measurement
4.1 Introduction
4.2 Sample Profile
4.3 Responses of the Customers regarding Preferences
4.4 Hypotheses Testing

Chapter: 4 Customer Perspective Measurement
153
4.1 INTRODUCTION
This chapter deals with one of the important perspective of
Balanced Scorecard (BSC), that is, Customer Perspective. For
effective implementation of RCOM strategy, strategic objectives
are broken down into measurable parameters. As per the vision of
the RCOM, customer experience is key strategic objective. If a
customer is not happy with the company customer service
delivery, that customer may definitely turn to other competitors
for better services of same or similar products. Therefore customer
satisfaction is relevant measures under this perspective. To
measure how the customers see the RCOM, the key performance
indicator (KPI) for customer perspective is customer satisfaction
level. The customer satisfaction index is the most important
because it’s directly linked to an organization’s profit. Service
delivery via various channels of IT applications has emerged as an
important attribute in satisfying customers. Therefore, a company
with very satisfied customers is able to create sustained
profitability and high growth rate. The company also benefits from
word of mouth advertising from its satisfied customers thereby
reducing its cost of advertising whiles at the same time increasing
its customer base. This therefore means that the higher the
satisfaction level, the higher the future profitability of an

Chapter: 4 Customer Perspective Measurement
154
organization may be. This study is based on a sample of 500
RCOM customers living in Mumbai city out of that 317
respondents has given information.
For this purpose, the researcher has prepared a structured
questionnaire regarding personal-individual customers and asking
questions mainly in the following areas:
1. Information about different age groups of RCOM customers
2. Awareness about RCOM products
3. Information about which type of mobile technology prefer and
use
4. Information about type of mobile connection use
5. Customer satisfaction level
4.2 SAMPLE PROFILE
The researcher has got 317 responses from the customers as under:
Table No. 4.1
Age Group of Customers
Age Group Frequency Percent Below 20 Years 55 17.4
20-40 years 209 65.9 Above 40 years 53 16.7
Total 317 100

Chapter: 4 Customer Perspective Measurement
155
Table No.4.1 indicates that from 317 respondents, there are 55
respondents from below 20 years, 209 respondents from 20-40
years and remain 37 respondents from above 40 years that is
65.9% from age group of 20-40 years, were below 20 years, 209
customers were age group of 20-40 years and 53 customers were
above 40 years.
Table No. 4.2
Occupation of Customers
In telecom business, occupation is very important of end users. The
occupation of the customers is divided in six groups, viz: students,
professionals, businessmen, service People, retired and housewives.
47.6% customers are having services, 24.3% customers are businessmen,
22.4% are students and the rest are others.
Occupation Frequency Percent Student 71 22.4
Professional 6 1.9 Business 77 24.3 Service 151 47.6 Retired 1 0.3
Housewife 11 3.5 Total 317 100

Chapter: 4 Customer Perspective Measurement
156
Table No. 4.3
Sex of Customers
In India, still female customers are less that the male customers in
telecom sector. This is proved here also. Sex wise distribution of sample
that 17% are female customers and 83% are male customers.
4.2 RESPONSES OF THE RCOM CUSTOMERS
As discussed earlier, the researcher has prepared a structured
questionnaire regarding different parameters for measuring
satisfaction level of RCOM customers’. The answer falls for each
parameter in five point scaling technique. The options were highly
satisfied, satisfied, can’t say, dissatisfied and highly dissatisfied. The
responses of RCOM customers regarding different parameters are as
under:
Gender Frequency Percent Male 263 83
Female 54 17 Total 317 100

Chapter: 4 Customer Perspective Measurement
157
Table No. 4.4
Information about Customer Satisfaction Level
Services Highly satisfied
satisfied can't say
dissatisfied Highly dissatisfied
Total
Customer care Count 22 179 57 45 14 317
% 6.94% 56.46% 17.98% 14.19% 4.43% 100%
Network Count 114 152 4 41 6 317
% 35.96% 47.94% 1.28% 12.93% 1.89% 100%
Cost Count 101 175 8 28 5 317
% 31.86% 55.20% 2.52% 8.85% 1.57% 100%
ISD Count 11 136 139 29 2 317
% 3.47% 42.90% 43.84% 9.16% 0.63% 100%
STD Count 14 150 123 26 4 317
% 4.41% 47.33% 38.80% 8.20% 1.26% 100%
Local Count 95 177 13 26 6 317
% 29.96 55.85 4.1 8.2 1.89 100%
SMS rates Count 93 83 110 27 4 317
% 29.33% 26.20% 34.70% 8.51% 1.26% 100%
Voice clarity Count 83 221 11 18 4 337
% 26.18% 63.40% 3.49% 5.67% 1.26% 100%
Technology Count 69 179 53 14 2 317
% 21.76% 56.46% 16.74% 4.41% 0.63% 100%
Product offer Count 32 230 43 10 2 317
% 10.09% 72.55% 13.58% 3.15% 0.63% 100%
Total 634 1662 561 264 49 3170
Avg 63.4 166.2 56.1 26.4 4.9
Round Avg 64 166 56 26 5 317
scale 5 4 3 2 1
Avg * scale 320 664 168 52 5 1209
Round Avg/avg*scale
3.81
4

Chapter: 4 Customer Perspective Measurement
158
Table No.4.4 shows the responses of customers regarding different types
of services provided by RCOM to the customer.
From the sampled RCOM customers, 6.94% customers are highly
satisfied regarding customer care service of RCOM, 56.46% are
satisfied, 17.98% are can’t say, 14.19% are dissatisfied and 4.43 are
highly dissatisfied on this services.
• Point No.2 is regarding Network. Here 47.94% are satisfied, 12.93% are
dissatisfied.
• Point No. 3 is regarding Cost of service. Here 31.86% and 55.20%
customer are respectively highly satisfied and satisfied regarding cost of
services and 8.85% are dissatisfied.
• Point No. 4, 5 and 6 is related with call rates of ISD, STD and Local
services. In ISD, 42.90% customer are satisfied, 43.84% are can’t say
and 9.16% customer dissatisfied. In STD, 47.33% customer are satisfied,
38.80% customer are can’t say. In Local call rates, 29.96% customers are
highly satisfied, 26.20% customers are satisfied and 8.2% customers are
dissatisfied.
• Point No. 7 is regarding SMS rates. Here 29.33% customers are highly
satisfied, 26.20% customers are satisfied and 8.51% customers are
dissatisfied for SMS rates.

Chapter: 4 Customer Perspective Measurement
159
• Point No. 8 is regarding voice clarity of mobile services. Here 26.28%
customers are highly satisfied, 63.40% customers are satisfied and
8.51% customers are dissatisfied.
• Pont No. 9 is regarding technology using by RCOM. Here 56.46%
customers are satisfied and 4.41% customers are dissatisfied for
Technology.
• Point No. 10 is regarding product offer. Here 10.09% customers are
highly satisfied, 72.55% customers are satisfied and 3.15% customers
are dissatisfied.
By observing this table, it can be said that most of the customers are
almost satisfied with different types of services provided by RCOM and
dissatisfied customers are very few.
Considering the overall average about satisfaction, the average scale is
3.81 out of 5; it means customer satisfaction score is 76% for RCOM
customers.
4.3 HYPOTHESE TESTING (1) Age Group and Customers’ Satisfaction
There are three age groups consider in the questionnaire. Different
type of age group has a different satisfaction level. This was tested
under the following hypothesis:

Chapter: 4 Customer Perspective Measurement
160
Null Hypothesis:
There is no significant difference in mean score of different age
groups and customers satisfaction of RCOM customers.
H0: µ1 = µ2 = µ3
H1: µ1 ≠ µ2 ≠ µ3
Where µ1 = Age group of below 20 years
µ2 = Age group of 20-40 years
µ3 = Age group of above 40 years
Table No. 4.5
Age and Customers’ Satisfaction
ANOVA CALCULATIONS
SS Df MS F Between Groups 2.503 2 1.251 5.799
Within Groups 67.756 314 0.216 Total 70.259 316
Age Group Customer Satisfaction Score
Total 20 to 40 40 to 60 60 to 80 Below 20 Years 3 41 11 55
20-40 Years 4 145 60 209 Above 40 Years 2 47 4 53
Total 9 233 75 317
Age Group N Mean SD Std.
Error Below 20 Years 55 2.15 0.488 0.066
20-40 Years 209 2.27 0.485 0.034 Above 40 Years 53 2.04 0.338 0.046
Total 317 2.21 0.472 0.026

Chapter: 4 Customer Perspective Measurement
161
Table value of F = 2.99
Level of Significance = 0.05
The above ANOVA table shows that the table value of F at 5%
level of significance is 2.99 and the calculated value of F is 5.799.
As, the calculated value of F is more its table value, null
hypothesis is rejected. It means that there is significant difference
in customers’ satisfaction regarding different age group. Age is a
major consideration for customers’ satisfaction.
(2) Occupation and Customers’ Satisfaction
Occupation of customers’ is divided in six groups, student,
professionals, business class, service class, retired and housewife.
If the occupation affects on customers’ satisfaction or not, was
tested as under:
Null Hypothesis:
There is no significant difference in mean score of occupation of
the respondents in customers’ satisfaction of RCOM customers.
H0: µ1 = µ2 = µ3 =µ4 = µ5 = µ6
H1: µ1 ≠ µ2 ≠ µ3≠ µ4 ≠ µ5 ≠ µ6

Chapter: 4 Customer Perspective Measurement
162
Where µ1 = Student
µ2 = Professional
µ3 = Business class
µ4 = Service class
µ5 = Retired
µ6 = Housewife
Table No.4.6
Occupation and Customers’ Satisfaction
Occupation Customer Satisfaction Score
Total 20 to 40 40 to 60 60 to 80 Student 0 45 26 71
Professional 1 5 0 6 Business 2 64 11 77 Service 6 110 35 151 Retired 0 1 0 1
Housewife 0 8 3 11 Total 9 233 75 317
Occupation N Mean SD Std.
Error Student 71 2.37 0.485 0.058
Professional 6 1.83 0.408 0.167 Business 77 2.12 0.396 0.045 Service 151 2.19 0.486 0.04 Retired 1 2 0 0
Housewife 11 2.27 0.467 0.141 Total 317 2.21 0.472 0.026
ANOVA CALCULATIONS
SS Df MS F Between Groups 3.386 5 0.677 3.15 Within Groups 66.873 311 0.215
Total 70.259 316

Chapter: 4 Customer Perspective Measurement
163
Table value of F = 2.21
Level of Significance = 0.05
The above ANOVA table shows that the table value of F at 5%
level of significance is 2.21 and the calculated value of F is 3.15.
As, the calculated value of F is more its table value, null
hypothesis is rejected. It means that there is significant difference
in customers’ satisfaction regarding their occupation also. The
occupation is major consideration for customers’ satisfaction or all
types of customers having different occupations have different
satisfaction level.
(3) Sex and Customers’ Satisfaction
Male and Female customers’ may have different satisfaction for
the preference of RCOM customers. The customers’ satisfaction
according to sex was tested as under:
Null Hypothesis:
There is no significant difference in mean score of customers’
satisfaction and gender in RCOM customers.
H0: µ1 = µ2
H1: µ1 ≠ µ2
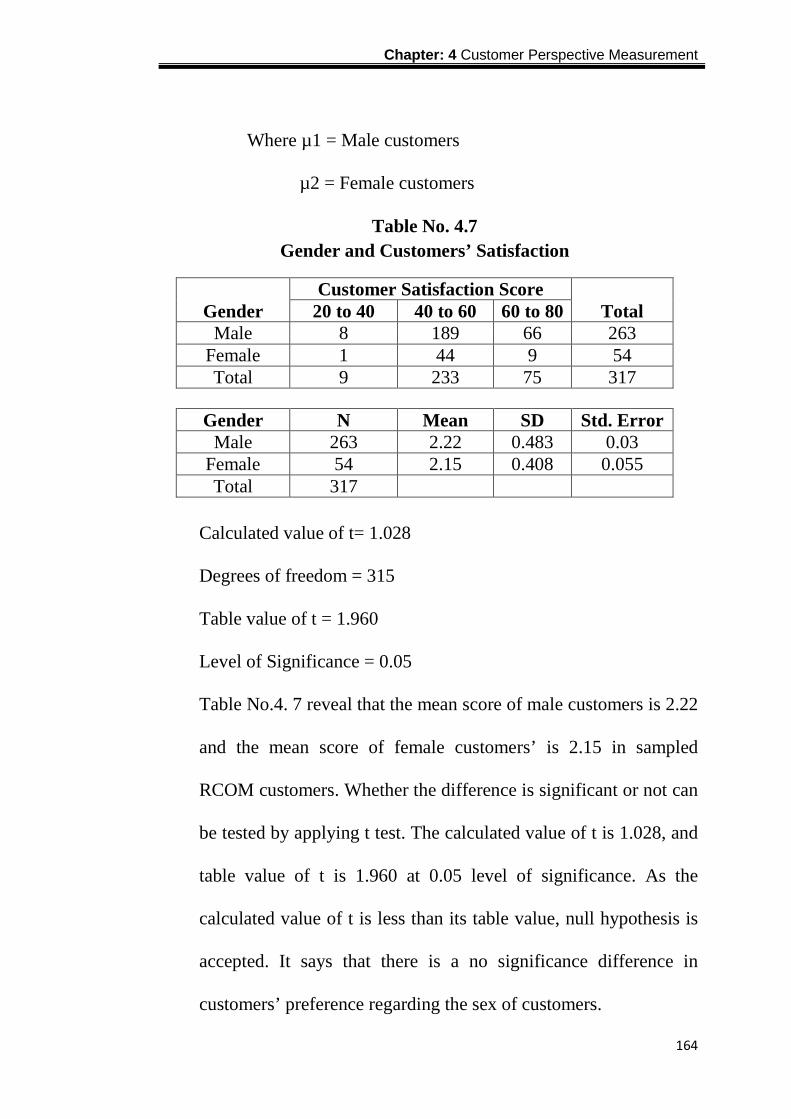
Chapter: 4 Customer Perspective Measurement
164
Where µ1 = Male customers
µ2 = Female customers
Table No. 4.7 Gender and Customers’ Satisfaction
Gender Customer Satisfaction Score
Total 20 to 40 40 to 60 60 to 80 Male 8 189 66 263
Female 1 44 9 54 Total 9 233 75 317
Gender N Mean SD Std. Error Male 263 2.22 0.483 0.03
Female 54 2.15 0.408 0.055 Total 317
Calculated value of t= 1.028
Degrees of freedom = 315
Table value of t = 1.960
Level of Significance = 0.05
Table No.4. 7 reveal that the mean score of male customers is 2.22
and the mean score of female customers’ is 2.15 in sampled
RCOM customers. Whether the difference is significant or not can
be tested by applying t test. The calculated value of t is 1.028, and
table value of t is 1.960 at 0.05 level of significance. As the
calculated value of t is less than its table value, null hypothesis is
accepted. It says that there is a no significance difference in
customers’ preference regarding the sex of customers.

Chapter: 4 Customer Perspective Measurement
165
(4) Types Of Mobile Technology and Customers’ Satisfaction
There are two types of mobile technology are available in the market,
first one GSM and second one is CDMA. RCOM is providing both
the types of technology to its customers. If the types of mobile
technology affect on customers’ satisfaction or not, were tested as
under:
Null Hypothesis:
There is no significant difference in mean score of types of mobile
technology using and customers’ satisfaction of RCOM customers.
H0: µ1 = µ2 = µ3 =µ4
H1: µ1 ≠ µ2 ≠ µ3≠ µ4
Where µ1 = CDMA
µ2 = GSM
µ3 = Both Technology
µ4 = Don’t Know
Table No. 4.8
Types of Mobile Technology and Customers’ Satisfaction Mobile Customer Satisfaction Score
Total Technology using 20 to 40 40 to 60 60 to 80 CDMA 1 51 39 91 GSM 4 142 29 175 Both 4 37 7 48
Don't Know 0 3 0 3 Total 9 233 75 317
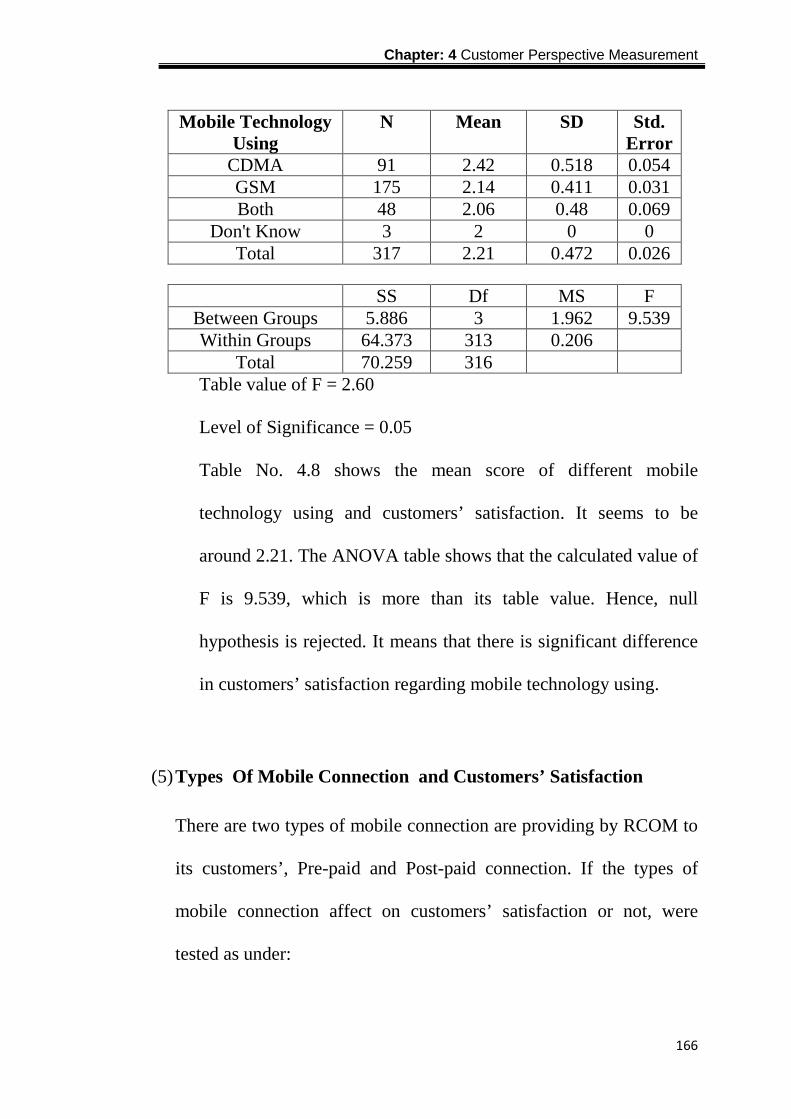
Chapter: 4 Customer Perspective Measurement
166
Mobile Technology Using
N Mean SD Std. Error
CDMA 91 2.42 0.518 0.054 GSM 175 2.14 0.411 0.031 Both 48 2.06 0.48 0.069
Don't Know 3 2 0 0 Total 317 2.21 0.472 0.026
SS Df MS F Between Groups 5.886 3 1.962 9.539 Within Groups 64.373 313 0.206
Total 70.259 316 Table value of F = 2.60
Level of Significance = 0.05
Table No. 4.8 shows the mean score of different mobile
technology using and customers’ satisfaction. It seems to be
around 2.21. The ANOVA table shows that the calculated value of
F is 9.539, which is more than its table value. Hence, null
hypothesis is rejected. It means that there is significant difference
in customers’ satisfaction regarding mobile technology using.
(5) Types Of Mobile Connection and Customers’ Satisfaction
There are two types of mobile connection are providing by RCOM to
its customers’, Pre-paid and Post-paid connection. If the types of
mobile connection affect on customers’ satisfaction or not, were
tested as under:

Chapter: 4 Customer Perspective Measurement
167
Null Hypothesis:
There is no significant difference in mean score of types of mobile
connection and customers’ satisfaction of RCOM customers.
H0: µ1 = µ2 = µ3
H1: µ1 ≠ µ2 ≠ µ3
Where µ1 = Pre-paid type connection
µ2 = Post-paid type connection
µ3 = both types of connection
Table No. 4.9 Types of Mobile Connection and Customers’ Satisfaction
Type of Mobile Customer Satisfaction Score Total Connection 20 to 40 40 to 60 60 to 80
Pre-paid 7 171 60 238 Post-paid 2 56 13 71
Both 0 6 2 8 Total 9 233 75 317
Type of Mobile
Connection N Mean SD Std.
Error Pre-paid 238 2.22 0.483 0.031 Post-paid 71 2.15 0.436 0.052
Both 8 2.25 0.463 0.164 Total 317 2.21 0.472 0.026
SS Df MS F Between Groups 0.265 2 0.133 0.595 Within Groups 69.993 314 0.223
Total 70.259 316

Chapter: 4 Customer Perspective Measurement
168
Table value of F = 2.99
Level of Significance = 0.05
Table No. 4.9 shows the mean score of different type’s mobile
connection and customers’ satisfaction. It seems to be around
2.21. The ANOVA table shows that the calculated value of F is
0.595, which is less than its table value. Hence, null hypothesis is
accepted. It means that there is no significant difference in
customers’ satisfaction regarding types of mobile connection
using.
(6) Time Period Of Connection and Customers’ Satisfaction
Those are RCOM customers’, how long they are using this
connection is divided in less than 3 months, 3-6 months, 6-12
months and 1-2 years. If the time period of connection affect on
customers’ satisfaction or not, were tested as under:
Null Hypothesis:
There is no significant difference in mean score of time period
connection and customers’ satisfaction of RCOM customers.
H0: µ1 = µ2 = µ3=µ4
H1: µ1 ≠ µ2 ≠ µ3≠µ4

Chapter: 4 Customer Perspective Measurement
169
Where µ1 = Less than 3 months µ2 = 3-6 months µ3 = 6-12 months µ4 = 1-2 years
Table No. 4.10
Time Period of Mobile Connection and Customers’ Satisfaction
Time period of Mobile Customer Satisfaction Score Total Connection Using 20 to 40 40 to 60 60 to 80
Less than 3 months 1 1 0 2 3-6 months 1 25 20 46 6-12 months 3 41 19 63
1-2 Years 4 166 36 206 Total 9 233 75 317
Time period of Mobile Connection Using N Mean SD
Std. Error
Less than 3 months 2 1.5 0.707 0.5 3-6 months 46 2.41 0.541 0.08 6-12 months 63 2.25 0.538 0.068
1-2 Years 206 2.16 0.413 0.029 Total 317 2.21 0.472 0.026
SS Df MS F Between Groups 3.641 3 1.214 5.702 Within Groups 66.618 313 0.213
Total 70.259 316
Table value of F = 2.60
Level of Significance = 0.05
Table No. 4.10 shows the mean score of different time period of
mobile connection and customers’ satisfaction. It seems to be
around 2.21. The ANOVA table shows that the calculated value of
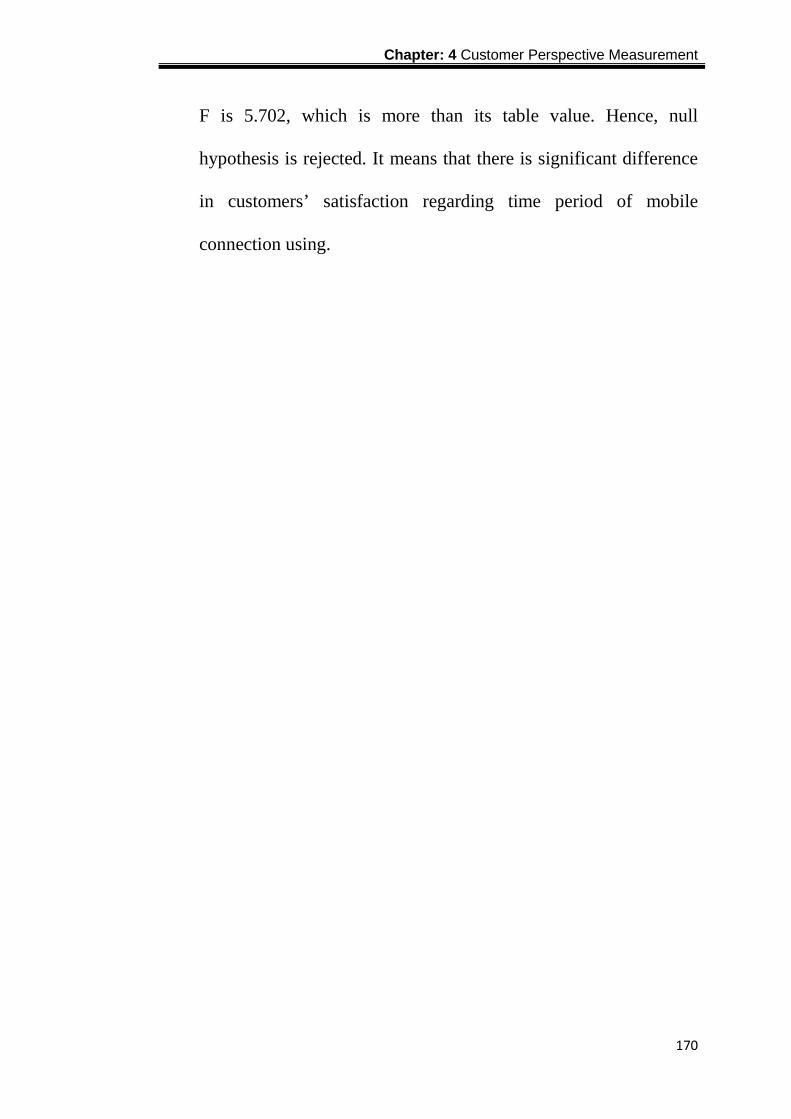
Chapter: 4 Customer Perspective Measurement
170
F is 5.702, which is more than its table value. Hence, null
hypothesis is rejected. It means that there is significant difference
in customers’ satisfaction regarding time period of mobile
connection using.

Chapter: 5 Learning and Growth & Internal Business Process Perspective Measurement
171
Chapter 5
LEARNING AND GROWTH AND INTERNAL BUSINESS PROCESS PERSPECTIVE MEASUREMENT
5.1 Introduction: Learning and Growth Perspective Measurement
5.2 Sample Profile
5.3 Analysis of Job Satisfaction
5.4 Hypotheses Testing
5.5 Analysis of Organizational Perception
5.6 Hypotheses Testing
5.7 Introduction: Internal Business Process Perspective
Measurement
5.8 Analysis of Internal Business Process Perspective

Chapter: 5 Learning and Growth & Internal Business Process Perspective Measurement
172
5.1 INTRODUCTION: LEARNING AND GROWTH
PERSPECTIVE
This chapter deals with second perspective of Balanced Scorecard
(BSC), that is, Learning and Growth perspective. A learning
organization is a knowledgeable organization. An organization that
empowers its staff and resource them adequately will surely reap
the benefit in term of superior performance and growth. For most
organization that has treated their employees as their most critical
resource they have often been rewarded with higher and sustained
profit. There is a saying that, “You cannot give what you don’t
have”. Therefore organizations with dissatisfied employees will
often find out that, their customer service efforts are always not
without problems. They may have very brilliant customer service
framework or model, but will have serious issues implementing it
because they have dissatisfied employees. Poor customer service
delivery then affects customer satisfaction.
Under the learning and growth perspective, three areas emerged
which are human capital, information capital and organizational
capital. The framework is aimed at creating the right strategic
alignment between employee goals and that of the Rcom so as to
create the right synergies to enable the employee deliver superior
Chapter: 5 Learning and Growth & Internal Business Process Perspective Measurement
173
service to the customer. As per the vision of the Rcom, Employee
centricity is the key strategic objective. The key measures here that
are relevant to the RCOM are job satisfaction and organizational
perception index which is driven by the main strategic objective.
This study is based on a sample survey of 100 RCOM employees
working at head quarter in Mumbai city.
For this purpose, the researcher has prepared a structured
questionnaire regarding RCOM employees and asking questions
mainly in the following areas:
(1) Information about different age groups of RCOM employees
(2) Information about education details of RCOM employees
(3) Information about average length of service of RCOM
employees
(4) Job satisfaction index
(5) Organizational perception index
5.2 SAMPLE PROFILE
This study is based on sample survey of 100 RCOM employees of 5
departments of organization at Mumbai city. As such has been
pointed out in the research methodology, the data were collected by

Chapter: 5 Learning and Growth & Internal Business Process Perspective Measurement
174
administering a well structured schedule by the researcher. The
sample RCOM employees were chosen by way of the mix of the
stratified and the convenience sampling techniques used at multi-
stages. Efforts were made to insure the representation of the various
departments of the organization and various designation level of the
organization.
Out of the 100 sampled employees 47 were sales department, 12
were finance department, 18 from network department, 13 from
customer service department and 10 from Human Resources
department.
Table No. 5.1 Departments wise Employees in RCOM
Departments Frequency Percent Sales 47 47.0
Finance 12 12.0 Network 18 18.0
Customer Service 13 13.0 HR 10 10.0
Total 100 100
Out of the 100 sampled employees 24% are executive level, 17%
were senior Executive level, 16% were manager level, 9% were
senior manager level, 14% were deputy Manager level, 15% were
deputy general manager level and remained 5% were general
manager level. As per organization structure employees divided into

Chapter: 5 Learning and Growth & Internal Business Process Perspective Measurement
175
four levels L1, L2, L3 and L4. Out of 100 sampled employees 5%
were L1 level, 15% were L2 level, 40% were L3 level and 40% were
L4 level. Designation and level is one of the important factors that
affect the job satisfaction and organizational perception.
Table No. 5.2
Designation wise Employees in RCOM
Table No. 5.3
Level wise Employees in RCOM
Education has increasingly becoming an important factor in
determining the quality of work and performance. In telecom
industry academic qualification is important because major
Designation Frequency Percent Executive 24 24.0
Senior Executive 17 17.0 Manager 16 16.0
Senior Manager 9 9.0 Deputy Manager 14 14.0
Deputy General Manager 15 15.0 General Manager 5 5.0
Total 100 100
Level Frequency Percent L1 5 5.0 L2 15 15.0 L3 40 40.0 L4 40 40.0
Total 100 100

Chapter: 5 Learning and Growth & Internal Business Process Perspective Measurement
176
function of telecom industry related with better technology and
quick services to customer.
Table No. 5.4 Educational Qualification of RCOM Employees
Table No. 5.4 shows that educational qualifications of RCOM
sampled employees. According to the table 2% belong to under
graduate, 6% to diploma, 40% to graduate and 52% to post
graduate.
The experience of employees of the organization is bound to have
impact on the quality of professional service and leadership. The
contribution of employees whether individually or collectively
will be influenced also by their age factor. While the relationship
between age and job satisfaction and organizational perception
could be complex; it was assumed that the person would grow
older; he would get greater satisfaction and favorable
organizational perception with his job. So, experience of
Educational Qualification Frequency Percent
Under Graduate 2 2.0 Diploma 6 6.0 Graduate 40 40.0
Post Graduate 52 52.0 Total 100 100

Chapter: 5 Learning and Growth & Internal Business Process Perspective Measurement
177
employees in a particular job is an important variable in tracing
out the association with job satisfaction and organizational
perception.
Table No. 5.5 Length of Service of RCOM Employees
Length of Service (Years) Frequency Percent
1 27 27.0 2 30 30.0 3 21 21.0 4 10 10.0 5 7 7.0 6 3 3.0 7 1 1.0 10 1 1.0
Total 100 100
Above Table No. 5.5 shows that 27% completed 1 year service,
30% completed 2 year service, 21% completed 3 year service,
10% completed 4 year service, 7% completed 5 year service, 3%
completed 6 year service and 1% completed 7 year and 10 year
service. In overall picture, 88% total staff belongs to below five
years of experience and 12% staff belongs to more than five years
of experience.
Marital status is also an important phenomenon to study job
satisfaction and organizational perception for the married and un-

Chapter: 5 Learning and Growth & Internal Business Process Perspective Measurement
178
married people have different behavior at work. Generally, one
would assume that with increasing responsibility placed on
married individuals, the employees value their jobs little more
that an unmarried employees.
Table No. 5.6
Marital Status of RCOM Employees
Table No.5.6 shows that all the sampled employees 68% were
married and 32% were unmarried.
5.3 ANALYSIS OF JOB SATISFACTION
This part deals with job satisfaction of RCOM employees. It
broadly covers the personal characteristics and their association
with job satisfaction. Job satisfaction covers four basis factors 1)
economic factors, 2) social factors, 3) organizational factors, and 4)
personal factors. Economic aspect cover pay, allowances, etc.
social factors consider interpersonal relationships, freedom at job,
family environment and tension etc. While organizational factors
consider authority responsibility, accountability, performance
appraisal, works involvement etc. Personal matter includes
Marital Status Frequency Percent Married 68 68.0
Un-married 32 32.0 Total 100 100

Chapter: 5 Learning and Growth & Internal Business Process Perspective Measurement
179
education, designation, experience etc. The extent to which the job
provides opportunities for meeting economic, social and
psychological needs of employees will determine their job
satisfaction. Job satisfaction has been analyzed on the basis of
several questions which covers most of the aspects of management.
An attempt has been made to cover, job satisfaction, with reference
to pay and monetary benefits, behavior of subordinates and
superior, authority, confidence and trust opportunity to growth and
development, clarity to given authority, responsibility and
accountability, team efforts, job involvement, welfare, promotion
and development, recognition, autonomy, training facilities,
conducive and hygienic work environment, grievances handling
procedure, incentives, motivational practices, performance
evaluation challenges and threats for job, job security and
treatment from management.
This part deals with all the aspects to examine the job satisfaction
among RCOM employees. For this, the schedule of questions
included eighteen questions of the sampled RCOM employees
were asked to respond to all these statements on five point scale.
Strongly agree with a statement denotes highest job satisfaction

Chapter: 5 Learning and Growth & Internal Business Process Perspective Measurement
180
while strongly disagree to least job satisfaction. The responses to
the all the statements for all employees are shown Table No. 5.7.
Table No. 5.7
Information about Employees’ Job Satisfaction Level
Sr. No. Statements
Strongly Agree Agree
Can’t Say Disagree
Strongly Disagree
1 I am satisfied with my Pay and other Monetary Benefits; I receive for my present job.
25 30 14 23 8
2 I am satisfied with the behavior of my colleagues 33 55 12 0 0 3 I am satisfied with superior authority in the
organization 41 44 14 1 0
4 There are enough opportunity of my progress in this organization
26 58 16 0 0
5 My responsibility are clearly known to me in relation to my present job
26 60 0 14 0
6 Promotion are purely based on merit and work skill
30 27 43 0 0
7 I have the resources (materials, equipments, suppliers etc.) necessary to do my job well
19 55 17 9 0
8 I am satisfied with the autonomy given to me to do my work
8 67 22 3 0
9 Work environment is quite conducive and hygienic and I am fully satisfied
90 3 7 0
10 My institution is very popular and I am proud to work in the institution
29 69 1 1 0
11 I am satisfied with the grievance handling procedure and justice given to the employees
3 44 52 1 0
12 I am satisfied with the incentives and other motivational practices adopted by management
3 37 43 17 0
13 I am fully satisfied with the evaluation of performance
16 51 14 19 0
14 My work is full of challenge and I believe in doing such work
57 24 8 11 0
15 I am satisfied with job security given to me 9 32 23 17 19
16 I get dignified treatment from management 9 71 20 0 0
17 I feel free to speak my mind 8 46 26 20 0
18 I enjoy coming to work 11 76 13 0 0
Total 353 936 341 143 27
Avg 19.611 52 18.944 7.944 1.5
Round Avg 20 52 19 8 1
scale 5 4 3 2 1
Avg * scale 100 208 57 16 1
Round Avg/avg*scale 3.82

Chapter: 5 Learning and Growth & Internal Business Process Perspective Measurement
181
Table No. 5.7 indicate 20 strongly agreed employees, 52 agreed,
19 can’t say, 8 and 1 remain disagree and strongly disagreed with
job satisfaction. Considering the overall average about job
satisfaction, the average scale is 3.82 out of 5; it means job
satisfaction index is 76% for RCOM employees.
5.4. HYPOTHESE TESTING
(1) Age Group and Job Satisfaction
There are four age groups consider in the questionnaire. A
different type of age group has a different satisfaction level. This
was tested under the following hypothesis:
Null Hypothesis: There is no significant difference in mean score of different age
groups and job satisfaction of RCOM employees.
H0: µ1 = µ2 = µ3 = µ4 H1: µ1 ≠ µ2 ≠ µ3 ≠ µ4`
Where µ1 = Age group of 20-30 years
µ2 = Age group of 30-40 years
µ3 = Age group of 40-50 years
µ4 = Age group of 50 - 60 years

Chapter: 5 Learning and Growth & Internal Business Process Perspective Measurement
182
Table No. 5.8 Age and Job Satisfaction
Age Group N Mean SD Std.
Error 20 to 30 Years 46 2.3 0.986 0.145 30 to 40 Years 49 2.69 0.94 0.134 40 to 50 Years 3 2.67 1.528 0.882 50 to 60 Years 2 2 1.414 1
Total 100 2.5 0.99 0.099
ANOCA CALCULATIONS
SS df MS F Between Groups 4.186 3 1.395 1.443 Within Groups 92.814 96 0.967
Total 97 99
Table value of F = 2.68
Level of Significance = 0.05
The above ANOVA table shows that the table value of F at 5%
level of significance is 2.68 and the calculated value of F is 1.443.
As the calculated value of F is less than its table value, null
hypothesis is accepted. It means that there is no significant
difference in employees’ satisfaction regarding different age
group.
(2) Departments and Job Satisfaction There are five different departments consider in the questionnaire.
Employee working into different departments has a different
satisfaction level. This was tested under the following hypothesis:

Chapter: 5 Learning and Growth & Internal Business Process Perspective Measurement
183
Null Hypothesis: There is no significant difference in mean score of different
departments’ employee and job satisfaction of RCOM employees.
H0: µ1 = µ2 = µ3 = µ4 = µ5 H1: µ1 ≠ µ2 ≠ µ3 ≠ µ4 ≠ µ5
Where µ1 = Sales department employees
µ2 = Finance department employees
µ3 = Network department employees
µ4 = Customer service department
Employees.
µ5 = HR department employees
Table No. 5.9
Department and Job Satisfaction
Departments N Mean SD Std. Error Sales 47 2.53 0.929 0.136
Finance 12 2.83 0.718 0.207 Network 18 2.22 0.732 0.173
Customer Service 13 2.92 1.256 0.348 HR 10 1.9 1.287 0.407
Total 100 2.5 0.99 0.099

Chapter: 5 Learning and Growth & Internal Business Process Perspective Measurement
184
ANOVA CALCULATIONS
SS Df MS F Between Groups 8.697 4 2.174 2.339 Within Groups 88.303 95 0.93
Total 97 99
Table value of F = 2.45
Level of Significance = 0.05
The above ANOVA table shows that the table value of F at 5%
level of significance is 2.45 and the calculated value of F is 2.339.
As the calculated value of F is less than its table value, null
hypothesis is accepted. It means that there is no significant
difference in employees’ satisfaction regarding working into
different departments.
(3) Designation of Employee and Job Satisfaction :
There are different level of designation consider from executive to
general manager in the questionnaire. Employee working at
different level of designation so they have a different job
satisfaction level. This was tested under the following hypothesis:
Null Hypothesis:
There is no significant difference in mean score of different level
of designation employee and job satisfaction of RCOM
employees.

Chapter: 5 Learning and Growth & Internal Business Process Perspective Measurement
185
H0: µ1 = µ2 = µ3 = µ4 = µ5 = µ6 = µ7 H1: µ1 ≠ µ2 ≠ µ3 ≠ µ4 ≠ µ5 ≠ µ6 ≠ µ7
Where µ1 = Executive level employees
µ2 = Sr.Executive level employees
µ3 = Manager level employees
µ4 = Dy.Manager level employees
µ5 = Sr.Manager level employees
µ6 = Dy. Gen.Manager level employees
µ7 = General Manager level employees
Table No. 5.10
Designation and Job Satisfaction
Designation N Mean SD Std. Error Executive 24 2.54 0.977 0.199
Sr. Executive 17 2.12 1.054 0.256 Manager 16 2.75 0.931 0.233
Sr. Manager 9 2.44 0.882 0.294 Dy. Manager 14 2.57 1.016 0.272
Dy. Gen.Manager 15 2.6 0.986 0.254 Gen. Manager 5 2.4 1.342 0.6
Total 100 2.5 0.99 0.099
ANOVA CALCULATIONS
SS df MS F Between Groups 3.826 6 0.638 0.637 Within Groups 93.174 93 1.002
Total 97 99

Chapter: 5 Learning and Growth & Internal Business Process Perspective Measurement
186
Table value of F = 2.17
Level of Significance = 0.05
The above ANOVA table shows that the table value of F at 5%
level of significance is 2.17 and the calculated value of F is 0.637.
As the calculated value of F is less than its table value, null
hypothesis is accepted. It means that there is no significant
difference in employees’ satisfaction regarding working at
different level of designation.
(4) Educational Qualification of Employee and Job Satisfaction
There are different educational qualification employees’ workings
into organization and researcher considers four level of
educational qualification from under graduate to post graduate
into the questionnaire. Different educational groups’ employees
have a different level of job satisfaction. This was tested under the
following hypothesis:
Null Hypothesis: There is no significant difference between means scores of
different educational groups in job satisfaction of RCOM
employees.

Chapter: 5 Learning and Growth & Internal Business Process Perspective Measurement
187
H0: µ1 = µ2 = µ3 = µ4 H1: µ1 ≠ µ2 ≠ µ3 ≠ µ4
Where µ1 = Under Graduate employees
µ2 = Diploma Holder employees
µ3 = Graduate employees
µ4 = Post Graduate employees
Table No. 5.11
Educational Qualification and Job Satisfaction
Educational Qualification N Mean SD Std. Error Under Graduate 2 1 0 0
Diploma 6 1.83 0.983 0.401 Graduate 40 2.63 0.838 0.132
Post Graduate 52 2.54 1.056 0.147 Total 100 2.5 0.99 0.099
ANOVA CALCULATIONS
SS Df MS F Between Groups 7.869 3 2.623 2.825 Within Groups 89.131 96 0.928
Total 97 99
Table value of F = 2.68
Level of Significance = 0.05
The above ANOVA table shows that the table value of F at 5%
level of significance is 2.68 and the calculated value of F is 2.825.
As the calculated value of F is more than its table value, null

Chapter: 5 Learning and Growth & Internal Business Process Perspective Measurement
188
hypothesis is rejected. It means that there is significant difference
between the mean score of job satisfaction among different
educational groups of RCOM employees’.
(5) Length of Services and Job Satisfaction Different length of services employees has a different level of job
satisfaction. This was tested under the following hypothesis:
Null Hypothesis:
There is no significant correlation between length of services
and means scores of job satisfaction of RCOM employees.
H0: µ1 = µ2 = µ3 = µ4 = µ5 = µ6 = µ7 = µ8 H1: µ1 ≠ µ2 ≠ µ3 ≠ µ4 ≠ µ5 ≠ µ6 ≠ µ7 ≠ µ8
Where µ1 = One year length of service employees
µ2 = Two year length of service employees
µ3 = Three year length of service employees
µ4 = Four year length of service employees
µ5 = Five year length of service employees
µ6 = Six year length of service employees
µ7 = Seven year length of service employees
µ8 = Ten year length of service employees
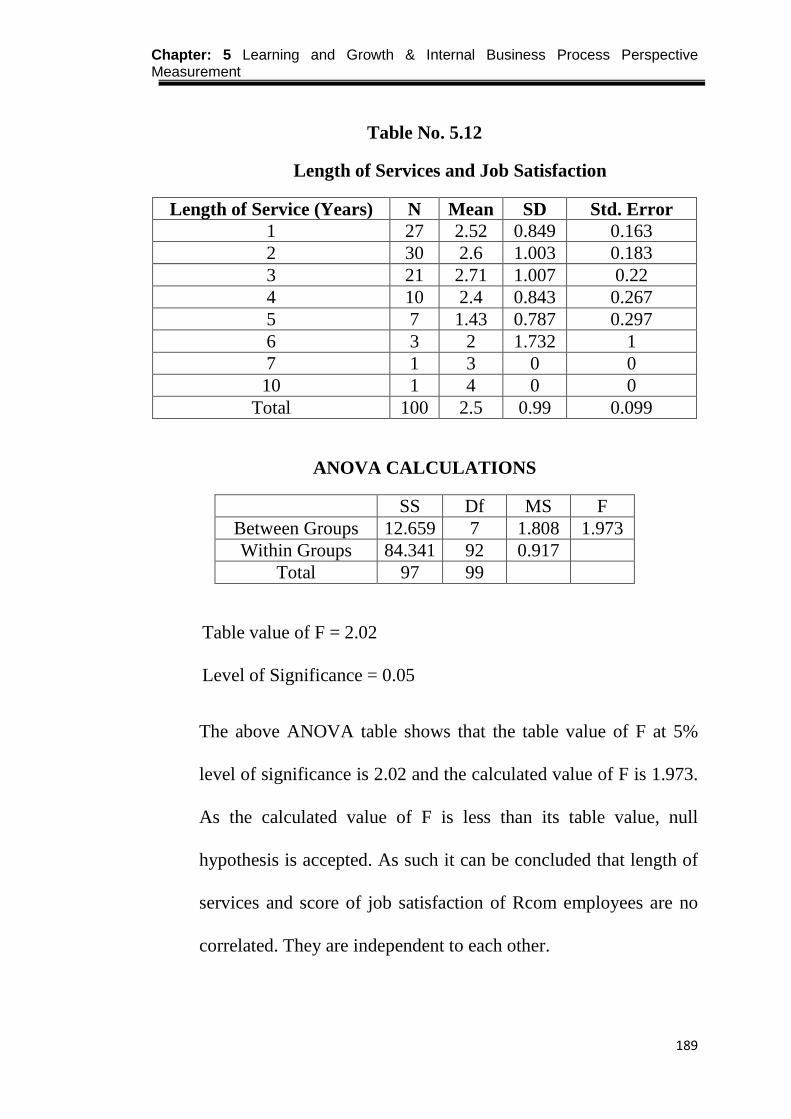
Chapter: 5 Learning and Growth & Internal Business Process Perspective Measurement
189
Table No. 5.12
Length of Services and Job Satisfaction
Length of Service (Years) N Mean SD Std. Error 1 27 2.52 0.849 0.163 2 30 2.6 1.003 0.183 3 21 2.71 1.007 0.22 4 10 2.4 0.843 0.267 5 7 1.43 0.787 0.297 6 3 2 1.732 1 7 1 3 0 0 10 1 4 0 0
Total 100 2.5 0.99 0.099
ANOVA CALCULATIONS
SS Df MS F Between Groups 12.659 7 1.808 1.973 Within Groups 84.341 92 0.917
Total 97 99
Table value of F = 2.02
Level of Significance = 0.05
The above ANOVA table shows that the table value of F at 5%
level of significance is 2.02 and the calculated value of F is 1.973.
As the calculated value of F is less than its table value, null
hypothesis is accepted. As such it can be concluded that length of
services and score of job satisfaction of Rcom employees are no
correlated. They are independent to each other.

Chapter: 5 Learning and Growth & Internal Business Process Perspective Measurement
190
5.5 ANALYSIS OF ORGANIZATIONAL PERCEPTION
Every person lives in his own world. Human-being is what
human-beings experience. It is what the human-beings perceive by
feeling, thinking and imagine. Perception is defined as the process
by which human-beings screen, select, organize and interpret
stimuli into the meaningful picture of the world. The manner in
which man perceives in world provides a basis for behavior. To be
effective, a manager must understand how people perceive event,
objects and other people. It is try that people perceive is some
things and the same people differently is not objective reality,
Thus, because people act on what they perceive to be true,
perception is in a real sense equal in importance to reality.
Perception depends on the interaction of two sets of contributions,
those of the environment (in the form of stimuli) and those of the
observer. An individual may influence his or her environment as
well as influenced by it. Therefore, behavior is a product of the
interaction between an environment and individual rather than
simply a reaction to an environment.
This part deals with analysis of organizational perception of
RCOM employees. In this connection, an attempt has been made
to understand RCOM employees perception with respect to co-

Chapter: 5 Learning and Growth & Internal Business Process Perspective Measurement
191
operation and support among staff, delegation of authority,
opportunity for growth, fear and favor of supervision, promotion,
substandard work, operational difficulties and managerial
consideration, grievance, intervention, management and control
mechanism, team and its performance.
For studying all those aspect the researcher very judiciously
selected thirteen different statements and asked the sampled RCOM
employees to respond the each statement on a five point scale.
Strongly agree to statement denotes most favorable perception
while the strongly disagreed denotes the most antarourable
perception. The responses for all the statements related to
organizational perception for that all employees are shown into
following table;

Chapter: 5 Learning and Growth & Internal Business Process Perspective Measurement
192
Table No. 5.13
Information about Employees’ Organizational Perception Level
Sr. No. Statements
Strongly Agree Agree
Can’t Say Disagree
Strongly Disagree
1 I am free to raise questions and make suggestion and comments in the organization
17 49 23 11 0
2 The authority and responsibility in the organization are well defined
16 44 29 11 0
3 There are enough opportunities in the origination for further growth and development
23 43 25 9 0
4 Supervision is done without any fear or favor
15 48 25 11 0
5 We make opportunities to participate in decision making
5 43 25 27 0
6 We have clear cut idea about who is working under whom
23 56 9 12 0
7 Interpersonal Relationship are good 29 59 8 4 0
8 Merit is the prime consideration for reward
22 42 24 2 10
9 All instruction in organization are effectively communicated
17 47 36 0
10 The management is fully aware and committed to overall welfare of employees
5 37 54 4 0
11 I understand the connection between the work I do and mission and goals of the Organization
18 52 25 5 0
12 I am familiar with Organization Vision and Mission
31 41 15 13 0
13 I am proud to be a part of R-Com 38 57 5 0
Total 259 618 303 109 10
Avg 19.9230769 47.538462 23.307692 8.3846154 0.7692308
Round Avg 20 48 23 8 1
scale 5 4 3 2 1
Avg * scale 100 192 69 16 1
Round Avg/avg*scale 3.78
As per Table No. 5.13, 20 strongly agreed employees, 48 agreed, 23
can’t say, 8 and 1 disagreed and strongly agreed for the different

Chapter: 5 Learning and Growth & Internal Business Process Perspective Measurement
193
aspects related to organizational perception. This way the average
score of organizational perception at 5 point scale the employees
were found 3.78 which shows that on an average the employees have
favorable perception of organizational aspects at the job. It means
organizational perception index is 76% for RCOM employees.
5.6 HYPOTHESES TESTING
(1) Age Group and Organizational perception
There are four age groups consider in the questionnaire. Different
type of age group has a different level of organizational
perception. This was tested under the following hypothesis:
Null Hypothesis: There is no significant correlation between mean age groups
and mean score of organizational perception of RCOM
employees.
H0: µ1 = µ2 = µ3 = µ4 H1: µ1 ≠ µ2 ≠ µ3 ≠ µ4`
where µ1 = Age group of 20-30 years µ2 = Age group of 30-40 years
µ3 = Age group of 40-50 years µ4 = Age group of 50 - 60 years

Chapter: 5 Learning and Growth & Internal Business Process Perspective Measurement
194
Table No. 5.14
Age and Organizational Perception
Age Group N Mean SD Std. Error 20 to 30 Years 46 2.8 0.719 0.106 30 to 40 Years 49 3.06 0.827 0.118 40 to 50 Years 3 3.33 0.577 0.333 50 to 60 Years 2 3 1.414 1
Total 100 2.95 0.783 0.078
ANOVA CALCULATIONS
SS df MS F Between Groups 2.028 3 0.676 1.105 Within Groups 58.722 96 0.612
Total 60.75 99
Table value of F = 2.68
Level of Significance = 0.05
The above ANOVA table shows that the table value of F at 5%
level of significance is 2.68 and the calculated value of F is1.105.
As the calculated value of F is less than its table value, null
hypothesis is accepted. It means that there is no correlation
between different age groups and organizational perception.

Chapter: 5 Learning and Growth & Internal Business Process Perspective Measurement
195
(2) Departments and Organizational Perception There are five different departments consider in the questionnaire.
Employee working into different departments has a different level
of organizational perception. This was tested under the following
hypothesis:
Null Hypothesis: There is no significant difference in mean score of different
departments’ employee and organizational perception of RCOM
employees.
H0: µ1 = µ2 = µ3 = µ4 = µ5 H1: µ1 ≠ µ2 ≠ µ3 ≠ µ4 ≠ µ5
Where µ1 = Sales department employees
µ2 = Finance department employees
µ3 = Network department employees
µ4 = Customer service department
Employees.
µ5 = HR department employees

Chapter: 5 Learning and Growth & Internal Business Process Perspective Measurement
196
Table No. 5.15
Department and Organizational Perception
Departments N Mean SD Std. Error Sales 47 3 0.808 0.118
Finance 12 3 0.603 0.174 Network 18 2.61 0.698 0.164
Customer Service 13 3.31 0.855 0.237 HR 10 2.8 0.789 0.249
Total 100 2.95 0.783 0.078 ANOVA CALCULATIONS
SS df MS F Between Groups 4.103 4 1.026 1.72 Within Groups 56.647 95 0.596
Total 60.75 99
Table value of F = 2.45
Level of Significance = 0.05
The above ANOVA table shows that the table value of F at 5%
level of significance is 2.45 and the calculated value of F is 1.72.
As the calculated value of F is less than its table value, null
hypothesis is accepted. It means that there is no significant
correlation between organizational perception and employees’
working into different departments.
(3) Designation of Employee and Organizational Perception
There are different level of designation consider from executive to
general manager in the questionnaire. Employees are working at

Chapter: 5 Learning and Growth & Internal Business Process Perspective Measurement
197
different level of designation so they have a different level of
organizational perception. This was tested under the following
hypothesis:
Null Hypothesis: There is no significant difference in mean score of different
level of designation employee and organizational perception of
RCOM employees.
H0: µ1 = µ2 = µ3 = µ4 = µ5 = µ6 = µ7 H1: µ1 ≠ µ2 ≠ µ3 ≠ µ4 ≠ µ5 ≠ µ6 ≠ µ7
Where µ1 = Executive level employees
µ2 = Sr.Executive level employees
µ3 = Manager level employees
µ4 = Dy.Manager level employees
µ5 = Sr.Manager level employees
µ6 = Dy. Gen.Manager level employees
µ7 = General Manager level employees
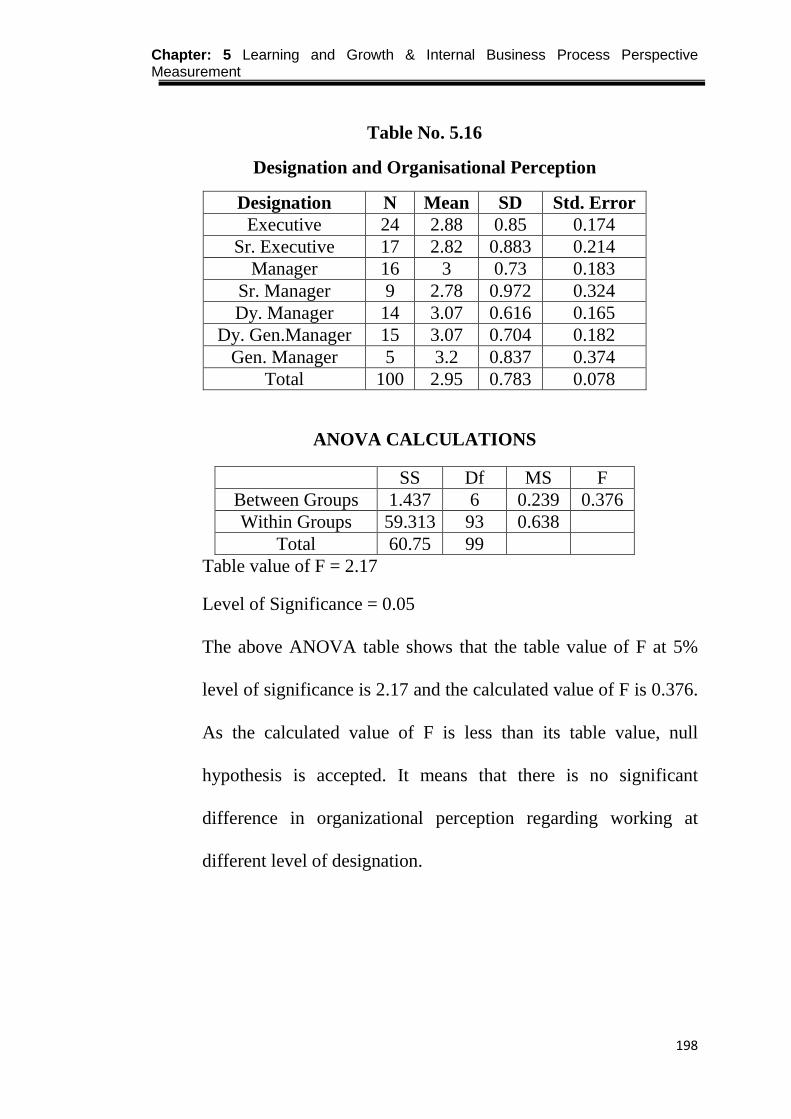
Chapter: 5 Learning and Growth & Internal Business Process Perspective Measurement
198
Table No. 5.16
Designation and Organisational Perception
Designation N Mean SD Std. Error Executive 24 2.88 0.85 0.174
Sr. Executive 17 2.82 0.883 0.214 Manager 16 3 0.73 0.183
Sr. Manager 9 2.78 0.972 0.324 Dy. Manager 14 3.07 0.616 0.165
Dy. Gen.Manager 15 3.07 0.704 0.182 Gen. Manager 5 3.2 0.837 0.374
Total 100 2.95 0.783 0.078
ANOVA CALCULATIONS
SS Df MS F Between Groups 1.437 6 0.239 0.376 Within Groups 59.313 93 0.638
Total 60.75 99 Table value of F = 2.17
Level of Significance = 0.05
The above ANOVA table shows that the table value of F at 5%
level of significance is 2.17 and the calculated value of F is 0.376.
As the calculated value of F is less than its table value, null
hypothesis is accepted. It means that there is no significant
difference in organizational perception regarding working at
different level of designation.
Chapter: 5 Learning and Growth & Internal Business Process Perspective Measurement
199
(4) Educational Qualification of Employees and Organizational Perception There are different educational qualification employees’ workings
into organization and Researcher considers four level of education
qualification from under graduate to post graduate into the
questionnaire. Different educational groups’ employees have a
different level of organizational perception. This was tested under
the following hypothesis:
Null Hypothesis: There is no significant difference between means scores of
different educational groups’ organizational perception of RCOM
employees.
H0: µ1 = µ2 = µ3 = µ4
H1: µ1 ≠ µ2 ≠ µ3 ≠ µ4
Where µ1 = Under Graduate employees
µ2 = Diploma Holder employees
µ3 = Graduate employees
µ4 = Post Graduate employees

Chapter: 5 Learning and Growth & Internal Business Process Perspective Measurement
200
Table No. 5.17
Educational Qualification and Organisational Perception
Education Qualification N Mean SD Std. Error Under Graduate 2 1.5 0.707 0.5
Diploma 6 2.83 1.169 0.477 Graduate 40 2.93 0.764 0.121
Post Graduate 52 3.04 0.713 0.099 Total 100 2.95 0.783 0.078
ANOVA CALCULATIONS
SS Df MS F Between Groups 4.719 3 1.573 2.695 Within Groups 56.031 96 0.584
Total 60.75 99
Table value of F = 2.68
Level of Significance = 0.05
The above ANOVA table shows that the table value of F at 5%
level of significance is 2.68 and the calculated value of F is 2.695.
As the calculated value of F is more than its table value, null
hypothesis is rejected. It means that there is significant difference
in the mean scores of organization perception among different
educational groups of RCOM employees’.

Chapter: 5 Learning and Growth & Internal Business Process Perspective Measurement
201
(5) Length of Services and Organizational Perception Different length of services employees has a different level of
organizational perception. This was tested under the following
hypothesis:
Null Hypothesis:
There is no significant correlation between length of services
and means scores of organizational perception of RCOM
employees.
H0: µ1 = µ2 = µ3 = µ4 = µ5 = µ6 = µ7 = µ8 H1: µ1 ≠ µ2 ≠ µ3 ≠ µ4 ≠ µ5 ≠ µ6 ≠ µ7 ≠ µ8
Where µ1 = One year length of service employees
µ2 = Two year length of service employees
µ3 = Three year length of service employees
µ4 = Four year length of service employees
µ5 = Five year length of service employees
µ6 = Six year length of service employees
µ7 = Seven year length of service employees
µ8 = Ten year length of service employees
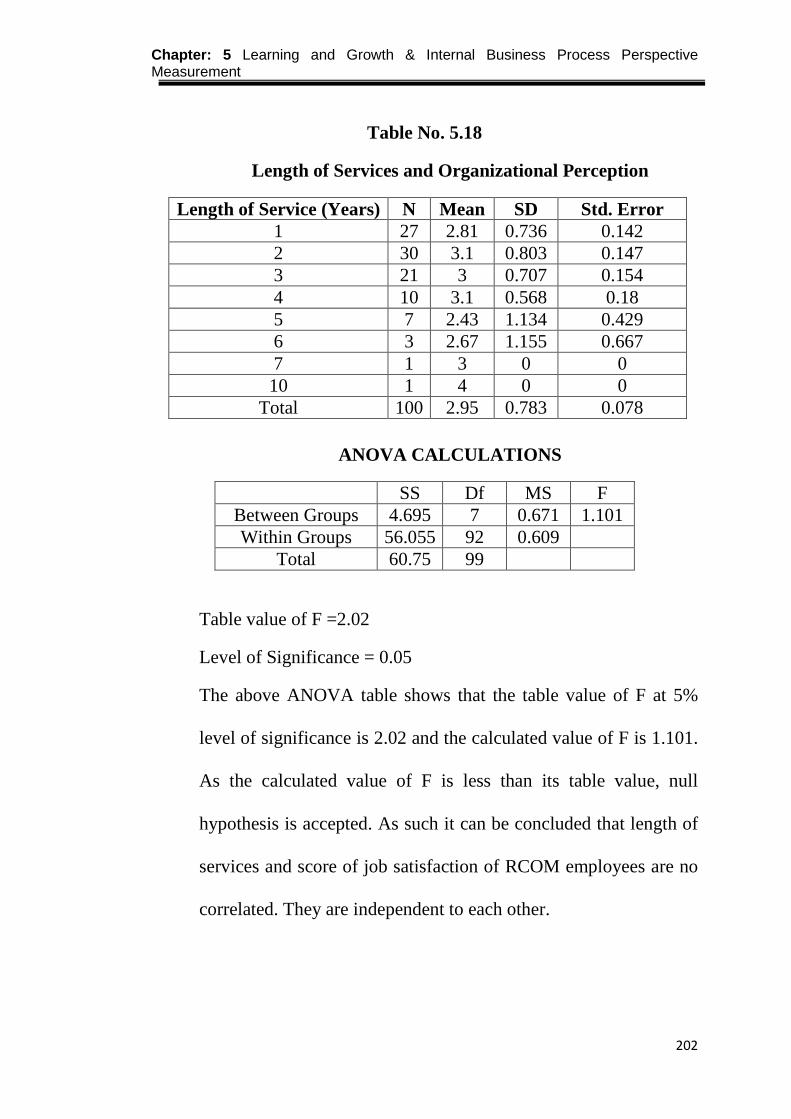
Chapter: 5 Learning and Growth & Internal Business Process Perspective Measurement
202
Table No. 5.18
Length of Services and Organizational Perception
ANOVA CALCULATIONS
SS Df MS F Between Groups 4.695 7 0.671 1.101 Within Groups 56.055 92 0.609
Total 60.75 99
Table value of F =2.02
Level of Significance = 0.05
The above ANOVA table shows that the table value of F at 5%
level of significance is 2.02 and the calculated value of F is 1.101.
As the calculated value of F is less than its table value, null
hypothesis is accepted. As such it can be concluded that length of
services and score of job satisfaction of RCOM employees are no
correlated. They are independent to each other.
Length of Service (Years) N Mean SD Std. Error 1 27 2.81 0.736 0.142 2 30 3.1 0.803 0.147 3 21 3 0.707 0.154 4 10 3.1 0.568 0.18 5 7 2.43 1.134 0.429 6 3 2.67 1.155 0.667 7 1 3 0 0 10 1 4 0 0
Total 100 2.95 0.783 0.078
Chapter: 5 Learning and Growth & Internal Business Process Perspective Measurement
203
5.6 INTRODUCTION: INTERNAL BUSINESS PROCESS PERSPECTIVE
This section deals with third perspective of Balanced Scorecard
(BSC), that is, internal business process perspective. The various
activities under the learning and growth perspective assist to
achieve an efficient internal business processes that deliver
services to the customer in a timely fashion and that adequately
meets the customer’s needs. The efficiency of the internal
processes of an organization can affect the way the company
delivers service to their customers. Operational efficiency and
effectiveness therefore allows company to render service to its
customers at a lower or reduced cost. It could also be a source of
differentiating factor by which the company can create
competitive advantage in its industry. Also, a company with good
internal processes is able to quickly respond to customer queries
and customers’ needs. Such a company also reduces the waiting
time for the delivery of its services and increase availability of its
services to customers through the use of latest technology.
RCOM is India’s truly integrated and fully-converged
telecommunications service provider. Company operates across
the full spectrum of wireless, wire line, voice, data, video and
Chapter: 5 Learning and Growth & Internal Business Process Perspective Measurement
204
internet communication services. RCOM customer base exceeds
142 million as on March 31, 2011 and includes over 2.5 million
overseas retail customers and 3.5 million Reliance Digital TV
customers. Rcom has a own and operate the world’s largest next
generation IP-enabled connectivity infrastructure, comprising over
277,000 route kilometers of fiber optic cable systems in India,
USA, Europe, Middle East and the Asia Pacific region. RCOM
has a built India’s one of the largest portfolio of multi-tenancy
towers offering integrated infrastructure solutions.
5.7 ANALYSIS OF INTERNAL BUSINESS PROCESS PERSPECTIVE
The strategic vision of Reliance communications Limited is giving
as: “Providing Information, Communication & Entertainment
services, and being the industry benchmark in.”
This vision therefore emphasizes on bringing communication
services to the doorsteps of its customers with the ultimate
objective of dominating the telecom industry in India. The key
measures here that are relevant to the RCOM are:
1. Connection with good voice quality
2. Resolution of billing / charging / validity complaints
3. Accessibility of call centre / customer care

Chapter: 5 Learning and Growth & Internal Business Process Perspective Measurement
205
Telecom Regulatory Authority of India (TRAI) is set the Quality
of service (QoS) parameters for telecom company in India. TRAI
has sets benchmark for each parameter. For the above parameters
following are the benchmark decided by TRAI:
Table No. 5.19
Strategic Measures and Benchmark
STRATEGIC MEASURES BENCHMARK (TRAI) Connection with good voice quality ≥ 95%
Resolution of billing / charging / validity complains
100% within 4 weeks
Accessibility of call centre / customer care ≥ 95%
As per Table No. 5.19, benchmark of first strategic measures is
greater than or equal to 95% for connection with good voice
quality, benchmark of second strategic measures is 100% within 4
weeks for resolution of billing / charging / validity complains and
benchmark of third strategic measure is greater than or equal to
95% for accessibility of call centre / customer care.
For the above key measure, following is the performance of
RCOM to comparison with benchmark decided by TRAI for the
telecom company.

Chapter: 5 Learning and Growth & Internal Business Process Perspective Measurement
206
Table No. 5.20
Strategic Measures and Performance of RCOM
STRATEGIC MEASURES BENCHMARK
(TRAI) PERFORMANCE
OF RCOM Connection with good voice
quality ≥ 95% 98.14% Resolution of billing / charging /
validity complaints 100% within 4 weeks 100%
Accessibility of call center / customer care ≥ 95% 95.23%
As per Table No. 5.20, first key measures is connection with good
voice quality and performance value for RCOM is 98.14%, which is
greater than for benchmark decided by TRAI. Second key measure
is resolution of billing / charging / validity complaints and
performance value for RCOM is 100%, which is meeting the
benchmark decided by TRAI and third key measure is accessibility
of call centre / customer care and performance value is 95.23%,
which is greater than for benchmark decided by TRAI. For the
above performance, this shows that overall internal business
processes working effectively and meet the expectation of customer.

Chapter: 6 Financial Perspective Measurement
207
Chapter 6
Financial Perspective Measurement
6.1 Introduction
6.2 Financial Perspective Measurement 1. Return on Assets (ROA) 2. Return on Equity (ROE) 3. Return on Investment (ROI) 4. Earnings Per Share (EPS) 5. Market value
Reference
Chapter: 6 Financial Perspective Measurement
208
6.1 INTRODUCTION
This chapter deals with one of the important perspective of
Balanced Scorecard (BSC), that is, financial perspective. For
effective implementation of RCOM strategy, strategic objectives
are broken down into measurable parameters. As per the vision of
the RCOM, “By 2015, be amongst the top 3 most valued Indian
companies” is key strategic objective. To measure financial
performance of the RCOM, the following key measures here that
are considered,
1. Return on Asset (ROA) 2. Return on Equity (ROE) 3. Return on Investment (ROI) 4. Earnings Per Share (EPS) 5. Market Value
These are good indicators of the financial health of an
organization since they measure how efficiently businesses are
utilizing their assets and the value they are returning to
shareholders on their investments. A business that is financially
healthy will consistently return high ROA, ROE, ROI and EPS.
These measures will therefore give information to shareholders on
the state of the businesses they have invested in.
Thus, the above indicators of a unit can be evaluated with help of
trend analysis. It is helpful in making comparative study of the

Chapter: 6 Financial Perspective Measurement
209
changes in an item or groups of item over a period of time and to
draw conclusion.
6.2 FINANCIAL PERSPECTIVE MEASUREMENT 1. Return on Assets (ROA)
An indicator of how profitable a company is relative to its total
assets. ROA provides an idea of how efficient management is at
using its assets to generate earnings. It is calculated, as shown
here, by dividing a company's annual earnings by its total assets,
with ROA displayed as a percentage. Sometimes this is referred to
as return on investment.The profitability ratio is measures in term
of the relationship between net profits and assets. The ROA may
also be called profit-to-asset ratio.
The formula of Return on Assets = Net Income
Total Assets
The assets of the company are made of both debt and equity. Both
of these types of financing are used to fund the operations of the
company. The ROA figure gives investors an idea of how
effectively the company is converting the money it has to invest
into net income. The higher the ROA number, the better, because
the company is earning more money on less investment.
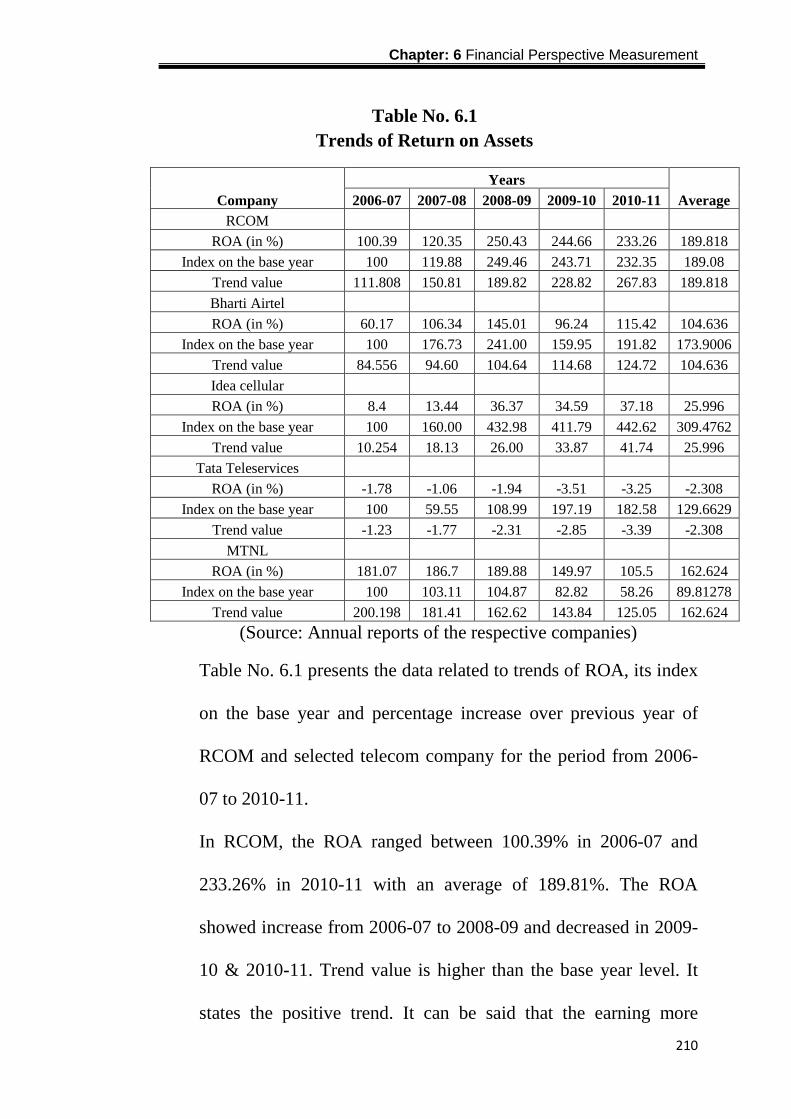
Chapter: 6 Financial Perspective Measurement
210
Table No. 6.1 Trends of Return on Assets
Company Years
Average 2006-07 2007-08 2008-09 2009-10 2010-11 RCOM
ROA (in %) 100.39 120.35 250.43 244.66 233.26 189.818
Index on the base year 100 119.88 249.46 243.71 232.35 189.08
Trend value 111.808 150.81 189.82 228.82 267.83 189.818
Bharti Airtel
ROA (in %) 60.17 106.34 145.01 96.24 115.42 104.636
Index on the base year 100 176.73 241.00 159.95 191.82 173.9006
Trend value 84.556 94.60 104.64 114.68 124.72 104.636
Idea cellular
ROA (in %) 8.4 13.44 36.37 34.59 37.18 25.996
Index on the base year 100 160.00 432.98 411.79 442.62 309.4762
Trend value 10.254 18.13 26.00 33.87 41.74 25.996
Tata Teleservices
ROA (in %) -1.78 -1.06 -1.94 -3.51 -3.25 -2.308
Index on the base year 100 59.55 108.99 197.19 182.58 129.6629
Trend value -1.23 -1.77 -2.31 -2.85 -3.39 -2.308
MTNL
ROA (in %) 181.07 186.7 189.88 149.97 105.5 162.624
Index on the base year 100 103.11 104.87 82.82 58.26 89.81278
Trend value 200.198 181.41 162.62 143.84 125.05 162.624
(Source: Annual reports of the respective companies)
Table No. 6.1 presents the data related to trends of ROA, its index
on the base year and percentage increase over previous year of
RCOM and selected telecom company for the period from 2006-
07 to 2010-11.
In RCOM, the ROA ranged between 100.39% in 2006-07 and
233.26% in 2010-11 with an average of 189.81%. The ROA
showed increase from 2006-07 to 2008-09 and decreased in 2009-
10 & 2010-11. Trend value is higher than the base year level. It
states the positive trend. It can be said that the earning more

Chapter: 6 Financial Perspective Measurement
211
money on less investment and company performance was
satisfactory based on ROA.
In Airtel, the ROA ranged between 60.17% in 2006-07 and
115.42% in 2010-11 with an average of 104.63%. The ROA
showed increase from 2006-07 to 2008-09 and decreased in 2009-
10 and further increased in 2010-11. The ROA was satisfactory.
The trend value also indicates the upward trend.
In Idea, the ROA ranged between 8.7% in 2006-07 and 37.18% in
2010-11 with an average of 104.63%. The ROA showed increase
from 2006-07 to 2008-09 and decreased in 2009-10 and further
increased in 2010-11. The ROA was satisfactory. The value also
suggests the upward trend.
The ROA of Tata Teleservices showed declined trend from -
1.78% in 2006-07 to -3.25% in 2010-11. The average ROA of the
company was -2.30%, which indicated that the Return on Assets
was not satisfactory. Trends values average is also lower than the
base year level. So, it also says negative trend.
In MTNL, the ROA ranged between 181.07% in 2006-07 and
105.5% in 2010-11 with an average of 162.62%. The ROA
showed increase from 2006-07 to 2008-09 and decreased in 2009-

Chapter: 6 Financial Perspective Measurement
212
10 & 2010-11. The ROA was satisfactory. The trend value shows
the downward trend.
On the basis of above details, it can be concluded that the highest
ROA was 189.81% of RCOM, followed by MTNL, Airtel, Idea
and Tata Teleservices. We can say that performance of RCOM
was better that other telecom company.
The overall result of ROA is determined by viewing the chi-
square. The calculated value of chi-square comes out to 32.23
while the critical value of chi-square is 9.488. So, here the
calculated value is higher than the critical. It indicates the
acceptance of alternative hypothesis instead of null hypothesis. It
means, “There is significant difference in Return on Assets of
RCOM”.
2. Return on Equity (ROE)
Return on equity (ROE) measures the rate of return on the
ownership interest of the common stock owners. It measures a
firm's efficiency at generating profits from every unit of
shareholders' equity (also known as net assets or assets minus
liabilities). ROE shows how well a company uses investment
funds to generate earnings growth. It is calculated as follows:
Chapter: 6 Financial Perspective Measurement
213
Return on Equity (ROE) = Net Income Shareholder’s Equity
The amount of net income returned as a percentage of
shareholders equity. Return on equity measures a corporation's
profitability by revealing how much profit a company
generates with the money shareholders have invested. Return on
Equity of ROE is an indicator of a company’s profitability. It is
the most important profitability metrics. Return on equity reveals
how much profit a company earned in comparison to the total
amount of shareholder equity fund on the balance sheet.
Shareholder equity is equal to total assets minus total liabilities.
It’s what the shareholders “own”. Shareholder equity is a creation
of accounting that represents the assets created by the retained
earnings of the business and the paid-in capital of the owners. A
business that has a high return on equity is more likely to be one
that is capable of generating cash internally. For the most part, the
higher a company’s return on equity compared to its industry, the
better.

Chapter: 6 Financial Perspective Measurement
214
Table No. 6.2
Trends of Return on Equity
Company Years
Average 2006-07 2007-08 2008-09 2009-10 2010-11 RCOM
ROE (in %) 11.74 10.41 9.29 0.94 -1.57 6.162
Index on the base year 100 88.67 79.13 8.01 -13.37 52.49
Trend value 13.38 9.77 6.16 2.55 -1.06 6.162
Bharti Airtel
ROE (in %) 35.35 30.94 28.13 25.79 17.6 27.562
Index on the base year 100 87.52 79.58 72.96 49.79 77.96888
Trend value 35.692 31.63 27.56 23.49 19.43 27.5602
Idea cellular
ROE (in %) 23.04 29.48 8.87 9.23 6.87 15.498
Index on the base year 100 127.95 38.50 40.06 29.82 67.26563
Trend value 26.016 20.76 15.50 10.24 4.98 15.498
Tata Teleservices
ROE (in %) 96.7 62.68 43.33 44.72 -8.09 47.868
Index on the base year 100 64.82 44.81 46.25 -8.37 49.50155
Trend value 93.37 70.62 47.87 25.11 2.36 47.8668
MTNL
ROE (in %) 4.01 3.45 1.4 -32.42 -42.15 -13.142
Index on the base year 100 86.03 34.91 -808.48 -1051.12 -327.731
Trend value 12.496 -0.32 -13.14 -25.96 -38.78 -13.142
(Source: Annual reports of the respective companies)
The ROE of RCOM and selected telecom company has been
presented in table no.6.2. In RCOM, the ROE ranged between
11.74% in 2006-07 and -1.57% in 2010-11 with an average of
6.61%. The ROE showed decreased trend during the study period.
It comes on average to 6.162 which are lower than the base year
level. The trend value says the downward trend. It can be said that
company performance was not satisfactory based on ROE.

Chapter: 6 Financial Perspective Measurement
215
In Airtel, the ROE ranged between 35.35% in 2006-07 and 17.6%
in 2010-11 with an average of 27.56%. The ROE showed decrease
from 2006-07 to 2010-11. The trend value says the downward
trend.
In Idea, the ROE ranged between 23.04% in 2006-07 and 6.87%
in 2010-11 with an average of 15.49%. In most of years the
company was not maintained performance. The value also says the
downward trend.
The ROE of Tata Teleservices showed declined trend from 96.7%
in 2006-07 to -8.09% in 2010-11. The average ROE of the
company was 47.86%, which indicated that company was good
but average was not maintained. The value also says the
downward trend.
In MTNL, the ROE ranged between 4.01% in 2006-07 and -
42.15% in 2010-11 with an average of 13.14%. The ROE showed
decrease from 2006-07 to 2010-11. The ROE was not satisfactory.
The value also says the downward trend.
On the basis of above details, it can be concluded that the highest
ROE was 47.86% of Tata Teleservices, followed by Airtel, Idea,

Chapter: 6 Financial Perspective Measurement
216
MTNL and RCOM. We can say that performance of RCOM was
not good comparing with others Telecom Company.
The overall result of ROE is determined by viewing the chi-
square. The calculated value of chi-square comes out to 2.59 while
the critical value of chi-square is 9.488. So, here the calculated
value is lower than the critical. It indicates the acceptance of null
hypothesis. It means, “There is no significant difference in
Return on Equity of RCOM”.
3. Return on Investment (ROI)
A performance measure used to evaluate the efficiency of
an investment or to compare the efficiency of a number of
different investments. To calculate ROI, the benefit (return) of an
investment is divided by the cost of the investment; the result is
expressed as a percentage or a ratio. The return on investment
formula:
Return on = (Gain from investment – Cost of Investment) Investment (ROI) Cost of Investment
In the above formula "gains from investment", refers to the
proceeds obtained from selling the investment of interest. Return
on investment is a very popular metric because of its
versatility and simplicity. That is, if an investment does not have a
positive ROI, or if there are other opportunities with a higher ROI,
then the investment should be not be undertaken. The purpose of

Chapter: 6 Financial Perspective Measurement
217
the "return on investment" metric is "to measure per period rates
of return on rupees invested in an economic entity. Marketers
should understand the position of their company and the returns
expected. ROI is often compared to expected (or required) rates of
returns on rupees invested.
Table No. 6.3
Trends of Return on Investment
Company Years
Average 2006-07 2007-08 2008-09 2009-10 2010-11 RCOM
ROI(in %) 10.96 9.65 4.8 1.97 1.03 5.682
Index on the base year 100 88.05 43.80 17.97 9.40 51.84
Trend value 11.19 8.44 5.68 2.93 0.17 5.682
Bharti Airtel
ROI(in %) 29.06 27.95 28.4 23.86 15.97 25.048
Index on the base year 100 96.18 97.73 82.11 54.96 86.19408
Trend value 31.102 28.08 25.05 22.02 18.99 25.048
Idea cellular
ROI(in %) 14.96 16.92 11.2 10.73 7.5 12.262
Index on the base year 100 113.10 74.87 71.72 50.13 81.96524
Trend value 16.484 14.37 12.26 10.15 8.04 12.262
Tata Teleservices
ROI(in %) -8.21 1.44 5.09 -1.37 -12.01 -3.012
Index on the base year 100 -17.54 -62.00 16.69 146.29 36.68697
Trend value -0.93 -1.97 -3.01 -4.05 -5.09 -3.012
MTNL
ROI(in %) 6.77 6.48 3.43 -35.63 -16.35 -7.06
Index on the base year 100 95.72 50.66 -526.29 -241.51 -104.284
Trend value 10.61 1.78 -7.06 -15.90 -24.73 -7.06
(Source: Annual reports of the respective companies)
The ROI of RCOM and selected telecom company has been
presented in table No.6.3. In RCOM, the ROI ranged between
10.96% in 2006-07 and -1.03% in 2010-11 with an average of
5.68%. The ROI showed decreased trend during the study period.

Chapter: 6 Financial Perspective Measurement
218
It can be said that company performance was not satisfactory
based on ROI. Trend value is 5.682 which is lower than the base
year. It states the negative trend of ROI.
In Airtel, the ROI ranged between 29.06% in 2006-07 and 15.97%
in 2010-11 with an average of 25.04%. The ROI showed decrease
from 2006-07 to 2010-11. The trend value shows downward trend
but company maintains the ROI during study period.
In Idea, the ROI ranged between 14.96% in 2006-07 and 7.5% in
2010-11 with an average of 12.26%. In most of years the company
was not maintained performance. The trend value of ROI shows
an overall downward trend.
The ROI of Tata Teleservices showed declined trend from -8.21%
in 2006-07 to -12.01% in 2010-11. The average ROI of the
company was 3.01%, which indicated that company was good but
average was not maintained. The trend value of ROI shows a
downward trend.
In MTNL, the ROI ranged between 6.77% in 2006-07 and -
16.35% in 2010-11 with an average of 7.06%. The ROI showed
decrease from 2006-07 to 2010-11. The ROI was not satisfactory.
The trend value of ROI shows a downward trend.

Chapter: 6 Financial Perspective Measurement
219
On the basis of above details, it can be concluded that the highest
ROI was 25.04% of Airtel, followed by Idea, MTNL, RCOM and
Tata Teleservices. We can say that performance of RCOM was
not good comparing with others Telecom Company.
The overall result of ROI is determined by viewing the chi-square.
The calculated value of chi-square comes out to 4.84 while the
critical value of chi-square is 9.488. So, here the calculated value
is lower than the critical. It indicates the acceptance of null
hypothesis. It means, “There is no significant difference in
Return on Investment of RCOM”.
4. Earnings Per Share (EPS)
The profitability of a firm from the point of view of the ordinary
shareholders is the Earning per Share. It measures the profit
available to the equity shareholders on a per share basis, i.e. the
amount that they can get on every share held. It is calculated by
dividing the profits available to the shareholders by the number of
the outstanding shares. The profits available to the ordinary
shareholders are represented by net profits after taxes and
preference dividend. The formula for derivation of this ratio is:
Earnings per Share = Net Profit available to equity holders No. of Ordinary shares Outstanding

Chapter: 6 Financial Perspective Measurement
220
Earnings per Share are widely used term. Its usefulness in
analyzing the effect of a change in leverage on the net operating
earnings to the ordinary shareholders and, given the requirements
of maximizing Earning Per Share. Earnings Per Share as a
measure of profitability of a firm from the owner’s point of view
should be used cautiously as it does not recognize the effect of
increase in equity capital as a result of retention of earnings. In
other words, if Earnings Per Share has increased profit to the
owner’s may be the effect of an enlarged equity capital as a result
of retention of earnings. In other words, if Earning Per Share has
increased over the years, it does not necessarily follow that the
firm’s profitability has improved because the increased profits to
the owner’s may be the effect of an enlarged equity capital as a
result of profit retentions, though the number of ordinary shares
outstanding still remains constant. It only shows how much
“theoretically” belongs to the ordinary shareholders.

Chapter: 6 Financial Perspective Measurement
221
Table No. 6.4
Trends of Earnings per Share
Company Years
Average 2006-07 2007-08 2008-09 2009-10 2010-11 RCOM
EPS (in Rs.) 11.78 12.53 23.27 2.32 -3.67 9.246
Index on the base year 100 106.37 197.54 19.69 -31.15 78.49
Trend value 17.468 13.36 9.25 5.14 1.02 9.246
Bharti Airtel
EPS (in Rs.) 21.27 32.9 40.79 24.82 20.32 28.02
Index on the base year 100 154.68 191.77 116.69 95.53 131.7348
Trend value 30.016 29.02 28.02 27.02 26.02 28.02
Idea cellular
EPS (in Rs.) 1.94 3.96 3.23 3.19 2.56 2.976
Index on the base year 100 204.12 166.49 164.43 131.96 153.4021
Trend value 2.882 2.93 2.98 3.02 3.07 2.976
Tata Teleservices
EPS (in Rs.) -1.72 -0.66 -0.84 -1.57 0.26 -0.906
Index on the base year 100 38.37 48.84 91.28 -15.12 52.67442
Trend value -1.516 -1.21 -0.91 -0.60 -0.30 -0.906
MTNL
EPS (in Rs.) 7.4 6.46 2.67 -48.63 -44.47 -15.314
Index on the base year 100 87.30 36.08 -657.16 -600.95 -206.946
Trend value 16.452 0.57 -15.31 -31.20 -47.08 -15.314
(Source: Annual reports of the respective companies)
Table No. 6.4 shows that the ratio of earning per share in RCOM.
The ratio showed increased from Rs.11.78 in 2006-07 to Rs. 12.53
in 2007-08. It further rose to Rs.23.27 in 2008-09 and sharply
declined to Rs.2.32 in 2009-10.It was Rs.-3.67 in 2010-11. The
ratio fluctuated throughout the study period. The trend value also
shows the negative trend.

Chapter: 6 Financial Perspective Measurement
222
In Airtel, the ratio of earning per share showed the fluctuated trend
during the study period. The ratio was Rs.21.27 then it was
increased to Rs. 32.9 in 2007-08 showing the improvement in the
ratio. The ratio was Rs.40.79 in 2008-09 and Rs. 20.32 in 2010-
11. The average ratio of the company was Rs.28.02. The Earning
per share was quite satisfactory. The trend value also shows the
negative trend.
In idea cellular, the ratio of earning per share showed increase
from Rs.1.94 in 2006-07 to Rs.32.9 in 2007-08. It was decreased
to Rs.3.23 in 2008-09 to Rs. 3.19 in 2009-10 and Rs.2.56 in 2010-
11. It can be said that the profitability of the company was
satisfactory based on EPS. The trend value also indicated the
positive trend.
In Tata Teleservices, the ratio of earning per shares Rs.-1.72 in
2006-07 and Rs. -0.66 in 2007-08. It was decreased to Rs.-0.84 to
Rs.-1.57 in 2009-10. The average ratio of the company was minus
Rs.0.906, which indicated that the ratio was not satisfactory. The
trend value also shows the negative trend.
The ratio of earning per share of MTNL reveals the trend towards
decreasing. The E.P.S was Rs.7.4 in 2006-07 to Rs.6.46 in 2007-
08. It further declined to Rs.2.67 in 2008-09. The ratio was

Chapter: 6 Financial Perspective Measurement
223
declined to very lower to Rs.-48.63 in 2009-10 and Rs. -44.47 in
2010-11. The average ratio was Rs.15.314. The trend value shows
the negative trend.
It can be generalized from the above analysis that the Airtel had
the highest E.P.S followed by the MTNL, RCOM, Idea and Tata
Teleservices. The E.P.S of Rcom was on third position in telecom
industry.
The overall result of EPS is determined by viewing the chi-square.
The calculated value of chi-square comes out to 46.23 while the
critical value of chi-square is 9.488. So, here the calculated value
is higher that the critical. It indicates the acceptance of alternative
hypothesis instead of null hypothesis. It means, “There is
significant difference in Earnings per Share of RCOM”.
5. Market value
The market value, as reflected in the stock market quotations,
comprises for estimating the value of a business. The justification
of market value as an approximation of true worth of a firm is
derived from the fact that market quotations by and large indicate
the consensus of investors as to the firm’s earning potentials and
the corresponding risk. The market value approach is one of the
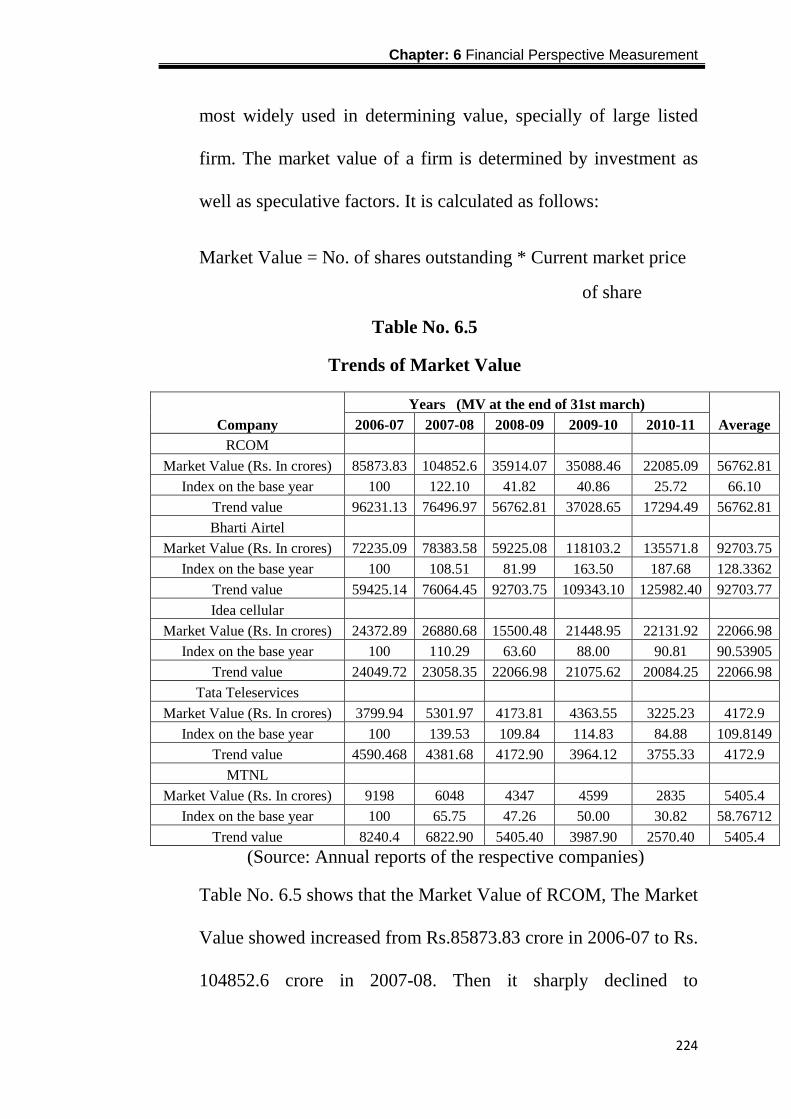
Chapter: 6 Financial Perspective Measurement
224
most widely used in determining value, specially of large listed
firm. The market value of a firm is determined by investment as
well as speculative factors. It is calculated as follows:
Market Value = No. of shares outstanding * Current market price
of share
Table No. 6.5
Trends of Market Value
Company Years (MV at the end of 31st march)
Average 2006-07 2007-08 2008-09 2009-10 2010-11 RCOM
Market Value (Rs. In crores) 85873.83 104852.6 35914.07 35088.46 22085.09 56762.81
Index on the base year 100 122.10 41.82 40.86 25.72 66.10
Trend value 96231.13 76496.97 56762.81 37028.65 17294.49 56762.81
Bharti Airtel
Market Value (Rs. In crores) 72235.09 78383.58 59225.08 118103.2 135571.8 92703.75
Index on the base year 100 108.51 81.99 163.50 187.68 128.3362
Trend value 59425.14 76064.45 92703.75 109343.10 125982.40 92703.77
Idea cellular
Market Value (Rs. In crores) 24372.89 26880.68 15500.48 21448.95 22131.92 22066.98
Index on the base year 100 110.29 63.60 88.00 90.81 90.53905
Trend value 24049.72 23058.35 22066.98 21075.62 20084.25 22066.98
Tata Teleservices
Market Value (Rs. In crores) 3799.94 5301.97 4173.81 4363.55 3225.23 4172.9
Index on the base year 100 139.53 109.84 114.83 84.88 109.8149
Trend value 4590.468 4381.68 4172.90 3964.12 3755.33 4172.9
MTNL
Market Value (Rs. In crores) 9198 6048 4347 4599 2835 5405.4
Index on the base year 100 65.75 47.26 50.00 30.82 58.76712
Trend value 8240.4 6822.90 5405.40 3987.90 2570.40 5405.4
(Source: Annual reports of the respective companies)
Table No. 6.5 shows that the Market Value of RCOM, The Market
Value showed increased from Rs.85873.83 crore in 2006-07 to Rs.
104852.6 crore in 2007-08. Then it sharply declined to
Chapter: 6 Financial Perspective Measurement
225
Rs.35914.07 crore in 2008-09 and Rs.35088.46 crore in 2009-10.
It was Rs.22085.09 crore in 2010-11. The average Market Value
of the company was Rs.56762.81 crore. The Market Value was
fluctuated throughout the study period.
In Airtel, the market value showed the fluctuated trend during the
study period. The market value was Rs.72235.09 crore in 2006-07
then it was increased to Rs. 78383.58 crore in 2007-08 showing
the improvement in the value. The value was Rs.118103.2 crore in
2009-10 and Rs. 135571.8 crore in 2010-11. The average value of
the company was Rs.92703.75 crore. The market value was quite
satisfactory.
In Idea cellular, the market value showed increase from
Rs.24372.89 crore in 2006-07 to Rs.26880.68 crore in 2007-08. It
was decreased to Rs.15500.48 crore in 2008-09 to Rs. 21448.95
crore in 2009-10 and Rs.22131.92 crore in 2010-11. It can be said
that the performance of the company was stable based on market
value.
In Tata Teleservices, the market value Rs.3799.94 crore in 2006-
07 and Rs. 5301.97 crore in 2007-08. It was decreased to
Rs.4363.55 crore to Rs.3225.23 crore in 2010-11. The average

Chapter: 6 Financial Perspective Measurement
226
value of the company was Rs.4172.9 crore, which indicated that
the performance of the company was not satisfactory.
The Market Value of MTNL reveals the trend towards decreasing.
The market value was Rs.9198 crore in 2006-07 to Rs.6048 crore
in 2007-08. It further declined to Rs.4347 crore in 2008-09. The
ratio was declined to very lower to Rs.4599 crore in 2009-10 and
Rs. 2835 crore in 2010-11. The average value was Rs.5405.4
crore. The market value was not satisfactory.
It can be generalized from the above analysis that the Airtel had
the highest market value followed by the RCOM, Idea, MTNL and
Tata Teleservices. The Market Value wise RCOM was on second
position in telecom industry.
The overall result of MV is determined by viewing the chi-square.
The calculated value of chi-square comes out to 20711.84 while
the critical value of chi-square is 9.488. So, here the calculated
value is much higher than the critical. It indicates the acceptance
of alternative hypothesis instead of null hypothesis. It means,
“There is significant difference in Market Value of RCOM”.

Chapter: 6 Financial Perspective Measurement
227
REFERENCES:
1. James C. Van Horne : Fundamentals of Financial Management,
Prentice Hall of India Pvt. Ltd., New Delhi, III ed., 1978.
2. Chaudhary A.R., “Financial Ratio and Working Capital:
Technologist” , Calcutta, 1989.
3. S.C. Kuchhal, “Financial management” An Analytical and
Conceptual Approach” ‘Eight edition.
4. Block and Hirt “Foundation of financial management” Richard D.
Irwin inc. Homeword, Illinois, 1978.
Chapter: 7Summary, Findings & Conclusions
228
Chapter 7
Summary, Findings and Conclusion
7.1 Balanced Scorecard of RCOM
7.2 Study of Customer Perspective
7.3 Study of Learning and Growth Perspective
7.4 Study of Internal Business Processes Perspective
7.5 Study of Financial Perspective
7.6 Overall Conclusion

Chapter: 7Summary, Findings & Conclusions
229
7.1 BALANCED SCORECARD OF RCOM
The modern era is of global competition. In present scenario,
telecom companies play vital role in the economy by providing
communication facilities to the business as well customers. It has
become past where customer pay higher charges for mobile
services. Today’s market is a customer-oriented that provides
better, faster and competitive price to their customers. To facilitate
the customers, lots of telecom players present into the market. So,
the picture is totally changed now. All types of telecom players
offer different and qualitative services to customers for their
satisfaction.
As an outcome of the study the researcher provides Balanced
Scorecard (BSC) of Reliance Communications:
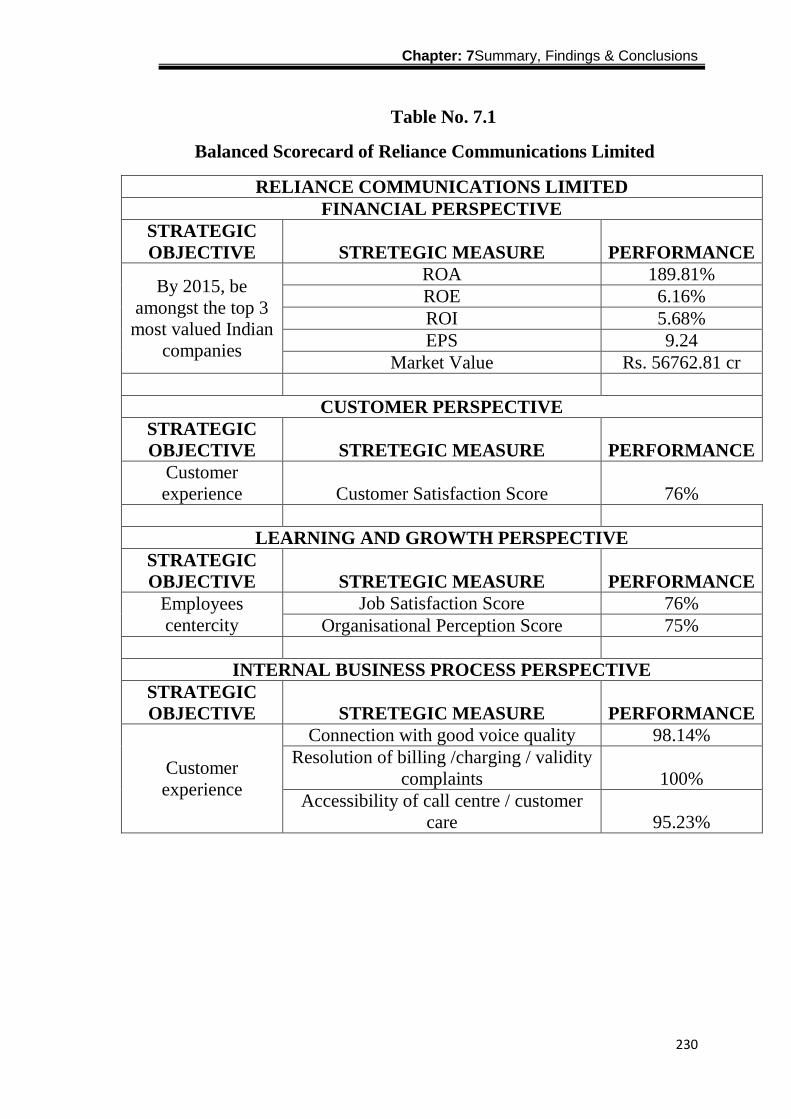
Chapter: 7Summary, Findings & Conclusions
230
Table No. 7.1
Balanced Scorecard of Reliance Communications Limited
RELIANCE COMMUNICATIONS LIMITED FINANCIAL PERSPECTIVE
STRATEGIC OBJECTIVE STRETEGIC MEASURE PERFORMANCE
By 2015, be amongst the top 3 most valued Indian
companies
ROA 189.81% ROE 6.16% ROI 5.68% EPS 9.24
Market Value Rs. 56762.81 cr
CUSTOMER PERSPECTIVE STRATEGIC OBJECTIVE STRETEGIC MEASURE PERFORMANCE
Customer experience Customer Satisfaction Score 76%
LEARNING AND GROWTH PERSPECTIVE
STRATEGIC OBJECTIVE STRETEGIC MEASURE PERFORMANCE
Employees centercity
Job Satisfaction Score 76% Organisational Perception Score 75%
INTERNAL BUSINESS PROCESS PERSPECTIVE
STRATEGIC OBJECTIVE STRETEGIC MEASURE PERFORMANCE
Customer experience
Connection with good voice quality 98.14% Resolution of billing /charging / validity
complaints 100% Accessibility of call centre / customer
care 95.23%

Chapter: 7Summary, Findings & Conclusions
231
From the above table, Reliance Communications Limited has
shown performance in terms of learning and growth perspective,
internal process perspective, customer perspective and financial
perspective.
In financial perspective, Return on Asset (ROA), Return on Equity
(ROA), Return on Investment (ROA), Earnings per Share (EPS)
and Market Value (MV) are key strategic measures. Performance
of ROA recorded 189.91% which was highest among sampled
telecom company. Performance of ROE recorded 6.16% which
was lower than the other sampled telecom company. ROI of
RCOM showed decreasing during study period. EPS of RCOM
recorded Rs.9.24, which was third position among sampled
telecom company. RCOM recorded average Market Value of Rs.
56762.81 cr and Market Value wise RCOM was on second
position in telecom industry but performance of RCOM was
decreasing.
In customer perspective, customer satisfaction index is key
strategic measures and performance of RCOM was recorded 76%
customer satisfaction score. Company should take some proper
step for improving customer satisfaction score up to 95%.

Chapter: 7Summary, Findings & Conclusions
232
In learning and growth perspective, job satisfaction index and
organisational perception index are key strategic measures. As per
table No. 7.1 showed Balanced Scorecard of RCOM, which was
recorded 76% customer satisfaction score and 75% organisational
perception score. Employee is most important asset of the
company so organisation should take proper step for improving
job satisfaction and organisational score up to 95%.
Performance score of internal process recorded 98.14% for
connection with good voice quality, 100% for resolution of
billing/charging/validity complaints and 95.23% for accessibility
of call centre/customer care. It means that internal processes are
working properly and resolution of customer complaints timely.
The broader objective of the study is to measure the total
performance of Reliance Communications through Balanced
Scorecard, which is sub divided into four main key performance
indicators (KPI) which is financial perspective, customer
perspective, internal business processes and, learning and growth
perspective. Under each KPI, the organization selects metrics that
align business performance to its strategic objectives and vision.
Following are the objectives of the study,
1. To Measure Customer Perspective of RCOM.

Chapter: 7Summary, Findings & Conclusions
233
2. To Measure Learning and Growth Perspective of RCOM.
3. To Measure Internal Business Process Perspective of RCOM.
4. To Measure Financial Perspective of RCOM.
On the basis of the above objectives, following are the major
finding of the study.
7.2 STUDY OF CUSTOMER PERSPECTIVE
By administering the comprehensive structured schedule of
question to 317 respondentsof RCOM customers the primary data
were calculated, classified and tabulated as per the needs of the
study. Besides elementary techniques like average percentage, F
test and T test.
Keeping in view objective of the study, the researcher could
identified following findings.
1. There was a significant difference found in the mean score of
customers’ satisfaction and age group. It indicates that age is
major consideration for Rcom customers’ regarding
satisfaction level.
2. Regarding occupation, the RCOM customers having different
types of occupations like service, business, student or other like
student and housewife, have different satisfaction level of
RCOM customers’, because significant difference was found.

Chapter: 7Summary, Findings & Conclusions
234
3. Male and female customers have no significance difference in
satisfaction level of Rcom customers.
4. The significant difference was found in satisfaction level of
RCOM customers regarding types of mobile technology using.
It means CDMA and GSM technology users have different
level of satisfaction. It indicates that mobile technology is
major factor for customer satisfaction level.
5. No significant difference was found in mean score of
customers’ satisfaction and types of mobile connection using.
It indicates that prepaid or postpaid connection is not a major
factor for satisfaction of RCOM customers.
6. The significant difference was found in satisfaction level of
RCOM customers regarding time period of mobile connection
using. It indicates that time period of using service is important
factor for satisfaction of RCOM customers.
7.3 STUDY OF LEARNING AND GROWTH PERSPECTIVE
By administering the comprehensive structured schedule of
question to 100 respondents of RCOM employees the primary
data were calculated, classified and tabulated as per the needs
of the study. Besides elementary techniques like average
percentage, F test and T test.
Chapter: 7Summary, Findings & Conclusions
235
Keeping in view objective of the study, the researcher could
identified following findings.
1. There was no significant difference between age group and
mean scores of job satisfaction of RCOM employees.
2. It was found that there was no correlation between working
into different departments and score of job satisfaction.
3. It was found that there was no correlation between working at
different level of designation and score of job satisfaction.
4. There was significant differences between academic
qualification and means score of job satisfaction.
5. There was no correlation in length of service and mean scores
of job satisfaction.
6. There was no correlation between different age groups and
mean score of organisational perception.
7. There was no significant difference found between working
into different departments and mean scores of organisational
perception.
8. There was no correlation between working at different
departments and mean score of organisational perception.

Chapter: 7Summary, Findings & Conclusions
236
9. There was significant difference between academic
qualification and level of mean scores of organisational
perception.
10. There was no correlation in length of service and mean scores
of organisational perception.
7.4 STUDY OF INTERNAL BUSINESS PROCESSES
PERSPECTIVE
The efficiency of the internal processes of an organisation can
affect the way the company delivers service to their customers.
Table No.7.2
Strategic Measures for Internal Business Processes Perspective
STRATEGIC MEASURES BENCHMARK
(TRAI) PERFORMANCE
OF RCOM Connection with good voice quality ≥ 95% 98.14%
Resolution of billing / charging/ validity complaints
100% within 4 weeks 100%
Accessibility of call centre / customer care ≥ 95% 95.23%
There is positive correlation between the performance of a company
and the efficiency and effectives of its internal processes as evidenced
from the data available on above table.
1. First strategic measure for internal processes is connection with
good voice quality and performance of RCOM was 98.14%,
which is above the benchmark decided by TRAI. It means that
Rcom has very good technological support and providing good
service to the customers.

Chapter: 7Summary, Findings & Conclusions
237
2. Second strategic measure for internal processes is resolution of
billing / charging / validity complaints and performance of RCOM
is 100%, which is above benchmark decided by TRAI. It means
that internal processes are working properly and resolution of
customer complaints on timely.
3. Third strategic measure for internal processes is accessibility of
call centre / customer care and performance of RCOM was
95.23%, which is above benchmark decided by TRAI. It means
that company has effective customer care department.
7.5 STUDY OF FINANCIAL PERSPECTIVE
Under financial perspective, the following measures/metrics were
considered:
Trends of Return on Asset (ROA)
The trends of ROA registered upward movement in RCOM during
the study period. RCOM recorded average ROA of 189.91%,
which was the highest among sampled telecom company for the
study period. It can be concludes that RCOM used its assets
efficiently for generating earnings.
Trends of Return on Equity (ROE):
RCOM recorded ROE of highest index of 88.67% while lowest
index was registered -13.37% and it was continuously decreased
during the study period. Average ROE for Airtel, Idea, Tata and
MTNL was higher than the RCOM. It indicates not favourable
Chapter: 7Summary, Findings & Conclusions
238
financial position among sampled telecom company. It is
recommended that RCOM should focus to improve its ROE.
Trend of Return on Investment (ROI):
ROI of RCOM showed decreasing trend during the study period.
RCOM recorded ROI of highest index of 88.05% while lowest
index was registered 9.40%. It can be concludes that profitability
of financial resources employed in business enterprise assets is not
good during the study period.
Trends of Earnings Per Share (EPS):
EPS of RCOM showed fluctuating during study period. The EPS
showed highest index of Rs.197.54 in 2008-09 and lowest index of
Rs.-31.15 in 2010-11.It means profitability available to
shareholders of RCOM was decreasing and RCOM required
increasing profit.
Market value:
RCOM recorded average Market value of Rs.56762.81 cr and it
was highest of Rs.104852.6 cr in 2008-09 and lowest of
Rs.22085.09 cr in 2010-11. It can be concludes that based on
market value RCOM was on second position in telecom industry
but performance of RCOM was decreasing.

Chapter: 7Summary, Findings & Conclusions
239
7.6 OVERALL CONCLUSION
As per table No. 7.1 showed Balanced Scorecard of Reliance
Communications Limited, which was recorded 76% customer
satisfaction score, 76% employee satisfaction score and 75%
organisational perception score. Performance score of internal
process recorded 98.14% for connection with good voice quality,
100% for resolution of billing /charging / validity complaints and
95.23% for accessibility of call centre / customer care. The
additional information the BSC framework has provided in
assessing the performance of RCOM is that, it has revealed that
there are two sided to its performance, the first being poor
financial performance; and the other being the good customer
satisfaction, employee satisfaction and effective internal
processes. It is clear that company financially may not necessarily
be the best in the telecom industry, but other perspective or
dimensions are taking into consideration for review.
It is therefore very clear from the study that customer perspective,
learning and growth perspective, and internal business perspective
affect the assessment of the performance of RCOM to very large
extent. With the kind of results that have been gathered through
this research, any investor who wants to invest, merge or takeover
these company will be better informed with measures in several
dimensions in terms of customer perspective, internal business
processes perspective (operational structures and controls), and
learning and growth perspective all of which affect the long term
performance and survival of the RCOM than just looking at their
financials alone. Customer perspective, internal business
Chapter: 7Summary, Findings & Conclusions
240
perspective, and learning and growth perspective therefore play
complementary roles in assessing performance of institutions.
As per the Balanced Scorecard of RCOM presented in table No.
7.1, strategic objective decided by RCOMis top 3 most valued
Indian companies but organization is not achieved this objective
because financial performance is not satisfactory. Performance of
RCOM in Customer perspective, learning and growth perspective,
and internal business process perspective were satisfactory.
The BSC framework can assist by providing additional
information using measures in several dimensions such as
customer perspective, internal business processes perspective and
learning and growth perspective to managers, shareholders and
other interested stakeholders regarding the performance of the
Rcom. This will enable RCOM focus on the core strategies in
order to create and deliver superior value and returns to their
shareholders. This puts the shareholders in an informed position
regarding the value the RCOM are delivering to them in the short-
run versus the long-run. The additional information the BSC
framework is providing could be viewed like a commentary on
“facts behind the figures” to reveal the non-financial inputs that
went into achieving the financial results and whether the results
being reported by the RCOM are sustainable in the long run.
As per Balanced scorecard of the RCOM, financial performance
of the company is not satisfactory. Researcher has finding below
causes of poor financial performance of RCOM.
1. After a phase of robust growth over the recent past, the Indian
telecom sector is slowing down. The sector is now characterized

Chapter: 7Summary, Findings & Conclusions
241
by an overcrowded market, fragmented industry structure and
steep decline in tariffs.
2. Minutes of usage per subscriber in India have declined 465
minutes in 2007 to 349 minutes in 2011.
3. As a result of decline in tariffs and falling minutes of use, Industry
– wide Revenue per Minute (RPM) have decreased from INR 1.0
in 2007 to INR 0.4 in 2011. Same time, RCOM revenue per
minute has decreased from INR 0.95 in 2007 to INR 0.44 in 2011.
4. Mobile operators currently face the challenge of not only
stagnating revenues but also increasing operating expenses. The
network expenses of operators are increasing due to the overall
high inflationary environment along with their network expansion
activities. For instance, in FY2007, network expense as
percentage of revenue for RCOM, Airtel and Idea cellular were
7%, 11% and 12% respectively. However, by FY2011, they had
increased to 52%, 23% and 31%, It means that RCOM has highest
rising network operating expenses as percentage of revenue
compared to other telecom company working in this industry.
5. Company is burdened by multiple duties and levies, both at the
central as well as the state level. Central levies include annual
license fees, annual spectrum fees and service tax. This high
burden of fees/levies/duties on mobile industry players has also
contributed to the deterioration of profitability. Regulatory
charges in India are on the higher side compared with China,
Malaysia, Sri Lanka and Pakistan.

Chapter: 7Summary, Findings & Conclusions
242
From the above causes of the poor financial performance of
RCOM, following is action plan for improving financial
performance:
1. Focus on mass mobility market through GSM with special
focus on rural distribution.
2. Increase revenue from new service streams of value added
service and In-roaming revenue.
3. Maximize revenues from existing assets of Towers and
Optical fibers so that network operating expenses
decreasing.
4. RCOM not only reliant on wireless business for future
growth; massive opportunity in newer segments including
DTH and expansion of Enterprise business.
Bibliography
243
Bibliography
1. FabrizioBocci – Bocci consulting – [email protected]
2. Fiorenzo Franceschini, Maurizio Galetto, Domenico Maisano,
“Management by measurement” p. 109.
3. Dess, G. G., and Robinson, R. 1984. “Measuring Organizational
Performance in the Absence of Objective Measures: The Case of
the Privately-Held Firm and Conglomerate Business Unit.”
Strategic Management Journal, 5: 265–273.
4. Fiorenzo Franceschini, Maurizio Galetto, Domenico Maisano,
“Management by measurement” p. 111.
5. Peters and Waterman, 1982, “ Industrial Management”,
6. Venkatraman, N., and Ramanujam, V. 1987. “Measurement of
Business Economic Performance: An Examination of Method
Convergence.” Journal of Management, 13: 109–122.
7. Brush, Candida G.; Vanderwerf, Pieter A. (1992): “A Comparison
of Methods and Sources for Obtaining Estimates of New Venture
Performance”, Journal of Business Venturing, 7,157-170.
8. Fiorenzo Franceschini, Maurizio Galetto, Domenico Maisano,
“Management by measurement” p. 112.
Bibliography
244
9. Fitzgerald, L. and Moon, P. (1996). Performance Measurement in
Service Industries: Making it Work. London: The Chartered
Institute of Management Accountants.
10. Artley, W. and Stroh, A. (2001). The Performance-Based
Management Handbook: Establishing an Integrated Performance
Measurement System. Retrieved April 9, 2008-
11. Leong, G.K., Snyder, D.L. and Ward, P.T. (1990). Research in the
process and content of manufacturing strategy. OMEGA
International Journal of Management Science, 18 (2), 109-22.
12. Performance – based management special interest – Group 2001
13. Kaplan, R. S. and Norton, D. P (1992). The Balanced Scorecard -
Measures that Drive Performance. Harvard Business Review,
January - February.
14. The Critical Few Method – http://book.personalmba.com/critical-
few/
15. Performance Dashboards: Measuring, Monitoring and Managing
your Business by Wayne W. Eckerson
16. Rampersad, H.K., Total Performance Scorecard; Redefining
Management to Achieve Performance with Integrity, Butterworth-

Bibliography
245
Heinemann Business Books, Elsevier Science, Massachusetts,
May 2003.
17. Brevis, T., Ngambi, H.C., Vrba, M.J. & Naicker, K.S. (2002).
Management principles: A contemporary edition for Africa (P.J.
Smit & G.J.de J. Cronje, Eds.). Cape Town: Juta Academic.
18. Kaplan, R. S. and Norton, D. P.(1992). The Balanced Scorecard -
Measures that Drive Performance. Harvard Business Review,
January - February.
19. Kaplan, R. S. and Norton, D. P. (1996). Using the Balanced
Scorecard as a Strategic Management System. Harvard Business
Review, January – February, 75-85.
20. Lawrie, G. and Cobbold, I. (2004). Development of the 3rd
Generation Balanced Scorecard: Evolution of the Balanced
Scorecard into an effective strategic performance management
tool. Retrieved April 6, 2008,
21. Business Process Trends, 2003.
22. Harmon, P. (2003). The evolution of the balanced scorecard.
Business process trends. Retrieved April 5, 2008.

Bibliography
246
23. Kaplan, R. S. and Norton, D. P. (1996). Using the Balanced
Scorecard as a Strategic Management System. Harvard Business
Review, January – February, 75-85.
24. Veltman, M. (2005). Balanced Scorecard. Retrieved April 5, 2008.
25. Kaplan, R. S. and Norton, D. P. (2000). Balanced Scorecard
Strategy Maps. Harvard Business Review.
26. Harmon, P. (2003). The evolution of the balanced scorecard.
Business process trends. Retrieved April 5, 2008.
27. Lawrie, G. and Cobbold, I. (2004). Development of the 3rd
Generation Balanced Scorecard: Evolution of the Balanced
Scorecard into an effective strategic performance management
tool. Retrieved April 6, 2008.
28. Kaplan, R. S. and Norton, D. P. (2001). The Strategy Focused
Organization. Harvard Business School Press.
29. Hepworth, P. (1998). Weighing it up - a literature review for the
balanced scorecard. The Journal of Management Development, 17
(8), 559.
30. Williams, J. R., Haka, S. F. and Bettner, M.S. (2005). Financial
and Managerial Accounting: the basis for business decisions.
London: McGraw-Hill.

Bibliography
247
31. Bourne, M. & Bourne, P. (2007). Instant Manager: Balanced
Scorecard. London: Hodder Arnold.
32. Anthony, R. N. and Govindarajan, V. (2000). Management
Control Systems. London: McGraw Hill Higher Education.
33. Hepworth, P. (1998). Weighing it up - a literature review for the
balanced scorecard. The Journal of Management Development, 17
(8), 559.
34. Bloomquist. P. and Yeager, J. (2008). Using Balanced Scorecards
to Align Organizational Strategies. Healthcare Executive, Jan/Feb,
23 (1), 24-26, 28.
35. Schmidt, C. (2005). The Driver's View. The Internal Auditor, 62
(3), 29-31.
36. O Cleverley, W. and O Cleverley, J. (2005). Scorecards and
dashboards: using financial metrics to improve performance.
Healthcare Financial Management, 59 (7), 64-69.
37. Artley, W. and Stroh, A. (2001). The Performance-Based
Management Handbook: Establishing an Integrated Performance
Measurement System. Retrieved April 9, 2008.
38. Amaratunga,D.,Baldry, D. & Sarshar, M. (2000). Performance
evaluation in facilities management: Using the Balanced

Bibliography
248
Scorecard Approach. COBRA 2000 Conference, University of
Greenwich, 30 August to 1 September. Retreived March 18, 2008.
39. Shulver, M. and Antarkar, N. (2001). The Balanced Scorecard as a
Communication Protocol for Managing Across Intra-
Organizational Borders. Proceedings of the Twelfth Annual
Conference of the Production and O Perations Management
Society, Orlando.
40. Wicks, A. M., St Clair, L. and Kinney, C. S. (2007). Competing
Values in Healthcare: Balancing the (Un) Balanced
Scorecard/Practitioner Application. Journal of Healthcare
Management, Sep/Oct, 52 (5), 309-323; discussion 323-324.
41. Smith, H. And Kim, I. (2005). Balanced scorecard at Summa
health system. The Journal of Corporate Accounting & Finance,
16 (5), 65-72.
42. Kocakülâh, M.C. and Austill, A.D. (2007). Balanced Scorecard
Application in the Health Care Industry: A Case Study. Journal of
Health Care Finance, 34 (1), 72-99.
43. Ashton, C. (1998). Balanced scorecard benefits NatWest Bank.
Human Resource Management International Digest, 6 (3), 11-13.

Bibliography
249
44. Jensen, M.C. (2001). Value Maximization, Stakeholder Theory,
and the Corporate Objective Function. Journal of Applied
Corporate Finance, 14 (3).
45. Field, T., Buchbach, R. and Weert, A.V. (2007). Literature review:
measuring compliance effectiveness: Balanced scorecard.
Australian Taxation Office, Australian Government. Retrieved
April 12, 2008.
46. Harvard Business Publishing Newsletters, 2002 3 pages, by
Lauren Keller Johnson
47. Ashton, C. (1998). Balanced scorecard benefits NatWest Bank.
Human Resource Management International Digest, 6 (3), 11-13.
48. Mobile Communications by Joohen Schiller –second edition
49. Kaplan, R. S. and Norton, D. P. (1996). Using the Balanced
Scorecard as a Strategic Management System. Harvard Business
Review, January – February, 75-85.
50. Letza, S. R. 1996. The design and implementation of the balanced
business scorecard: An analysis of three companies in practice.
Business Process Re-engineering & Management Journal 2 (3):
54-76.

Bibliography
250
51. Hoque, Z. and James, W. (2000), ‘‘Linking balanced scorecard
measures to size and market factors: impact on organizational
performance’’, Journal of Management Accounting Research,
Vol. 12, pp. 1-17.
52. Ittner, C. D., D. F. Larcker, and M. Meyer. 2003. Subjectivity and
the weighting of performance measures: Evidence from a balanced
scorecard. The Accounting Review 78 (3): 725-758.
53. Kaplan, R. S. and Norton, D. P.(1992). The Balanced Scorecard -
Measures that Drive Performance. Harvard Business Review,
January - February.
54. Speckbacher, G., Bischof, J. and Pfeiffer, T. (2003) ‘A descriptive
analysis on the implementation of Balanced Scorecards in
German-speaking countries’ Management Accounting Research,
Vol. 14 Issue 4, p361-389.
55. Malina, M. A., and F. H. Selto. 2001. Communicating and
controlling strategy: An empirical study of the effectiveness of the
balanced scorecard. Journal of Management Accounting Research
13: 47-90.
Bibliography
251
56. Ittner, C. D., D. F. Larcker, and M. Meyer. 2003. Subjectivity and
the weighting of performance measures: Evidence from a balanced
scorecard. The Accounting Review 78 (3): 725-758.
57. James C. Van Horne : Fundamentals of Financial Management,
Prentice Hall of India Pvt. Ltd., New Delhi, III ed., 1978.
58. Chaudhary A.R., “Financial Ratio and Working Capital:
Technologist”, Calcutta, 1989.
59. S.C. Kuchhal, “Financial management” An Analytical and
Conceptual Approach” ‘Eight edition.
60. Block and Hirt “Foundation of financial management” Richard D.
Irwin inc. Homeword, Illinois, 1978.
Websites
1. www.gao.gov/about/index.html
2. www.usa.gov/directory/federal/index.shtml
3. www.efqm.org/en/tabid/
4. www.balancedscorecard.org
5. www.nao.org.uk/idoc.ash
6. www.balancedscorecard.org/bscresources/examplessuccessstories/
tabid/57/default.aspx
7. www.saatchi.com/about_saatchi_and_saatchi

Bibliography
252
8. www.balancedscorecard.org/bscresources/examplessuccessstories/
tabid/57/default.aspx
9. www.budde.com.au/Research/Global-Industry-An-Introduction-
to-Telecommunications.html
10. www.telecomsmarketresearch.com/research/TMAAATMX-Hot-
Telecom-Global-Telecom-Market-Status-Forecast-2008-
2013.shtml
11. www.economywatch.com/worldindustries/telecommunications/
world-telecom-industry.html
12. http://business.mapsofindai.com/indai-industry/telecom.html
13. http://www.trai.gov.in/WriteReadData/UserFiles/Documents/Anu
ualReports/ar_10_11.pdf
14. www.crisil.com/CRISIL-ratings_indian-telecom-sector-faqs.pdf
15. www.trai.gov.in/WriteReadData/UserFiles/Documents/AnuualRe
ports/ar_10_11.pdf
16. www.ey.com/IN/en/Industries/Telecommunications/Telecommuni
cations_Overview
17. http://store.businessmonitor.com/telecommunications/india_teleco
mmunications_report/

Bibliography
253
18. http://www.trai.gov.in/WriteReadData/UserFiles/Documents/Anu
ualReports/ar_10_11.pdf
19. www.ibef.org/industry/telecommunications.aspx
20. www.trai.gov.in/WriteReadData/UserFiles/Documents/AnuualRe
ports/ar_10_11.pdf
21. http://www.telecomsmarketresearch.com/research/TMAAATMX-
Hot-Telecom-Global-Telecom-Market-Status-Forecast-2008-
2013.shtml
22. www.trai.gov.in/WriteReadData/UserFiles/Documents/AnuualRe
ports/ar_10_11.pdf, page 20-40
23. www.trai.gov.in/WriteReadData/UserFiles/Documents/AnuualRe
ports/ar_10_11.pdf, page 9-35
24. www.bsnl.co.in/about.htm
25. www.bsnl.co.in/company/growth.htm
26. www.tataindicomextra.in/index_interim_new.html
27. http://mtnl.net.in/history.htm
28. http://mtnl.in/growth/index.htm
29. www.airtel.in/wps/wcm/connect/about+bharti+airtel/
30. www.vodafone.in
31. www.rcom.co.in/Rcom/personal/home/index.html

Bibliography
254
32. www.rcom.co.in/Rcom/aboutus/overview/overview_reliancegroup
.html
33. www.tataindicom.com/
34. www.ideacelluar.com
35. www.aircel.com
36. Www. videocon.com
37. www.loopmobile.in
38. www.frost.com/prod/servlet/svcg.pag/IT00
39. www.gartner.com/technology/research/
40. www.coai.com/revenue.php
41. www.imrbint.com/index.
42. www.siliconindia.com/.../Characteristics_of_Successful_MVAS_c
om
43. www.rcom.co.in/Rcom/aboutus/overview/overview_business.html
44. www.rcom.co.in/Rcom/aboutus/ir/ir_financials.html
45. www.rcom.co.in/Rcom/business/HTML/index.html

ANNEXURE
i
ANNEXURE: 1 QUESTIONNAIRE FOR CUSTOMER SATISFACTION
1 Age Group
Below 20 years
20 – 40 years
Above 40 years
2 Occupation : __________________
3 Gender :
Male Female
4 Which of the following RCOM Products are you aware of?
Reliance Mobile
Fixed Wireless Phone (FWP)
High Speed Data Card
Broadband
Reliance DTH Services (Big TV)
5 Which of the following RCOM Products are you using?
Reliance Mobile
Fixed Wireless Phone (FWP)
High Speed Data Card
Broadband
Reliance DTH Services (Big TV)
6 Which Technology do you prefer?
CDMA
GSM
Both
7 Currently, which type of Mobile Connection are you using?
Pre-paid
Post-paid

ANNEXURE
ii
8 How long have been using this Connection of your Service Provider?
Less than 3 months
3 – 6 months
6 – 12 months
1 – 2 years
More than 2 years
9 How much you spend on your Mobile Connection per month?
Up to Rs. 200
Rs. 200 to Rs. 500
Rs. 500 to Rs. 700
Rs. 700 to Rs. 1000
More than Rs. 1,000
10 Are you satisfied with the way the Reliance treats you as a Customer ?
Highly satisfied
satisfied Can’t say dissatisfied Highly dissatisfied
11 With all required documentations provided, are you satisfied with how long it takes for the Reliance to active a new connection for you?
Highly satisfied
satisfied Can’t say dissatisfied Highly
dissatisfied
12 Are you satisfied with how long you have to queue to Bill Payments or Recharge from the Counter?
Highly satisfied
satisfied Can’t say dissatisfied Highly
dissatisfied
13 How, will you gate the Reliance response time to issues you raise ?
Highly satisfied
satisfied Can’t say dissatisfied Highly
dissatisfied

ANNEXURE
iii
14 Are you satisfied with the behaviour of Customer Care Executives at your Service Provider?
Highly satisfied
satisfied Can’t say dissatisfied Highly
dissatisfied
15 How will you gate (Reliance) response time to issues raise?
Highly satisfied
satisfied Can’t say dissatisfied Highly
dissatisfied
16 Rate the following services on the basis at your satisfaction.
Services Highly
satisfied satisfied Can’t say dissatisfied
Highly dissatisfied
Customer Care
Network
Cost
ISD
STD
Local
SMS Rates
Voice Clarity
Technology
Product offer
17 Overall, how would you rate the products the Reliance is offering to you ?
Highly satisfied
satisfied Can’t say dissatisfied Highly
dissatisfied
18 Would you like to recommend RCOM Service to other?
YES
Thank You

ANNEXURE
iv
ANNEXURE: 2
QUESTIONNAIRE FOR RCOM EMPLOYEES
1 Name :
2 Age :
3 Departments :
4 Designation :
5 Level :
6 Education Qualification : Below Graduates
Graduates
Diploma
Post Graduates
7 Date of Joining :
8 Date of Last Promotion :
9. Marital Status Married
Unmarried
JOB SATISFACTION
No. Statements Strongly Agree
Agree Can’t say Dis
Agree
Strongly Dis
Agree
01. I am satisfied with my Pay and other Monetary Benefits, I received for my present job.
02. I am satisfied with the behavior of my colleagues
03. I am satisfied with superior authority in the organization
04. There are enough opportunity of my progress in this organization
05. My responsibility are

ANNEXURE
v
clearly known to me in relation to my present job
06. Promotion are purely based on merit and work skill
07. I have the resources (materials, equipment, suppliers etc.) necessary to do my job well
08. I am satisfied with the autonomy given to me to do my work
09. Work environment is quite conducive and hygienic and I am fully satisfied
10. My institution is very popular and I am proud to work in the institution
11. I am satisfied with the grievance handling procedure and justice given to the employees
12. I am satisfied with the incentives and other motivational practices adopted by management
13. I am fully satisfied with the evaluation of performance
14. My work is full of challenge and I believe in doing such work
15 I am satisfied with job security given to me
16 I get dignified treatment from management
17 I feel free to speak my mind
18 I enjoy coming to work
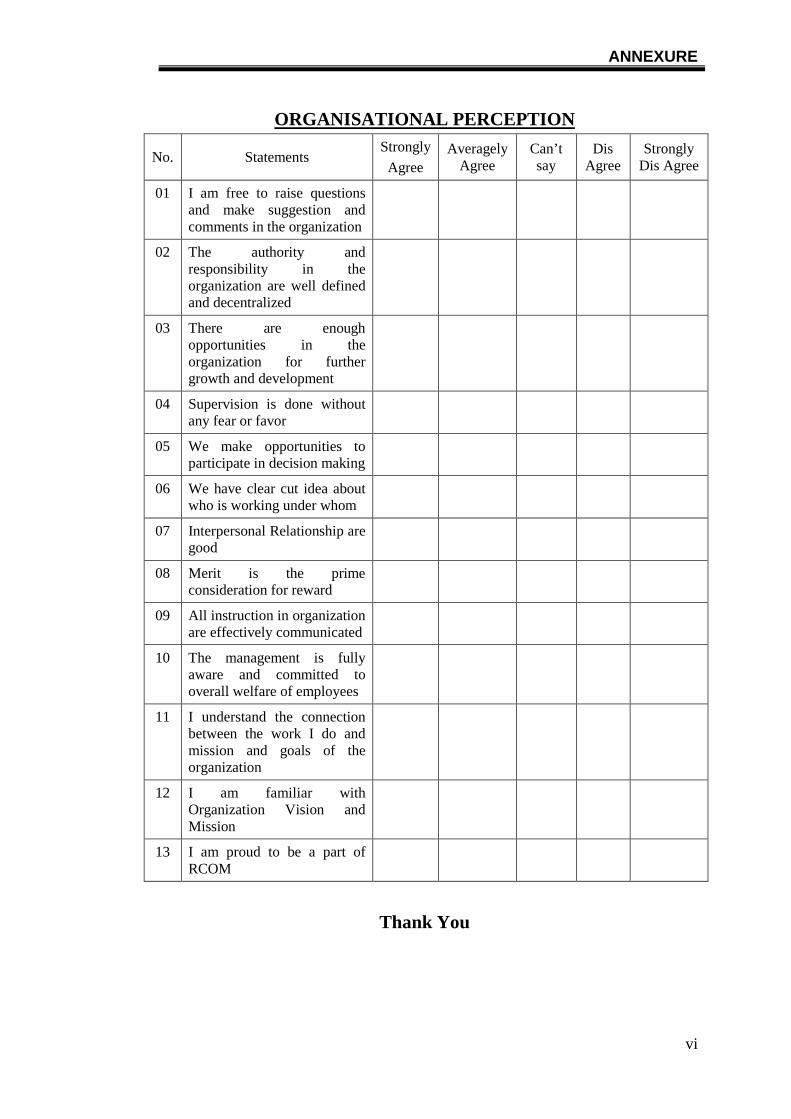
ANNEXURE
vi
ORGANISATIONAL PERCEPTION
No. Statements Strongly
Agree Averagely
Agree Can’t say
Dis Agree
Strongly Dis Agree
01 I am free to raise questions and make suggestion and comments in the organization
02 The authority and responsibility in the organization are well defined and decentralized
03 There are enough opportunities in the organization for further growth and development
04 Supervision is done without any fear or favor
05 We make opportunities to participate in decision making
06 We have clear cut idea about who is working under whom
07 Interpersonal Relationship are good
08 Merit is the prime consideration for reward
09 All instruction in organization are effectively communicated
10 The management is fully aware and committed to overall welfare of employees
11 I understand the connection between the work I do and mission and goals of the organization
12 I am familiar with Organization Vision and Mission
13 I am proud to be a part of RCOM
Thank You