satellite remote sensing and climate change - … · damage to the sea-bed, from activities like...
TRANSCRIPT

Rosenstiel School of Marine and Atmospheric Science
Satellite Remote Sensingand Climate Change
2
Rosenstiel School of Marine and Atmospheric Science
Europe’s growth potential – and countless
European livelihoods – are heavily
dependent on the proper functioning of
marine ecosystems. We have every interest in
using these resources carefully and efficiently, in
ways that safeguard them for future generations.
But we can’t do that effectively until we recognise
and address the growing pressures that we are
exerting on the marine environment today.
EU lawmakers have adopted new legislation on
Maritime Spatial Planning. Competition for
maritime space – for renewable energy equipment,
aquaculture and other growth areas – has high-
lighted the need for more efficient management
of such areas, to avoid potential conflict and
create a stable environment attractive to investors.
What we have proposed will make it easier for
Member States to coordinate such activities and
better manage environmental pressures from
sea-based activities.
Maritime Spatial Planning is a cornerstone of
the Commission’s Blue Growth strategy and of
Integrated Maritime Policy. Clearer rules would
boost sustainable maritime growth, while also
contributing to a more efficient implementation
of EU environmental legislation in marine and
coastal waters. It should also help establish
coherent networks of Marine Protected Areas, for
which cooperation on planning across borders is
essential, and ensure the participation of all
stakeholders in planning processes.
The EU’s marine areas exceed our total land mass.
In fact, almost half of the EU’s population lives
within 50 km of the sea, regularly using its
resources. This number increases during holiday
season. The seas are one of the planet’s common
resources, so it makes sense to have shared legis-
lation in this area. We already do, of course, in the
form of the Marine Strategy Framework Directive,
the EU’s flagship policy for marine protection.
This ambitious legislation sets a target of “Good
Environmental Status” for all of our marine
waters, a target to be reached in just 6 years’ time.
To achieve good status, we must ensure our
waters are clean, healthy and productive, and that
the way we use them today does not jeopardise
their use by the generations to come.
There is much to be done. It is no secret that Europe’s
seas are some way from good environmental
status, and the latest reports from Member States
make troubling reading.
Marine pollution has decreased in some places,
but levels of nutrients and hazardous substances
such as mercury still remain above safe levels.
Damage to the sea-bed, from activities like bottom
trawling, is extensive, particularly in the North Sea.
In the Mediterranean and the Black Sea, nearly
9 in every 10 species are still being overfished.
Urgent action is required. If we wait too long, the
greater the cost will be to our industry and we
will endanger the livelihoods of the people who
Better knowledge for better seasWith the ever growing pressures that are being put on the marine environment, Janez Potočnik Commissioner for Environment at the European Commission discusses the proposed solutions…
3
Rosenstiel School of Marine and Atmospheric Science
depend on fishing to put food on their table.
Member States must deliver on their commitment
in the reformed Common Fisheries Policy not to
fish beyond the Maximum Sustainable Yield
and to bring our fish stocks back within safe
biological limits.
To tackle the eutrophication of our seas, we need
to adopt a more integrated approach to the way
we manage the fertilisers and other nutrients that
are at the heart of the problem.
To combat marine litter, we must go to the source
of the problem, and ensure that the materials that
today end up as litter are instead pumped back
into our economy as the raw materials for our
products. That is why I am recommending to the
Commission a headline target for marine litter
reduction in the circular economy and waste
package to be delivered this summer.
Closer European integration is a delicate subject,
but when dealing with the common resource that
is our seas, there is no doubt that Europe has
everything to gain from a coherent, transnational
approach. It has been said that we know more
about the surface of Mars than we do about the
deep sea. As Member States move into the next
phase of the implementation of the Marine Directive,
we must develop joint monitoring programmes
and improve the comparability of the data Member
States invest so much in generating. That way we
can also work towards a shared picture, an index
of the state of our marine environment, which can
tell us at a glance how far we are from genuinely
healthy seas.
To date, EU Member States have set fragmented,
and at times contradictory, ambitions for the
marine environment. We need to align our aims if
we are to achieve coordinated and adequate actions
to address the key marine issues we are facing
today: whether overfishing, eutrophication or
marine litter.
There are global aspects too that cannot be neglected.
At the United Nations’ Rio+20 Conference in
2012, the EU played an important role in stepping
up international marine cooperation, as outlined
in the ambitious oceans chapter in the conference
conclusions. A range of commitments was agreed,
from reducing marine litter, curbing overfishing,
mitigating sea-level rise and coastal erosion
and combating ocean acidification. We are now
working through the UN processes to turn these
commitments into action, and to ensure that
marine protection has a prominent place in the
Sustainable Development Goals – the key headline
targets which the international community is
developing for beyond 2015.
Solving these problems is ultimately a question
of political will. In March this year, marine
stakeholders from all over Europe put out a
declaration 1 urging policymakers to address
these maritime questions as a matter of urgency,
and to turn words into actions to preserve our
seas. I hope they pick up that challenge. �
1 http://ec.europa.eu/environment/marine/hope-
conference/pdf/HOPE%20Conference%20Declaration.pdf
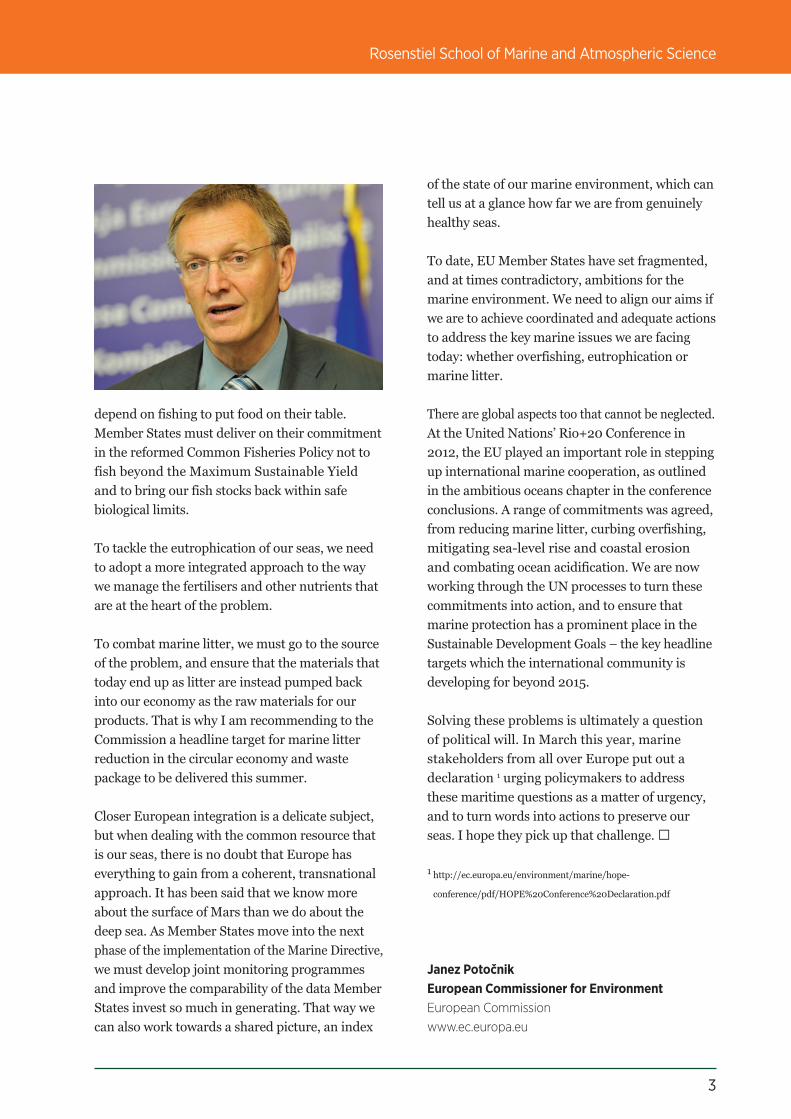
Janez PotočnikEuropean Commissioner for EnvironmentEuropean Commissionwww.ec.europa.eu

Within the stable conditions of
the past millennia, the weather
and climate have been driven by
the surplus of heat gained in the
tropics from the sun; surplus in
the sense that more is gained
than can be absorbed or returned
to space by local processes. The
oceans and atmosphere work
together to move the surplus of
heat towards the poles where it
can be lost to space by infrared
radiation. The poleward move-
ment of heat is what gives us
reasonably stable and predictable
weather conditions. Some of the
poleward heat transfer is through
the movement of water, not only
in the oceans, but also in the
4
There can be little doubt that the
consequences of climate change
present one of the greatest chal-
lenges, if not the greatest chal-
lenge, to humanity. The climate
will change in a way that is very
difficult to predict on national
and local levels, and on ill-defined
time scales. Uncertainties pose a
conundrum to politicians and
decision-makers who have to
formulate policies on the basis of
incomplete information. Yet it is
formulating the correct policies,
and implementing them in a way
that is acceptable to the majorities
of their populations, that will
mark their place in future views
of history. But also our generation
as a whole will be judged by our
children and grandchildren, and
generations into the future, on
how we rise to this challenge.
The geological record tells us
that there have been swings in
the earth’s climate in the past, but
all of the indicators available to
us tell of changes on longer time
scales than those we can antici-
pate in the coming decades. The
rapid increase in the concentra-
tions of carbon dioxide in the
atmosphere that have been
accelerating since the start of the
Industrial Revolution, caused by
burning fossil fuels, is unprece-
dented in the history of human
civilization. We have unwittingly
put in motion events that will
change the climatic conditions
that have prevailed and been
relatively stable, since the dawn
of civilization. In the past ten
thousand years or so, humanity
developed from wandering
hunter-gatherers to more
stationary communities tied to a
particular place by primitive
agriculture. The locations where
early communities were able to
thrive offered specific advantages,
including reliable rainfall or
seasonal flooding of rivers or
seasonal river flow driven by
snow or glacier melt – all for the
provision of drinking water and
to water or irrigate crops.
1.The concentration of atmospheric carbon dioxide since the start of the Industrial Revolution. Early measurements are from ice-cores, and thoseafter 1958 from direct measurements taken on the mountain Mauna Loa inHawai’i. The direct measurements resolve the seasonal cycle of atmosphericcarbon dioxide concentration, which leads to the fine temporal structure tothe curve. From Scripps Institution of Oceanography, University of California San Diego (http://keelingcurve.ucsd.edu/).
Rosenstiel School of Marine and Atmospheric Science
Satellite Remote Sensingand Climate Change
atmosphere in the form of water
vapor, clouds and precipitation –
the hydrological cycle.
While it is difficult, if not impos-
sible, to lay the blame of any
unusual weather event on climate
change, the number and intensity
of extreme events in the past
decade, whether flooding, severe
storms or extended droughts, are
a likely indication of the early
symptoms of global change. Of
course it is inevitable that people
view the state of the climate by
their own recent experience, but
the issues of climate change are
indeed global. Several areas in
the northern hemisphere have
just experienced a very severe
winter, but elsewhere in the
northern hemisphere the winter
has been anomalously mild; very
hot conditions have prevailed at
the same time in the southern
hemisphere summer, and there
are regions where droughts have
become persistent. And sea-level
continues its slow but accelerating
rise, to the consternation of
forward-looking coastal commu-
nities and the governments of
low-lying countries.
The oceans play an extremely
important role in the climate
system. They cover about three-
quarters of the earth’s surface,
contain about 97% of the earth’s
Rosenstiel School of Marine and Atmospheric Science
6
Despite remarkable progress in
our ability to measure some of
the properties of the oceans made
in the last decade or so, exploiting
new technologies such as
autonomous underwater vehicles
(gliders) and autonomous profil-
ers (Argo), properly sampling the
relevant oceanic variability is
extraordinarily difficult. And it is
instruments on earth-observation
satellites that can provide impor-
tant information about the ocean,
atmosphere and climate system.
The impetus of developing earth
observations satellite instruments
was originally for weather fore-
casting and for military purposes.
In concert with the provision of
satellite data, rapid advances in
computing capabilities led to the
growth of numerical models for
weather forecasting. And it was
only later that these two resources
were applied to the challenges of
understanding longer term vari-
ability, that is, to understanding
the internal workings of the
climate and to attempting to
forecast climate change.
A critical component of the
climate system is the interaction
of radiation, visible radiation
from the sun and infrared radia-
tion from the atmosphere and the
surface, with the atmosphere. It
was in the 1890’s that a Swedish
scientist, Svante Arrhenius, con-
ducted the first study of the likely
consequences of increasing the
levels of carbon dioxide in the
atmosphere by burning coal.
Arrhenius concluded that a warmer
climate would be the outcome.
This was an impressive intellectual
feat, given the limited informa-
tion and tools at his disposal,
rendered even more remarkable
by his prediction that the first
area of the globe to reveal signal
of a changing climate would be
the Arctic. Arrhenius’s prescient
conclusion has since been borne
out by all computer models
that are used to predict future
climates, as they all indicate the
water, provide about 85% of
evaporation into the atmosphere
and receive about three-quarters
of the global precipitation. They
provide much of the energy to
drive the atmospheric circulation,
which gives us weather, and have
their own circulation patterns
that are part of the poleward
transport of heat. The oceans,
sometimes referred to as the
“flywheel” of the climate system,
control the timing and influence
the magnitudes of changes in the
global climate. Without better
understanding of the properties
and behavior of the oceans, and
how they interact with the
overlying atmosphere, progress
in improving our knowledge of
the climate system, and in
producing better climate
forecasts will be hindered.
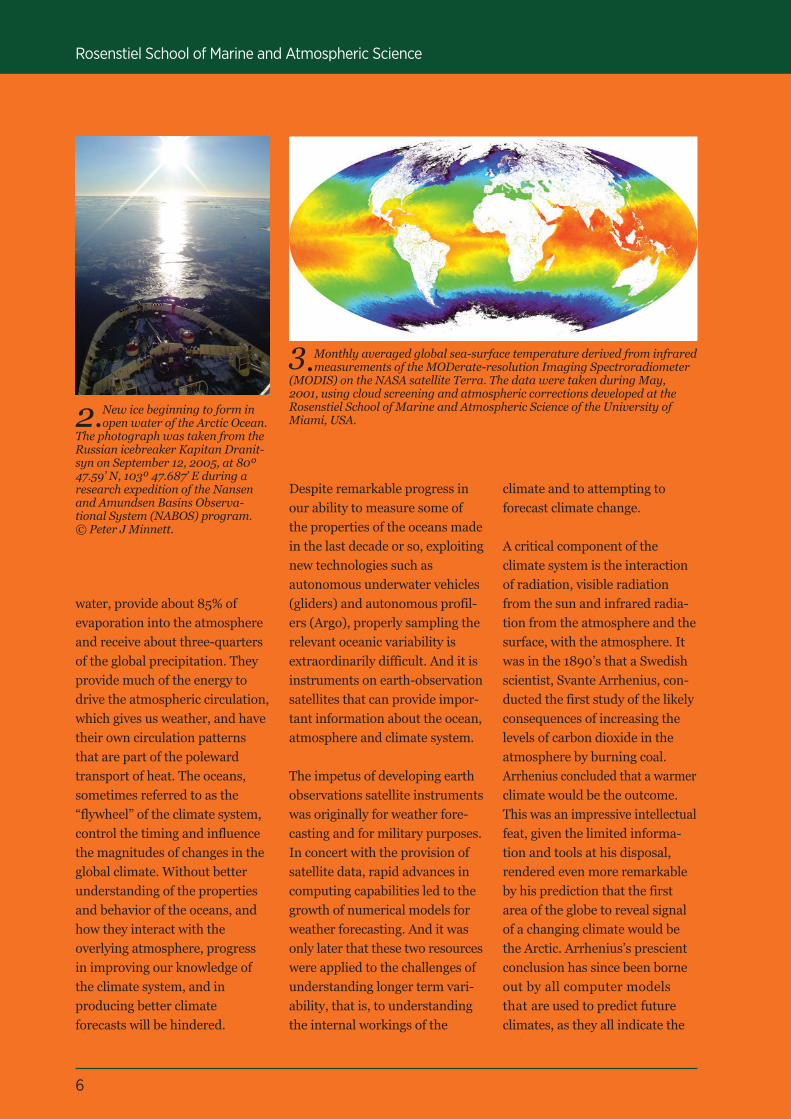
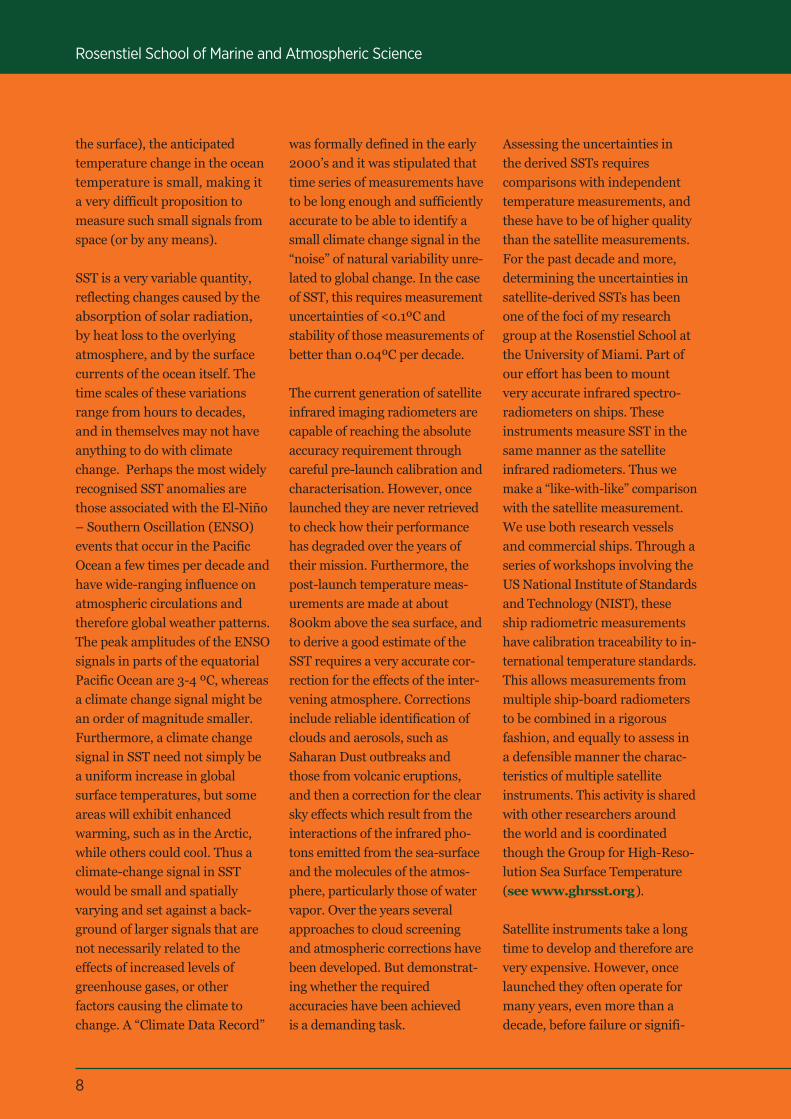
2.New ice beginning to form inopen water of the Arctic Ocean.The photograph was taken from theRussian icebreaker Kapitan Dranit-syn on September 12, 2005, at 80º47.59’ N, 103º 47.687’ E during a research expedition of the Nansenand Amundsen Basins Observa-tional System (NABOS) program. © Peter J Minnett.
3.Monthly averaged global sea-surface temperature derived from infraredmeasurements of the MODerate-resolution Imaging Spectroradiometer(MODIS) on the NASA satellite Terra. The data were taken during May,2001, using cloud screening and atmospheric corrections developed at theRosenstiel School of Marine and Atmospheric Science of the University ofMiami, USA.
Rosenstiel School of Marine and Atmospheric Science
7
temperature rises in the Arctic
will be larger than the global
average in a world with increased
levels of greenhouse gasses. The
models may not agree in the
magnitude of the changes, or
when certain warming thresholds
will be passed, but they all
indicate “Arctic amplification”
of the climate change signal.
Another convincing confirmation
of Arctic amplification is in the
measurements from satellites of
Arctic sea ice extent. Before the
satellite era, that began in the late
1970’s, information about the
extent of Arctic sea ice was very
sparse and incomplete, being
derived from few ship observa-
tions and from aircraft patrols
designed to monitor the positions
of icebergs that might present a
hazard to shipping in the North
Atlantic. Since late 1978, a series
of imaging microwave radiome-
ters have flown on satellites in
polar orbit, providing measure-
ments of the entire Arctic region
on a daily basis. The contrast in
the signal in the microwave
emission from ice and sea water
is very large, and so the distinction
between areas covered by sea ice
and open water is relatively easy
to measure. There is a seasonal
cycle to the Arctic sea ice extent,
increasing in the autumn and
winter when the sunlight is weak
or absent, and the surface loses
heat to space by infrared radia-
tion. The extent begins to
diminish in late spring when
solar heating begins to dominate
the surface heat budget and the
sea-ice begins to melt, leading to
a minimum in the extent in
mid-September each year. In the
first two decades of the satellite
era, the seasonal cycle was more-
or-less stable, with some years
showing more ice in September
than in others, but in the late
1990’s the trend changed with an
acceleration in the reduction of
the annual minimum sea-ice
extent. This acceleration has
continued, with some year-to-year
variations, through the last
decade with the minimum ice
extent in 2012 being about half
of that in 1980.
Another climate-relevant variable
measureable from space is the
surface temperature of the
oceans, commonly referred to as
sea-surface temperature (SST).
Images of the global SST can be
derived from space by both
infrared and microwave radiome-
ters on satellites. The microwave
signal can propagate through
most clouds, so can give a more
complete picture of the SST
patterns than those taken by
infrared imagers, for which
clouds obscure the surface.
However, infrared imagers
produce information at a much
higher spatial resolution, and
therefore complement the
microwave data. The time series
of infrared-derived SST equals
that of the microwave sea-ice
extent, going back to 1978,
whereas accurate SSTs from
microwave instruments began
in the early 2000’s. Because the
thermal capacity of water is so
high, taking about 3500 times
more heat to raise the tempera-
ture of equal volumes of water
and air (at average conditions at
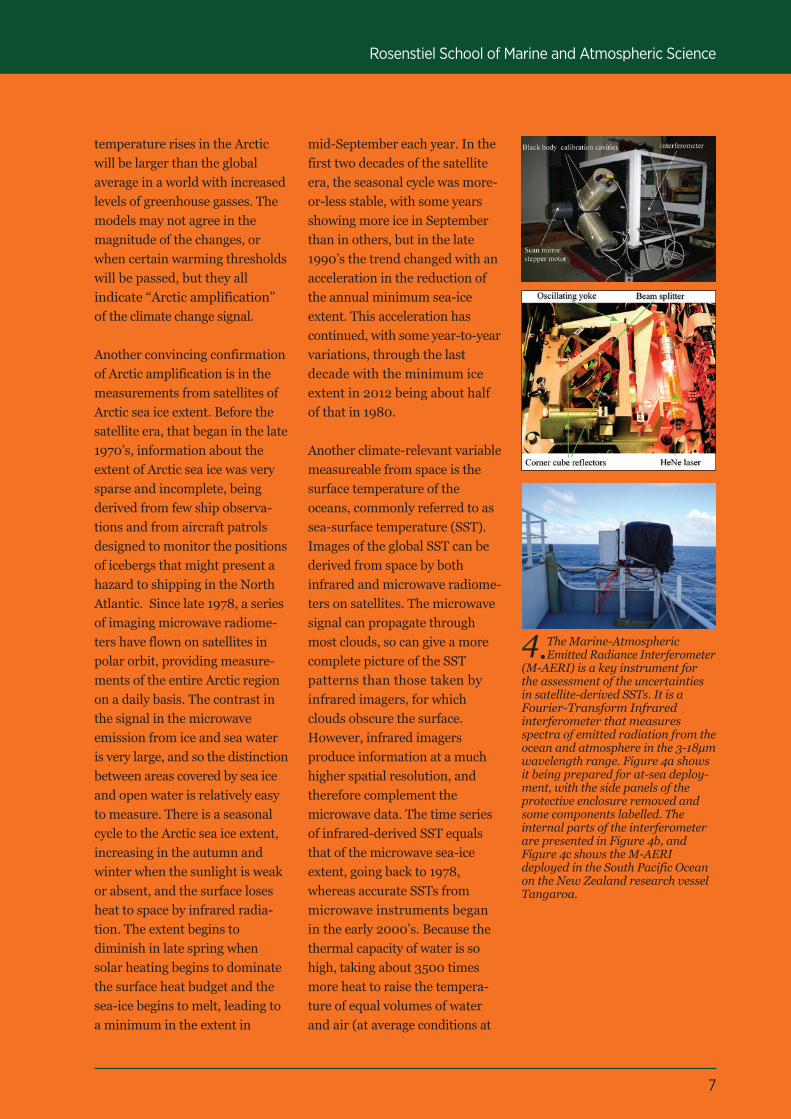
4.The Marine-Atmospheric Emitted Radiance Interferometer(M-AERI) is a key instrument forthe assessment of the uncertaintiesin satellite-derived SSTs. It is aFourier-Transform Infrared interferometer that measures spectra of emitted radiation from theocean and atmosphere in the 3-18µmwavelength range. Figure 4a showsit being prepared for at-sea deploy-ment, with the side panels of the protective enclosure removed andsome components labelled. The internal parts of the interferometerare presented in Figure 4b, and Figure 4c shows the M-AERI deployed in the South Pacific Oceanon the New Zealand research vesselTangaroa.
Rosenstiel School of Marine and Atmospheric Science
8
the surface), the anticipated
temperature change in the ocean
temperature is small, making it
a very difficult proposition to
measure such small signals from
space (or by any means).
SST is a very variable quantity,
reflecting changes caused by the
absorption of solar radiation,
by heat loss to the overlying
atmosphere, and by the surface
currents of the ocean itself. The
time scales of these variations
range from hours to decades,
and in themselves may not have
anything to do with climate
change. Perhaps the most widely
recognised SST anomalies are
those associated with the El-Niño
– Southern Oscillation (ENSO)
events that occur in the Pacific
Ocean a few times per decade and
have wide-ranging influence on
atmospheric circulations and
therefore global weather patterns.
The peak amplitudes of the ENSO
signals in parts of the equatorial
Pacific Ocean are 3-4 ºC, whereas
a climate change signal might be
an order of magnitude smaller.
Furthermore, a climate change
signal in SST need not simply be
a uniform increase in global
surface temperatures, but some
areas will exhibit enhanced
warming, such as in the Arctic,
while others could cool. Thus a
climate-change signal in SST
would be small and spatially
varying and set against a back-
ground of larger signals that are
not necessarily related to the
effects of increased levels of
greenhouse gases, or other
factors causing the climate to
change. A “Climate Data Record”
was formally defined in the early
2000’s and it was stipulated that
time series of measurements have
to be long enough and sufficiently
accurate to be able to identify a
small climate change signal in the
“noise” of natural variability unre-
lated to global change. In the case
of SST, this requires measurement
uncertainties of <0.1ºC and
stability of those measurements of
better than 0.04ºC per decade.
The current generation of satellite
infrared imaging radiometers are
capable of reaching the absolute
accuracy requirement through
careful pre-launch calibration and
characterisation. However, once
launched they are never retrieved
to check how their performance
has degraded over the years of
their mission. Furthermore, the
post-launch temperature meas-
urements are made at about
800km above the sea surface, and
to derive a good estimate of the
SST requires a very accurate cor-
rection for the effects of the inter-
vening atmosphere. Corrections
include reliable identification of
clouds and aerosols, such as
Saharan Dust outbreaks and
those from volcanic eruptions,
and then a correction for the clear
sky effects which result from the
interactions of the infrared pho-
tons emitted from the sea-surface
and the molecules of the atmos-
phere, particularly those of water
vapor. Over the years several
approaches to cloud screening
and atmospheric corrections have
been developed. But demonstrat-
ing whether the required
accuracies have been achieved
is a demanding task.
Assessing the uncertainties in
the derived SSTs requires
comparisons with independent
temperature measurements, and
these have to be of higher quality
than the satellite measurements.
For the past decade and more,
determining the uncertainties in
satellite-derived SSTs has been
one of the foci of my research
group at the Rosenstiel School at
the University of Miami. Part of
our effort has been to mount
very accurate infrared spectro-
radiometers on ships. These
instruments measure SST in the
same manner as the satellite
infrared radiometers. Thus we
make a “like-with-like” comparison
with the satellite measurement.
We use both research vessels
and commercial ships. Through a
series of workshops involving the
US National Institute of Standards
and Technology (NIST), these
ship radiometric measurements
have calibration traceability to in-
ternational temperature standards.
This allows measurements from
multiple ship-board radiometers
to be combined in a rigorous
fashion, and equally to assess in
a defensible manner the charac-
teristics of multiple satellite
instruments. This activity is shared
with other researchers around
the world and is coordinated
though the Group for High-Reso-
lution Sea Surface Temperature
(see www.ghrsst.org).
Satellite instruments take a long
time to develop and therefore are
very expensive. However, once
launched they often operate for
many years, even more than a
decade, before failure or signifi-
Rosenstiel School of Marine and Atmospheric Science

cant degradation and therefore
the data sets they produce are of
exceptionally good monetary
value. Rarely are such instruments
developed solely for climate
research, but are multi-purpose,
often primarily intended for
weather forecasting. However,
the full impact of the satellite
data cannot be fully realised
without painstaking research
over many years to improve the
accuracy of the measurements,
and to demonstrate the
characteristics of the residual
uncertainties in the SSTs.
In the past couple of years, the
first of a new generation of in-
frared radiometer with SST
capability has been launched by
the USA, and an improved model
of microwave radiometer by
Japan. The first of a new type of
infrared radiometer, optimised
for the measurement of SST, will
be launched by ESA next year,
and a new infrared radiometer is
being developed for the next
generation of EUMETSAT polar-
orbiting weather satellites, the
first of which is planned of launch
in 2021. These are all excellent
indicators of a promising future
for studying the climate system
from earth observation satellites.
But this promise will not be
realised without increased
investment in the research groups
around the world endeavoring
to improve the accuracies of
satellite-derived ocean variables,
including SST, to ensure they are
“fit for purpose” for climate
research and monitoring.
Rosenstiel School of Marine and Atmospheric Science

Peter J Minnett
Ocean SciencesRosenstiel School of Marine and Atmospheric Science
University of Miami4600 Rickenbacker Causeway
Miami, FL 33149, USA
Tel: +1 305 421 4104Email: [email protected]