satellite in gaia - arxiv.org · antlia 2 dwarf galaxy is located behind the galactic disc at a...
TRANSCRIPT

MNRAS 000, 1–23 (2018) Preprint 4 December 2018 Compiled using MNRAS LATEX style file v3.0
The hidden giant: discovery of an enormous Galactic dwarfsatellite in Gaia DR2
G. Torrealba,1? V. Belokurov,2,3 S. E. Koposov,4,2 T. S. Li,5,6 M. G. Walker4
J. L. Sanders,2 A. Geringer-Sameth,7 D. B. Zucker,8,9 K. Kuehn10, N. W. Evans2,W. Dehnen11,121 Institute of Astronomy and Astrophysics, Academia Sinica, P.O. Box 23-141, Taipei 10617,Taiwan2 Institute of Astronomy, University of Cambridge, Madingley Road, Cambridge CB3 0HA, UK3 Center for Computational Astrophysics, Flatiron Institute, 162 5th Avenue, New York, NY 10010, USA4 McWilliams Center for Cosmology, Department of Physics, Carnegie Mellon University, 5000 Forbes Avenue, Pittsburgh, PA 15213, USA5 Fermi National Accelerator Laboratory, P.O. Box 500, Batavia, IL 60510, USA6 Kavli Institute for Cosmological Physics, University of Chicago, Chicago, IL 60637, USA7 Department of Physics, Imperial College London, Blackett Laboratory, Prince Consort Road, London SW7 2AZ, UK8 Department of Physics & Astronomy, Macquarie University, Sydney, NSW 2109, Australia9 Macquarie University Research Centre for Astronomy, Astrophysics and Astrophotonics, Macquarie University, Sydney, NSW 2109, Australia10 Australian Astronomical Optics, Macquarie University, North Ryde, NSW 2113, Australia11 Department of Physics & Astronomy, University of Leicester, University Road LE1 7RH Leicester, UK12 Sternwarte der Ludwig-Maximilians-Universitat, Scheinerstrasse 1, Munchen D-81679, Germany
Accepted XXX. Received YYY; in original form ZZZ
ABSTRACTWe report the discovery of a Milky-Way satellite in the constellation of Antlia. TheAntlia 2 dwarf galaxy is located behind the Galactic disc at a latitude of b ∼ 11◦
and spans 1.26 degrees, which corresponds to ∼ 2.9 kpc at its distance of 130 kpc.While similar in extent to the Large Magellanic Cloud, Antlia 2 is orders of magnitudefainter with MV = −8.5 mag, making it by far the lowest surface brightness systemknown (at 32.3 mag/arcsec2), ∼ 100 times more diffuse than the so-called ultra diffusegalaxies. The satellite was identified using a combination of astrometry, photometryand variability data from Gaia Data Release 2, and its nature confirmed with deeparchival DECam imaging, which revealed a conspicuous BHB signal. We have alsoobtained follow-up spectroscopy using AAOmega on the AAT to measure the dwarf’ssystemic velocity, 290.9 ± 0.5km/s, its velocity dispersion, 5.7 ± 1.1 km/s, and meanmetallicity, [Fe/H]= −1.4. From these properties we conclude that Antlia 2 inhabitsone of the least dense Dark Matter (DM) halos probed to date. Dynamical modellingand tidal-disruption simulations suggest that a combination of a cored DM profileand strong tidal stripping may explain the observed properties of this satellite. Theorigin of this core may be consistent with aggressive feedback, or may even requirealternatives to cold dark matter (such as ultra-light bosons).
Key words: Galaxy: halo – galaxies: dwarf – galaxies: individual: Antlia 2 Dwarf
1 INTRODUCTION
While the population of Galactic low-luminosity dwarfsatellites may have been sculpted by a number of yet-unconstrained physical processes such as cosmic reionisation(see e.g. Bose et al. 2018) and stellar feedback (see e.g. Fittset al. 2017), the total number of bright satellites dependsstrongly only on the mass of the host galaxy, and thus can
? E-mail: [email protected]
be predicted more robustly. According to, e.g., Garrison-Kimmel et al. (2018), in the Milky Way today there mayremain between 1 and 3 undetected satellites with stellarmasses M∗ > 105M�. An obvious place where such a satel-lite might reside is the so-called Zone of Avoidance (ZOA, seee.g. Shapley 1961; Kraan-Korteweg & Lahav 2000), a por-tion of the sky at low Galactic latitude, affected by elevateddust extinction and a high density of intervening disc stars.The paucity of Galactic dwarf satellites in this region wasalready apparent in the catalogue of Mateo (1998) and has
c© 2018 The Authors
arX
iv:1
811.
0408
2v2
[as
tro-
ph.G
A]
3 D
ec 2
018
2 G. Torrealba et al.
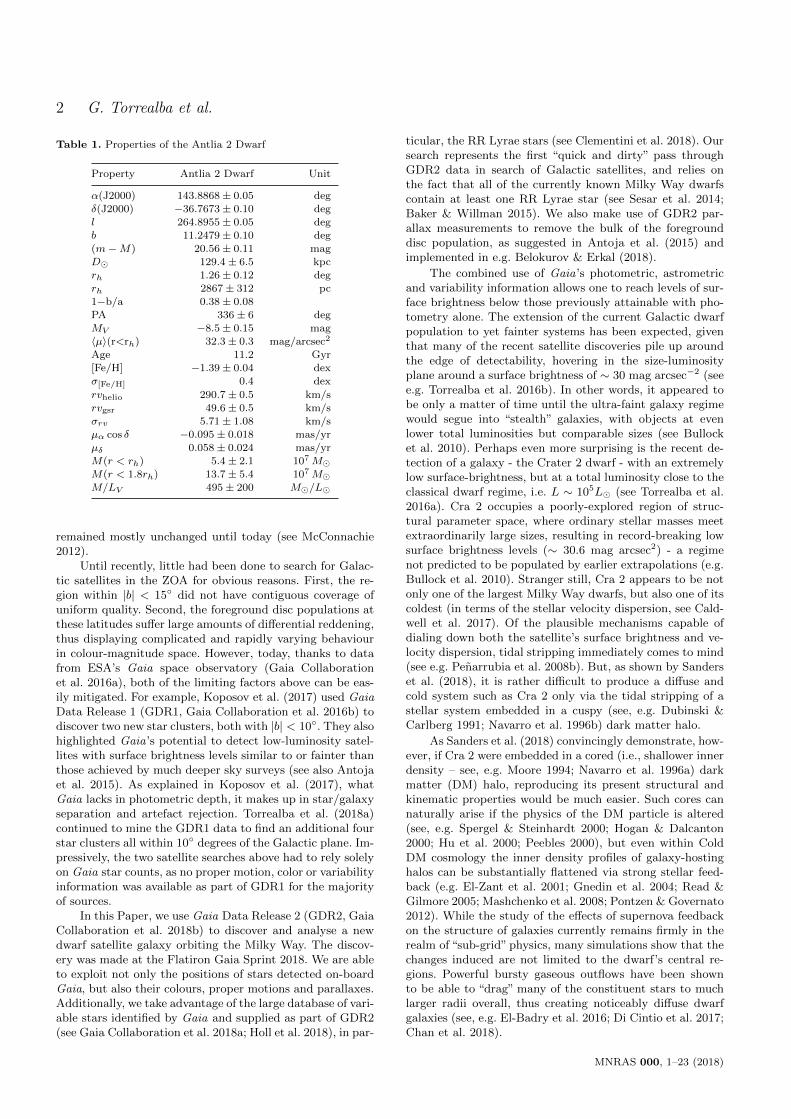
Table 1. Properties of the Antlia 2 Dwarf
Property Antlia 2 Dwarf Unit
α(J2000) 143.8868± 0.05 deg
δ(J2000) −36.7673± 0.10 deg
l 264.8955± 0.05 degb 11.2479± 0.10 deg
(m−M) 20.56± 0.11 mag
D� 129.4± 6.5 kpcrh 1.26± 0.12 deg
rh 2867± 312 pc
1−b/a 0.38± 0.08PA 336± 6 deg
MV −8.5± 0.15 mag
〈µ〉(r<rh) 32.3± 0.3 mag/arcsec2
Age 11.2 Gyr
[Fe/H] −1.39± 0.04 dexσ[Fe/H] 0.4 dex
rvhelio 290.7± 0.5 km/srvgsr 49.6± 0.5 km/s
σrv 5.71± 1.08 km/s
µα cos δ −0.095± 0.018 mas/yrµδ 0.058± 0.024 mas/yr
M(r < rh) 5.4± 2.1 107M�M(r < 1.8rh) 13.7± 5.4 107M�M/LV 495± 200 M�/L�
remained mostly unchanged until today (see McConnachie2012).
Until recently, little had been done to search for Galac-tic satellites in the ZOA for obvious reasons. First, the re-gion within |b| < 15◦ did not have contiguous coverage ofuniform quality. Second, the foreground disc populations atthese latitudes suffer large amounts of differential reddening,thus displaying complicated and rapidly varying behaviourin colour-magnitude space. However, today, thanks to datafrom ESA’s Gaia space observatory (Gaia Collaborationet al. 2016a), both of the limiting factors above can be eas-ily mitigated. For example, Koposov et al. (2017) used GaiaData Release 1 (GDR1, Gaia Collaboration et al. 2016b) todiscover two new star clusters, both with |b| < 10◦. They alsohighlighted Gaia’s potential to detect low-luminosity satel-lites with surface brightness levels similar to or fainter thanthose achieved by much deeper sky surveys (see also Antojaet al. 2015). As explained in Koposov et al. (2017), whatGaia lacks in photometric depth, it makes up in star/galaxyseparation and artefact rejection. Torrealba et al. (2018a)continued to mine the GDR1 data to find an additional fourstar clusters all within 10◦ degrees of the Galactic plane. Im-pressively, the two satellite searches above had to rely solelyon Gaia star counts, as no proper motion, color or variabilityinformation was available as part of GDR1 for the majorityof sources.
In this Paper, we use Gaia Data Release 2 (GDR2, GaiaCollaboration et al. 2018b) to discover and analyse a newdwarf satellite galaxy orbiting the Milky Way. The discov-ery was made at the Flatiron Gaia Sprint 2018. We are ableto exploit not only the positions of stars detected on-boardGaia, but also their colours, proper motions and parallaxes.Additionally, we take advantage of the large database of vari-able stars identified by Gaia and supplied as part of GDR2(see Gaia Collaboration et al. 2018a; Holl et al. 2018), in par-
ticular, the RR Lyrae stars (see Clementini et al. 2018). Oursearch represents the first “quick and dirty” pass throughGDR2 data in search of Galactic satellites, and relies onthe fact that all of the currently known Milky Way dwarfscontain at least one RR Lyrae star (see Sesar et al. 2014;Baker & Willman 2015). We also make use of GDR2 par-allax measurements to remove the bulk of the foregrounddisc population, as suggested in Antoja et al. (2015) andimplemented in e.g. Belokurov & Erkal (2018).
The combined use of Gaia’s photometric, astrometricand variability information allows one to reach levels of sur-face brightness below those previously attainable with pho-tometry alone. The extension of the current Galactic dwarfpopulation to yet fainter systems has been expected, giventhat many of the recent satellite discoveries pile up aroundthe edge of detectability, hovering in the size-luminosityplane around a surface brightness of ∼ 30 mag arcsec−2 (seee.g. Torrealba et al. 2016b). In other words, it appeared tobe only a matter of time until the ultra-faint galaxy regimewould segue into “stealth” galaxies, with objects at evenlower total luminosities but comparable sizes (see Bullocket al. 2010). Perhaps even more surprising is the recent de-tection of a galaxy - the Crater 2 dwarf - with an extremelylow surface-brightness, but at a total luminosity close to theclassical dwarf regime, i.e. L ∼ 105L� (see Torrealba et al.2016a). Cra 2 occupies a poorly-explored region of struc-tural parameter space, where ordinary stellar masses meetextraordinarily large sizes, resulting in record-breaking lowsurface brightness levels (∼ 30.6 mag arcsec2) - a regimenot predicted to be populated by earlier extrapolations (e.g.Bullock et al. 2010). Stranger still, Cra 2 appears to be notonly one of the largest Milky Way dwarfs, but also one of itscoldest (in terms of the stellar velocity dispersion, see Cald-well et al. 2017). Of the plausible mechanisms capable ofdialing down both the satellite’s surface brightness and ve-locity dispersion, tidal stripping immediately comes to mind(see e.g. Penarrubia et al. 2008b). But, as shown by Sanderset al. (2018), it is rather difficult to produce a diffuse andcold system such as Cra 2 only via the tidal stripping of astellar system embedded in a cuspy (see, e.g. Dubinski &Carlberg 1991; Navarro et al. 1996b) dark matter halo.
As Sanders et al. (2018) convincingly demonstrate, how-ever, if Cra 2 were embedded in a cored (i.e., shallower innerdensity – see, e.g. Moore 1994; Navarro et al. 1996a) darkmatter (DM) halo, reproducing its present structural andkinematic properties would be much easier. Such cores cannaturally arise if the physics of the DM particle is altered(see, e.g. Spergel & Steinhardt 2000; Hogan & Dalcanton2000; Hu et al. 2000; Peebles 2000), but even within ColdDM cosmology the inner density profiles of galaxy-hostinghalos can be substantially flattened via strong stellar feed-back (e.g. El-Zant et al. 2001; Gnedin et al. 2004; Read &Gilmore 2005; Mashchenko et al. 2008; Pontzen & Governato2012). While the study of the effects of supernova feedbackon the structure of galaxies currently remains firmly in therealm of “sub-grid” physics, many simulations show that thechanges induced are not limited to the dwarf’s central re-gions. Powerful bursty gaseous outflows have been shownto be able to “drag” many of the constituent stars to muchlarger radii overall, thus creating noticeably diffuse dwarfgalaxies (see, e.g. El-Badry et al. 2016; Di Cintio et al. 2017;Chan et al. 2018).
MNRAS 000, 1–23 (2018)

Antlia 2 dwarf 3
−5.0 −2.5 0.0 2.5 5.0
∆α cos (δ) (deg)
−6
−4
−2
0
2
4
6
∆δ(
deg
)
Stellar Density
0.0 0.5 1.0 1.5 2.0
(Bp− Rp)0(mag)
15
16
17
18
19
20
21
G0(m
ag)
CMD
−4 −2 0 2 4
pm α cos (δ) (mas/yr)
−4
−2
0
2
4
pmδ(
mas/y
r)
Proper Motions
Figure 1. Discovery of Antlia 2 in the Gaia DR2 data. Left: Proper motion and CMD-filtered stars in a ∼ 100 deg2 region around
Ant 2. The gigantic elongated overdensity in the center is easily visible once the proper motion, the CMD and the parallax cuts (see maintext) are applied. Red and orange filled circles show the position of the four RRL that we originally used to find Ant 2 (see Section 2.3
and Figure 3 for more details). Middle: CMD of the Gaia DR2 stars within the half-light radius of Ant 2 filtered by proper motion,
featuring an obvious RGB at a distance of ∼ 130 kpc. Right: Stellar PMs within the half-light radius selected using their position onthe CMD, highlighting a clear overdensity around 0. In each panel, red dashed lines show the selection boundaries used to pick out the
likely satellite members.
This Paper is organized as follows. Section 2 gives thedetails of the search algorithm and archival imaging process-ing; it also describes the modelling of the structural prop-erties of the system and the estimates of its distance. Sec-tion 3 presents the analysis of the spectroscopic follow-upas well as the details of the kinematic modelling. Section 4compares the new satellite to the population of previouslyknown Milky Way dwarfs, and gives an interpretation of itsDM properties. Concluding remarks can be found in Sec-tion 5.
2 THE HIDDEN GIANT
2.1 Discovery in Gaia DR2
Gaia DR2 boasts many unique properties that allow one tostudy the outskirts of the Milky Way as never before. Per-haps the most valuable of these is the wealth of high-qualityall-sky proper motion (PM) information. Gaia’s astrometrymakes it possible to filter out nearby contaminating popula-tions, revealing the distant halo behind them. Halo studiesare further boosted by the use of Gaia’s variable star data,specifically the RR Lyrae (RRL) catalogue (see Holl et al.2018, for details), which provides precise distances out to(and slightly beyond) ∼100 kpc. RRLs are the archetypalold, metal-poor stars, and hence a perfect tracer of the MilkyWay’s halo, including the dwarf satellite galaxies residing init. Indeed, all but one dSph (Carina III, see Torrealba et al.2018b, for further discussion) that have been studied so farcontain at least one RRL (Baker & Willman 2015). Thismakes searches for stellar systems co-distant with RRLs aplausible means to probe for low surface brightness MilkyWay halo sub-structure (see, e.g. Sesar et al. 2014; Baker& Willman 2015).
In this work, we combine the use of both Gaia’s astrom-etry and its RRL catalogues to look for previously unknown
MW satellites. We use a clean sample of RRLs from thegaiadr2.vari rrlyrae table provided by Gaia DR2, and lookfor overdensities of stars with the same proper motions asthe RRL considered. Specifically, we first estimate the RRLdistance modulus as
Dh = 〈G〉 − 3.1AGAV
E(B − V )− 0.5, (1)
where 〈G〉 is the intensity-averaged G magnitude, E(B-V)is taken from the Schlegel et al. (1998) extinction map, andAG/AV = 0.8593 is the extinction coefficient for the GaiaG band (Malhan et al. 2018). For simplicity we assumedan absolute magnitude for the RRL of 0.5 (but see Iorio &Belokurov 2018). Then, we cleaned up the RRL sample byremoving stars with astrometric excess noise larger than 1,and reduced the sample to search only around stars thathave Dh > 50 and that are at least 15 degrees away fromthe LMC and SMC. The stars selected for the overdensitysearch were taken in a 2 degree radius from the central RRL.Only stars with PMs consistent - within the uncertainties -with the central RRL PM were considered. Additionally, weremoved stars with low heliocentric distances by applying acut on parallax of $ > 0.5.
Specifically, the overdensity search was performed asfollows. We counted the number of the previously selectedstars within circular apertures ranging in radius from 1′ to30′ (from the central RRL), and compared these to the fore-ground, which was estimated in the area between 1 and 2degrees away from the RRL star. If any of the samples ex-ceeded by more than 2σ the expected foreground number,we flagged the trial RRL as a possible tracer of a stellar sys-tem. By plotting the flagged RRL in the sky - together withthe known satellite galaxies and the globular clusters - weimmediately noticed that three flagged RRL with distancesbetween 55 and 90 kpc were bunching up in a small regionof the sky where no known stellar system was present. A
MNRAS 000, 1–23 (2018)

4 G. Torrealba et al.
-5 0 5
∆α cos (δ) (deg)
-5
0
5
All
Sta
rs∆δ(
deg
)
Stellar Density
-5 0 5
∆α cos (δ) (deg)
-5
0
5
Sel
ecte
dS
tars
∆δ(
deg
)
−5 0
pm α cos (δ) (mas/yr)
−4
−2
0
2
4
6
8
pmδ(
mas/y
r)
Proper Motions
−5 0
pm α cos (δ) (mas/yr)
−4
−2
0
2
4
6
8
pmδ(
mas/y
r)
−0.5 0.0 0.5 1.0 1.5
(g − r)0(mag)
15
16
17
18
19
20
21
r 0(m
ag)
CMD
−0.5 0.0 0.5 1.0 1.5
(g − r)0(mag)
15
16
17
18
19
20
21
r 0(m
ag)
Figure 2. DECam view of Antlia 2. Stars in a ∼ 100 deg2 region centred on the dwarf are shown. The top row gives the properties of allstars in this portion of the sky, while the bottom panels illustrate the properties of the likely Ant 2 members. Left: Distribution of the
stellar density on the sky. The red ellipse corresponds to the half-light radius of the best-fit model (rh = 1.26◦), and marks the boundary
used for the spatial selection. Middle: Hess diagram, i.e. stellar density in the CMD. Red line corresponds to the best-fit isochrone withlog age = 10.05 and [Fe/H] = −1.4. Right: Stellar density in proper motion space. The red ellipse marks the PM selection boundary.
Being very close to the Galactic disc (b ∼ 11◦), the region around Ant 2 is heavily dominated by the MW foreground. Nonetheless, after
applying all of the selection cuts (including the parallax, see main text), Ant 2’s signal appears conspicuous in all three parameter spaces.
closer inspection revealed that the RRLs shared the samePM; moreover the PM-filtered stars in the region had a con-spicuous signal both in the CMD and on the sky, as seen inFigure 1. More precisely, the left panel of the Figure showsthe spatial distribution of the stars selected using the PMand the CMD cuts. Here a large stellar overdensity spanningmore than 1 degree on the sky is visible. The middle panelgives the CMD density of stars within the half-light radius(red dashed line in left panel, see Sec. 2.2 for its definition),and after applying the PM cut. A broad Red Giant Branch(RGB) at a distance of & 100kpc can be easily discerned.The red polygon indicates the CMD mask used for the se-lection, which was empirically defined based on the RGBfeature. Finally, the right panel of the Figure demonstratesthe PM density of stellar sources within the half-light radiusand inside the CMD mask shown in the middle panel. A tightover-density is noticeable around µα ∼ 0 and µδ ∼ 0. Thered ellipse outlines the PM selection boundary, as defined inSection 2.2. Based only on the approximate distance, the sizeand the breadth of the RGB we can safely conclude that thenewly found object is a dwarf galaxy satellite of the MilkyWay. This hypothesis is further tested and confirmed below.As the dwarf is discovered in the constellation of Antlia (orthe Pump), we have given it the name Antlia 2 (or Ant 2).
Note that Ant 2’s neighbour on the sky, the previously-foundAntlia dwarf, is a transition-type dwarf (i.e. a galaxy withproperties similar to both dwarf spheroidals and dwarf ir-regulars) on the outskirts of the Local Group (i.e. beyond 1Mpc, see Whiting et al. 1997).
2.2 Photometric modeling
2.2.1 Deep DECam imaging data
To better characterize the new object, we checked whetherany deeper photometric data were available. In this re-gion, photometry with partial coverage was found in theNOAO source catalogue (NSC, Nidever et al. 2018); addi-tionally several unprocessed images were available from theNOAO archive. We searched for DECam data in the g andr bands in a 100 square degree region around (ra, dec) =144.1558,−37.07509, and retrieved the instcal and weightframes provided by NOAO. Most of the area is covered withimages from two Programs, namely 2017A-0260 (the BLISSsurvey) and 2015A-0609, but we also downloaded imagesfrom Programs 2013B-0440 and 2014B-0440, although theselatter two only added 3 fields in total in the outskirts of theregion.
MNRAS 000, 1–23 (2018)
Antlia 2 dwarf 5
−0.4 −0.2 0.0
(g − r)0(mag)
15
16
17
18
19
20
21
22
23
r 0(m
ag)
19.0 19.5 20.0 20.5 21.0DMBHB
0
10
20
30
4020.56± 0.1
-5 0 5
∆α cos (δ) (deg)
-5
0
5
∆δ(
deg
)
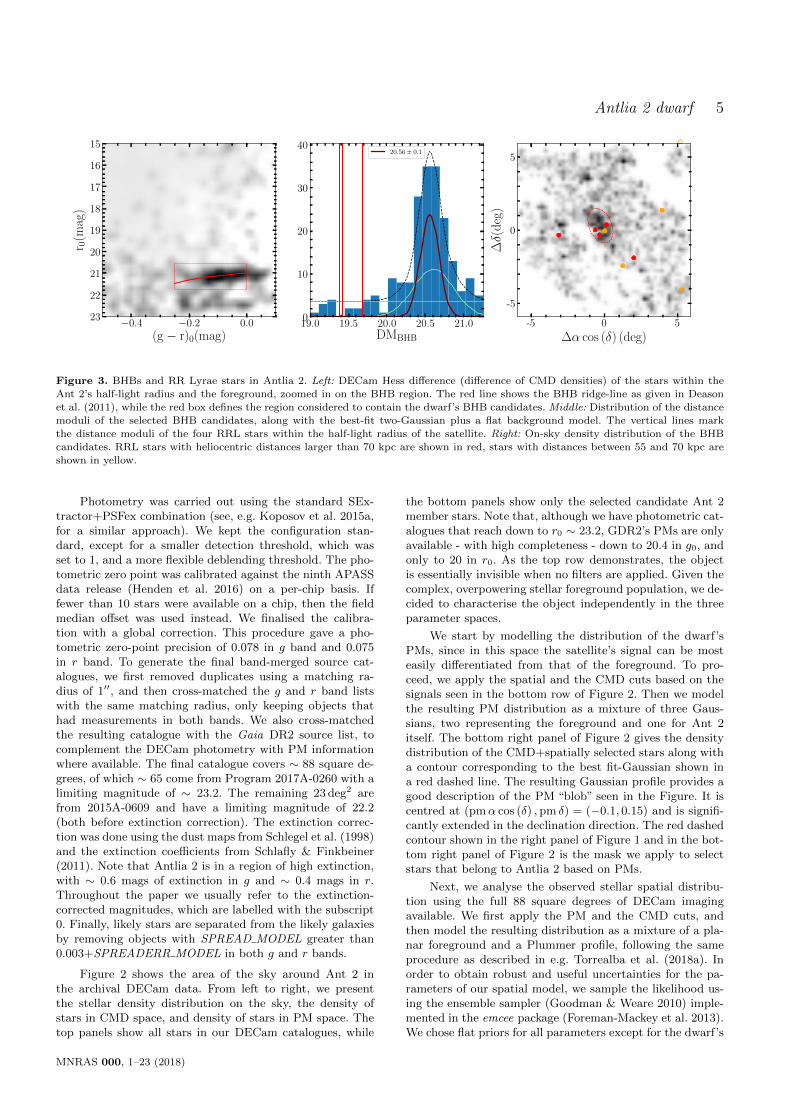
Figure 3. BHBs and RR Lyrae stars in Antlia 2. Left: DECam Hess difference (difference of CMD densities) of the stars within theAnt 2’s half-light radius and the foreground, zoomed in on the BHB region. The red line shows the BHB ridge-line as given in Deason
et al. (2011), while the red box defines the region considered to contain the dwarf’s BHB candidates. Middle: Distribution of the distance
moduli of the selected BHB candidates, along with the best-fit two-Gaussian plus a flat background model. The vertical lines markthe distance moduli of the four RRL stars within the half-light radius of the satellite. Right: On-sky density distribution of the BHB
candidates. RRL stars with heliocentric distances larger than 70 kpc are shown in red, stars with distances between 55 and 70 kpc are
shown in yellow.
Photometry was carried out using the standard SEx-tractor+PSFex combination (see, e.g. Koposov et al. 2015a,for a similar approach). We kept the configuration stan-dard, except for a smaller detection threshold, which wasset to 1, and a more flexible deblending threshold. The pho-tometric zero point was calibrated against the ninth APASSdata release (Henden et al. 2016) on a per-chip basis. Iffewer than 10 stars were available on a chip, then the fieldmedian offset was used instead. We finalised the calibra-tion with a global correction. This procedure gave a pho-tometric zero-point precision of 0.078 in g band and 0.075in r band. To generate the final band-merged source cat-alogues, we first removed duplicates using a matching ra-dius of 1′′, and then cross-matched the g and r band listswith the same matching radius, only keeping objects thathad measurements in both bands. We also cross-matchedthe resulting catalogue with the Gaia DR2 source list, tocomplement the DECam photometry with PM informationwhere available. The final catalogue covers ∼ 88 square de-grees, of which ∼ 65 come from Program 2017A-0260 with alimiting magnitude of ∼ 23.2. The remaining 23 deg2 arefrom 2015A-0609 and have a limiting magnitude of 22.2(both before extinction correction). The extinction correc-tion was done using the dust maps from Schlegel et al. (1998)and the extinction coefficients from Schlafly & Finkbeiner(2011). Note that Antlia 2 is in a region of high extinction,with ∼ 0.6 mags of extinction in g and ∼ 0.4 mags in r.Throughout the paper we usually refer to the extinction-corrected magnitudes, which are labelled with the subscript0. Finally, likely stars are separated from the likely galaxiesby removing objects with SPREAD MODEL greater than0.003+SPREADERR MODEL in both g and r bands.
Figure 2 shows the area of the sky around Ant 2 inthe archival DECam data. From left to right, we presentthe stellar density distribution on the sky, the density ofstars in CMD space, and density of stars in PM space. Thetop panels show all stars in our DECam catalogues, while
the bottom panels show only the selected candidate Ant 2member stars. Note that, although we have photometric cat-alogues that reach down to r0 ∼ 23.2, GDR2’s PMs are onlyavailable - with high completeness - down to 20.4 in g0, andonly to 20 in r0. As the top row demonstrates, the objectis essentially invisible when no filters are applied. Given thecomplex, overpowering stellar foreground population, we de-cided to characterise the object independently in the threeparameter spaces.
We start by modelling the distribution of the dwarf’sPMs, since in this space the satellite’s signal can be mosteasily differentiated from that of the foreground. To pro-ceed, we apply the spatial and the CMD cuts based on thesignals seen in the bottom row of Figure 2. Then we modelthe resulting PM distribution as a mixture of three Gaus-sians, two representing the foreground and one for Ant 2itself. The bottom right panel of Figure 2 gives the densitydistribution of the CMD+spatially selected stars along witha contour corresponding to the best fit-Gaussian shown ina red dashed line. The resulting Gaussian profile provides agood description of the PM “blob” seen in the Figure. It iscentred at (pmα cos (δ) ,pm δ) = (−0.1, 0.15) and is signifi-cantly extended in the declination direction. The red dashedcontour shown in the right panel of Figure 1 and in the bot-tom right panel of Figure 2 is the mask we apply to selectstars that belong to Antlia 2 based on PMs.
Next, we analyse the observed stellar spatial distribu-tion using the full 88 square degrees of DECam imagingavailable. We first apply the PM and the CMD cuts, andthen model the resulting distribution as a mixture of a pla-nar foreground and a Plummer profile, following the sameprocedure as described in e.g. Torrealba et al. (2018a). Inorder to obtain robust and useful uncertainties for the pa-rameters of our spatial model, we sample the likelihood us-ing the ensemble sampler (Goodman & Weare 2010) imple-mented in the emcee package (Foreman-Mackey et al. 2013).We chose flat priors for all parameters except for the dwarf’s
MNRAS 000, 1–23 (2018)

6 G. Torrealba et al.
−100 0 100 200 300 400
HRV (km/s)
0
10
20
30
40
−0.5 0.0 0.5 1.0 1.5
(g − r)0(mag)
17
18
19
20
r 0(m
ag)
-1.0
-1.3
-1.4
-1.5
-2.0
−2.50
−2.25
−2.00
−1.75
−1.50
−1.25
−1.00
−0.75
−0.50
Figure 4. Top: CMD of the stars with spectroscopic measure-
ments within the DECam data footprint. Ant 2 stars with accu-rate velocity measurements are colour-coded according to their
spectroscopic metallicity. Small black dots are stars with veloci-
ties inconsistent with Ant 2 membership and small black crossesare stars without good velocity measurements. The red line corre-
sponds to the best-fit isochrone from the photometric modelling,
while the dashed lines show isochrones with the same age, butdifferent metallicity values. Reassuringly, there is a good corre-
lation between the spectroscopic metallicity of each star and thegeneral ((g−r)0 colour) trend marked by the different isochrones.
The large spread in the spectroscopic metallicity of Ant 2 stars
appears to be consistent with the large width of the RGB. Bot-tom: Distribution of heliocentric radial velocities of the targeted
stars. Only stars with accurate velocity measurements are shown
(uncertainties less than 10 km s−1, residual kurtosis and skewnessless than 1). The red curve shows the best-fit foreground model,consisting of two Gaussian distributions.
size, which uses the Jeffreys prior. The best-fit parametersand their uncertainties are estimated from the marginalizedposterior distributions corresponding to the 15.9%, 50%, and84.1% percentiles. The half-light radius of the best-fit modelis shown as the red ellipse in the bottom left panel of Figure2, corresponding to a whopping rh = 1.26 ± 0.12 deg. TheAnt 2 dwarf’s angular extent is similar to that of the SMCand almost three times larger than the next largest knownsatellite. Located at ∼ 130 kpc (see sec. 2.3 for details), thisangular size translates to ∼ 2.9 ± 0.3 kpc, which is equalin size to the LMC! A summary of the relevant physicalparameters measured above is presented in Table 1.
Finally, we model the stellar distribution in CMD spaceusing Padova isochrones (Bressan et al. 2012) for the satel-lite’s stars and an empirically estimated foreground. In linewith previous steps, we first apply a spatial cut, using thebest-fit structural model, as well as a PM cut based on theconstraint derived above. Additionally, we fix the distancemodulus to the value obtained by fitting the satellite BHBcandidates (see section 2.3 for details), more precisely we usem−M = 20.56, and we set up a magnitude limit of 20 in r0
and 20.4 in g0, corresponding to the range within which allstars have their PMs measured by Gaia. The isochrone mod-els are built on a colour-magnitude grid by convolving theexpected number of stars along the isochrone with the pho-tometric uncertainties. We also add an uncertainty of 0.3mag in the distance modulus. The modeling is performedonly between 0.5 < (g − r)0 < 1.5, since this is the regionwhere the RGB, the only easily discernible CMD feature, islocated. To create the foreground model, we make a densitymap of the stars in the same part of the sky, but remov-ing the stars with the PM of Ant 2. Finally, we carry out amaximum-likelihood optimization to determine the ratio ofthe foreground stars to the satellite’s for the isochrones withlogarithmic ages between 9.9 and 10.1 and metallicities be-tween -2.1 and -0.8. The best-fit model obtained is that withlog (age) = 10.05 and [Fe/H] = −1.4. The best-fit isochronealong with the PM and spatial filtered CMD is shown inthe middle panel of Figure 2. Note that the good fit of theRGB at the given distance modulus provides an indepen-dent confirmation of the distance to Ant 2. Using the aboveCMD model of the satellite, we can measure the number ofAnt 2’s stars above the limiting magnitude N = 159 ± 15.Given that the catalogue is close to 100% completeness forg0 < 20.4, we can combine the total number of stars withthe best-fit isochrone to estimate the absolute magnitude ofAnt 2 to be MV = −8.53± 0.15.
2.3 Horizontal Branch and distance
If no PM cut is applied, it is very difficult to see the RGBfeature in the CMD, but it is still possible to see a strongBHB sequence at r0 ∼ 21.2. This is illustrated in the leftpanel of Figure 3, in which we show the blue part of thedifferential Hess diagram between the stars within the half-light radius of Ant 2 and those in the foreground. The sampleshown comes from the region where the limiting magnitudein the r band is 23.2. The red line indicates the BHB ridge-line from Deason et al. (2011) at the distance modulus of20.56. This is the best-fit value obtained by measuring thedistance modulus of all stars within the dashed red box, as-suming they are drawn from the above ridge-line. The dis-tribution of the observed distance modulus is shown in themiddle panel of the Figure, along with a two-Gaussian plusa flat background model. The two Gaussian components areshown in brown and green, and the flat background cyan.The resulting fit is shown as a dashed black line. Taking intoaccount the fact that there is still plenty of contaminationin this part of the CMD, we take the brown Gaussian to berepresentative of the Ant 2 BHB population, with the corre-sponding uncertainty in the distance modulus of 0.11. Thistranslates into a distance of 129.4±6.5 kpc. The red verticallines show the distance moduli of the three RRL originallyfound around Ant 2. Clearly, these variable stars – while
MNRAS 000, 1–23 (2018)

Antlia 2 dwarf 7
−3 −2 −1 0
[Fe/H](dex)
−100
0
100
200
300
400
HR
V(k
m/s
)
−1.0 −0.5 0.0 0.5 1.0 1.5
µα cos δ(mas/yr)−1.0 −0.5 0.0 0.5 1.0 1.5
µδ(mas/yr)
Figure 5. Heliocentric radial velocities of Ant 2 targets. Left: HRV vs spectroscopic metallicity. Only stars with good RVs (see Fig. 4)
and small metallicity errors σ[Fe/H]<0.5 are shown. Ant 2 members stand out clearly as low-metallicity stars, while a small numberof foreground contaminants are mostly high-metallicity disc stars. There is also a handful of halo stars. Middle/Right: HRV vs proper
motion in Right Ascension (middle) and Declination (right). Since only stars within ±1.5 mas yr−1 were spectroscopically targeted, the
proper motion range shown is truncated. Note however that Ant 2’s proper motion is clearly distinct from the bulk of the foregroundcontaminants and concentrates towards µ ≈ 0. This can also be seen in the corresponding 1D histograms shown above each panel.
located far in the halo – appear to be positioned well infront of the dwarf along the line of sight. We speculate thatthis handful of RR Lyrae detected by Gaia may be on thenear side of an extended cloud of tidal debris (see Section 4for details) emanating from the dwarf. Given its luminosity,Ant 2 is likely to host many tens of RR Lyrae, similar to,e.g., its close analogue, Crater 2 (see Joo et al. 2018). At thedistance of the main body of the dwarf, RR Lyrae wouldbe too faint for Gaia but should be detectable with deeperfollow-up imaging. The distribution of the BHBs, along withthe RRLs with distances larger than 55 kpc, is shown in theright panel of Figure 3. An obvious BHB overdensity with ashape very similar to that of the RGB stars is visible at theposition of Antlia 2, further confirming that the BHB andthe RGB features are correlated.
3 SPECTROSCOPIC FOLLOW-UP
Immediately after the object’s discovery at the Flatiron GaiaSprint, we sought to obtain spectroscopic follow up of someof Ant 2’s RGB members. The night of 24 June 2018 weobtained service mode observations of targets in the field ofAnt 2 with the 2dF+AAOmega Spectrograph (Sharp et al.2006) on the 3.9 m Anglo-Australian Telescope. The dataconsist of 3×30 min exposures taken with an average seeingof 1.4′′, over an airmass range of 1.4 to 2 and at a moondistance of ∼ 80◦ from the full moon. We used 580V (R∼ 1300) and 1700D (R ∼ 10000) gratings in the blue andred channels, respectively. Because of the bright moon con-ditions during observations, the signal-to-noise of the bluespectra taken with the 580V grating was low, and hence weonly used the red 1700D spectra – containing the infraredcalcium triplet – for the analysis in this paper.
The strong unambiguous RGB signal, and the avail-ability of the colour-magnitude, proper motion and spa-
tial information allowed easy and efficient target selection.Figure 4 gives the DECam colour-magntitude diagram ofthe targets selected for the spectroscopic follow-up. Notethat the original selection was performed using Gaia’s BPand RP band-passes, which is why the selection deviatessubstantially from the isochrone colours at fainter magni-tudes. On top of the CMD-based selection, we also requiredthe targets to have proper motions within 1.5 mas/yr of(µα cos δ, µδ) = (−0.04,−0.04)mas/year. The targets wereselected to occupy the whole of the 2 deg field of view of the2dF+AAOmega spectrograph. We observed a total of 349candidate stars in Ant 2.
The data reduction was performed using the latestversion 2dfdr (v6.46)1, including the following procedures:bias subtraction, 2D scattered light subtraction, flat-fielding,Gaussian-weighted spectral extraction, wavelength calibra-tion, sky subtraction, and spectrum combination.
To model the observed spectra and obtain chemicalabundances and radial velocities we have used a direct pixel-fitting approach by interpolated spectral templates (see e.g.Koleva et al. 2009; Koposov et al. 2011; Walker et al.2015). We use the PHOENIX v2.0 spectral library (Husseret al. 2013) that spans a large range of metallicities (from[Fe/H]= −4 to [Fe/H]= 1) and stellar atmospheric param-eters. For parameter values that fall between templates, wecombine the Radial Basis Function interpolation, which isused to create a grid with a step size finer than that inthe original PHOENIX grid, with a linear N-d interpolationbased on the Delaunay triangulation (Hormann 2014) (at thelast stage). At each spectral-fitting step, the polynomial con-tinuum correction transforming the template into observeddata is determined. As the original template grid has log g,Teff , [Fe/H] and α parameters, we sample those together
1 https://www.aao.gov.au/science/software/2dfdr
MNRAS 000, 1–23 (2018)

8 G. Torrealba et al.
−0.4 −0.3 −0.2 −0.1 0.0 0.1 0.2µα [mas/yr]
−0.4
−0.3
−0.2
−0.1
0.0
0.1
0.2
µδ
[mas
/yr]
Gaia proper motionKinematic proper motion
Figure 6. Ant 2’s proper motion measurement using two differ-ent methods (see main text). The black filled circle shows the
proper motion of Ant 2’s centre as measured using the Gaia DR2
data. The grey filled circle shows the proper motion inferred fromthe radial velocity gradient (Walker et al. 2006). The dashed line
shows the expected proper motion direction if it is aligned with
the elongation of Ant 2’s iso-density contours, as measured in Sec-tion 2.2. Note that the Gaia proper motion is well aligned with
the elongation, suggesting that the elongation may be of tidalnature. The fact that the kinematic proper motions are pointing
in a slightly different direction suggests that the dwarf’s internal
kinematics may be affected by either intrinsic rotation or Galactictides.
0.0 0.2 0.4 0.6 0.8 1.0 1.2R [deg]
0
1
2
3
4
5
6
7
8
σ[k
m/s
]
Figure 7. Line-of-sight velocity dispersion measured as a func-
tion of radial distance from Ant 2’s centre. Each bin contains
roughly equal numbers of stars. Error bars correspond to the 16%-84% percentiles of the measurements. There is a non-statistically
significant hint of a velocity dispersion decrease close to the cen-ter.
with the radial velocity using the emcee (Foreman-Mackeyet al. 2013) ensemble sampler, while assuming uniform priorsover all parameters. The resulting chains for each parameterof interest are then used to measure various statistics, suchas posterior percentiles, standard deviations as well as themeasures of non-Gaussianity, such as kurtosis and skewness(as motivated by Walker et al. 2015). The average signal-to-noise of the spectra is 5.8, and for the spectra with S/N>3the median uncertainties were 2.67 km/s, 0.7 dex, 325 K,and 0.35 dex for the RV, log g, Teff , and [Fe/H], respec-tively. Table 2 records all the relevant information for thespectroscopic measurements reported here.
For the most part, the analysis of the stellar kinematicsin the paper utilises the subset of stars with 1σ uncertaintiesin the radial velocity less than 10 km s−1 and residual kur-tosis and skewness less than 1 in absolute value in order toensure that the posterior is close enough to a Gaussian. Thenumber of these stars is 221. The velocity distribution of allof the observed stars is shown in Figure 4. The distributionreveals a strikingly prominent peak at ∼ 290 km s−1 - un-doubtedly Ant 2’s velocity signature - as well as a broad (andweak) contribution from the MW halo and MW disk. The as-sociation of the velocity peak with Ant 2 is particularly clearin Fig. 5, where we show the radial velocities of the observedstars as a function of their proper motion and spectroscopicmetallicity. The stars in the RV peak have metallicities sig-nificantly lower than the field stars and are concentratedaround the proper motion value of (µα cos δ, µδ) ≈ (0, 0).In the next section, we model the observed distribution tomeasure the kinematic properties of the newly discovereddwarf.
3.1 Kinematic modelling
To describe the kinematics of the system we construct agenerative model of the proper motions and radial veloci-ties. The right two panels of Figure 5 show the data usedfor the model. We highlight that both the proper motionsand radial velocities are highly informative for identificationof members of Antlia 2, however the proper motion errorsare noticeably larger. For the foreground contaminants, ourmodel assumes a 2-component Gaussian mixture distribu-tion in radial velocity and a uniform distribution over propermotions within our selection box. The radial velocity distri-bution of the Antlia 2 members is modeled by a Gaussian,while the proper motions are assumed to have no intrinsicscatter and therefore are described by a delta function asspecified below:
P(µ, V |α, δ) = (1− fo)(fb,1N(V |Vb,1, σb,1) +
(1− fb,1)N(V |Vb,2, σb,2))U(µ) + foN(V |Vo, σo))δ(µ− µo) (2)
where fo is the fraction of stars belonging to Antlia 2and fb,1 is the fraction of the foreground stars belongingto a first Gaussian component, Vo and σo are the sys-temic velocity and the velocity dispersion of Antlia 2, andVb,1,Vb,2, σb,1, σb,2 are the means and standard deviationsof the Gaussian distribution of the foreground. U(µ) is thebivariate uniform distribution within the proper motion se-lection region. The Gaussian uncertainties on both proper
MNRAS 000, 1–23 (2018)

Antlia 2 dwarf 9
50 100 150 200
RC(Kpc)
−60
−40
−20
0
20
40
60
80
Z(Kpc
) Ant 2
−100 0 100
X(Kpc)
−60
−40
−20
0
20
40
60
80
Z(Kpc
)
Disk t = -0.35 Gyr
Peri t = -0.81 Gyr
Apo t = -2.19 Gyr
−100 0 100
X(Kpc)
−150
−100
−50
0
50
100
Y(Kpc
)
Figure 8. Orbit of Antlia 2 in Galactocentric coordinates. The orbit of Ant 2 is obtained by integrating for 5 Gyr the initial conditions
as recorded in Table 1 in the MWPotential2014 potential from galpy (Bovy 2015), but in a DM halo which is 12% more massive. Theposition of Ant 2 is shown in cyan, together with its past (black) and future (red) orbits. The most recent pericentre and apocentre are
marked with green and purple filled circles, respectively. The most recent “disc” crossing is shown in yellow. Note that this happens about∼ 90 kpc from the centre of the galaxy. The background density map corresponds to the cumulative positions of the orbits sampled
according to the uncertainties in the dwarf’s line-of-sight velocity, proper motion, and distance. The orbit and position of the LMC are
shown in grey. On this orbit, the pericentre of Ant 2 is at 48± 11 kpc.
motions and radial velocities for each star are easily takeninto account in this model by convolving the distributionwith the appropriate Gaussian. The only additional assump-tion we make to take into account the uncertainties is thatthe contaminants are approximately uniformly distributedover a much larger area than the proper motion selectionarea. We note also that the probability distribution in Eq. 2is conditioned on Right Ascension and Declination, as someof the variants of the model described below consider thedependence of the systemic velocity and the proper motionVo and µo on the star’s position.
Because Antlia 2 is exceptionally extended on the sky,we consider a situation where the systemic velocity of the ob-ject can spatially vary across the object. Such velocity fieldevolution could be induced either by the internal dynamicsin Antlia 2 or the perspective ‘rotation’ effect due to theproper motion of the object (Merritt et al. 1997; Kaplinghat& Strigari 2008; Walker et al. 2008). To test these possiblescenarios above we consider a total of the following threemodels for the systemic velocity Vo of Antlia 2.
• Constant radial velocity (Vo)• Radial velocity is a function of systemic veloc-
ity, proper motion and position of the star Vo =Vo(Vo,0, α, δ,D, µα,0, µδ,0) as predicted by projection effects(perspective rotation).• The previous model combined with the linear gradient
in radial velocity Vo = Vo,0 + Vx(α− α0) cos δ0 + Vy(δ − δ0)
We also ran the second model using the radial velocitydata only, while ignoring the Gaia proper motion informa-tion in order to separate the inference of Antlia’s propermotion driven by the Gaia data from the inference based onthe radial velocity gradients.
For all of the three models described above the param-eters were sampled using the ensemble sampler. For eachposterior sample we ignored the first half of the chain as aburn-in/warm-up. For the remainder of the chains we veri-
150 120 90 60 30 0 -30 -60 -90 -120 -150
l (deg)−75◦−60◦
−45◦−30◦
−15◦0◦15◦
30◦45◦
60◦75◦
b(d
eg)
Ant 2
LMC
Figure 9. Distribution of the MW dwarf satellites in Galacto-
centric coordinates. The position of Ant 2 is shown as a red filledcircle. The positions of the Magellanic clouds are shown in blue.
Other MW dwarf galaxies are shown in black. The red and blue
lines are the orbits of Ant 2 and the LMC, respectively. Blacklines enclose the Galactic plane between b ± 15, highlighting the
ZOA, which presently clearly shows a dearth of MW satellites.Interestingly, while the LMC’s orbit is not aligned with that ofAnt 2, the new object lies close to the projection of the Cloud’s
orbital path. Note however that testing the possibility of associa-
tion between these two objects is not feasible without a detailedsimulation of the MC and Ant 2’s accretion onto the MW (see
also Fig.8).
fied the convergence by checking the acceptance rate acrosswalkers and verified that the means and the standard devi-ations of the first third of the chains agreed well with thelast third part of the chains for each parameter (Geweke& In 1995). The values of common parameters measuredfrom different models mostly agree within 1σ. The parame-ter values from the model with perspective rotation and nointrinsic velocity gradient such as systemic velocity, propermotions, and velocity dispersion are given in the bottom part
MNRAS 000, 1–23 (2018)

10 G. Torrealba et al.
−3.0 −2.5 −2.0 −1.5 −1.0 −0.5 0.0[Fe/H] [dex]
0
5
10
15
20
25
30
N
Antlia 2KDEFornaxLeoII
Figure 10. Distribution of spectroscopic metallicities of Ant 2’sstars with 274<HRV<303 km/s and metallicity error less than
0.5 dex. The black line is the [Fe/H] histogram with a bin size
of 0.2 dex, while the grey curve shows the kernel density esti-mation using the Epanechnikov kernel. The mean metallicity is
< [Fe/H] >=-1.39, with a significant scatter toward low metal-
licities. Metallicity distributions of stars in Fornax and Leo II arealso shown for comparison.
of Table 1. The main results are the following: the systemicvelocity is Vo = 290.7 ± 0.5 km/s, with a velocity disper-sion of σo = 5.71± 1.08 km/s and a systemic proper motionof µα cos δ = −0.095 ± 0.018 mas/yr µδ = 0.059 ± 0.024mas/yr.
The goodness-of-fit (log-likelihood) values for the differ-ent models listed above were comparable, with a likelihoodratio of ∼ 1 - indicating that no very strong evidence forperspective rotation or intrinsic rotation was observed. How-ever the model that was applied to the radial velocity datawhile ignoring the Gaia proper motions implied a kinematicproper motion of µα cos δ, µδ = −0.26±0.13,−0.28+/−0.10mas/yr, which is in some tension with the overall (Gaia-based) proper motion of the system. Figure 6 shows the com-parison between the inferred systemic proper motion values,as well as the expected proper motion direction if it wasaligned with the orientation of the Antlia 2’s iso-density con-tours. The most likely explanation for the mismatch of thekinematic proper motion and the astrometric proper motionis that Antlia has some intrinsic velocity gradient. This canbe associated either with the tidal disruption of the systemor with the intrinsic rotation.
We have also attempted to measure the velocity disper-sion gradient in Antlia 2 by applying the model in Eq. 2to stars in 3 different angular distance bins (with respectto Antlia 2’s center). The bins were selected such that theyhave an approximately equal number of stars. We kept theparameters of the foreground velocity and the proper motiondistribution fixed across those bins and only allowed the ve-locity dispersion of the dwarf and a mixing fraction of dwarfstars to change from bin to bin. The results of this model areshown in Fig. 7. We can see that the velocity dispersion inthe very central bin is measured to be somewhat lower than
in the outer bins, although by only ∼ 2 σ. While the stellarvelocity dispersion in a dark matter dominated system canchange with radius, there are other possible explanations.Apart from a random fluctuation, this could be due to theexistence of a velocity gradient associated with either ro-tation or tidal disruption, which would tend to inflate theouter velocity dispersion measurements.
3.2 Orbit
We use the kinematics of Antlia 2 obtained above to gaugethe satellite’s orbital properties. We estimate the pericen-ter to be at 48 ± 11 kpc, which is just close enough to in-duce some tidal disruption in the satellite (see the discussionof the mass measurement of Ant 2 in Section 5). Figure 8presents the orbit of Ant 2 built using use the MWPoten-tial2014 (Bovy 2015) with the MW’s halo mass increasedfrom 0.8× 10¹² M� to 0.9× 10¹² M� (see e.g. Vasiliev 2018,for recent mass estimates). The density map in the figureshows the accumulation of the orbits with initial conditionssampled using the uncertainties in radial velocity, propermotions, and distance. The current position of Ant 2 isshown in cyan, and its past and future orbits are shownin black and red, respectively. According to the orbit com-puted, Ant 2 passed through pericentre last time about 1Gyr ago. It recently crossed the plane of the Galactic disc,but 95 kpc away from the MW centre. The dwarf is about toreach its apocentre. For comparison, the Figure also showsthe orbit of the LMC (in grey). Both galaxies have similardirections of motion; in fact, Ant 2 is currently sitting veryclose to where the LMC is heading and where Jethwa et al.(2016) predict a large number of low-mass dwarfs strippedfrom the LMC. However, given the significantly slower or-bital velocity of Ant 2 - resulting in a significantly differ-ent orbit - any obvious association between the two objectsseems somewhat unlikely. Figure 9 helps to see the differencein the orbital paths of the LMC and Ant 2 more clearly.
3.3 Chemistry
We also look at the metallicity distribution of likely mem-bers of Ant 2. We select stars within 15 km s−1 of the sys-temic velocity of Ant 2, small radial velocity error σv < 5and small uncertainty on [Fe/H]< 0.5 and residual kurtosisand skewness on [Fe/H] less than 1. The stellar metallicitydistribution of this sample - which we believe to be free ofcontamination - is shown in Figure 10. We note that Ant 2’smetallicity peaks at [Fe/H]=-1.4, i.e. noticeably higher thanthe majority of ultra-faint dwarf galaxies. Additionally, the[Fe/H] histogram also shows some moderate asymmetry to-wards low metallicities, which has been seen in other objects(Kirby et al. 2010). Accordingly, for comparison we over-plotthe metallicity distributions of a couple of classical dwarfspheroidal galaxies from (Kirby et al. 2010) whose shape isnot dissimilar to that of the Ant 2’s MDF.
4 DISCUSSION
Figure 11 presents the physical properties of Ant 2 in com-parison to other stellar systems in the MW and the Lo-cal Group. The left panel shows the distribution of intrinsic
MNRAS 000, 1–23 (2018)

Antlia 2 dwarf 11
100 101 102 103 104
rh(pc)
−17.5
−15.0
−12.5
−10.0
−7.5
−5.0
−2.5
0.0
2.5
MV
(mag
)
Ant 2Cra 2
LMC
AndXIX
Fornax Sgr dsph
Sextans
LeoII
Draco
µ=
31
µ=
32
103 104 105 106 107 108 109
M(r < rh)(M�)
−17.5
−15.0
−12.5
−10.0
−7.5
−5.0
−2.5
0.0
2.5
MV
(mag
)
Ant 2Cra 2
LMC
AndXIX
Sgr dsphFornax
SextansDraco
LeoII
M/L
=1
M/L
=10
0
M/L
=10
00
MW galaxies
Classical dwarfs
M31 galaxies
LG galaxies
MW GCs
Figure 11. Left: Absolute magnitude as a function of half-light radius for galaxies in the Local Group as well as the MW globularclusters. Yellow filled circles show the positions of the Classical dwarfs, open red circles give the positions of fainter MW satellites (from
McConnachie (2012) plus Crater 2 (Torrealba et al. 2016a), Aquarius 2 (Torrealba et al. 2016b), DESJ0225+0304 (Luque et al. 2017),
Pictor II (Drlica-Wagner et al. 2016), Virgo I (Homma et al. 2016), Cetus III (Homma et al. 2018), Car II and Car III (Torrealba et al.2018b), Hydrus 1 (Koposov et al. 2018), and updated values for the Andromeda galaxies from (Martin et al. 2016b)) black dots show
the positions of the MW GCs (Harris 2010; Belokurov et al. 2010; Munoz et al. 2012; Balbinot et al. 2013; Kim & Jerjen 2015; Kim
et al. 2015, 2016a; Laevens et al. 2015; Weisz et al. 2016; Luque et al. 2016, 2017; Martin et al. 2016a; Koposov et al. 2017; Luque et al.2018); the M31 satellites are shown as black open circles and the other LG galaxies are shown as black crosses (both from McConnachie
2012). The position of Antlia 2 is shown with a red filled circle. With a size similar to the LMC, but the luminosity close to that of
the faintest of the classical dwarfs, Antlia 2 has a surface brightness more than 1 magnitude fainter than any previously known galaxy.Right: Object’s luminosity as a function of the dynamical mass within the half-light radius. Symbols are the same as in the right panel,
but only systems with known velocity dispersion are shown. Masses were estimated using the relation from Walker et al. (2009). Thesolid gray lines correspond to the mass-to-light ratios of 1, 100, and 1000.
luminosities (in absolute magnitudes) as a function of thehalf-light radius. Strikingly, no other object discovered todate is as diffuse as Ant 2. For example, the so-called UltraDiffuse Galaxies (van Dokkum et al. 2015) have sizes sim-ilar to Ant 2, but are typically ∼ 6 mag brighter. Overall,compared to systems of similar luminosity, the new dwarf isseveral times larger, while for objects of comparable size, itis ∼ 3 orders of magnitude fainter. One exception to this isAnd XIX (McConnachie et al. 2008), which has had its sizeupdated in Martin et al. (2016b) from 6.2′to 14.2′. In thefigure, we show the old measurement connected with a lineto the new measurement. As we can see, And XIX is similarin size to Ant 2, but ∼ 2 magnitudes brighter. While thehalf-light radius of And XIX has recently been updated toa much larger value, the available spectroscopy only probesthe mass distribution within much smaller aperture corre-sponding to the earlier size measurement. We therefore re-port mass measurement for And XIX within 6.2′but cautionthe reader against over-interesting this number. The rightpanel of the Figure shows the satellite’s luminosity MV as afunction of the mass within the half-light radius for systemswith known velocity dispersion. Here, we have used the massestimate suggested by Walker et al. (2009). Superficially,Ant 2, although sitting at the edge of the distribution of thecurrently known dwarfs, does not appear as extreme in the
plane of absolute magnitude and mass within the projectedhalf-light radius.
However, the similarity of the Ant 2’s mass to that ofother dwarfs of comparable luminosity is clearly deceiving.This is because the dwarf’s half-light radius is typically anorder of magnitude larger than that of other objects at thesame level of brightness. Figure 12 illustrates this by show-ing the effective density of each satellite, in other words themass within the half-light radius divided by the correspond-ing volume. The left panel gives the density as a functionof the intrinsic luminosity, while the right panel displaysdensity as a function of the half-light radius. As the Fig-ure convincingly demonstrates, Ant 2 occupies the spars-est DM halo detected to date. Interestingly, the dwarf ap-pears to extend the “universal” density profile suggested byWalker et al. (2009) to lower densities. At the radius probedby Ant 2, the cuspy (blue line) and cored (red line) den-sity profiles start to decouple appreciably. The satellite sitsslightly below the red curve, but probably still within theobserved scatter. Could the extremely low stellar and DMdensities in Ant 2 be the result of the tidal influence of theMW? While the satellite does not come very close to theGalactic centre (as discussed in Section 3.2), at its nomi-nal pericentre of ∼50 kpc, the MW’s density is very closeto the effective (half-light) density of the object (assuming
MNRAS 000, 1–23 (2018)

12 G. Torrealba et al.
−15−10−50
MV (mag)
10−4
10−3
10−2
10−1
100
101
102
103
ρh(M�/p
c3)
Ant 2Cra 2
LMC
Sgr dpsh
AndXIX
Fornax
DracoLeoII
Sextans
100 101 102 103 104
rh(pc)
10−4
10−3
10−2
10−1
100
101
102
103
ρh(M�/p
c3)
Ant 2Cra 2
LMC
Sgr dsph
AndXIX
Fornax
Draco
Sextans
NFW
CORE
MW galaxies
Classical dwarfs
M31 galaxies
LG galaxies
MW GCs
LeoII
Figure 12. Average (or effective) total matter density within the half-light radius for stellar systems in the LG. Symbols are the sameas in Figure 11. Left: Average density as a function of the object’s absolute magnitude. Ant 2 is clearly an outlier in this plane, owing to
its very low surface brightness. A clear selection bias can be seen in the lower left corner of the plot, in which galaxies become too diffuse
to be detected. Right: Effective density as a function of half-light radius. The blue and red lines are the best-fit “universal profiles” fordwarf galaxies from Walker et al. (2009). Blue is an NFW profile, and red corresponds to a cored double power law model. Ant 2 extends
the trends reported in Walker et al. (2009) to larger sizes.
the Galactic mass measurement of Williams et al. 2017),therefore some amount of tidal heating/disruption is possi-ble. Bear in mind however that, while tides tend to lower asatellite’s density, typically (as demonstrated by Penarrubiaet al. 2008b, 2012), as the satellite loses mass to the host, ittends to shrink rather than expand. This would imply thatthe dwarf started with an even larger half-light radius (alsosee Sanders et al. 2018).
There exist other indirect hints that Ant 2 might nothave escaped the MW’s tides. The RR Lyrae used to iden-tify the object in Gaia DR2 data lie significantly closer tothe observer than the dwarf itself, as traced by the RGB andBHB populations (see Section 2.3 for details). The nominalmean distance to these stars is ∼ 80 kpc, implying that theyare some 50 kpc away from the dwarf, signaling extendedtidal tails. Note, however, that all three RR Lyrae lie closeto the limiting magnitude of Gaia, therefore their medianflux estimate may be biased high and, correspondingly, theirdistances biased low, suggesting a somewhat smaller extentof the tidal tails. Moreover, as Figure 6 illustrates, an ad-ditional clue is the close alignment between the directionof the dwarf’s motion (as measured using the GDR2 data,black filled circle with error-bars) and the elongation of itsiso-density contours (dashed line). Moreover, the radial ve-locity gradient (grey filled circle with error-bars) does notfully match the Gaia proper motions, possibly indicating avelocity field affected by rotation or tides. One can also lookfor sign of disruption in the mass-metallicity diagram. Fig-ure 13 shows metallicity as a function of stellar mass for ob-jects in the Local Group. Systems with metallicity inferredfrom spectroscopy are plotted in full colour, while metal-
licities deduced from photometry alone are shown as lightgrey symbols. We have also completely removed objects withmetallicities drawn solely based on the colour of the RGB(Da Costa & Armandroff 1990), as these are more affectedby systematics due to the age/metallicity degeneracy com-pared to other photometric methods (see e.g. McConnachieet al. 2008; Kirby et al. 2013, for further discussion). Assum-ing that a correlation exists between the galaxy’s metallicityand its stellar mass - as Figure 13 appears to indicate - ob-jects that have suffered any appreciable amount of mass losswould move off the main sequence to the left in this plot.Ant 2 is indeed one such example: while not totally off themass-metallicuty relation, it clearly hovers above it, thussignaling that some tidal disruption might have occurred.
4.1 Dark Matter Halo
Since the Gaia DR2 data do not resolve the internal propermotion distributions within Ant 2, inferences about dynam-ical mass must rely on the projection of phase space that issampled by star counts on the sky and spectroscopic line-of-sight velocities. These observations are usefully summarizedby the global velocity dispersion, σrv = 5.7 ± 1.1 km s−1,and halflight radius Rh = 2.86 ± 0.31 kpc. On dimensionalgrounds, the dynamical mass enclosed within a sphere ofradius r = λRh can be written
M(λRh) =λµ
GRhalf σ
2rv. (3)
Equating σrv with the global mean (weighted by surfacebrightness) velocity dispersion, the coefficient µ depends
MNRAS 000, 1–23 (2018)

Antlia 2 dwarf 13
2 4 6 8
logM?(M�)
−3.0
−2.5
−2.0
−1.5
−1.0
−0.5
0.0
[Fe/
H](
dex
)
Ant 2
Figure 13. Metallicity as function of stellar mass. The symbols
are the same as in Figure 11. Objects with spectroscopic metallic-ity available are highlighted, while the photometric measurements
are shown as faded symbols. Globular clusters are shown as light
gray dots. The dashed black line is the mass-metallicty relationfrom Kirby et al. (2013) with the corresponding 1σ scatter in-
dicated by the dotted lines. Spectroscopic metallicities for dwarfgalaxies are from McConnachie (2012); Kirby et al. (2013, 2015,
2017b); Caldwell et al. (2017); Torrealba et al. (2016b); Collins
et al. (2017); Koposov et al. (2018, 2015b); Li et al. (2018, 2017);Kirby et al. (2017a); Walker et al. (2016); Simon et al. (2017);
Kim et al. (2016b). The remaining photometric data are from the
same sources as in Figure 11.
only on the gravitational potential and the configuration oftracer particles, via the projected virial theorem (Agnello &Evans 2012; Errani et al. 2018):
σ2 =4πG
3
∫ ∞0
rν(r)M(r)dr, (4)
where ν(r) is the deprojection of the projected stellar den-sity profile; for the adopted Plummer profile, ν(r) ∝ (1 +r2/R2
h)−5/2.Without invoking a specific mass profile, the simple
mass estimator of Walker et al. (2009) effectively assumesλ = 1 and µ = 5/2, implying for Ant 2 a dynamical massM(Rh) ≈ [5.4±2.1]×107M� enclosed within a sphere of ra-dius r = 2.9 kpc. The more recent estimator of Errani et al.(2018), calibrated to minimize biases due to uncertaintyabout form of the mass profile, uses λ = 1.8 and µ = 3.5, im-plying dynamical mass M(1.8Rh) ≈ [1.37 ± 0.54] × 108M�enclosed within a sphere of radius r = 5.2 kpc; the simi-lar estimator of Campbell et al. (2017) gives a comparableresult.
In contrast to the use of mass estimators, specification ofthe stellar number density (ν(r)) and enclosed mass (M(r))profiles lets one use Equation 4 to calculate the global veloc-ity dispersion exactly. Even when Ant 2 profile might havebeen modified by its interaction with MW, in order to place
Ant 2 in a cosmological context, we first consider the proper-ties of dark matter halos that might host Ant 2 while follow-ing the NFW enclosed-mass profile that characterizes halosformed in N-body simulations (Navarro et al. 1996b, 1997):
MNFW(r) = 4πr3sρs
[ln
(1 +
r
rs
)− r/rs
1 + r/rs
]. (5)
An NFW halo is uniquely specified by parameters M200 ≡M(r200), the mass enclosed within radius r200, inside whichthe mean density is 〈ρ〉200 ≡ 200[3H2
0/(8πG)], and concen-tration c200 ≡ r200/rs.
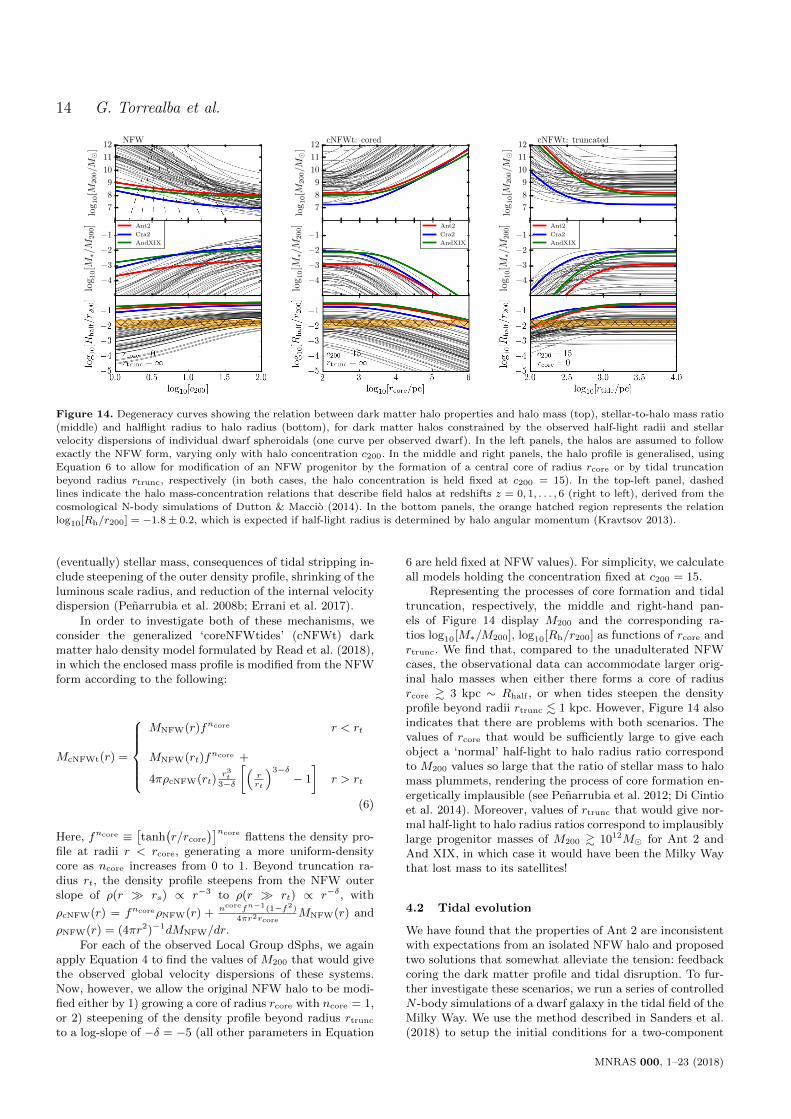
For Ant 2 and each of the other Local Group dSphs withmeasured velocity dispersions and half-light radii (assumedto correspond to Plummer profiles), we use Equation 4 tofind the parameters of NFW halos that exactly predict theobserved velocity dispersion. For each dwarf, the two degreesof freedom in the NFW profile result in a ‘degeneracy curve’of M200 as a function of c200 (Penarrubia et al. 2008a); ingeneral, higher concentrations require lower halo masses inorder to predict the same global velocity dispersion.
The top-left panel of Figure 14 shows the NFW degen-eracy curve for each dwarf galaxy. Given the measured lu-minosities, and assuming a stellar mass-to-light ratio Υ∗ =2M�/LV,�, the middle-left panel shows the correspondingrelationship between concentration and the ratio of stellarto halo mass, M∗/M200. The bottom-left panel shows the re-lationships between concentration and the ratio of half-lightradius to the halo radius r200.
We find that Ant 2 joins Crater 2 (Torrealba et al.2016a) and Andromeda XIX (McConnachie et al. 2008) asextreme objects amongst the Local Group dwarfs. All threeare relatively large (Rh & 1 kpc) and cold (σrv . 5 kms−1). As a result, their plausible NFW host halos tend tohave low mass (M200 . 109M�) even at low concentration.Perhaps most strikingly, all three have extremely large ra-tios of half-light to halo radius, with log10[Rh/r200] & −1,putting them & 4σ above the the empirical average relationlog10[Rh/r200] = −1.8 ± 0.2 describing sizes of the entiregalaxy population (Kravtsov 2013).
Larger halo masses and thus smaller ratios of Rh/r200 inany of Ant2, Cra2 and AndXIX would require non-NFW ha-los. In general there are two different ways that NFW haloprogenitors with more ‘normal’ values of M200 & 109M�and log10[Rh/r200] . −1 might have been transformed byastrophysical processes into non-NFW halos that would ac-commodate the large sizes and small velocity dispersions ob-served for these galaxies today. The first is the outward mi-gration of central dark matter in response to the rapid loss ofgas mass following supernova explosions (e.g., Navarro et al.1996a; Pontzen & Governato 2012). Recent hydrodynami-cal simulations demonstrate that such feedback from galaxyformation can turn primordial NFW ‘cusps’ into ‘cores’ ofnear-uniform dark matter density (e.g. Zolotov et al. 2012;Madau et al. 2014; Read et al. 2016).
The second mechanism is mass loss due to tidal strip-ping, as all three of the extreme objects are satellites ofeither the Milky Way or M31. Indeed, the orbit inferredfrom Gaia DR2 proper motions of Crater 2 is consistentwith rperi . 10 kpc (see e.g. Fritz et al. 2018), compatiblewith significant mass loss. Moreover, Collins et al. (2014)speculate that tidal stripping is the cause of AndXIX’s ex-treme kinematics. In addition to the loss of both dark and
MNRAS 000, 1–23 (2018)
14 G. Torrealba et al.
7
8
9
10
11
12
log
10[M
200/M�
]
NFW
−4
−3
−2
−1
log
10[M∗/M
200] Ant2
Cra2
AndXIX
7
8
9
10
11
12
log
10[M
200/M�
]
cNFWt: cored
−4
−3
−2
−1
log
10[M∗/M
200] Ant2
Cra2
AndXIX
7
8
9
10
11
12
log
10[M
200/M�
]
cNFWt: truncated
−4
−3
−2
−1
log
10[M∗/M
200] Ant2
Cra2
AndXIX
Figure 14. Degeneracy curves showing the relation between dark matter halo properties and halo mass (top), stellar-to-halo mass ratio(middle) and halflight radius to halo radius (bottom), for dark matter halos constrained by the observed half-light radii and stellar
velocity dispersions of individual dwarf spheroidals (one curve per observed dwarf). In the left panels, the halos are assumed to follow
exactly the NFW form, varying only with halo concentration c200. In the middle and right panels, the halo profile is generalised, usingEquation 6 to allow for modification of an NFW progenitor by the formation of a central core of radius rcore or by tidal truncation
beyond radius rtrunc, respectively (in both cases, the halo concentration is held fixed at c200 = 15). In the top-left panel, dashedlines indicate the halo mass-concentration relations that describe field halos at redshifts z = 0, 1, . . . , 6 (right to left), derived from the
cosmological N-body simulations of Dutton & Maccio (2014). In the bottom panels, the orange hatched region represents the relation
log10[Rh/r200] = −1.8± 0.2, which is expected if half-light radius is determined by halo angular momentum (Kravtsov 2013).
(eventually) stellar mass, consequences of tidal stripping in-clude steepening of the outer density profile, shrinking of theluminous scale radius, and reduction of the internal velocitydispersion (Penarrubia et al. 2008b; Errani et al. 2017).
In order to investigate both of these mechanisms, weconsider the generalized ‘coreNFWtides’ (cNFWt) darkmatter halo density model formulated by Read et al. (2018),in which the enclosed mass profile is modified from the NFWform according to the following:
McNFWt(r) =
MNFW(r)fncore r < rt
MNFW(rt)fncore +
4πρcNFW(rt)r3t
3−δ
[(rrt
)3−δ− 1
]r > rt
(6)
Here, fncore ≡[tanh
(r/rcore
)]ncore flattens the density pro-file at radii r < rcore, generating a more uniform-densitycore as ncore increases from 0 to 1. Beyond truncation ra-dius rt, the density profile steepens from the NFW outerslope of ρ(r � rs) ∝ r−3 to ρ(r � rt) ∝ r−δ, with
ρcNFW(r) = fncoreρNFW(r) + ncorefn−1(1−f2)
4πr2rcoreMNFW(r) and
ρNFW(r) = (4πr2)−1dMNFW/dr.
For each of the observed Local Group dSphs, we againapply Equation 4 to find the values of M200 that would givethe observed global velocity dispersions of these systems.Now, however, we allow the original NFW halo to be modi-fied either by 1) growing a core of radius rcore with ncore = 1,or 2) steepening of the density profile beyond radius rtrunc
to a log-slope of −δ = −5 (all other parameters in Equation
6 are held fixed at NFW values). For simplicity, we calculateall models holding the concentration fixed at c200 = 15.
Representing the processes of core formation and tidaltruncation, respectively, the middle and right-hand pan-els of Figure 14 display M200 and the corresponding ra-tios log10[M∗/M200], log10[Rh/r200] as functions of rcore andrtrunc. We find that, compared to the unadulterated NFWcases, the observational data can accommodate larger orig-inal halo masses when either there forms a core of radiusrcore & 3 kpc ∼ Rhalf , or when tides steepen the densityprofile beyond radii rtrunc . 1 kpc. However, Figure 14 alsoindicates that there are problems with both scenarios. Thevalues of rcore that would be sufficiently large to give eachobject a ‘normal’ half-light to halo radius ratio correspondto M200 values so large that the ratio of stellar mass to halomass plummets, rendering the process of core formation en-ergetically implausible (see Penarrubia et al. 2012; Di Cintioet al. 2014). Moreover, values of rtrunc that would give nor-mal half-light to halo radius ratios correspond to implausiblylarge progenitor masses of M200 & 1012M� for Ant 2 andAnd XIX, in which case it would have been the Milky Waythat lost mass to its satellites!
4.2 Tidal evolution
We have found that the properties of Ant 2 are inconsistentwith expectations from an isolated NFW halo and proposedtwo solutions that somewhat alleviate the tension: feedbackcoring the dark matter profile and tidal disruption. To fur-ther investigate these scenarios, we run a series of controlledN -body simulations of a dwarf galaxy in the tidal field of theMilky Way. We use the method described in Sanders et al.(2018) to setup the initial conditions for a two-component
MNRAS 000, 1–23 (2018)

Antlia 2 dwarf 15
(dark matter and stars) spherical dwarf galaxy on Ant 2’sorbit. We opt for a fixed time-independent axisymmetricMilky Way potential from McMillan (2017), place the dwarfat apocentre ∼ 13 Gyr ago and integrate forwards. In thismodel, Ant 2 undergoes 6 pericentric passages. The shapeof the orbit is very similar to that shown in Fig. 8 despitethe different potential.
We initially selected a vmax = 20 km s−1, c200 = 15.9NFW halo which is hypothesised to be the lowest massgalaxy-hosting dark matter halo (Okamoto & Frenk 2009).The scale radius of the halo is rs = 1.45 kpc. Choosing astellar double-power law density profile with scale radius1.45 kpc, outer logarithmic slope β = 5 and transition α = 2and either a core (inner slope γ = 0.1) or a cusp (γ = 1)produced similar results: the velocity dispersion fell steadilyfrom ∼ 14 km s−1 to 8−10 km s−1 while the half-light radiusfell by ∼ 30 percent ending at ∼ 1 kpc. Changing the innerstellar and dark matter slope to a more cored d ln ρ/d ln r =−0.1 (while retaining the enclosed central mass), we foundthat the decay of the velocity dispersion was more rapid (de-stroying the galaxy on the fifth pericentric passage) whilethe half-light radius fell more slowly, but could also increasebetween pericentric passages (as shown in Sanders et al.2018). We note that these results are largely insensitive tothe adopted stellar mass as the stars are subdominant. Wehave adopted M? = (MDM(< 4/3Rh)/(2000M�))5/3M�,choosing a stellar mass-to-light ratio of 2.5.
Inspired by these first experiments, we present two sce-narios for the evolution of Ant 2: a cuspy dark matter sce-nario and cored dark matter scenario. The results are shownin Fig. 15. We compute the half-light radius from a Plummerfit to bound particles, and the dispersion is mass-weightedover the entirety of the dwarf (accounting for perspectiveeffects due to Ant 2’s large size). For the cuspy model (leftcolumn of Fig. 15), we adopt vmax = 16.6 km s−1, c200 = 15.9producing rs = 1.2 kpc to attempt to match σlos, and set thescale radius of the stars as r? = 7.2 kpc to attempt to matchRh. The dark matter profile is NFW and the stellar profilehas (α, β, γ) = (2, 5, 1). We set the velocity anisotropy ofthe dark matter as zero and stars as −0.5 (tangential bias).Furthermore, we decrease the mass of stars in the simula-tion by a factor of 50 to attempt to match the final mass-to-light ratio. We see from Fig. 15 that the final velocity dis-persion and mass-to-light ratio match those observed. How-ever, the half-light radius for this model rapidly decays asthe model becomes tidally-truncated. Correspondingly, theenclosed masses (both dark and stellar) fail to match thoseobserved. We see that early in the evolution (around 3 Gyr,after a single pericentric passage) the simulation matchesall observables well. However, the simulation shows that astellar profile that extends significantly beyond the scale ra-dius of the dominant dark matter mass component is rapidlytruncated by tides and such configurations only last a feworbital periods.
As the cuspy model fails to adequately produce all theobservables under reasonable assumptions, we attempt toproduce a cored model that satisfactorily explains the data.We start with vmax = 37.4 km s−1, c200 = 15.9 producingrs = 2.7 kpc and set the stellar and dark matter inner slopeas d ln ρ/d ln r = −0.3 (retaining the enclosed central mass)– this produces a slope of d ln ρ/d ln r ≈ −0.8 at 1.5 percentof Rvir. We set the scale radius of the stars as r? = rs
0
1
2
3
Rh/kpc
Cusp, Inner Slope=-1 Core, Inner Slope=-0.3
0
10
20
σlo
s/km
s−1
104
106
108
1010
Mas
s(<r)
/M¯
DM
Stars
<Rh <∞
0
200
400
600(M
/L
)(<R
h)
0 5 10Time/Gyr
10-4
10-3
10-2
10-1
M/M
DM
0 5 10Time/Gyr
Effective feedback
Figure 15. Evolution of two-component N -body dwarf galaxysimulations on the orbit of Ant 2: the left column corresponds to
a cuspy dark-matter simulation and the right a cored simulation.
The four rows show (‘circularised’) half-light radius, Rh, velocitydispersion, mass (dark matter in thin blue, stars in thicker green,
solid for within Rh and dashed total), mass-to-light ratio (assum-
ing a stellar mass-to-light ratio of 2.5), and total stellar to darkmass ratio. The black horizontal lines and grey shaded regions
give the median and 1σ uncertainty for the corresponding mea-
sured properties of Ant 2. The red shaded region in the bottompanel gives the range of mass ratios for which feedback is effective
in producing a cored dark matter profile. The vertical grey linesshow the pericentric passages.
and decrease the mass of stars by a factor of ∼ 330. Weuse the same outer slopes, transition slopes and velocityanisotropies as the cuspy case. From the right column ofFig. 15 we find the dispersion falls rapidly, with the dwarfonly surviving three pericentric passages. After the thirdpericentric passage the dwarf has a dispersion similar to thatof Ant 2. Between pericentric passages the half-light radiusinflates slightly but stays approximately constant and con-sistent with the data. The total stellar mass to dark massratio and the mass-to-light ratio both stay approximatelyconstant over the simulation. There is weak tension betweenproducing an initial total stellar to dark-matter mass ratiothat is high enough to produce cored profiles via feedback
MNRAS 000, 1–23 (2018)

16 G. Torrealba et al.
Surface brightness / magarcsec−232 36
Distance/ kpc20 150
µ`/masyr−1-1 1
µb/masyr−1-1 1
Figure 16. Simulation of Ant 2’s disruption on the sky in Galactic coordinates: the four panels show the surface brightness, mean
distance and galactic proper motions for the cored simulation in the left column of Fig. 15.
(M?/MDM ∼ 0.001− 0.015, Di Cintio et al. 2014; Bullock &Boylan-Kolchin 2017) and a high enough mass-to-light ratioto match that observed for Ant 2. However, there is somefreedom in our choice of stellar mass-to-light ratio which waschosen to be 2.5 but could be larger for a steeper low-massinitial mass function slope (e.g. Salpeter). Heavy tidal dis-ruption is also accompanied by sphericalization of the dwarfgalaxy (Sanders et al. 2018) which is possibly in contradic-tion with the observed stellar axis ratio of ∼ 0.6. However,further simulations of flattened progenitors are needed toconfirm whether this is a significant issue. The initial stellarmass in the model is ∼ 1 × 10⁷M� placing the progenitorof Ant 2 on the mass-metallicity relation of the other dwarfgalaxies in Fig. 13. A prediction of the cored scenario isthat the dwarf galaxy has deposited ∼ 90 percent of its stel-lar mass into the Milky Way halo. In Fig. 16 we show theexpected surface brightness of the resulting material (typi-cally 34 − 35 mag arcsec−2) as well as the expected mediandistances and proper motions using the final apocentric pas-sage from the simulation rotated to the present coordinatesof Ant 2. The line-of-sight distribution of the tidal debrisin this simulation is shown in Fig. 17. Given the currentdwarf’s location near the apocentre, a substantial portionof the debris is distributed along the line-of-sight, extend-ing as far as 50 kpc from the progenitor towards the Sun.It appears that, given Gaia’s bright limiting magnitude for
detecting RR Lyrae stars (dashed line), only the near sideof the debris cloud can be detected using the RR Lyrae cat-alogue discussed above (as illustrated by the dashed lineand the filled black circles). If our interpretation is correct,then the three RR Lyrae detected are only a small fractionof the dwarf’s total cohort of such stars; as noted above,the existence of a much larger undetected population of RRLyrae would be consistent with recent results obtained forthe Crater 2 dwarf (Joo et al. 2018), which is of comparabletotal luminosity.
In conclusion, we have found that the only cuspy pro-files that adequately explain the data have both haloes withsmaller vmax than that required to explain most other dwarfgalaxies and stellar profiles that extend further than theeffective radius of the dark halo (Rh/rs ∼ 2). Such an al-ready unlikely configuration does not survive long within thetidal field of the Milky Way as the exposed stellar profilebecomes heavily truncated. However, a cored dark matterprofile more naturally explains the data. In this scenario,Ant 2 is embedded initially in a larger, more massive darkmatter halo which naturally produces a broader stellar dis-tribution. The dwarf is then heavily tidally disrupted by theMilky Way’s tidal field such that, after a few pericentricpassages, the velocity dispersion has fallen to the observedvalue while the half-light radius is unchanged. In this pic-ture, Ant 2 has deposited a large fraction of its stellar mass
MNRAS 000, 1–23 (2018)
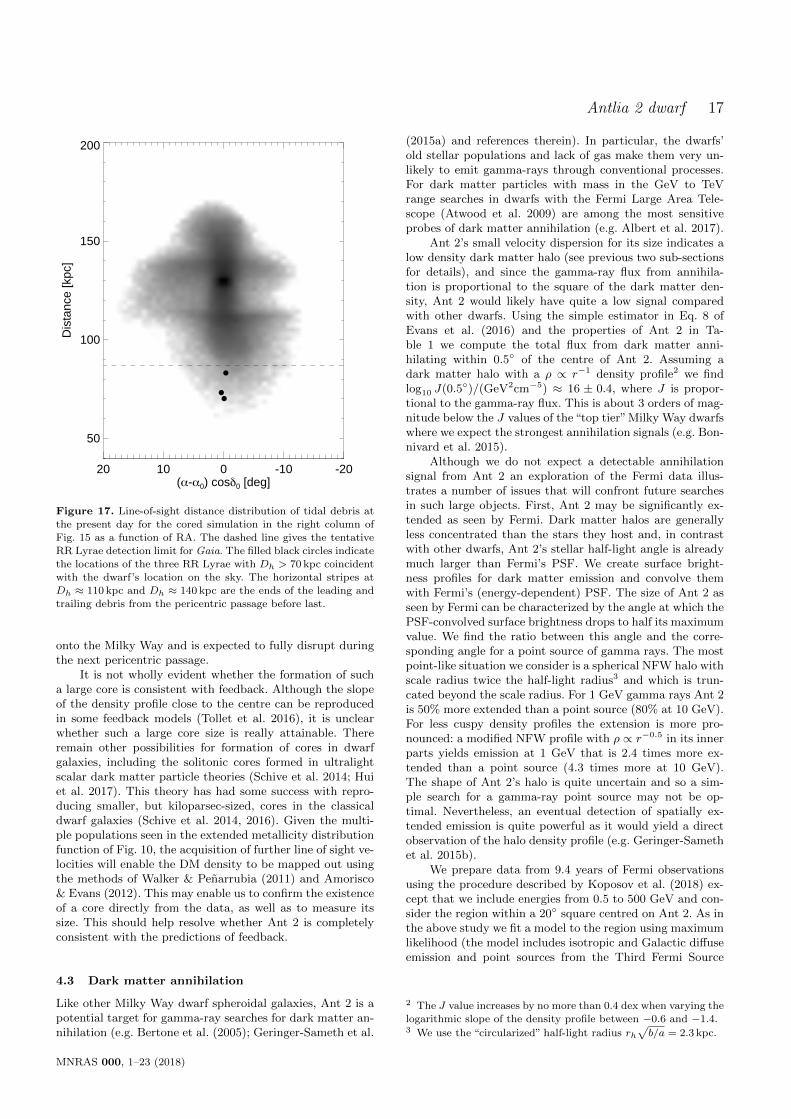
Antlia 2 dwarf 17
20 10 0 -10 -20(α-α0) cosδ0 [deg]
50
100
150
200
Dis
tanc
e [k
pc]
Figure 17. Line-of-sight distance distribution of tidal debris atthe present day for the cored simulation in the right column of
Fig. 15 as a function of RA. The dashed line gives the tentative
RR Lyrae detection limit for Gaia. The filled black circles indicatethe locations of the three RR Lyrae with Dh > 70 kpc coincident
with the dwarf’s location on the sky. The horizontal stripes at
Dh ≈ 110 kpc and Dh ≈ 140 kpc are the ends of the leading andtrailing debris from the pericentric passage before last.
onto the Milky Way and is expected to fully disrupt duringthe next pericentric passage.
It is not wholly evident whether the formation of sucha large core is consistent with feedback. Although the slopeof the density profile close to the centre can be reproducedin some feedback models (Tollet et al. 2016), it is unclearwhether such a large core size is really attainable. Thereremain other possibilities for formation of cores in dwarfgalaxies, including the solitonic cores formed in ultralightscalar dark matter particle theories (Schive et al. 2014; Huiet al. 2017). This theory has had some success with repro-ducing smaller, but kiloparsec-sized, cores in the classicaldwarf galaxies (Schive et al. 2014, 2016). Given the multi-ple populations seen in the extended metallicity distributionfunction of Fig. 10, the acquisition of further line of sight ve-locities will enable the DM density to be mapped out usingthe methods of Walker & Penarrubia (2011) and Amorisco& Evans (2012). This may enable us to confirm the existenceof a core directly from the data, as well as to measure itssize. This should help resolve whether Ant 2 is completelyconsistent with the predictions of feedback.
4.3 Dark matter annihilation
Like other Milky Way dwarf spheroidal galaxies, Ant 2 is apotential target for gamma-ray searches for dark matter an-nihilation (e.g. Bertone et al. (2005); Geringer-Sameth et al.
(2015a) and references therein). In particular, the dwarfs’old stellar populations and lack of gas make them very un-likely to emit gamma-rays through conventional processes.For dark matter particles with mass in the GeV to TeVrange searches in dwarfs with the Fermi Large Area Tele-scope (Atwood et al. 2009) are among the most sensitiveprobes of dark matter annihilation (e.g. Albert et al. 2017).
Ant 2’s small velocity dispersion for its size indicates alow density dark matter halo (see previous two sub-sectionsfor details), and since the gamma-ray flux from annihila-tion is proportional to the square of the dark matter den-sity, Ant 2 would likely have quite a low signal comparedwith other dwarfs. Using the simple estimator in Eq. 8 ofEvans et al. (2016) and the properties of Ant 2 in Ta-ble 1 we compute the total flux from dark matter anni-hilating within 0.5◦ of the centre of Ant 2. Assuming adark matter halo with a ρ ∝ r−1 density profile2 we findlog10 J(0.5◦)/(GeV2cm−5) ≈ 16 ± 0.4, where J is propor-tional to the gamma-ray flux. This is about 3 orders of mag-nitude below the J values of the“top tier”Milky Way dwarfswhere we expect the strongest annihilation signals (e.g. Bon-nivard et al. 2015).
Although we do not expect a detectable annihilationsignal from Ant 2 an exploration of the Fermi data illus-trates a number of issues that will confront future searchesin such large objects. First, Ant 2 may be significantly ex-tended as seen by Fermi. Dark matter halos are generallyless concentrated than the stars they host and, in contrastwith other dwarfs, Ant 2’s stellar half-light angle is alreadymuch larger than Fermi’s PSF. We create surface bright-ness profiles for dark matter emission and convolve themwith Fermi’s (energy-dependent) PSF. The size of Ant 2 asseen by Fermi can be characterized by the angle at which thePSF-convolved surface brightness drops to half its maximumvalue. We find the ratio between this angle and the corre-sponding angle for a point source of gamma rays. The mostpoint-like situation we consider is a spherical NFW halo withscale radius twice the half-light radius3 and which is trun-cated beyond the scale radius. For 1 GeV gamma rays Ant 2is 50% more extended than a point source (80% at 10 GeV).For less cuspy density profiles the extension is more pro-nounced: a modified NFW profile with ρ ∝ r−0.5 in its innerparts yields emission at 1 GeV that is 2.4 times more ex-tended than a point source (4.3 times more at 10 GeV).The shape of Ant 2’s halo is quite uncertain and so a sim-ple search for a gamma-ray point source may not be op-timal. Nevertheless, an eventual detection of spatially ex-tended emission is quite powerful as it would yield a directobservation of the halo density profile (e.g. Geringer-Samethet al. 2015b).
We prepare data from 9.4 years of Fermi observationsusing the procedure described by Koposov et al. (2018) ex-cept that we include energies from 0.5 to 500 GeV and con-sider the region within a 20◦ square centred on Ant 2. As inthe above study we fit a model to the region using maximumlikelihood (the model includes isotropic and Galactic diffuseemission and point sources from the Third Fermi Source
2 The J value increases by no more than 0.4 dex when varying thelogarithmic slope of the density profile between −0.6 and −1.4.3 We use the “circularized” half-light radius rh
√b/a = 2.3 kpc.
MNRAS 000, 1–23 (2018)

18 G. Torrealba et al.
Catalogue, Acero et al. 2015). Fitting an additional trialpoint source with a flexible energy spectrum at the locationof Ant 2 does not improve the fit (2∆ logL = 0.75, whereL is the Poisson probability of obtaining the data given themodel). We also examine the energy spectra of events withinvarious-sized apertures centred on Ant 2 as compared to thebackground model and find no significant bumps or discrep-ancies.
As a way of checking for extended emission we rebin thecounts and model maps from the original 0.05◦ pixelisationinto coarser maps with 0.25◦, 0.5◦, 1◦, and 1.5◦ pixels (wherethe central pixel is always centred on Ant 2). In each pixelp we construct a statistic to measure the discrepancy withthe best-fitting background model: χ2
p =∑
(cpi−mpi)2/mpi,
where cpi and mpi are the observed and expected numbers ofcounts in pixel p and energy bin i and the sum is taken overenergy bins between 1 and 10 GeV. Generating sky mapsbased on χ2
p yields no “hot spots” centred on Ant 2.One major caveat is that the Galactic diffuse template
provided by the Fermi Collaboration already absorbs ex-tended excess emission on scales larger than about 2◦ (Aceroet al. 2016), and so it is possible that Ant 2 has already beenincluded in the background model. We examine the morphol-ogy of the diffuse template and do not find any blob-likeemission centred on Ant 2, though this is somewhat diffi-cult due to Ant 2’s proximity to the Galactic plane, a regionwith numerous diffuse structures and gradients. In order totry to suppress the very bright emission from the Galacticplane we re-extract the data but keep only PSF3 events4.This subset of data is roughly the quarter of events withthe best direction reconstruction. While this will not helpdetect extended emission it does reduce the glare from theGalactic plane. Examining the PSF3 counts maps reveals twopotential point sources within the half-light ellipse of Ant 2,∆` = 0.3◦,∆b = −0.3◦ away from the centre of the dwarf.Fitting point sources at these locations gives an improve-ment of 2∆ logL = 17. However, this comes at the cost ofgreatly increased model complexity and so the resulting sig-nificance of these potential sources (p value) is only aroundthe 5% level. In any case a dark matter explanation wouldrequire a density profile significantly offset from the stellardistribution.
Despite the lack of a signal from Ant 2, its huge angularsize hints at a possible opportunity for gamma-ray searchesusing dwarfs. The most powerful dark matter searches com-bine observations of multiple dwarfs by assigning weights tothe gamma-ray events from each dwarf (Geringer-Sameth &Koushiappas 2011; Geringer-Sameth et al. 2015a). For theoptimal set of weights, each dwarf contributes to the ex-pected signal to noise in quadrature as SNR2 =
∑s2/b,
where the sum runs over energy and spatial bins, and sand b are the expected number of dark matter photons andbackground events detected in each (generally infinitesimal)bin (see Eq. 18 of Geringer-Sameth et al. 2015a). For dwarfswith identical dark matter halos, as long as the spatial extentof the emission is smaller than the PSF, a dwarf’s contribu-tion to SNR2 is proportional to 1/D4 (the amplitude of sscales as the total flux 1/D2 while the shape of s is fixed by
4 https://fermi.gsfc.nasa.gov/ssc/data/analysis/
documentation/Cicerone/Cicerone_Data/LAT_DP.html
the PSF). For a homogeneous distribution of dwarfs (numberdensity ∝ D2dD), this scaling leads to searches dominatedby the nearest dwarfs, e.g. Ursa Major II, Coma Berenices,and Segue 1. In contrast, for dwarfs with extended emissionSNR2 scales as 1/D2 (in this case the amplitude of s is fixedbut the shape of the surface brightness profile contracts bya factor of 1/D). If Ant 2 is the first of many “missing gi-ants” we may eventually find ourselves with an abundanceof relatively distant, spatially extended gamma-ray targets.Since J ∝ σ4
v/rh (Evans et al. 2016), such dwarfs will beespecially important if they have larger velocity dispersionsand/or smaller half-light radii than Ant 2 (as is perhaps sug-gested by the isolated position of Ant 2 in Fig. 11). It mayturn out that this large population becomes as important forconstraining dark matter particles as the handful of “pointsource-like” dwarfs that are currently the most informative.
5 CONCLUSIONS
We have presented the discovery of a new dwarf satellitegalaxy of the Milky Way, Antlia 2 (Ant 2). Originally de-tected in Gaia DR2 data using a combination of RR Lyrae,proper motions, parallaxes and shallow broad-band photom-etry, this new satellite is also confirmed using deeper archivalDECam imaging as well as AAT 2dF+AAOmega follow-upspectroscopy. The CMD of the Ant 2 dwarf boasts a broadand well-populated RGB as well as a prominent BHB se-quence, which we use as a standard candle. The resultingdwarf’s distance modulus is m −M = 20.56 is consistentwith an independent estimate obtained via the CMD mod-elling. In addition, there are possibly 3 associated RRL stars,lying in front of the dwarf along the line of sight. These likelyrepresent the near side of an extended cloud of tidal debrisspawn by Antlia 2. The angular half-light radius of the newdwarf is ∼1.3 degrees, which translates into a gigantic phys-ical size of ∼ 2.8 kpc, on par with the measurements of thelargest satellite of the MW, the LMC, but with a luminositysome ∼ 4000 times fainter.
Using ∼ 200 spectroscopically confirmed RGB memberstars, we have measured the dwarf’s velocity dispersion to be∼ 5.7 km s−1, which, combined with the luminosity MV =−8.5, yields a high mass-to-light ratio of ∼500, typical for aGalactic dwarf. However, given Ant 2’s enormous size, theimplied effective DM density is much lower than that of anyother dwarf satellite studied to date. Assuming an NFWdensity profile, Ant 2 is hosted by a relatively light DM halowith M200 < 109M� - close to the lowest mass inferred forthe Galactic dwarfs (see Jethwa et al. 2018) - which is noteasy to reconcile with its grotesquely bloated appearance.Even if the DM density deviates from the canonical NFWshape - be it either due to the effects of stellar feedback orof the Milky Way’s tides - bringing the object’s half-lightradius in accordance with the rest of the Galactic satellitepopulation appears difficult.
Nonetheless, a combination of feedback and tides work-ing in concert may provide a plausible way to explain theobserved properties of Ant 2. This solution requires a sub-stantially more luminous dwarf to be born in a i) relativelymassive and ii) cored DM halo, which subsequently suffersprolific tidal stripping. We have shown that for such a coredhost, the half-light radius changes little during the disrup-
MNRAS 000, 1–23 (2018)

Antlia 2 dwarf 19
tion but the velocity-dispersion plummets. A strong predic-tion of this model is a large amount of tidal debris left behindby Ant 2, which could be tested by surveying (with eitherimaging or spectroscopy) the area around the dwarf. Notehowever, that even in this scenario, the structural propertiesof Ant 2’s progenitor remain extreme. For example, in thesize-luminosity plane shown in Figure 11, it must have oc-cupied the empty space below and to the right of Sgr, withrh ∼ 3 kpc and MV ∼ −12.
Given that it currently appears impossible for Ant 2 tobe born with a half-light radius much smaller than currentlymeasured, its position on the size-luminosity plane (even ex-trapolated back in time) may imply that dwarf galaxy for-mation can proceed at surface brightness (and density) levelssignificantly lower than those so far observed. Hence Ant 2could be the tip of an iceberg - a population of extremelydiffuse Galactic dwarf galaxies even fainter than the numer-ous satellites detected in wide-area photometric surveys overthe past two decades. Fortunately, Gaia data – as illustratedby this work – may be the key to testing this hypothesis.
ACKNOWLEDGEMENTS
It is a pleasure to thank thank Andrey Kravtsov and JorgePenarrubia for enlightening discussions that helped to im-prove the quality of this manuscript, and Chris Lidman forcarrying out the spectroscopic service observations on theAAT. The authors thank Gisella Clementini and VincenzoRipepi for pointing out an error in the RR Lyrae luminositycalculation in an earlier version of this manuscript.
This project was developed in part at the 2018 NYCGaia Sprint, hosted by the Center for Computational As-trophysics of the Flatiron Institute in New York City. Theresearch leading to these results has received funding fromthe European Research Council under the European Union’sSeventh Framework Programme (FP/2007-2013) / ERCGrant Agreement n. 308024. SK and MGW are supportedby National Science Foundation grant AST-1813881. GT ac-knowledge support from the Ministry of Science and Tech-nology grant MOST 105-2112-M-001-028-MY3, and a Ca-reer Development Award (to YTL) from Academia Sinica.
This work presents results from the European SpaceAgency (ESA) space mission Gaia. Gaia data are being pro-cessed by the Gaia Data Processing and Analysis Consor-tium (DPAC). Funding for the DPAC is provided by nationalinstitutions, in particular the institutions participating inthe Gaia MultiLateral Agreement (MLA). The Gaia mis-sion website is https://www.cosmos.esa.int/gaia. The Gaiaarchive website is https://archives.esac.esa.int/gaia.
This paper includes data gathered with Anglo-Australian Telescope at Siding Spring Observatory in Aus-tralia. We acknowledge the traditional owners of the land onwhich the AAT stands, the Gamilaraay people, and pay ourrespects to elders past and present.
This project used data obtained with the Dark En-ergy Camera (DECam), which was constructed by the DarkEnergy Survey (DES) collaboration. Funding for the DESProjects has been provided by the U.S. Department of En-ergy, the U.S. National Science Foundation, the Ministry ofScience and Education of Spain, the Science and Technol-ogy Facilities Council of the United Kingdom, the Higher
Education Funding Council for England, the National Cen-ter for Supercomputing Applications at the University ofIllinois at Urbana-Champaign, the Kavli Institute of Cos-mological Physics at the University of Chicago, the Centerfor Cosmology and Astro-Particle Physics at the Ohio StateUniversity, the Mitchell Institute for Fundamental Physicsand Astronomy at Texas A&M University, Financiadora deEstudos e Projetos, Fundacao Carlos Chagas Filho de Am-paro a Pesquisa do Estado do Rio de Janeiro, Conselho Na-cional de Desenvolvimento Cientıfico e Tecnologico and theMinisterio da Ciencia, Tecnologia e Inovacao, the DeutscheForschungsgemeinschaft, and the Collaborating Institutionsin the Dark Energy Survey.
The Collaborating Institutions are Argonne NationalLaboratory, the University of California at Santa Cruz, theUniversity of Cambridge, Centro de Investigaciones Ener-geticas, Medioambientales y Tecnologicas-Madrid, the Uni-versity of Chicago, University College London, the DES-Brazil Consortium, the University of Edinburgh, the Ei-dgenossische Technische Hochschule (ETH) Zurich, FermiNational Accelerator Laboratory, the University of Illi-nois at Urbana-Champaign, the Institut de Ciencies del’Espai (IEEC/CSIC), the Institut de Fısica d’Altes Ener-gies, Lawrence Berkeley National Laboratory, the Ludwig-Maximilians Universitat Munchen and the associated Ex-cellence Cluster Universe, the University of Michigan, theNational Optical Astronomy Observatory, the University ofNottingham, the Ohio State University, the University ofPennsylvania, the University of Portsmouth, SLAC NationalAccelerator Laboratory, Stanford University, the Universityof Sussex, and Texas A&M University.
REFERENCES
Acero F., et al., 2015, ApJS, 218, 23
Acero F., et al., 2016, ApJS, 223, 26
Agnello A., Evans N. W., 2012, ApJ, 754, L39
Albert A., et al., 2017, ApJ, 834, 110
Amorisco N. C., Evans N. W., 2012, MNRAS, 419, 184
Antoja T., et al., 2015, MNRAS, 453, 541
Atwood W. B., et al., 2009, ApJ, 697, 1071
Baker M., Willman B., 2015, AJ, 150, 160
Balbinot E., et al., 2013, ApJ, 767, 101
Belokurov V., Erkal D., 2018, preprint, (arXiv:1808.00462)
Belokurov V., et al., 2010, ApJ, 712, L103
Bertone G., Hooper D., Silk J., 2005, Phys. Rep., 405, 279
Bonnivard V., et al., 2015, MNRAS, 453, 849
Bose S., Deason A. J., Frenk C. S., 2018, ApJ, 863, 123
Bovy J., 2015, The Astrophysical Journal Supplement Series, 216,29
Bressan A., Marigo P., Girardi L., Salasnich B., Dal Cero C.,Rubele S., Nanni A., 2012, MNRAS, 427, 127
Bullock J. S., Boylan-Kolchin M., 2017, ARA&A, 55, 343
Bullock J. S., Stewart K. R., Kaplinghat M., Tollerud E. J., WolfJ., 2010, ApJ, 717, 1043
Caldwell N., et al., 2017, ApJ, 839, 20
Campbell D. J. R., et al., 2017, MNRAS, 469, 2335
Chan T. K., Keres D., Wetzel A., Hopkins P. F., Faucher-GiguereC.-A., El-Badry K., Garrison-Kimmel S., Boylan-Kolchin M.,
2018, MNRAS, 478, 906
Clementini G., et al., 2018, preprint, (arXiv:1805.02079)
Collins M. L. M., et al., 2014, ApJ, 783, 7
Collins M. L. M., Tollerud E. J., Sand D. J., Bonaca A., WillmanB., Strader J., 2017, MNRAS, 467, 573
MNRAS 000, 1–23 (2018)

20 G. Torrealba et al.
Table 2. Results from the spectroscopic modeling
id ra dec rvh [Fe/H] log g Teff(deg) (deg) (km/s) (dex) (dex) (K)
Antlia2 001 144.41 -36.7678 290.2±0.7 -1.33±0.17 1.19±0.29 4955±83Antlia2 002 144.0322 -36.7156 294.0±0.9 -1.12±0.11 4.39±0.23 4668±118Antlia2 003 144.5626 -36.8088 275.1±9.8 -2.39±0.54 4.02±1.37 4943±281Antlia2 004 144.2164 -36.7546 289.3±3.4 -1.34±0.38 3.22±0.88 4958±221Antlia2 005 144.6405 -36.9363 284.2±3.9 -1.44±0.38 3.75±0.86 4860±221Antlia2 006 143.8835 -36.7709 292.9±0.8 -1.1 ±0.12 1.3 ±0.26 5075±57Antlia2 007 144.2962 -36.8591 278.3±4.1 -1.62±0.35 2.7 ±0.93 4884±223Antlia2 008 144.8393 -37.0967 8.6 ±3.1 0.23 ±0.32 5.2 ±0.64 4629±185Antlia2 009 144.738 -37.0794 20.4 ±3.4 -0.48±0.33 4.98±0.68 4698±331Antlia2 010 144.3932 -36.9902 288.5±1.4 -1.23±0.17 3.91±0.27 4428±125Antlia2 011 144.0758 -36.8442 290.2±1.9 -1.29±0.26 3.88±0.52 4711±260Antlia2 012 144.2665 -36.9975 48.4 ±3.9 -0.22±0.34 5.28±0.54 5008±220Antlia2 013 144.6282 -37.1997 293.0±2.5 -1.2 ±0.29 3.96±0.7 4746±201Antlia2 014 144.0369 -36.9445 288.0±1.7 -1.16±0.25 3.63±0.66 4960±218Antlia2 015 144.0136 -36.8662 287.8±5.4 -1.31±0.28 4.81±0.63 5136±264Antlia2 016 144.3143 -37.0689 292.8±1.2 -0.94±0.13 3.8 ±0.23 4287±83Antlia2 017 144.5795 -37.2524 289.2±2.5 -1.16±0.26 2.95±0.74 4926±196Antlia2 018 144.4075 -37.1573 293.1±1.3 -1.0 ±0.12 2.02±0.61 5115±138Antlia2 019 144.256 -37.0773 291.0±1.8 -1.26±0.21 3.84±0.52 4701±202Antlia2 020 144.2549 -37.1559 272.2±6.8 -1.24±0.54 4.58±1.06 4865±340Antlia2 021 144.323 -37.1384 291.8±1.8 -1.25±0.25 2.42±0.8 4957±149Antlia2 022 144.5144 -37.3139 85.6 ±2.8 -0.97±0.28 4.16±0.61 5124±231Antlia2 023 144.6594 -37.4486 294.1±2.4 -1.07±0.23 4.29±0.5 4723±198Antlia2 024 144.185 -37.1481 283.7±3.2 -1.4 ±0.26 4.54±0.6 4688±249Antlia2 025 144.3197 -37.2287 289.4±0.9 -0.84±0.12 4.28±0.26 4827±136Antlia2 026 144.013 -36.9676 300.2±0.6 -0.79±0.09 3.9 ±0.14 4408±73Antlia2 027 144.2995 -37.2668 280.1±3.2 -1.47±0.41 2.55±1.37 4974±239Antlia2 028 144.0498 -37.0218 273.0±6.5 -0.37±0.45 5.19±0.9 5046±320Antlia2 029 144.1539 -37.1801 314.7±0.8 -0.14±0.17 2.81±0.37 4034±103Antlia2 030 144.4285 -37.4949 297.3±2.6 -1.24±0.29 2.62±0.81 5024±196Antlia2 031 144.2236 -37.302 281.7±6.3 -2.02±0.64 3.53±1.37 4799±385Antlia2 032 144.3628 -37.4769 285.5±4.1 -1.75±0.44 2.63±0.96 4707±247Antlia2 033 144.0026 -37.0409 292.1±0.8 -1.0 ±0.09 3.65±0.59 4355±246Antlia2 034 144.3108 -37.4548 294.8±0.9 -1.67±0.18 1.36±0.4 4937±102Antlia2 035 144.0247 -37.1193 85.8 ±1.5 -1.58±0.5 5.93±0.32 3834±216Antlia2 036 144.1418 -37.3015 296.0±0.7 -1.14±0.1 3.96±0.14 4399±61Antlia2 037 144.081 -37.1197 288.4±2.0 -0.91±0.25 3.51±0.64 4856±202Antlia2 038 144.0853 -37.259 295.3±2.8 -1.57±0.31 3.45±0.94 4748±239Antlia2 039 144.0885 -37.1639 288.3±5.5 -2.18±0.49 2.91±1.17 4828±323Antlia2 040 144.189 -37.4559 292.4±1.2 -1.39±0.19 2.96±0.55 4798±164Antlia2 041 144.1202 -37.3303 296.2±3.5 -1.44±0.6 2.81±1.14 4858±408Antlia2 042 143.9548 -36.9605 284.2±6.5 -1.16±0.38 4.38±0.85 4985±312Antlia2 043 144.1308 -37.668 292.0±2.6 -1.32±0.22 4.32±0.5 4589±226Antlia2 044 143.8916 -37.1604 295.6±2.3 -1.19±0.42 2.09±1.01 4889±201Antlia2 045 143.8625 -37.1026 293.8±1.3 -1.52±0.2 3.67±0.53 4654±150Antlia2 046 143.9378 -37.3905 286.4±4.2 -1.42±0.42 3.64±0.93 5240±285Antlia2 047 143.8282 -37.132 218.4±4.6 -1.3 ±0.39 2.93±1.31 5144±296Antlia2 048 144.0119 -37.7311 291.2±2.3 -1.88±0.29 2.82±0.55 4634±245Antlia2 049 143.9227 -37.4917 293.3±3.1 -1.93±0.72 3.83±1.0 5108±537Antlia2 050 143.8137 -37.1636 174.1±3.2 -1.15±0.46 2.69±1.73 4682±294Antlia2 051 143.7889 -37.101 300.4±0.9 -0.99±0.13 2.22±0.36 5119±72Antlia2 052 143.7875 -37.2203 290.4±0.9 -1.25±0.17 1.89±0.37 5069±73Antlia2 053 143.7774 -37.5246 303.9±1.0 -1.48±0.19 2.18±0.57 4739±148Antlia2 054 143.7444 -37.6849 273.4±6.7 -2.55±0.57 3.84±1.56 4727±254Antlia2 055 143.7364 -37.5761 282.0±4.8 -3.31±0.67 2.83±1.66 4458±283Antlia2 056 143.7462 -37.1284 292.3±0.6 -1.06±0.14 1.9 ±0.33 5036±68Antlia2 057 143.6452 -37.6683 57.8 ±7.2 -1.03±0.63 6.07±1.09 4881±372Antlia2 058 143.5564 -37.6037 296.8±2.0 -1.27±0.24 3.42±0.62 4826±200Antlia2 059 143.6555 -37.0654 280.9±2.0 -1.08±0.28 3.63±0.75 4993±205Antlia2 060 143.5162 -37.3626 287.6±1.5 -1.26±0.25 2.57±0.45 5137±143Antlia2 061 143.865 -36.8063 296.1±3.2 -1.68±0.42 1.68±0.96 5025±278Antlia2 062 143.545 -37.2742 293.4±0.5 -1.71±0.04 1.02±0.08 4796±14Antlia2 063 143.4109 -37.5214 51.7 ±4.6 -0.92±0.55 5.82±1.13 4574±344Antlia2 064 143.4977 -37.3211 47.7 ±3.0 -1.06±0.36 4.88±0.67 4908±203Antlia2 065 143.3955 -37.4922 -24.5±3.9 -0.24±0.35 5.22±0.65 4611±323Antlia2 066 143.3652 -37.4772 294.4±4.9 -2.0 ±0.54 2.55±1.25 4821±331Antlia2 067 143.4774 -37.1417 298.4±0.2 -0.29±0.03 2.49±0.11 3995±17Antlia2 068 143.5907 -37.0158 296.2±7.2 -1.87±0.72 4.42±1.22 4856±416Antlia2 069 143.523 -37.2347 300.2±4.7 -1.36±0.56 3.73±1.12 4660±280Antlia2 070 143.5213 -37.1668 290.7±2.7 -1.75±0.33 3.43±0.98 4741±242Antlia2 071 143.0966 -37.5431 289.2±2.2 -1.48±0.27 2.52±0.73 4824±171Antlia2 072 143.7441 -36.9139 29.5 ±3.7 -1.05±0.41 3.71±1.07 4971±328Antlia2 073 143.455 -37.0521 287.6±2.3 -2.0 ±0.29 1.71±0.84 4928±206Antlia2 074 143.5503 -36.9872 278.5±2.8 -1.32±0.31 3.36±0.81 5178±230Antlia2 075 143.5367 -37.0773 298.8±3.8 -1.81±0.55 1.76±0.96 4852±285Antlia2 076 143.018 -37.4241 294.7±5.7 -2.44±0.64 4.15±1.48 4672±428Antlia2 077 143.0292 -37.31 109.9±3.6 -0.83±0.38 5.12±0.84 4622±329Antlia2 078 142.894 -37.3983 301.4±3.0 -1.98±0.49 3.22±0.72 4859±253Antlia2 079 143.8168 -36.7829 292.7±2.2 -1.36±0.38 2.64±0.93 4793±212Antlia2 080 142.9567 -37.3225 285.2±0.9 -2.74±0.15 0.67±0.28 4492±73Antlia2 081 143.1255 -37.2181 138.6±3.0 -1.67±0.5 3.25±0.88 4967±225Antlia2 082 142.7703 -37.3498 172.1±2.9 -1.07±0.43 3.59±0.79 5080±208Antlia2 083 143.399 -36.9386 281.4±3.8 -2.45±0.5 2.54±1.17 4601±259Antlia2 084 143.6257 -36.8654 293.3±4.1 -2.05±0.47 4.19±1.07 5064±385Antlia2 085 143.4277 -36.8772 295.0±2.5 -0.99±0.45 2.39±0.89 4934±241Antlia2 086 143.6338 -36.9415 285.3±4.9 -1.19±0.53 2.04±1.43 5377±317Antlia2 087 143.0142 -37.1148 11.3 ±2.5 0.03 ±0.43 5.72±0.49 4549±275Antlia2 088 142.7531 -37.2389 44.2 ±4.7 -1.97±0.35 5.85±0.33 4510±277Antlia2 089 143.6367 -36.7939 286.1±6.3 -1.46±0.57 4.45±1.07 4908±321Antlia2 090 143.1911 -36.9777 298.6±0.9 -1.42±0.22 2.16±0.66 4914±121Antlia2 091 143.7745 -36.8622 292.6±1.7 -1.21±0.19 2.67±0.53 5148±143Antlia2 092 143.5555 -36.7636 282.0±2.7 -1.58±0.39 2.69±0.83 4616±241Antlia2 093 143.5135 -36.8184 298.7±1.2 -2.04±0.24 2.28±0.51 4754±133Antlia2 094 143.3822 -36.8418 289.5±0.5 -0.96±0.08 3.69±0.12 4314±61Antlia2 095 143.0311 -36.8743 289.2±1.2 -1.25±0.18 3.46±0.41 4795±189Antlia2 096 143.248 -36.8216 287.8±1.1 -2.32±0.22 2.13±0.43 4677±139Antlia2 097 143.381 -36.6321 301.7±3.7 -1.73±0.41 3.12±1.09 5052±305Antlia2 098 143.0082 -36.8738 195.3±3.3 -1.59±0.4 3.26±1.02 4877±211Antlia2 099 143.044 -36.8536 294.7±1.2 -2.28±0.21 2.06±0.37 4789±154Antlia2 100 143.2149 -36.805 289.8±1.9 -1.28±0.25 2.69±0.7 4827±190Antlia2 101 143.4385 -36.641 296.1±1.0 -1.07±0.19 2.07±0.39 5042±98Antlia2 102 142.7956 -36.8848 31.0 ±3.6 -1.78±0.4 4.35±0.97 4470±300Antlia2 103 142.984 -36.8579 3.9 ±1.3 -0.39±0.15 5.35±0.34 5123±196Antlia2 104 143.0315 -36.7567 299.1±3.5 -2.05±0.51 0.01±1.14 4899±337Antlia2 105 143.4262 -36.7238 287.9±1.7 -1.0 ±0.23 2.08±0.66 5035±148Antlia2 106 143.485 -36.6694 29.4 ±3.3 0.04 ±0.3 5.58±1.01 4834±313Antlia2 107 143.567 -36.6938 293.5±3.8 -1.35±0.76 3.04±1.07 5391±461Antlia2 108 142.54 -36.6496 69.9 ±6.3 -1.08±0.58 5.89±0.64 3966±619
MNRAS 000, 1–23 (2018)

Antlia 2 dwarf 21
Table 2 – continued
id ra dec rvh [Fe/H] log g Teff(deg) (deg) (km/s) (dex) (dex) (K)
Antlia2 109 142.48 -36.6232 315.4±5.9 -0.43±0.54 5.47±0.67 5021±199Antlia2 110 142.5243 -36.6079 286.2±9.2 -1.88±0.8 2.88±1.41 4869±239Antlia2 111 143.0022 -36.6454 294.2±3.8 -2.09±0.34 3.28±0.71 4860±228Antlia2 112 143.1721 -36.6686 97.5 ±4.2 -0.45±0.43 5.32±0.86 4399±315Antlia2 113 142.8796 -36.5792 291.3±2.0 -1.53±0.29 2.66±0.61 4483±199Antlia2 114 142.715 -36.5071 -13.1±4.4 -0.71±0.47 2.34±1.91 4645±372Antlia2 115 143.0283 -36.5595 300.4±1.2 -1.52±0.21 2.42±1.01 4731±151Antlia2 116 143.3247 -36.6292 298.7±1.2 -1.47±0.21 3.47±0.51 4887±156Antlia2 117 143.0218 -36.5246 27.8 ±3.2 -0.18±0.32 5.46±0.66 4564±302Antlia2 118 142.9719 -36.4776 299.6±0.4 0.33 ±0.21 1.14±0.38 3465±204Antlia2 119 143.2491 -36.5633 293.0±0.5 -0.97±0.09 3.49±0.14 4305±71Antlia2 120 143.48 -36.5207 170.4±3.3 -1.27±0.4 5.06±0.73 5408±283Antlia2 121 143.1997 -36.5209 45.0 ±2.9 0.25 ±0.3 4.63±0.94 4894±319Antlia2 122 143.6304 -36.5916 292.5±1.0 -1.21±0.17 2.33±0.68 4830±223Antlia2 123 143.4508 -36.526 297.5±3.7 -1.83±0.52 4.71±0.9 4947±314Antlia2 124 143.4412 -36.7202 288.6±4.8 -0.54±0.49 3.09±1.23 5324±337Antlia2 125 142.679 -36.2331 289.1±1.4 -1.45±0.31 2.31±0.7 4687±187Antlia2 126 142.9998 -36.3547 18.2 ±4.9 -0.45±0.69 4.44±1.4 4955±447Antlia2 127 143.1023 -36.3311 292.8±3.5 -1.62±0.36 2.96±0.92 4677±274Antlia2 128 143.3845 -36.536 281.1±1.8 -1.51±0.21 1.61±0.57 5014±178Antlia2 129 142.8157 -36.2154 288.6±5.8 -1.18±0.63 0.98±1.21 4827±310Antlia2 130 143.5783 -36.6125 287.5±0.9 -1.24±0.11 3.87±0.19 4392±85Antlia2 131 143.0325 -36.2573 280.0±1.7 -1.05±0.26 3.39±0.59 4978±254Antlia2 132 143.6435 -36.5501 289.6±1.3 -1.96±0.23 1.44±0.44 4766±113Antlia2 133 143.6242 -36.4029 283.3±2.7 -2.17±0.39 2.52±0.74 4633±234Antlia2 134 143.1325 -36.2867 77.2 ±3.7 0.1 ±0.27 5.38±0.52 5031±272Antlia2 135 143.5472 -36.3937 295.0±3.9 -1.71±0.39 3.47±0.97 4684±270Antlia2 136 143.029 -36.1825 430.5±7.3 -1.78±0.5 5.02±0.9 5020±322Antlia2 137 142.9986 -36.1471 194.0±5.5 -1.91±0.55 2.76±1.77 5326±359Antlia2 138 143.6291 -36.4992 289.2±3.4 -2.03±0.47 4.13±0.94 4535±312Antlia2 139 143.5753 -36.4902 295.3±1.2 -1.93±0.23 1.09±0.44 4803±123Antlia2 140 143.6256 -36.5625 295.7±2.7 -0.72±0.36 3.56±1.19 5032±260Antlia2 141 143.0544 -36.0141 44.3 ±3.6 -0.48±0.25 4.88±0.7 4651±220Antlia2 142 143.1813 -36.1775 280.8±3.6 -1.14±0.39 2.83±1.59 4747±282Antlia2 143 142.9533 -35.9304 290.0±7.1 -2.72±0.6 5.48±1.54 3997±263Antlia2 144 143.2108 -36.1181 29.9 ±3.0 0.11 ±0.24 5.28±0.58 4473±219Antlia2 145 143.1267 -35.9899 288.9±1.3 -1.6 ±0.26 2.23±0.64 4791±135Antlia2 146 143.0852 -35.9434 34.0 ±4.4 -1.79±0.6 5.74±0.42 4041±294Antlia2 147 143.2008 -36.1824 65.4 ±10.0 -1.88±0.72 5.01±1.17 4502±420Antlia2 148 143.1406 -35.979 9.7 ±3.2 -0.91±0.34 5.16±0.81 4389±276Antlia2 149 143.278 -36.148 290.5±3.2 -1.61±0.41 2.66±0.84 5113±259Antlia2 150 143.3024 -36.236 295.0±6.6 -2.25±0.66 2.05±1.53 4393±344Antlia2 151 143.2906 -35.9939 13.2 ±4.0 -0.77±0.58 5.55±1.01 4741±272Antlia2 152 143.2522 -35.967 159.2±1.5 -0.86±0.24 4.74±0.49 5128±234Antlia2 153 143.487 -36.2642 296.8±2.6 -2.14±0.35 2.5 ±0.68 4853±244Antlia2 154 143.6713 -36.3644 140.1±3.2 -2.11±0.3 3.17±0.94 4955±207Antlia2 155 143.2321 -35.8358 286.6±4.1 -2.1 ±0.53 4.68±1.06 5106±246Antlia2 156 143.3072 -35.9445 158.8±4.3 -0.85±0.65 3.85±1.33 5423±363Antlia2 157 143.442 -36.0378 290.9±2.4 -1.36±0.31 2.83±0.75 4850±172Antlia2 158 143.6224 -36.2775 301.7±0.7 -1.25±0.19 1.36±0.34 4971±95Antlia2 159 143.4061 -35.957 296.2±2.7 -2.6 ±0.36 1.69±0.74 4620±114Antlia2 160 143.5705 -36.0955 288.1±2.3 -1.72±0.31 3.23±0.72 4872±207Antlia2 161 143.5017 -35.8606 274.8±1.9 -1.87±0.29 1.61±0.78 4633±173Antlia2 162 143.5503 -35.9301 284.7±3.1 -2.04±0.42 3.4 ±0.84 5120±171Antlia2 163 143.606 -36.0869 288.3±6.0 -2.51±0.94 4.93±1.12 4317±405Antlia2 164 143.5992 -35.9915 287.0±0.9 -1.22±0.11 3.83±0.73 4447±196Antlia2 165 143.6506 -36.2201 294.3±1.4 -1.39±0.22 2.17±0.6 5036±139Antlia2 166 143.7377 -36.0909 185.4±1.6 -0.26±0.21 3.56±0.62 5084±168Antlia2 167 143.6639 -36.2787 287.2±0.6 -0.99±0.16 1.73±0.72 4860±122Antlia2 168 143.6661 -35.9863 34.9 ±4.6 -0.81±0.51 5.03±2.29 4350±276Antlia2 169 143.6968 -35.7993 287.3±1.9 -0.94±0.24 2.8 ±0.6 4891±171Antlia2 170 143.7152 -35.8785 285.4±4.9 -2.49±0.6 2.45±1.44 4596±339Antlia2 171 143.762 -35.7853 284.8±1.7 -1.04±0.21 2.07±0.58 4882±155Antlia2 172 143.7126 -36.4737 294.6±0.9 -1.13±0.16 1.79±0.33 5012±98Antlia2 173 143.7959 -36.0037 288.7±0.7 -0.98±0.11 1.81±0.26 5084±66Antlia2 174 143.7845 -36.1298 287.2±1.2 -1.07±0.17 3.34±0.65 5000±161Antlia2 175 143.7935 -36.2443 27.3 ±2.4 -0.29±0.24 5.08±0.47 4873±180Antlia2 176 143.6763 -36.3421 223.7±2.3 -1.03±0.32 2.69±0.89 5169±195Antlia2 177 143.8092 -36.2361 281.9±3.3 -1.34±0.36 3.83±0.85 5254±262Antlia2 178 143.8774 -35.9471 217.0±3.9 -1.69±0.44 3.02±0.83 5170±226Antlia2 179 143.9661 -35.7902 295.7±6.2 -1.42±0.48 3.94±1.15 5203±288Antlia2 180 143.6692 -36.3141 91.8 ±2.4 0.21 ±0.19 4.77±0.52 4967±189Antlia2 181 143.9801 -35.7549 284.2±3.2 -1.28±0.58 1.51±1.48 4817±356Antlia2 182 143.8865 -36.0804 280.7±2.4 -1.87±0.3 1.47±1.07 4941±147Antlia2 183 143.834 -36.2541 360.4±3.8 -0.26±0.4 4.84±0.63 5785±335Antlia2 184 143.8395 -36.3661 295.2±1.9 -1.45±0.27 1.8 ±0.56 4843±167Antlia2 185 143.6866 -36.5661 281.9±4.2 -1.41±0.35 4.03±0.88 4867±286Antlia2 186 143.942 -36.2156 66.4 ±2.8 0.1 ±0.21 5.65±0.38 5037±211Antlia2 187 143.6558 -36.5768 297.8±0.6 -1.0 ±0.09 1.7 ±0.26 5098±50Antlia2 188 144.1966 -35.7793 276.5±5.3 -1.98±0.54 4.07±1.48 4682±266Antlia2 189 144.2014 -35.8191 65.2 ±6.6 -0.86±0.38 5.67±0.49 4543±276Antlia2 190 144.0545 -36.2081 59.3 ±5.4 0.04 ±0.37 5.55±0.7 4940±337Antlia2 191 144.1003 -36.0622 378.8±3.6 -1.75±0.52 2.58±0.85 5118±212Antlia2 192 144.0123 -36.2622 295.1±1.5 -1.11±0.17 2.89±0.46 4998±136Antlia2 193 144.254 -35.8732 169.3±3.4 -0.63±0.32 4.43±0.98 5160±215Antlia2 194 144.1068 -36.1388 288.5±1.2 -1.85±0.16 0.97±0.4 4844±100Antlia2 195 144.239 -36.0789 38.8 ±1.0 0.17 ±0.12 4.74±0.28 4553±98Antlia2 196 144.2908 -36.0961 95.7 ±3.0 -0.14±0.23 5.06±0.55 4501±218Antlia2 197 144.3403 -35.9994 107.3±2.4 -0.29±0.28 4.45±0.51 4707±235Antlia2 198 144.307 -36.1008 289.2±1.2 -2.06±0.21 1.53±0.45 4699±133Antlia2 199 144.1083 -36.2986 226.1±0.7 -0.68±0.1 4.18±0.18 4764±103Antlia2 200 144.0819 -36.3793 275.6±4.6 -0.95±0.39 3.4 ±1.0 5128±241Antlia2 201 144.3462 -36.2044 281.7±2.9 -1.46±0.3 4.38±0.77 4971±234Antlia2 202 144.5744 -36.0101 19.0 ±4.5 -0.93±0.85 5.03±0.87 4963±268Antlia2 203 144.0653 -36.4794 295.3±0.4 -1.16±0.12 1.26±0.24 4940±46Antlia2 204 144.2034 -36.365 297.9±2.2 -1.33±0.3 3.19±0.85 4756±234Antlia2 205 143.9453 -36.7579 320.6±4.6 -1.05±0.45 3.34±1.46 5112±243Antlia2 206 144.3255 -36.3558 290.4±0.5 -1.07±0.06 1.12±0.11 4985±33Antlia2 207 144.1495 -36.6055 297.7±6.3 -0.96±0.52 4.59±1.04 4834±348Antlia2 208 144.2508 -36.4576 65.5 ±2.2 -0.24±0.19 5.47±0.43 4750±149Antlia2 209 144.2995 -36.4365 279.2±0.6 -1.05±0.09 4.01±0.14 4397±76Antlia2 210 144.2863 -36.5128 287.3±0.9 -0.61±0.12 3.77±0.23 4679±119Antlia2 211 144.4146 -36.4728 46.9 ±1.3 0.15 ±0.12 5.49±0.28 4890±106Antlia2 212 144.267 -36.5383 293.0±1.2 -1.27±0.17 2.95±0.64 4904±114Antlia2 213 144.2461 -36.5839 65.3 ±6.3 -0.28±0.48 4.52±1.08 4193±307Antlia2 214 144.3061 -36.5282 299.8±5.0 -1.49±0.35 3.23±1.06 4915±295Antlia2 215 144.125 -36.7496 11.3 ±3.5 -0.04±0.25 5.65±0.37 4672±161Antlia2 216 144.1626 -36.6182 -5.3 ±1.5 -0.37±0.18 4.16±0.41 4906±151Antlia2 217 144.8575 -36.4593 300.9±1.1 -0.72±0.14 4.16±0.24 4377±86Antlia2 218 144.3082 -36.6104 290.4±2.3 -1.02±0.2 0.08±0.43 5241±182Antlia2 219 144.0521 -36.7465 293.0±7.7 -1.1 ±0.77 3.83±2.16 5198±386Antlia2 220 144.4467 -36.6607 284.1±3.1 -2.33±0.76 3.73±1.05 5019±287Antlia2 221 144.4118 -36.6823 292.8±0.8 -1.02±0.15 1.58±0.66 4961±126
MNRAS 000, 1–23 (2018)

22 G. Torrealba et al.
Da Costa G. S., Armandroff T. E., 1990, AJ, 100, 162
Deason A. J., Belokurov V., Evans N. W., 2011, MNRAS, 416,
2903
Di Cintio A., Brook C. B., Maccio A. V., Stinson G. S., Knebe
A., Dutton A. A., Wadsley J., 2014, MNRAS, 437, 415
Di Cintio A., Brook C. B., Dutton A. A., Maccio A. V., ObrejaA., Dekel A., 2017, MNRAS, 466, L1
Drlica-Wagner A., et al., 2016, ApJ, 833, L5
Dubinski J., Carlberg R. G., 1991, ApJ, 378, 496
Dutton A. A., Maccio A. V., 2014, MNRAS, 441, 3359
El-Badry K., Wetzel A., Geha M., Hopkins P. F., Keres D., Chan
T. K., Faucher-Giguere C.-A., 2016, ApJ, 820, 131
El-Zant A., Shlosman I., Hoffman Y., 2001, ApJ, 560, 636
Errani R., Penarrubia J., Laporte C. F. P., Gomez F. A., 2017,
MNRAS, 465, L59
Errani R., Penarrubia J., Walker M. G., 2018, MNRAS, 481, 5073
Evans N. W., Sanders J. L., Geringer-Sameth A., 2016, Phys.Rev. D, 93, 103512
Fitts A., et al., 2017, MNRAS, 471, 3547
Foreman-Mackey D., Hogg D. W., Lang D., Goodman J., 2013,
PASP, 125, 306
Fritz T. K., Battaglia G., Pawlowski M. S., Kallivayalil N., van
der Marel R., Sohn S. T., Brook C., Besla G., 2018, A&A,619, A103
Gaia Collaboration et al., 2016a, A&A, 595, A1
Gaia Collaboration et al., 2016b, A&A, 595, A2
Gaia Collaboration et al., 2018a, preprint, (arXiv:1804.09382)
Gaia Collaboration Brown A. G. A., Vallenari A., Prusti T., de
Bruijne J. H. J., Babusiaux C., Bailer-Jones C. A. L., 2018b,preprint, p. arXiv:1804.09365 (arXiv:1804.09365)
Garrison-Kimmel S., et al., 2018, preprint, (arXiv:1806.04143)
Geringer-Sameth A., Koushiappas S. M., 2011, Phys. Rev. Lett.,
107, 241303
Geringer-Sameth A., Koushiappas S. M., Walker M. G., 2015a,
Phys. Rev. D, 91, 083535
Geringer-Sameth A., Koushiappas S. M., Walker M., 2015b, ApJ,801, 74
Geweke J., In F., 1995, 4
Gnedin O. Y., Kravtsov A. V., Klypin A. A., Nagai D., 2004,
ApJ, 616, 16
Goodman J., Weare J., 2010, Comm. App. Math. Comp. Sci, 5,
65
Harris W. E., 2010, preprint, (arXiv:1012.3224)
Henden A. A., Templeton M., Terrell D., Smith T. C., Levine S.,Welch D., 2016, VizieR Online Data Catalog, p. II/336
Hogan C. J., Dalcanton J. J., 2000, Phys. Rev. D, 62, 063511
Holl B., et al., 2018, preprint, p. arXiv:1804.09373
(arXiv:1804.09373)
Homma D., et al., 2016, ApJ, 832, 21
Homma D., et al., 2018, Publications of the Astronomical Societyof Japan, 70, S18
Hormann K., 2014, in , Approximation Theory XIV: San Antonio2013. Springer, pp 197–218
Hu W., Barkana R., Gruzinov A., 2000, Physical Review Letters,
85, 1158
Hui L., Ostriker J. P., Tremaine S., Witten E., 2017, Phys. Rev. D,
95, 043541
Husser T.-O., Wende-von Berg S., Dreizler S., Homeier D., Rein-ers A., Barman T., Hauschildt P. H., 2013, A&A, 553, A6
Iorio G., Belokurov V., 2018, preprint, (arXiv:1808.04370)
Jethwa P., Erkal D., Belokurov V., 2016, MNRAS, 461, 2212
Jethwa P., Erkal D., Belokurov V., 2018, MNRAS, 473, 2060
Joo S.-J., et al., 2018, ApJ, 861, 23
Kaplinghat M., Strigari L. E., 2008, ApJ, 682, L93
Kim D., Jerjen H., 2015, ApJ, 799, 73
Kim D., Jerjen H., Milone A. P., Mackey D., Da Costa G. S.,
2015, ApJ, 803, 63
Kim D., Jerjen H., Mackey D., Da Costa G. S., Milone A. P.,
2016a, ApJ, 820, 119
Kim D., et al., 2016b, ApJ, 833, 16
Kirby E. N., et al., 2010, ApJS, 191, 352
Kirby E. N., Cohen J. G., Guhathakurta P., Cheng L., Bullock
J. S., Gallazzi A., 2013, ApJ, 779, 102
Kirby E. N., Simon J. D., Cohen J. G., 2015, ApJ, 810, 56
Kirby E. N., Rizzi L., Held E. V., Cohen J. G., Cole A. A., Man-ning E. M., Skillman E. D., Weisz D. R., 2017a, ApJ, 834,
9
Kirby E. N., Cohen J. G., Simon J. D., Guhathakurta P., Thyge-
sen A. O., Duggan G. E., 2017b, ApJ, 838, 83
Koleva M., Prugniel P., Bouchard A., Wu Y., 2009, A&A, 501,
1269
Koposov S. E., et al., 2011, ApJ, 736, 146
Koposov S. E., Belokurov V., Torrealba G., Evans N. W., 2015a,ApJ, 805, 130
Koposov S. E., et al., 2015b, ApJ, 811, 62
Koposov S. E., Belokurov V., Torrealba G., 2017, MNRAS, 470,
2702
Koposov S. E., et al., 2018, MNRAS, p. 1695
Kraan-Korteweg R. C., Lahav O., 2000, A&ARv, 10, 211
Kravtsov A. V., 2013, ApJ, 764, L31
Laevens B. P. M., et al., 2015, ApJ, 813, 44
Li T. S., et al., 2017, ApJ, 838, 8
Li T. S., et al., 2018, ApJ, 857, 145
Luque E., et al., 2016, MNRAS, 458, 603
Luque E., et al., 2017, MNRAS, 468, 97
Luque E., et al., 2018, MNRAS, 478, 2006
Madau P., Shen S., Governato F., 2014, ApJ, 789, L17
Malhan K., Ibata R. A., Martin N. F., 2018, MNRAS, 481, 3442
Martin N. F., et al., 2016a, ApJ, 830, L10
Martin N. F., et al., 2016b, ApJ, 833, 167
Mashchenko S., Wadsley J., Couchman H. M. P., 2008, Science,319, 174
Mateo M. L., 1998, ARA&A, 36, 435
McConnachie A. W., 2012, AJ, 144, 4
McConnachie A. W., et al., 2008, ApJ, 688, 1009
McMillan P. J., 2017, MNRAS, 465, 76
Merritt D., Meylan G., Mayor M., 1997, AJ, 114, 1074
Moore B., 1994, Nature, 370, 629
Munoz R. R., Geha M., Cote P., Vargas L. C., Santana F. A.,
Stetson P., Simon J. D., Djorgovski S. G., 2012, ApJ, 753,
L15
Navarro J. F., Eke V. R., Frenk C. S., 1996a, MNRAS, 283, L72
Navarro J. F., Frenk C. S., White S. D. M., 1996b, ApJ, 462, 563
Navarro J. F., Frenk C. S., White S. D. M., 1997, ApJ, 490, 493
Nidever D. L., Dey A., Olsen K., Ridgway S., Fitzpatrick M.,
Scott A., 2018, preprint, (arXiv:1801.01885)
Okamoto T., Frenk C. S., 2009, MNRAS, 399, L174
Penarrubia J., McConnachie A. W., Navarro J. F., 2008a, ApJ,672, 904
Penarrubia J., Navarro J. F., McConnachie A. W., 2008b, ApJ,
673, 226
Penarrubia J., Pontzen A., Walker M. G., Koposov S. E., 2012,ApJ, 759, L42
Peebles P. J. E., 2000, ApJ, 534, L127
Pontzen A., Governato F., 2012, MNRAS, 421, 3464
Read J. I., Gilmore G., 2005, MNRAS, 356, 107
Read J. I., Agertz O., Collins M. L. M., 2016, MNRAS, 459, 2573
Read J. I., Walker M. G., Steger P., 2018, MNRAS, 481, 860
Sanders J. L., Evans N. W., Dehnen W., 2018, MNRAS, 478, 3879
Schive H.-Y., Chiueh T., Broadhurst T., 2014, Nature Physics,10, 496
Schive H.-Y., Chiueh T., Broadhurst T., Huang K.-W., 2016, ApJ,818, 89
Schlafly E. F., Finkbeiner D. P., 2011, ApJ, 737, 103
Schlegel D. J., Finkbeiner D. P., Davis M., 1998, ApJ, 500, 525
MNRAS 000, 1–23 (2018)

Antlia 2 dwarf 23
Sesar B., et al., 2014, ApJ, 793, 135
Shapley H., 1961, Galaxies.
Sharp R., et al., 2006, in Society of Photo-Optical Instru-mentation Engineers (SPIE) Conference Series. p. 62690G
(arXiv:astro-ph/0606137), doi:10.1117/12.671022
Simon J. D., et al., 2017, ApJ, 838, 11Spergel D. N., Steinhardt P. J., 2000, Physical Review Letters,
84, 3760Tollet E., et al., 2016, MNRAS, 456, 3542
Torrealba G., Koposov S. E., Belokurov V., Irwin M., 2016a, MN-
RAS, 459, 2370Torrealba G., et al., 2016b, MNRAS, 463, 712
Torrealba G., Belokurov V., Koposov S. E., 2018a, preprint, p.
arXiv:1805.06473 (arXiv:1805.06473)Torrealba G., et al., 2018b, MNRAS, 475, 5085
Vasiliev E., 2018, preprint, p. arXiv:1807.09775
(arXiv:1807.09775)Walker M. G., Penarrubia J., 2011, ApJ, 742, 20
Walker M. G., Mateo M., Olszewski E. W., Bernstein R., Wang
X., Woodroofe M., 2006, AJ, 131, 2114Walker M. G., Mateo M., Olszewski E. W., 2008, ApJ, 688, L75
Walker M. G., Mateo M., Olszewski E. W., Penarrubia J., WynEvans N., Gilmore G., 2009, ApJ, 704, 1274
Walker M. G., Olszewski E. W., Mateo M., 2015, MNRAS, 448,
2717Walker M. G., et al., 2016, ApJ, 819, 53
Weisz D. R., et al., 2016, ApJ, 822, 32
Whiting A. B., Irwin M. J., Hau G. K. T., 1997, AJ, 114, 996Williams A. A., Belokurov V., Casey A. R., Evans N. W., 2017,
MNRAS, 468, 2359
Zolotov A., et al., 2012, ApJ, 761, 71van Dokkum P. G., Abraham R., Merritt A., Zhang J., Geha M.,
Conroy C., 2015, ApJ, 798, L45
This paper has been typeset from a TEX/LATEX file prepared bythe author.
MNRAS 000, 1–23 (2018)