satellite imagery interpretation - university of...
TRANSCRIPT

Satellite Imagery Interpretation
Satellite Types
1. Polar Orbiter (POES)
2. Geosynchronous Orbiters Geostationary Operational Env. Satellite (GOES)(GOES)GMSEUMETSAT

Satellite Imagery InterpretationImage Types
Garp
1. Visible: radiation reflected by objects 4km/0.65
2. Infrared: radiated energy of objects 4km/10.7
W t V di t d f bj t 43. Water Vapor: radiated energy of objects 4km/6.8

Satellite Imagery Interpretation
Visible Imagery:looks very much like black and white yphotosbased on reflected light (reflection i d t t d li ht i )increases, detected light increases)
Sample albedos:Sample albedos:Large T-storm: 92% Fresh snow: 88%Thick Cs: 74% Thick Sc: 68%Thin St: 42% Thin Cs: 32%Thin St: 42% Thin Cs: 32%Water surface: 9% White Sands, NM: 60%

Satellite Imagery Interpretation
GOES VISIBLE Specs:Resolution: 0.5 km (each pixel represents .5 x .5 km area)
Bands: 0.65 μm

Satellite Imagery Interpretation
Infrared Imagery (IR)
Radiometer detects radiated energy of an object, emitted from a surface.
All objects with a temp. greater than absolute zero radiated electromagnetic radiationradiated electromagnetic radiation
Wavelength of max radiation emission varies w/temp

Satellite Imagery Interpretation
GOES Radiometer Approach1. Fix wavelength (λ)2. Measure energy level at that λ3. Convert energy levels to temps
GOES Specs:Resolution: 4 kmBand: 3.9, 6.8, 10.7, 13.3

Satellite Imagery Interpretation
Vis Imagery often has good visual contrastcontrast
For IR images some low clouds mayFor IR images, some low clouds may have temps very similar to underlying surface so we need some means ofsurface so we need some means of determining subtle temp. differences.

Satellite Imagery Interpretation
Enhancement : Human eye can perceive 15-20 gray shades where computers can generate 256 gray shades which can be used to definegray shades which can be used to define more temperatures
IR Imagery usually enhanced.

Satellite Imagery Interpretationh d / l dUnenhanced: many temps/colors unused
From An Introduction toAn Introduction to Satellite Image InterpretationBy Eric D. Conway

Satellite Imagery Interpretation
ZA curve: allows enhancements of high and low clouds
Segments1. Black2. Small difference in low clouds and SST exaggerated3. No enhancements4 Small difference in Ci exaggerated4. Small difference in Ci exaggerated5. White

Satellite Imagery Interpretation
From An Introduction toAn Introduction to Satellite Image InterpretationBy Eric D. Conway

Satellite Imagery Interpretation
MB curveAllows for enhancement of convection;Allows for enhancement of convection; Generally ZA curve until Cirrus levelMesoscale convective complex (MCC)Mesoscale convective complex (MCC) definition based on MB curve

Satellite Imagery Interpretation
From An Introduction toAn Introduction to Satellite Image InterpretationBy Eric D. Conway

Satellite Imagery Interpretation
MB curve

Satellite Imagery Interpretation
MB curve – basis of MCC definition

Satellite Imagery Interpretation
From An Introduction toAn Introduction to Satellite Image InterpretationBy Eric D. Conway

Satellite Imagery Interpretation
BD curveAllows for enhancement of hurricanes;Allows for enhancement of hurricanes; More detail in cloud top temps between eye and eyewalleye and eyewall

Satellite Imagery Interpretation
From An Introduction toAn Introduction to Satellite Image InterpretationBy Eric D. Conway

Satellite Imagery InterpretationFromFrom An Introduction to Satellite Image InterpretationBy Eric D ConwayBy Eric D. Conway

Satellite Imagery InterpretationWater Vapor is a good absorber of 6.8 μm E.
more vapor
greater absorption
lower E (reaching satellite)
l (S f l )lower T (Stefan-Boltzmann)
brighter whiteCorresponds to ~400-mb flowpattern
Satellite Imagery Interpretation
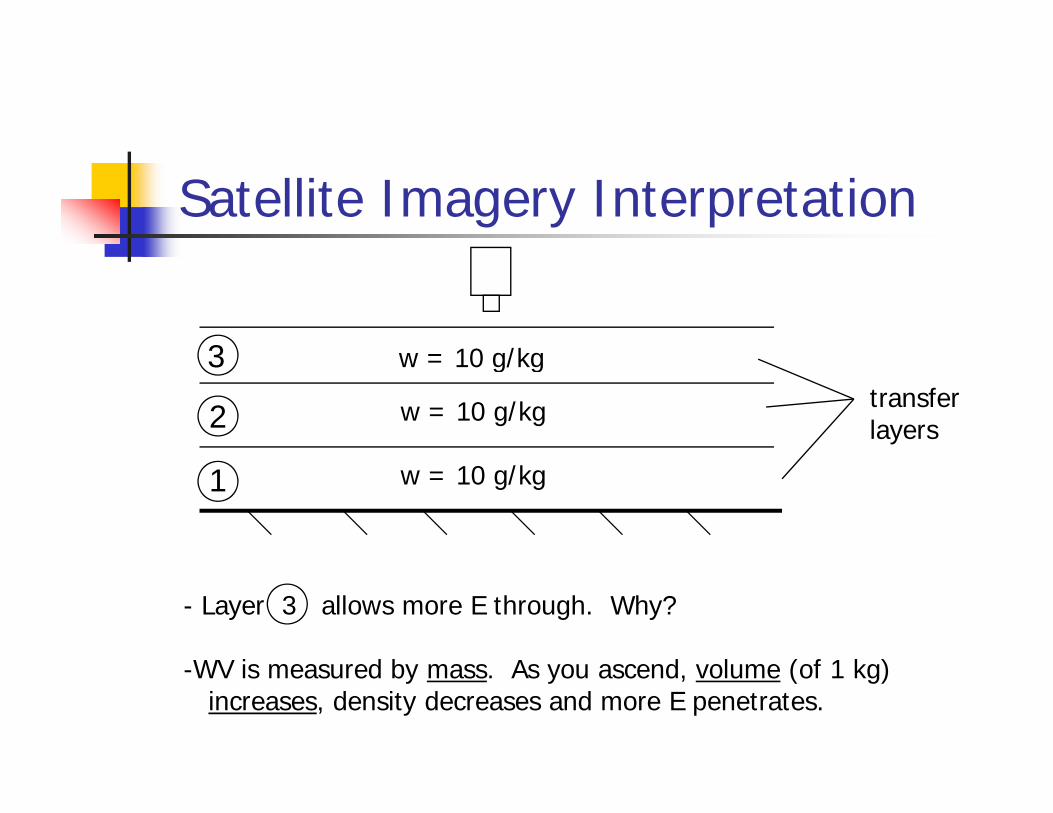
3 w = 10 g/kg
2
3 w = 10 g/kg
w = 10 g/kg transferlayers
1 w = 10 g/kg
- Layer 3 allows more E through. Why?
WV i d b A d l ( f 1 k )-WV is measured by mass. As you ascend, volume (of 1 kg)increases, density decreases and more E penetrates.

Satellite Imagery Interpretation
moist dry
Low E Mid ELow EL E
Mid E
dry
dry
moist
Low E
L E
Mid EMid E
moist dryLow E
- Due to the reduced density, E leaves 2nd moist layer about the same way as it entered.

Synoptic Scale Cloud Bands
Deformation Zones:Tend to hide in flow fieldTend to hide in flow fieldNot always easy to see (w/o other aids, like clouds)like clouds)

Synoptic Scale Cloud Bands
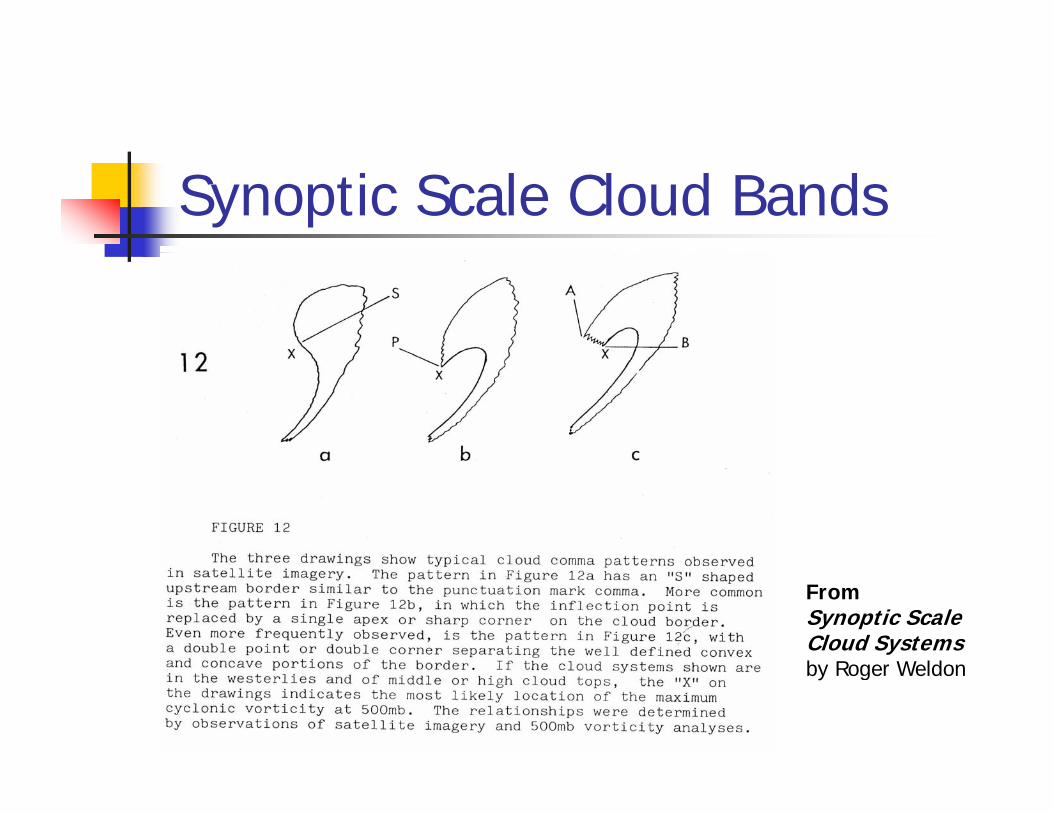
FromFrom Synoptic Scale Cloud Systemsby Roger Weldon

Synoptic Scale Cloud BandsBaroclinic Leaf
Early stage of surface cyclogenesisAssociated w/frontogenetic stage of storm development75% of leaf cloud systems evolve to comma systems

Synoptic Scale Cloud Bands
From Synoptic ScaleSynoptic Scale Cloud Systemsby Roger Weldon

Synoptic Scale Cloud BandsBaroclinic Leaf

Synoptic Scale Cloud BandsComma Pattern:
S shape in cloud pattern, assoc. with cyclogenesis.Max tangent velocity near to center500 b t ft f d t i fl ti t f500 mb vort. max often found at inflection pt. of S shapeNote:Note:
Comma clouds w/o jet stream cirrus typical w/large UA low ---- left of jet.Comma cloud w/ jet stream cirrus typical w/newComma cloud w/ jet stream cirrus typical w/new comma formation just left of jet stream.
Synoptic Scale Cloud Bands
From Synoptic Scale Cloud Systemsb R W ldby Roger Weldon

Synoptic Scale Cloud Bands
Comma Pattern:

Global Positioning System Meteorology
GPS signals are:delayed and refracted by atm gasses as they propagate from GPS satellites to Earth-based receivers.from GPS satellites to Earth based receivers.
1. Water vapor produces a significant and unique delaydelay
Only common atm constituent having a permanent dipole momentDipole moment caused by asymmetric charge distributionDipole moment caused by asymmetric charge distribution in water moleculeRetards propagation of electromagnetic radiation in the atm

Global Positioning System Meteorology
2. Refractivity of WV is ~17 times greater than that of dry air.
Th t f ti it i iti t th fThe atm refractivity is very sensitive to the presence of WV.WV introduces a delay in propagation of microwave
di ti t th b d GPS iradiation to earth-based GPS receivers.
“wet delay”
“wet delay” nearly α integrated vapor along signal path
- Liquid water & ice are largely not a factor. Why?q g y y- Hydrogen bond between water molecules reduces the contribution of dipole moment to delay.

Global Positioning System Meteorology
Refractivity may also be used to profile an atm pressure and temp
1. Coherent dual-band radio signals transmitted by ground station to satellite on far side of planet.
2. Signals are bent thru atm or way back to planet surface
3. Receiver (ground station) picks up signal
4 The two way differential phase measurements are used to4. The two-way differential phase measurements are used to retrieve profiles of atm temp and pressure.

Global Positioning System MeteorologyC tlCurrently
One may also employ geostationary satellites w/GPS transmitters w/ GPSsatellites w/GPS transmitters w/ GPS receivers on Low Earth Orbit (LEO) satellites:satellites:
a. LEO tracks GPS satellite as it occults Earth’s atm
b. Arrival time of GPS signal at receiver delayed:-refractive bending and slowing of signal

Global Positioning System MeteorologyC tlCurrently
Measure change in carrier phase own entirec. Measure change in carrier phase own entire occultation event
d. Determine atm refractive index as function of altitude

Global Positioning System MeteorologyC tlCurrently
T d fil d i d i d de. T and p profiles derived via downward integration using
i) linear relationship btwn refractivity and ρairi) linear relationship btwn refractivity and ρairii) gas law iii) hydrostatic assumption
only in trop.only in trop.away frommoisture

Global Positioning System Meteorology
GPS Strengths
Profiles of atmospheric q (and T and P) available with greater spatial density.available with greater spatial density.
Have greater temporal densityHave greater temporal density~ hourly profiles

Global Positioning System Meteorology
GPS Weaknesses
Significant lateral (spacial) averaging
Earth-based observing provides continuous measurements at fixed location
GPS discrete in timeGPS discrete in time
Space-based measurements subject to p ji. Mountain obstructionsii. Adjacent low-lying areas
much of lower tropmay not be visible

Global Positioning System Meteorology
SuomiNet: Real time GPS for atm monitoringNamed for Verner Suomi
meteo satellite pioneer