satellite-based estimates ofbased estimates of groundwater ... story/sdn/water... ·...
TRANSCRIPT

SatelliteSatellite--based Estimates ofbased Estimates ofSatelliteSatellite based Estimates of based Estimates of Groundwater Depletion Groundwater Depletion
Matt Matt Rodell, Ph.D.Rodell, Ph.D.
Chief, Hydrological Chief, Hydrological Sciences Sciences LaboratoryLaboratoryNASA Goddard Space Flight NASA Goddard Space Flight CenterCenter
Greenbelt MDGreenbelt MD
Matt RodellMatt RodellNASA GSFCNASA GSFC
Greenbelt, MDGreenbelt, MD

Groundwater MonitoringGroundwater Monitoring
Matt RodellMatt RodellNASA GSFCNASA GSFC

Inadequacy of Surface Observations Inadequacy of Surface Observations
Global Telecommunication System meteorological stations. Air temperature, precipitation, solar radiation, wind speed, and humidity only.
Eight countries make groundwater data publicly available through the Global Groundwater Monitoring Network.
USGS Groundwater Climate Response Network. River flow observations from the Global Runoff Data Centre. Lighter circles indicate greater latency in the data record.
Matt RodellMatt RodellNASA GSFCNASA GSFC
Issues include coverage gaps, delays, measurement continuity and consistency, data format and QC, political restrictions

NASA Earth Science MissionsCurrent & PlannedCurrent & Planned
Highly relevant to hydrology
Matt RodellMatt RodellNASA GSFCNASA GSFC

Soil MoistureSoil MoistureSnow Ice RainfallSnow Ice Rainfall SnowSnow
VegetationVegetationRadiationRadiation
Gravity Recovery and Climate Experiment (GRACE)Gravity Recovery and Climate Experiment (GRACE)
Snow, Ice, RainfallSnow, Ice, Rainfall SnowSnow
Aqua: MODIS, AMSR EAMSR-E, etc.
Traditional Traditional radiation-based remote sensing technologies gcannot sense water below the first few centimeters of the snow-canopy-soil
l
Matt RodellMatt RodellNASA GSFCNASA GSFC
column

Soil MoistureSoil MoistureSnow Ice RainfallSnow Ice Rainfall SnowSnow
VegetationVegetationRadiationRadiation
Gravity Recovery and Climate Experiment (GRACE)Gravity Recovery and Climate Experiment (GRACE)
Snow, Ice, RainfallSnow, Ice, Rainfall SnowSnow
Aqua: MODIS, AMSR EAMSR-E, etc.
GRACE
GRACE is unique in its ability to ability to monitor water at all levels, down to the deepest
Matt RodellMatt RodellNASA GSFCNASA GSFC
to the deepest aquifer

Gravity Recovery and Climate Experiment (GRACE)Gravity Recovery and Climate Experiment (GRACE)
• Two identical satellites flying in tandem, near-polar orbit, ~200 km apart, 500 km initial altitude
Matt RodellMatt RodellNASA GSFCNASA GSFC
initial altitude• Distance between satellites tracked by K-band microwave ranging system• Launched 17 March 2002

450 Snow Water Equivalent
Top 2m Soil Moisture
Terrestrial Water Storage VariationsTerrestrial Water Storage Variations
200250300350400
Stor
age,
mm
Top 2m Soil Moisture
Deep SM and Groundwater
050
100150
83 84 85 86 87 88 89 90 91 92 93 94 95 96 97 98 99 00 01 02 03 04 05
Wat
er S
Updated from Rodell and Famiglietti, WRR, 2001
Jan-
8
Jan-
8
Jan-
8
Jan-
8
Jan-
8
Jan-
8
Jan-
8
Jan-
9
Jan-
9
Jan-
9
Jan-
9
Jan-
9
Jan-
9
Jan-
9
Jan-
9
Jan-
9
Jan-
9
Jan-
0
Jan-
0
Jan-
0
Jan-
0
Jan-
0
Jan-
0
Top: 23 year time series of snow, soil se es o s o , somoisture, and groundwater storage in Illinois, USA (right)
TWS variations are dominated by:Soil moisture in temperate regions;Snow in polar and alpine regions;S f t i tl d
Matt RodellMatt RodellNASA GSFCNASA GSFC
Surface water in wetlands.

GRACE T t i lGRACE T t i lGRACE Terrestrial GRACE Terrestrial Water Storage Water Storage
Anomalies, Anomalies, ,,20032003--2013 2013
Top: Monthly terrestrial water p ystorage anomalies (equivalent height of water in cm), derived from GRACE CSR RL05 data with 300 km smoothing g(unscaled), available from http://grace.jpl.nasa.gov(Landerer and Swenson, Wat. Resour. Res., 2012)., )
Bottom: Same as top, with seasonal cycle removed.
Matt RodellMatt RodellNASA GSFCNASA GSFCMatt RodellMatt RodellNASA GSFCNASA GSFC

Emerging Trends in Terrestrial Water Storage from GRACEEmerging Trends in Terrestrial Water Storage from GRACE
• “Trends” in GRACE derived terrestrial water storage, 2002-2014.• Best fit linear rate of change of TWS (cm/yr).
cm/yr
Matt RodellMatt RodellNASA GSFCNASA GSFC
Best fit linear rate of change of TWS (cm/yr).• Based on land hydrology product from GRACE Tellus (CSR RL05). • Which apparent trends are real and likely to continue?

Exploitation of Water ResourcesExploitation of Water ResourcesNet Consumptive Use of Ground and Surface Waters,
Percentage of Irrigated Areap ,
1998-2002
Terrestrial Water Storage “Trends” from GRACE
Source: FAO and University of Frankfurt
Groundwater Depletion Rate (ca. 2000)
Equivalent height of water (mm/yr)
Döll et al. (2011)
Terrestrial Water Storage Trends from GRACEp ( )
Wada et al. (2010)
Matt RodellMatt RodellNASA GSFCNASA GSFC
Equivalent height of water (mm/yr)
Equivalent height of water (cm/yr)

Groundwater Depletion in Northern IndiaGroundwater Depletion in Northern India
20
30
y (c
m)
Total Terrestrial WaterSoil WaterGroundwaterGroundwater Trend
0
10
orag
e A
nom
aly Groundwater Trend
-30
-20
-10
Wat
er S
to
-30
Apr
-02
Apr
-03
Apr
-04
Apr
-05
Apr
-06
Apr
-07
Apr
-08
Apr
-09
Apr
-10
Apr
-11
Apr
-12
Apr
-13
Apr
-14
Date
GW = TWS – SM – SWE Groundwater continues to be depleted in the Indian states of Rajasthan, Punjab, and Haryana by about 16.0 km3/yr, reduced slightly from our
Matt RodellMatt RodellNASA GSFCNASA GSFCMatt RodellMatt RodellNASA GSFCNASA GSFC
j y y y g yprevious (2002-08) estimate of 17.7 ±4.5 km3/yr (Rodell, Velicogna, and Famiglietti, 2009).

Growth of Irrigation in Saudi ArabiaGrowth of Irrigation in Saudi Arabia
Rate of change of water storage (cm/yr)
Matt RodellMatt RodellNASA GSFCNASA GSFCMatt RodellMatt RodellNASA GSFCNASA GSFC
Landsat images prepared by Aries Keck, NASA/GSFC

Groundwater Depletion in Saudi ArabiaGroundwater Depletion in Saudi Arabia
6
8
10
m)
Total Terrestrial WaterSoil WaterGroundwater
0
2
4
6
ge A
nom
aly
(cm Groundwater
Groundwater Trend
-8
-6
-4
-2
Wat
er S
tora
g
-10
Mar
-03
Mar
-04
Mar
-05
Mar
-06
Mar
-07
Mar
-08
Mar
-09
Mar
-10
Mar
-11
Mar
-12
Date
Preliminary estimate of groundwater depletion rate: 2.6 km3/yr.This includes the impact of a persistent drought in the region as
ate
Matt RodellMatt RodellNASA GSFCNASA GSFCMatt RodellMatt RodellNASA GSFCNASA GSFC
This includes the impact of a persistent drought in the region, as indicated by the soil water time series.

Groundwater Depletion in the North China PlainGroundwater Depletion in the North China Plain
4
6
8
10
mal
y (c
m)
Total Terrestrial WaterSoil WaterGroundwaterGroundwater Trend
4
-2
0
2
Stor
age
Ano
m
-10
-8
-6
-4
3 4 5 6 7 8 9 0 1 2
Wat
er S
Mar
-03
Mar
-04
Mar
-05
Mar
-06
Mar
-07
Mar
-08
Mar
-09
Mar
-10
Mar
-1
Mar
-12
Date
Preliminary estimate of groundwater depletion rate: 4.9 km3/yr.Estimate likely would increase if properly scaled to account for leakage.
Matt RodellMatt RodellNASA GSFCNASA GSFCMatt RodellMatt RodellNASA GSFCNASA GSFC
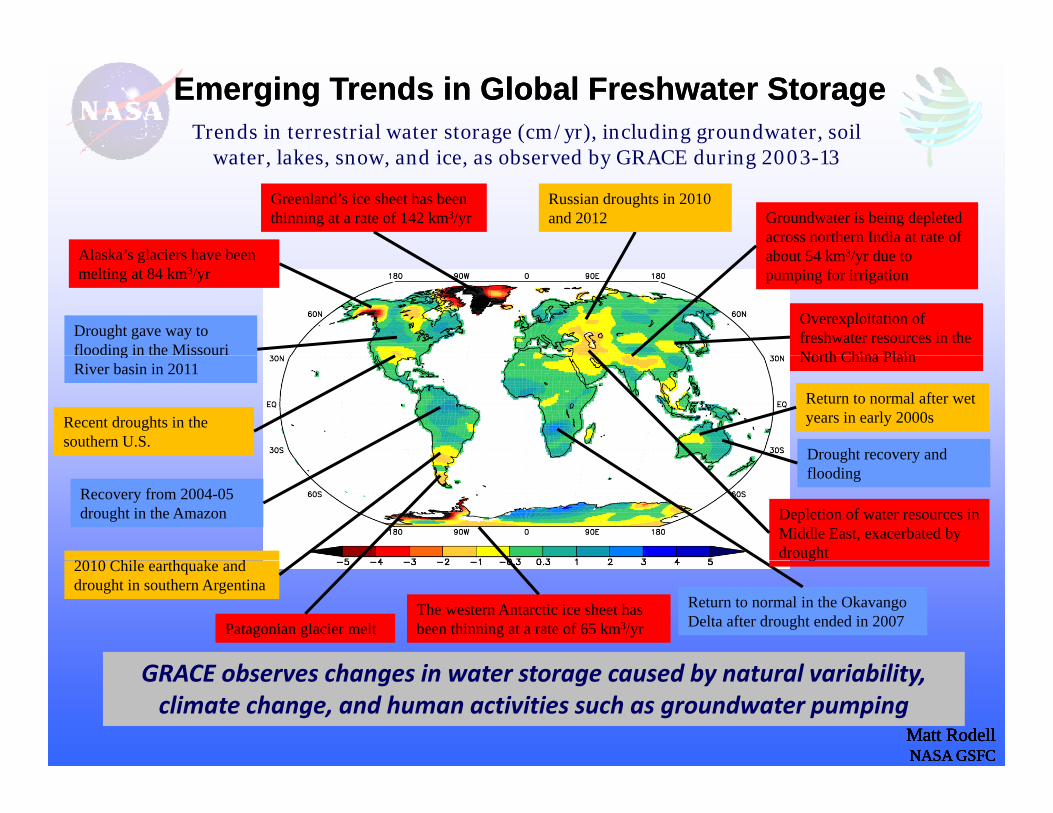
Emerging Trends in Global Freshwater StorageEmerging Trends in Global Freshwater StorageTrends in terrestrial water storage (cm/yr), including groundwater, soil
l k d i b d b GRACE d i water, lakes, snow, and ice, as observed by GRACE during 2003-13
Greenland’s ice sheet has been thinning at a rate of 142 km3/yr
Alaska’s glaciers have been
Groundwater is being depleted across northern India at rate of b t 54 k 3/ d t
Russian droughts in 2010 and 2012
Alaska’s glaciers have been melting at 84 km3/yr
about 54 km3/yr due to pumping for irrigation
Overexploitation of freshwater resources in the North China Plain
Drought gave way to flooding in the Missouri
Recent droughts in the southern U.S.
Return to normal after wet years in early 2000s
Drought recovery and
North China PlaingRiver basin in 2011
Recovery from 2004-05 drought in the Amazon
Drought recovery and flooding
Depletion of water resources in Middle East, exacerbated by drought
2010 Chil h k d
The western Antarctic ice sheet has been thinning at a rate of 65 km3/yr
Return to normal in the Okavango Delta after drought ended in 2007
g2010 Chile earthquake and drought in southern Argentina
Patagonian glacier melt
Matt RodellMatt RodellNASA GSFCNASA GSFCMatt RodellMatt RodellNASA GSFCNASA GSFC
GRACE observes changes in water storage caused by natural variability, climate change, and human activities such as groundwater pumping

Land Surface Land Surface Models (LSMs)Models (LSMs)
LSMs solve for the interaction of energy, momentum, and mass between the surface and the atmosphere in each
d l l t ( id ll) t h
SUBGRID HETEROGENEITY
SURFACE VEGETATION
ATMOSPHERE
model element (grid cell) at each discrete time-step (~15 min)
10%
GRASSLAND:50%
SHRUBS:
NEEDLELEAFTREES: 25%GRID
HETEROGENEITY TRANSFER SCHEME
System of physical equations: Surface energy conservation equation
BARE SOIL: 15%
Surface energy conservation equationSurface water conservation equationSoil water flow: Richards equationEvaporation: Penman-Monteith equation
Input - Output = Storage ChangeP + Gin –(Q + ET + Gout) = ΔS
Matt RodellMatt RodellNASA GSFCNASA GSFC
Evaporation: Penman Monteith equationetc.
in ( out)Rn - G = Le + H

Summary of Output Fields: Input Parameters:
LSM Input and Output FieldsLSM Input and Output Fields
soil moisture in each layersnow water equivalent
soil temperature in each layer
Input Parameters:vegetation classvegetation greenness/LAIsoil type
Required Forcing Fields:
p ysurface and subsurface runoff
evaporationtranspiration
soil typeelevation
Required Forcing Fields:total precipitationconvective precipitationdownward shortwave radiation
transpirationlatent, sensible, and ground heat fluxes
snowmeltf ll d i f lldownward shortwave radiation
downward longwave radiationnear surface air temperature
f ifi h idit
snowfall and rainfallnet shortwave and longwave radiation
near surface specific humiditynear surface wind speed (U & V)surface pressure
Matt RodellMatt RodellNASA GSFCNASA GSFC

GRACE Data Assimilation for Drought MonitoringGRACE Data Assimilation for Drought Monitoring
GRACE terrestrial water storage
anomalies (cm equivalent height of
water) for June 2007water) for June 2007.
New process integrates data from GRACE and other satellites to produce timely information on wetness conditions at all levels in the soil column, including groundwater. For current maps and more info, see http://www drought unl edu/MonitoringTools aspx U.S. Drought Monitor product for 26 July 2007. http://www.drought.unl.edu/MonitoringTools.aspx
Surface Soil Moisture Root Zone Soil Moisture Groundwater
Matt RodellMatt RodellNASA GSFCNASA GSFCMatt RodellMatt RodellNASA GSFCNASA GSFC
Drought indicators from GRACE data assimilation (wetness percentiles relative to the period 1948-present) for 26 June 2007.

Indicators of Drought Based on GRACE Data AssimilationIndicators of Drought Based on GRACE Data Assimilation
Matt RodellMatt RodellNASA GSFCNASA GSFC
http://svs.gsfc.nasa.gov/vis/a030000/a030100/a030177/
D t th i l t f d b d b ti b d
Summary and Future ProspectsSummary and Future Prospects
• Due to the incompleteness of ground-based observations, space-based observation of global freshwater resources is critical.
• NASA’s GRACE satellite mission is unique in its ability to monitor all forms of water at all depths, including groundwater.• Emerging trends in terrestrial water storage observed by GRACE during 2002-14 can be categorized as natural variations, climate change impacts, 4 g , g p ,or direct consequences of human activities, particularly irrigation.• The value of GRACE and other satellite data for applications such as drought monitoring can be enhanced by combining them within a land g g y gsurface model.• The GRACE Follow-On mission is scheduled to launch in August 2017.
Matt RodellMatt RodellNASA GSFCNASA GSFC

htt // t d / / d ti / GRACE d ti l t i l
Data, Visualization, Educational MaterialsData, Visualization, Educational Materials
http://www.csr.utexas.edu/grace/education/ - GRACE educational materials
http://gracetellus.jpl.nasa.gov/data/gracemonthlymassgridsland/ - GRACE data, images, and animations
http://smap.jpl.nasa.gov/ - Soil Moisture Active Passive Mission
http://trmm.gsfc.nasa.gov/ - Tropical Rainfall Measurement Mission
http://pmm nasa gov/GPM/ Global Precipitation Measurement Missionhttp://pmm.nasa.gov/GPM/ - Global Precipitation Measurement Mission
http://www.pecad.fas.usda.gov/cropexplorer/global_reservoir - Satellite based monitoring of lake and reservoir levels
http://disc.sci.gsfc.nasa.gov/giovanni/overview/index.html - Giovanni Earth science data visualization tool
http://drought.unl.edu – National Drought Mitigation Center
http://wmp.gsfc.nasa.gov/international/collaborations.php - NASA/GSFC Water Resources Applications Projects
http://www nasa gov/topics/earth/features/india water html - Feature on Indian
Matt RodellMatt RodellNASA GSFCNASA GSFC
http://www.nasa.gov/topics/earth/features/india_water.html Feature on Indian groundwater depletion detected by GRACE