sat suite of assessments – score reporting · english and is free or virtually free of : ......
TRANSCRIPT

SAT Suite of Assessments – Score Reporting
2015-16

*Please note: All subscores are tentative and subject to research.
SAT Scores and Subscores
2

Longitudinal Progress Monitoring
+ This same concept will hold true for the Test and Cross-
Test Scores as well as Total Score.
+ Section Scores will be placed on a vertical scale.
3

+ Essay scoring will consist of 3 subscores:
SAT Essay Scores
Reading
2 – 8 Scale
Analysis
2 – 8 Scale
Writing
2 – 8 Scale

Score Reading Analysis WritingPoint
4 Advanced: The response Advanced: The response offers Advanced: The response is cohesive and demonstrates thorough an insightful analysis of the demonstrates a highly effective use and comprehension of the source source text and demonstrates a command of language.text. sophisticated understanding of
the analytical task. The response includes a precise central The response shows an claim.understanding of the text’s The response offers a thorough, central idea(s) and of most well-considered evaluation of The response includes a skillful important details and how they the author’s use of evidence, introduction and conclusion. The response interrelate, demonstrating a reasoning, and/or stylistic and demonstrates a deliberate and highly comprehensive understanding persuasive elements, and/or effective progression of ideas both within of the text. feature(s) of the student’s own paragraphs and throughout the essay.
choosing.The response is free of errors of The response has a wide variety in fact or interpretation with The response contains relevant, sentence structures. The response regard to the text. sufficient, and strategically demonstrates a consistent use of precise
chosen support for claim(s) or word choice. The response maintains a The response makes skillful use point(s) made. formal style and objective tone.of textual evidence (quotations, paraphrases, or The response focuses The response shows a strong command of both), demonstrating a consistently on those features the conventions of standard written complete understanding of the of the text that are most English and is free or virtually free of source text. relevant to addressing the task. errors.
SAT Essay Rubric
Complete Rubric: https://collegereadiness.collegeboard.org/sat-suite-assessments/practice/essay/scoring

► Student Reporting Portal
► A centralized portal for students to access their PSAT 8/9, PSAT/NMSQT, PSAT 10, and SAT score reports.
► Educator Reporting Portal
► A centralized portal for schools, districts, states
► Report Center: Reporting tools allow educators to configure and run
online reports, apply filters for data analysis, and print student reports
► Download Center: Data files available to manage electronic score
downloads – manual and automatic
► Paper Score Reports
6
Delivering Scores

Student Reports

Assessments Score Reporting Data Portal
+ Student Reports
- Central location to access all College Board’s SAT Suite of Assessment
reports:
PSAT/NMSQT, PSAT 8/9 – In Fall 2015
SAT, SAT Subject, PSAT 10 – In Spring 2016
- Replaces current My College QuickStart
+ Report samples reflect PSAT/NMSQT however reporting will be
consistent for SAT as well.
8
NOTE: All reports are subject to change and should not be considered final

Student Report Demo Site
► To see an example of what the online student You can access
the student reporting demo site by going to:
studentscores.collegeboard.org/viewscore
► studentscores.collegeboard.org/viewscore
Student Score Reports

Student Reports - Dashboard
+ Consolidated view of
all assessment scores
+ Brief overview of each
assessment including
grade and year taken
plus top level section
scores
+ Includes pre-2015
PSAT/NMSQT scores
- ‘Report Details’ less
detailed for pre-2015
PSAT/NMSQT
10
NOTE: All reports are subject to change and should not be considered final.
Reports shown are illustrations, and all data is fictitious.

Student Reports – Report Detail
+ Detailed information of all
scores
+ College Readiness Benchmark
of the two section scores –
Evidence-based Reading and
Writing and Math
+ Projected score range on next
assessment
+ Percentile rankings
+ Performance based on
benchmarks for individual
scores:
- Need to strengthen skills
- Approaching benchmark
- Meets or exceeds benchmark
+ Tallies of correct and incorrect
answers
11
NOTE: All reports are subject to change and should not be considered final.
Reports shown are illustrations, and all data is fictitious.

Student Reports – Section Score Messages
12
Red
Your scores indicate you need to strengthen your college
readiness skills.
Let’s get you back on track, so you won’t have to take non-credit courses
in college. You have free, personalized recommendations waiting for you
on KhanAcademy.org/sat
Yellow
Your scores indicate you are close to being on track for college readiness,
but you need to continue to strengthen your skills.
Let’s get you back on track, so you won’t have to take non-credit courses
in college. You have free, personalized recommendations waiting for you
on KhanAcademy.org/sat
Green
You are on track for college readiness.
Stay on track and continue your progress. Start now with your free,
personalized recommendations waiting for you on KhanAcademy.org/sat

Student Reports – Performance Zones
+ Section, Test, and Subscores all
report scores against performance
zones
+ Need to Strengthen Skills = below
grade-level benchmark by more than
one year
+ Approaching Benchmark = below
grade-level benchmark by one year or
less
+ Meets or exceeds Benchmark = at or
above grade-level benchmark
+ Based on Section-level benchmarks, and average scores of students
against benchmarks
+ The red, yellow, and green ranges in the test scores/ subscores reflect
areas of strengths and weaknesses compared to the typical
performance of students

Student Reports – Projection Graphs
+ Score projection for ‘next’ test
will be available online
+ Initially projection is based on
average growth of 10th to 90th
percentile students.
+ Same grade-level +/- range for
all students (not based on
student’s score)
+ Graph in year 2+ will include
multiple redesigned scores
over time.
NOTE: All reports are subject to change and should not be considered final.
Reports shown are illustrations, and all data is fictitious.

+ Detailed explanation of
current college
readiness skills, based
on test score band and
typical students
+ Actionable steps to
improve on skills
required to be college
ready
+ Each skill linked to
applicable subscore
categories
15
Student Reports – Skills Insight
NOTE: All reports are subject to change and should not be considered final.
Reports shown are illustrations, and all data is fictitious.

Educator Reports – States, Districts, & Schools

Educator Reports – Centralized Reporting/Data Portal
+ A centralized portal for Schools,
Districts, States
- Launched July 20, and ‘open’ to
K12 Educators August 3
- SAT Electronic Scores in Oct 2015
- PSAT/NMSQT, PSAT 8/9 scores
in Fall 2015
- SAT, SAT Subject Tests, PSAT 10
in Spring 2016
+ Reporting tools allow Educators
to easily configure and run online
reports and apply filters for data
analysis
+ Download Center available to
manage electronic score
downloads – manual and
automatic
17NOTE: All reports are subject to change and should not be considered final.
Reports shown are illustrations, and all data is fictitious.

Educator Reports – Download Center
+ Score data files,
downloadable via portal or
web service
- SAT Electronic Score
Reports
- PSAT/NMSQT (formerly
CDs)
- PSAT 10
- PSAT 8/9
+ Comma Delimited or Fixed
Width format
+ Email notification when new
files are posted
+ Tracks who downloaded file
18NOTE: All reports are subject to change and should not be considered final.
Reports shown are illustrations, and all data is fictitious.
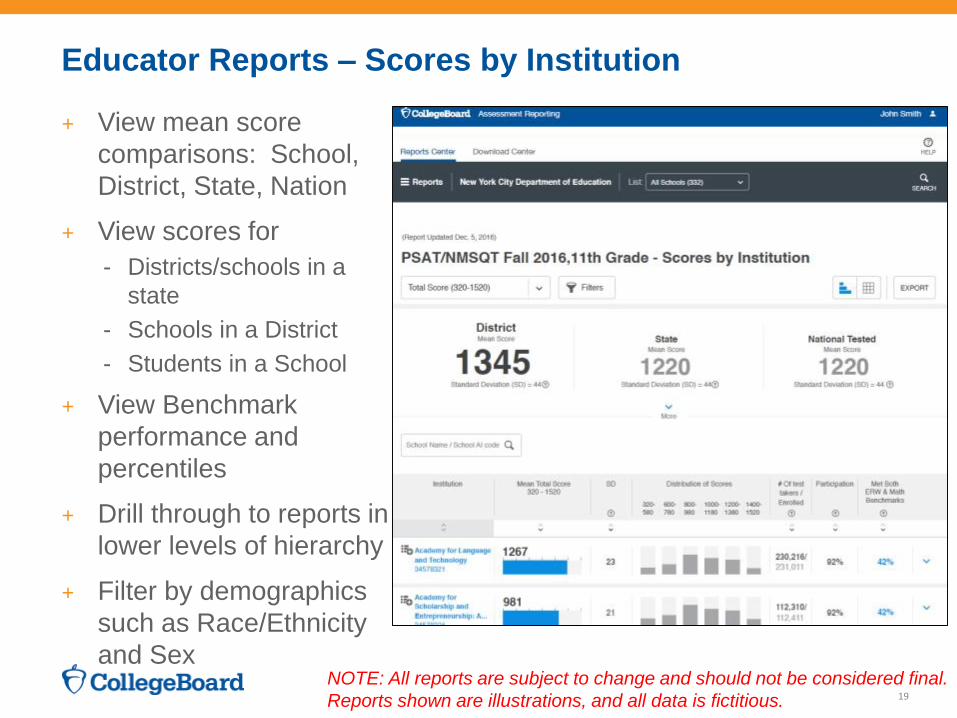
Educator Reports – Scores by Institution
+ View mean score
comparisons: School,
District, State, Nation
+ View scores for
- Districts/schools in a
state
- Schools in a District
- Students in a School
+ View Benchmark
performance and
percentiles
+ Drill through to reports in
lower levels of hierarchy
+ Filter by demographics
such as Race/Ethnicity
and Sex
19
NOTE: All reports are subject to change and should not be considered final.
Reports shown are illustrations, and all data is fictitious.

Educator Reports – Scores by Institution
+ Multiple views provided
based on user type and
role
+ Individuals can drill up
and down their hierarchy
to view the same report
for a State, District, and
School
NOTE: All reports are subject to change and should not be considered final.
Reports shown are illustrations, and all data is fictitious.

Educator Reports – Scores by Institution (More Info)
+ Expand “More Info” views
to view participation,
benchmark, and score
statistics in one place
NOTE: All reports are subject to change and should not be considered final.
Reports shown are illustrations, and all data is fictitious.

Educator Reports – Scores by Institution (More Info)
+ Expand “More Info” views
to view participation,
benchmark, and score
statistics in one place
NOTE: All reports are subject to change and should not be considered final.
Reports shown are illustrations, and all data is fictitious.

Educator Reports – Scores by Demographics
+ View mean scores by
demographics
- Up to two demographic
levels available
+ View Benchmark
performance by
demographics
+ Filter by demographics
such as Race/Ethnicity
and Sex
23
NOTE: All reports are subject to change and should not be considered final.
Reports shown are illustrations, and all data is fictitious.

Educator Reports – Scores by Demographics
+ View mean scores by
demographics
- Up to two demographic
levels available
+ View Benchmark
performance by
demographics
+ Filter by demographics
such as Race/Ethnicity
and Sex
24
NOTE: All reports are subject to change and should not be considered final.
Reports shown are illustrations, and all data is fictitious.

Educator Reports – Scores Roster
+ View score roster
summaries with high
level details for a
State, District and
School
+ Drill down to a detail
Score Roster report for
a School
25NOTE: All reports are subject to change and should not be considered final.
Reports shown are illustrations, and all data is fictitious.

Educator Reports – Scores Roster
+ Score Roster
- Easy to export to
excel
- Several data points to
hide/show
- Drill to Student Level
Report
NOTE: All reports are subject to change and should not be considered final.
Reports shown are illustrations, and all data is fictitious.

Educator Reports – Student Longitudinal Information
+ Students score history
for all SAT Suite
available in one place
+ Redesigned
assessments will have
detailed score
information, mimicking
students’ view
+ Pre-redesigned
assessments will have
high-level scores only
27NOTE: All reports are subject to change and should not be considered final.
Reports shown are illustrations, and all data is fictitious.

Educator Reports – Student Longitudinal Information
+ Students score history
for all SAT Suite
available in one place
+ Redesigned
assessments will have
detailed score
information, mimicking
students’ view
+ Pre-redesigned
assessments will have
high-level scores only
28NOTE: All reports are subject to change and should not be considered final.
Reports shown are illustrations, and all data is fictitious.
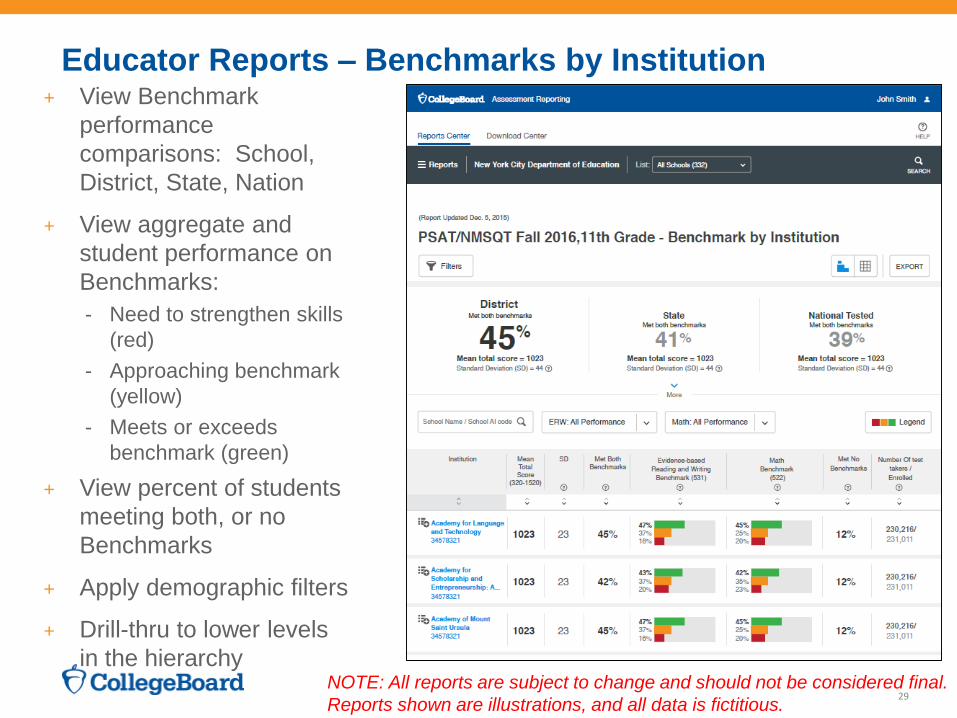
Educator Reports – Benchmarks by Institution+ View Benchmark
performance
comparisons: School,
District, State, Nation
+ View aggregate and
student performance on
Benchmarks:
- Need to strengthen skills
(red)
- Approaching benchmark
(yellow)
- Meets or exceeds
benchmark (green)
+ View percent of students
meeting both, or no
Benchmarks
+ Apply demographic filters
+ Drill-thru to lower levels
in the hierarchy
29NOTE: All reports are subject to change and should not be considered final.
Reports shown are illustrations, and all data is fictitious.

Educator Reports – Benchmarks by Institution+ View Benchmark
performance
comparisons: School,
District, State, Nation
+ View aggregate and
student performance on
Benchmarks:
- Need to strengthen skills
(red)
- Approaching benchmark
(yellow)
- Meets or exceeds
benchmark (green)
+ View percent of students
meeting both, or no
Benchmarks
+ Apply demographic filters
+ Drill-thru to lower levels
in the hierarchy
30NOTE: All reports are subject to change and should not be considered final.
Reports shown are illustrations, and all data is fictitious.

Educator Reports – Benchmarks by Demographics
+ View Benchmark
performance for: School,
District, State, Nation
+ View aggregate
performance by
demographic groups on
Benchmarks:
- Need to strengthen skills
(red)
- Approaching benchmark
(yellow)
- Meets or exceeds
benchmark (green)
+ View percent of students
meeting both, or no
Benchmarks
+ Apply demographic filters
31NOTE: All reports are subject to change and should not be considered final.
Reports shown are illustrations, and all data is fictitious.

Educator Reports – Benchmarks by Demographics
+ View Benchmark
performance for: School,
District, State, Nation
+ View aggregate
performance by
demographic groups on
Benchmarks:
- Need to strengthen skills
(red)
- Approaching benchmark
(yellow)
- Meets or exceeds
benchmark (green)
+ View percent of students
meeting both, or no
Benchmarks
+ Apply demographic filters
32NOTE: All reports are subject to change and should not be considered final.
Reports shown are illustrations, and all data is fictitious.

Educator Reports – Instructional Planning
+ Provides breakout of
student performance, in
each Section, Test, and
Subscores:
- Need to strengthen
skills (red)
- Approaching
benchmark (yellow)
- Meets or exceeds
benchmark (green)
+ At school-level, ability to
see student in each
performance group
+ See state standards for
subscores
+ Drill-thru to Question
Analysis report
33
NOTE: All reports are subject to change and should not be considered final.
Reports shown are illustrations, and all data is fictitious.

Educator Reports – Instructional Planning
+ Provides breakout of
student performance, in
each Section, Test, and
Subscores:
- Need to strengthen
skills (red)
- Approaching
benchmark (yellow)
- Meets or exceeds
benchmark (green)
+ At school-level, ability to
see student in each
performance group
+ See state standards for
subscores
+ Drill-thru to Question
Analysis report
34
NOTE: All reports are subject to change and should not be considered final.
Reports shown are illustrations, and all data is fictitious.

Educator Reports – Instructional Planning – Standards
+ See your state
standards for
Subscores
+ Note: Links to State
Standards are
provided anywhere
a Subscore is
reported
35
NOTE: All reports are subject to change and should not be considered final.
Reports shown are illustrations, and all data is fictitious.

Educator Reports – Question Analysis
+ See performance, by
question
+ For disclosed forms
- Individual answer choice
performance
- Link to actual question
content (including answer
explanations)
36
*Available only for disclosed forms. PSAT 8/9 is a non-disclosed form in 2015-2016. PSAT 10 and April SAT School Day are
disclosed forms.
NOTE: All reports are subject to change and should not be considered final.
Reports shown are illustrations, and all data is fictitious.

Educator Reports – Question Analysis
+ View student produced
responses
+ For non-disclosed
- % Correct/Incorrect
- No question content
provided
+ “Unscorable” questions
also displayed
+ Link to individual student
performance
37
*Available only for disclosed forms. PSAT 8/9 is a non-disclosed form in 2015-2016. PSAT 10 and April SAT School Day are
disclosed forms.
NOTE: All reports are subject to change and should not be considered final.
Reports shown are illustrations, and all data is fictitious.