sasol - 2004 - kitui sand dams construction and - samsamwater
TRANSCRIPT
1
SASOL FOUNDATION FIELD OFFICE LIASON OFFICE P.O. Box 85, Kitui, Kenya P.O. Box 14333, Nairobi, Tel: 254 - 044 -22873. Tel: 254-020-860772 or 802171 Email: [email protected] ______________________________________________________________________________________
KITUI SAND DAMS:
CONSTRUCTION AND OPERATION.
PRINCIPLES
JULIUS NZOMO MUNYAO JOSEPH MUINDE MUNYWOKI
MATHEW IKUTHU KITEMA DAVID NGUI KITHUKU
JOSEPH MUTINDA MUNGUTI SAMMY MUTISO
© SASOL 2004.

2
INTRODUCTION Quality of life in the drylands is determined by the ability to adapt to the existing situation. The most important of this is the shortage of water. There is an abundance of water in the short wet season. The long dry period is characterized by severe shortage of water. During this period water sources are few and far apart. Usually the sources of last resort are found deep under the dry sandy stream/riverbeds. These reservoir points are formed where an impermeable barrier across streams results in natural sand dams. Water is extracted from these reservoirs using scoop holes which maybe as deep as thirty feet or 10 metres more. Water is the greatest limiting factor of development in the drylands. During the dry season the households spent a disproportionably large amount of energy and time on water chores, resulting in the neglect of more important activities. Without water this situation will persist. Many communities have realized that water is their priority problem. It must be addressed for these communities to achieve development. These communities are also aware that only their involvement in solutions will create the appropriate solutions to their water problem. Indigenous knowledge stipulates that there is water in the sand. It is also known that streams without sand hold no water. By correlation therefore, sandy streams/rivers are important in solutions of water problems. Using this local knowledge of sources of water supplemented by scientific knowledge in construction techniques it is possible to make barriers which hold water in the sandy rivers. A cascade of barriers in a stream/river will form multiple sand dams increasing greatly the number of sources and amount of water held. Community involvement breeds ownership of the problem and the solutions thereof. Ownership of the problem leads to the participation in the solutions. To date communities in Kitui together with SASOL have constructed 500 sand dams serving more than 150,000 persons. The dams have been made using local materials with supplementary commercial inputs. The following is a chronicle of how the people of Kitui have been working on the Kitui sand dams programme.

3
SECTION 1
INSTITUTIONAL FACTORS
4
KITUI DISTRICT BACKGROUND
Location Kitui district is one of the twelve districts in eastern province of Kenya. It covers an area of 20,402 km2 (CBS, 2001). Its altitude ranges from 400 to 1800masl. The district borders Machakos and Makueni Districts to the west, Mwingi District to the North, Tana River District to the East and Taita Taveta Districts to the South .It is located between latitude 0 degree 37 inches and 3 degree 0 inches south and longitudes 37 degrees 45 inches and 39 degrees 0 inches East.
Population
The district consists of ten divisions whose total area is 20,402km2. The total population is 515,422. Table 1 below, culled from the 1999 Census, shows the population of each division, number of household (h/h) and the area occupied by each division. In “ Kitui Demographic Time Bomb” Leonard Kisovi writes: “… Kitui District is one of the Arid and Semi-Arid regions of Kenya with a worsening population resource balance. Its rapidly deteriorating population-resource balance is a product of limited resource base and an explosive demographic growth rate.” It is estimated that 60% of the households are female headed. (SASOL Socio and Economic Impacts, 2002). SASOL currently (2004) works in Central, Chuluni, Yatta, Mutomo and Mutha Divisions.
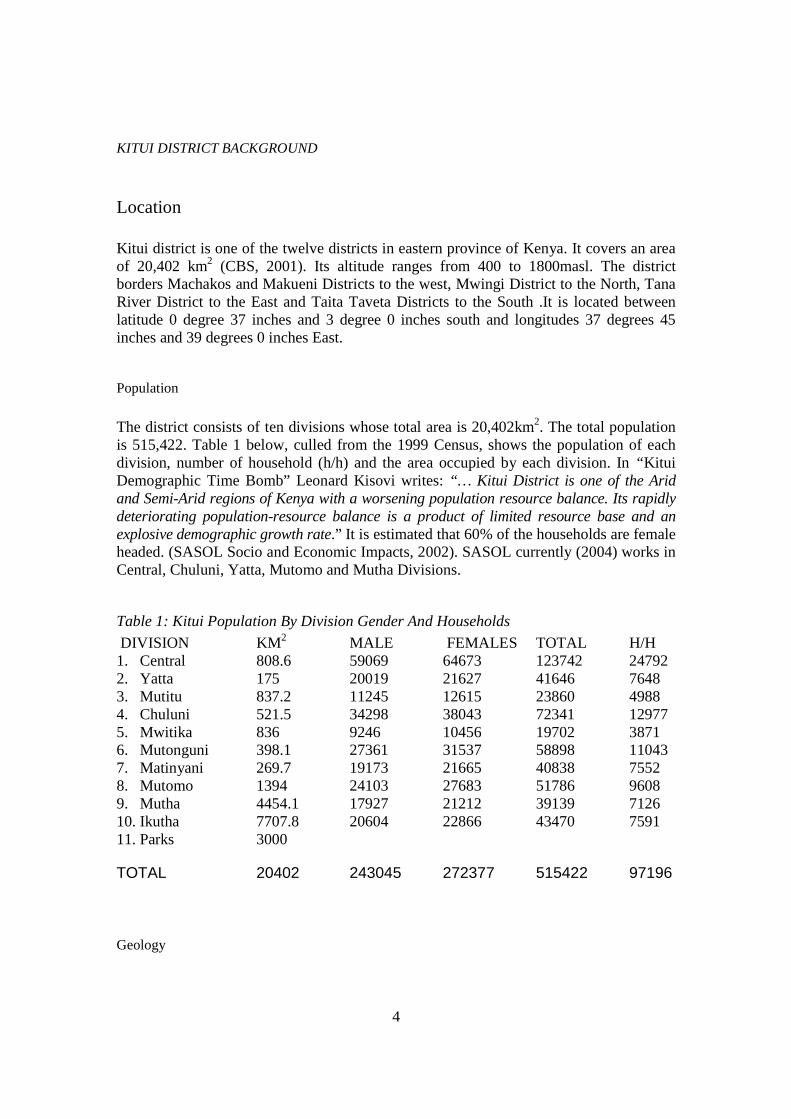
Table 1: Kitui Population By Division Gender And Households
DIVISION KM2 MALE FEMALES TOTAL H/H 1. Central 808.6 59069 64673 123742 24792 2. Yatta 175 20019 21627 41646 7648 3. Mutitu 837.2 11245 12615 23860 4988 4. Chuluni 521.5 34298 38043 72341 12977 5. Mwitika 836 9246 10456 19702 3871 6. Mutonguni 398.1 27361 31537 58898 11043 7. Matinyani 269.7 19173 21665 40838 7552 8. Mutomo 1394 24103 27683 51786 9608 9. Mutha 4454.1 17927 21212 39139 7126 10. Ikutha 7707.8 20604 22866 43470 7591 11. Parks 3000
TOTAL 20402 243045 272377 515422 97196
Geology

5
Metamorphic and igneous rocks of the basement complex system characterize the geology of the district. (Kisovi 1989). The southern side of the district is composed of Permian deposits and tertiary volcanics are predominant in the western part. These rocks hold extractable water only in small cells, which generally occurs in low areas near stream channels. The central part of the district has soil, which is mainly derived from the metamorphic rocks of the basement system although there are some small areas of black cotton soil [vertisols], which are tertiary sediments. These (vertisols) are usually high in fertility but are not intensively used because of lack of water and lack of appropriate land working technology. The eastern parts of the district have red sandy soils, which are low in natural fertility. These soils are very rich in sodium and are considered to be the best grazing grounds. Towards the western part of the district are black cotton soils. The vegetation of the district consists of natural grasses and shrubs of lantana camara and other species. The grasses and other species of plants have short life cycles to enable them take advantage of the short and unreliable rainy seasons.
Topography
The topography is undulating and gives way to plains towards the east. The Yatta plateau is towards the west. There are also the ranges of hills in the central part of the district. Various gneisses of the basement system are the bedrock and are exposed in the hills east of Kitui town, around Mutomo in the south and in the northeast at Makongo and Endau.
Rainfall
Kitui district is classified as semi-arid with rains being erratic in the better part of the district especially towards the south (Thomas D.B 1999). Rainfall is bimodal in nature with short rains occurring between October and December and long rains between March and May. The rainfall totals range between 250 mm to 750 mm per year. The hill masses, which constitute only 30 percent of the district, receive more rainfall while on the low lands which constitute 70 percent of the district, rainfall totals range from 250 mm to 500 mm. The rainfall received in Kitui is unreliable both in amount and distribution. Dry spells are common within the rainy seasons. Due to this, crop failure is a common occurrence. There is a prolonged dry period, from June to October, during which most of the vegetation sheds leaves and lies dormant. There are high temperatures that result to very high evaporation rates of water from the few available sources. The pan evaporation is estimated at above 2000 mm per year. River and ground water resources are scarce. River Athi, which forms the Western boundary of the district, is the only permanent river. The river is highly polluted with sewage and industrial wastes from the city of Nairobi. River Tiva to the east of Yatta

6
Plateau however flows as long as the rainfalls. It holds water for a long time after the rains in the sand, this dries out in prolonged drought Boreholes and wells have been constructed to lessen the water stress but the problem persists. A lot of homes have shallow wells most of which dry up during drought periods. Most boreholes are dry while others have saline water, that is unsuitable for human, livestock, and irrigation uses. The salinity problem is very severe in the southern part of the district especially Mutomo and Mutha division. CHOOSING THE APPROPRIATE TECHNOLOGY BY THE COMMUNIT Y :- TOWARDS SAND DAMS . All dry land life and survival is the result of adaptation of the conditions that exist. The consequence of increasing number and length of droughts as a result of rain failure is hunger for the people, lack of fodder for animals and critical shortage of water. This leads to destocking, thus removing major pillar supporting household well being. There is abundance of water in the ASALS during the short rainy season when water from the oceans is deposited in the land. Most of this water is usually lost through runoff back to the oceans. In mitigation against current and future droughts emanating from climate change, it is important to invoke technologies which increase retention of received rainfall in a catchment. Such technologies would eliminate water shortage for people and animals; increase moisture content in the soils, thus increasing land productivity; and increase vegetative cover over the land, thereby reducing land degradation. To achieve the potential of water retention technologies, local communities must understand, implement and manage them for the benefit of their physical and social environment. Of necessity the technologies must ride on the survival mechanisms, which have enabled past generations of indigenous people to thrive in these harsh climates. What is needed, therefore is for communities to manage their environment in context of the changing global climate. The community must take certain critical steps to achieve these goals. Firstly, the community must analyse the past in retrospect to understand the survival techniques employed in droughts. After this it is useful to show how that knowledge can be fed into the current situation to offer possible solutions. Secondly, institution of community wide problem solving strategies in view of identified problems, aspirations and visions of a better future. Thirdly, expedite community capacity building for development by soliciting outside expertise and technology where appropriate. From the collective mind the sources of last resort of water have been found in the dry river beds. Temporary scoop holes which have always been refilled as the next flow

7
comes in have been the method of extraction of the water dammed at certain points in the river channel. The rivers which have larger volumes of sand also have longer retentions of water. This knowledge indicates that developing these sandy filled rivers leads to enhanced retention of water. Infact this water is found in subsurface dam storages. Evaluating the available water technologies available to the community in Kitui, the community can make a conscious choice of the preferred technology for adoption. A discussion of the merits and demerits of all the known technologies aid the making of this choice. In this discussion boreholes are deemed to be expensive to install and operate in addition this technology is extractive. In a situation of short to very short rainfall periods coupled with the high intensity nature of the rainfall. With high runoff, facilitating little or no recharge, boreholes are not sustainable. Also especially in Kitui South due to the soil characteristics many boreholes are saline. Shallow wells which are smaller versions of boreholes are also an extractive technology. Shallow wells dry out as the water table falls in a prolonged drought. Water tanks are expensive to build. They are limited in size by engineering constraints. Another limitation is the length of the dry season when they receive no water for storage. Earth dams are an attractive technology as they store large amounts of water and facilitate recharge into the surrounding sub-surface storage. However, due to the exposure to the sun, they suffer great loses to evaporation stagnant open bodies of water have a huge potential of contamination and attendant risks to health. As stated above the dry river bed sands bear the sources of last resort. The water is held in natural sand dams. The community has always used this source and it is well known. The water extracted in the sands is preferred to that from any other medium. However the water passes through the sand rather quickly and the sand then remains dry. The solution of the grave water problem in this areas is the storage of water in the river sands which crisscross these lands for extraction for use by people and animals. Sand dams are a very old technology which is said to have been practiced by the Babylonians more than 4,000 years ago. It seems to have been lost in the mists of time. They were never adopted by the scientific community. This is a tragedy as it is an appropriate technology for water management in areas where plenty of sand occurs especially in the drainage channels. Rather that use only pockets of water found in these sandy rivers where the water is held by a natural barrier, man made barriers can be constructed. Some sand dams which were made more than 50 years ago in Kitui are functional to date with little or no maintenance. This is the technology of choice by the Kitui community today. It has been arrived at by logical process of evaluation and elimination and collection of all known factors to form an opinion and make choice.
8
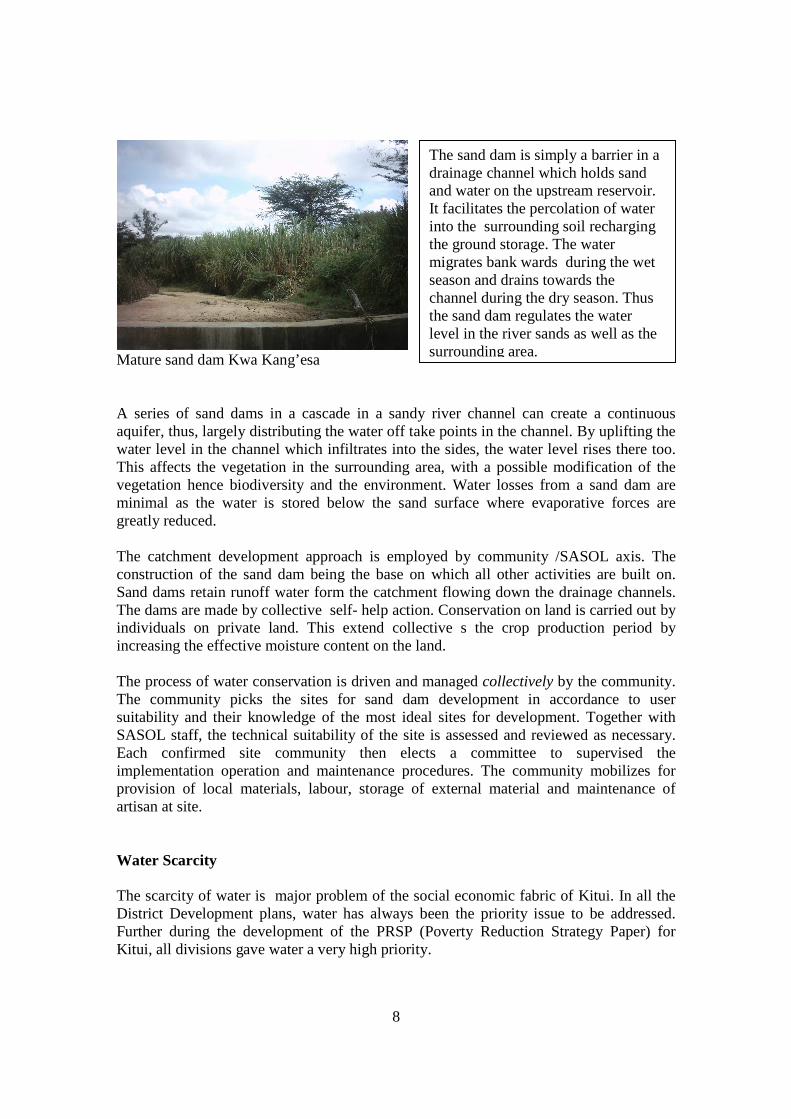
Mature sand dam Kwa Kang’esa A series of sand dams in a cascade in a sandy river channel can create a continuous aquifer, thus, largely distributing the water off take points in the channel. By uplifting the water level in the channel which infiltrates into the sides, the water level rises there too. This affects the vegetation in the surrounding area, with a possible modification of the vegetation hence biodiversity and the environment. Water losses from a sand dam are minimal as the water is stored below the sand surface where evaporative forces are greatly reduced. The catchment development approach is employed by community /SASOL axis. The construction of the sand dam being the base on which all other activities are built on. Sand dams retain runoff water form the catchment flowing down the drainage channels. The dams are made by collective self- help action. Conservation on land is carried out by individuals on private land. This extend collective s the crop production period by increasing the effective moisture content on the land. The process of water conservation is driven and managed collectively by the community. The community picks the sites for sand dam development in accordance to user suitability and their knowledge of the most ideal sites for development. Together with SASOL staff, the technical suitability of the site is assessed and reviewed as necessary. Each confirmed site community then elects a committee to supervised the implementation operation and maintenance procedures. The community mobilizes for provision of local materials, labour, storage of external material and maintenance of artisan at site. Water Scarcity The scarcity of water is major problem of the social economic fabric of Kitui. In all the District Development plans, water has always been the priority issue to be addressed. Further during the development of the PRSP (Poverty Reduction Strategy Paper) for Kitui, all divisions gave water a very high priority.
The sand dam is simply a barrier in a drainage channel which holds sand and water on the upstream reservoir. It facilitates the percolation of water into the surrounding soil recharging the ground storage. The water migrates bank wards during the wet season and drains towards the channel during the dry season. Thus the sand dam regulates the water level in the river sands as well as the surrounding area.

9
Usually, many people only think about drinking water as water per se. However this is a miniscule amount, about 2%, of the total water demand. Therefore by only looking at drinking water many projects have totally missed the focus for of water development Projects. Due to concentration on provision of drinking water, large investments in water in the district have shown little impact. Water is continuously in a state of flux. The water we use is an integral part of the hydrological cycle. Part of the water is in liquid state held in large reservoirs in the seas, lakes, hollows, rivers and aquifers. This is blue water. Some water is held in the soil and is slowly released into the drainage channels through ground flow. This is brown or through transpiration. This portion, the green water, is the source of our food production. It is the very basis of survival. The air always contains a certain amount of water in vapour form. This is white water. After the vapor attains a critical mass in the air it coalesces and falls as rain. The scarcity of water in Kitui is due to the following factors.
1. Low levels of total precipitation 2. Erratic patterns of the precipitation 3. Distribution of the precipitation over time 4. The high intensity nature of precipitation 5. Loss of received precipitation from catchments.
Given the pattern of high intensity precipitation, over short to very short periods, interspersed with long periods of no precipitation; its no wonder Kitui has scarcity of water. To mitigate the situation, the retention of received precipitation in a catchment is paramount. This will initially distribute the available water over time. Eventually this may lead to modification in precipitation distribution patterns. Options for Water Retention in Catchments Many technologies have been tried in Kitui to ease the plight of Kitui citizens suffering from scarcity of water with varying success. These include: earth dams, earth pans, shallow wells, boreholes, rock catchments, water tanks and sand dams. For a long time earth dams and pans have been the backbone of the water resources development in Kitui. Most of the earth dams in the district were constructed in the 1950’s & 1960’s. The bulk of earth dams are now silted up and hold little or no water. On their part earth pans hold water for only one or two months after the rainfall leaving a desperate situation in before the next rainfall. Both earth dams and pans suffer large losses due to evaporation. In Kitui there are over 100 boreholes which have been constructed. Less than 20% are functional due to various problems. Generally boreholes are expensive to construct and

10
maintain. Further more due to the geological formation many are saline and / or low yielding. In addition this is an extractive technology whose long term consequence is depletion of existing deep aquifers. Shallow wells are an attractive and affordable sources. However, they are an extractive technology which depletes the ground water and have to be deepened periodically to follow the falling water table. Water tanks are suitable for domestic supplies. They are however limited to households which have corrugated iron roofs estimated to be x% of Kitui households. Their construction is expensive and they are generally small making the water very expensive. Sand dams are a low level technology suitable for alleviating water scarcity in Kitui. They have several positive factors. Firstly sand dams make use of the largest reservoir, underground storage. Second the abundance of ephemeral sandy river channels found in Kitui provide ideal sites for their construction. Third, this is a low level technology which promotes participation. Fourth, materials for the construction of sand dams are readily available. Fifth, the results are readily evident immediately the construction is finished and the first rains received. Sixthly, large amounts of water is stored underground without creating a breeding ground for mosquitoes etc and with very low losses from evaporation. Community Organisation Community organization is the process of sensitizing and mobilizing communities to act to improve the quality of their life through collective self-help. Many types of community organizations exist in a community at any particular time depending on the current needs, problems and aspirations. In the case of construction of sand dams, the community organises for development of the sand dam structure. The focus is on the sand dam, a collective effort; in addition there is an individual effort for the adjacent land plots. Thus an organization with sensitivities which cater for collective as well as individual effort is required for a sand dam catchment development. When SASOL started the sand dam programme in Kitui, there was need to introduce the technology. Now 10 years later most communities are aware of the technology. Many communities now request SASOL to help them build dams in their areas. In fact it is sometimes difficult to fulfill the number of sand dams a community needs due to shortage of funds. The programme has gone from a supply to demand driven process as the community became familiar with the technology. The usual procedure in organizing a community involves: One, holding a initial community meeting with the facilitation of the Chief of the Location. for administrative and security reasons. The Chief is in charge and this is the avenue of meeting and entering into the community. This is a get to know each other meeting. In this meeting both the community and SASOL discuss the possibilities and conditionalities of the

11
anticipated sand dam project in the area. As stated earlier, currently meetings are on demand by the community and are not about the technology but are about implementation procedures. Second, prior to any further development, the community must develop baseline data for their community. Thirdly the focus is on the project community as defined below. Baseline Data Most communities do not have any data for their area. To effect a meaningful planning for an ideal number of water source points, they should have data on the numerous of people in the area, households, number of animals, distance to present water resources, distance and time to their source of last resource. This data enables the community to visualize and deduce the water resources they require where they require them, who will use them, and how far sources would be from the user households. The baseline data gives the current development status of the community and forms a platform from which they can measure their progress. Baseline data is collected per village. Generally a “ Village consists of 40-120 households and a population of 300-1000 people. The Project Community For the SASOL sand dam programme we have found that the ideal project community is the sublocation, the location headed by a chief is too large a unit for effective logistics. The sub-locationals community is reasonably homogeneous and distances are reasonably short for meetings, messages and planning. The sub location is headed by an Assistant chief who is the administrative and security officer in the area. He is aided by village Headmen in each village. A sub-location is usually 6-15 villages. It is within this community that the detailed planning of the project is carried out. The first meeting of the project community is arranged with the aid of and facilitated by the Assistant Chief. The meeting comprises of the local leaders in the sub location including members of the Sublocational Development Committee whose Chair is the Assistant Chief, community leaders and representatives from all the villages in the sub-location. The aim of this meeting is to plan for systematic identification of possible sand dam sites per village. The sites of preference are those which are, accessible and with construction material found within reasonable distance. Above all they must be sites people require, need and are willing to participate in the construction and later on use the facilities. The first agenda for this meeting is to deliberate on site selection activities. These must be arrived in a participatory manner and have a consensus of the village people. If sites are picked without the agreement of the people, their development is always problematic

12
The involvement of people is extremely important for the construction. The second agenda is to fix a date when the community and SASOL staff can jointly visit the community proposed sites. The third action is the stakeholders to assess the suitability of the site in accordance with the criteria listed.
1. The site must be accessible to the community (preferably close to a surveyed road)
2. There must be enough people to work at the site (not less than 20 households)
3. Adequate construction materials; sand stone and water must be available nearby to reduce transport costs.
4. The river morphology must be suitable with firm base for placement of the dam. (Some dams have sank into ablivion because they are based on clayed soils).
5. Topography of the river should be amenable to the formation of a large reservoir. A low gradient and wide swathes makes a large area for a reservoir and facilitate infiltration into the soil.
6. Information of sub-surface water storage from the community i.e. where scoop holes last a long time shows possible positions of below ground barriers. These areas have potential for development into larger reservoirs.
On agreement of the sites according to this criteria, the work now centres on each individual site for development. For each site, an implementation committee is informed. Its duty is to mobilize resources, plan the site works, record progress, supervise and monitor the implementation process. The sequence of activities is; collect stone and sand, prepare the dam trench as marked by the construction supervisor, receive and store external material-cement, bars and equipment reinforcement, arrange for artisans accommodation and support before start of construction. During the dam construction the committee arranges for; the transport of material from store to site, mixing and pouring of mortar, feeding at site, maintaining all relevant records at site such as store withdrawals and balances, attendance and daily costs. The committee must on weekly basis monitor and evaluate the progress to ascertain whether they are maintaining the schedules which they have set. This is important, otherwise the attendance will fall. The monitoring system also ensures compliance to the rules and regulations agreed for the site, a copy of which is forwarded to the Assistant Chief and the Chief respectively. These rules are the ones which will eventually be used in allowing an individual to use the facility when completed. In the case of non participants a pre determined fee is paid to gain access to the facility.

13
Cost Of Sand Dams Contrary to the popular belief that the community has minimal contribution in the construction of a sand dam the reverse is true. This belief has been perpetuated on the basis that local materials are free and labour is also free. Ironically development theory practice and it maintains that nothing local has any value and only what comes into the community from donors has value. The perpetuation of no value of local material is detrimental to the creation of natural assets. It is rather surprising that sand and rough stone used in the construction of a house has a value, but the same used in the construction of a sand dam taken from the same area has no value. The food eaten on site by the community, during the construction has a market value and opportunity cost yet only sugar and tea leaves from the local kiosk is usually considered a cost. This is an important value factor where anything foreign has higher value than the usual things donated by community. Yet it is only the use of the local resources turned into natural assets which will allow development to create wealth and improve the standard of living of the community. This is a lesson the community must learn inorder to appreciate the sand dam as a community asset while taking care of what they have already built. A typical dam cost is given below: these are actual values of Mbooni sand dam in Tungutu

14
DAM COSTING 2004 S/No Item Description Unit Unit
Rate Quantity Total
Ksh. Total Euro
1. Cement 50 kg
bag 600 350 210,000
2. Reinforcement bars ½ Dia’
Pieces 13 500 6,500
3. Reinforcement bars ½ Dia ‘
Pieces 13 300 3,900
4. Barbed wire Roll 3200 5 16,000 5. Timber 2”x 2” Foot 17 100 1,700 6. Polythene Paper g 1000 Meter 100 200 2,000 7. Skilled Labour Man
days 450 105 47,250
8. Training Training 20,000 4 80,000 9. Site Management
• Mobilisation • Sitting • Site Preparation • Construction
Supervisor
Item Item Item
35,000 20,000 15,000 45,000
482,350 56% 1. Hard core Ton 400 210 84,000 2. Sand Ton 300 105 31,500 3. Water Litre 0.50 45,000 22,500 4. Unskilled Labour Man
days 100 2,100 210,000
5. Community Feeding Day 10 2,100 21,000 6. Support to Artisan Day 80 105 84,000 377,400 44% Total 859,750
External contribution input 56 % and community input 44% = 100% Total dam cost. Keeping records of all costs of the sand dam the community can understand the value of the structure and the community input which has hitherto been ignored. This lesson in value is a spur to ownership and protection of the developed asset.

15
Training Training is an integral part of the sand dam programme in Kitui. It would be mistaken to see the SASOL dam project as only building sand dams. The core business of SASOL is to build sand dams as community assets with a purpose of increasing productivity and wealth creation. Several steps in training are taken concurrently with the construction of sand dams. Training methodology is participatory using carefully selected guiding questions to facilitate group discussions. It avails a forum for the community to critically examine their situation, identify their problems, suggest possible solutions. The community then can make a plan of action to tackle their problems by implementing suitable solutions according to a defined order, to achieve their goals and aspirations. 1. Development of village baseline data development As stated earlier many villages do not have any village records. The development of this data gives a virtual image of the state of their village which most people visualize for the first time. It serves as an eye opener of the real existing situation, highlights village needs and possible solutions, and helps the villages plan future actions. From this base line situation future achievements can be measured. In order to plan for the future the community has to know:- the number of people they eater for, how many animals, their geographical extent, the facilities and institutions in their resources, their standards of living, hygiene practices, crops grown etc.. The information is collected by the community sitting together trustfully discussing and filling a questionnaire . They are free to add any other information it is deemed fit for their area. The information is collected on village basis. The procedure is to hold a one day sub-locational meeting with village leaders to discuss the questionnaire. At the end of the meeting the questionnaire is distributed to be filled by each village individually. To do this the community holds several meetings over a month for the completion of the data. A reporting meeting is them held again for discussion of the collected data foundation a village might have to go back and review its own data. Mainly this exercise gives a village the data to use as a planning base a part from highlighting the need of having and maintaining data for posterity. 2. Site Committee- Implementation Training Many pitfalls in project implementation procedures can be avoided through proper planning and institution of a monitoring and evaluation scheme. Training site committees on essence of planning, development of site implementation by-laws, the maintenance of

16
site records and monitoring/evaluating progress coupled with feed-back to the site members has been crucial for the success of the sites developed. The site committee is the back bone of the organizational structure and the success of a sand dam site. Its constitution is therefore important if it were to function effectively. Usually the people elected in the committee are the ones the community knows will get things done. Basically the community sees their most important as the implementation of the sand dam construction. A major part of community organization is to form structures for sand dam construction. Once the community in a village has identified the sites for development, they divide the community into sectors for each site. This is the time the community organizer meets with the village to discuss the formation of committees for each site. In this meeting the guidelines for the committee are spelled out. An effective committee is formed out of the site community representing gender and all age groups. This ensures involvement and distribution of responsibilities. Record keeping and transparency is the other major issue which is discussed. A proper record would show who and how each person was involved, the investment involved hence the value of the investment. This ensures ownership. Transparency and accountability of the committer prevents diversion of sand dam construction material to personal or other uses. For smooth operation of the site each committee member most know and act their role. Whereas the chairman has overall command, he must not show favoritism or become dictatorial . the secretary must keep all site records truthfully. The site treasurer must keep all money records and give feedback to the community of their contributions and expenditure. All committee members must participate in the planning, monitoring and supervision of the site up and above participating in site works. Continuous interaction with the community organizer ensures that the committees are constantly appraised and have a constant reference to their operation. Any issues which arise are discussed and resolved with the community organizer who is constantly in touch with the site committees. 3. Sand dam Community –Sanitation and Hygiene Training This training purposely deems to dialogue with the community on the dire need to avoid contamination of their water source. Water could be a medium of dispersal of disease when contaminated. By maintaining appropriate sanitation and hygiene in the vicinity of the source and the surrounding areas. This contamination can be greatly reduced. This training which takes 5 days is based on material developed by the Ministry of Health. The materials of PHAST (Participatory Hygiene and Sanitation Transformation) are designed to enable the community to identify their current hygiene practices and help them to change to a desired state. Hence achieving a transformation.

17
Each site gives 5 participants for this training. The participants are charged with the extension of the training material at their site. In addition all the locational health technicians and Divisional health officers as support of the trained community resource persons (CRPs). Two community resource persons have been trained for each sub-location as facilitators in their area. 4. Project community – Natural Resource Management Effective management of natural resources is the path to wealth and improved standards of living. In their native state these resources might not be seem to amount to much, and are likely to be wantonly exploited and destroyed. With informed management, these resources can be changed into assets which can sustainably create wealth. For example, water harvesting will improve land in the ASALs from a mere possession into a productive entity which will increase its value an turn it to an asset. This trainings aim is to facilitate the community to look at their resources and determine ways and means of developing assets from these resources. Poor superintendence of natural resources in a major course of poverty in the rural areas in the ASALs. The natural resource management is designed as a participatory 5 day training. The training is held at a community facility. Each site elects 5 participants for attendance of the training. A site is made up of a community comprising of 20-50 households with a population of 140-350 people. The deliberations of the training workshop are disseminated to the site community by the participants with the help of the community organizer who is in constant contact with the site community. Using guiding question the community catalogues the available natural resources founding their village. They then, explore ways and means of utilizing their natural resources to create wealth. Take for example the case of water which is a limiting factor of production. This commodity is in abundance during the short wet rainy season. It becomes extremely scarce after the rains stop. It is clear on discussion that management of water and its conservation can enhance productivity. This enhanced productivity translated into improved food availability and incomes. However to realise this, they realise that the community must practice smart marketing. Failure to do this will be tantamount to giving away the fruits of their sweat for somebody else’s benefit. By the end of the week each village develops a comprehensive list of the natural resources found in their village. They also workout the possible ways and means of using their resources to reduce poverty and create wealth. An option plan spelling out how to use these resources sustain ably and their management is prepared to take back to the village for consultation, discussion amendment and option by the village community which is made up of one or more dam sites. This training is run by SASOL with the help of external trainers.

18
5. Project Community –Project Management Training In any community numerous projects are undertaken either on individual or communal basis. Some of these projects are successfully completed whilst others are failures. This training is an examination by the community of what creates a successful or failed projects, how to increase the success rate. It examines The role of social structures, community institutions, processes and their interactions with other institutions for mutual benefit. This enables communities to shape new ethical behaviour, traditions, beliefs, opinions, values., in order to survive in an ever changing world. At any point in time there are many projects, individual or communal, undertaken in all communities. Some of the projects are successful while others are not. This training facilitates the community to explore what factors lead to failed projects and which factors make successful projects. The failure creating factors can then be avoided, whereas, the success promoters can be embraced. For 5 days, village participants from sand dam site meet at a village facility to deliberate and these issues. Each dam site produces 5 participants, elected by the site community. The participants of all sites in a village from the village team. Using guiding question the village makes a catalogue of the projects undertaken in the village in the past 5 years. For each project an analysis of success or failure is made. Two categories of project therefore emerges, successful and failed project. Each successful project is then analysed to elucidate factors which made it a success. Similarly for each failed project an analysis is made to show factors leading to failure. The community them makes a catalogue of factors which promote the success of a project. A second catalogue is made of factors which are failure promoters. Discussion on factors of successful projects leads to a definition of concrete principles of future projects for success. On the other hand it gives pitfalls which must be avoided to achieve success. For example, it is important to avoid conflict in projects, however, the community must be ready to resolved conflict as it is likely to occur due to human differences. By the end of this training the village prepares an action plan. This outlines how future projects will be handled in the village to ensure success and minimize failure. It also highlights what community institutions promote success and how and where to get help from external institutions e.g. administration security and the line ministries.

19
SECTION 11
TECHNICAL CONSTRUCTION AND OPERATION PRINCIPLES

20
Ground Water Dams. Ground water dams are impermeable structures constructed across ephemeral rivers mainly to impede subsurface flow in the riverbed sands. This water flows at a lower rate than the surface water in the river channels. Thus less interference to the surface flows of water in the river channel. Pressure difference in water is responsible for it’s flow. In water, the pressure difference is created by height difference. However, besides the pressure difference, the media of flow is important in determining the flow speed. For the water to be stored in a material, the material should have pore spaces. In these the water is stored. When these pore spaces are interconnected, there is the connection of waters with different pressure. Water at higher levels will flow to attain equilibrium. Thus creating higher water heads will promotes flow of water. In building ground water dams and increasing the level of storage in the sands raises this level hence promoting the flow to the banks and upstream the river from the dam. This mainly increases the storage capacity of the river channel by accumulating the base flow and storing it in the sand. Since the banks are mainly made up of soil, infiltration is possible due to the raised water heights in the sands. Rocks that are porous and permeable also facilitate the flow of the water and its storage. Thus the critical height of the dam is highly recommended for maximum utility of the dam. The connection of this impermeable structure to the impermeable country rock stops all the flow in the channel thus accumulating the subsurface water to the level it finds way out of the assumed trough that is filled with sand. Sand is made up of 40% air spaces. This percentage of the total volume of sand stored in the channel is considered as water. Due to the other materials in the banks the amount of time the water is stored in the channel gives it sufficient time to infiltrate to the less permeable materials in the banks and at the base of the river channel. Water stored in these materials is not exposed to a lot of evaporation thus there is a possibility for it being stored in the material for along time. This makes it possible for the water stored in these materials to last to the next rainy season. This promotes the stability of water in the river channel. Because of water accumulation in a variety of materials, overtime, this level is saturated thus raising the water table in the area. Dams built in a series interconnect this saturation and create a continuous aquifer in the river channel sides. Dam building involves creation or extension of naturally occurring obstructing materials for the ground water flow. Typically, river channels are characterized by presence of some portions in the rivers that happen to be the point of last resort for abstracting water in the driest periods. In other words, water-abstracting points in river channels shift, as the year gets drier. This shifting is attributed to the existence of these natural barriers and they shift as the height of these barriers comes near the riverbed surface. The deepest barriers hold the water for the longest period of the year. This depends on the water rest level in the sand of the river and the amount of water stored in this sand and also on the amount of abstraction of the water. Thus the bigger the trough between two barriers and the depth of the barrier determines the amount of water stored in them.

21
1 Sand filling the river 2 B 3 A C 4 Bedrock Beneath the riverbed Key:
1, 2, 3, 4. WRL in different periods in different season of the year. A, B, C, Different storage obstruction portions. In 1, The Water Level is just near the surface of the river so water is found everywhere. In 2. There is very little water in B In 3 & 4 Water is found in A & B as the troughs are deepest.
The principle behind the functioning of the dams is based on the storage of water in the sand of the river. Sand is good for storage due to its high porosities, which ranges between 35-40%. Thus of the total volume of the river basin covered by the sand behind the dam this percentage is water given that porosity is the ratio of the total volume of the spaces in a material not occupied. The water that infiltrates in the sand takes it up. This takes only a small percentage of the flowing water in a river. Thus increasing the volume of this sand creates a higher storage space for water. Given the prolonged period of time the water stays in the channel, there is adequate time to allow for both lateral and vertical infiltration and thus recharging the groundwater resources available. In principle, arid areas never receive enough rainfall to allow groundwater recharge from the surface infiltration. Recharge is mainly from surface waters. This is due to inadequate and short spans of rainfall. High temperatures in these arid semi –arid areas causes a lot water loss through evaporation and thus most surface water bodies store water for a short time.

22
Storing water under the sand reduces water loss and thus most water is available for use and recharge of groundwater. HYDROLOGICAL AND HYDRO-GEOLOGICAL Land forms. The upper part of the earth is composed soils, which lie upon the basement rock otherwise known as the parent rock. It is from this rock that most earth materials like soils originate. These rocks are in most cases impermeable and never allow water to percolate through them thus acting as obstructions for vertical ground water flow forming base for aquifers forming the base for most stable water tables. The depths of these rocks are varied depending on varied earth processes. Storage of water in rocks is either in weathered rocks or in joints and faults. The rest of the water is taken up by the spaces in the soils lying on top of the rocks. Most exposures of these rocks are found in river channels. This is so because they are the lowest points. Most of the water infiltrating into the ground at higher levels and is never obstructed resurfaces in these valleys and flows down stream. Thus in principle, topographical gradient acts as a guide for ground water flow in the absence of obstructing materials in between the points of infiltration and the river channel. Structural parameters like lineation, sheared and faulted veins, pegmatite veins, sinistral and dextral shears and fractures are directly related to water movement in the sub surface and ground water regions and are the conduits for this movement. These are structures highly featured in high metamorphic grades. Silimanite, Kyanite and andalusite are the index minerals found in coexistence with pelitic minerals like muscovites and phlogopites. Domination by thick successions of alluvial deposits and kunkar limestone whose permeability and porosity are low, are highly regarded in development of the dams as they have high water retaining capacities. Unless fresh rock outcrops are fractured, they are never considered suitable places to place dams as they will not perpetuate movement of the water. In most cases these will not avail shallow aquifers but incases of deep opening they will recharge the deep aquifers, GENERAL HYDROLOGY Generally, the term hydrology comprises all the systems and transformations through which water undergoes in its cycle from the atmosphere and up to it’s going back as vapour. It incorporates precipitation and evaporation, which is the last stage in the hydrologic cycle. Among the sectors in this cycle are the precipitation, which takes different forms like rainfall, storms, fogs and falling ice. After precipitation the water on the ground flows as run off.
Run off Run off is considered synonymous with stream flow. This synonymity is because the term takes into account all the water that reaches stream channels and it is made up of surface run off which is the water flowing on the land surface and the ground water flow. On falling to the ground, when the rate of precipitation is higher than the rate of

23
infiltration, surface flow begins and this is what is described as the surface run off. The thin film of water is formed in the soil and this is called the inter flow. Then the rest of the water goes to the ground water and this forms the base flow of the river. This movement of water through the surface of the soil is a function of a number of factors, which determine the flow and infiltration capacities. These are; the intensity of precipitation, permeability of the ground surface, duration of precipitation, vegetation cover, area of drainage basin, the river geometry, depth to water table, slope of the land surface etc The run off portion of the water falling directly in the river channel is called channel precipitation. When the storage of the interception and depressions becomes saturated, and more water infiltrates the ground, land flow begins and this becomes the surface run off. Hydrologic cycle, therefore, includes the distribution of water and the path followed by the water after it precipitates on the land until it goes to the stream channel or directly to the atmosphere through Evapotranspiration.
Evapotranspiration. Through Evapotranspiration, the water goes back to the atmosphere. This is usually through evaporation and transpiration It has been difficult however to separate evaporation and transpiration because they take place at the same time and therefore they are taken together and thus the word evapotranspiration, This happens when the water molecules on a surface acquire enough energy through radiation to escape in gaseous state. Ground water is never affected by direct evaporation. However, the roots of plants are responsible for ground water discharge. The plants loose the water they get from the ground through their leaves. Some plants are known to have roots going to a depths of thirty meters below the surface.
Infiltration. This is the maximum rate at which a given soil can absorb precipitation in a given condition. It decreases exponentially in time from maximum capacity decreasing from an initial value to a constant rate. This depends on soil moisture mainly. It decreases with the saturation of the soil up to a terminal rate. The rate of lateral flow is faster in the first few meters but at some point it stabilizes. The soil particles arrangement and sorting affect the rate of water movement in the soil. This is due to the degree of sorting in the soil. On complete saturation, movement of water is minimal. This can be determined using the double ring method.
Subsurface water. Water found on the surface of the soil in known as the soil water. This water moves down on gravitational influence. It gets to the intermediate zone. The water in these two levels is known as the vadoze water. Most of the ground water is stored in this saturated zone. The transition from different levels of the water zones is however different in different soils. The capillary fridge is the next level. This dependents on the grain size of the soil as this affects the capillarity rise in the soils. It is rather abrupt in sands than in loams and

24
clays. The difference in moisture content between intermediate zone and the capillary fridge will be quite minimal in fine-grained soils when there is recharge. The surface of this capillary fridge depends on water table and the amount of recharge. However, the upper part of the capillary fridge contains pockets of air that slows the movement of flow of water. Phreatic water is the most stable level of water and this shows the general level of water in an area. It is the level of water found in open wells when they are not abstracted. Though they distort it a little due to the atmospheric pressure and abstraction. But they correspond a lot to the water table in an area. This is the level at which the atmospheric pressure equals the hydrostatic pressure in unconfined material Below the water table, there is the ground water also known as zone of saturation. Here water is stored and transmitted by aquifers. However, in arid areas, precipitation rarely exceeds the storage capacities of the soils. There fore, most ground water recharge occurs from stream bottoms and surface water storages. This due to the factor of time for infiltration RIVER HYDROLOGY. Rivers are a stage in the hydrologic cycle. This is how the water is conveyed to the lakes and hollows dams oceans after falling to the ground. Rivers receive water from different sources, which include rainfall, surface run off, springs, and the ground water. This water is as a result of surface run off from the land to the rivers from rainfall. River hydrographs. In ephemeral rivers, flow is comprised of integrated input from the surface run off, groundwater, seepage, and channel precipitation. This is shown by use of hydrographs, which are graphical representations of the instantaneous discharge of a river plotted with time. Hydrographs of single storms over a drainage area follows a general pattern. It shows a period of rise culminating to a peak and a decreasing discharge which may or may not decrease to zero depending on the amount of ground water flow. Incorporating this flow in a hydrograph gives a broad band near the time axis representing the base flow. The remaining part above the base flow represents the surface run off which is directly from the by the storm. At the beginning of the rainfall, river discharge is low and a period of time elapses before the river begins to rise. This time the rainfall is intercepted by the vegetation or soaks to the ground to make up for the soil moisture deficit. This time of wetness depends on the moisture of the catchment before the downpour in the catchment before the storm and the intensity of the rainfall. When the catchment is saturated the rainfall starts contributing to the stream flow. The proportion of the rainfall finding its way to the river is known as the effective rainfall. The rest is lost to evaporation, or detained on the surface or retention in the soil. As the storm continues the proportion of effective rainfall increases and the lost rainfall

25
decreases leading to a rise in the limp of the hydrograph. When the effective rainfall gets to the maximum, the hydrograph gets to the peak. The areas closest to the river contribute to the flow of the river first followed by the areas further upstream. This means that in small catchments the peak is reached faster than in larger catchments. The boundary between the surface flow and the base flow is difficult to define and depends on geological structures and composition of the catchment. Permeable aquifers like limestone, and sandstone strata react faster than impervious clays. In one rainfall event the base flow continues to flow even after the river levels have began to rise and only when the storm has had time to percolate to the water table does the base flow begin to increase. This gets to its height at the end of the storm and thus accounting for the continual flow of the run off from the groundwater seepage. Groundwater provides the total flow of the general recession curve the next rainfall. Peak flow Total flow.
Recession curve
Surface run off
Rising limp Base flow. B Depletion curve A Negative base flow or bank storage. Time Components of a hydrograph. At the beginning of a rainfall event, the river discharge is low and a period of time lapses before the river begins to rise.

26
GROUNDWATER FLOW. Flow of water is guided by pressure differences mainly. This flow is through voids, pores, or interstices matrixes. These could originally be filled with gasses or organic matter. Formed by soils and rocks. This property of soil or rock is known as the porosity (n). It is the ratio of volume of the voids over the total volume in the material. Thus
Vt
Vvn = Where Vv is Volume of Voids, and Vt is total volume of material.
This is depended on parking, shape, arrangement, and size distribution of the grains. It is higher in well sorted materials, in alluvial deposits it is between 0.3 to 0.4, rumble rock 0.42, sand stone 0.15, clays they are high as 0.6. Flow is measured by specific discharge (q) where a plane surface with surface are a (L) is compared with a single pore per unit time denoted as Q (L3T-1).
A
Qq =
Quantitative measurement of fluid flow is possible when velocity, pressure, density, temperature and velocity are known. However for groundwater, parameters like density and viscosity are negligible thus are neglected. Head gradient, which is the pressure difference due to height difference, is the driving force for groundwater movement. Darcy’s law says shares water flows at what gradient by relating Head gradient to the specific discharge. kiq −= Since density in water is constant, pressure distribution is done in terms of Piezometric head (ω)
ω = zg
+ρρ
; ρ/ ρg = Pressure Head, and z the Elevation Head.
Thus for the above equations, the constant head and pressure distribution is a linear equations )(: zgz −= ϖρρ This is the hydrostatic pressure distribution. In such a case a vertical equilibrium exists and thus no vertical flow occurs. With a head difference, ground water begins to flow. This groundwater head change (∆ω) is always associated with a change in distance (∆x), hence the change in head is over a distance

27
xixf
wiwf
xi
−−=
∆∆= ϖ
‘K’ is the hydraulic conductivity of the material with dimensions length over time (LT-1). Thus as ∆x approaches Zero, ∆ω/∆x becomes δω/δx. Thus in three dimensions Darcy’s
law becomes x
kqδδϖ−=
Flow in unconfined situation is usually in three dimensions. However, in practice it is hard to solve the three-dimensional flow water problem. This is countered by using the Dupits –Forchheimer approximation this assumes the presence of vertical flow if overridden by the horizontal flow. Horizontal flow is more active than vertical flow. The continuity equation and Darcy’s law are combined to solve this equation. Ground water recharge is also included denoted by N.
Nx
=δδϖ
Where Q =ωq- flow in the horizontal direction. NB: The base of the aquifer is the reference level for ω
Substituting the Darcy’s law becomes. K
N
xx−=
δϖδϖ
δδ
Discharge through land mass =
−−=
xixf
wiwfkQ
22
2
CATCHMENT STORAGE AND WATER BALANCE DETERMINATION. A catchment is an area contributing to the discharge at a particular part of a river basin. In the case of sand dam development, this can be defined as a drainage basin of a river system. This is the area water flowing in the river falls. This includes the main river and its tributaries. This is usually the lowest topographic region. Water flows to the lower areas. This includes both the surface run off and the water from the interflow water that gets to the river through moving in the ground. Thus, the water falling in a catchment will partly be held in the catchment, and the rest flows out. It is worth determining the amount of water falling in the catchment, water held in the catchment is referred to as the water balance. It is usually affected by the precipitation, which is the input and the output that comprises the evapotranspiration E, and river discharge Q at the outlet of the catchment.
Hence water balance is written as ( )t
SQAEP
∆∆=−×−
Where ∆S is change of storage with time step ∆t, A is the Surface area of the catchment upstream of the outlet point.

28
NB: All should be expressed in the same unit. Precipitation and evapotranspiration are mm/d and river discharge is m3/s. For conversion of one unit to the other A should be known. E.g. conversion of m3/s into mm/d for a catchment is of 200Mm2
Where Mm2 =1Km2
Is as follows: - Conversion of: - Seconds to Days ⇒ 1m3/s =86400m3/d
m3 to mm ⇒1m3/200Mm2 = ( )6
3
10200
10
×mm
Result ⇒mmmm
dm
/1010
/86400328
3
×
=0.432mm/d
When computing the storage equation for annual periods, the beginning of the balance period is chosen when the water balance is not like to vary a lot for the successive years. These could be the start of the rainy seasons of in the dry seasons. These periods are known as hydrologic years or as water years. Topographic divide between two watersheds are taken as the boundary of the catchment, the water divide though this may not necessarily be the boundary for ground water flow. It’s just true for surface water.
t
StoragetOutflowtInflow
∆∆=− )()(
Inflow: This is the inflow from outside the catchment and the precipitation occasioned in the area. It can be determined by placing rain gauges in the catchment area to get the rainfall data. Since the area of the catchment is known, multiplying this area with the amount of rainfall obtained in the hydrological year, you get the amount of inflow caused by rainfall. Therefore the inflow into the catchment can be calculated as follows:
areaCatchment A
depth Rainfall
pointoutlet over the Discharge
..
int
int
==
=+∆=
R
Q
ARtQInflow
outletpoi
Outleto
Outflow: This is the discharge through the most down stream dam of the catchment plus the water lost through evapotranspiration.

29
Discharge. This is the water that flows out the catchment. It can be determined by placing a measuring gauge at the point of exit, probably on the wall of the spill in the last dam. It can be placed the same time that dam is build. However this can be a bit difficult as it is difficult to measure at peak storms. On determining the volume flowing out this can be integrated with time to get the discharge over time. [ ]3. mtQ =∆
Evapotranspiration. To estimate the amount of water leaving the catchment by evaporation and transpiration a study on vegetation and meteorological parameters should be executed in the catchment area .A computer model can be created in for example CROPWAT. The following parameters are needed to do this. • Min. and max. Temperatures (°C) • ET0 and ET-crop values of crops and vegetation present (mm/day) • Humidity (percentage) • Sunshine (hr) • Wind speed (km/day) Storage: This is the balance of water remaining in the catchment after the hydrologic year is over. This means all the water that retains in the catchment area, not only the water conserved by the dam. The construction of a dam will increase the storage. A lot of factors are yet unknown in the water balance. When factors are known, the order of magnitude of ∆Storage can be obtained; the water balance can be integrated over the account period ∆t:
( )( )∫∆=
=
−+−=∆tt
t
outInletpo dtAEPQQStorage0
int
The philosophy behind the establishment of sand dams is that, there will be more water held in a catchment than before the establishment of the dams. When the dams are build in a series, this will be easily achieved as the interconnection of the effects of these dams will increase the volume of water held in the banks and in the main river channel. This, as stipulated earlier, is due to the rising of the heads in the main river channel and on the obstruction of the subsurface and ground flow of the water in the channel. An expectation is that the biggest part of the storage will be in the area directly upstream of the dam. This is because of the high run-off coefficient. The water from rains will flow almost immediately to the river. Only a very small part will remain in the slopes. To determine this amount, a study can be done on infiltration capacity in relation to slopes and vegetation. This expectation means that the river is an irrigating river, from which the water will recharge into the banks.

30
Studies done show that over time the amount of water in the down stream part of the river will increase . This is so as a result of reverse drainage from the banks of the water that is stored in the banks when the levels in the main channels get lower due to consumption and evaporation. This helps in stabilizing the amount of time water is in the river. Most rivers in arid areas stay with water for really short durations of time and some of them get saline. This salinity is known to increase with lowering of the water levels in the river. Stabilizing this water level in the river channel will reduce the amount of time in a year that the water gets to critical saline levels for plant and animal use. GROUND WATER DAMS OPERATION. Natural Groundwater Obstruction. Depending of the earth/rock properties, water will always be in motion as long as there is sufficient head gradient to facilitate the flow. This flow will continue until it achieves equilibrium this water will move in materials that are able to transmit it until it finds a barrier then fills the barrier and if the barrier doesn’t help achieve the equilibrium, the water flows on after filling the barrier. Naturally, the skeleton of the earth that is the parent rock is usually not flat. It made up of rough surfaces that form troughs and crests. These troughs and crests act as reservoirs for the ground water. When they are filled with material that is porous and permeable, then this becomes the ground water home. The size of the basins, transmissivity determines and the porosity of the material filling the troughs determine the size and yielding capacity for groundwater. Different materials have different porosities and thus the yield of an aquifer is depended on the material forming the aquifer. Aquifers are known to be common in buried river valleys and basins. this is the alluvial material deposited in these areas. River valleys are the lowest earlier topographical areas. This means surface water flow will be towards these areas. This includes also the subsurface flow. This subsurface flow continues until the level of the water in the ground comes to contact with open ground where it is exposed as surface water this. Obstruction of this flow leads to accumulation up to the highest level that the water will find a possibility to flow further. This happens when a height is reached where the media can transmit the water further due to the head gradient.

31
Soft Porous Material
Parent rock
Natural Rock Barrier Under The River Bed.

32
dam filed with sand
Soft Porous Material
Parent rock
After Establishment Artificial Barrier. Before the dam is build, there is the natural rock barrier that holds water just to some level below the riverbed. By extending this barrier, there is more volume of the reservoir material stores. This is mainly sand, whose porosity is high, meaning high it has a water holding capacity than the materials stored one below it that could be clays or alluvial silts which are less porous. This raises of the river bed water level in the sand is high
So a very rough estimation of the amount of sediment that comes available is 455m³. A part of this sediment will pass the dam but a large part will sediment in front of the dam. Sedimentation as a Factor of Energy. B (m2) i
H (m2) A (m2) X –axis (Direction of flow)

33
It is assumed that the channel is a nearly prismatic; A (m2) is the wetted area section, which is perpendicular to the x-axis the direction of flow of the water. Sloping at an angle (i) down ward of the current. The horizontal width is B (m) of the free surface in A and the wetted area perimeter P (m). The mean depth H = A/B (m). to describe the hydrodynamic or gravity effects of disturbances on the free water surface, and the hydraulic radius R=A/P [m]for addressing the resistance exerted by a fixed wall or the friction. R or H is used in hydraulics as the natural macroscopic unit of length. Using the two components of the earth gravity i.e. ]/)[cos( 2smig in the plane of A and
( )[ ]2/sin smig perpendicular to it in the direction of x, the two natural physical scales for the velocity are formed c={g(A/B)cos(i)}1/2 The characteristic velocity of elementary disturbance in open channel flow, as comparison with the mean flow velocity v=Q/A and v*=gRsin(i)}1/2[m/s2]. Being the shear velocity for addressing the resistance effects of the fixed wall compared with v=Q/A also. The search for natural length and time aims at numerical solutions of equations of motions and continuity. The natural length unit of direction of flow is then H/tan (i) [m] and for the time unit H/c tan (i) [s] For the velocities under the influence of wall friction and the natural survey able unit is v*[m/s] again. On a microscopic scale, these are related to the turbulence flow concepts. Parameters describing the physical properties in the interactive flow of water and sediment are needed. Theses are Transportation of sediments by water is usually in equilibrium and non-equilibrium conditions. This implies that the sediment should be transported without sedimentation or erosion happening in the course of the transportation. This condition of equilibrium is an ideal situation and it is a design principle used in designing canals. Non-equililibrium state means that there is erosion and deposition. This is the case with natural water channels. In these channels. Designing is by natural forces like the floods and the landforms. Thus there are subsequent erosion and deposition episodes in different periods of the life and stages of the channel. The major influencing factor for sediment transport is that this happens as a power of water discharge in the river. Thus this discharge is directly related to energy dissipation in the water and sediment mixture. H.C.P. De Vos, designed an expression based on that sediment transport is an ascending function of turbulence energy dissipation per cubic meter volume of water in the channel. He published his relative transport capacity parameter S/Q that can be interpreted as an expression for the concentration and suspension distributed across the entire wetted area of the flow section of the channel. This can be associated to any solid material transported i.e. sand and finer material like silts. Suspensions in running water have the capacity to trigger and sustain the transport of sand. Prof. Vlugter -Bagnold designs a suspension stability criteria in which he postulated that the limit of sediment –water mixture stability is closely related to the dissipation of potential energy into kinetic energy of the turbulence. He used the direction of the earth gravity component ( )igcos in

34
the direction of flow (x –axis) and the sediment grains move with respect to the water molecules under the influence of the component ( )igs sinρ . He established the following
energy balance model in terms of energy losses.
( ){ } ( )( ) ( ) ( ) ( ) ( )
( ) ( )
∆−−=
−
−−+−−=+−
εθ
ρρ
θ
ρδρρεθρερρ
/cos11
,
sincoscos111
iWC
C
simplifiesSeparating
iCgWiCgCCC
es
s
sess
ρ = Density of water: ρs Density of the sediment C = The ratio of solid mater in the mixture by volume (m3/m3). ε = Local energy dissipation into kinetic energy of turbulence m2/s3
θ = a Dimensionless fraction; θ>0,sub critical flow; θ<0 then super critical flow: (1-θ) ε = Reduction due to the energy dissipation if there is no solid particles under identical flow conditions (Water flow alone, so less energy dissipation, reduction factor) (1-θ); with θ<<1 We = Effective fall velocity of grain particles in the direction of force resulting from gravity minus the uplift in the plane of the wetted area section.
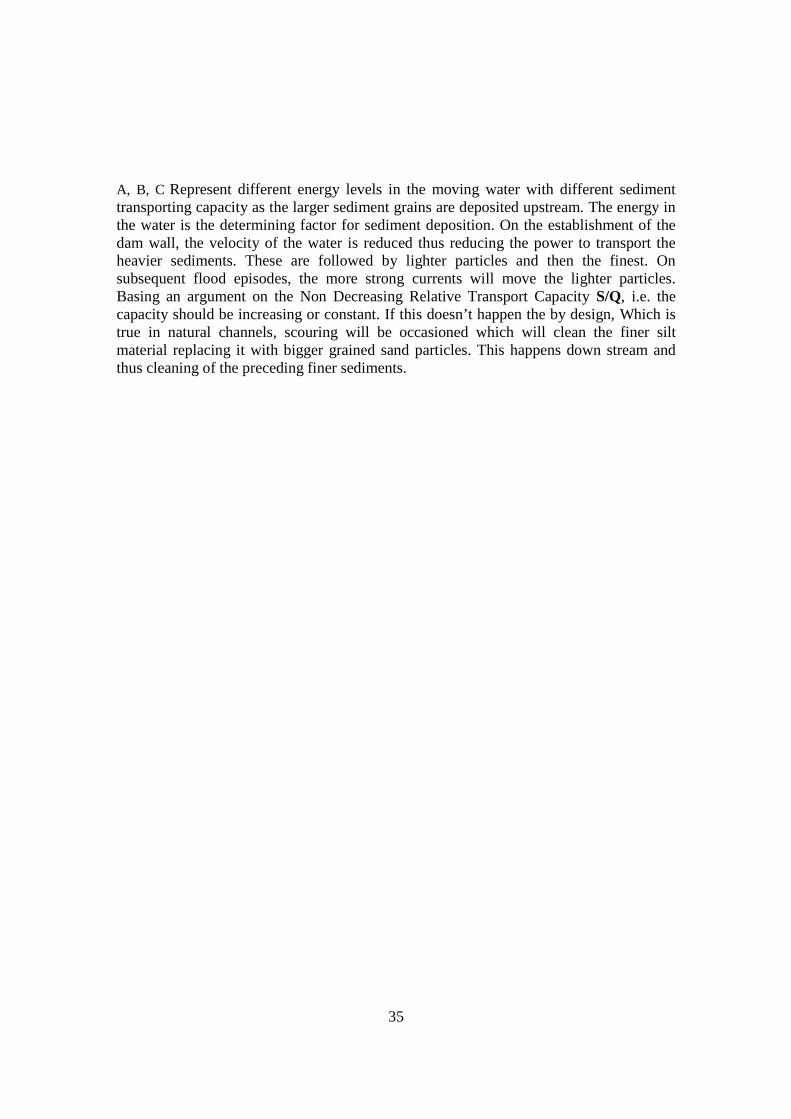
A Flowing Water B C Sub- Sequent Sediments. Deposited Sediment Bedrock
{ρ (1-C) ρsC} ε = Energy loss of mixture
(ρs-ρ)Cgcos(i)Wecos(δ) = Loss of potential e ρ energy of suspended particle with respect to water flow across the entire wetted profile.
ρ (1-C)(I-C) ε =
Energy loss of water alone.
ρsCg sin (i)Wesin(δ) =
Loss of potential energy of suspended grain particles in the direction of flow. (Minus loss = gain)
35
A, B, C Represent different energy levels in the moving water with different sediment transporting capacity as the larger sediment grains are deposited upstream. The energy in the water is the determining factor for sediment deposition. On the establishment of the dam wall, the velocity of the water is reduced thus reducing the power to transport the heavier sediments. These are followed by lighter particles and then the finest. On subsequent flood episodes, the more strong currents will move the lighter particles. Basing an argument on the Non Decreasing Relative Transport Capacity S/Q, i.e. the capacity should be increasing or constant. If this doesn’t happen the by design, Which is true in natural channels, scouring will be occasioned which will clean the finer silt material replacing it with bigger grained sand particles. This happens down stream and thus cleaning of the preceding finer sediments.
36
CONSTRUCTION OF THE ARTIFIAL BARRIER. Methods Tools and Equipment Site Selection and confirmation. This is determines the suitability of a site considering the surface flow of water in the river. It is a redesign process that takes into account the general river hydraulic and hydrology. It is a kind of a preliminary study using the physical parameters to design the impermeable barrier. This looks at parameters like:- The water levels, the height of the banks in relation to the adjoining areas, the rock formations present, soil types, Accessibility and other social factors like availability of local material for construction. The process involves:-
a) Determination of river flow parameters on the proposed site. • Height of flood (Hf) • Height of lowest river bank (Hb) • Area of wetted section (Aw). • Area of dry section (Ad)
b) Suitability of the following river conditions. 1 Condition one When Hf ≥ Hb Ad=0 , Hd = 0, Hs = 0, Gf = 0 Example: Hf = 5m, Hb = 3m The dam should be at ground level. Raising it higher will make the river burst the banks thus causing flooding.
1. When Aw > Ad.
2. Condition II Hf > Hd ≥ 0 When the area of the Aw >Ad ,The height should be between zero and the flood level. The cross section Area of the dam should be equal to the dry area section to avoid over flooding. I.e. Cross section area of dam=Ad. The dam should also be flat. I.e. Hs = Hd,, Gf = 0 Aw>Ad

37
Cross section area of dam is = Ad After the dam is constructed the flood level rise to a height of Hb there fore
I. If A dam=Ad Example 1
Adam= max).(2
1HsWbLs+
Ad = Wb (Hb-Hf)
½ (Ls-Wb). Hs= Wb (Ho-Hf)
Hs max= 2Wb (Hb-Hf)/(L s-Wb)
Where
Wb =Width of river at the bottom (Measure.) Hb =Height of the lowest river bank (Measure) Hf = Height of flood (Measure) L s =Length of spillway, which is initially assumed to equal to W
Wb= 4m , Hf= 4m , Ls= 7m
Ad= Wb(Hb-Hf) = 4(5-4)= 4m2
A w=½ (Wb-Wf ). Hf
=½(4+6). 4=20m2
Ad> A w
Thus 20 > 4 Therefore A dam = ½( Wb+ Ls). Hs
4 =½(4+4). Hs
8=8Hs Hs max = 1m. When Hs is set at in the site, The actual area can be calculated. E.g. When set at Hs max, the actual L s becomes 5m.
Adam= ½(5+4). Hs max = 4
Hs max=9
24× =0.89
Say 0.90m.
II. When Ad > A w, Hb > Hf
There fore Hd max=Hb
Hs max=Hb-Gf
Example 2. Wb = 2, Wf = 4, Hf = 2, Hb = 6

38
There fore Hd max=Hb
Hs max=Hb-Gf Hb>Hd>0
Aw=½ (2+4). 2 = 6m3 Ad=2 (6-2) =8m3 Ad = Aw
When Ad > Aw The height of the dam can be between zero and the height of the lowest river bank.(Hb)
III. Determining Hs max
Hd max=Hb Hs max = Hb -Gf
In this case Aw =Area of spillway. Aw= LsGf But Ls max =Wb
Aw = Wb x Gf
Since Aw=6 and Wb=2
Then Gf= Wb
Aw =
2
6 = 3m,
Therefore Hs max =6 – 3 =3m.
Hence: - When Ad >Aw
Tools and equipment
Small River (Wb<5m) Tape measure 5m, Tape measure 50m,Lining level, Building line, A Panga, Mallet, Plump bob and line, Calculator, Note book.
Larger River (Wb>5m) A leveling machine with accessories, Tape measure 5m, A Panga, Calculator, Note Book, Mallet.
Hs max =Hb_- Aw / Wb
39
b) Pre Hydraulic Design. At this stage the following parameters will have been determined. Height of spillway Hs by using
Height of dam Hd by using So with this it is possible to carry out: -Spillway Design. - Back flow Designs
Spillway design This involves the determination of: - 1 Length of spillway L s 2 Gross free board Gf
As earlier stated the following suitability conditions prevail always. a) When Hf > Hb: Gf=0 and b) Ls =Wb; this is because Hs = Hd = 0. c) When Hb > Hf , Ad > Aw Method I Wetted area Section. Procedure. Using the flood marks and information from the local people, the area of wetted section
(Aw) is determined in five points along the river. Note: Minimizing the Gf increases the cost effectiveness of the dam. This is possible by minimizing the length of the spillway (L s).
NB: If the calculated Gf is below 30cm the designers should L s but only when Gf does not become too cost effective.
Hs max =Hb_- Aw / Wb
Hd max = Hb
Average Wetted Area Section
(Awa) = ∑5
15
1A
fwa GLA .=
bx WL =max
Wb
AwGfMin =∴
Example. When Awa =4m2 ,Wb = 10m, Ls = 10m
.7
7.66.0
4)( 22
min
m
mm
m
W
mAG
b
waf
≈
===

40
Method II Using Simplified area Method.
2
1
3
2
)(56.0)05.033.1188.0
9.1
LogSLogSLogALoqQ
L
QG
d
df
+++=
=
Typical example. Kwa Ngove Dam. Wb =2.0m , Hf =1.2m , Wf =4m.
36.3)42(2.12
1mA =+××=
S = 0.01(10-2) log Q = 1.88+ 1.33 log 3.6 + 0.05 log (10-2)2
log Q=1.05 Q=11.27m3
Gf =(Qd/1.9 Ls) 2/3 =(11.27/1.9*2) 2/3 =2.06m.
Stilling Basin. (Back Flow) Stilling basin is commonly referred to as the back flow BF. Its main function is to protect downstream erosion when the water is falling .It is not necessary when there is hard surface down stream. Determination of the Dimensions of the Stilling Basin. The following dimensions of the stilling basin are determined.
• Length of then back flow (L bf)
• Width of the back flow (Wb)
1. Length Of then back flow (Lbf).
L b f= Ld+ L j Where: Ld= Drop length.
41
L j= Hydraulic Length. This length should cover the distance of the projection of the water flowing over the spill way. This can be determined using either free fall or simplified slop area method to determine the discharge through the spillway. 1 LD = 0.96 (q1/3. Hs1/2) (Free Fall Method). q= Q/Ls 2 Log Q = 0.188+1.33 loqA+0.05 log S + 0.056 (Log S) 2
Typical Example. i) Kwa -Ngove. A=8.25m2; S=0.01; Hs=1.5 LogQ = 0.188+1.33 loq8.25+0.05 log (10-2) + 0.056 (Log 10-2) 2
=1.531. Q=34m3/s
q = Q/Ls = 34m3/6.5ms =5.22m2/s LBf =LD =0.96 (q1/3.Hs
1/2) =0.96 (5.22 1/3 * 1.5 1/2) =2.04m. ii) Kwa- Kathata. Hf=1.05m; Hs=1.35m; Wf=2.6m; Wb=1.8m; Ls=1.8m; S=0.01. A=1/2 × 1.05 × (2.6+1.8) = 2.31m2
LogQ = 0.188+1.33 loq2.31+0.05 log (0.01) + 0.056 (Log 0.01) 2
= 0.840 Q= 6.91m3/s Q = 6.91m3s-1/1.8m =3.84m2s-1 LBf= 0.96 (3.84 1/3× 1.35 1/2)

42
=1.75m. 2. Determination of the Width of the Back flow (WBF).
WBF=(Wb+2) In Metres. 3. Depth of the back flow (DBF)
The depth of the back flow is 0.3 of the depth of down stream water (HD/s) .The down stream water depth is assumed to be the same upstream depth (HU/s). DBF = 0.3 GF. Note: Boulders should be placed Behind the stilling basin to protect soil erosion this can be done to about four times the down stream water depth (HU/s). i.e.
Length of boulder placing= 4Hf

43
CONSTRUCTION.
Setting the trench. This is marking the position and the size of the dam. It is done by pegging the dimensions of the dam taking in to account the size of the wing wall and working space during construction. Several factors are considered in this process. When determining the distance the wing walls go into the banks, bank characteristics are taken into account.
� In loose riverbanks, the distance should be about seven meters from the riverbank.
� Hard soils about five meters. � Hard and impermeable, can be zero. � No need of backflow in case of a rock formation downstream of the dam.
Trenching Procedure.
� Measure the appropriate distance from on one of the river banks depending on bank characteristics and fix a peg at the distance.
� Fix another peg across the river perpendicular to the river course at the appropriate distance.
Building line.
Peg 2
Peg 1 River course
� Using a plumb bob and line mark several points from the building line and fix
pegs.
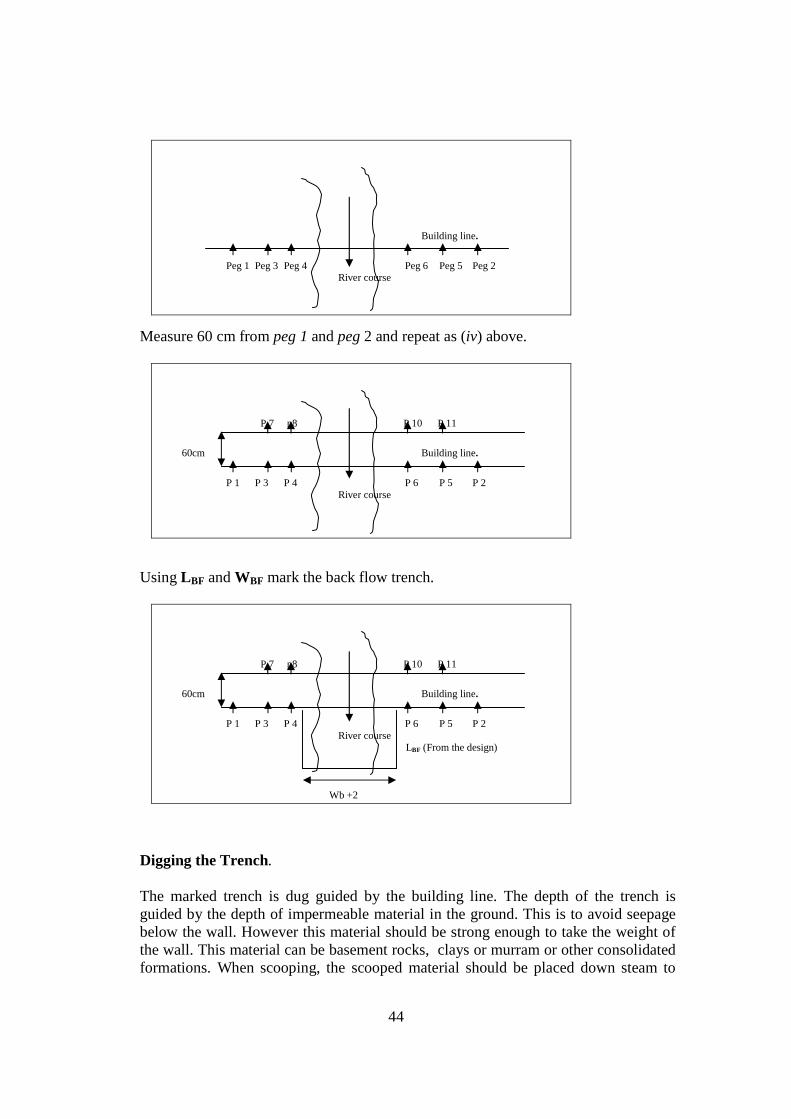
44
Building line.
Peg 1 Peg 3 Peg 4 Peg 6 Peg 5 Peg 2
River course
Measure 60 cm from peg 1 and peg 2 and repeat as (iv) above.
P 7 p8 P 10 P 11 60cm Building line.
P 1 P 3 P 4 P 6 P 5 P 2
River course
Using LBF and WBF mark the back flow trench.
P 7 p8 P 10 P 11 60cm Building line.
P 1 P 3 P 4 P 6 P 5 P 2
River course LBF (From the design) Wb +2
Digging the Trench. The marked trench is dug guided by the building line. The depth of the trench is guided by the depth of impermeable material in the ground. This is to avoid seepage below the wall. However this material should be strong enough to take the weight of the wall. This material can be basement rocks, clays or murram or other consolidated formations. When scooping, the scooped material should be placed down steam to
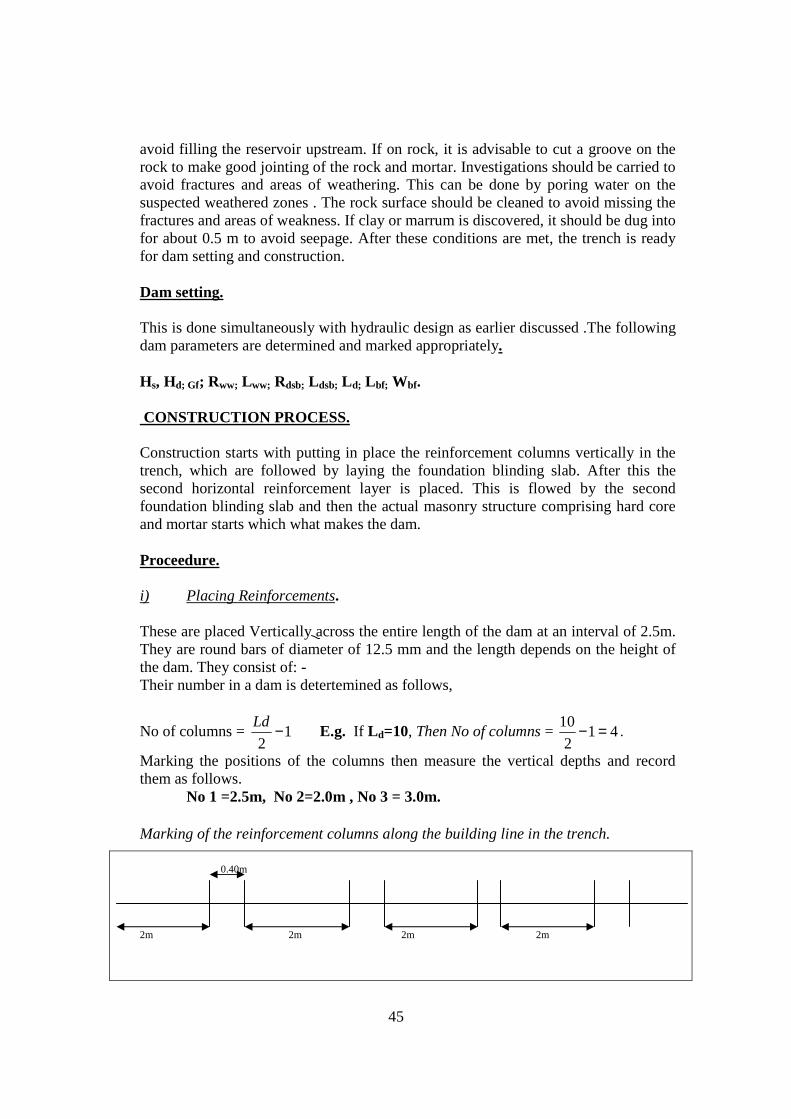
45
avoid filling the reservoir upstream. If on rock, it is advisable to cut a groove on the rock to make good jointing of the rock and mortar. Investigations should be carried to avoid fractures and areas of weathering. This can be done by poring water on the suspected weathered zones . The rock surface should be cleaned to avoid missing the fractures and areas of weakness. If clay or marrum is discovered, it should be dug into for about 0.5 m to avoid seepage. After these conditions are met, the trench is ready for dam setting and construction. Dam setting. This is done simultaneously with hydraulic design as earlier discussed .The following dam parameters are determined and marked appropriately. Hs, Hd; Gf; Rww; Lww; Rdsb; Ldsb; Ld; Lbf; Wbf. CONSTRUCTION PROCESS. Construction starts with putting in place the reinforcement columns vertically in the trench, which are followed by laying the foundation blinding slab. After this the second horizontal reinforcement layer is placed. This is flowed by the second foundation blinding slab and then the actual masonry structure comprising hard core and mortar starts which what makes the dam. Proceedure. i) Placing Reinforcements. These are placed Vertically across the entire length of the dam at an interval of 2.5m. They are round bars of diameter of 12.5 mm and the length depends on the height of the dam. They consist of: - Their number in a dam is detertemined as follows,
No of columns = 12
−Ld E.g. If L d=10, Then No of columns = 41
2
10 =− .
Marking the positions of the columns then measure the vertical depths and record them as follows.
No 1 =2.5m, No 2=2.0m , No 3 = 3.0m.
Marking of the reinforcement columns along the building line in the trench.
0.40m 2m 2m 2m 2m
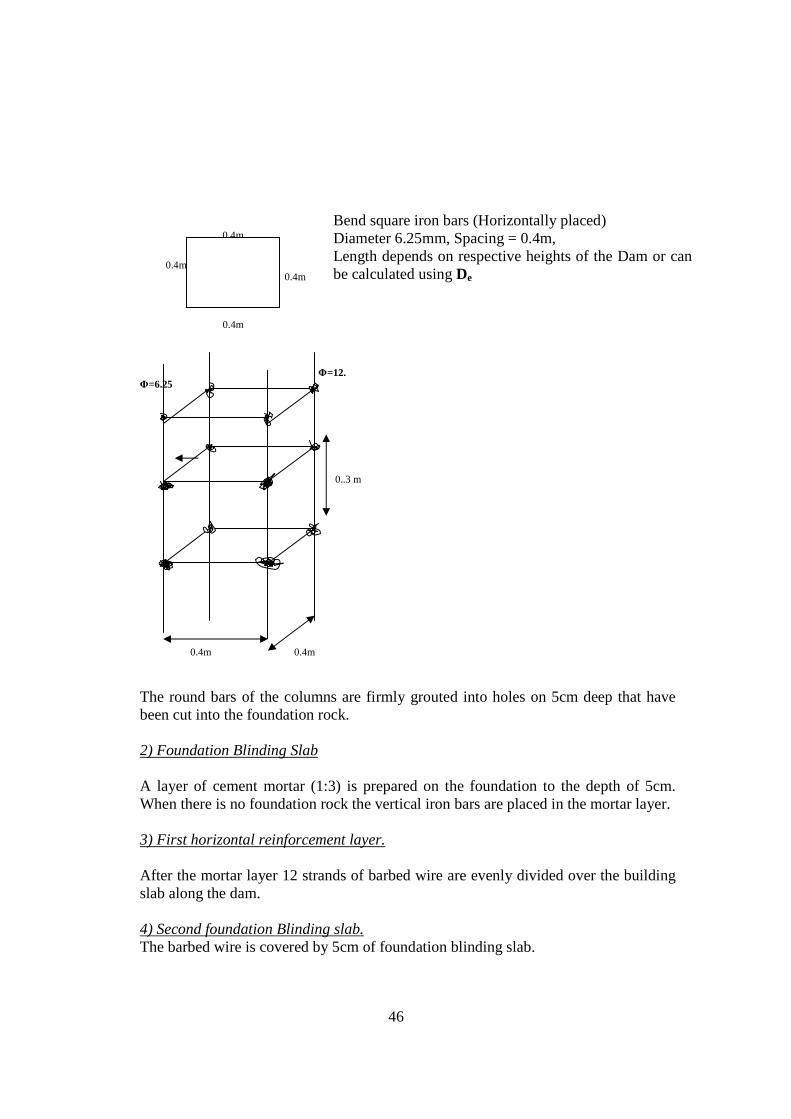
46
0.4m 0.4m
0.4m 0.4m
0.4m
Bend square iron bars (Horizontally placed) Diameter 6.25mm, Spacing = 0.4m, Length depends on respective heights of the Dam or can be calculated using De
Φ=12. Φ=6.25
0..3 m
0.4m 0.4m
The round bars of the columns are firmly grouted into holes on 5cm deep that have been cut into the foundation rock. 2) Foundation Blinding Slab A layer of cement mortar (1:3) is prepared on the foundation to the depth of 5cm. When there is no foundation rock the vertical iron bars are placed in the mortar layer. 3) First horizontal reinforcement layer. After the mortar layer 12 strands of barbed wire are evenly divided over the building slab along the dam. 4) Second foundation Blinding slab. The barbed wire is covered by 5cm of foundation blinding slab.

47
5) Masonry comprising Hard core and mortar Substructure. After the foundation blinding slab sets and holds the columns firmly the foundation trench is filled with masonry comprising clean hard core and mortar (1:4) Mortar for filling should have more water (Sasol name) The joints between the rocks are filled 25mm of this mortar. The rocks should be tapped well to settle completely to all voids.When the filling reaches the level of the back flow, the construction of the backflow should be done along side that of the wall as shown. Plan Y Trench Where filling is done.
River course back flow trench X b) Section x-x (When back flow is on hard formation).
0.5m
Masonry Comprising H/C and mortar (1:4)
100m slab (1:3) with 12 strands of barbed wire.
NB: The back flow for this site is resting on a formation that can support its weight. c) Section x-x (When the BF rests in a soft formation).
It is usually not necessary to dig the whole depth of the trench at the back flow. It can be upto 0. 3m trench.
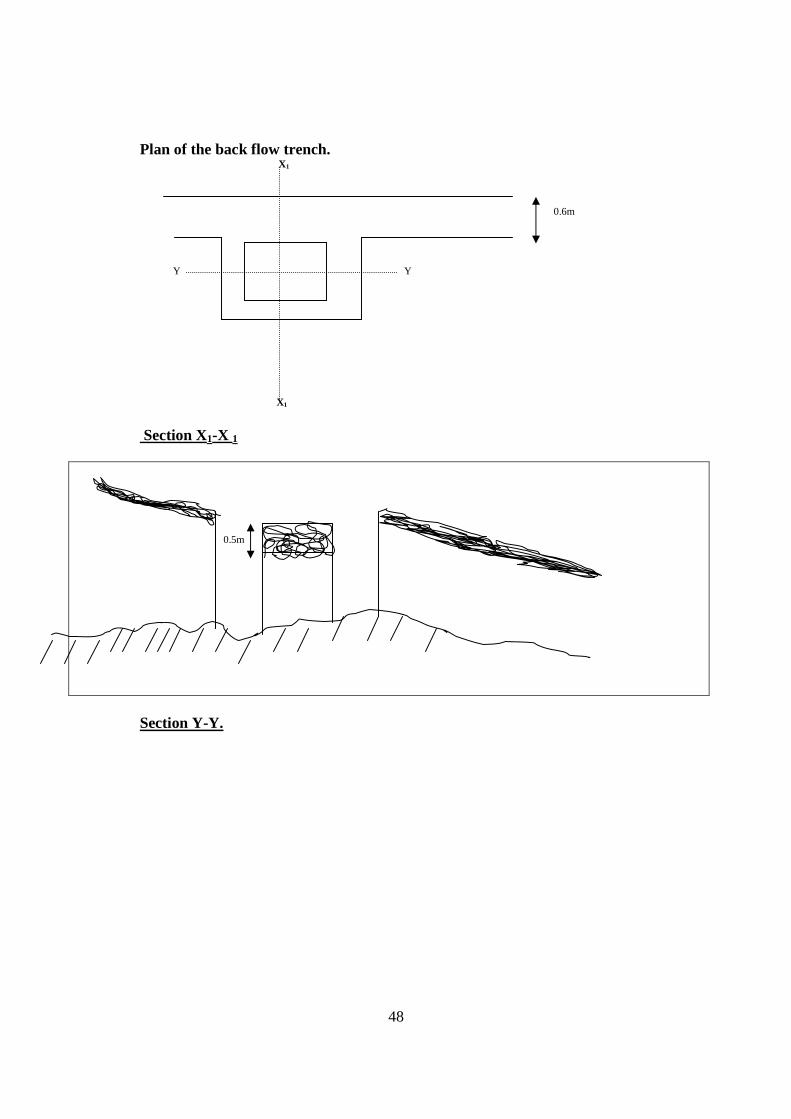
48
Plan of the back flow trench. X1
0.6m
Y Y
X1
Section X1-X 1
0.5m
Section Y-Y.

49
0.5m Section X-X

50
When filling of the main trench and the back flow reaches the sand level, Templates are set and installed within the river basin for the dam to take shape. Plan 5 4 All templates should be tall enough to accommodate the Hd and Hs
Setting of the templates. Template Nature 1 Vertical 2 Slanting 3 Slanting 4 Vertical 5. 6 Vertical
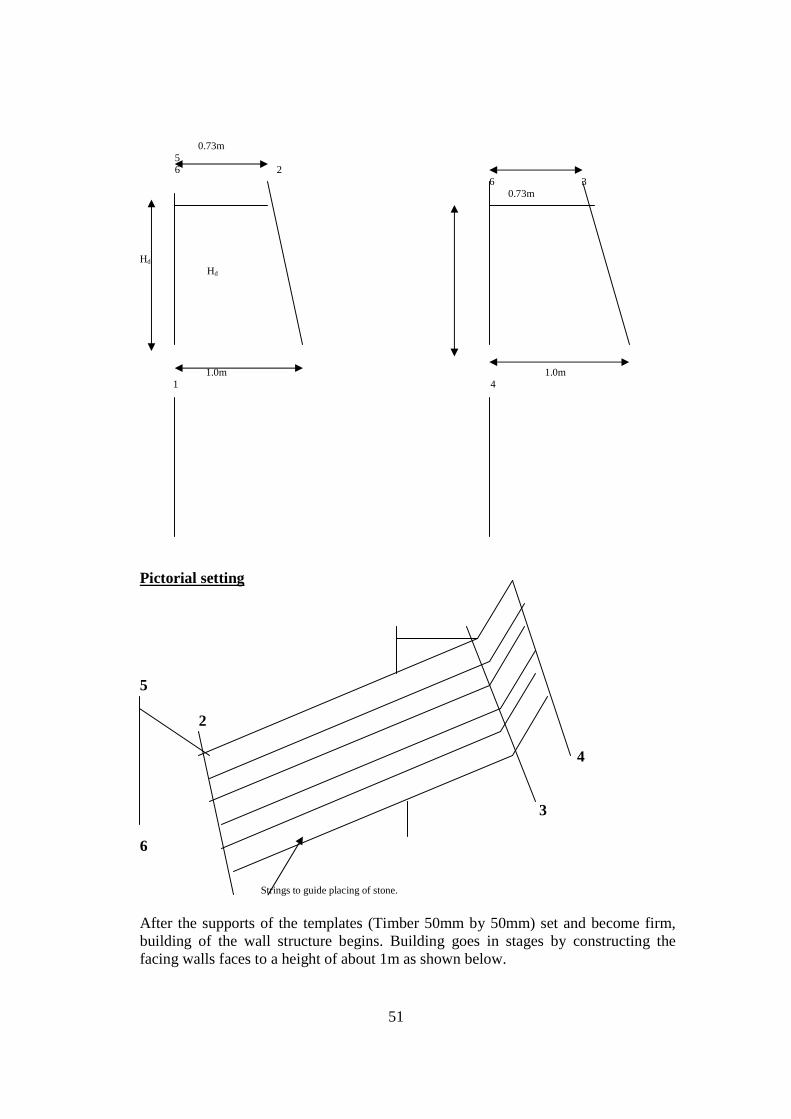
51
0.73m 5 6 2
6 3 0.73m
Hd Hd
1.0m 1.0m 1 4 Pictorial setting 5 2 4 3 6 Strings to guide placing of stone. After the supports of the templates (Timber 50mm by 50mm) set and become firm, building of the wall structure begins. Building goes in stages by constructing the facing walls faces to a height of about 1m as shown below.

52
Upstream Down stream Supporting stick Mortar (1:3) Sliding stone Guiding string
One day after constructing the stone wall, the middle section is filled with masonry comprising hard core and about 25mm mortar (1:4) .The joints between the wall hard core are filled with about 25mm of the mortar (1:3). The mortar used for filling should have more water to avoid seepage. Arrangement of the rocks should be well interlocked for strength. These rocks might be permeable or impermeable. because the dam is build on masonry only. The mortar will fill up the spaces between the stones.
Horizontal Reinforcements.
Strands of barbed wire are placed horizontally every 30cm of construction across to both the wing walls. the width of the wings and the spillway are laid lengthways as before. The number of strands of the barbed wire reduces with two strands every layer starting with ten strands of the barbed wire. Plaster layer The top of the dam is covered by a layer of plaster of mortar (1:3) 1.5cm thick. The wall on the upstream is also plastered to ensure that the dam is watertight and an extra thickness plaster is put at the foot of the wall on either sides of the wall for the same purpose. The wall on the down stream side is plastered for only 15cm (skirting) below the top of the spillway and the wings .The down stream is only decorated at the joints. The Back flow
After the filling has been done to the sand level, a slab of mortar (1:3) of 5cm is laid. Then strands of barbed wire making both lengths and spaces at --- are laid then covered wit a 5cm slab of mortar (1:3) laid and smoothed properly

53
Plan and section view of the finished dam X w Y
X
W
Section X-X 15 cm plaster 15 cm plaster Hard rock

54
Section Y-Y ( The spillway) 0.85m
15cm plaster
Sand level
0.6m 0.4m LBF
Section W-W (wing wall) 0.75cm

55
Key. 1 Wdc 75cm when off the ground and 60cm under the ground.. 100mm slab (mortar 1:3) 2 Main wall of hard cores and cement 9:4:1 3 -50mm Plaster (Mortar 1:3) 4 -Impermeable formation. 2re-h Section w-w 0.85m
15cm plaster
100mm slab(1:3)
0.5m
0.6m 0.4m LBF
NB: Section W-w is through the spillway crest. That is why width is 85cm not usual width 75cm.

56
70-75cm 60cm
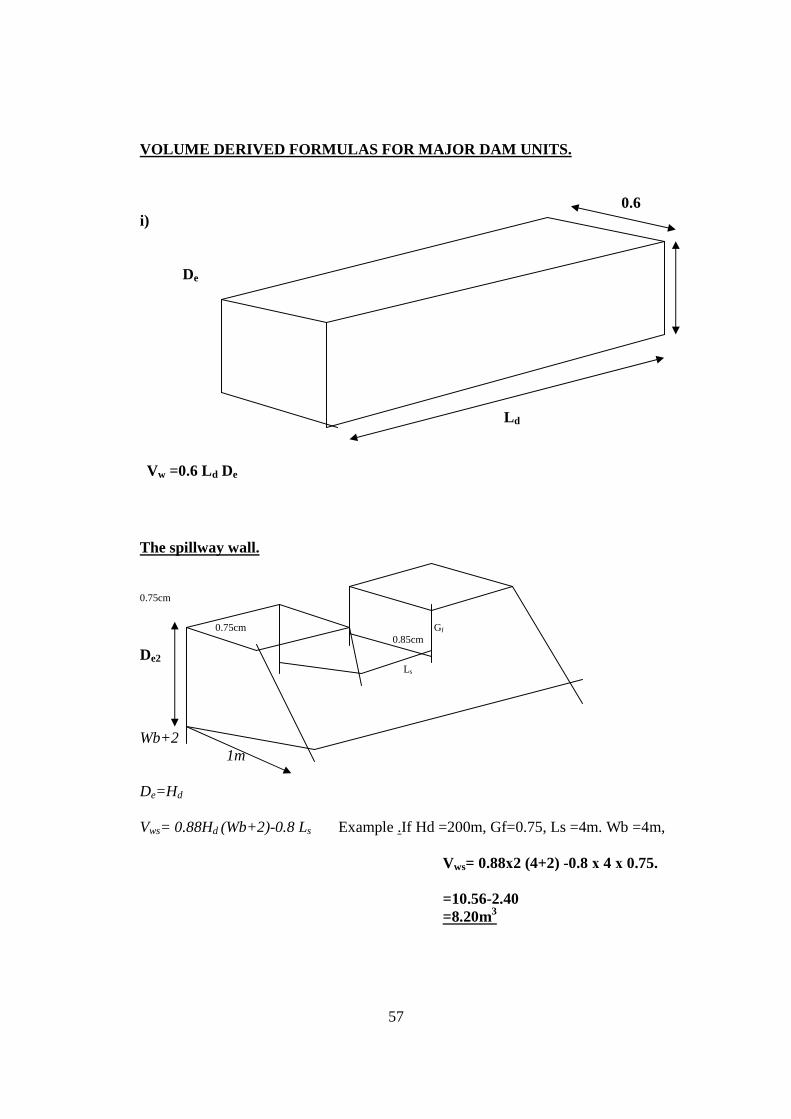
57
VOLUME DERIVED FORMULAS FOR MAJOR DAM UNITS. 0.6 i) De L d Vw =0.6 Ld De
The spillway wall. 0.75cm
0.75cm Gf 0.85cm
De2 Ls
Wb+2 1m De=Hd Vws= 0.88Hd (Wb+2)-0.8 Ls Example .If Hd =200m, Gf=0.75, Ls =4m. Wb =4m,
Vws= 0.88х2 (4+2) -0.8 х 4 х 0.75. =10.56-2.40 =8.20m3

58
Volume of Plaster Crest. -(Ld+2Gf)
0.05cm
0.75cm
Vc=0.75 х 0.05 (Ld+2Gf) =0.04 Ld + 0.08 Gf
=0.04Ld +0.08Gf
L d=20m, Gf=0.75m. Vc=0.04 х 20+0.08 х 0.75
=(0.75+0.06)0.06 is negligible ThereforeVc=0.04Ld
Example. iv) Plaster upstream Vus
Gf
Ls
Hs
)(2
121 HdLdsbRdsBHsLsVus ++=

59
v) Blinding slab Vb
0.1 Ld
0.6m Vb= 0.1 х 0.6Ld Vb= 0.06Ld
vi) Main body of the backflow. Lbf 0.5 Wf
Vwf=0.5Wbf Χ LBf
LBF Vii) Volume of slab.Bf
0.05m WBF
VpBF = 0.05 WBF.LBF

60
BILL OF QUANTITIES. Resources required.
Material Units 1. Cement 50 kg 2. Barbed wire g16 in rolls 3. Reinforcement bars 12.5 mm by 12m 4. Reinforcement bars 6.25 mm by 12m 5. Wire nails 100mm - 6. Cypress timber 50mm by 50mm 7. Polythene paper Rolls 8. Hard core tones 9. Sand tones 10. Water liters 11. Unskilled labor Man-day 12. Skilled laboring, Man-days 13. Supervision Man-days.
CALCULATING QUANTITIES OF MATERIALS. a) Cement.
Found in the main wall, body of the back flow spillway wall mixing ratios 1:4:9 Total Volume of Cement = Vw+ VBF + Vsw
Total Volume of Cement in Masonry.
Mass of cement = VBFVswVw ++(14
l
Bags of Cement= VBFVswVw ++×
(5014
1440)
Cement in Masonry= 2(Vw+Vsw+VBF)
VBFVswVw ++(14
1)

61
Cement is also in Ve, Vus, Vb, VPBF (Mixing ratio 1:3)
Bags of cement=50
4
1×ceml
(Vsw+Vc+Vus+Vb+VpBf)
= )(1450
1440VpbfVbVusVcVsw ++++
×
Cement in Mortar =7.0(Vc+Vus+Vb+VpBf)
Total cement requirement =
b) Hard Core in Tones.
9/14 x Total volume of H/c Total volume of hard core = Hard core in main wall =Hard core in spillway=hardcore in back flow
VH/C = 9/14 (Vw+Vsw+VBF)
Tones of Hardcore =1000
/.
14
9 cPhcVh ××
9/14x2200/1000(Vw+Vsw+VBF)
Tones of H/C in Masonry = 1.4(Vw+Vsw+VBF)
C) Sand in Tonnes.
i) Sand in masonry. ii) Sand in mortar.
Tones of sand in masonry = 4/14 ¥sand/1000(Vw+Vsw+VBF) ¥sand=1600
=0.5(Vw+Vsw+VBF
Tones of sand in mortar (1:3) = 3/4ρ sand/1000(Vc+Vus+Vb+VpBF) ρ sand=1600. (Vc+Vus+Vb+VpBF) Total tones of sand=0.5(Vw+Vsw+VBF)+0.3(Vc+Vus+Vb+VpBF)
2(Vw+Vsw+VBF)+ 7.0(Vc+Vus+Vb+VpBf)

62
d) Reinforcement Bars. Types of reinforcement bars used. i) Round bar 12.5mm diameter and length of 12m. ii) Round bars 6.25mm diameter and length of 12m Nature of placing.
Φ=12.5
Φ=6.25 0..3 m
0.4m 0.4m
Spacing columns. Columns are spaced 2m side to side. No of columns=Ld/2-1 Note that it is unwise to place columns at the extreme like it done in fencing posts. That is why we use.
Total length
No of R12.5mm= No of columns x 4 x De .
DeLd
4)12
( −
Number of pieces of R12. = 12
(12
4 −LdDe
Note: One piece of reinforcement bar=12m.
∴= )12
(33.0 −LdDe
Example. When De=2.0m, Ld=20m
Number of R12.5 bars = 0.33 x 20( 12
20− )
=6.60-0.66 =5.94. Length of one ring of R 6.25 0.4
0.4 0.4
0.4
=0.4 x 4=1.6.

63
e) Barbed Wire. Gauge 16, Length=610m, Spacing= 0.45
Average strands=10
Total length of barbed wire= 10 x Ld
No of layers of Barbed wire =45.0
De
Total length of Barbed wire = 45.0
.10 DeLd
No of rolls of Barbed wire = 61045.0
.10
x
DeLd
No of rolls of Barbed wire = 0.04 L dDe
Example. L d=20, De =2 No of rolls of barbed wire= 0.4 x 20 x 2 = 1.6
Number of rings per evarage columns.
= DeDe
Spacing
De2
5.0==
Total length of R6.25 =Length per Ring x No of Rings per average column x No of columns.
=1.6(2De+1)( 12
−Ld)
= )12
2(6.1 ++− LdDeDeLd
No of R6.25
=12
6.1)1
22( ++− LdDeDeLd
=0.13 )12
2( ++− LdDeDeLd
Example.
Ld=20, De=20.
=0.13 )12
20)22()220( +−− xx
=(5.2 –0.52+1.3+0.13) =6.11 NB: 0.13 can be Negligible. Hence
No of R 6.25=
0.13 )12
2( −−− LdDeDeLd

64
f) Nails. 1 kg on nails is enough. g) Timber A normal dam requires about 15m of cypress timber 50mm x 50 mm. A bigger Dam may require about 30m of the timber. h) Water. Litres of water = 1.8VT x 200 Where VT the total volume of the dam. Hence NB: From Experience 1m3 of a dam requires 1.8 drums of water. i) Skilled Labour. From experience, one artisan and 15 men can construct 1.4m3 of a dam per day. Therefore,
Litres of water = 360 VT
Man artisan days= 4.1
Vt
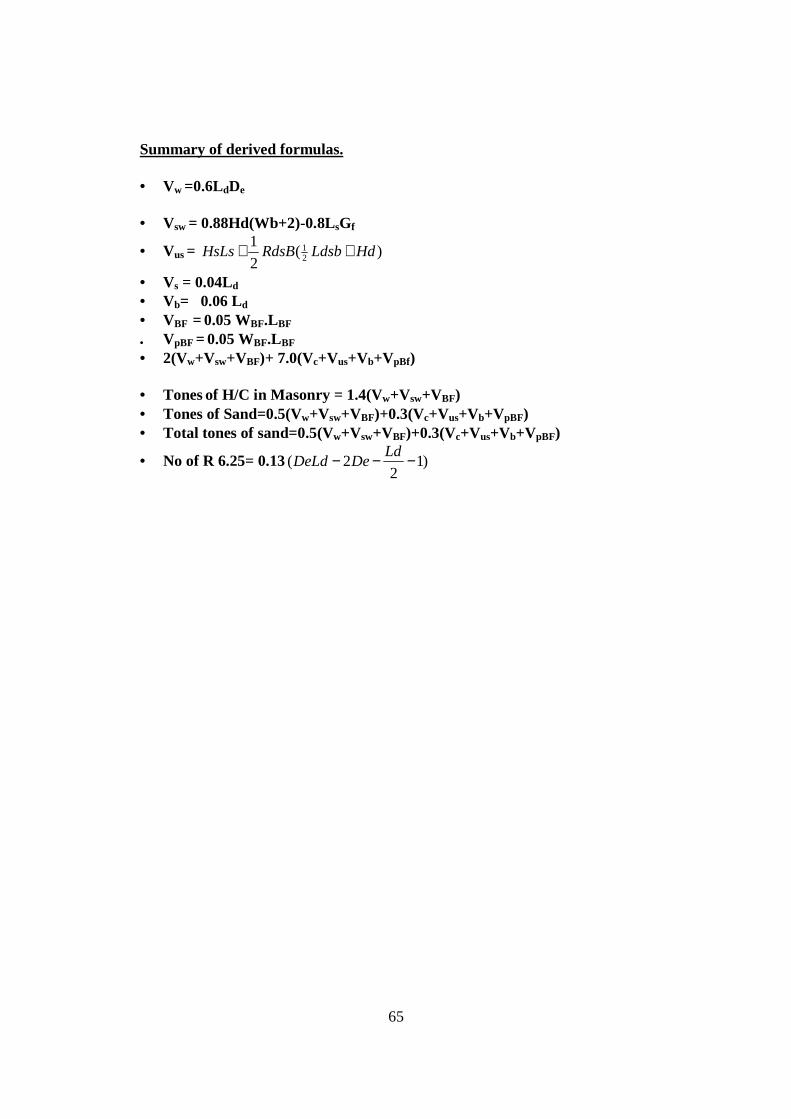
65
Summary of derived formulas. • Vw =0.6LdDe
• Vsw = 0.88Hd(Wb+2)-0.8LsGf
• Vus = )(2
121 HdLdsbRdsBHsLs ++
• Vs = 0.04Ld • Vb= 0.06 Ld • VBF = 0.05 WBF.LBF • VpBF = 0.05 WBF.LBF
• 2(Vw+Vsw+VBF)+ 7.0(Vc+Vus+Vb+VpBf) • Tones of H/C in Masonry = 1.4(Vw+Vsw+VBF) • Tones of Sand=0.5(Vw+Vsw+VBF)+0.3(Vc+Vus+Vb+VpBF) • Total tones of sand=0.5(Vw+Vsw+VBF)+0.3(Vc+Vus+Vb+VpBF)
• No of R 6.25= 0.13 )12
2( −−− LdDeDeLd

66