saskatchewan provincial budget 2018-19publications.gov.sk.ca/documents/15/106322-2018-19 budget for...
TRANSCRIPT

O N T R A C K
18-19SASKATCHEWAN PROVINCIAL BUDGET
The Honourable Donna HarpauerMinister of Finance
14232c1 Budget Cover 2018-19-FA.indd 1 2018-03-13 12:29 PM


MIN ISTER’S MESSAGE
I am pleased to table the 2018-19 Budget and supporting documents for public discussion and review.
ON TRACKOur Government has a plan to return Saskatchewan to a balanced budget by next year, and that plan is
on track.
Faced with significant challenges, including a resource revenue decline of more than $1 billion due in
large part to low oil and potash prices, our Government initiated a three-year plan last year. Our plan
reduces the province’s reliance on resource revenue, controls and carefully manages spending and achieves
a balanced budget in 2019-20.
This year’s budgeted deficit is $365 million in 2018-19. A return to balance is forecast for 2019-20 with a
modest surplus of $6 million. Higher surpluses of $108 million and $212 million respectively are projected
for 2020-21 and 2021-22.
The 2018-19 Budget supports the priorities of Saskatchewan people through major investments in health care,
education, social services and the protection of people and property. It also invests in needed infrastructure,
hospitals, schools and highways, and helps support a strong and growing economy.
We were able to make all of these investments with no increases to tax rates. That means all provincial tax
rates, including those for sales, income, and property tax, remain the same.
The 2018-19 Budget supports our Government’s vision to ensure that Saskatchewan is the best place in
Canada – to live, work, start a business, to get an education and raise a family, and to build a life.
Honourable Donna Harpauer
Minister of Finance


TABLE OF CONTENTS
MINISTER’S MESSAGE
GOVERNMENT DIRECTION FOR 2018-19 On Track . . . . . . . . . . . . . . . . . . . . . . . . . . . . . . . . . . . . . . . . . . . . . . . . . . . . . . . . . . . . . . . . . . . . . . . 6
SASKATCHEWAN BUILDS CAPITAL PLAN . . . . . . . . . . . . . . . . . . . . . . . . . . . . . . . . . . 18
TECHNICAL PAPERS The Saskatchewan Economy . . . . . . . . . . . . . . . . . . . . . . . . . . . . . . . . . . . . . . . . . . . . . . . . . . . . . . . 27
2018-19 Financial Outlook . . . . . . . . . . . . . . . . . . . . . . . . . . . . . . . . . . . . . . . . . . . . . . . . . . . . . . . . 36
2018-19 Borrowing and Debt . . . . . . . . . . . . . . . . . . . . . . . . . . . . . . . . . . . . . . . . . . . . . . . . . . . . . . 47
2018-19 Revenue Initiatives . . . . . . . . . . . . . . . . . . . . . . . . . . . . . . . . . . . . . . . . . . . . . . . . . . . . . . . . 52
Saskatchewan’s Tax Expenditures . . . . . . . . . . . . . . . . . . . . . . . . . . . . . . . . . . . . . . . . . . . . . . . . . . . 57
2018 Intercity Comparison of Taxes and Utilities . . . . . . . . . . . . . . . . . . . . . . . . . . . . . . . . . . . . . . 61
BUDGET FINANCIAL TABLES Budget . . . . . . . . . . . . . . . . . . . . . . . . . . . . . . . . . . . . . . . . . . . . . . . . . . . . . . . . . . . . . . . . . . . . . . . . 66
Statement of Accumulated Deficit . . . . . . . . . . . . . . . . . . . . . . . . . . . . . . . . . . . . . . . . . . . . . . . . . . . 67
Statement of Change in Net Debt . . . . . . . . . . . . . . . . . . . . . . . . . . . . . . . . . . . . . . . . . . . . . . . . . . . 67
Schedule of Pension Liabilities . . . . . . . . . . . . . . . . . . . . . . . . . . . . . . . . . . . . . . . . . . . . . . . . . . . . . 68
Schedule of Capital Assets . . . . . . . . . . . . . . . . . . . . . . . . . . . . . . . . . . . . . . . . . . . . . . . . . . . . . . . . . 68
Schedule of Public Debt . . . . . . . . . . . . . . . . . . . . . . . . . . . . . . . . . . . . . . . . . . . . . . . . . . . . . . . . . . 69
Schedule of Revenue . . . . . . . . . . . . . . . . . . . . . . . . . . . . . . . . . . . . . . . . . . . . . . . . . . . . . . . . . . . . . 70
Glossary of Financial Terms . . . . . . . . . . . . . . . . . . . . . . . . . . . . . . . . . . . . . . . . . . . . . . . . . . . . . . . 71


SASKATCHEWAN PROVINCIAL BUDGET
18-19G O V E R N M E N T D I R E C T I O N F O R 2 0 1 8 - 1 9

Budg
et 2
018-
19
6
Government D i rec t ion fo r 2018 -19 :ON TRACK
Saskatchewan is on track.
Faced with challenging years marked by resource
revenue that declined by more than $1 billion,
due largely to low oil and potash prices, a plan to
restore balance was initiated last year. This Budget
sticks to that plan, to control spending and reduce
Government’s reliance on volatile resource revenue.
Saskatchewan’s finances are improving and our
economy is showing resilience. Oil patch production
has increased and potash mines are more active,
reflecting higher resource prices. Agriculture, the
service industry, the manufacturing sector, and other
engines of the economy are steady, as well.
While positive signs are emerging, challenges remain.
To address those challenges, this year’s budget makes
investments in priorities, supports growth in the
economy, carefully manages expenses and stays
focused on a return to balance.
The goal to balance is important for many reasons.
Staying on a path to balance ensures the long-term
sustainability of the services and programs
Saskatchewan people value – among them health
care, education and services for those most
vulnerable.
Staying on track ensures that investments in
infrastructure, including hospitals, highways and
schools, continue this year and in the years to come.
Over the last decade our province’s population has
grown at the second highest rate in the country –
over 160,000 more people now call Saskatchewan
home.
As it was more than a century ago, Saskatchewan is a
place of opportunity, a place where people see growth
and prosperity. People look to our province as a place
that provides compassion and care.
The Jim Pattison Children’s Hospital is on schedule
to open in Saskatoon in the fall of 2019. This Budget
includes the Province’s final investment to complete
construction of the hospital and continued phase-in
of funding for doctors, nurses and other health
professionals that will provide the best care for
children.
The Government has a balanced budget plan and
that plan is on track.
Saskatchewan’s vision is to be the best place in
Canada – to live, to work, to start a business, to get
an education, to raise a family and to build a life.
Four goals set the Government’s direction for the
province: sustaining growth and opportunities for
Saskatchewan people, meeting the challenges of
growth, securing a better quality of life for all
Saskatchewan people and delivering responsive
and responsible government.
The foundation for the Government’s direction is
strong fiscal management and balanced budgets. In
2017-18, the Government charted a three-year plan
to reduce the province’s dependency on resource
revenue and balance the budget in 2019-20.
Budget 2018-19 keeps that plan on track by
controlling government spending, while at the same
time making important new investments targeted in
health, education and social services to improve the
lives of Saskatchewan people.

Budget 2018-19
7
The new Saskatchewan Hospital North Battleford will
open this fall, replacing a hospital that is more than a
century old.
This new facility is a significant commitment to
address and improve mental health. This Budget
includes funding to finish construction, and funding
for the men and women who will provide care for
people with psychiatric rehabilitation needs.
Investments continue in education, with increased
funding for Saskatchewan classrooms and
investments in school capital projects.
This Budget provides more funding for social services
and assistance, for foster families and those in our
communities who provide direct, daily care for our
most vulnerable children and adults.
The 2018-19 Budget ensures full coverage of HIV
drugs for Saskatchewan people, as well as additional
supports.
This Budget includes individualized funding for each
child under the age of six with Autism Spectrum
Disorder, to help children and their families access
additional support.
This Budget continues funding for the Regina Bypass,
completes funding for the Saskatoon North
Commuter Bridge, and invests in transportation
capital and maintenance to help people travel more
easily and move our products to market, but most
importantly to improve safety and save lives.
Those are a few examples of how the 2018-19 Budget
demonstrates Government’s commitment to ensuring
Saskatchewan stays on track.
There’s more to do. There are challenges to tackle.
The important goal of achieving balance in order to
ensure sustainability continues to be pursued, and
balance is in sight.
ECONOMIC GROWTHSaskatchewan’s economy is projected to have the
fourth highest growth in the country in 2018,
according to private sector forecasters. In 2019,
Saskatchewan is projected to have the third highest
economic growth among provinces.
Saskatchewan’s export-based economy is fueled by
strong global economic growth. The value of the
province’s exports rose 8.7 per cent to approximately
$28.9 billion last year, up more than $2 billion from
2016.
Agriculture exports were $13.5 billion last year, the
fourth highest total on record, with sales to 143
countries.
To help further support the economy and this vital
sector, this Budget introduces a Saskatchewan Value-
added Agriculture Incentive for corporations making
a minimum capital investment of $10 million in an
eligible project.
To be eligible, projects must upgrade or transform
raw or primary agricultural products. The incentive is
provided through a non-refundable income tax credit
equal to 15 per cent of the eligible project’s qualifying
capital investments.
POPULATION GROWTH BY PROVINCE(January 2018 over January 2008)
Source: Statistics Canada
0
5
10
15
20
25
NLPENSNBQCONMBSKABBC
Per C
ent
Canada 11.8%
15.8%

Budg
et 2
018-
19
8
Also important to Saskatchewan’s economy is the
ability to help create an environment for innovation
and support for technology companies in their
infancy.
The Saskatchewan Technology Start-up Incentive
introduced in this Budget will provide eligible
investors with a non-refundable income tax credit
equal to 45 per cent of qualifying new investments
made in eligible small businesses.
Eligible small businesses are early stage technology
start-ups that are developing new technologies, or
applying existing technologies in a new way to create
new proprietary products, services or processes that
are repeatable and scalable.
Eligible small businesses must also be incorporated
and headquartered in Saskatchewan and have fewer
than 50 employees, the majority of which are located
in the province.
Combined with competitive taxes and labour costs,
targeted incentives like these continue to support
diversification and growth in Saskatchewan’s
economy.
A number of indicators point to a Saskatchewan
economy that is on track.
Manufacturing sales were $15.9 billion in 2017, up
12.6 per cent year-over-year, representing the fourth
highest growth among provinces in 2017. Sales of
new motor vehicles were up 8 per cent, again the
fourth highest growth among provinces. Building
permits, wholesale and retail trade were all up in
2017, as were oil and potash production.
The Fraser Institute’s Annual Survey of Mining
Companies 2017 named Saskatchewan the best place
in Canada and the second best jurisdiction in the
world for mining investment, based on competitive
taxes, regulatory certainty and permitting practices.
The Institute’s survey has ranked the province first or
second in the world in each of the last four years, as
well as first in the nation in all four years.
(More detailed economic information is provided in
The Saskatchewan Economy technical paper
beginning on page 27 and in the 2018-19 Revenue
Initiatives technical paper which begins on page 52.)
FISCAL PICTURESaskatchewan is on track with its financial plan to
return to balance, with a steadily improving outlook
over the next four years.
A deficit of $365 million is projected for 2018-19.
A return to balance is forecast for 2019-20 – a modest
surplus of $6 million, with higher surpluses of
$108 million projected in 2020-21 and $212 million
forecast in 2021-22.
Revenue is forecast at $14.24 billion in the
2018-19 Budget, up about $80 million from last
year’s budget and $300 million higher than the
2017-18 third quarter forecast.
SASKATCHEWAN REAL AND NOMINAL GDP LEVEL
Source: Ministry of Finance
0
20
40
60
80
100
20212019201720152013201120092007
Billio
ns o
f Dol
lars
Forecast
Real Nominal Nominal GDP Trendline

Budget 2018-19
9
The increase in expected revenue in the
2018-19 Budget over last year is largely attributable
to higher non-renewable resource revenue, net
income from Government Business Enterprises, and
other own-source revenue. Taxation is lower largely
due to lower individual and corporation income tax
revenue, offset by higher revenue from provincial
sales tax.
Expense is forecast at $14.61 billion in 2018-19,
down from the previous year’s budget by
$200 million, and up $70 million from the 2017-18
third quarter forecast.
The 2018-19 Budget provides increases for health,
social services and assistance, protection of persons
and property, as well as the K-12 and post-secondary
education sectors. However, total expense is lower
than the previous year’s budget as a result of lower
pension expense, primarily due to a significant
decrease in Government’s pension liability. Expenses
are also projected to be down across many other
areas, as entities are managing spending carefully
while continuing to provide high quality services to
Saskatchewan people.
(More information is available in the 2018-19
Financial Outlook, beginning on page 36.)
IMPROVED REVENUE STABILITYGovernment has worked to modernize the tax
system, in order to move away from an over-reliance
on volatile resource revenue.
Improved revenue stability helps Government plan
and invest in needed priority services, programs, and
the infrastructure Saskatchewan people value.
In this Budget, all provincial tax rates, including
Provincial Sales Tax (PST), Education Property Tax
(EPT), and income tax rates are being held at their
current levels.
A measure being taken, consistent with the shift to
consumption taxes, is the broadening of the existing
application of PST to used light vehicles, effective
April 11, 2018.
This measure aligns Saskatchewan’s tax treatment on
used light vehicles with every other jurisdiction in
the country that applies a sales tax. In addition, the
trade-in allowance which allows a deduction for the
value of a trade-in when determining PST is
reinstated, so PST will only be paid on the difference
in price between the trade-in vehicle and the
purchased vehicle.
Unique to Saskatchewan, PST will not be applied to
the private sale of used vehicles with a purchase price
of up to $5,000. Private sales of used vehicles
registered for commercial use, as well as dealer sales
of used vehicles, are not eligible for the $5,000
exemption.
And PST will not be charged for used vehicles gifted
between qualifying family members – spouses,
parents or legal guardians, children, grandparents,
grandchildren or siblings.
Also, the PST exemption for ENERGY STAR®
appliances is removed. Energy efficient appliances are
more common and affordable than in the past. Energy
cost savings provide a strong incentive for consumers
to choose these appliances.
While it remains unclear exactly when the federal
government’s legalization of cannabis will occur, and
the size of the cannabis market and retail pricing is
difficult to predict, Saskatchewan will follow a
taxation approach agreed to by Canadian Finance
Ministers in late 2017.
Saskatchewan intends to formalize its participation
by entering into a two-year agreement, where the
Province will receive 75 per cent of the federal
cannabis excise duty revenue.

Budg
et 2
018-
19
10
PST will also apply to all retail sales of cannabis
products in Saskatchewan and the federal excise duty
rate will be increased to account for interprovincial
sales tax rate differentials. Saskatchewan will receive
this revenue from the federal government.
Personal Income Tax (PIT) rates were reduced by
half a point in 2017 and are staying the same in the
near term, pausing the rate reduction plan announced
last year. Income tax bracket indexation has also been
paused.
Since 2008, PIT exemptions have removed 112,000
people from the province’s income tax roll and PIT
reductions introduced over the past decade, as well
as last year’s half-point rate reduction, are providing
over $606 million in annual income tax savings to
Saskatchewan people.
A Saskatchewan family of four pays no provincial
income tax on their first $51,600 of combined
income. In 2007, that threshold was much lower, as
a family of four began paying provincial income tax
once their combined income reached just $26,150.
A Saskatchewan family of four with $100,000 in total
income pays $1,945 less in combined provincial
income and sales tax in 2018 compared to 2007.
In terms of tax competitiveness for businesses,
Saskatchewan has the highest small business income
threshold in the country – that is, the amount of
income up to which businesses pay tax at the much
lower two per cent small business tax rate. The
threshold went up from $500,000 to $600,000
effective January 1, 2018.
Saskatchewan’s 12 per cent corporate income tax rate
continues to be among the lowest in the country,
matching the rates of the other western provinces.
(More information is included on pages 52 to 56
in the 2018-19 Revenue Initiatives section and
pages 57 to 60 of the Saskatchewan’s Tax Expenditures
section, and in the 2018 Intercity Comparison of
Taxes and Utilities on pages 61 to 64.)
CONTROLLING SPENDINGGovernment continues to control and carefully
manage spending in the 2018-19 Budget.
Many ministries and agencies are forecasting lower
spending than in the previous fiscal year, while
continuing to provide valued core services and
programs.
Controlling compensation costs, the largest single
component of Government’s expense, is key to
keeping Saskatchewan’s fiscal plan on track.
Employers and unions understand the fiscal
environment and continue to bargain in good faith.
Through the bargaining process, fair and equitable
agreements will be achieved.
In addition to negotiated settlements, there is a target
to achieve $70 million in savings over two years,
$35 million in this Budget and a further $35 million
next fiscal year. This is largely through efficiency
initiatives and attrition as part of Government’s
commitment to return to balance in 2019-20.
Using tools like vacancy management, overtime
management and internal process improvement, the
strategy is specific to Executive Government and the
Crown corporations. And while the request hasn’t
been extended to major third parties, Government
expects them to continue to manage their resources
in the most efficient way possible.
An example of achieving efficiencies through positive
change is the creation of a single Saskatchewan
Health Authority.

Budget 2018-19
11
The consolidation of 12 regional authorities was
completed last year to improve front-line patient care
for Saskatchewan people.
Greater integration and coordination has resulted in
savings of $19 million in this Budget, from salaries,
the amalgamation of IT services, and lower board costs.
Savings continue to be realized across Government,
mainly by exploring new ways to address challenges.
The Ministry of Central Services, for example, has
reduced the size of its government vehicle fleet
budget by 14.7 per cent, saving more than $5 million,
in part by using private rental cars where it proves to
be more efficient and cost effective.
These are a few examples of Government seeking
changes to improve services while controlling
spending in order to meet the challenges of lower
revenues and the needs of a growing province.
Overall, Government has managed expense carefully
over the past several years. Expense was down
2 per cent in 2016-17 from the previous year.
In 2017-18, expense is forecast to be down a further
2 per cent. And in this Budget, expense is forecast to
be about the same level as the 2017-18 third quarter
forecast.
PRIORITY INVESTMENTSIn Saskatchewan, investment into three priority
areas – health, education and social services and
assistance is $10.4 billion in this Budget – an increase
of more than 64 per cent or $4 billion since 2007-08.
This accounts for 70 per cent of overall government
spending.
In 2018-19, total spending for health is projected
to be $5.77 billion, an increase of $138 million or
2.5 per cent over last year’s budget. This includes
spending through the Ministry of Health, the
Saskatchewan Health Authority, the Saskatchewan
Cancer Agency, eHealth, the Health Quality Council,
3sHealth, and the Physician Recruitment Agency.
Billio
ns o
f Dol
lars
0
1
2
3
4
5
6
2018-19Budget
2017-183rd Qtr.
2016-172015-162014-152013-142012-132011-122010-112009-102008-092007-08
Health All OtherEducation Social Servicesand Assistance
SPENDING BY THEME
Boards of Education did not become part of the Government Reporting Entity until 2009-10.Source: Saskatchewan Budget, Public Accounts

Budg
et 2
018-
19
12
This Budget provides $3.5 billion for Saskatchewan
Health Authority base operating funding and targeted
programs and services, an increase of $71.87 million,
or 2.1 per cent from 2017-18.
Included is a $25 million increase for general
operations and services, as well as $11.4 million in
new funding for mental health initiatives and
$12 million in additional funding for home and
community care initiatives.
There is a $16.8 million increase for physician and
operating capacity for the Jim Pattison Children’s
Hospital, and $14.2 million in new funding for
operating and accommodations costs at the
Saskatchewan Hospital North Battleford.
There is also a $49.4 million increase for physician
services, including existing services and the
recruitment of new specialists and primary
physicians.
There is additional funding of $700,000 to increase
coverage for HIV drugs to 100 per cent from
91 per cent, as well as provide additional HIV
supports.
Higher investments into classrooms highlight
education expense, budgeted at $3.26 billion – down
$268 million from last year, primarily due to a
decrease in Government’s pension liability for the
Teachers’ Superannuation Plan.
Education includes budgeted spending through the
Ministries of Advanced Education, Education, and
Immigration and Career Training, the Boards of
Education, Saskatchewan Polytechnic, Regional
Colleges, the Saskatchewan Apprenticeship and Trade
Certification Commission, the Saskatchewan Student
Aid Fund and the Teachers’ Superannuation Plan.
Saskatchewan’s school divisions will receive
$1.87 billion in operating funding for the 2018-19
school year, a $30 million increase over last year.
There is also $20.8 million in new funding from the
federal government through the recently signed
Canada-Saskatchewan Early Learning and Child Care
Agreement. The funding allows for the continued
support of more than 16,000 licensed child care
spaces and for the addition of 2,500 more by 2020.
The 2018-19 expense budget for the Ministry of
Advanced Education is $729 million, an increase
of $11 million from last year. It includes an
$18.3 million increase to ensure a successful College
of Medicine that provides quality medical education.
This Budget supports the continuation of the
Saskatchewan Advantage Scholarship, which assists
Saskatchewan students with post-secondary tuition
costs, and the Graduate Retention Program, one of
the most aggressive and successful youth retention
programs in the country, providing up to $20,000 in
income tax credits to graduates who live and work in
Saskatchewan.
Social services and assistance includes the
budgeted spending of the Ministry of Social Services,
the Saskatchewan Housing Corporation, the
Saskatchewan Legal Aid Commission, as well as
portions of the Ministries of Government Relations,
Justice and Attorney General and Advanced
Education.
Social services and assistance expense is $1.38 billion
in the 2018-19 Budget, an increase of $25 million, or
1.8 per cent, over last year, and a 53 per cent increase
since 2007-08 when total expense was $900 million.
This Budget includes a $14.2 million increase to
address higher Saskatchewan Assistance Program
caseloads.

Budget 2018-19
13
In this Budget, $10.4 million will be targeted to those
in communities providing direct daily care to adults
with intellectual disabilities and mental health
challenges, direct supports to families, and daily care
for children in need of protection.
This includes funding increases for foster families,
community-based organizations (CBOs) that deliver
day programs and residential services to persons with
intellectual disabilities and other CBOs that provide
family-focused services.
The 2018-19 Budget has $10 million to continue
moving residents from Valley View Centre into
community-based care, and $9 million to provide
services for adults with intellectual disabilities whose
needs have increased.
Significant investment into protection of
persons and property is prominent in this year’s
budget. Expense in this area is increasing in the
2018-19 Budget to $690 million, up $46 million,
or 7.2 per cent, from last year.
Protection of persons and property expense includes
portions of the Ministries of Government Relations,
Justice and the Attorney General, Corrections and
Policing, Labour Relations and Workplace Safety, as
well as the entire appropriation for the Advocate for
Children and Youth, the Information and Privacy
Commissioner and the Ombudsman and Public
Interest Disclosure Commissioner, among a number
of other accounts and funds.
Combined increases in the Ministries of Justice and
the Attorney General and Corrections and Policing,
including amounts funded through the new
Integrated Justice Services vote, total more than
$45 million.
Highlights include increases of $13.6 million for the
RCMP, $11.4 million to operate the province’s
correctional facilities, $9 million for utilization of
court services, $4.9 million to enhance the Rural
Crime Strategy, and $1.8 million to expand the
Remand Reduction Strategy aimed at reducing
corrections and court system pressures.
While expense is being managed carefully, there
continues to be significant investments into programs
and services across all areas of government in:
agriculture, community development, economic
development, environment and natural resources,
and transportation.
Further details of highlights in these areas related to
the 2018-19 Budget are outlined in media releases
and backgrounders from individual ministries and
agencies.
INVESTING IN INFRASTRUCTURE The 2018-19 Budget includes $2.7 billion for
investment into Saskatchewan’s infrastructure. The
commercial Crown sector is investing $1.5 billion
and $1.2 billion is being invested by Executive
Government ministries and agencies.
This Budget includes $20 million for the final
investment of the Province’s $235.5 million
commitment to the Jim Pattison Children’s Hospital
in Saskatoon. The 176-bed facility is scheduled to
open in the fall of 2019.
There is $34 million in this year’s budget to complete
construction of a unique 284-bed psychiatric care
facility, Saskatchewan Hospital North Battleford,
which is scheduled to open in the fall of this year.
The hospital replaces a facility that is over 100 years
old and includes secure beds to provide mental health
care for people in custody, a step forward in breaking
the cycle of crime and victimization.
Construction of the Regina Bypass continues to move
forward, with completion slated for late 2019. This
year, $330 million will be invested in work on phase
two, which has and will vastly improve highway
safety and traffic flow.

Budg
et 2
018-
19
14
It’s part of a $924 million Ministry of Highways and
Infrastructure’s budget commitment to build, operate
and maintain transportation capital.
In the fall of 2018, Saskatoon’s new North Commuter
Parkway Bridge will improve traffic flow and safety
in Saskatchewan’s largest city, and $15 million
provided in this Budget completes Government’s
$50 million commitment to the project.
The 2018-19 Budget provides $10.5 million for a
major school consolidation project in Rosthern, and
$12.2 million for a similar project in Weyburn, as
well as $49.6 million for school maintenance and
emergency funding, up $6.4 million from last year.
These are just a few highlights among many, across
Executive Government.
In 2018-19, major Crown projects include
$883 million at SaskPower, primarily to connect
customers and expand electricity generation assets to
meet growing customer power needs. SaskPower also
plans to renew its distribution and transmission
systems to ensure continued reliable service.
Investment of $298 million is projected at SaskTel to
increase and upgrade its wireless and wireline
networks, improve customer service through network
growth and modernization, enhance rural services,
and continue the roll out of infiNET, its high-speed
fibre-optic internet service.
SaskEnergy plans to invest $268 million to ensure
the integrity of its natural gas transmission and
distribution system, providing safe and reliable
service that meets continually growing customer
demand. SaskWater plans to invest $34 million in
2018-19 for the creation of water and wastewater
systems, and the maintenance of infrastructure to
ensure the continued delivery of safe and reliable
water and wastewater services.
(More detail is in the Saskatchewan Builds Capital
Plan on pages 18 to 23.)
DEBT MANAGEMENTResponsible debt management keeps Saskatchewan
on track.
Saskatchewan’s forecasted 26.1 per cent of total
debt-to-GDP as of March 31, 2018 is third lowest
among the provinces, according to the Dominion
Bond Rating Service’s most recent analysis. Prince
Edward Island is fourth lowest at 34.0 per cent,
and Newfoundland and Labrador has the highest
debt-to-GDP ratio at 74.6 per cent.
The 2018-19 Budget estimates all government debt,
including that of Crown corporations, to remain
manageable at $20.0 billion as at March 31, 2019.
Government’s operating debt is nearly 10 per cent
lower than it was in 2008, resulting in cumulative
savings of over $1.1 billion in interest payments.
Strong credit ratings, low interest rates and our
province’s low debt-to-GDP, make this a cost-effective
time to finance capital, using a disciplined approach,
and matching the benefits of the assets with the term
of payments.
2017-18 TOTAL DEBT (PER CENT OF GDP)
DBRS-Adjusted Total Debt as at March 31, 2018.Sources: Statistics Canada, Conference Board of Canada
01020304050607080
NLPENSNBQCONMBSKABBC
Per C
ent o
f GDP
25.6
14.3
26.1
66.9
45.1
62.656.0
34.4 34.0
74.6

Budget 2018-19
15
The additions to capital assets (net of amortization)
for 2018-19 is almost $1.2 billion, including
$508 million in government service organizations
and $684 million in government business enterprises,
largely the major Crown corporations. The total
budgeted book value of tangible capital assets at
March 31, 2019 is $27.1 billion.
A key principal of Government’s capital financing
plan is the repayment of capital debt upon maturity.
At least two per cent of the value of these borrowings
is set aside and invested each year to ensure sufficient
cash is available to repay capital debt as it comes due,
ensuring it isn’t passed on to future generations.
(More information on 2018-19 Borrowing and Debt
begins on page 47.)
CONCLUSIONSaskatchewan is on track. Our province’s economy
and population are growing, and the Government’s
three-year plan to return the budget to balance
remains on target.
The 2018-19 Budget controls spending and continues
to follow a plan that shifts away from over
dependence on volatile revenue to a more stable base.
This Budget invests in needed infrastructure,
hospitals, schools and highways and supports growth
in the Saskatchewan economy. This Budget invests in
the priorities of health care, education, social services
and the protection of people and property.
Importantly, the 2018-19 Budget is on track with the
plan to balance.
The pursuit and ultimate realization of the fiscal plan
ensures the long-term sustainability of the services
and programs Saskatchewan people value.
A plan to balance ensures a stronger Saskatchewan in
the future, better positioned for growth and better
able to meet the challenges ahead.
Billio
ns o
f Dol
lars
0
5
10
15
20
2018-19*2017-18*2016-172015-162014-152013-142012-132011-122010-11
Government Service Organizations Government Business Enterprises
6.6 6.8 7.08.2
7.4
9.37.9
11.2
8.4
12.5
9.2
13.3
10.3
13.9
11.3
14.6
11.8
15.3
GROWTH OF TANGIBLE CAPITAL ASSETS
* Forecast

Budg
et 2
018-
19
16
SASKATCHEWAN PROVINCIAL BUDGET
18-19S A S K AT C H E WA N B U I L D S C A P I T A L P L A N

Budg
et 2
018-
19
18
SASKATCHEWAN BUILDS CAPITAL PLAN(2018 -19 to 2021 -22 )
CAPITAL PLAN HIGHLIGHTSThe 2018-19 Saskatchewan Builds Capital Plan
includes the capital investment activities of Executive
Government ministries and agencies. The plan
strategically aligns capital expenditures to the
province’s growth and quality of life priorities, and
serves to strengthen the reporting on Government’s
infrastructure investments.
Including the $1.2 billion provided in the
2018-19 Budget, $12.4 billion has been provided
since 2008-09 to meet ongoing infrastructure needs,
as well as to support future growth and expanded
economic opportunities. This includes critical
funding for schools, health care facilities, roads,
bridges, highways and municipal infrastructure. The
2018-19 Saskatchewan Builds Capital Plan continues
to balance the need for further capital funding with
long-term sustainability.
Investing in the infrastructure required to foster
economic growth and address the challenges of
growth is a core component of The Saskatchewan Plan
for Growth. Strategic and sustainable infrastructure
expenditures support all sectors of the economy and
provide the base to support continued growth and
keep Saskatchewan On Track.
Milli
ons o
f Dol
lars
0
200
400
600
800
1,000
1,200
1,400
1,600
1,800
2,000
2021-22 Target
2020-21 Target
2019-20 Target
2018-19 Budget**
2017-18 Forecast
2017-18 Budget
2016-17 Actual
2015-16 Actual
2014-15 Actual
2013-14 Actual
2012-13 Actual
2011-12 Actual
2010-11 Actual
2009-10 Actual
2008-09 Actual*
2007-08 Actual
551
1,361
927
1,174
612780
954
1,592 1,582
823
1,241
854746 772
1,757
1,154
SASKATCHEWAN BUILDS CAPITAL PLAN
* The 2008-09 Budget provided $829M for capital expenditures. Actual capital expenditures were $1.361B in 2008-09.** The 2018-19 Budget includes the transfer of government’s ownership interest in laboratory equipment to the Saskatchewan
Health Authority. The capital investment before this adjustment is $1,239,473K.
The 2018-19 Budget includes a total capital
investment of over $2.7 billion, including Crowns
and the $1.2 billion outlined in this plan.

Budget 2018-19
19
In addition to the Saskatchewan Builds Capital Plan,
capital spending by the Crowns is projected to be
over $1.5 billion in 2018-19. Between 2018-19 and
2021-22, Crown corporations forecast average annual
expenditures of $1.4 billion to maintain existing and
build new infrastructure.
The 2018-19 to 2021-22 Saskatchewan Builds Capital
Plan outlines projects approved to date and provides
an estimate of anticipated future capital investment.
The plan is detailed as follows.
2017-18 2017-18 2018-19 2019-20 2020-21 2021-22(Thousands of Dollars) Budget Forecast Budget* Target Target Target
Capital Asset Acquisitions (Government-Owned Capital) 1,065,379 1,094,704 779,327 450,780 386,214 383,339Capital Transfers (Third-Party Capital) 526,316 486,908 461,683 403,446 359,610 388,687
Saskatchewan Builds Capital Plan Total 1,591,695 1,581,612 1,241,010 854,226 745,824 772,026
Capital Plan by Sector
Transportation Infrastructure – $690.8M in 2018-19Highways Capital (including Regina Bypass) 842,882 912,882 672,882 387,684 345,682 342,882Highways Partnerships and Supporting Capital 17,955 17,955 17,955 17,805 17,805 17,805
Municipal Infrastructure – $206.5M in 2018-19Municipal Programs 279,261 246,863 206,466 106,032 100,034 100,077
Education Capital – $76.4M in 2018-19Schools (including Joint-Use school projects) 75,886 65,876 26,813 36,398 12,320 10,666Preventative Maintenance and Renewal 43,200 43,200 49,600 55,900 62,300 75,300
Advanced Education – $22.4M in 2018-19Maintenance Capital 21,500 21,500 22,400 25,300 27,200 29,100
Health Care – $128.2M in 2018-19Maintenance and Facility Regeneration 34,700 34,700 44,600 54,380 64,280 74,180Health Equipment 15,723 15,723 22,360 23,343 23,943 24,543Long-term Care (including Swift Current LTC) 6,730 6,730 – – – –Hospitals (including SHNB-ICF) 174,000 139,000 61,200 8,300 – –
Government Services – $116.7M in 2018-19IT Capital 25,225 25,069 31,598 20,228 1,775 1,700Courts and Corrections Capital 16,704 14,565 17,039 10,189 7,689 4,180Parks Capital 5,050 5,050 9,500 9,500 9,500 9,500Equipment Capital 21,852 21,707 15,680 17,471 12,660 12,660Government Buildings 9,152 9,017 9,452 18,817 12,417 12,417Other Capital 1,875 1,775 33,465 62,879 48,219 57,016
Saskatchewan Builds Capital Plan Total 1,591,695 1,581,612 1,241,010 854,226 745,824 772,026
* The 2018-19 Budget includes the transfer of government’s ownership interest in laboratory equipment to the Saskatchewan HealthAuthority. The capital investment before this adjustment is $1,239,473K.
SASKATCHEWAN BUILDS CAPITAL PLAN – 2018-19 TO 2021-22

Budg
et 2
018-
19
20
The chart below outlines the main categories of
infrastructure expenditure by sector expected over
the next four years.
The long-term sustainability of provincial
infrastructure requires investments be made toward
the maintenance and renewal of these assets. The
2018-19 Budget provides over $116.6 million for
maintenance investment in existing capital in
Advanced Education, Health and Education. This
amount represents an increase of $17.2 million or
17.2 per cent. The four-year plan includes consistent
increases for important capital maintenance activities
to reinvest in and protect existing infrastructure.
CAPITAL PLAN DETAILS
Transportation Infrastructure
The 2018-19 Budget provides $691 million in capital
funding for transportation infrastructure. Safety is a
primary focus of this spending in 2018-19 with about
$51 million being directed toward major safety
projects in the province, including continued work
on interchanges for Warman and Martensville, as well
as multiple twinning and passing lane projects on
busy highways throughout the province.
Funding is provided to continue work on twinning
Highway 7 between Vanscoy and Delisle; to start a
series of twinning and passing lane projects on
Highways 6 and 39 between Regina and Estevan; to
build two sets of passing lanes on Highway 4 between
North Battleford and Cochin; and to begin pre-
construction and design work for passing lanes on
Highway 7 between Rosetown and the Alberta border,
Highways 9 and 10 between Melville and Canora,
and Highway 5 between Highway 2 and Saskatoon.
In addition to major safety improvements, over
100 km of rural highways will be upgraded. Some of
this work includes upgrades on Highway 4 between
Val Marie and Cadillac, Highway 36 between
Highway 18 and Willow Bunch and Highway 255
south and west of Tobin Lake.
0
200
400
600
800
1,000
1,200
1,400
1,600
1,800
2021-22 Target2020-21 Target2019-20 Target2018-19 Budget*2017-18 Budget
AdvancedEducation
Transportation School
Capital
Milli
ons o
f Dol
lars
Municipal Infrastructure
HealthCare
GovernmentServices
1,591.7
1,241.0
854.2745.8 772.0
279.379.9
231.221.5
119.1
860.8
76.422.4
128.2116.7206.5
690.8405.592.325.386.0
139.1106.0
363.574.627.288.292.3
100.0
360.786.029.198.797.5
100.1
SASKATCHEWAN BUILDS CAPITAL PLAN BY SECTOR – 2018-19 TO 2021-22
* The 2018-19 Budget includes the transfer of government’s ownership interest in laboratory equipment to the SaskatchewanHealth Authority. The capital investment before this adjustment is $1,239,473K.

Budget 2018-19
21
Work continues on the Regina Bypass project.
Once complete in October 2019, this project will
significantly improve traffic safety and efficiency. This
project has already provided for much safer travel
through the opening of important interchanges for
the communities of Pilot Butte, White City and
Balgonie.
Over $1.8 billion of capital investment will be
provided through the Ministry of Highways and
Infrastructure over the next four years to ensure that
these important initiatives continue.
Municipal Infrastructure
Since 2008-09, almost $1.6 billion in municipal
infrastructure funding, including cost-shared
programs, has been used to support municipal
projects across the province. Participation in cost-
shared programs such as the New Building Canada
Fund and the Clean Water and Wastewater Fund
have resulted in over 170 projects across the province
being funded that support municipalities and their
citizens.
Funding of $206.5 million is included in the budget
for municipal infrastructure in 2018-19, with plans
to invest more than $500 million over the course of
this four-year plan for existing programs. Once
agreements are in place respecting the new Investing
in Canada Infrastructure Plan, up to an additional
$896 million of federal funding will be available to
Saskatchewan over the next 11 years.
2018-19 investments will provide for important
projects such as a new water treatment facility in
Neudorf, a comprehensive recycling centre in
Wynyard, a new River Street reservoir in Prince Albert
and a water treatment plant upgrade in Meadow Lake.
The 2018-19 Budget provides $15 million to
complete government’s $50 million commitment
toward the new North Commuter Parkway Bridge
project in Saskatoon. Once complete, this project will
support transportation efficiencies in the City of
Saskatoon and reduce traffic on existing bridges.
Education Capital
Over $1.5 billion has been invested in education
capital since 2008-09. This significant investment
includes funding for new schools, major renovations,
relocatables, and preventative maintenance and
renewal projects. The 2018-19 Budget provides
$76.4 million in education capital, while the four-year
plan targets well over $300 million in this area.
The Budget provides $22.7 million to continue work
on two new major school capital projects in Weyburn
and Rosthern. Once complete, the new schools in
Rosthern and Weyburn will provide for the much
needed replacement of existing facilities.
800 km of highway upgrades and renewal will be
made across the province with the 2018-19 Budget.
Over $1.5 billion has been invested in education
capital since 2008-09.
Since 2008-09, almost $1.6 billion in municipal
infrastructure funding, including cost-shared
programs, has been used to support over 170
projects across the province.

Budg
et 2
018-
19
22
Budget 2018-19 also provides $49.6 million for
preventative maintenance and renewal in the K-12
sector. This represents an increase of $6.4 million
from the previous year and provides increased
financial support for the ongoing maintenance and
renewal of the province’s existing schools.
Finally, $3.1 million will be provided to fund
relocatables in 2018-19. This funding supports the
cost-effective management of ongoing utilization
pressures.
Advanced Education
Since 2008-09, Government has invested nearly
$600 million through the Ministry of Advanced
Education for infrastructure in the post-secondary
education and research sector. This includes the
Health Sciences Building and the International
Vaccine Centre at the University of Saskatchewan, a
new student residence at the University of Regina,
and notable projects at Southeast, Parkland,
Cumberland, and Carlton Trail Colleges. The
2018-19 Budget provides $22.4 million for
maintenance capital and renewal in the sector.
Health Care
The four-year plan targets over $400 million for
investments in health facilities and equipment,
including $128.2 million for health capital in
2018-19.
Since 2008-09, Government has invested over
$1.5 billion in capital projects across the health
sector in order to improve the quality of care for
Saskatchewan residents. This includes building new
state-of-the-art facilities such as the Jim Pattison
Children’s Hospital of Saskatchewan in Saskatoon and
the Dr. F. H. Wigmore Hospital in Moose Jaw, and
replacing aging centres like Saskatchewan Hospital in
North Battleford and the Roy Romanow Provincial
Laboratory in Regina.
Additionally, $329.9 million has been provided over
this period to replace outdated long-term care
facilities throughout the province. This includes The
Meadows long-term care facility in Swift Current, the
Leader Integrated Care Facility, and 11 other long-
term care facilities across Saskatchewan.
The 2018-19 Budget provides ongoing funding of
$34.0 million to complete work on the Saskatchewan
Hospital North Battleford, which will allow for the
expansion of access to inpatient mental health care to
more Saskatchewan residents; $20.0 million to finish
government’s commitment to the construction on the
Jim Pattison Children’s Hospital of Saskatchewan,
which will better meet the unique needs of mothers,
babies, children and teens in a growing province;
and $7.2 million for electrical renewal upgrades at
provincial hospitals, which will ensure the long-term
viability of those facilities.
Government is also making critical investments in
health facility maintenance and equipment by
providing $65.4 million, an increase of $15.0 million
from last year. The four-year plan to increase
maintenance and equipment funding recognizes the
importance of ensuring that adequate support exists
to ensure the sustainability of Saskatchewan’s health
care system.
$128.2 million is being invested in health care
infrastructure in 2018-19 with $400 million
targeted over four years.
Since 2008-09, Government has invested nearly
$600 million through the Ministry of Advanced
Education for infrastructure in the post-secondary
education and research sector.

Budget 2018-19
23
Government Services
Program areas in government require infrastructure
upgrades, including government buildings,
correctional centres, day program facilities, courts,
parks, recreation facilities and information
technology (IT) management systems. Investments in
these areas will support high quality program and
service delivery.
The 2018-19 Budget provides $116.7 million in
capital funding for this area, including investments in
IT infrastructure, court and correctional facilities,
provincial dam rehabilitation and in the province’s
forest fire-fighting capacity.
An additional $4.5 million in capital funding will be
provided to Saskatchewan’s Parks in 2018-19 as part
of Government’s commitment to improve and
upgrade our provincial parks. In total, this brings
capital investment in Saskatchewan Parks to
$9.5 million in 2018-19. The Government of
Saskatchewan has invested almost $99 million in
capital expenditures in provincial parks since
2008-09; new campgrounds and recreational facilities
have been developed, water and wastewater systems
have been upgraded and expanded and almost 1,900
campsites have been electrified, a portion of which
are full-service sites with water, sewer and electrical
connections.
$28.6 million is provided to contribute to the
rehabilitation of the province’s 69 owned dams and
130 km of conveyance channels as part of the Water
Management Infrastructure Renewal Plan with the
Water Security Agency.
The Jim Pattison Children’s Hospital of Saskatchewan
will receive $6.6 million in 2018-19 for software and
equipment that will provide the technological
components required to run the hospital, bringing the
total investment to date to $24.5 million.
In addition, $9.3 million is provided in 2018-19 to
renew the Income Assistance Information Technology
system at the Ministry of Social Services. This project
will support and further enhance government’s ability
to deliver its income assistance programs.
Saskatchewan Builds Capital Plan Financing
Saskatchewan, as with other jurisdictions in Canada,
has a significant amount of aging infrastructure. In
addition to providing for infrastructure renewal,
Saskatchewan must make strategic investments in the
capital required to support future growth
opportunities while keeping the province On Track to
balance.
Capital expenditures will continue to be funded
through a disciplined financing strategy in order to
meet the infrastructure needs of our province and
better match the benefits of the assets with the term
of payment for these assets.
Planning for and enabling the repayment of capital
debt upon maturity continues to be a key principal of
undertaking this capital financing plan. As a result,
Government remains committed to having at least
two per cent of the value of these borrowings set
aside and invested each year to ensure that sufficient
cash will be available to repay the debt as it comes
due. This ensures that any debt pertaining to
infrastructure assets will not be passed on to future
generations.
Current low interest rates, combined with the
Province’s excellent credit rating, continue to make
this a cost-effective time to finance capital.

Budg
et 2
018-
19
24

SASKATCHEWAN PROVINCIAL BUDGET
18-19TE C H N I C A L P A P E R S


Budget 2018-19
27
THE SASKATCHEWAN ECONOMY
INTRODUCTIONThe outlook for the Saskatchewan economy in 2018
remains positive.
Oil and potash prices are expected to continue to
improve, while global growth remains strong.
Though total Saskatchewan employment declined
slightly in 2017, employment is forecast to rise by
2,500 in 2018 as the Saskatchewan economy
continues to grow.
Overall, real GDP is forecast to rise by 1.3 per cent
in 2018.
Nominal GDP is forecast to increase by 4.0 per cent.
GLOBAL ECONOMIC OUTLOOKGlobal economic growth was strong and broadly
based across countries in 2017.
The Eurozone economy performed robustly, not only
across countries but also across categories of
expenditure. Buoyed by strong investment and
household consumption, the Eurozone economy
grew by 2.5 per cent in 2017.
Over the next two years, the Eurozone expansion is
expected to moderate, growing by 2.2 per cent in
2018 and 1.6 per cent in 2019.
Benefiting from strong demand for its exports, the
government’s fiscal stimulus measures and
accommodative monetary policy, Japan’s economy
grew by 1.5 per cent in 2017.
Japan’s economy is expected to continue its moderate
expansion in 2018, highlighted by business
investments related to the 2020 Summer Olympic
Games. Overall, Japan’s economy is forecast to grow
by 1.4 per cent in 2018 and 0.8 per cent in 2019.
Per C
ent
2018 2019
0
2
4
6
8
GlobalChinaJapanEurozoneU.S.Canada
GLOBAL REAL GDP GROWTH ASSUMPTIONS
Sources: Bank of Canada (January 2018), Conference Board of Canada (December 2017)

Budg
et 201
8-19
28
Economic growth in emerging-market economies
remained strong in 2017, particularly in China.
China’s growth is forecast to moderate slightly in the
near term while the country continues to address
structural reforms and financial sector vulnerabilities.
China’s economy is expected to grow by 6.4 per cent
in 2018 and 6.3 per cent in 2019, after posting
6.8 per cent growth in 2017.
The U.S. economy finished up with 2.3 per cent
growth in 2017, despite weak growth in the first
quarter. The acceleration in real GDP growth
primarily reflected upturns in consumer spending,
non-residential fixed investment and exports.
U.S. economic growth momentum is expected to
carry into 2018, mainly driven by business
investment. The approved federal tax cuts are
expected to have marginal impact in 2018.
Overall, U.S. real GDP is expected to grow by
2.7 per cent in 2018 and 2.3 per cent in 2019.
CANADIAN ECONOMIC OUTLOOKThe Canadian economy grew strongly and
outperformed other G7 economies in 2017. Real
GDP increased by 3.0 per cent in 2017, well above
1.4 per cent growth in 2016. Most of the growth was
led by household consumption and business
investment. Growth in exports, however, remained
slow at 1.0 per cent.
In terms of GDP by industry, growth in 2017 was
widespread across sectors. The oil and gas extraction
sector grew by 6.3 per cent and support activities for
mining rose by 37.0 per cent. Service-producing
industries rose by 2.8 per cent, led by a 7.5 per cent
increase in the wholesale trade sector.
Canadian real GDP grew strongly in the first half of
the year, posting 4.0 per cent and 4.4 per cent
annualized rates in the first and second quarters of
2017, respectively.
Economic growth momentum weakened in the
second half of 2017, posting 1.5 per cent in the third
quarter and 1.7 per cent in the fourth quarter.
Overall, growth is expected to slow to 2.1 per cent in
2018 and 1.8 per cent in 2019 as high household
debt and uncertainties related to U.S. trade policies
continue to be key challenges to the Canadian
outlook.
Amid buoyant economic growth, the Bank of Canada
has raised its overnight lending rate three times since
July 2017, a total of 75 basis points to 1.25 per cent.
Actual 2017 2018 2019 2020 2021 2022Can. Real GDP Growth (%) 3.0 2.1 1.8 1.8 1.7 1.7U.S. Real GDP Growth (%) 2.3 2.7 2.3 2.2 2.2 2.1Short-term Interest Rate (%) 0.70 1.42 2.27 2.70 2.71 2.7110-year Government of Canada Bond (%) 1.79 2.61 3.38 3.59 3.59 3.59
Canadian Dollar (US cents) 77.10 78.40 79.10 81.30 82.30 83.40Sources: Statistics Canada, Conference Board of Canada, Ministry of Finance
CANADIAN AND U.S. ECONOMIC ASSUMPTIONS

Budget 2018-19
29
Following the rate hikes, the value of the Canadian
dollar gained about 6.2 U.S. cents from an average of
75.2 U.S. cents in June 2017 to 81.4 U.S. cents in
September 2017 – the highest level since May 2015.
The value of the Canadian dollar has been under
pressure recently due to slower economic growth,
tightening monetary policy in the U.S. and
uncertainties related to the renegotiations of the
North American Free Trade Agreement. The value of
the Canadian dollar weakened to around 77.0 U.S.
cents in early March 2018.
Overall, the value of the Canadian dollar is expected
to average 78.4 U.S. cents in 2018 and 79.1 U.S. cents
in 2019.
SASKATCHEWAN 2017 PERFORMANCEFollowing two consecutive years of negative growth
due to low commodity prices and modest global
growth, the Saskatchewan economy is expected to
post positive growth in 2017.
Total employment was down slightly last year, but
still above the 10-year average.
Similarly, though some investment indicators were
down slightly, they remain historically high.
On a 10-year-average basis, Saskatchewan non-
residential building construction investment more
than doubled from $0.8 billion in the 1998 to 2007
period to $1.7 billion in the 2008 to 2017 period.
CANADIAN AND U.S. INTEREST RATES
Sources: Bank of Canada, U.S. Federal Reserve
0.0
0.5
1.0
1.5
2.0
Jan-2018Jan-2017Jan-2016Jan-2015
Per C
ent
CanadianOvernight Rate
U.S. Federal Funds Rate
CANADIAN DOLLAR
Source: Bank of Canada
US C
ents
0
70
75
80
85
Jan-2018Jan-2017Jan-2016Jan-2015
SASKATCHEWAN EMPLOYMENT
Source: Statistics Canada
Thou
sand
s of P
eopl
e
0
450
500
550
600
2016201420122010200820062004200220001998
2008-17 average (550.5)
1998-07 average (477.1)
SASKATCHEWAN NON-RESIDENTIAL BUILDING CONSTRUCTION INVESTMENT
Source: Statistics Canada
Billio
ns o
f Dol
lars
0.0
0.5
1.0
1.5
2.0
2016201420122010200820062004200220001998
1998-07 average ($0.8B)
2008-17 average ($1.7B)

Budg
et 201
8-19
30
New housing starts increased from an average of
3,417 units to 6,498 units per year during the same
periods.
Other indicators had strong growth in 2017.
Manufacturing sales grew by 12.6 per cent, the
fourth-highest percentage increase among provinces.
Sales of new motor vehicles were up by 8.0 per cent,
also the fourth-highest percentage increase among
provinces.
In addition, the value of building permits,
international goods exports, wholesale and retail
trade were up substantially in 2017, as were oil and
potash production.
SASKATCHEWAN NEW HOUSING STARTS
Source: Statistics Canada
Num
ber o
f New
Hou
sing
Star
ts
0
2,000
4,000
6,000
8,000
10,000
2016201420122010200820062004200220001998
1998-07 average (3,417)
2008-17 average (6,498)
Saskatchewan Canada 2017 2017 2011-17 2011-17 Actual % Change Rank % Change Rank % ChangePopulation at January 1, 2018 and 2012-18 (000s) 1,169.8 1.2 6 8.8 2 7.0
Employment (000s) 567.6 (0.2) 9 5.9 5 6.9Unemployment Rate (%) 6.3 6.3 5th lowest 5.0 Lowest 7.0Consumer Price Index (2002=100) 134.4 1.7 5 10.2 2 8.8Average Weekly Earnings ($) 1,010.5 2.2 3 15.5 2 11.7Retail Sales ($B) 19.9 4.0 8 22.9 5 28.6Wholesale Trade ($B) 27.1 7.2 7 26.4 6 31.7New Motor Vehicle Sales (# of units) 56,265 8.0 4 10.2 9 28.2Manufacturing Sales ($B) 15.9 12.6 4 25.4 3 14.2International Exports ($B) 28.9 8.7 5 (2.0) 8 19.7Building Permits ($B) 2.2 10.9 7 (16.4) 9 28.3Housing Starts (# of units) 4,904 2.7 9 (30.3) 8 13.3Investment in New Housing Construction ($B) 1.2 (1.0) 9 (17.8) 8 39.7
Investment in Non-residentialBuilding Construction ($B) 1.7 (14.1) 10 13.8 3 10.0
Source: Statistics Canada
SASKATCHEWAN ECONOMIC INDICATORS

Budget 2018-19
31
Saskatchewan’s population continued to grow.
Between January 1, 2017 and January 1, 2018,
Saskatchewan’s population increased by 13,410
persons. It was estimated to be 1,169,752 as of
January 1, 2018, according to Statistics Canada’s
latest release.
SASKATCHEWAN ECONOMIC OUTLOOKOverall, the outlook for the Saskatchewan economy
in 2018 remains positive, though there are still
challenges remaining in some sectors.
Though last year’s crop was affected by hot and dry
weather, total crop production in Saskatchewan in
2017 turned out to be significantly better than
what had been expected in the summer. Crop
production in 2017 totaled 34.9 million tonnes. In
the 2017-18 Mid-Year Report, crop production in
2017 was estimated to be 29.2 million tonnes.
For 2018, crop production is expected to be
34.4 million tonnes, slightly less than in 2017 but
still well above the 10-year average.
Oil prices have continued to improve over the course
of the last few years.
The price of West Texas Intermediate (WTI) oil is
expected to average US$59.00 per barrel in 2018, up
from US$50.78 per barrel in 2017.
SASKATCHEWAN CROP PRODUCTION
Source: Ministry of Agriculture
Milli
ons o
f Ton
nes
0
15
20
25
30
35
40
202220192016201320102007200420011998
1998-07 average (23.8)
2008-17 average (31.2)
Forecast
SASKATCHEWAN KEYECONOMIC INDICATORS(2017 over 2016)
Source: Statistics Canada
0
5
10
15
Housing Starts
Bldg. Permits
ExportsMfg. Sales
New Vehicles
Wholesale
Retail Sales
Per C
ent C
hang
e
4.0
7.2 8.0
12.6
8.7
10.9
2.7
SASKATCHEWAN POPULATION GROWTH(January 1)
Source: Statistics Canada
Num
ber o
f Peo
ple
-10,000
-5,000
0
5,000
10,000
15,000
20,000
20182016201420122010200820062004200220001998
1998-07 average (-2,319)
2008-17 average (16,120)

Budg
et 201
8-19
32
Drilling activity is expected to improve as a result
of increases in the price of oil.
In 2017, 2,520 new oil wells were drilled in the
province. This figure is expected to rise by
3.2 per cent to 2,600 this year.
Total Saskatchewan potash sales in 2017 are
estimated to have increased by 10.0 per cent to a
record 12.0 million K2O tonnes.
Strong global demand is expected to continue into
2018. Total sales are anticipated to reach 12.5 million
K2O tonnes.
The price of potash is expected to increase by
3.7 per cent in 2018 to $398.19 per K2O tonne.
The 10-month suspension of operations at the
McArthur River mine beginning in January 2018 is
expected to reduce uranium production significantly
in 2018.
This reduction in uranium production has dampened
the outlook for Saskatchewan GDP growth this year.
Nonetheless, Saskatchewan real GDP is currently
expected to rise by 1.3 per cent in 2018. Nominal
GDP is forecast to increase by 4.0 per cent.
Growth in 2019 is expected to improve. Real GDP is
forecast to grow by 2.5 per cent while nominal GDP
is forecast to increase by 4.3 per cent.
WTI OIL PRICE AND OIL WELLS DRILLED
Source: Ministry of Energy and Resources
05001,0001,5002,0002,5003,0003,5004,000
20222020201820162014201220102008
Forecast Number of W
ells Drilled
US$/
Barre
l
020406080
100120140160180
Oil Wells Drilled
WTI Oil Price
2017 2018 2019 2020 2021 2022WTI Oil (US$/barrel) 50.78 59.00 59.00 62.00 68.00 72.00Natural Gas (C$/GJ) 2.26 2.55 2.60 2.75 2.90 3.05Potash (C$/K2O tonne)1 383.96 398.19 400.03 395.96 397.83 398.72Potash (US$/KCl tonne)1 180.58 190.43 193.02 196.37 199.72 202.84Wheat (C$/tonne) 230.23 237.75 231.50 235.49 237.26 237.10Canola (C$/tonne) 501.17 500.49 496.78 504.48 505.59 507.301 The potash industry quotes prices in US dollars per KCl tonne. Provincial royalty calculations, however, are based on the
Canadian dollar price per K2O tonne.Sources: Ministry of Energy and Resources, Ministry of Agriculture
COMMODITY PRICE ASSUMPTIONS – CALENDAR YEAR
SASKATCHEWAN POTASH PRICE AND SALES
Source: Ministry of Energy and Resources
0246810121416
2022202020182016201420122010
Potash Sales
Potash Price
Forecast Millions of K O Tonnes
2
0
200
400
600
800
1,000
C$/K
O To
nne
2

Budget 2018-19
33
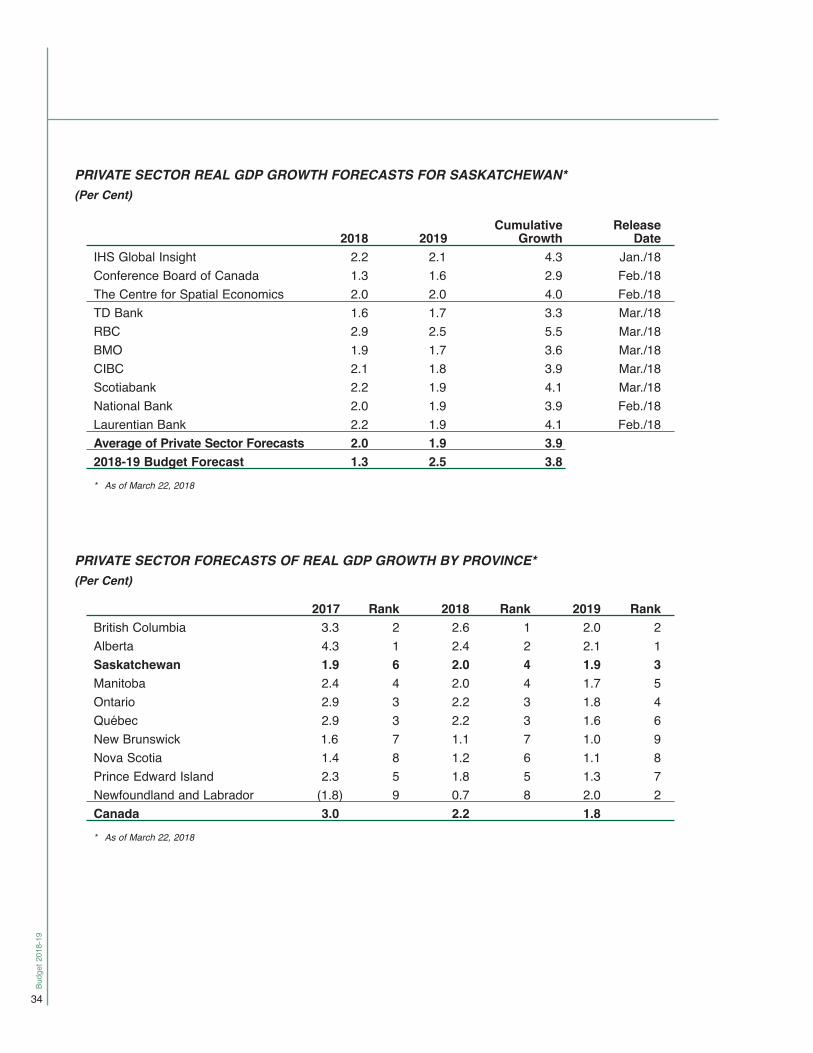
FORECAST COMPARISONMany private sector forecasters expect Saskatchewan’s
economy to be one of the top performing economies
in all of Canada over the next two years.
On average, private sector forecasters expect
Saskatchewan real GDP to grow by 2.0 per cent in
2018. The outside forecasts range from a low of
1.3 per cent to a high of 2.9 per cent.
In 2019, Saskatchewan’s economy is expected to grow
by 1.9 per cent. The outside forecasts range from a
low of 1.6 per cent to a high of 2.5 per cent.
2017 2018 2019 2020 2021 2022Real GDP 1.5 1.3 2.5 2.6 2.2 1.9Nominal GDP 4.9 4.0 4.3 4.2 4.6 4.5CPI* 1.7 2.3 1.8 1.8 1.9 1.9Employment Growth (000s)* (0.9) 2.5 4.6 5.4 5.3 5.1Unemployment Rate (%)* 6.3 6.1 5.9 5.7 5.5 5.6Retail Sales* 4.0 2.7 2.5 2.3 2.6 3.0* 2017 actualSources: Statistics Canada, Ministry of Finance
SASKATCHEWAN FORECAST AT A GLANCE(Per Cent Change Unless Otherwise Noted)
SASKATCHEWAN REAL AND NOMINAL GDP LEVEL
Source: Ministry of Finance
0
20
40
60
80
100
20212019201720152013201120092007
Billio
ns o
f Dol
lars
Forecast
Real Nominal Nominal GDP Trendline
Per C
ent
-2
-1
0
1
2
3
4
5
NLPENSNBQCONMBSKABBC
2017-18 Budget 2018-19 Budget
PRIVATE SECTOR FORECASTS OF 2017 REAL GDP GROWTH BY PROVINCE
Private sector forecast average as at March 22, 2018.Sources: Major Canadian banks, IHS Global Insight, CBOC, C4SE
Budg
et 201
8-19
34
Cumulative Release 2018 2019 Growth DateIHS Global Insight 2.2 2.1 4.3 Jan./18Conference Board of Canada 1.3 1.6 2.9 Feb./18The Centre for Spatial Economics 2.0 2.0 4.0 Feb./18TD Bank 1.6 1.7 3.3 Mar./18RBC 2.9 2.5 5.5 Mar./18BMO 1.9 1.7 3.6 Mar./18CIBC 2.1 1.8 3.9 Mar./18Scotiabank 2.2 1.9 4.1 Mar./18National Bank 2.0 1.9 3.9 Feb./18Laurentian Bank 2.2 1.9 4.1 Feb./18Average of Private Sector Forecasts 2.0 1.9 3.92018-19 Budget Forecast 1.3 2.5 3.8 * As of March 22, 2018
PRIVATE SECTOR REAL GDP GROWTH FORECASTS FOR SASKATCHEWAN*(Per Cent)
2017 Rank 2018 Rank 2019 RankBritish Columbia 3.3 2 2.6 1 2.0 2Alberta 4.3 1 2.4 2 2.1 1Saskatchewan 1.9 6 2.0 4 1.9 3Manitoba 2.4 4 2.0 4 1.7 5Ontario 2.9 3 2.2 3 1.8 4Québec 2.9 3 2.2 3 1.6 6New Brunswick 1.6 7 1.1 7 1.0 9Nova Scotia 1.4 8 1.2 6 1.1 8Prince Edward Island 2.3 5 1.8 5 1.3 7Newfoundland and Labrador (1.8) 9 0.7 8 2.0 2Canada 3.0 2.2 1.8 * As of March 22, 2018
PRIVATE SECTOR FORECASTS OF REAL GDP GROWTH BY PROVINCE*(Per Cent)

Private forecasters, on average, expect total
employment in the province to increase by 2,400 and
4,600 in 2018 and 2019, respectively. These are in
line with the current 2018-19 budget employment
forecast of 2,500 in 2018 and 4,600 in 2019.
CONCLUSIONAlthough the growth outlook for 2018 has been
revised downward, the Saskatchewan economy
remains on track to post positive growth in 2018.
The downward revision to the growth forecast for
2018 since the 2017-18 Mid-Year Report is largely
due to the shutdown of the McArthur River mine for
much of this year, significantly reducing uranium
production in 2018.
Still, oil and potash prices are expected to continue to
improve this year. In addition, global growth remains
strong. Further, Saskatchewan employment this year
is forecast to rise by 2,500.
Overall, Saskatchewan real GDP is currently forecast
to grow by 1.3 per cent in 2018 and 2.5 per cent in
2019.
Nominal GDP is forecast to increase by 4.0 per cent
this year and 4.3 per cent next year.
Budget 2018-19
35
Per C
ent
0
1
2
3
NLPENSNBQCONMBSKABBC
2018 2019
PRIVATE SECTOR FORECASTS OF REAL GDP GROWTH BY PROVINCE
Private sector forecast average as at March 22, 2018.Sources: Major Canadian banks, IHS Global Insight, CBOC, C4SE

Budget 2018-19
36
2018 -19 F INANCIAL OUTLOOK
OVERVIEWThe Saskatchewan Provincial Budget includes the
financial activity for all organizations within the
control of the Government of Saskatchewan, based on
standards established by the Public Sector Accounting
Board (PSAB) for senior Canadian governments. The
method of consolidation in the budget is consistent
with the policies described in the Saskatchewan
Public Accounts.
The revenue and expense budgets of Government
Service Organizations (GSOs), including the General
Revenue Fund (GRF), are consolidated after
adjusting for differences in accounting policies and
eliminating significant inter-organizational
transactions. Adjustments are also made to account
for significant transactions in the period between an
organization’s fiscal year-end and the Government of
Saskatchewan’s year-end.
Budgets for Government Business Enterprises (GBEs)
are incorporated as a single amount using the
modified-equity method, which includes the
Government of Saskatchewan’s proportionate share
of net earnings or losses.
Saskatchewan’s 2018-19 Budget includes pension
costs on an accrual basis in expense and deficit
figures, and the 2017-18 Budget has been restated
for comparative purposes.
The 2018-19 Budget estimates a deficit of
$365 million.
Taxes: $7,215 (51%)
Non-Renewable Resources: $1,482 (10%)
Other Own Source: $2,007 (14%)
GBE Net Income: $1,078 (8%)
Federal Transfers: $2,462 (17%)
Deficit: $365
Health: $5,765 (39%)
Expense: $14,609Revenue: $14,244
Education: $3,263 (22%)
Social Services: $1,381 (9%)
Agriculture: $771 (5%)
Protection: $690 (5%)
Debt Charges: $655 (4%)
Other Expense: $2,084 (16%)
2018-19 GOVERNMENT OF SASKATCHEWAN BUDGET(Millions of Dollars)

Budget 2018-19
37
REVENUEThe 2018-19 revenue outlook includes all tax and
other revenue measures announced in this year’s
budget, as well as changes to provincial fees and
charges announced ahead of the budget. However,
the budget does not incorporate either tax revenue
or costs associated with cannabis legalization.
Total revenue is forecast to be $14.2 billion in
2018-19, an increase of $301 million (2.2 per cent)
from the 2017-18 third quarter forecast. The increase
is due to higher tax revenue, non-renewable resource
revenue and federal transfers, partially offset by
decreases in net income from GBEs and other own-
source revenue.
Tax Revenue
Tax revenue is budgeted at $7.2 billion in 2018-19.
This is an increase of $419 million from the current
2017-18 forecast. As a share of total revenue, tax
revenue accounts for 51 per cent in this year’s budget,
identical to last year’s budget.
Provincial Sales Tax (PST) revenue is budgeted at
nearly $2.2 billion, an increase of $226 million from
the 2017-18 forecast. The increase is primarily due to
the elimination of the PST exemption on used light
vehicles, the full-year impact of last year’s expansion
of the PST to insurance premiums (excluding
agriculture, life and health premiums), and growth
in the taxable base as a result of increased economic
activity.
2017-18 2018-19 Change (Millions of Dollars) Forecast Budget Dollars Per CentTaxation 6,796.3 7,214.9 418.6 6.2Non-Renewable Resources 1,419.7 1,482.1 62.4 4.4Net Income from GBEs 1,186.5 1,078.0 (108.5) (9.1)Other Own-Source Revenue 2,098.2 2,006.5 (91.7) (4.4)Transfers from the Federal Government 2,442.3 2,462.0 19.7 0.8Total Revenue 13,943.0 14,243.5 300.5 2.2
2018-19 REVENUE RECONCILIATION
2014-15 2015-16 2016-17 2017-18 2018-19(Millions of Dollars) Actual Actual Actual Forecast BudgetTaxation 6,511.6 6,605.3 6,351.2 6,796.3 7,214.9Non-Renewable Resources 2,614.5 1,761.3 1,300.0 1,419.7 1,482.1Net Income from GBEs 738.4 1,108.6 845.9 1,186.5 1,078.0Other Own-Source Revenue 1,994.2 2,003.0 2,174.2 2,098.2 2,006.5Transfers from the Federal Government 2,200.0 2,155.5 2,954.8 2,442.3 2,462.0Total Revenue 14,058.7 13,633.7 13,626.1 13,943.0 14,243.5
TOTAL REVENUE – 2014-15 TO 2018-19

Budget 2018-19
38
Individual and Corporation Income Tax revenue are
budgeted to increase $129 million and $31 million,
respectively, from the 2017-18 forecast. The increases
are primarily due to significant negative prior-year
adjustments experienced in 2017-18 that are not
forecast to repeat in 2018-19.
All other taxes are budgeted to increase by a
combined $33 million, including an $11 million
increase in Fuel Tax revenue as a result of increased
economic activity and continued population growth
and a $9 million increase in Property Tax as a result
of expected growth in the value of assessments.
Non-Renewable Resource Revenue
Non-renewable resource revenue is budgeted at
nearly $1.5 billion in 2018-19, a $62 million
improvement over the 2017-18 forecast. Similar to
last year’s budget, non-renewable resource revenue
accounts for 10 per cent of total revenue.
Despite the increase this year, non-renewable resource
revenue is well below levels experienced in recent
years. The 2018-19 Budget forecast of $1.5 billion is
$1.1 billion lower than actual revenue collected in
2014-15.
COMPOSITION OF 2018-19 REVENUE
Corporation Income Tax: 4%
Federal Transfers: 17%
Other Non-Renewable Resources: 5%
Other Own Sources: 14%
Net Income from Government Business Enterprises: 8%
Personal Income Tax: 17%
ProvincialSales Tax: 15%
Other Taxes: 15%
Oil and Natural Gas: 5%
2014-15 2015-16 2016-17 2017-18 2018-19(Millions of Dollars) Actual Actual Actual Forecast BudgetCorporation Income Tax 848.5 1,002.5 735.0 590.2 621.1Fuel Tax 515.4 479.3 488.6 535.4 546.1Individual Income Tax 2,546.6 2,537.3 2,592.2 2,311.8 2,441.2Property Tax 624.7 657.7 675.4 750.6 759.3Provincial Sales Tax 1,358.2 1,288.9 1,205.5 1,929.5 2,155.0Tobacco Tax 260.7 263.7 259.7 260.3 260.3Other Taxes 357.5 375.9 394.8 418.5 431.9Total 6,511.6 6,605.3 6,351.2 6,796.3 7,214.9
TAX REVENUE – 2014-15 TO 2018-19

Budget 2018-19
39
Oil and natural gas royalties are budgeted at
$700 million in 2018-19, an increase of $39 million
from the 2017-18 forecast. West Texas Intermediate
(WTI) oil prices are forecast to average US$58.18 per
barrel in 2018-19, consistent with private-sector
forecasts for the upcoming year. This is a US$5.58 per
barrel increase over the estimated 2017-18 average
price of US$52.60. This increase is partially offset by
a wider light-heavy price differential and an increase
in the value of the Canadian dollar.
WTI oil prices are an important benchmark for the
oil market and provincial revenue; however, the
majority of oil produced in Saskatchewan is heavier
and more sour than WTI oil and requires further
processing to be turned into refined products. As a
result, Saskatchewan oil typically trades at a discount
to WTI oil in the marketplace. Increasing production
in Western Canada and North Dakota, as well as
pipeline and transportation capacity limits, have also
contributed to a general widening of the price
discount for Saskatchewan oil in recent years.
In 2018-19, the light-heavy price differential – a
rough benchmark for the price discount for oil
produced in Saskatchewan – is expected to widen
further, from an average of 17.3 per cent in 2017-18
to 22.1 per cent.
2014-15 2015-16 2016-17 2017-18 2018-19(Millions of Dollars) Actual Actual Actual Forecast BudgetCrown Land Sales 164.9 44.0 50.1 64.5 63.9Oil and Natural Gas 1,297.9 564.8 571.4 661.2 700.1Potash 546.3 552.1 241.0 298.7 308.0Resource Surcharge 474.5 400.6 303.5 297.5 317.3Other 130.9 199.8 134.0 97.8 92.8Total 2,614.5 1,761.3 1,300.0 1,419.7 1,482.1
NON-RENEWABLE RESOURCE REVENUE – 2014-15 TO 2018-19
2014-15 2015-16 2016-17 2017-18 2018-19 Actual Actual Actual Forecast BudgetWTI Oil Price (US$/barrel) 80.48 45.15 47.94 52.60 58.18Light-Heavy Differential (% of WTI) 17.4 22.4 21.3 17.3 22.1Well-head Oil Price (C$/barrel)1 70.22 41.16 45.09 51.62 54.36Oil Production (million barrels) 187.4 174.0 169.3 177.0 177.7Potash Price (mine netback, US$/KCl tonne)2 281 258 173 183 191Potash Price (mine netback, C$/K2O tonne)2 529 546 377 388 399Potash Sales (million K2O tonnes)2 11.2 10.7 11.2 12.2 12.6Canadian Dollar (US cents) 88.05 76.38 76.20 77.82 78.341 The average price per barrel of Saskatchewan light, medium and heavy oil.2 Ministry of Finance calculations derived from calendar-year forecasts.
NON-RENEWABLE RESOURCE FORECAST ASSUMPTIONS – FISCAL YEAR

Budget 2018-19
40
The value of the Canadian dollar is projected to
average 78.34 U.S. cents in 2018-19, up from an
average of 77.82 U.S. cents in 2017-18. As the price
of Saskatchewan oil at the well-head is generally
determined based on prevailing prices in the United
States, a higher exchange rate translates to lower
prices in Canadian dollars, all else being equal.
Potash revenue is forecast at $308 million in 2018-19,
a $9 million improvement over the 2017-18 forecast.
Strength in global potash demand and market
conditions continues to have a positive impact on
average prices and sales volume. In 2018-19, average
realized prices are budgeted at US$191 per KCl tonne
(C$399 per K2O tonne), up from US$183 (C$388)
in 2017-18. Sales are expected to increase from
12.2 million K2O tonnes in 2017-18 to 12.6 million
K2O tonnes in 2018-19.
Resource Surcharge revenue is forecast at
$317 million in 2018-19, an increase of $20 million
from the current 2017-18 forecast. The increase is
largely due to higher oil and potash prices.
The economic and fiscal forecasts in the
2018-19 Budget rely on a set of assumptions
regarding Canadian, U.S. and global economic
growth, commodity prices and the value of the
Canadian dollar. These factors are beyond
government’s control, yet they heavily influence
Saskatchewan’s fiscal performance, particularly non-
renewable resource revenue.
In an attempt to minimize risk to the fiscal plan, the
assumptions used to develop the resource forecast are
prudent and incorporate a number of private sector
forecasts. But because of the volatile nature of these
key external factors, the non-renewable resource
revenue forecast will always be subject to risk. This
risk is quantified throughout the year.
For 2018-19 it is estimated that:
• a US$1 per barrel change in the fiscal-yearaverage WTI oil price results in an estimated $16 million change in oil royalties;
• a US$10 per KCl tonne (C$21 per K2O tonne)change in the fiscal-year average realized potashprice results in an estimated $35 million changein potash royalties; and,
• a 1 U.S. cent change in the fiscal-year averageexchange rate results in an estimated $21 millionchange in non-renewable resource revenue.
WTI OIL PRICES AND THE CANADIAN DOLLAR
0
25
50
75
100
125
Mar-18Sept-17Mar-17Sept-16Mar-16Sept-15Mar-15Sept-14Mar-14Sept-13Mar-13
US$/
Barre
l
0
25
50
75
100
125
WTI Oil Prices (left axis) Canadian Dollar (right axis)
US Cents

Budget 2018-19
41
Net Income from Government Business Enterprises
Government Business Enterprise (GBE) net income
is forecast at nearly $1.1 billion in 2018-19 and
accounts for 8 per cent of budgeted revenue. This is
a $109 million decrease from the current 2017-18
forecast, largely reflecting declines of $101 million
and $25 million at the Workers’ Compensation Board
and the Auto Fund, respectively, primarily due to
one-time investment gains in 2017-18 that are not
budgeted to repeat. In addition, SaskEnergy is
budgeted to decline $36 million relative to the
2017-18 forecast, primarily due to an expected return
to normal weather conditions and more typical gas
marketing volumes.
These declines are partially offset by a $39 million
increase at SaskPower mainly due to the 3.5 per cent
rate increase that became effective on March 1, 2018
and an $11 million increase at SaskTel due to
expected growth in business and consumer revenue.
Other Own-Source Revenue
Other own-source revenue includes fees for services
and licenses, proceeds from the sale of goods and
services, investment income, fees collected by
insurance entities and other miscellaneous sources
of revenue. Most government organizations generate
own-source revenue.
2014-15 2015-16 2016-17 2017-18 2018-19(Millions of Dollars) Actual Actual Actual Forecast BudgetFees 1,085.6 1,139.6 1,213.0 1,153.4 1,157.3Insurance 256.4 242.5 303.6 297.8 288.2Investment Income 137.4 101.1 91.8 105.5 95.6Transfers from Other Governments 90.9 97.8 96.8 96.8 88.8Miscellaneous 423.9 422.0 469.0 444.7 376.6Total 1,994.2 2,003.0 2,174.2 2,098.2 2,006.5
OTHER OWN-SOURCE REVENUE – 2014-15 TO 2018-19
2014-15 2015-16 2016-17 2017-18 2018-19(Millions of Dollars) Actual Actual Actual Forecast BudgetSaskatchewan Auto Fund 53.8 159.1 188.7 142.6 118.0Saskatchewan Government Insurance 41.1 84.5 65.2 58.8 60.7Saskatchewan Liquor and Gaming Authority 494.7 503.8 478.1 479.6 481.4SaskPower 57.7 18.4 53.1 138.1 176.7SaskTel 71.8 121.3 130.1 122.1 133.0SaskEnergy (33.0) 110.9 145.6 104.6 68.4Workers’ Compensation Board 20.3 70.0 (246.4) 116.1 15.3Other 32.0 40.6 31.5 24.6 24.5Total 738.4 1,108.6 845.9 1,186.5 1,078.0
NET INCOME FROM GOVERNMENT BUSINESS ENTERPRISES – 2014-15 TO 2018-19

Budget 2018-19
42
Other own-source revenue is budgeted at $2.0 billion
in 2018-19, accounting for 14 per cent of total
revenue. Relative to the 2017-18 forecast, this is a
$92 million decrease, largely due to non-recurring
GRF revenues in 2017-18 that are not budgeted to
repeat, including investment earnings, agricultural
land sales, gains on the sale of assets, out-of-province
fire-fighting recoveries and miscellaneous refunds.
Transfers from the Federal Government
Federal transfers are budgeted at nearly $2.5 billion
in 2018-19, a $20 million increase over the current
2017-18 forecast. Contributions from the federal
government account for 17 per cent of total revenue
in the 2018-19 Budget.
The Canada Health Transfer and Canada Social
Transfer will increase by $26 million and $6 million,
respectively. All other federal cost-sharing agreements
are budgeted to decrease $12 million, largely due to
lower infrastructure contributions related to
agreements and projects that are winding down,
including the Regina Bypass project.
EXPENSEExpense in the 2018-19 Budget includes pension
expense on an accrual basis, consistent with the
audited financial statements that appear in the Public
Accounts. The 2017-18 Budget has been restated to
reflect this change.
Total expense is budgeted at $14.6 billion in 2018-19,
a decrease of $202 million, or 1.4 per cent, from the
restated 2017-18 Budget. The change from last year’s
budget includes a $404 million decrease in
Government’s pension liability (the pension accrual
adjustment), reflecting prior-year actuarial losses that
are finished being recognized in 2017-18 and new
actuarial gains as a result of higher interest rates and
other changes in actuarial assumptions. This decline
is partially offset by increases for Health, Protection
of Persons and Property, Social Services and
Assistance, as well as Education (excluding teachers’
pensions and benefits) and Debt Charges.
The composition of expense in the 2018-19 Budget
is as follows:
• Health, $5.8 billion, or 39 per cent;
• Education, $3.3 billion, or 22 per cent;
• Social Services and Assistance, $1.4 billion, or 9 per cent;
• Agriculture, $771 million, or 5 per cent;
• Protection of Persons and Property, $690 million,or 5 per cent;
• Debt Charges, $655 million, or 4 per cent;
• all others, nearly $2.1 billion, or 16 per cent;
2014-15 2015-16 2016-17 2017-18 2018-19(Millions of Dollars) Actual Actual Actual Forecast BudgetCanada Health Transfer 998.4 1,080.7 1,138.8 1,176.1 1,202.4Canada Social Transfer 397.7 408.7 422.7 435.3 441.3Other 803.9 666.1 1,393.3 830.9 818.3Total 2,200.0 2,155.5 2,954.8 2,442.3 2,462.0
FEDERAL TRANSFERS – 2014-15 TO 2018-19
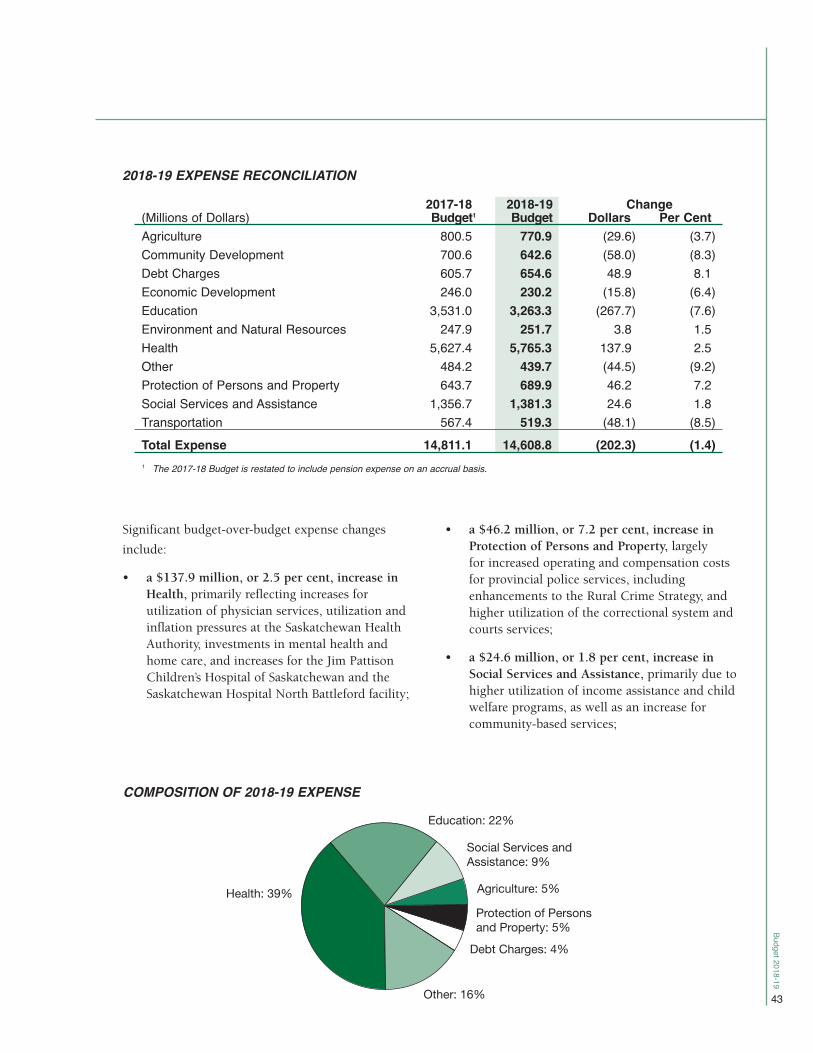
Budget 2018-19
43
Significant budget-over-budget expense changes
include:
• a $137.9 million, or 2.5 per cent, increase inHealth, primarily reflecting increases forutilization of physician services, utilization andinflation pressures at the Saskatchewan HealthAuthority, investments in mental health andhome care, and increases for the Jim PattisonChildren’s Hospital of Saskatchewan and theSaskatchewan Hospital North Battleford facility;
• a $46.2 million, or 7.2 per cent, increase inProtection of Persons and Property, largely for increased operating and compensation costsfor provincial police services, includingenhancements to the Rural Crime Strategy, andhigher utilization of the correctional system andcourts services;
• a $24.6 million, or 1.8 per cent, increase inSocial Services and Assistance, primarily due tohigher utilization of income assistance and childwelfare programs, as well as an increase forcommunity-based services;
2017-18 2018-19 Change (Millions of Dollars) Budget1 Budget Dollars Per CentAgriculture 800.5 770.9 (29.6) (3.7)Community Development 700.6 642.6 (58.0) (8.3)Debt Charges 605.7 654.6 48.9 8.1Economic Development 246.0 230.2 (15.8) (6.4)Education 3,531.0 3,263.3 (267.7) (7.6)Environment and Natural Resources 247.9 251.7 3.8 1.5Health 5,627.4 5,765.3 137.9 2.5Other 484.2 439.7 (44.5) (9.2)Protection of Persons and Property 643.7 689.9 46.2 7.2Social Services and Assistance 1,356.7 1,381.3 24.6 1.8Transportation 567.4 519.3 (48.1) (8.5)Total Expense 14,811.1 14,608.8 (202.3) (1.4)1 The 2017-18 Budget is restated to include pension expense on an accrual basis.
2018-19 EXPENSE RECONCILIATION
COMPOSITION OF 2018-19 EXPENSE
Education: 22%
Social Services andAssistance: 9%
Debt Charges: 4%
Agriculture: 5%
Protection of Persons and Property: 5%
Other: 16%
Health: 39%

Budget 2018-19
44
• a $267.7 million, or 7.6 per cent, decrease inEducation, primarily due to lower teachers’pension expense, partially offset by investmentsin the K-12 education system, an increase forchild care programs under the Canada-Saskatchewan Early Learning and Child CareAgreement, and an increase for the College ofMedicine;
• a $58.0 million, or 8.3 per cent, decrease inCommunity Development, largely due to adecrease in the Clean Water and WastewaterFund as the program winds down and lowermunicipal revenue sharing grants, reflecting adecrease in PST revenue in 2016-17;
• a $48.1 million, or 8.5 per cent, decrease inTransportation, primarily due to the full-yearimpact of the wind-down of operations at theSaskatchewan Transportation Company and adecrease for the Public Transit InfrastructureFund as the federal program comes to an end;
• a $29.6 million, or 3.7 per cent, decrease inAgriculture, primarily due to lower budgetedcrop insurance indemnities and decreasedAgriStability program demand, as well as lowerrequirements for the Farm and Ranch WaterInfrastructure Program due to programmingchanges;
• a $44.5 million, or 9.2 per cent, decrease inOther, primarily reflecting a decrease in pensionexpense; and,
• a $48.9 million, or 8.1 per cent, increase inDebt Charges associated with higherSaskatchewan Builds Capital Plan debt and GRFoperating debt.
MEDIUM-TERM OUTLOOKThe medium-term financial outlook incorporates the
impact of all measures announced in this year’s
budget and is consistent with the current medium-
term economic outlook and its underlying
assumptions. Similar to the budget, medium-term
expense projections include the full accrual cost of
pensions.
Total revenue is forecast to grow, on average, by
3.0 per cent per year over the forecast period, slightly
less than expected average nominal GDP growth of
4.0 per cent.
Non-renewable resource revenue is estimated to grow
at 4.9 per cent per year. WTI oil prices are assumed
to increase over the forecast period, reaching
US$69.00 in 2021-22. Potash prices are also forecast
to increase over the four-year period. However, some
of these price gains are offset by an expected increase
in the value of the Canadian dollar.
2018-19 2019-20 2020-21 2021-22WTI Oil Price (US$/barrel) 58.18 59.75 63.50 69.00Light-Heavy Differential (% of WTI) 22.1 19.8 17.7 16.7Well-head Oil Price (C$/barrel)1 54.36 55.98 59.38 64.82Oil Production (million barrels) 177.7 181.0 183.4 185.5Potash Price (mine netback, US$/KCl tonne)2 191 194 197 201Potash Price (mine netback, C$/K2O tonne)2 399 399 396 398Potash Sales (million K2O tonnes)2 12.6 13.2 13.6 14.0Canadian Dollar (US cents) 78.34 79.65 81.55 82.581 The average price per barrel of Saskatchewan light, medium and heavy oil.2 Ministry of Finance calculations derived from calendar-year forecasts.
KEY MEDIUM-TERM NON-RENEWABLE RESOURCE FORECAST ASSUMPTIONS

Budget 2018-19
45
As a share of total revenue, non-renewable resources
are projected to grow from 10 per cent in 2018-19 to
11 per cent in 2021-22, the same path as outlined in
last year’s budget. While the share of revenue from
non-renewable resources is projected to increase
slightly over the forecast period, it is far lower than
levels relied upon over the past two decades. For
example, over the three-year period 2006-07 to
2008-09, non-renewable resources averaged
25 per cent of total revenue, including 32 per cent
in 2008-09.
Tax revenue is projected to grow at an average rate of
3.3 per cent over the medium term due to continued
growth in the provincial economy and population.
Similarly, other own-source revenue and net income
from GBEs are projected to increase at annual rates of
1.9 per cent and 1.1 per cent, respectively. Federal
transfers are projected to increase at an annual rate of
3.3 per cent over the forecast period, largely reflecting
legislated growth in the Canada Health Transfer and
Canada Social Transfer.
Non-Renewable ResourcesTaxes
Billio
ns o
f Dol
lars
Other Own-Sources Federal Transfers
0
2
4
6
8
10
12
14
16
2018-192010-112000-011990-91
COMPOSITION OF REVENUE – 1990-91 TO 2021-22
0
1,000
2,000
3,000
4,000
5,000
2018-192010-112000-011990-91
Revenue (left axis) Share of Revenue (right axis)
Milli
ons o
f Dol
lars
Per Cent
0
10
20
30
40
50
NON-RENEWABLE RESOURCE REVENUE – 1990-91 TO 2021-22

Budget 2018-19
46
Expense growth over the medium term is targeted
at 1.0 per cent in 2019-20, followed by growth of
1.7 per cent in 2020-21 and 2.0 per cent in 2021-22.
After a $365 million deficit in 2018-19, a small
surplus of $6 million is forecast for 2019-20.
Surpluses of $108 million and $212 million are
projected over the final two years of the four-year
forecast horizon.
(Millions of Dollars) 2018-19 2019-20 2020-21 2021-22Revenue 14,244 14,761 15,114 15,518Expense 14,609 14,755 15,006 15,306Surplus (Deficit) (365) 6 108 212
MEDIUM-TERM FINANCIAL OUTLOOK

Budget 2018-19
47
Billio
ns o
f Dol
lars
Debt of Government Business Enterprises
GRFOperating
Other Debt ofGovernment ServiceOrganizations
0
5
10
15
20
25
202220212020201920182017201620152014201320122011201020092008
6.84.1 4.1 4.1 3.8 3.8 3.8 3.8 4.1 5.4 5.8 6.2 6.6 6.6
3.4
3.6 3.9 4.0 4.4 5.3 6.4 7.3 8.08.3 8.7 9.2 9.5 9.70.3
0.2 0.2 0.2 0.3 0.30.5
0.6 1.32.3
3.24.6
5.4 6.0 6.7
9.8
6.6
10.5
7.9 8.2 8.3 8.5 9.410.7
11.7 13.4
16.017.7
20.021.5 22.3 23.1
PUBLIC DEBT As at March 31
2018 -19 BORROWING AND DEBT
The Province’s debt consists of:
• General Debt – all debt of government entitiesother than Government Business Enterprise(GBE) Specific Debt; and,
• Government Business Enterprise Specific Debt –amounts borrowed by, or specifically on behalf of self-sufficient government organizations.
Government business enterprises have the financial
and operating authority to sell goods and services to
individuals and organizations outside government as
their principal activity. Amounts borrowed by, or
specifically for these entities are classified separately
because they are expected to be repaid from cash
flows generated by these business enterprises. In
other words, this debt has been incurred to finance
the business activities of Crown corporations, and it
is supported by revenue from those Crown business
activities.
Public debt as reported in this budget paper is
comprised of:
• Gross Debt – the amount of money owed tolenders; less
• Sinking Funds – the amount of money which has been set aside for the repayment of debt.
Public debt at March 31, 2018 is forecast to be
$448.2 million lower than estimated, due primarily to
decreased debt for government business enterprises.
For 2018-19, public debt is expected to increase by
$2.3 billion from the March 31, 2018 forecast. This
is primarily due to $1.5 billion of new borrowings to
enable the General Revenue Fund (GRF) to finance
infrastructure assets for the Saskatchewan Builds
Capital Plan, $0.5 billion of increased debt for the
utility Crown corporations and $0.4 billion for GRF
operations. These increases are slightly offset by
reductions in the debt of other government service
organizations.

Budget 2018-19
48
GBE General Specific Debt Debt Budget Forecast Budget(Millions of Dollars) 2019 2019 2019 2018 2018Government Service OrganizationsGross Debt 11,937.0 – 11,937.0 10,056.9 10,091.5Sinking Funds 1,161.9 – 1,161.9 1,029.1 1,029.0Government Service Organization Debt 10,775.1 – 10,775.1 9,027.8 9,062.5Government Business EnterprisesGross Debt 275.0 10,046.6 10,321.6 9,679.3 10,097.1Sinking Funds 27.0 1,034.8 1,061.8 955.3 959.6Government Business Enterprise Debt 248.0 9,011.8 9,259.8 8,724.0 9,137.5
Public Debt 11,023.1 9,011.8 20,034.9 17,751.8 18,200.0
Guaranteed Debt 24.5 – 24.5 22.5 27.0
DEBTAs at March 31
Per C
ent
0
5
10
15
20
25
30
202220212020201920182017201620152014201320122011201020092008
13.0
Debt of Government Business Enterprises
GRFOperating
Other Debt ofGovernment ServiceOrganizations
6.1 6.9 6.5 5.1 4.9 4.6 4.6 5.2 7.2 7.3 7.5
0.6
6.4
5.3
0.40.3
6.5 6.3
0.40.4
5.9 6.8
0.4 0.6
7.7 8.8
0.7
1.7
10.211.0
3.0 4.1
11.1 11.3
5.6
7.6
11.2
6.3 6.8
10.8
7.4
7.5
10.3
7.0
20.0
11.813.7 13.2
11.4 12.1 12.914.1
17.121.2
22.524.4 25.1 25.0 24.8
PUBLIC DEBT AS A % OF GDPAs at March 31

Budget 2018-19
49
BORROWINGMost borrowing is done by the GRF. Where the GRF
borrows on behalf of a government entity, the entity
is responsible for the principal and interest payments
on this debt.
The GRF’s 2018-19 borrowing requirements are
estimated to be $3,206.1 million. Of this amount,
$586.0 million is for the purpose of refinancing
maturing debt, $400.0 million is increased debt for
GRF operations, and the majority of the remaining
amount is to assist with the financing of capital
expenditures. The 2018-19 borrowing requirements
include $600.0 million of borrowing that pertains to
capital expenditures of 2019-20. Borrowing these
funds in advance ensures that they are available when
needed and capitalizes on the current environment of
historically low interest rates.
A small amount of borrowing is done by entities such
as the Saskatchewan Health Authority, Boards of
Education, the Water Security Agency and the Global
Transportation Hub Authority. Collectively, the debt
of entities that conduct their own borrowing is
estimated to decline by $97.6 million in 2018-19.
SINKING FUNDSSinking funds are monies set aside for the orderly
retirement of a portion of the government’s debt.
Sinking funds at March 31, 2018 are forecasted to be
$1,984.4 million, which is $4.2 million lower than
estimated. The variance is primarily due to lower-
than-expected earnings during 2017-18.
For 2018-19, sinking funds are expected to increase
by $239.3 million to $2,223.7 million. This is
primarily due to the estimated level of sinking fund
contributions and forecasted earnings for the year.
SINKING FUNDS
Forecast Contributions Earnings Redemptions Budget(Millions of Dollars) 2018 2019 2019 2019 2019General Debt 1,029.1 108.0 24.8 0.0 1,161.9GBE Specific Debt 955.3 82.1 25.2 (0.8) 1,061.8
Total Sinking Funds 1,984.4 190.1 50.0 (0.8) 2,223.7

Budget 2018-19
50
DEBT CHARGESIn addition to interest payments, debt charges
include other costs related to general gross debt, such
as the amortization of premiums, discounts, and
commissions. Debt charges also include interest that
is accrued on pension liabilities.
The 2018-19 debt charges assume interest rates of
1.5 per cent for short-term borrowing transactions
and 3.5 per cent for long-term borrowings. An
interest rate of 3.1 per cent is assumed for pension
liabilities. A one percentage point increase in interest
rates for a full year from levels assumed in the Budget
would increase debt charges in 2018-19 by
approximately $55.7 million.
NET DEBTAnother measure of a province’s financial position is
“net debt.” Net debt aggregates all of a province’s
liabilities, and subtracts the financial assets that it has
at its disposal to repay these obligations.
Credit rating agencies and other users of public
sector financial information typically consider both
debt and net debt in their assessment of a province’s
financial condition.
The table below shows that the Province of
Saskatchewan’s net debt at March 31, 2018 is
forecasted to be $11.8 billion, which is third among
provinces on a per capita basis and second among
provinces as a percentage of GDP.
DEBT CHARGES
Estimated Forecast(Millions of Dollars) 2018-19 2017-18General Revenue Fund 425.6 356.4Pension Liabilities 220.9 232.2Other General Debt 8.1 14.7
Debt Charges1 654.6 603.31 Debt charges do not include amounts pertaining to Government Business Enterprise Specific Debt. These amounts are reflected in
Net Income from Government Business Enterprises.

Budget 2018-19
51
2017-18 2015-16 2016-17 2017-18 Per Capita2 Per Cent of GDP3
Billions of Dollars Dollars Rank1 % Rank1British Columbia 39.6 37.8 42.3 8,786 2 15.2 3Alberta (3.9) 8.9 20.3 4,729 1 5.9 1Saskatchewan 7.9 10.2 11.8 10,116 3 15.0 2Manitoba 21.4 22.7 24.0 17,900 6 33.9 5Ontario 295.4 301.6 308.2 21,715 9 37.1 7Québec 185.0 181.8 181.1 21,580 8 43.9 9New Brunswick 13.7 13.8 14.1 18,561 7 39.7 8Nova Scotia 15.1 15.0 15.1 15,779 5 35.3 6Prince Edward Island 2.2 2.2 2.2 14,606 4 33.7 4Newfoundland and Labrador 12.5 13.6 14.6 27,680 10 47.2 101 Rank ordered with 1 = lowest.2 Population data from Statistics Canada for populations as of January 1, 2018.3 Based on Statistics Canada estimates of GDP and Conference Board forecasts.Source: Jurisdictions’ most recent publicly available data.
NET DEBT COMPARISONAs at March 31

Budg
et 2
018-
19
52
2018 -19 REVENUE IN IT IAT IVES
The 2018-19 Budget introduces a number of revenue
initiatives to support Saskatchewan’s Growth Agenda
and to remain on track to address continuing fiscal
challenges facing the Government of Saskatchewan.
This paper describes in more detail the tax measures
announced in the Budget. However, it is only a
summary and the reader is advised to contact the
responsible ministries and consult the enacting
legislation or regulation for specific details.
SASKATCHEWAN’S GROWTH AGENDA
Saskatchewan Value-added Agriculture Incentive
For Saskatchewan to continue to successfully
promote robust economic growth and secure new
investment in key sectors, the Province must find
new ways to foster a competitive business
environment. As part of this effort, Saskatchewan has
introduced a number of new growth tax incentives.
Saskatchewan also recently increased the income
threshold to which the two per cent small business
tax rate applies – from $500,000 to $600,000
effective January 1, 2018.
To further encourage business investments that
will support the continued diversification of the
provincial economy, this Budget introduces a new
growth incentive designed to improve investment in
Saskatchewan’s value-added agriculture sector. The
Saskatchewan Value-added Agriculture Incentive
(SVAI) will provide a non-refundable Corporation
Income Tax credit equal to 15 per cent of qualifying
new capital expenditures.
Eligible value-added agriculture activities are defined
as the physical transformation or upgrading of any
raw/primary agricultural product or any agricultural
by-product or waste into a new or upgraded product.
Potential examples include pea protein processing,
canola seed crushing, oat milling, malt production
and cannabis oil processing. Cleaning, bagging,
handling, and/or storing of primary products will not
qualify.
Qualifying projects include new or existing value-
added agriculture facilities making capital
expenditures of at least $10 million related to new
or expanded productive capacity.
Potential applicants can apply to the Saskatchewan
Ministry of Trade and Export Development,
demonstrating how the proposed project will meet
the qualifying criteria. The Ministry will issue a letter
of conditional SVAI approval to eligible applicants.
Conditionally approved applicants will need to
complete construction, initiate operations and
provide evidence of the new or expanded value-
added production that resulted from the capital
investment. The Ministry will then issue a certificate
of SVAI eligibility to the company. This certificate will
indicate the amount of the company’s qualifying
capital expenditures.
Eligible companies can claim the 15 per cent SVAI
tax credit by submitting the certificate of SVAI
eligibility to the Saskatchewan Ministry of Finance,
along with the company’s Notice of Assessment from
the Canada Revenue Agency. The Ministry will

Budget 2018-19
53
redeem the tax credit as a rebate up to the amount of
Saskatchewan Corporation Income Tax paid by the
company. Redemption of the tax credit will be limited
to 20 per cent in year one after the facility begins
operations, 30 per cent in year two, and 50 per cent
in year three. Unused tax credit amounts can be
carried forward to subsequent taxation years, up to
the tenth year after the facility begins operations.
The SVAI program will sunset after December 31, 2022.
For further information on the SVAI program, contact
the Ministry of Trade and Export Development at
306-787-5858.
Saskatchewan Technology Start-up Incentive
The pace and scope of technological change
continues to accelerate through every sector of the
global economy. As such, Saskatchewan’s prosperity
is increasingly tied to its ability to foster strong
innovation outcomes. Of critical importance to
achieving strong innovation outcomes is a robust
innovation ecosystem that supports and develops
technology start-up companies in the preliminary
stages of commercialization and scale-up.
To further encourage business investment in early
stage technology start-ups, Saskatchewan is
introducing an incentive to increase the availability
of patient and risk tolerant seed capital. The
Saskatchewan Technology Start-up Incentive (STSI)
builds on the best practices in other Western
Canadian jurisdictions to address the capitalization
challenges faced by Saskatchewan technology
start-ups. The STSI will provide a non-refundable tax
credit equal to 45 per cent of qualifying new
investments made in eligible small businesses.
Eligible small businesses (ESBs) are early stage
technology start-ups that:
• are developing new technologies or applyingexisting technologies in a new way, to createproprietary new products, services, or processesthat are repeatable and scalable;
• have less than 50 employees;
• are incorporated and headquartered inSaskatchewan; and,
• have the majority of staff and operations locatedin Saskatchewan.
Investors can be either accredited or
non-accredited. Accredited investors include local
investment fund managers and financial institutions.
Non-accredited investors will be permitted to invest
within the confines of Saskatchewan securities
legislation. Venture capital corporations may also
raise capital and make investments under the terms
of the STSI program.
Upon making an approved ESB investment, eligible
investors will receive an eligibility certificate from
Innovation Saskatchewan which may then be used
to claim the 45 per cent STSI tax credit from the
Saskatchewan Ministry of Finance. For example, a
$500,000 investment can earn a maximum tax credit
of $225,000 per investment in an ESB. An investor
may claim up to $140,000 in tax benefits per year.
Unused tax credit amounts may be carried forward
for up to four years after the ESB investment is made.
The minimum hold period for ESB investments is two
years and the ESB may not be acquired, go public or
leave Saskatchewan within that two-year period.
The STSI is being launched as a 2½ year pilot
program. At the end of the pilot, the STSI’s
effectiveness will be evaluated against a series of
pre-determined metrics.
For further information on the STSI program, contact
Innovation Saskatchewan at 306-933-7389.

Budg
et 2
018-
19
54
TAXATION MEASURES
Personal Income Tax Rates
Enhancements to Saskatchewan’s Personal Income
Tax (PIT) exemptions introduced in 2008 and 2011
have removed almost 112,000 Saskatchewan residents
from the Province’s income tax roll. In total, PIT
reductions introduced since 2007 are providing about
$500 million in annual income tax savings to
Saskatchewan residents.
The 2017-18 Budget announced that PIT rates would
be reduced in two stages – an initial half-point
reduction on July 1, 2017 and a second half-point
reduction on July 1, 2019. The first stage of this
reduction is providing a further $121 million in
income tax savings to Saskatchewan residents in
2018.
The 2018-19 Budget announces a temporary freeze to
the tax rate reduction plan. Tax rates have now been
reduced by a half-point and will remain at these
levels for the time being.
Dividend Tax Credit
In October 2017, the federal government announced
an adjustment to the taxation of non-eligible
dividends (generally those received from small
business corporations) beginning in 2018. These
dividends are referred to as “non-eligible” because
they are distributed to individuals from corporate
income that was taxed at the small business tax rates
rather than at the standard corporate tax rates.
As a result of the linkage between the federal and
provincial personal income tax systems, the federal
change would automatically increase provincial
income taxes on this type of dividend income.
To offset this potential increase to provincial income
taxes and to maintain the current level of provincial
tax on non-eligible dividends, Saskatchewan will
amend provincial legislation. For the 2018 taxation
year, the effective Saskatchewan dividend tax credit
rate will be 3.333 per cent of taxable non-eligible
dividend income. For the 2019 and subsequent
taxation years, this rate will be 3.362 per cent.
Caregiver Tax Credits
In its 2017-18 Budget, the federal government
announced the consolidation of federal caregiver-
related income tax credits into a single Canada
Caregiver Credit. Saskatchewan will not mirror the
federal change and will instead maintain the existing
provincial Infirm Dependant Tax Credit and
Caregiver Tax Credit, in order to ensure that
dependants who are currently eligible to be claimed
under these tax credits remain eligible.
Saskatchewan’s $9,464 tax credit amounts also remain
significantly higher than the $6,883 federal amount.
2016 2017 2018 Rates Rates RatesFirst Bracket 11% 10.75% 10.5%Second Bracket 13% 12.75% 12.5%Third Bracket 15% 14.75% 14.5%Note: The 2017 tax rates reflect the impact of the half-point reduction midway through the 2017 taxation year.
SASKATCHEWAN’S PERSONAL INCOME TAX RATES

Budget 2018-19
55
Taxation of Vehicles
The 2017-18 Budget announced a number of
expansions to the Provincial Sales Tax (PST) base.
One of the changes was to maintain the PST
exemption for used light vehicles, but to no longer
allow a deduction for the value of a trade-in when
determining the PST on the purchase of a taxable
light vehicle.
Following substantial consultations with
Saskatchewan’s vehicle dealers, this Budget
announces the elimination of the PST exemption for
used light vehicles, effective April 11, 2018. This
measure removes the difference in the tax treatment
between used light vehicles and all other types of
used vehicles, for which PST has always applied.
Purchasers of used vehicles will now face the same
tax rules, regardless of the type of vehicle they are
purchasing.
In addition, the Budget announces the restoration
of the trade-in allowance when determining the PST,
also effective April 11, 2018. In other words, when
trading in a vehicle, PST is paid only on the
difference in price between the value of the trade-in
and the total selling price of the vehicle being
purchased.
Individuals purchasing a used vehicle through a
private sale and registering the vehicle for personal
or farm use have previously been permitted to deduct
$3,000 from the purchase price in computing the
PST. This deduction is now converted to a $5,000
exemption. The PST will not apply to the private sale
of these used vehicles with a purchase price up to
$5,000. The PST will apply in full for vehicles with a
purchase price above $5,000. As with the former
$3,000 deduction, private sales of used vehicles
registered for commercial use, as well as dealer sales
of used vehicles, are not eligible for the $5,000
exemption.
The PST also does not apply for used vehicles gifted
between qualifying family members. A qualifying
family member includes a spouse, parent or legal
guardian, child, grandparent, grandchild or sibling.
Rules are in place to prevent the unfair avoidance of
tax.
ENERGY STAR® Appliances
Since 2003, an exemption from the PST has existed
for ENERGY STAR® certified refrigerators, freezers,
dishwashers and clothes washers to encourage
consumers to purchase energy-efficient household
appliances. This exemption was subsequently
expanded to include ENERGY STAR® qualifying
residential furnaces and boilers, as well as ground
and air source heat pumps.
ENERGY STAR® certified appliances now dominate
the household appliance market and constitute the
majority of consumer sales in Canada, with the
benefit of permanent energy cost savings providing a
strong incentive for consumers to choose these
appliances. The PST exemption is no longer needed
to encourage this consumer behaviour and the
Budget therefore eliminates the PST exemption for
these appliances, effective April 11, 2018.

Budg
et 2
018-
19
56
Cannabis Taxation
In December 2017, Canadian Finance Ministers
agreed in principle to a cannabis taxation approach.
Saskatchewan believes this approach best meets the
objectives to restrict cannabis use by youth and, as
much as possible, eliminate the illegal market.
Saskatchewan therefore intends to formalize its
participation in this taxation approach by entering
into an initial two-year agreement under which the
Province will receive 75 per cent of the federal
cannabis excise duty revenue generated in the
province. Saskatchewan will also receive a
proportionate share of any revenue generated in
Canada above the $100 million cap on federal
revenues from the federal cannabis excise duty.
The PST will also apply to all retail sales of cannabis
products in Saskatchewan. In addition, for sales in
the province, the federal cannabis excise duty rate
will be increased to account for interprovincial sales
tax rate differentials, and Saskatchewan will receive
this revenue from the federal government.
The 2018-19 Budget does not incorporate any
revenue from the sale of cannabis in this initial year,
in part because it remains unclear exactly when
legalization will occur, and because the size of the
cannabis market and the anticipated retail price are
difficult to predict, making it challenging to
accurately forecast potential revenue.
For further information on the initiatives described in
this paper (other than the SVAI program or the STSI
program), refer to the Ministry of Finance website at
www.saskatchewan.ca/budget or call 1-800-667-6102.

Budget 2018-19
57
SASKATCHEWAN’S TAX EXPENDITURES
INTRODUCTIONAlthough the primary purpose of taxation is to raise
revenue, governments also attain some of their social
and economic goals by reducing the taxes paid by
certain taxpayers. These reductions are commonly
called “tax expenditures” and include such measures
as exemptions, deductions, tax credits, preferential
tax rates or deferrals. Taken together, they provide
assistance to a variety of individuals and businesses,
including families, farmers, senior citizens and small
businesses.
While tax expenditures are usually absorbed in the
overall revenue estimates and are not presented in the
same way as direct spending programs, they reduce
the amount of revenue generated by a government
and they affect a government’s fiscal position in the
same way as direct expenditures.
RATIONALE FOR TAX EXPENDITURESTax expenditures can achieve a number of objectives,
such as enhancing the fairness of the tax system or
promoting certain types of economic activity. In
pursuing these objectives, some tax expenditures
have become fundamental elements of the tax system.
Saskatchewan’s Provincial Sales Tax (PST) does not
apply to certain essential items such as basic
groceries, residential natural gas, residential
electricity and reading materials, thereby reducing
the taxes paid by families consuming these items.
Some of Saskatchewan’s PST exemptions are in
contrast to the federal Goods and Services Tax (GST)
and the sales taxes of provinces that have harmonized
their sales taxes with the GST, since those taxes apply
to a much broader range of goods and services
purchased by families.
Other exemptions from the PST are intended to
support particular key sectors of the provincial
economy, including manufacturing and farming.
Saskatchewan’s personal income tax system applies
provincial marginal tax rates directly to taxable
income as defined for federal income tax purposes.
As a result, deductions that contribute to the federal
determination of taxable income, such as the
deduction for Registered Retirement Savings Plan
contributions, also affect Saskatchewan income tax
revenue. The impacts of several of these deductions
are estimated in this paper.
In addition, Saskatchewan’s personal income tax
system has distinct provincial non-refundable income
tax credits that recognize the personal circumstances
of the taxpayer, including family-based credits and
disability-related credits. This paper also provides
estimates of the revenue impacts of several of these
provincial non-refundable tax credits.
Saskatchewan’s income tax system also delivers
several programs designed to encourage particular
taxpayer behaviours, including investment incentives
and retention incentives.

Budget 2018-19
58
To improve tax competitiveness, Saskatchewan levies
a lower income tax rate on small businesses and a
special income tax rate on manufacturing and
processing (M&P) profits. In addition, Saskatchewan
provides a refundable Investment Tax Credit to
assist M&P companies that invest in qualifying new
or used M&P assets for use in the province.
Saskatchewan also provides a Research and
Development (R&D) Tax Credit in support of
qualifying R&D activities.
ASSOCIATED COSTSWhile tax expenditures serve important social and
economic objectives, the introduction of any tax
expenditure results in associated costs. These costs
take several forms.
• First, there is the cost of forgone revenue. Taxexpenditures result in the reduction of revenuecollected and have a significant impact on agovernment’s financial position.
• Second, tax expenditures may add to thecomplexity of the tax system, leading toincreased administrative effort by both taxpayersand governments.
• Third, tax expenditures may create distortions in consumer and other economic behaviour byproviding preferential treatment for certaincategories of consumer expenditure.
• Finally, tax expenditures may create increasedcompliance costs for both businesses andconsumers.
GOVERNMENT OF CANADA TAX EXPENDITURESThe federal government produces a detailed
presentation on tax expenditures that are part of the
federal tax system. Since Saskatchewan’s personal and
corporate income taxes are based upon the federal
definition of taxable income, many of the federal tax
expenditures have an impact on Saskatchewan’s
revenue. Readers interested in examining the federal
government’s presentation of tax expenditures are
invited to visit the Finance Canada website at
www.fin.gc.ca (and click on “Publications and
Reports”).
2018 SASKATCHEWAN TAX EXPENDITURE ACCOUNTSThe following tables provide estimates of the major
tax expenditures of the Government of Saskatchewan,
calculated using tax collection data, Statistics Canada
data and income tax assessment data. Estimates are
derived from these data sources by applying
assumptions regarding the expected changes in
population, employment and income, retail sales and
investment intentions. This year’s tables also provide
updates to the 2015, 2016 and 2017 tax expenditure
estimates that were reported last year.
The 2018-19 Saskatchewan Tax Expenditure
Accounts incorporate the PST change that was
announced earlier this year to exempt certain
insurance products, as well as the PST changes
announced in this Budget. These latter initiatives
are described in greater detail in the technical paper
entitled 2018-19 Revenue Initiatives.

Budget 2018-19
59
2015 2016 2017 2018Provincial Sales Tax Revised Revised Revised Estimate
Exemptions 1. Basic groceries................................................................... 127.6 129.6 153.3 164.5 2. Prescription drugs .............................................................. 34.9 35.7 45.0 45.4 3. Reading materials .............................................................. 8.8 9.4 11.4 12.8 4. Personal services ............................................................... 35.8 37.0 43.3 46.0 5. Feminine hygiene products ................................................ – 1.7 2.1 2.2 6. Used goods – exemption amounts .................................... 0.2 0.2 0.2 0.3 7. Electricity ............................................................................ 47.4 49.9 64.4 71.2 8. Natural gas ......................................................................... 24.1 23.2 28.0 28.4 9. Farm machinery and repair parts ....................................... 85.6 87.3 82.9 85.910. Fertilizer, pesticide and seed.............................................. 177.9 182.7 201.2 210.911. Direct agents ...................................................................... 19.1 18.6 21.6 22.812. Toll-free telephone services ............................................... 0.2 0.2 0.2 0.213. Agriculture, life and health insurance................................. – – 65.0 120.0
Other 1. Saskatchewan Low-Income Tax Credit .............................. 88.2 92.0 109.0 126.0
2015 2016 2017 2018Fuel Tax Revised Revised Revised Estimate
1. Exemption for farm activity................................................. 118.7 116.3 87.7 78.3 2. Exemption for heating fuels................................................ 28.2 26.2 26.7 27.3 3. Exemption for primary producers ....................................... 1.8 1.6 1.3 1.2
2018 Government of SaskatchewanTax Expenditure Accounts(Value of Tax Expenditures in Millions of Dollars)

Budget 2018-19
60
2015 2016 2017 2018Personal Income Tax Actual Revised Revised Estimate
Deductions from Income 1. Registered Pension Plan contributions .............................. 95.6 90.9 96.3 98.0 2. Registered Retirement Savings Plan contributions............ 147.7 137.1 141.4 146.6 3. Annual union, professional or like dues ............................. 17.0 16.0 17.2 17.5 4. Child care expenses........................................................... 13.5 12.7 13.2 13.4 5. Moving expenses ............................................................... 1.7 1.6 1.6 1.6 6. Carrying charges ................................................................ 17.2 15.7 15.2 16.1 7. Allowable employment expenses....................................... 14.3 13.3 13.5 13.9 8. Capital gains deduction...................................................... 79.8 73.7 74.8 75.1
Saskatchewan Non-Refundable Tax Credits 1. Basic personal tax credit .................................................... 1,047.0 1,069.0 1,061.0 1,050.6 2. Spousal tax credit............................................................... 52.3 53.2 53.8 53.3 3. Equivalent-to-spouse tax credit .......................................... 23.5 23.6 23.8 23.6 4. Age tax credit ..................................................................... 34.5 34.6 36.8 36.9 5. Supplement to the age tax credit ....................................... 14.3 14.6 14.4 14.3 6. Dependent child tax credit.................................................. 106.7 108.4 107.0 105.5 7. Canada Pension Plan contributions tax credit ................... 87.1 86.3 88.1 86.9 8. Employment Insurance premiums tax credit ...................... 30.5 30.0 30.9 30.4 9. Pension income tax credit .................................................. 13.2 13.0 12.9 12.810. Tuition and education tax credit ......................................... 42.6 39.7 21.8 0.011. Student loan interest tax credit .......................................... 0.7 0.7 0.8 0.812. Disability tax credit ............................................................. 20.7 20.2 20.8 20.713. Caregiver tax credit ............................................................ 2.9 2.9 2.9 2.814. Medical expenses tax credit............................................... 26.5 25.6 26.6 26.615. Charitable contributions tax credit...................................... 46.2 45.2 46.9 47.716. First-time homebuyers tax credit........................................ 6.0 6.0 5.9 5.9
Other Saskatchewan Tax Measures 1. Labour-sponsored Venture Capital Tax Credit ................... 12.9 12.1 16.0 12.0 2. Mineral Exploration Tax Credit ........................................... 0.2 0.1 0.5 0.5 3. Political Contributions Tax Credit ....................................... 1.6 2.0 0.8 1.3 4. Graduate Retention Program Tax Credit............................ 52.9 58.0 68.1 72.3
2015 2016 2017 2018Corporation Income Tax Actual Revised Revised Estimate
1. Lower tax rate for small business ...................................... 438.2 418.0 441.4 422.5 2. Manufacturing and Processing Profits Tax Reduction ....... 11.9 10.9 15.0 15.0 3. Investment Tax Credit for Manufacturing and Processing .. 40.7 32.7 36.0 36.0 4. Research and Development Tax Credit ............................. 25.1 10.1 10.0 11.5

Budget 2018-19
61
2018 INTERCITY COMPARISON OF TAXES AND UT IL IT IES
INTRODUCTIONA number of factors contribute to the quality of life
enjoyed by individuals and families in Saskatchewan
and across Canada. For example, access to excellent
health care, education and social services is a key part
of the overall quality of life.
Other important factors that affect quality of life are
the level of taxation and the cost of utilities and auto
insurance. Calculating the combined cost of
provincial taxes and utilities is a reliable way to
compare the attractiveness of living in different parts
of Canada.
For the purposes of such a comparison, the total cost
of such taxes and utilities for representative families
living in Regina has been compared with the costs
those families would face in other major cities across
the country.
The provincial taxes and utilities costs associated
with the following family characteristics and income
levels have been calculated to provide a representative
comparison:
• a single person, living in rental accommodation,with an annual income of $40,000;
• a family of two adults and two dependentchildren, owning its own home, with an annualfamily income of $75,000;
• a family of two adults and two dependentchildren, owning its own home, with an annualfamily income of $100,000; and,
• a family of two adults and two dependentchildren, owning its own home, with an annualfamily income of $125,000.
SASKATCHEWAN’S RANKING FOR 2018In 2018, Saskatchewan individuals and families will
pay total provincial taxes that are very competitive
with those paid in other Canadian cities, with a
ranking among the lowest in Canada for all four
representative family situations.
• A single person earning $40,000 will pay $3,059 in total provincial taxes.
• A two-income family earning $75,000 will pay$4,572 in total provincial taxes.
• A two-income family earning $100,000 will pay$7,554 in total provincial taxes.
• A two-income family earning $125,000 will pay$10,668 in total provincial taxes.
Regina also ranks favourably with other cities in
Canada when comparing provincial taxes and
utilities. For the representative family situations,
Regina again ranks among the lowest overall
combined taxes and utilities of the 10 cities surveyed.

Budget 2018-19
62
2018 Intercity Comparison of Taxes and UtilitiesSingle Person at $40,000 Total Income(Values in Dollars) Saint Charlotte- Vancouver Calgary Regina Winnipeg Toronto Montréal John Halifax town St. John’sProvincial TaxesProvincial Income Tax 1,381 1,861 2,254 3,199 1,372 2,827 2,661 3,195 3,215 2,725
Tax Credits and Rebates (15) (300) (144) 0 (193) (622) (200) 0 (160) (450)
Health Premiums 390 0 0 0 450 667 0 0 0 0Sales Tax 740 0 799 932 1,192 1,502 1,513 1,513 1,513 1,513Gasoline Tax 322 197 150 158 147 167 155 155 158 205Total Provincial Taxes 2,818 1,758 3,059 4,289 2,968 4,541 4,129 4,863 4,726 3,993
Household Utility CostsElectricity 459 564 894 464 1,351 414 651 824 1,297 658Telephone 362 361 258 314 370 370 371 372 372 371Auto Insurance 1,966 2,588 1,199 1,192 4,669 1,884 1,621 1,992 1,754 2,991Total Household Utility Costs 2,787 3,513 2,351 1,970 6,390 2,668 2,643 3,188 3,423 4,020
Total Taxesand Utilities 5,605 5,271 5,410 6,259 9,358 7,209 6,772 8,051 8,149 8,013
2018 Intercity Comparison of Taxes and UtilitiesFamily at $75,000 Total Income(Values in Dollars) Saint Charlotte- Vancouver Calgary Regina Winnipeg Toronto Montréal John Halifax town St. John’sProvincial TaxesProvincial Income Tax 2,288 2,956 2,422 5,128 1,887 4,513 4,750 5,382 5,557 4,831
Tax Credits and Rebates 0 (807) 0 0 0 (2,694) (60) 0 0 0
Health Premiums 900 0 0 0 750 1,334 0 0 0 0Sales Tax 1,811 0 1,850 2,248 2,865 3,604 3,627 3,627 3,627 3,627Gasoline Tax 644 394 300 316 294 334 310 310 316 410Total Provincial Taxes 5,643 2,543 4,572 7,692 5,796 7,091 8,627 9,319 9,500 8,868
Household Utility CostsHome Heating 914 850 910 849 926 1,603 2,181 2,193 2,254 2,204Electricity 796 908 1,377 746 1,298 618 999 1,356 1,420 1,015Telephone 362 361 258 314 370 370 371 372 372 371Auto Insurance 1,966 2,588 1,199 1,192 4,669 1,884 1,621 1,992 1,754 2,991Total Household Utility Costs 4,038 4,707 3,744 3,101 7,263 4,475 5,172 5,913 5,800 6,581
Total Taxes and Utilities 9,681 7,250 8,316 10,793 13,059 11,546 13,799 15,232 15,300 15,449

Budget 2018-19
63
2018 Intercity Comparison of Taxes and UtilitiesFamily at $100,000 Total Income(Values in Dollars) Saint Charlotte- Vancouver Calgary Regina Winnipeg Toronto Montréal John Halifax town St. John’sProvincial TaxesProvincial Income Tax 4,091 5,325 5,205 8,226 4,252 8,365 7,814 8,859 8,679 7,829
Tax Credits and Rebates 0 (460) 0 0 0 (1,694) 0 0 0 0
Health Premiums 900 0 0 0 960 1,334 0 0 0 0Sales Tax 1,968 0 2,049 2,493 3,173 3,995 4,021 4,021 4,021 4,021Gasoline Tax 644 394 300 316 294 334 310 310 316 410Total Provincial Taxes 7,603 5,259 7,554 11,035 8,679 12,334 12,145 13,190 13,016 12,260
Household Utility CostsHome Heating 914 850 910 849 926 1,603 2,181 2,193 2,254 2,204Electricity 796 908 1,377 746 1,298 618 999 1,356 1,420 1,015Telephone 362 361 258 314 370 370 371 372 372 371Auto Insurance 1,966 2,588 1,199 1,192 4,669 1,884 1,621 1,992 1,754 2,991Total Household Utility Costs 4,038 4,707 3,744 3,101 7,263 4,475 5,172 5,913 5,800 6,581
Total Taxes and Utilities 11,641 9,966 11,298 14,136 15,942 16,809 17,317 19,103 18,816 18,841
2018 Intercity Comparison of Taxes and UtilitiesFamily at $125,000 Total Income(Values in Dollars) Saint Charlotte- Vancouver Calgary Regina Winnipeg Toronto Montréal John Halifax town St. John’sProvincial TaxesProvincial Income Tax 5,912 7,759 8,096 11,775 6,262 12,420 11,215 12,796 12,384 11,439
Tax Credits and Rebates 0 0 0 0 0 (1,312) 0 0 0 0
Health Premiums 900 0 0 0 1,200 1,334 0 0 0 0Sales Tax 2,165 0 2,272 2,742 3,490 4,395 4,423 4,423 4,423 4,423Gasoline Tax 644 394 300 316 294 334 310 310 316 410Total Provincial Taxes 9,621 8,153 10,668 14,833 11,246 17,171 15,948 17,529 17,123 16,272
Household Utility CostsHome Heating 914 850 910 849 926 1,603 2,181 2,193 2,254 2,204Electricity 796 908 1,377 746 1,298 618 999 1,356 1,420 1,015Telephone 362 361 258 314 370 370 371 372 372 371Auto Insurance 1,966 2,588 1,199 1,192 4,669 1,884 1,621 1,992 1,754 2,991Total Household Utility Costs 4,038 4,707 3,744 3,101 7,263 4,475 5,172 5,913 5,800 6,581
Total Taxes and Utilities 13,659 12,860 14,412 17,934 18,509 21,646 21,120 23,442 22,923 22,853

Budget 2018-19
64
TAXES AND UTILITIES – NOTES Tax estimates are calculated for the 2018 calendar
year using known changes as of March 15, 2018.
Household charges for the basic utility services
(electricity, home heating, telephone and auto
insurance) represent a cost comparison of the actual
utility rates for the 2017 calendar year. This
methodology has been chosen due to the uncertainty
of attempting to forecast utility rates for the coming
year. The utility figures exclude federal Goods and
Services Tax, provincial sales tax and municipal taxes
and surcharges.
Provincial Income Tax is calculated for an individual
with $40,000, and three families with $75,000,
$100,000 and $125,000 income respectively. It is
assumed that family income is earned by both
spouses at a 60 per cent to 40 per cent ratio and that
the families each claim $3,000 in child care expenses
for two dependent children (ages 6 and 12). Personal
non-refundable credits used include the Canada
Pension Plan/Québec Pension Plan and Employment
Insurance contribution credits. Gross Québec
personal income tax has been reduced by the
Québec Child Care Expense Tax Credit and by the
16.5 per cent abatement from federal income tax.
Tax Credits and Rebates refer to refundable
provincial income tax credits and rebates designed
to reduce the impact of sales taxes.
Health Premiums are annual premiums for hospital
insurance and medical services.
Sales Tax is based upon average family expenditure
baskets at the total income levels from the CANSIM
Survey of Household Spending 2014 (Statistics
Canada). The sales tax base in each province was
identified from the enacting legislation, with total
expenditures adjusted to reflect Saskatchewan
consumption patterns. The sales tax in each province
was then estimated based on taxable expenditures.
Gasoline Tax is based on annual consumption of
1,000 litres by a single person, and 2,000 litres for
families. Figures include charges levied by transit
commissions as well as carbon taxes applied to the
purchase of gasoline.
Home Heating charges are based on an annual
consumption level of 2,800 m3 of natural gas. For
Charlottetown and St. John’s, the figures represent
the BTU equivalent consumption of fuel oil.
Electricity charges are based on an annual
consumption level of 4,584 kWh for the renter and
8,100 kWh for the homeowners.
Telephone charges are the basic service rates for
individual residences.
Auto Insurance is based on a composite index
developed by SGI modelled after the index developed
by the Consumers’ Association of Canada. The index
is based on the actual insurance rates quoted for what
drivers would pay in each jurisdiction if they had the
same car, same coverage, same claims history and
driving record at a consistent point in time. The
Consumers’ Association of Canada developed 34
profiles to create this index. The impacts of “Good
Driver” discounts/rebates have been factored in for
all applicable jurisdictions. Auto insurance rates for
Saint John, Halifax, Charlottetown and St. John’s are
unchanged from last year’s comparison as SGI no
longer has access to rate information in these
jurisdictions.

SASKATCHEWAN PROVINCIAL BUDGET
18-19BUD G E T F I N A N C I A L T A B L E S

Budget 2018-19
66
GOVERNMENT OF SASKATCHEWANBudgetFor the Year Ended March 31
(Millions of Dollars)
Budget Forecast Budget 2018-19 2017-18 2017-18
Revenue
Taxation.................................................................................... 7,214.9 6,796.3 7,286.6Non-renewable resources ........................................................ 1,482.1 1,419.7 1,406.4Net income from government business enterprises ................ 1,078.0 1,186.5 1,053.7Other own-source revenue ...................................................... 2,006.5 2,098.2 1,964.9Transfers from the federal government.................................... 2,462.0 2,442.3 2,453.5
Total Revenue 14,243.5 13,943.0 14,165.1
Expense
Agriculture ................................................................................ 770.9 545.4 800.5Community development ......................................................... 642.6 663.6 700.6Debt charges1........................................................................... 654.6 603.3 605.7Economic development............................................................ 230.2 236.7 246.0Education1 ................................................................................ 3,263.3 3,449.4 3,531.0Environment and natural resources ......................................... 251.7 259.6 247.9Health....................................................................................... 5,765.3 5,730.0 5,627.4Other1 ....................................................................................... 439.7 443.5 484.2Protection of persons and property.......................................... 689.9 680.6 643.7Social services and assistance ................................................ 1,381.3 1,381.0 1,356.7Transportation .......................................................................... 519.3 544.9 567.4
Total Expense 14,608.8 14,538.0 14,811.1
Adjustments
Human resources compensation measures ............................ – – 250.0Contingency ............................................................................. – – (300.0)Deficit (365.3) (595.0) (696.0)Totals may not add due to rounding.
1 This schedule is presented on a basis consistent with the Summary Financial Statements, including presentation of pension costs on an accrual basis.For consistency with this presentation, the 2017-18 Budget is restated. The adjustment to restate previously published budget amounts is detailed in theGovernment of Saskatchewan 2017-18 Third Quarter Financial Report.

Budget 2018-19
67
GOVERNMENT OF SASKATCHEWANStatement of Accumulated Deficit
For the Year Ended March 31
(Millions of Dollars)
Budget Forecast Budget 2018-19 2017-18 2017-18
Accumulated (deficit)/surplus, beginning of year ..................... (223.1) 371.91 343.9Deficit........................................................................................ (365.3) (595.0) (696.0)Accumulated Deficit, End of Year (588.4) (223.1) (352.1)Totals may not add due to rounding.
1 Accumulated surplus as at March 31, 2017, as reported in the 2016-17 Summary Financial Statements.
GOVERNMENT OF SASKATCHEWANStatement of Change in Net Debt
For the Year Ended March 31
(Millions of Dollars)
Budget Forecast Budget 2018-19 2017-18 2017-18
Deficit ....................................................................................... (365.3) (595.0) (696.0)Acquisition of government service organization capital assets ...... (1,118.0) (1,558.9) (1,487.5)Amortization of government service organization capital assets1 .. 610.1 571.2 582.9
Increase in Net Debt (873.2) (1,582.7) (1,600.6)Net debt, beginning of year...................................................... (11,774.6) (10,191.9)2 (10,643.1)Net Debt, End of Year (12,647.8) (11,774.6) (12,243.7)Totals may not add due to rounding.
1 Includes disposals and adjustments.2 Net debt as at March 31, 2017, as reported in the 2016-17 Summary Financial Statements.

Budget 2018-19
68
GOVERNMENT OF SASKATCHEWANSchedule of Pension LiabilitiesAs at March 31
(Millions of Dollars)
Budget Forecast Budget 2018-19 2017-18 2017-18
Pension liabilities, beginning of year........................................ 7,695.5 7,786.11 7,784.4Adjustment to account for pension costs on an accrual basis .... (393.2) (90.6) 11.3Pension Liabilities, End of Year 7,302.3 7,695.5 7,795.7Totals may not add due to rounding.
1 Pension liabilities as at March 31, 2017, as reported in the 2016-17 Summary Financial Statements.
GOVERNMENT OF SASKATCHEWANSchedule of Capital AssetsAs at March 31
(Millions of Dollars)
Forecast Budget Net Book Net Book Net Book Value Value Value March 31 – 2017-18 Forecast – March 31 – 2018-19 Budget – March 31 20171 Additions2 Amortization3 2018 Additions2 Amortization3 2019
Government service organizations ................ 10,331.2 1,558.9 (571.2) 11,318.9 1,118.0 (610.1) 11,826.8
Government businessenterprises ................... 13,859.5 1,575.7 (835.9) 14,599.3 1,566.0 (881.8) 15,283.5
Total Capital Assets 24,190.7 3,134.6 (1,407.1) 25,918.2 2,684.0 (1,491.9) 27,110.3Totals may not add due to rounding.
1 Net book value as at March 31, 2017, as reported in the 2016-17 Summary Financial Statements.2 Includes only capital assets acquired by government entities. Capital transfers provided to entities outside the reporting entity are expensed.3 Includes disposals and adjustments.

(Millions of Dollars)
Budget Budget GBE Budget Forecast Budget General Specific Public Public Public Debt1 Debt Debt Debt Debt 2018-19 2018-19 2018-19 2017-18 2017-18
Government Service Organization (GSO) DebtGeneral Revenue Fund– Operating............................................................ 6,150.0 – 6,150.0 5,750.0 5,750.0– Saskatchewan Builds Capital Plan2.................... 4,193.8 – 4,193.8 2,751.7 2,755.6
Boards of Education ................................................. 166.8 – 166.8 175.2 174.8Global Transportation Hub Authority......................... 35.0 – 35.0 37.3 26.0Saskatchewan Health Authority3 ............................... 98.3 – 98.3 107.0 154.0Saskatchewan Housing Corporation ........................ 15.7 – 15.7 17.6 17.4Saskatchewan Immigrant Investor Fund Inc. ........... 22.9 – 22.9 90.1 89.6Saskatchewan Opportunities Corporation ................ 55.2 – 55.2 56.0 56.0Water Security Agency ............................................. 31.6 – 31.6 37.1 37.1Other......................................................................... 5.8 – 5.8 5.8 2.0Government Service Organization Debt 10,775.1 – 10,775.1 9,027.8 9,062.5
Government Business Enterprise (GBE) DebtMunicipal Financing Corporation of Saskatchewan.... 94.7 113.0 207.7 209.1 208.9Saskatchewan Liquor and Gaming Authority............. – 100.0 100.0 104.7 104.7Saskatchewan Power Corporation ........................... 87.6 6,336.9 6,424.5 6,132.5 6,422.4Saskatchewan TelecommunicationsHolding Corporation .............................................. – 1,046.2 1,046.2 945.2 967.4
Saskatchewan Water Corporation ............................ – 87.6 87.6 64.6 78.3SaskEnergy Incorporated ......................................... 65.7 1,328.1 1,393.8 1,267.9 1,355.8Government Business Enterprise Debt4 248.0 9,011.8 9,259.8 8,724.0 9,137.5Public Debt5 11,023.1 9,011.8 20,034.9 17,751.8 18,200.0
Guaranteed Debt 24.5 – 24.5 22.5 27.0Totals may not add due to rounding.
1 General debt is issued by government service organizations (GSOs) and includes issued amounts subsequently transferred to government business enterprises (GBEs).
2 General Revenue Fund – Saskatchewan Builds Capital Plan consists of amounts borrowed by the General Revenue Fund to finance investment in infrastructure assets.
3 2017-18 Budget represents public debt of 12 Regional Health Authorities that were amalgamated into the Saskatchewan Health Authority onDecember 4, 2017.
4 GBE debt includes both general debt and GBE-specific debt. General debt of GBEs is the amount transferred from the General Revenue Fund to a GBE and recorded as a loan receivable in the Summary Financial Statements. GBE-specific debt is debt issued by, or specifically on behalf of,GBEs. GBE-specific debt is included in “Investment in government business enterprises” in the Summary Financial Statements.
5 Public debt is shown net of sinking funds.
Budget 2018-19
69
GOVERNMENT OF SASKATCHEWANSchedule of Public Debt
As at March 31

Budget 2018-19
70
GOVERNMENT OF SASKATCHEWANSchedule of RevenueFor the Year Ended March 31
(Millions of Dollars)
Budget Forecast Budget 2018-19 2017-18 2017-18
TaxationCorporation income ....................................................................... 621.1 590.2 729.4Fuel................................................................................................ 546.1 535.4 515.4Individual income........................................................................... 2,441.2 2,311.8 2,540.6Property ......................................................................................... 759.3 750.6 753.9Provincial sales.............................................................................. 2,155.0 1,929.5 2,049.5Tobacco ......................................................................................... 260.3 260.3 280.3Other.............................................................................................. 431.9 418.5 417.5Total Taxation 7,214.9 6,796.3 7,286.6Non-Renewable ResourcesCrown land sales........................................................................... 63.9 64.5 52.0Oil and natural gas ........................................................................ 700.1 661.2 670.4Potash ........................................................................................... 308.0 298.7 260.6Resource surcharge ...................................................................... 317.3 297.5 272.5Other.............................................................................................. 92.8 97.8 150.9Total Non-Renewable Resources 1,482.1 1,419.7 1,406.4Net Income from Government Business EnterprisesMunicipal Financing Corporation of Saskatchewan ...................... 0.8 0.7 0.8Saskatchewan Auto Fund.............................................................. 118.0 142.6 65.3Saskatchewan Gaming Corporation.............................................. 23.0 22.4 23.5Saskatchewan Government Insurance ......................................... 60.7 58.8 37.2Saskatchewan Liquor and Gaming Authority ................................ 481.4 479.6 523.3Saskatchewan Power Corporation ................................................ 176.7 138.1 179.5Saskatchewan Telecommunications Holding Corporation ............ 133.0 122.1 122.1Saskatchewan Water Corporation................................................. 6.2 7.2 5.8SaskEnergy Incorporated .............................................................. 68.4 104.6 90.6Saskatchewan Workers' Compensation Board ............................. 15.3 116.1 11.2Consolidation adjustments ............................................................ (5.5) (5.7) (5.6)Total Net Income from Government Business Enterprises 1,078.0 1,186.5 1,053.7Other Own-Source RevenueFees............................................................................................... 1,157.3 1,153.4 1,124.4Insurance....................................................................................... 288.2 297.8 282.3Investment income ........................................................................ 95.6 105.5 80.7Transfers from other governments ................................................ 88.8 96.8 89.7Miscellaneous................................................................................ 376.6 444.7 387.8Total Other Own-Source Revenue 2,006.5 2,098.2 1,964.9Transfers from the Federal GovernmentCanada Health Transfer ................................................................ 1,202.4 1,176.1 1,161.2Canada Social Transfer................................................................. 441.3 435.3 429.8Other.............................................................................................. 818.3 830.9 862.5Total Transfers from the Federal Government 2,462.0 2,442.3 2,453.5Total Revenue 14,243.5 13,943.0 14,165.1Totals may not add due to rounding.

Budget 2018-19
71
GOVERNMENT OF SASKATCHEWANGlossary of Financial Terms
Accumulated (Deficit)
The amount by which expense has exceeded revenue
from the beginning of provincial incorporation
(1905), plus any adjustments that were charged
directly to the accumulated deficit. It is calculated as
the difference between total assets and liabilities.
Accumulated Surplus
The amount by which revenue has exceeded expense
from the beginning of provincial incorporation
(1905), plus any adjustments that were charged
directly to the accumulated surplus. It is calculated
as the difference between total assets and liabilities.
Amortization
The systematic process of allocating an amount to
revenue or expense over a period. Capital assets are
amortized to expense over their expected remaining
economic lives. Actuarial gains and losses, such as
those experienced by pension plans, and certain
amounts relating to financial instruments are also
amortized.
Capital Asset
An asset with physical substance that has an
economic life extending beyond one year, to be used
on a continuing basis and not for sale in the ordinary
course of operations.
Consolidation
The method used to account for government service
organizations (GSOs) in the Summary Budget.
Financial accounts of the GSOs are adjusted to the
basis of accounting described in note 1 of the
Summary Financial Statements and the adjusted
amounts are combined with amounts for other GSOs
and government partnerships. Inter-organization
balances and transactions are eliminated.
Debt
Obligations incurred through the issuance of debt
instruments. Debt does not include other liabilities
such as accounts payable or pension obligations.
Terms used to describe debt include:
• Gross Debt: borrowings through the issuance ofdebt instruments such as promissory notes anddebentures.
• Sinking Funds: funds set aside for the repaymentof debt.
• Public Debt: gross debt net of sinking funds.
• General Debt: public debt net of loans to Crowncorporations for Government Business Enterprise(GBE) specific debt.
• GBE Specific Debt:
- debt issued by GBEs; or,
- debt issued by the General Revenue Fund(GRF) specifically on behalf of a GBE wherethe government expects to realize thereceivable from the GBE and settle theexternal debt simultaneously.
• Guaranteed Debt: debt of others that thegovernment has agreed to repay if the othersdefault.

Debt Charges
Costs associated with debt, pension liabilities,
obligations under long-term financing arrangements
such as private-public partnerships (P3s) and capital
lease obligations. Debt charges include interest,
foreign exchange gains and losses, discounts, fees
and commissions.
Deficit
The amount by which expense exceeds revenue for
a fiscal period.
General Revenue Fund (GRF)
The primary operational account for the government
through which all provincial monies under the direct
authority of the Legislative Assembly are collected
and disbursed. The GRF is a GSO and is included in
the government reporting entity.
Government Business Enterprises (GBEs)
An organization that is controlled by the government,
is self-sufficient and has the financial and operating
authority to sell goods and services to individuals and
organizations outside the government reporting entity
as its principal activity. GBEs are recorded in the
Summary Budget using the modified equity method.
Government Partnership
A contractual arrangement between the government
and one or more partners outside the government
reporting entity where the partners share, on an
equitable basis, the risks and benefits of the
partnership. Government partnerships are
proportionately consolidated in the Summary Budget.
Government Reporting Entity
The set of organizations that are either controlled by
government (GSOs and GBEs) or subject to shared
control (government partnerships).
Government Service Organization (GSO)
An organization that is controlled by government,
except those designated as GBEs or government
partnerships. GSOs are consolidated in the Summary
Budget.
Modified Equity
The method used to account for GBEs in the
Summary Budget. Government’s share of GBE net
earnings or losses is included in budgeted revenue.
Government’s investment, which is originally
recorded at cost, is adjusted annually to include the
net earnings or losses and other net equity changes of
the GBE.
Net Debt
The difference between liabilities and financial assets.
Net debt represents the future revenue required to
pay for past transactions or events.
Pension Liability
An actuarial estimate of discounted future payments
to be made to retirees under government pension
plans, net of plan assets.
Budget 2018-19
72

Budget 2018-19
73
Proportionate Consolidation
The method used to account for government
partnerships in the Summary Budget. Financial
accounts of the government partnership are adjusted
to the basis of accounting described in note 1 of the
Summary Financial Statements and the government’s
proportionate share of the balances is combined with
balances for GSOs and other partnerships. Inter-
organization balances and transactions are eliminated.
Public Private Partnership (P3)
A partnership arrangement in the form of a long-term
performance-based agreement between the public
sector and the private sector to deliver public
infrastructure for citizens.
Summary Budget
Government’s main financial plan that accounts for
the full nature and extent of the planned financial
activities of all organizations in the government
reporting entity.
Surplus
The amount by which revenue exceeds expense for
a fiscal period.
For more information on Budget Basics, visit www.saskatchewan.ca/budget.