sas with excel, a winning combination, part 1: easy solutions
TRANSCRIPT

Paper 167-2010
SAS® and Excel, A Winning Combination, Part 1: Easy Solutions for Multi-Sheet Excel Workbooks, Color-Coding, Imbedded Graphs, etc.
LeRoy Bessler PhD, Bessler Consulting and Research Fox Point, Milwaukee, Wisconsin, USA, [email protected]
Abstract SAS is my personal favorite computer tool, but the world’s commonest non-SAS tool for data presentation, and working with data, is Microsoft Excel. People often want your SAS report formatted as a spreadsheet, so that they and others can post-process or reformat data however they like. This short tutorial on SAS-to-Excel solutions is for anyone who needs to deliver information via Excel from a SAS program. In regard to the popular “traffic lighting” concept, this paper will explain how to color-code data so as to address the commonest form of color blindness. The paper will reach the limits of what this author can easily do with the tools selected. For another solution for SAS-with-Excel, the reader is referred to the author’s companion paper on Dynamic Data Exchange (DDE). Please see Reference 1. Introduction Below is a list of the examples. Each output is displayed in its own section, with supporting code below it. The only explanation provided, if any, is in the comment(s) for the code. Solutions Using ODS HTML 1. Non-Customized Excel Output 2. Using ODS Style Minimal 3. Default Handling of Title (Unacceptable) 4. Using HTML Column Spanning Tag (Getting Better) 5. Title Spanning Seven Columns (The Correct Solution) 6. Conventional TITLE Statement Controls for Appearance of Text Fail with Column Spanning 7. Irrelevant Choice: Customize Text Appearance in Stretched Column 8. Customized Column-Spanning Title (the solution for a customized title in a spreadsheet from SAS) 9. Table with Footnote 10. Color-Coded Data (sometimes called “traffic lighting”) 11. PROC PRINT Font and Color Control:
Everything that you can do except for STYLE(OBS) and STYLE(OBSHEADER) 12. Table Above Graph Solutions Not Able To Use ODS HTML 13. Table at Left of Graph and Excel Sheet Name Customization
(requires MSOffice2K_x tagset, which can not support multi-sheet workbooks) 14. Multi-Sheet Workbook
(requires ExcelXP tagset, which can not support graphs)
1

Non-Customized Excel Output
ods listing close; ods noresults; * Do not open output in SAS *; goptions reset=all; * Always do this. *; ods html file="C:\SAStoXLoutput\GettingStarted.xls"; * start your reporting code here *; proc print data=sashelp.class noobs label; run; * end your reporting code here *; ods html close;
2

Using ODS Style Minimal
goptions reset=all; * Always do this. *; ods html file="C:\SAStoXLoutput\UsingODSstyleMinimal.xls" style=Minimal; proc print data=sashelp.class noobs label; run; ods html close;
3
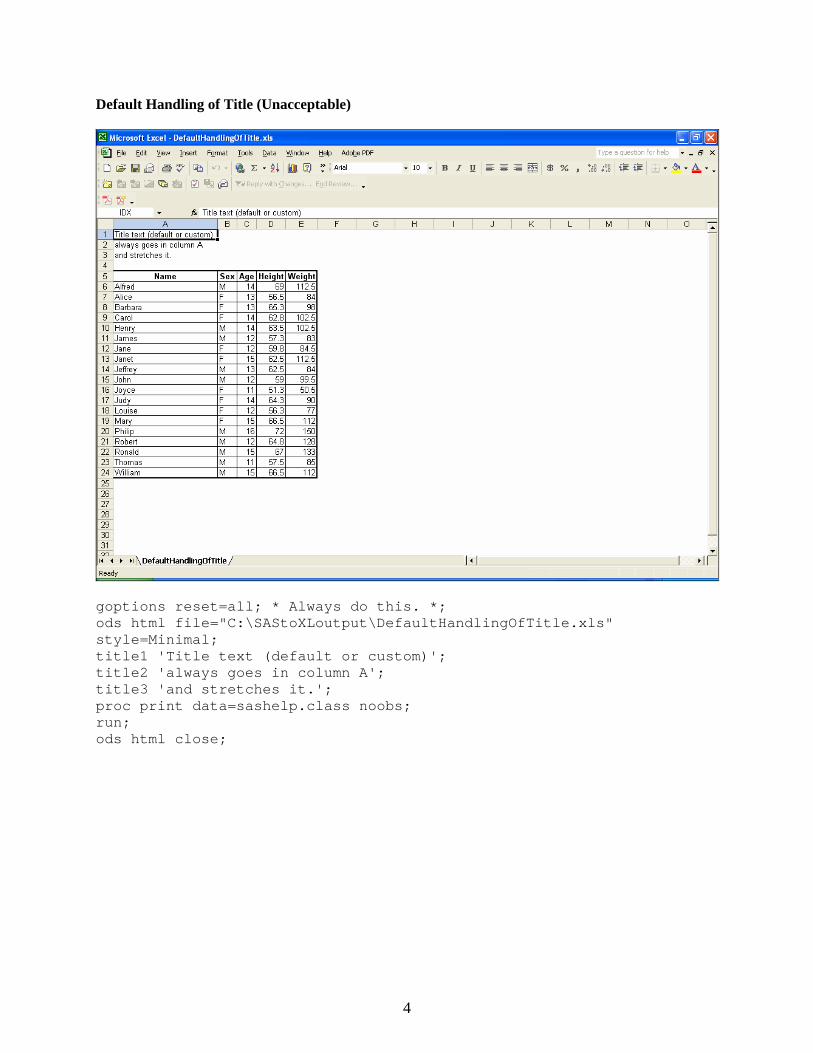
Default Handling of Title (Unacceptable)
goptions reset=all; * Always do this. *; ods html file="C:\SAStoXLoutput\DefaultHandlingOfTitle.xls" style=Minimal; title1 'Title text (default or custom)'; title2 'always goes in column A'; title3 'and stretches it.'; proc print data=sashelp.class noobs; run; ods html close;
4

Using HTML Column Spanning Tag (Getting Better)
goptions reset=all; * Always do this. *; ods html file="C:\SAStoXLoutput\TitleSpans4Columns.xls" style=Minimal; title1 '<td COLSPAN=4>Title lines using HTML tag to span four columns</td>'; title2 '<td COLSPAN=4>perversely always starts the text in Column B</td>'; title3 '<td COLSPAN=4>(JUSTIFY=LEFT would make no difference),</td>'; title4 '<td COLSPAN=4>and does stretch the four columns spanned.</td>'; proc print data=sashelp.class noobs; run; ods html close;
5

Title Spanning Seven Columns (The Correct Solution)
goptions reset=all; * Always do this. *; ods html file="C:\SAStoXLoutput\TitleSpans7Columns.xls" style=Minimal; title1 '<td COLSPAN=7>Title lines using HTML tag to span seven columns</td>'; title2 '<td COLSPAN=7>leaves the data-filled columns unstretched.</td>'; proc print data=sashelp.class noobs; run; ods html close;
6
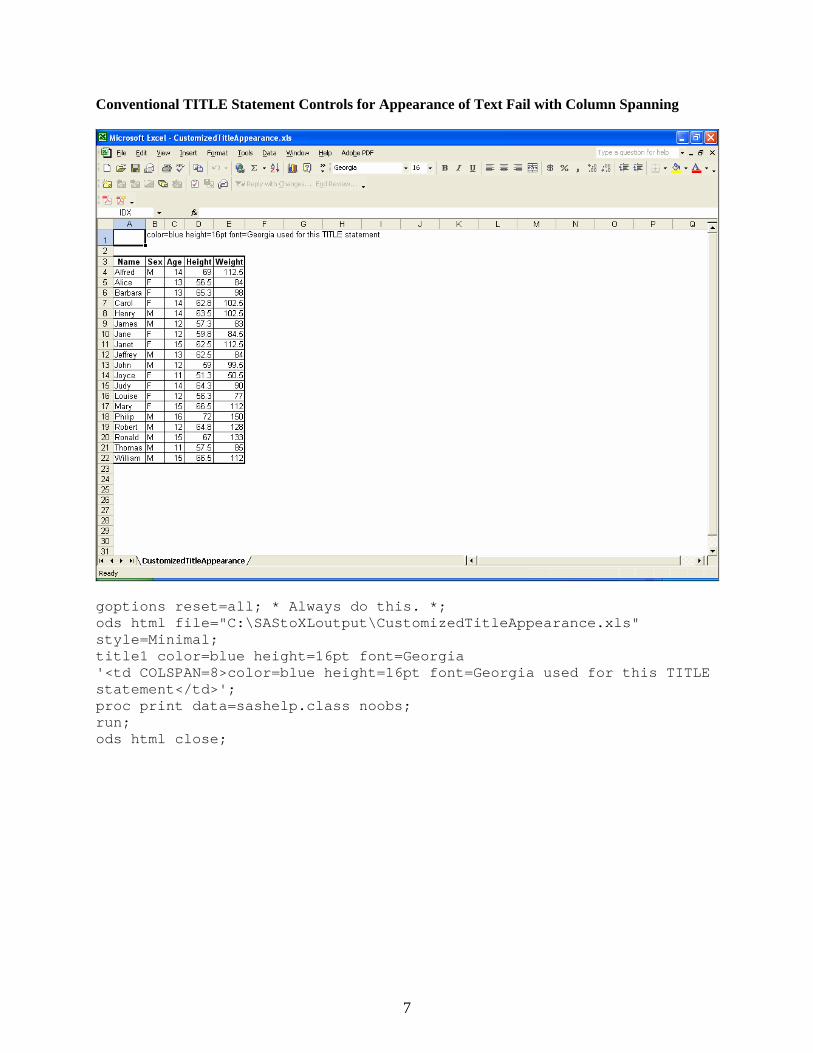
Conventional TITLE Statement Controls for Appearance of Text Fail with Column Spanning
goptions reset=all; * Always do this. *; ods html file="C:\SAStoXLoutput\CustomizedTitleAppearance.xls" style=Minimal; title1 color=blue height=16pt font=Georgia '<td COLSPAN=8>color=blue height=16pt font=Georgia used for this TITLE statement</td>'; proc print data=sashelp.class noobs; run; ods html close;
7
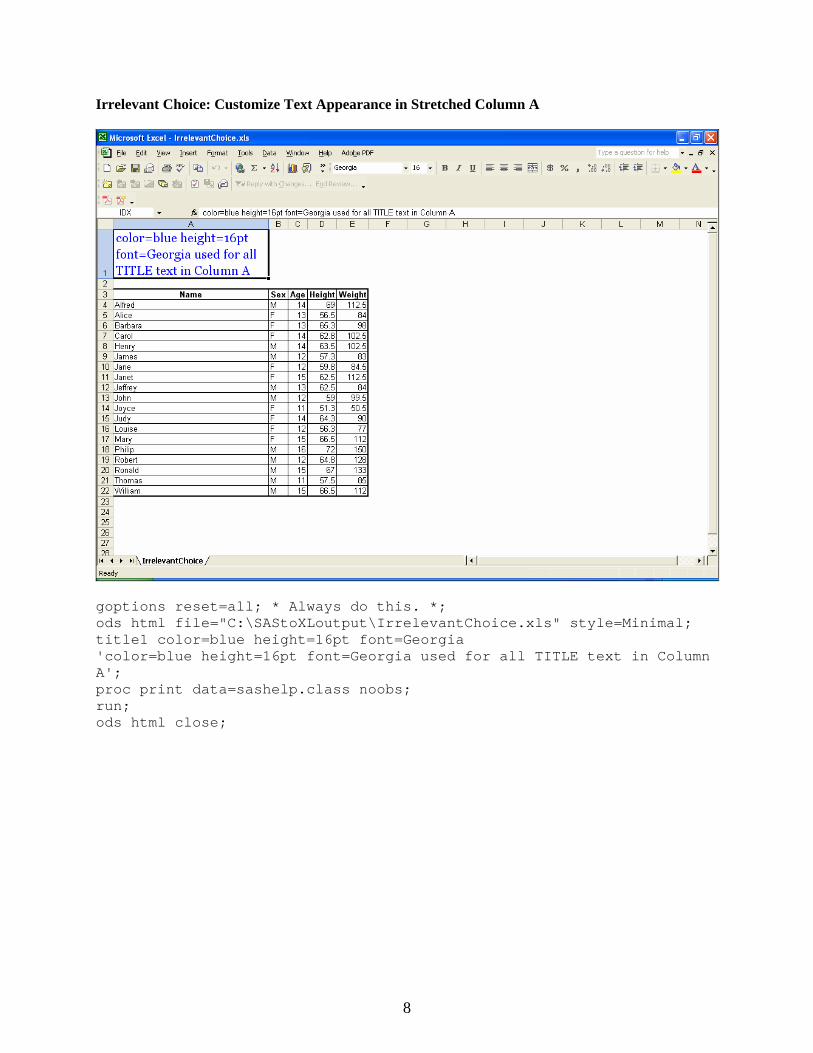
Irrelevant Choice: Customize Text Appearance in Stretched Column A
goptions reset=all; * Always do this. *; ods html file="C:\SAStoXLoutput\IrrelevantChoice.xls" style=Minimal; title1 color=blue height=16pt font=Georgia 'color=blue height=16pt font=Georgia used for all TITLE text in Column A'; proc print data=sashelp.class noobs; run; ods html close;
8
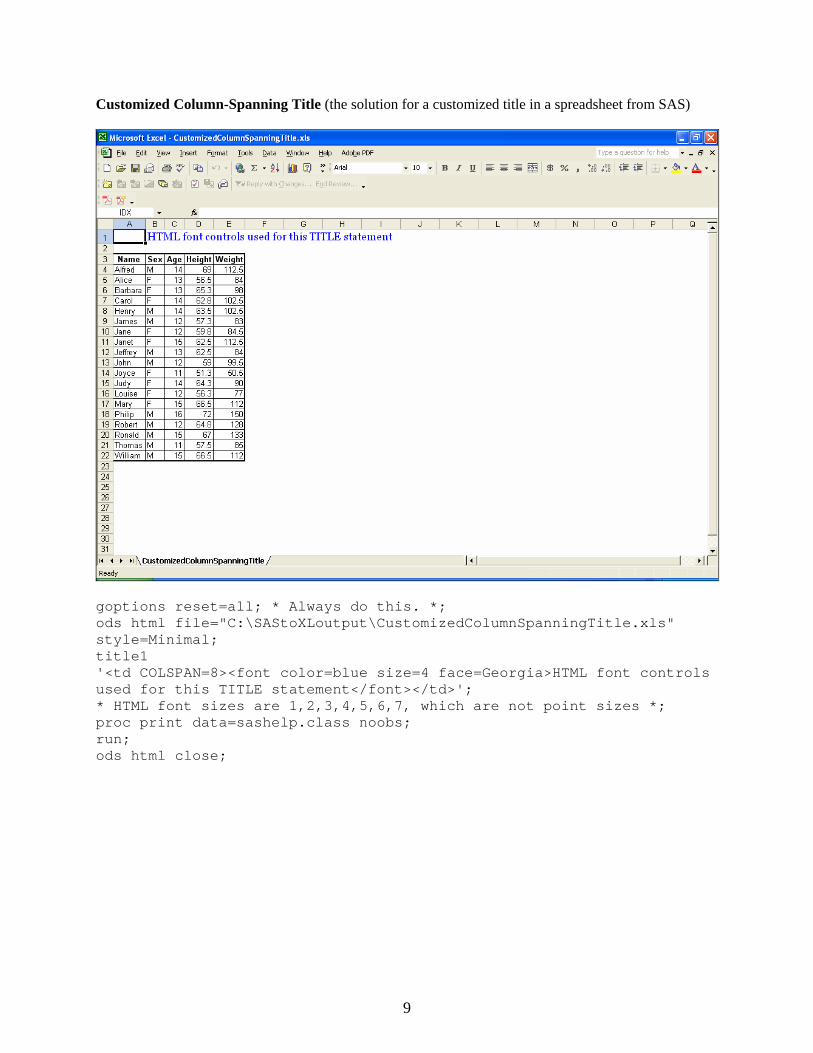
Customized Column-Spanning Title (the solution for a customized title in a spreadsheet from SAS)
goptions reset=all; * Always do this. *; ods html file="C:\SAStoXLoutput\CustomizedColumnSpanningTitle.xls" style=Minimal; title1 '<td COLSPAN=8><font color=blue size=4 face=Georgia>HTML font controls used for this TITLE statement</font></td>'; * HTML font sizes are 1,2,3,4,5,6,7, which are not point sizes *; proc print data=sashelp.class noobs; run; ods html close;
9
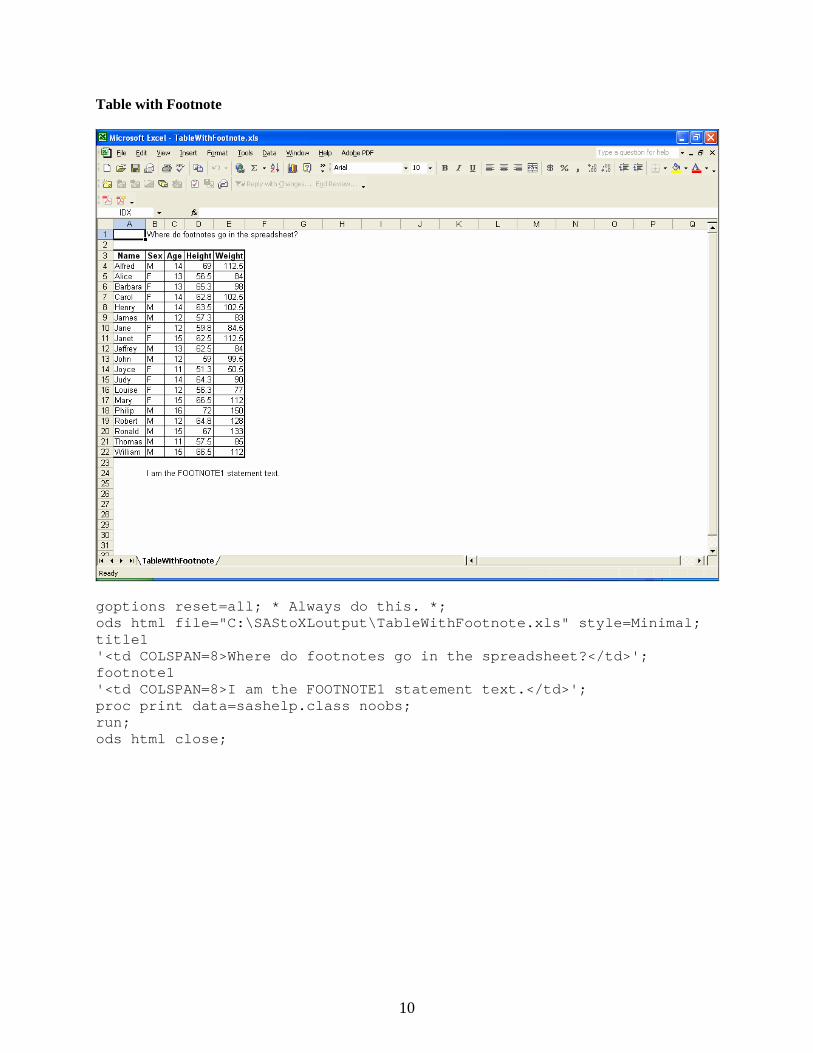
Table with Footnote
goptions reset=all; * Always do this. *; ods html file="C:\SAStoXLoutput\TableWithFootnote.xls" style=Minimal; title1 '<td COLSPAN=8>Where do footnotes go in the spreadsheet?</td>'; footnote1 '<td COLSPAN=8>I am the FOOTNOTE1 statement text.</td>'; proc print data=sashelp.class noobs; run; ods html close;
10

Color-Coded Data (sometimes called “traffic lighting”) The term “traffic lighting” in the context of data presentation refers to the use of red and green backgrounds to highlight bad and good, respectively. The problem is that the inability to distinguish red and green is the commonest form of color blindness (a condition wherein the two colors look the same). The simplest solution is to use red and blue. (Orange and green might be OK.) If using blue as a background for black text, it is important to use a light enough shade of blue. For even lighter shades of blue (and red), use AAAA or CCCC instead of 9999 in the color names below. However, on an LED monitor, the very light shades with CCCC might wash out to nearly white.
proc format lib=work; value $SexCol 'F' = 'CXFF9999' 'M' = 'CX9999FF'; run; goptions reset=all; * Always do this. *; ods html file="C:\SAStoXLoutput\ColorCodedData.xls" style=Minimal; title1 '<td COLSPAN=4>Color-Coded Data</td>'; proc print data=sashelp.class noobs; var Name; var Sex / style = [background = $SexCol.]; var Age Height Weight; run; ods html close;
11
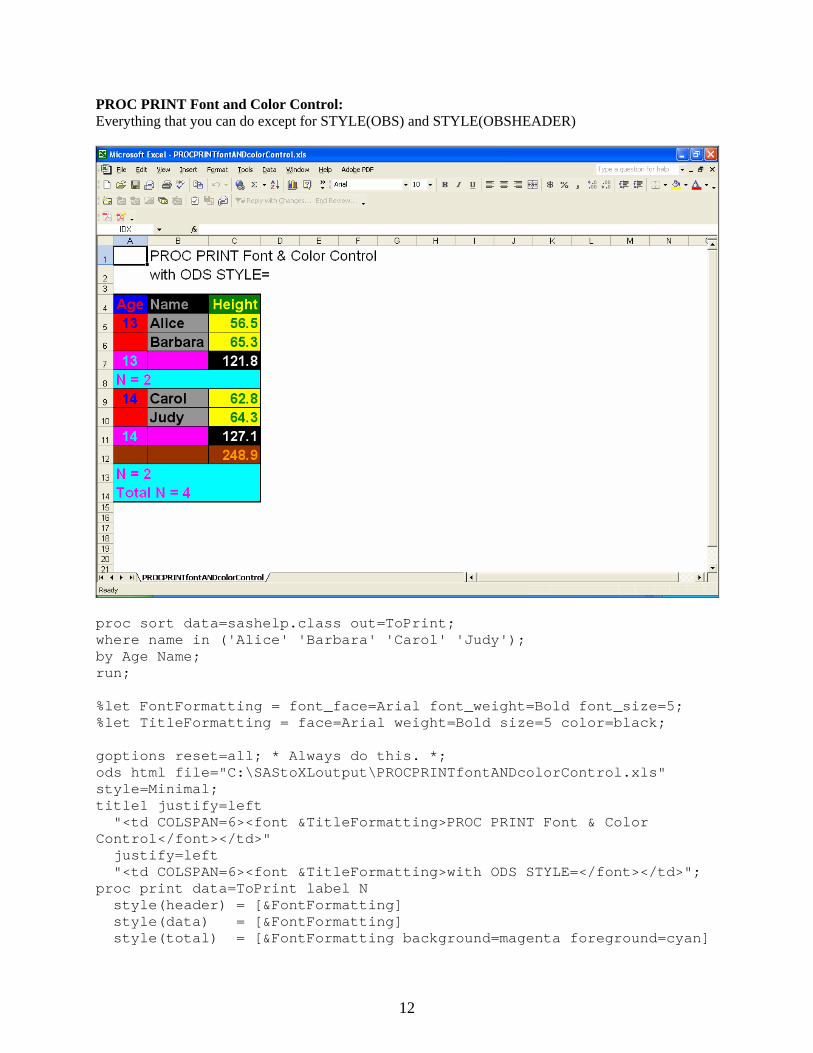
PROC PRINT Font and Color Control: Everything that you can do except for STYLE(OBS) and STYLE(OBSHEADER)
proc sort data=sashelp.class out=ToPrint; where name in ('Alice' 'Barbara' 'Carol' 'Judy'); by Age Name; run; %let FontFormatting = font_face=Arial font_weight=Bold font_size=5; %let TitleFormatting = face=Arial weight=Bold size=5 color=black; goptions reset=all; * Always do this. *; ods html file="C:\SAStoXLoutput\PROCPRINTfontANDcolorControl.xls" style=Minimal; title1 justify=left "<td COLSPAN=6><font &TitleFormatting>PROC PRINT Font & Color Control</font></td>" justify=left "<td COLSPAN=6><font &TitleFormatting>with ODS STYLE=</font></td>"; proc print data=ToPrint label N style(header) = [&FontFormatting] style(data) = [&FontFormatting] style(total) = [&FontFormatting background=magenta foreground=cyan]
12
style(bylabel)= [&FontFormatting background=magenta foreground=cyan just=center] style(grand) = [&FontFormatting background=brown foreground=orange] style(N) = [&FontFormatting background=cyan foreground=magenta just=left]; by age; id age / style(header) = [&FontFormatting background=blue foreground=red] style(data) = [&FontFormatting background=red foreground=blue]; var Name / style(header) = [background=black foreground=CX999999] style(data) = [background=CX999999 foreground=black]; var Height; sum Height / style(header) = [background=CX009900 foreground=yellow] style(data) = [background=yellow foreground=CX009900] style(total) = [&FontFormatting background=black foreground=white]; sumby age; run; ods html close;
13
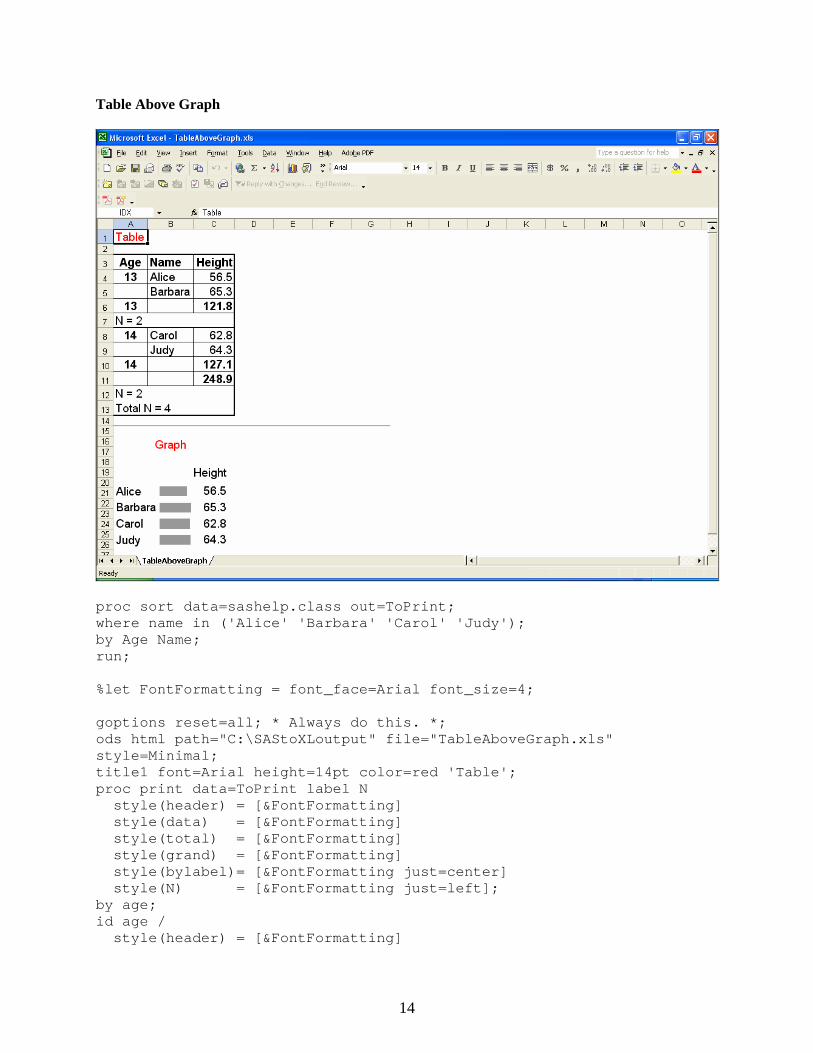
Table Above Graph
proc sort data=sashelp.class out=ToPrint; where name in ('Alice' 'Barbara' 'Carol' 'Judy'); by Age Name; run; %let FontFormatting = font_face=Arial font_size=4; goptions reset=all; * Always do this. *; ods html path="C:\SAStoXLoutput" file="TableAboveGraph.xls" style=Minimal; title1 font=Arial height=14pt color=red 'Table'; proc print data=ToPrint label N style(header) = [&FontFormatting] style(data) = [&FontFormatting] style(total) = [&FontFormatting] style(grand) = [&FontFormatting] style(bylabel)= [&FontFormatting just=center] style(N) = [&FontFormatting just=left]; by age; id age / style(header) = [&FontFormatting]
14

style(data) = [&FontFormatting]; var name height; sum height; run; proc catalog c=work.gseg kill;run;quit; goptions hsize=2in vsize=2in htext=10pct ftext='Arial' border; * goption border has no effect when imbedded in a spreadsheet *; title color=red height=2pct ' ' justify=center height=10pct 'Graph'; footnote1 angle=-90 height=2pct ' '; footnote2 angle=+90 height=1pct ' '; proc gchart data=ToPrint; pattern1 color=CX999999; axis1 label=none style=0 major=none minor=none; axis2 label=none style=0 major=none minor=none value=none; hbar name / name='Below' sumvar=height sum sumlabel='Height' maxis=axis1 raxis=axis2 width=4 space=3 coutline=same; run; quit; ods html close;
15

Table at Left of Graph and Excel Sheet Name Customization (requires MSOffice2K_x tagset, which can not support multi-sheet workbooks)
proc sort data=sashelp.class out=ToPrint; where name in ('Alice' 'Barbara' 'Carol' 'Judy'); by Age Name; run; %let FontFormatting = font_face=Arial font_size=4; goptions reset=all; * Always do this. *; ods tagsets.MSOffice2K_x path="C:\SAStoXLoutput" file="TableAtLeftOfGraph.xls" style=Minimal options(panelcols="2" sheet_name="Table At Left Of Graph" doc="help"); title1 font=Arial height=14pt color=red 'Table'; title1 font=Arial height=14pt color=red 'Table'; proc print data=ToPrint label N style(header) = [&FontFormatting] style(data) = [&FontFormatting] style(total) = [&FontFormatting] style(grand) = [&FontFormatting] style(bylabel)= [&FontFormatting just=center] style(N) = [&FontFormatting just=left];
16
by age; id age / style(header) = [&FontFormatting] style(data) = [&FontFormatting]; var name height; sum height; run; proc catalog c=work.gseg kill;run;quit; goptions hsize=2in vsize=2in htext=10pct ftext='Arial' border; * goption border has no effect when imbedded in a spreadsheet *; title color=red height=2pct ' ' justify=center height=10pct 'Graph'; footnote1 angle=-90 height=2pct ' '; footnote2 angle=+90 height=1pct ' '; proc gchart data=ToPrint; pattern1 color=CXCCCCCC; axis1 label=none style=0 major=none minor=none; axis2 label=none style=0 major=none minor=none value=none; hbar name / name='AtRight' sumvar=height sum sumlabel='Height' maxis=axis1 raxis=axis2 width=4 space=3 coutline=same; run; quit; ods _all_ close;
17
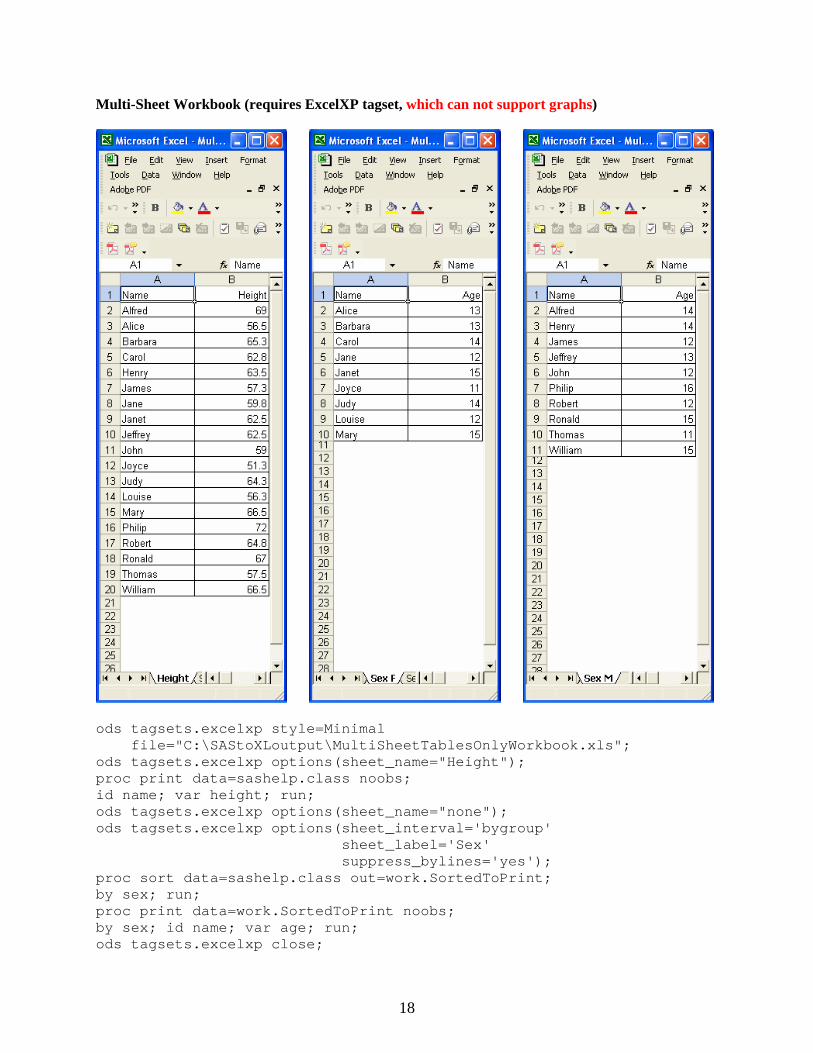
Multi-Sheet Workbook (requires ExcelXP tagset, which can not support graphs)
ods tagsets.excelxp style=Minimal file="C:\SAStoXLoutput\MultiSheetTablesOnlyWorkbook.xls"; ods tagsets.excelxp options(sheet_name="Height"); proc print data=sashelp.class noobs; id name; var height; run; ods tagsets.excelxp options(sheet_name="none"); ods tagsets.excelxp options(sheet_interval='bygroup' sheet_label='Sex' suppress_bylines='yes'); proc sort data=sashelp.class out=work.SortedToPrint; by sex; run; proc print data=work.SortedToPrint noobs; by sex; id name; var age; run; ods tagsets.excelxp close;
18

19
Conclusion The methods shown address common needs when presenting data from SAS via Excel. For other Excel formatting requirements, the author has found Dynamic Data Exchange (DDE) to be a method that is extremely powerful, and, for him, easier to use than the alternatives. See Reference 1. References (by this author) 1. LeRoy Bessler, “SAS and Excel, A Winning Combination, Part 2: Dynamic Data Exchange (DDE), a Popular Solution around the World”, Proceedings of the MidWest SAS Users Group Conference 2010, MWSUG, Inc. (USA), 2010. Acknowledgments My thanks to Chevell Parker at SAS Technical Support for advice about ODS tagset MSOffice2K_x. Author Information Your questions, comments, suggestions, and other simple SAS-to-Excel solutions are welcome. LeRoy Bessler PhD Bessler Consulting and Research, Fox Point, Milwaukee, Wisconsin, USA [email protected] A SAS user since 1978, Dr. LeRoy Bessler has shared his knowledge and experience with other users at conferences throughout the USA and in Montreal, London, Heidelberg, and Dublin. Though a SAS generalist with long experience in Base SAS, SAS macro language, and SAS tools for access to non-SAS data, his special interests include communication-effective visual communication and reporting, web information delivery, highly formatted Excel reporting, SAS/GRAPH, ODS, creation of unique tools to support the SAS BI server and its users, and Software-Intelligent Application Development for Reliability, Reusability, Extendibility, and Maintainability. He is a regular contributor to VIEWS News, the web newsletter of the VIEWS International SAS Programmer Community. SAS is a registered trademark or trademark of SAS Institute Inc. in the USA and other countries.
® indicates USA registration. Other product and brand names are trademarks or registered trademarks of their respective owners.