sas q2 2017/2018 · earnings as expected despite negative currency effect msek -320 msek -61 11,817...
TRANSCRIPT

1
SAS Q2 2017/2018
30 May 2018
EBT bef. non-recurring items
Capacity, ASK in millions
Unit cost1, SEK
PASK2, SEK
2
Earnings as expected despite negative currency effect
MSEK -61MSEK -320
11,817
0.58
0.6%
-2.5%
0.2%0.64
Q2
CHANGE
VS. Q2 FY17
Note: 1) Excluding jet fuel and currency adjusted; 2) Currency adjusted
POSITIVES
+ Total revenue up MSEK 73 vs. LY
+ Currency adjusted yield up 0.6% vs. LY
+ EB-point sale revenue increased 20% vs. LY
+ Efficiency program delivered MSEK 170
+ Cash flow from operating activities improved MSEK 414
+ 70% redemption of the preference shares completed
ISSUES
- Non-recurring items of MSEK -230 vs. LY
- Negative currency effects of MSEK 145 from weaker SEK
2
SEK/USD
3
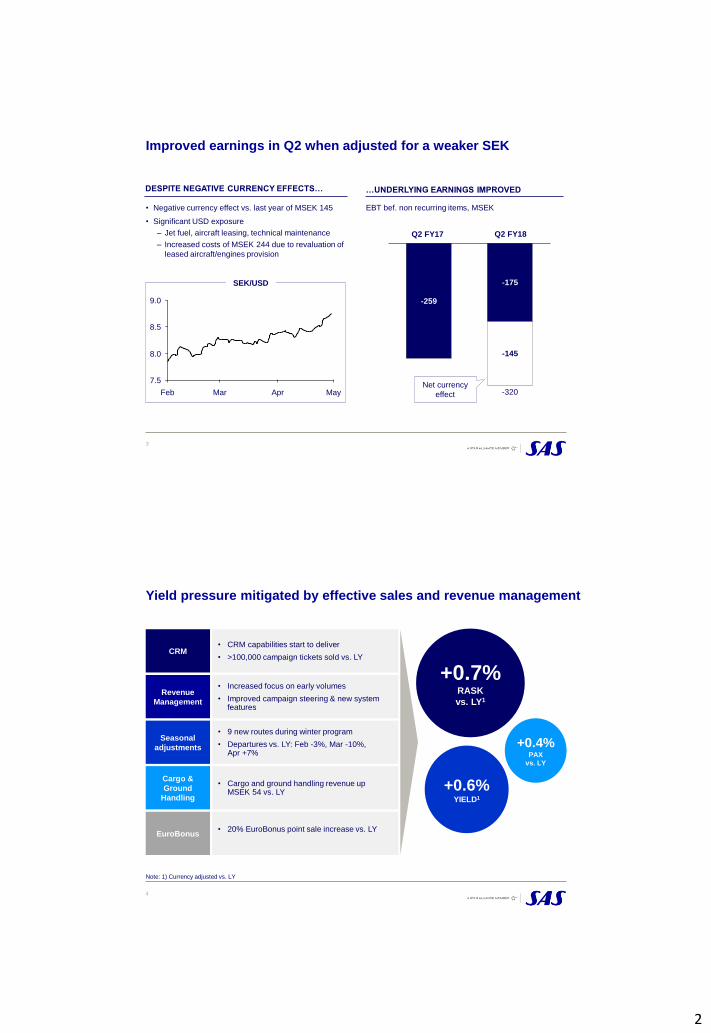
• Negative currency effect vs. last year of MSEK 145
• Significant USD exposure
– Jet fuel, aircraft leasing, technical maintenance
– Increased costs of MSEK 244 due to revaluation of
leased aircraft/engines provision
Improved earnings in Q2 when adjusted for a weaker SEK
EBT bef. non recurring items, MSEK
Q2 FY17 Q2 FY18
-259
-175
-145
-320Net currency
effect
…UNDERLYING EARNINGS IMPROVED
Mar
8.5
Feb MayApr
7.5
8.0
9.0
DESPITE NEGATIVE CURRENCY EFFECTS…
+0.7%RASK
vs. LY1
CRM• CRM capabilities start to deliver
• >100,000 campaign tickets sold vs. LY
Revenue
Management
• Increased focus on early volumes
• Improved campaign steering & new system features
Cargo &
Ground
Handling
• Cargo and ground handling revenue up MSEK 54 vs. LY
EuroBonus• 20% EuroBonus point sale increase vs. LY
Seasonal
adjustments
• 9 new routes during winter program
• Departures vs. LY: Feb -3%, Mar -10%, Apr +7%
4
Yield pressure mitigated by effective sales and revenue management
+0.6%YIELD1
+0.4%PAX
vs. LY
Note: 1) Currency adjusted vs. LY

3
5
The efficiency program is progressing according to plan
EFFICIENCY PROGRAM GROSS EARNINGS IMPACT (SEK, BN)
1,1
3,0
0,7
0,4
0,8
FY20
FY18
PLAN
FY19
FY17 FY17
RESULTS
1,1
0,3
0,8
FY18
Q2 ACTIVITIES & RESULTS
Flight operations, charges and fuel, MSEK 70
• New agreement with Swedish cabin union
• Reduced charges at CPH and Swedavia
Ground handling and technical, MSEK 50
• More efficient rosters agreed with unions
• Renegotiated line station agreements
Commercial and overhead, MSEK 50
• Commission model with agents
• Renegotiated facility agreements/services
170 MSEK
6
SAS operating platform proven to be resilient against a
challenging operating environment
Q2 CHALLENGES
SK
Regional
production
SAS
Ireland
SAS OPERATIONS OUTCOME vs. LY
Delayed aircraft deliveries
from Airbus
• 5 A320neo aircraft delayed
1-2 months
Dedicated
co-workers
Irregularities in wet lease
production
• 3% cancelled flights by
CityJet in Q2
Extreme weather
conditions
• De-icing volumes doubled
• Increased airport
restrictions
Stable
customer
satisfaction
+0.6%
scheduled
capacity growth
-2.5%
unit cost
4
7
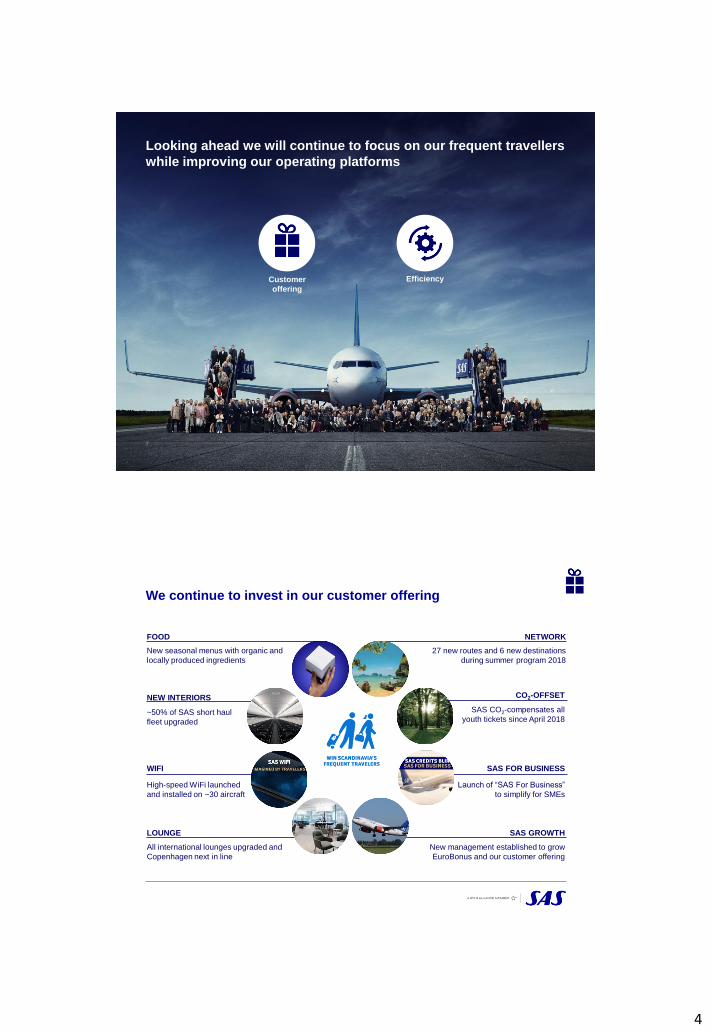
Looking ahead we will continue to focus on our frequent travellers
while improving our operating platforms
Customer
offering
Efficiency
We continue to invest in our customer offering
NEW INTERIORS
~50% of SAS short haul
fleet upgraded
SAS FOR BUSINESS
Launch of “SAS For Business”
to simplify for SMEs
WIFI
High-speed WiFi launched
and installed on ~30 aircraft
LOUNGE
All international lounges upgraded and
Copenhagen next in line
NETWORK
27 new routes and 6 new destinations
during summer program 2018
CO2-OFFSET
SAS CO2-compensates all
youth tickets since April 2018
SAS GROWTH
New management established to grow
EuroBonus and our customer offering
FOOD
New seasonal menus with organic and
locally produced ingredients

5
9
SAS orders 50 additional A320neo, paving the way for
improved customer experience and cost efficiency
MODERNIZED FLEET
• Most ordered short-haul aircraft
• Top operational economics
• Attractive financing terms
ATTRACTIVE ASSET
ENHANCED EXPERIENCE
SUSTAINABLE AIRCRAFT
• 18% lower carbon dioxide
emissions
• 50% lower NOx emissions
• 60% noise reduction
• Modern spacious cabin design
with Scandinavian touch
• Individual USB charging outlets
• Increased cabin efficiency with
retained seat comfort
A320neo
• Delivery plan of minimum
80 aircraft
• Replacement of older aircraft
and flexibility to grow
10
A single type fleet will further strengthen SAS’ competitiveness
FLEET RENEWAL PLAN EXCL. WETLEASE
20212018 2019 20202017 2022 2023
Airbus Boeing
Simplified crew and technical
maintenance planning
Harmonized and improved
customer experience
Increased robustness in traffic
execution
ADVANTAGES OF A SINGLE TYPE FLEET

6
FINANCIALS
Breakdown of the income statement – Q2
Note: * Before non-recurring items
Income statement, MSEK Feb-Apr 18 Feb-Apr 17 Change vs LY Currency
Total operating revenue 9,916 9,843 +73 +6
Payroll expenditure -2,279 -2,302 +23
Jet fuel -1,650 -1,659 +9
Government charges -972 -1,041 +69
Other operating expenditure -4,074 -3,816 -258
Total operating expenses* -8,975 -8,818 -157 -208
EBITDAR before non-recurring items 941 1,025 -84 -202
EBITDAR-margin* 9.5% 10.4% -0.9 p.u.
Leasing costs, aircraft -765 -801 +36
Depreciation -374 -388 +14
Share of income in affiliated companies -8 3 -11
EBIT before non-recurring items -206 -161 -45 -146
EBIT-margin* -2.1% -1.6% -0.5 p.u.
Financial items -114 -98 -16
EBT before non-recurring items -320 -259 -61 -145
Non-recurring items -179 51 -230
EBT -499 -208 -291 -145
12
7
13
Note: * Before non-recurring items
Non-recurring items, MSEK Feb-Apr 18 Feb-Apr 17 Change vs LY
Restructuring costs -226 0 -226
Facilities -150 0 -150
Payroll -76 0 -76
Capital gain, aircraft +47 +45 +2
Other non-recurring items 0 +6 -6
EU Commission 0 -672 +672
Slots 0 +678 -678
Total non-recurring items -179 +51 -230
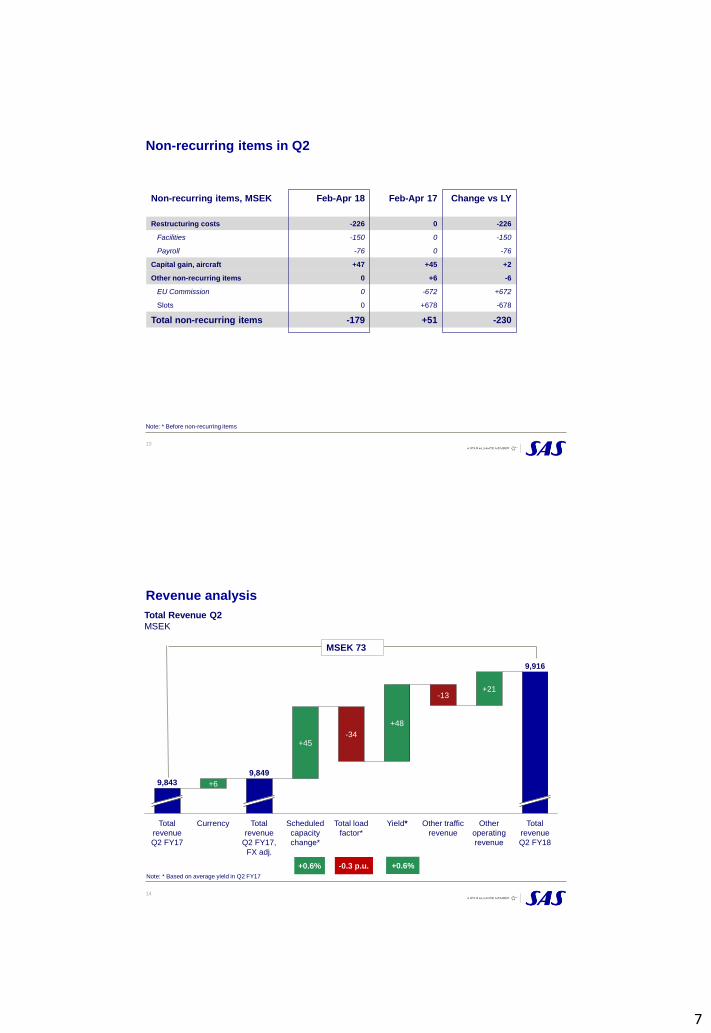
Non-recurring items in Q2
Total Revenue Q2
MSEK
14
Revenue analysis
Other
operating
revenue
-13
9,916
+21
Other traffic
revenue
Total load
factor*
+45
Total
revenue
Q2 FY17,
FX adj.
+6
Total
revenue
Q2 FY17
-34
Currency
9,843
+48
Scheduled
capacity
change*
9,849
Total
revenue
Q2 FY18
Yield*
-0.3 p.u.+0.6%
Note: * Based on average yield in Q2 FY17
+0.6%
MSEK 73
8
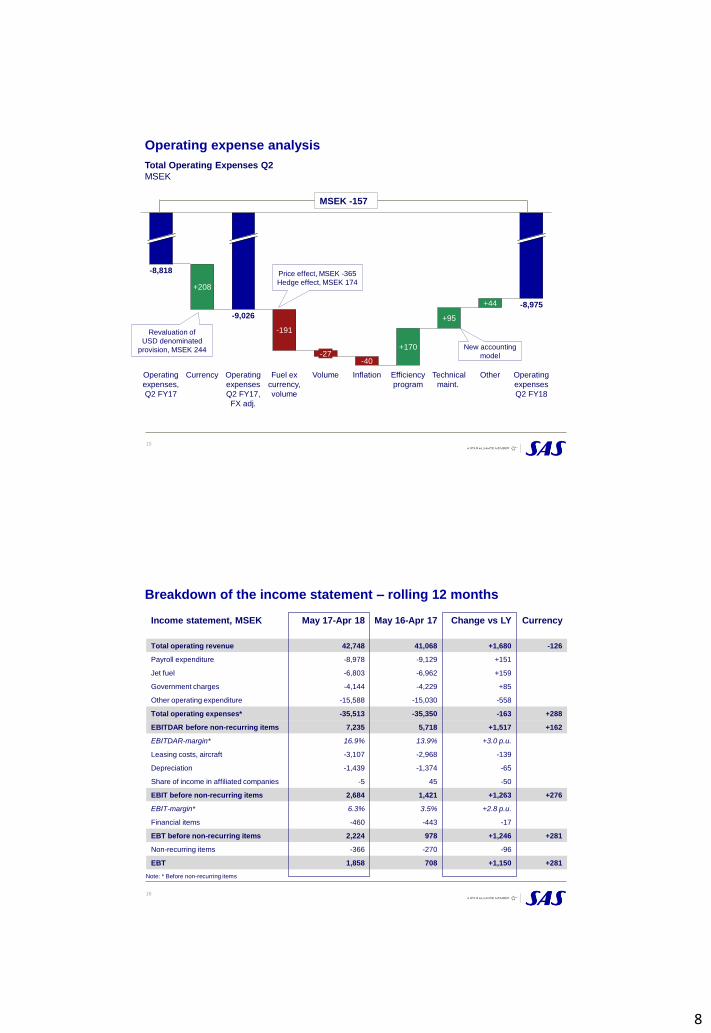
Total Operating Expenses Q2
MSEK
15
Operating expense analysis
-191
-8,975
Volume Inflation
-9,026
Currency
+170
+208
Operating
expenses,
Q2 FY17
+95
Operating
expenses
Q2 FY18
+44
Other
-40-27
Fuel ex
currency,
volume
Operating
expenses
Q2 FY17,
FX adj.
Efficiency
program
Technical
maint.
-8,818
MSEK -157
Revaluation of
USD denominated
provision, MSEK 244
Price effect, MSEK -365
Hedge effect, MSEK 174
New accounting
model
Breakdown of the income statement – rolling 12 months
Note: * Before non-recurring items
Income statement, MSEK May 17-Apr 18 May 16-Apr 17 Change vs LY Currency
Total operating revenue 42,748 41,068 +1,680 -126
Payroll expenditure -8,978 -9,129 +151
Jet fuel -6,803 -6,962 +159
Government charges -4,144 -4,229 +85
Other operating expenditure -15,588 -15,030 -558
Total operating expenses* -35,513 -35,350 -163 +288
EBITDAR before non-recurring items 7,235 5,718 +1,517 +162
EBITDAR-margin* 16.9% 13.9% +3.0 p.u.
Leasing costs, aircraft -3,107 -2,968 -139
Depreciation -1,439 -1,374 -65
Share of income in affiliated companies -5 45 -50
EBIT before non-recurring items 2,684 1,421 +1,263 +276
EBIT-margin* 6.3% 3.5% +2.8 p.u.
Financial items -460 -443 -17
EBT before non-recurring items 2,224 978 +1,246 +281
Non-recurring items -366 -270 -96
EBT 1,858 708 +1,150 +281
16
9
17
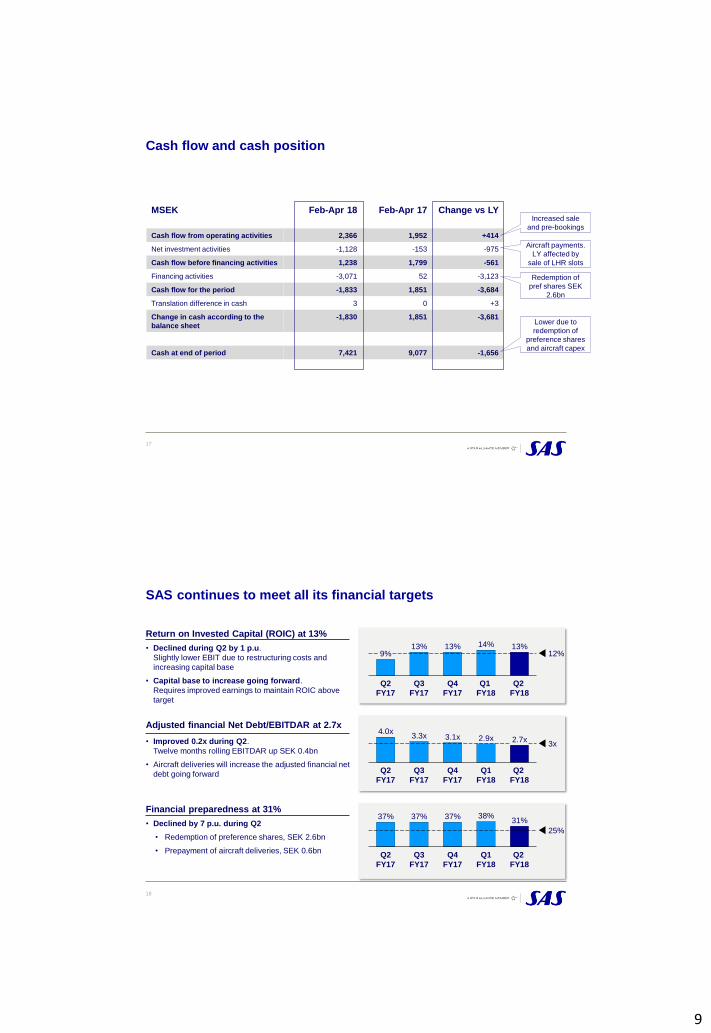
MSEK Feb-Apr 18 Feb-Apr 17 Change vs LY
Cash flow from operating activities 2,366 1,952 +414
Net investment activities -1,128 -153 -975
Cash flow before financing activities 1,238 1,799 -561
Financing activities -3,071 52 -3,123
Cash flow for the period -1,833 1,851 -3,684
Translation difference in cash 3 0 +3
Change in cash according to the
balance sheet
-1,830 1,851 -3,681
Cash at end of period 7,421 9,077 -1,656
Increased sale
and pre-bookings
Lower due to
redemption of
preference shares
and aircraft capex
Redemption of
pref shares SEK
2.6bn
Aircraft payments.
LY affected by
sale of LHR slots
Cash flow and cash position
18
SAS continues to meet all its financial targets
Q4
FY17
Q2
FY17
12%
Q3
FY17
Q1
FY18
Q2
FY18
9%13%13% 13% 14%
3x
Q1
FY18
Q2
FY17
Q2
FY18
Q4
FY17
Q3
FY17
4.0x3.3x 3.1x 2.9x 2.7x
25%
Q2
FY17
Q3
FY17
Q4
FY17
Q1
FY18
Q2
FY18
37% 37% 37% 38%31%
Financial preparedness at 31%
• Declined by 7 p.u. during Q2
• Redemption of preference shares, SEK 2.6bn
• Prepayment of aircraft deliveries, SEK 0.6bn
Adjusted financial Net Debt/EBITDAR at 2.7x
• Improved 0.2x during Q2.
Twelve months rolling EBITDAR up SEK 0.4bn
• Aircraft deliveries will increase the adjusted financial net
debt going forward
Return on Invested Capital (ROIC) at 13%
• Declined during Q2 by 1 p.u.
Slightly lower EBIT due to restructuring costs and
increasing capital base
• Capital base to increase going forward.
Requires improved earnings to maintain ROIC above
target
10
19
Debt profile and investments
Maturity profile
SEK bn
0.5
2.1
FY19 FY20FY18
1.0
1.4 1.5
FY22
0.6
FY23FY21
Unsecured loans Secured loans
Maturities in FY18-FY19
• Private placement and derivatives of SEK 0.6bn in
FY18
• Convertible bond maturing of SEK 1.6bn in FY19
Tap issue of SEK 1bn planned in June
• Increase flexibility in relation to upcoming
maturities, aircraft prepayments and general
corporate purposes
Investments and aircraft financing
• SAS finalizing financing of 10 A320neo with
deliveries until mid 2019
• First 15 A320neo from the new order of 50 aircraft
financed through operating leases
• Financing of A350 to be finalized early 2019
Aircraft orders as at 30 April 2018
1210
3
44
1517
5
FY18 FY20
1413
FY19 FY22FY21
7
FY23
Airbus A320neo Airbus A330/A350
1
20
Maintained outlook for FY18
Note: The outlook is based on no unexpected events occurring 1) Including SAS hedges.
SAS expects to
deliver income
before tax and
nonrecurring
items in the
interval of SEK
1.5–2.0 billion
EXTERNAL
Operating environment
• Aviation industry undergoes significant change
• Geo-political uncertainty
• Volatile USD and jet fuel prices
• Continued stable macro and demand trend
INTERNAL
Main assumptions
• ASK (scheduled) +1-3% vs. LY
• Gross investments of SEK ~7bn (SEK ~6bn in Q1)
• Fuel 580 USD/MT1
• FX rate 8.3 SEK/USD1 (SEK/USD 8.0 in Q1)
• Efficiency program: SEK 0.7 bn
YTD
PERFORMANCE
EBT before nonrecurring items, Q1-Q2
• Improved MSEK 273 vs. LY

11
22
SAS has undergone a significant transformation and
now creates value
31%
FINANCIAL
PREPAREDNESS
2.7x
FINANCIAL NET
DEBT/EBITDAR
13%
ROIC
30m
FY17
25m # PAX, SK
FY12
272 183 ROUTES
SERVED, SK
10,32414,903# FTEs
38A/C TYPES
9.68.2A/C BLOCK
HOURS/DAY, SK
>5m<3m # EUROBONUS
MEMBERS
433940
38
4242
0
5
10
15
20
25
30
35
40
45
-2%
-1%
0%
1%
2%
3%
4%
5%
6%
FY15FY14FY12 FY17FY13 FY16
REVENUE AND EBT MARGIN (SEK bn)
158184AIRCRAFT
FINANCIAL TARGETS / ACTUAL
ACTUAL (LTM 30-Apr-18)
TARGET <3x>25% >12%

12
Typical low cost carrier strategy
23
SAS strategy is to focus on Scandinavia’s frequent travelers
Strategy of SAS
• Multimarket focus, general low yield,
especially leisure
Market • Focus on Scandinavia’s frequent
travelers
• One type fleet, operate traffic flows
that fit fleet
• Fleet designed to fit best network and
schedule for customers
Growth • New destinations, anywhere • Improve offer for primary customer base
to increase loyalty
Operational
platform
24
SAS is implementing efficiency measures of SEK 3bn with full
effect in FY20
FY18
0.8
FY17
0.7
FY20 Total
effect
FY19
1.1
0.4
3.0
Gross earnings impact,
SEK bn• Increased use of cabin crew resource pool
• Increase flexibility in flight deck scheduling
• Optimize long-haul manning and address
demographic cost
• Increased use of lean processes
• Improve IT contracts and license mgmt
• Transform IT (e.g. cloud migration,
infrastructure consolidation)
EXAMPLES OF INITIATIVESFOCUS AREA
Flight ops,
wet lease,
charges & fuel
• Increase work task flexibility in Ground
• Increased ambition on external spend
• Full roll out of lean within Tech
• Minimize a/c phase out maintenance cost
Ground
handling &
Technical
maintenance
Admin
& IT
Product, sales
and distribution
• Differentiate product offering
• Reduce distribution and wholesale card costs
• Reduce logistic costs for onboard catering
• Reduce back-office and call centre
expenditure

13
25
Status of the efficiency program, April 30, 2018
• Increase use of resource pool
• Increase flexibility in flight deck scheduling
• Align manning on long-haul and address
demographic cost
• Increased use of lean processes and system
improvements
• Improve IT contracts and license management
• Transform IT (e.g. cloud migration, infrastructure)
EXAMPLES OF IMPLEMENTED INITIATIVESFOCUS AREA
Flight ops,
wet lease,
charges & fuel
EST.
POTENTIAL
SEK
~0.5bn
SEK
~0.9bn
SEK
~1.2bn
• Increase work task flexibility and mobility
• Increased ambition on external spend
• Full role out of lean within Tech
• Minimize aircraft phase out maintenance cost
Ground
handling &
Technical
maintenance
Admin
& IT
Product, sales
and distribution
• Differentiate product offering to increase
individualization
• Reduce distribution and wholesale card costs
• Reduce logistic costs for onboard catering
• Reduce back-office and call centre expenditure
SEK
~0.4bn
1
ACHIEVED
SEK ~0.16bn
SEK ~0.38bn
SEK~0.46bn
SEK ~0.12bn
26

14
SAS fleet – April 2018
27
Aircraft in traffic under SK
traffic license
Age Owned Leased Total Firm
order
Lease
order
Airbus A330/A340/A350 12.9 10 6 16 9
Airbus A321/A320/A319 8.8 10 25 35 47 15
Boeing 737 NG 14.4 27 40 67
Total 12.6 47 71 118 56 15
Aircraft in service with a
different license than SAS
Age Owned Wet
leased
Total Wet- lease
order
Bombardier CRJ-900 1.2 22 22
Bombardier CRJ1000 2.0 2 2
ATR-72 3.1 9 9
Airbus A320neo 0.3 6 6
Total 1.5 39 39
Total aircraft in traffic Age Owned Wet
leased
Total Firm
order
Wet- lease
order
Total 9.8 47 110 157 56 15
SAS is investing in modernization and simplification of the fleet
Current fleet in traffic,
30 April 2018
62
New orders
9
Firm order aircraft deliveries as at 30 April 2018
28
9
Bombardier CRJ (wet lease)
16
41
Airbus A330/A340
24
67
Airbus A320 family
Boeing 737 NG
ATR-72 (wet lease)
5
4 4
1715
1210
3
FY18 FY22
1
FY19
13
FY20 FY23
14
FY21
7
Airbus A330/A350Airbus A320neo

15
Productivity development
29
30

16
Yield and PASK development vs. last year
31
Quarterly yield development
32
17
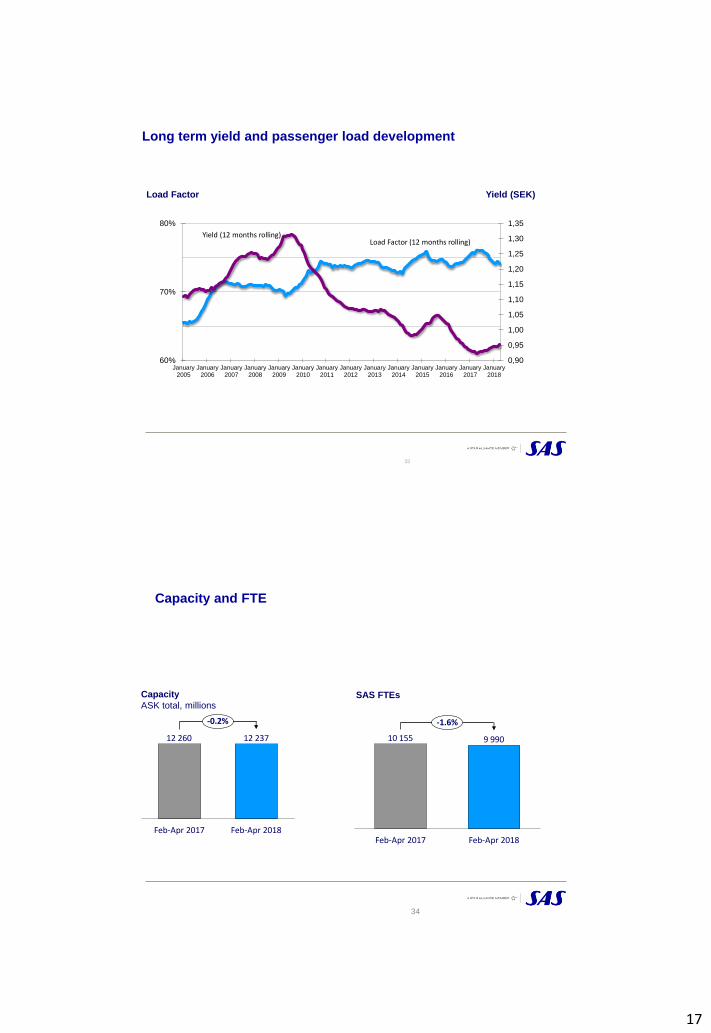
Long term yield and passenger load development
0,90
0,95
1,00
1,05
1,10
1,15
1,20
1,25
1,30
1,35
60%
70%
80%
January2005
January2006
January2007
January2008
January2009
January2010
January2011
January2012
January2013
January2014
January2015
January2016
January2017
January2018
33
Yield (SEK)Load Factor
Load Factor (12 months rolling)Yield (12 months rolling)
Capacity and FTE
34
Capacity
ASK total, millionsSAS FTEs
12 23712 260
-0.2%
Feb-Apr 2017 Feb-Apr 2018
9 99010 155
Feb-Apr 2018Feb-Apr 2017
-1.6%

18
Quarterly unit cost development
35
Breakdown of unit cost, Nov 2017 – Apr 2018
SAS, SEK, currency adjusted
36

19
Breakdown of unit cost, Feb 2018 – Apr 2018
SAS, SEK, currency adjusted
37
Summary of key drivers
SAS
Q4
2016/17
+5.5%
+1.7%
0.0%
+4.5%
-2.8p.u.
Q1
2017/18
-5.7%
-4.5p.u.
+6.8%
0.0%
-0.9%
Q2
2017/18
+0.2%
-0.3 p.u.
+0.6%
+0.2%
-2.5%
Q3
2016/17
+6.9%
-0.6 p.u.
-0.5%
-1.3%
-5.9%
20
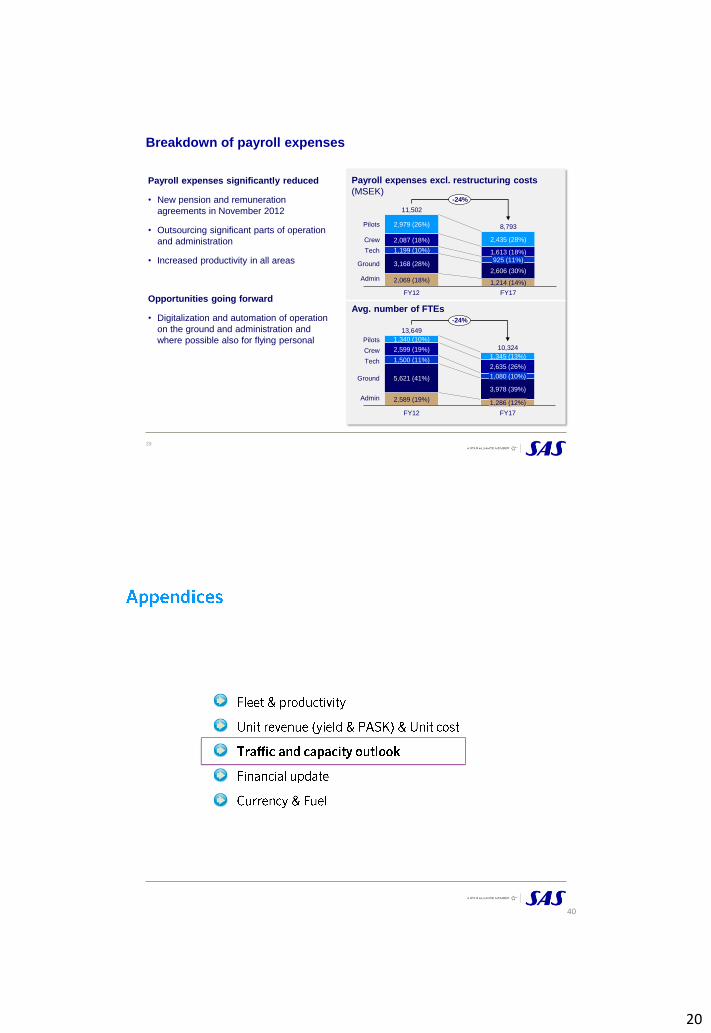
Breakdown of payroll expenses
Payroll expenses excl. restructuring costs
(MSEK)Payroll expenses significantly reduced
• New pension and remuneration
agreements in November 2012
• Outsourcing significant parts of operation
and administration
• Increased productivity in all areas
Opportunities going forward
• Digitalization and automation of operation
on the ground and administration and
where possible also for flying personal
39
1,613 (18%)
Pilots
1,199 (10%)
2,979 (26%)
2,087 (18%) 2,435 (28%)
3,168 (28%)
2,069 (18%)
925 (11%)
FY12
2,606 (30%)
1,214 (14%)
Crew
FY17
Tech
Ground
Admin
11,502
8,793
-24%
Avg. number of FTEs
2,589 (19%)
FY12
5,621 (41%)
1,340 (10%)
2,599 (19%)
1,500 (11%)2,635 (26%)
1,345 (13%)
1,080 (10%)
3,978 (39%)
1,286 (12%)
FY17
Pilots
Crew
Tech
Admin
Ground
13,649
10,324
-24%
40

21
41
SAS geographical traffic development in Q2 FY18
Total scheduled traffic
RPK +0.2%
ASK +0.6%
Passengers +0.4%
PASK +0.2%
Intercontinental routes
RPK -2.2%
ASK -2.8%
Europe/Intrascand
RPK +2.1%
ASK +3.2%
Domestic
RPK +0.3%
ASK +1.2%
Scheduled passenger, 12 months rolling
(Million)
22
23
24
25
26
27
28
29
jan
-12
mar-
12
may-1
2ju
l-12
se
p-1
2n
ov-1
2ja
n-1
3m
ar-
13
may-1
3ju
l-13
jul-
15
13-s
ep
13-n
ov
jan
-14
mar-
14
may-1
41
4-j
ul
14-s
ep
Nov-1
4Ja
n-1
5M
ar-
15
May-1
5Ju
ly-1
5S
ep
-15
Nov-1
5Ja
n-1
6M
ar-
16
May-1
6Ju
l-1
6S
ep
-16
Nov-1
6Ja
n-1
7M
ar-
17
May-1
7Ju
l-1
7S
ep
-17
Nov-1
7Ja
n-1
8M
ar-
18
Mill
ion
s
SAS passenger development
22
43
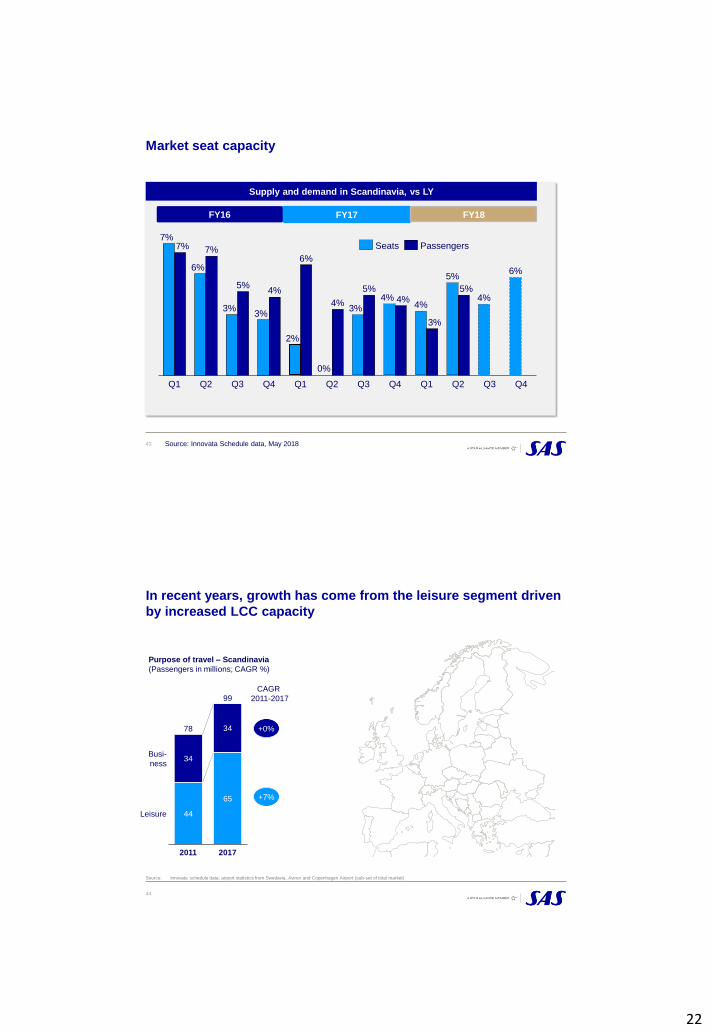
Market seat capacity
Supply and demand in Scandinavia, vs LY
FY17FY16
Q2
6%
Q3Q2 Q3 Q4
3%
7%
Q4 Q1 Q2
3%
7%
Q3Q4
7%
6%
5%
3%
4%
2%
0%
5%
Q1
3%
5%4% 4%4%
4%5%
Q1
6%
4%
Seats Passengers
Source: Innovata Schedule data, May 2018
FY18
44
In recent years, growth has come from the leisure segment driven
by increased LCC capacity
Purpose of travel – Scandinavia
(Passengers in millions; CAGR %)
44
65
34
34
2017
99
2011
Busi-
ness
Leisure
78
Source: Innovata schedule data; airport statistics from Swedavia, Avinor and Copenhagen Airport (sub-set of total market)
+0%
+7%
CAGR
2011-2017
23
ASK outlook for 2017/2018
45
ASK outlook for November 2017 – October 2018
46

24
Financial targets
To reach this, SAS pursues three strategic priorities to meet trends and
industry developments, ensure competitiveness and create the
prerequisites for long-term sustainable profitability.
48
SAS financial targets increase focus on the capital structure
Return on Invested Capital (ROIC)
• EBIT + 1/3 of aircraft leasing costs / Equity +
financial net debt + capitalized aircraft leasing
costs (x7)
• Consistent with an external and internal view
of SAS’s pre-tax WACC
• Target: >12% over a cycle
Apr 2018
EBIT (12 months) 2,318
+ 1/3 share of operating lease
costs
1,012
Adjusted EBIT 3,330
Equity 7,125
Financial net debt -2,567
Capitalized aircraft leasing costs 21,045
Invested Capital 25,603
ROIC 13.0%
Apr 2018
Financial net debt -2,567
Capitalized aircraft leasing costs 21,045
Adjusted financial net debt 18,478
EBITDAR 6,742
Adjusted financial net
debt/EBITDAR
2.7
>12%
<3x
>25%
Financial preparedness
• Cash & unutilized credit facilities / Annual
fixed cost
• Target: Above 25%
Adjusted financial net debt/EBITDAR
• Financial net debt incl. capitalized aircraft
leasing costs / EBITDAR
• Core ratio for credit rating
• Target: Below 3x
TARGET

25
49
Balance sheet
ASSETS (MSEK) LIABILITIES & EQUITY (MSEK)
Apr-18
Cash and cash
equivalents7 421
4 135
Other assets
Intangible fixed assets
8 755
Receivables
Aircraft & spare parts
1 564
11 345
33 220Change vs.
Jan 2018
+483
+11
+433
+1,006
-1,830Equity
Presold tickets
Other liabilities
Interest bearing
liabilities
6 003
8 376
10 567
8 274
33 220
Apr-18
Change vs.
Jan 2018
+40
+576
+2,508
-3,021
Overview of credit facilities – April 2018
50
26
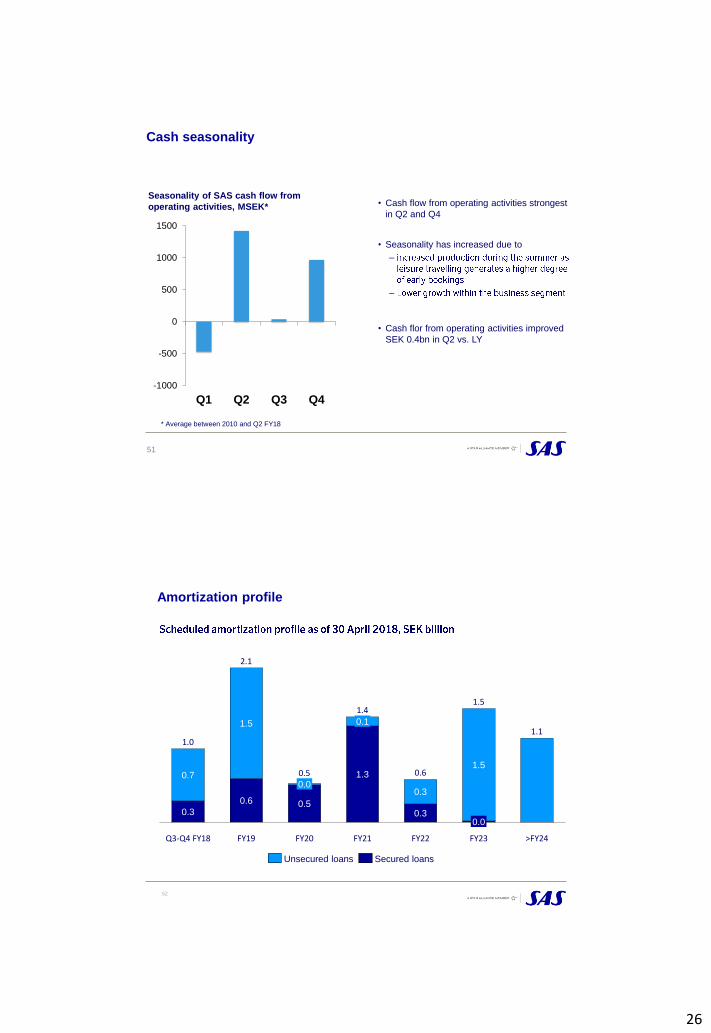
Cash seasonality
Seasonality of SAS cash flow from
operating activities, MSEK* • Cash flow from operating activities strongest
in Q2 and Q4
• Seasonality has increased due to
–
–
• Cash flor from operating activities improved
SEK 0.4bn in Q2 vs. LY
-1000
-500
0
500
1000
1500
Q1 Q2 Q3 Q4
51
* Average between 2010 and Q2 FY18
Amortization profile
1.5
0.0
1.4
1.3
0.1
1.5
FY20 FY22
0.6
0.3
0.5
0.3
FY21 >FY24
1.1
FY23
0.5
0.7
0.3
FY19
2.1
1.5
0.6
0.0
1.0
Q3-Q4 FY18
Unsecured loans Secured loans
52

27
Gearing ratios
-150%
-50%
50%
150%
250%
350%
450%
dec-98 dec-02 dec-03 dec-04 dec 06-dec 07-dec 01-dec 09-dec 10-dec dec-11 Oct-12 Oct-13 Oct-14 Oct-15 Oct-16 Oct-17
Fin Net Debt / Equity
Equity / Total Assets
Fin. Net Debt + 7*Op lease / Equity
53
SAS GroupFinancial Net November- April
54
28
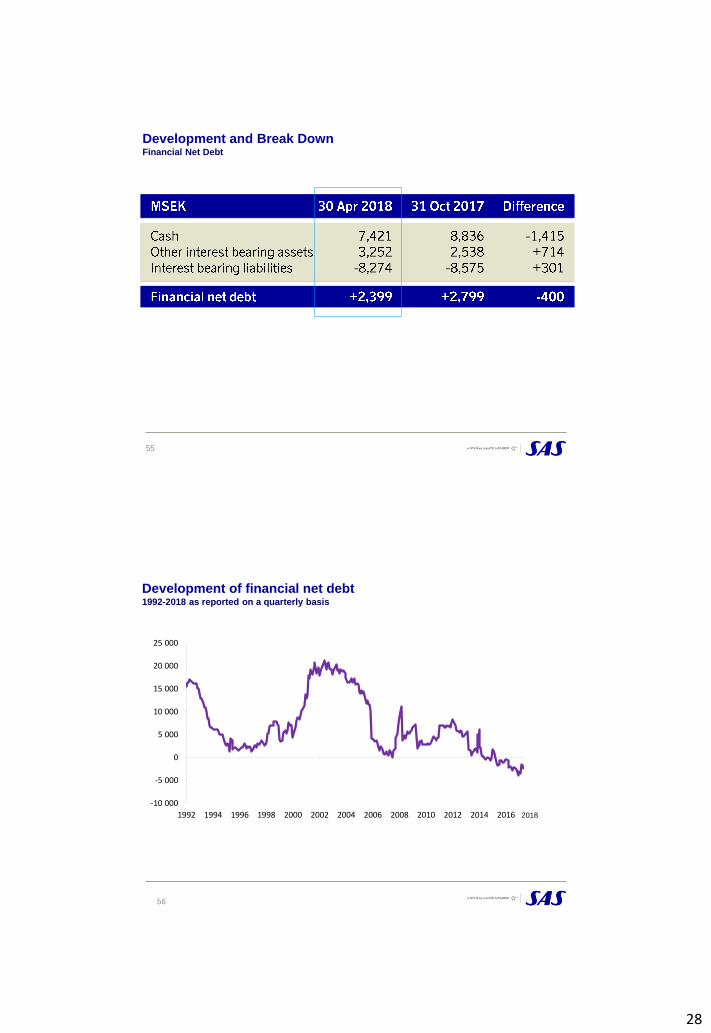
Development and Break Down Financial Net Debt
55
-10 000
-5 000
0
5 000
10 000
15 000
20 000
25 000
1992 1994 1996 1998 2000 2002 2004 2006 2008 2010 2012 2014 2016
Development of financial net debt 1992-2018 as reported on a quarterly basis
56
2018

29
Equity / Assets Ratio1993-2018 as report on a quarterly basis
57
20180%
5%
10%
15%
20%
25%
30%
35%
40%
45%
50%
1994 1996 1998 2000 2002 2004 2006 2008 2010 2012 2014 2016 2018
Financial Net Debt / Equity1993-2018 as reported on a quarterly basis
58
-0,5
-0,3
0,0
0,3
0,5
0,8
1,0
1,3
1,5
1,8
2,0
2,3
1993 1995 1997 1999 2001 2003 2005 2007 2009 2011 2013 2015 2017
30
Fleet & productivity
Unit revenue (yield & PASK) & Unit cost
Traffic & capacity outlook
Financial update
Currency & Fuel
59
Breakdown of currency effects SAS Group
-
Total revenues & costs currency effects
USDDKKNOKEURAsian currenciesAll otherTotal
20172018Difference
20172018Difference
20172018Difference
Total revenues & costs
Forward cover costs
Working capital
Financial items
Total currency effects
Nov 2017-Apr 2018 vs LY
453– 8
– 81– 8
– 29– 5
322
143– 3
– 146
58– 63– 121
914
5
60
60
Feb-Apr 2018 vs LY
234– 5
– 19– 6– 9
2197
57– 84– 141
– 10– 212– 202
781
– 145
31
Currency effects MSEK on SAS Group 2017/2018 vs 2016/2017
Changes in currency exchange rates affected the result by MSEK 60 in Nov 2017-Apr 2018 vs Nov 2016-Apr 2017
61
Negative impact on revenue dueto the weaker NOK and USD.
Positive impact on other operating costs due to the weaker NOK and USD.
Nov 17-Apr 18
– 219
541
– 267
55
5
60
Total revenue
Total costs
Forward cover costs &working capital
Income beforedepreciation
Financial items
Income before tax
Feb-Apr 18
6
191
– 343
– 146
1
– 145
SAS currency distribution
- Nov 2016 – Oct 2017
Revenue Expenses
62
30%
14%
27%
8%
11%
6%
USD
DKK
SEK
Other
3%
NOK
GBP
EUR
22%
15%
15%
36%
9%
2%
USD
SEK
NOK
DKK
GBP
EUR1%
Other

32
+174
Price OtherQ2 FY17 Currency Curr. adj.
Q2 FY17
+43
Volume Hedging &
time value
+16
Q2 FY18
-1,650-365-1,659
-1,518
+141
63
Jet fuel costs decreased MSEK 9 in Q2
Fuel cost Q2
MSEK
2018: +226
2017: +52
USD 590-630/MT 83% 91% - -
Jet fuel and currencies
Jet fuel cost sensitivity FY18, SEK bn*
* Based on hedge position as at 30 April 2018
Currency hedges*
• 63% of USD hedged next twelve months
• 70% of NOK hedged next twelve months
• Policy to hedge 40-80% of expected consumption
next 12 months and up to 50% for the next 12-18
months
• Hedge position as at 30 April 2018
– 47% of jet fuel hedged next twelve months
– Average jet fuel hedge level in FY18 at USD
580/MT
Currency
• Policy to hedge 40-80% of expected currency
deficit/surplus next 12 months
64
Max jet fuel price Q1 FY19Q3 FY18 Q4 FY18 Q2 FY19
Average spot
price8.0 SEK/USD 9.0 SEK/USD
USD 600/MT 7.3 7.8
USD 700/MT 7.4 7.9
USD 800/MT 7.5 8.0
Jet fuel
* Based on actual jet fuel costs during Q1-Q2 FY18 and hedge
position as at 30 April 2018