sas enterprise miner - pinnacle solutions, inc. · pdf filethis produces quality data mining...
TRANSCRIPT
What does SAS® Enterprise Miner™ do?It streamlines the data mining process so you can create accurate predictive and descrip-
tive analytical models using vast amounts of data. Our customers use this software to de-
tect fraud, minimize risk, anticipate resource demands, reduce asset downtime, increase
response rates for marketing campaigns, curb customer attrition and more.
Why is SAS® Enterprise Miner™ important?It ofers state-of-the-art predictive analytics and data mining capabilities that enable
organizations to analyze complex data, ind useful insights and act conidently to make
fact-based decisions.
For whom is SAS® Enterprise Miner™ designed?It’s designed for those who need to analyze increasing volumes of data to identify and
solve critical business or research issues – and help others make well-informed decisions.
This includes data miners, statisticians, marketing analysts, database marketers, risk analysts,
fraud investigators, engineers, scientists and business analysts.
SAS® Enterprise Miner™ Create highly accurate analytical models that enable you to predict with confidence
FACT SHEET
Turning increasing volumes of data into
useful information is a challenge for most
organizations. Relationships and answers
that identify key opportunities lie buried
somewhere in all of that data.
• Which customers will purchase what
products and when?
• Which customers are leaving and what
can be done to retain them?
• How should insurance rates be set to
ensure proitability?
• How can you predict failures, reduce
unnecessary maintenance and increase
uptime to optimize asset performance?
To get answers to complex questions and
gain an edge in today’s competitive
market, you need powerful advanced
analytic solutions. Discovering previously
unknown patterns can help decision
makers across your enterprise create
efective strategies. Those who choose to
implement SAS® data mining into their
business processes will be able to stay
competitive and achieve success in
today’s fast-moving markets.
Benefits• Understand key relationships and
develop models intuitively and quickly.
The GUI makes it easy for analytic profes-
sionals to interact with information at any
point in the modeling cycle. Both analyt-
ical professionals and business analysts
use a common, easy-to-interpret visual
view of the data mining process and can
collaborate to solve tough challenges.
• Build better models more eiciently with
a versatile data mining workbench. An
interactive self-documenting process
low diagram environment shortens
model development time. It eiciently
maps the data mining process to produce
the best possible results.
• Easily derive insights in a self-suicient
and automated manner. The SAS Rapid
Predictive Modeler enables business
analysts and subject-matter experts with
limited statistical skills to automatically
generate models and act on them
quickly. Analytic results are provided in
easy-to-understand charts for improved
decision making.
• Ensure the right decisions are made and
best actions are taken. Better-performing
models enhance the stability and accuracy
of predictions, which can be veriied easily
by visual model assessment and validation
metrics. Model proiling provided an
understanding of how predictor variables
contribute to outcomes.
• Ease model deployment and scoring
processes for faster results. SAS® Enterprise
Miner™ automates the tedious process of
scoring new data and provides complete
scoring code for all stages of model devel-
opment. The scoring code can be
deployed in a variety of real-time or batch
environments. This saves time and helps
you achieve accurate results so you can
make decisions that result in the most value.
• Combine the power of SAS 9 and SAS Viya
(our new advanced, distributed in-memory
architecture). Submit and execute SAS Viya
code from within SAS Enterprise Miner for
extremely fast responses to the largest ,
most complex analytics problems. Then,
compare SAS 9 and SAS Viya algorithms to
determine the best method and create the
most accurate predictions possible.
Product Overview Everyone can beneit from incorporating
analytics in a secure and scalable manner.
But this requires collaboration across the
organization and calls for a powerful,
multipurpose data mining solution that
can be tailored to meet diferent needs.
While one analytical approach may work
ine on one data collection, it may not
perform well with new data sources or be
able to answer new business questions.
This makes it crucial to have a wide selec-
tion of analysis tools at hand. Diferent
tools produce diferent models, and only
when you compare models side by side
can you see which data mining approach
produces the best “it.” If you start with a
workbench that has limited analytical
tools (e.g., only regression or only
decision trees), the end result could be a
model with limited predictive value.
SAS Enterprise Miner is delivered as a
distributed client/server system. This
provides an optimized architecture so
data miners and business analysts can
work more quickly to create accurate
predictive and descriptive models, and
produce results that can be shared and
incorporated into business processes.
To enhance the data mining process, this
software is designed to work seamlessly with
other SAS technologies, such as data inte-
gration, forecasting and reporting.
An integrated, complete view of your data
Data mining is most efective when it is
part of an integrated information delivery
strategy – one that includes data gathered
from hugely diverse enterprise sources.
Call center logs, survey results, customer
feedback forms, web data, time series data
and transactional point-of-sale data can all
be combined and analyzed with the indus-
try’s most sophisticated data mining
package. Adding SAS Text Miner lets you
analyze structured and unstructured data
together for more accurate and complete
results.
Easy-to-use GUI
An easy-to-use, drag-and-drop interface is
designed to appeal to analytic profes-
sionals. The advanced analytic algorithms
are organized under core tasks that are
performed in any successful data mining
endeavor. The SAS data mining process
encompasses ive primary steps: sampling,
exploration, modiication, modeling and
assessment (SEMMA). In each step, you
perform an array of actions as the data
mining project develops. By deploying
nodes from the SEMMA toolbar, you can
apply advanced statistics, identify the most
signiicant variables, transform data
elements with expression builders,
develop models to predict outcomes,
validate accuracy and generate a scored
data set with predicted values to deploy
into your operational applications.
A quick, easy and self-suicient way to generate models
SAS Rapid Predictive Modeler automati-
cally steps nontechnical users through a
worklow of data mining tasks (e.g., trans-
forming data, selecting variables, itting a
variety of algorithms and assessing
models) to quickly generate predictive
models for a wide range of business
problems. SAS Rapid Predictive Modeler is
a SAS® Enterprise Guide® or SAS Add-In for
Microsoft Oice (Microsoft Excel only) task
and uses prebuilt SAS Enterprise Miner
modeling steps. A collaborative approach
allows models developed using SAS Rapid
Predictive Modeler to be customized by
analytic professionals using SAS Enterprise
Miner.
Both classic and modern modeling techniques
SAS Enterprise Miner provides superior
analytical depth with a suite of statistical,
data mining and machine-learning algo-
rithms. Decision trees, bagging and
boosting, time series data mining, neural
networks, memory-based reasoning, hier-
archical clustering, linear and logistic
regression, associations, sequence and
web path analysis are all included. And
more. The breadth of analytical algorithms
extends to industry-speciic algorithms
such as credit scoring, and state-of-the-art
methods such as gradient boosting and
least angular regression splines.
Sophisticated data preparation, summarization and exploration
Preparing data is a time-consuming aspect
of all data mining endeavors. A powerful
set of interactive data preparation tools is
available for addressing missing values,
iltering outliers and developing segmen-
tation rules. Core data preparation tools
include ile importing and appending, and
merging and dropping variables. Extensive
descriptive summarization features and
interactive exploration tools enable even
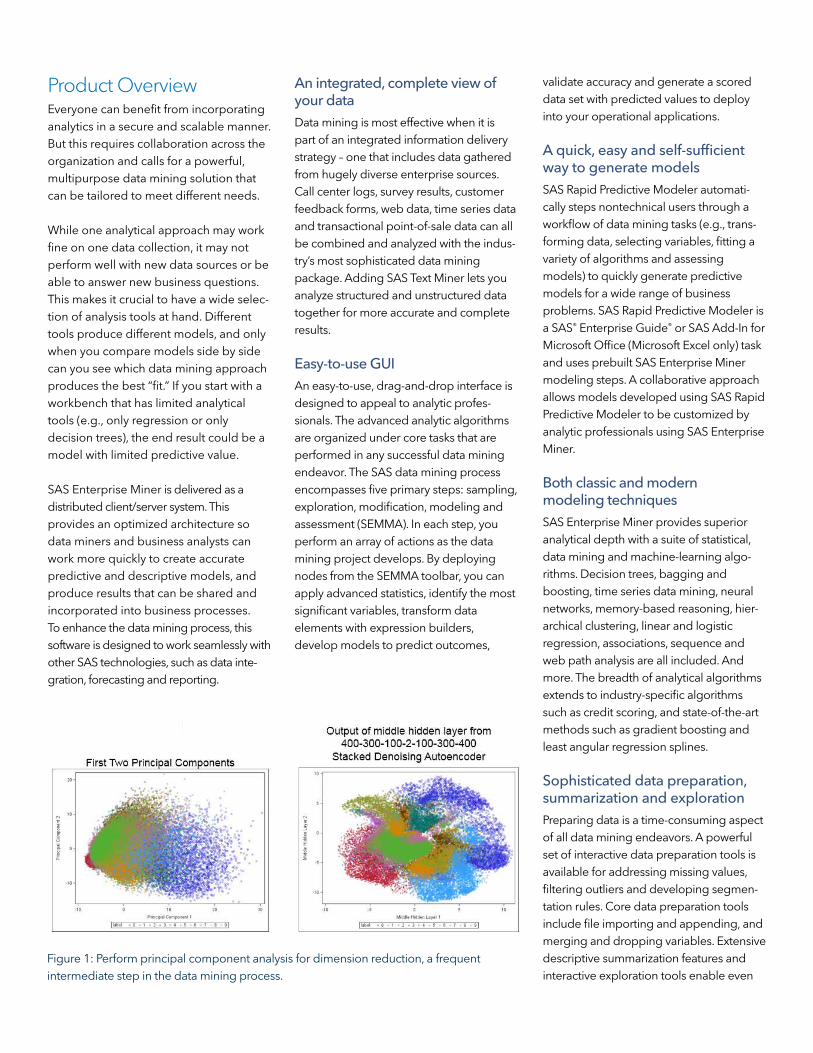
Figure 1: Perform principal component analysis for dimension reduction, a frequent
intermediate step in the data mining process.

novice users examine large amounts of
data in dynamically linked, multidimen-
sional plots. This produces quality data
mining results tailored and optimally
suited to speciic business problems.
Business-based model compari-sons, reporting and management
Assessment features let you compare
models to identify the ones that produce
the best lift and overall ROI. Models gener-
ated with diferent algorithms can be eval-
uated consistently using a highly visual
assessment interface. Data miners can
discuss results with business domain
experts for improved collaboration and
better results. An innovative Cutof node
examines posterior probability distribu-
tions to deine the optimal actions for
solving the business problem at hand.
Open, extensible design provides lexibility
The customizable environment of SAS
Enterprise Miner provides the ability to
add tools and include personalized SAS
code. Existing SAS models developed
outside of the SAS Enterprise Miner envi-
ronment can be integrated easily into the
process low environment while maintaining
full control of each syntax statement. The
Extension node includes interactive editor
features for training and score codes. Users
can edit and submit code interactively
while viewing the log and output listings.
Default selection lists can be extended
with custom-developed tools written with
SAS code or XML logic, which opens the
entire world of SAS to data miners.
Open Source Integration node
You can now easily integrate R language
code inside of a SAS Enterprise Miner
process low diagram. This enables you to
perform data transformation and explora-
tion as well as training and scoring super-
vised and unsupervised models in R. You
can then seamlessly integrate the results,
assess your R model and compare it to
models generated by SAS Enterprise
Miner.
Bridge to SAS® 9 and SAS® Viya™
Complement your SAS Enterprise Miner
environment with SAS Viya, our most
advanced distributed in-memory architec-
ture. The new SAS Viya Code node
enables you to submit and execute SAS
Viya code directly in a SAS Enterprise
Miner process low. With a look and feel
that is similar to the traditional SAS Code
node, SAS Enterprise Miner users should
ind the SAS Viya Code node easy to use.
This feature requires SAS/CONNECT
software.
In-database and in-Hadoop scoring delivers faster results
Scoring is the process of regularly
applying a model to new data for imple-
mentation into an operational environ-
ment. This can be tedious, especially
when it entails manually rewriting or
converting code, which delays model
implementation and can introduce poten-
tially costly errors. SAS Enterprise Miner
automatically generates score code in
SAS, C, Java and PMML. The scoring code
can be deployed in a variety of real-time
or batch environments within SAS, on the
web, or directly in relational databases or
Hadoop.
Combined with a SAS Scoring Accelerator
(available for Hadoop, Pivotal Greenplum,
DB2, IBM Netezza, Oracle, Teradata and
SAS Scalable Performance Data Server),
SAS Enterprise Miner models can be
published as database-speciic scoring
functions for execution directly in the
database. Results can be passed to other
SAS solutions for deployment of data
mining results into real-time operational
environments.
Score data on complex algorithms such as
forest and support vector machine models
more quickly using the SAS Scoring Accel-
erator. Score code generated within
process lows that include forest or support
vector machine models will be included in
the Score node and Score Export node
using the SAS ASTORE format for faster
in-memory scoring.
Parallelized grid-enabled workbench
Scale from a single-user system to very
large enterprise solutions with the Java
client and SAS server architecture. Powerful
servers can be dedicated to computing,
while users move from oice to home to
remote sites without losing access to
mining projects or services. Many process-
intensive tasks, such as data sorting,
summarization, variable selection and
regression modeling, are multithreaded,
and processes can be run in parallel for
distribution and workload balancing
across a grid of servers or scheduled for
batch processing.
Distributable data mining system suited for enterprises
SAS Enterprise Miner is deployable via a
thin-client web portal for distribution to
multiple users with minimal maintenance
of the clients. Alternatively, the complete
system can be conigured on a standalone
PC. SAS Enterprise Miner supports
Windows servers and UNIX platforms,
making it the software of choice for organi-
zations with large-scale data mining
projects. Model result packages can be
created and registered to the SAS
Metadata Server for promotion to SAS
Model Manager, SAS Data Integration
Studio (a component of SAS Data Integra-
tion) and SAS Enterprise Guide.
High-performance data mining
A select set of high-performance data
mining nodes is included in SAS Enterprise
Miner. Depending on the data and
complexity of analysis, users may ind
performance gains in a single-machine SMP
mode. When you need to process big data
faster, a separate licensable product, SAS
High-Performance Data Mining, lets you
develop timely and accurate predictive
models. High-performance data mining
procedures are available for those who
prefer a coding environment. Many options
are provided for complete customization of
your data mining programs. For more
details, visit sas.com/hpdatamining.
Key Features
• Weighted.
• Cluster.
• Systematic.
• First N.
• Rare event sampling.
• Stratiied and event-level sampling in
Teradata 13.
Data partitioning
• Create training, validation and test
data sets.
• Ensure good generalization of your
models through use of holdout data.
• Default stratiication by the class
target.
• Balanced partitioning by any class
variable.
• Output SAS tables or views.
Transformations
• Simple: log, log 10, square root, inverse,
square, exponential and standardized.
• Binning: bucketed, quantile and optimal
binning for relationship to target.
• Best power: maximize normality,
maximize correlation with target and
equalize spread with target levels.
• Interactions editor: define polynomial
and nth degree interaction efects.
• Enhanced Explorer window to
quickly locate and view table listings
or develop a plot using interactive
graph components.
• Drop Variables node.
• Merge Data node.
• Append node.
• Filter outliers:
• Apply various distributional
thresholds to eliminate extreme
interval values.
• Combine class values with fewer
than n occurrences.
• Interactively ilter class and
numeric values.
• Metadata node for modifying
columns metadata such as role,
measurement level and order.
• Integrated with SAS Data Integration
Studio, SAS Enterprise Guide, SAS
Model Manager and SAS Add-In
for Microsoft Oice through SAS
Metadata Server:
• Build training tables for mining.
• Deploy scoring code.
Sampling
• Simple random.
• Stratiied.
Intuitive interfaces
• Easy-to-use GUI for building process
low diagrams:
• Build more, better models faster.
• Deliverable via the web.
• Access the SAS programming
environment.
• Provides XML diagram exchange.
• Reuse diagrams as templates for
other projects or users.
• Directly load a speciic data
mining project or diagram, or
choose from a Project Navigator
tree that contains the most recent
projects or diagrams.
• Batch processing (program develop-
ment interface):
• Encapsulates all features of the
GUI.
• SAS macro based.
• Embed training and scoring
processes into customized
applications.
Scalable processing
• Server-based processing.
• Grid computing, in-database and
distributed in-memory processing
options.
• Asynchronous model training.
• Ability to stop processing cleanly.
• Parallel processing – run multiple
tools and diagrams concurrently.
• Multithreaded predictive algorithms.
• All storage located on servers.
Accessing and managing data
• Access and integrate structured and
unstructured data sources, including
time series data, market baskets,
web paths and survey data as candi-
date predictors.
• File Import node for easy access to
Microsoft Excel, comma-delimited
iles, SAS and other common ile
formats.
• Support for variables with special
characters.
• SAS Library Explorer and Library
Assignment wizard.
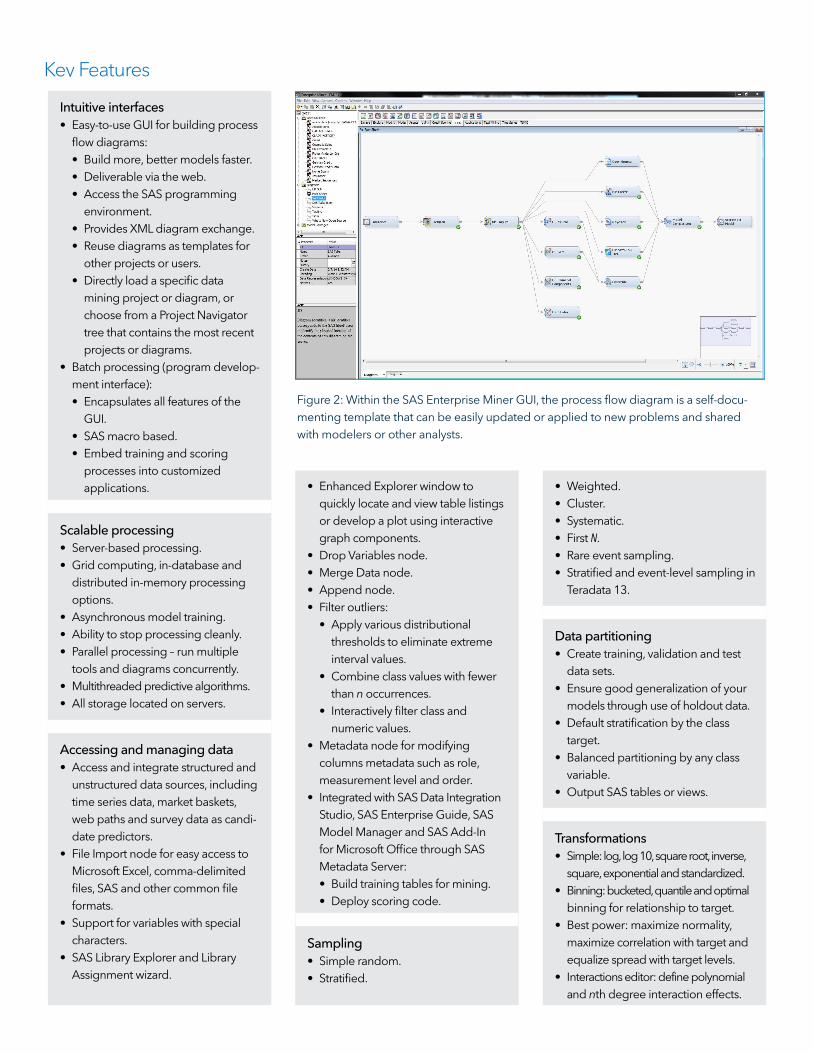
Figure 2: Within the SAS Enterprise Miner GUI, the process low diagram is a self-docu-
menting template that can be easily updated or applied to new problems and shared
with modelers or other analysts.
Graphs/visualization
• Batch and interactive plots: scatter,
matrix, box, constellation, contour,
needle, lattice, density and multidi-
mensional plots; 3-D, pie and area
bar charts; and histograms.
• Segment proile plots:
• Interactively proile segments of
data created by clustering and
modeling tools.
• Easily identify variables that deter-
mine the proiles and the difer-
ences between groups.
• Easy-to-use Graphics Explorer wizard
and Graph Explore node:
• Create titles and footnotes.
• Apply a WHERE clause.
• Choose from color schemes.
• Easily rescale axes.
• Distribution plots.
• Statistics breakdown for each level
of the class target.
• Bivariate statistics and plots:
• Ordered Pearson and Spearman
correlation plot.
• Ordered chi-square plot with
option for binning continuous
inputs into nbins.
• Coeicient of variation plot.
• Variable selection by logworth.
• Other interactive plots:
• Variable worth plot ranking inputs
based on their worth with the
target.
• Class variable distributions across
the target and/or the segment
variable.
• Scaled mean deviation plots.
• Interactively deine transformations:
• Deine customized transforma-
tions using the Expression Builder
or SAS code editor.
• Compare the distribution of the new
variable with the original variable.
• Predeine global transformation code
for reuse.
Interactive variable binning
• Quantile or bucket.
• Gini variable selection.
• Handle missing values as separate
group.
• Fine and coarse classing detail.
• Proile bins by target.
• Modify groups interactively.
• Save binning deinitions.
Rules Builder node
• Create ad hoc data-driven rules and
policies.
• Interactively deine the value of the
outcome variable and paths to the
outcome.
Data replacement
• Measures of centrality.
• Distribution-based.
• Tree imputation with surrogates.
• Mid-medium spacing.
• Robust M-estimators.
• Default constant.
• Replacement Editor:
• Specify new values for class
variables.
• Assign replacement values for
unknown values.
• Interactively cap extreme interval
values to a replacement threshold.
Descriptive statistics
• Univariate statistics and plots:
• Interval variables: n, mean, median,
min, max, standard deviation, scaled
deviation and percent missing.
• Class variables: number of catego-
ries, counts, mode, percent mode
and percent missing.
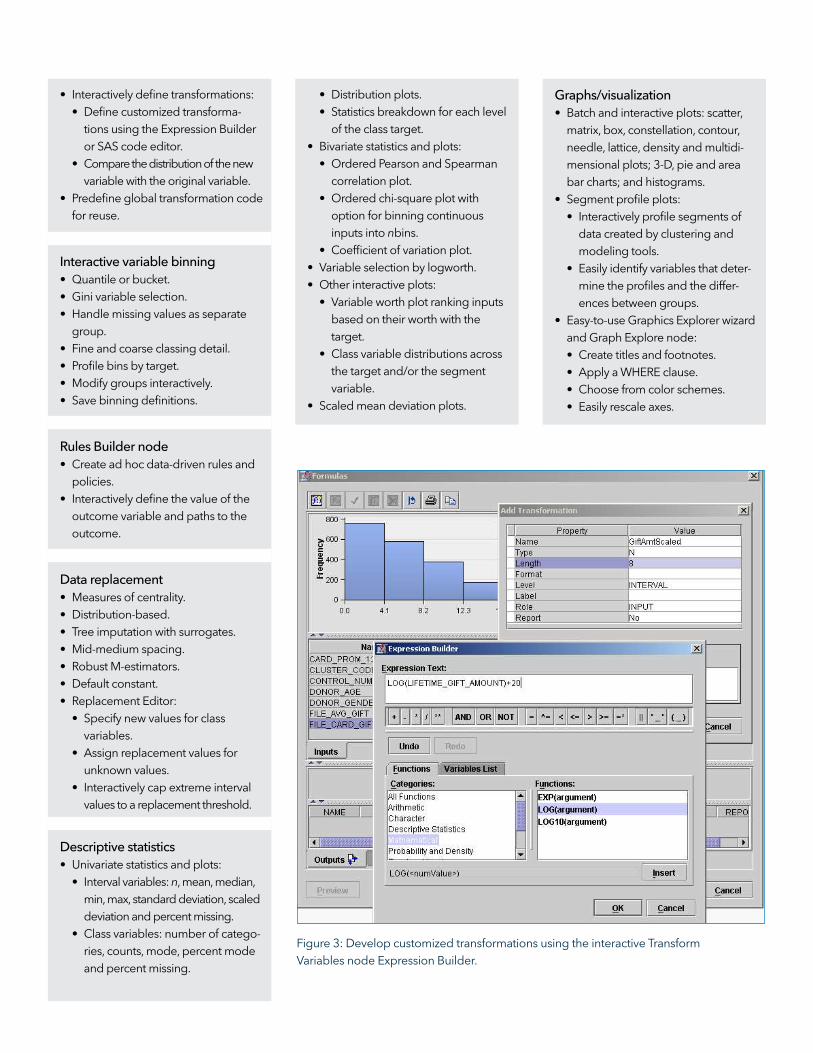
Figure 3: Develop customized transformations using the interactive Transform
Variables node Expression Builder.
• Provides weighted conidence
statistics to provide next-best ofer
information.
• Generates cluster scores for data
reduction and segmentation.
Dimension reduction
• Variable selection:
• Remove variables unrelated to
target based on a chi-square or R2
selection criterion.
• Remove variables in hierarchies.
• Remove variables with many
missing values.
• Reduce class variables with a large
number of levels.
• Bin continuous inputs to identify
nonlinear relationships.
• Detect interactions.
• Least Angle Regression (LARS)
variable selection:
• AIC, SBC, Mallows C(p), cross-vali-
dation and other selection criteria.
• Plots include: parameter esti-
mates, coeicient paths, iteration
plot, score rankings and more.
• Generalizes to support LASSO
(least absolute shrinkage and
selection operator).
• Supports class inputs and targets
as well as continuous variables.
• Interactively subset rules based
on lift, conidence, support, chain
length, etc.
• Seamless integration of rules with
other inputs for enriched predictive
modeling.
• Hierarchical associations:
• Derive rules at multiple levels.
• Specify parent and child
mappings for the dimensional
input table.
Web path analysis
• Scalable and eicient mining of the
most frequently navigated paths
from clickstream data.
• Mine frequent consecutive subse-
quences from any type of sequence
data.
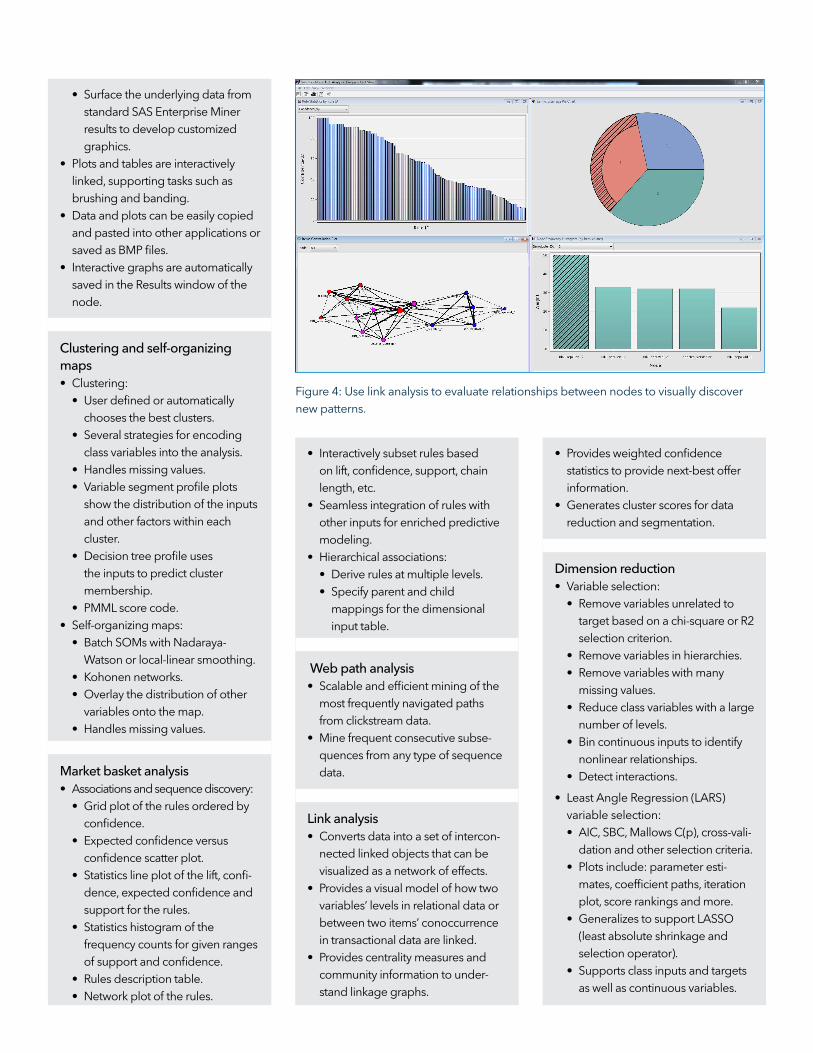
Link analysis
• Converts data into a set of intercon-
nected linked objects that can be
visualized as a network of efects.
• Provides a visual model of how two
variables’ levels in relational data or
between two items’ conoccurrence
in transactional data are linked.
• Provides centrality measures and
community information to under-
stand linkage graphs.
• Surface the underlying data from
standard SAS Enterprise Miner
results to develop customized
graphics.
• Plots and tables are interactively
linked, supporting tasks such as
brushing and banding.
• Data and plots can be easily copied
and pasted into other applications or
saved as BMP iles.
• Interactive graphs are automatically
saved in the Results window of the
node.
Clustering and self-organizing
maps
• Clustering:
• User deined or automatically
chooses the best clusters.
• Several strategies for encoding
class variables into the analysis.
• Handles missing values.
• Variable segment proile plots
show the distribution of the inputs
and other factors within each
cluster.
• Decision tree proile uses
the inputs to predict cluster
membership.
• PMML score code.
• Self-organizing maps:
• Batch SOMs with Nadaraya-
Watson or local-linear smoothing.
• Kohonen networks.
• Overlay the distribution of other
variables onto the map.
• Handles missing values.
Market basket analysis
• Associations and sequence discovery:
• Grid plot of the rules ordered by
conidence.
• Expected conidence versus
conidence scatter plot.
• Statistics line plot of the lift, coni-
dence, expected conidence and
support for the rules.
• Statistics histogram of the
frequency counts for given ranges
of support and conidence.
• Rules description table.
• Network plot of the rules.
Figure 4: Use link analysis to evaluate relationships between nodes to visually discover
new patterns.
• Display multiple results in one
window to help better evaluate
model performance.
• Decisions node for setting target
event and deining priors and proit/
loss matrices.
Regression
• Linear and logistic.
• Stepwise, forward and backward
selection.
• Equation terms builder: polynomials,
general interactions, and efect hier-
archy support.
• Cross-validation.
• Efect hierarchy rules.
• Optimization techniques include:
Conjugate Gradient, Double
Dogleg, Newton-Raphson with Line
Search or Ridging, Quasi-Newton
and Trust Region.
• Dmine Regression node:
• Fast forward stepwise least
squares regression.
• Optional variable binning to
detect nonlinear relationships.
• Optional class variable reduction.
• Include interaction terms.
• In-database modeling for Teradata
13.
• PMML score code.
• Batch code uses input tables of
diferent names and locations.
• Batch code now integrates project-
start code that you can use to
deine libraries and options.
• Easy-to-use program development
interface:
• Macro variables to reference data
sources, variables, etc.
• Interactive code editor and submit.
• Separately manage training,
scoring and reporting code.
• SAS Output and SAS LOG.
• Create graphics.
• Write SAS Viya code in code editor
window within a SAS Enterprise Miner
process low.
Consistent modeling features
• Select models based on either
the training, validation (default)
or test data using several criteria
such as proit or loss, AlC, SBC,
average square error, misclas-
siication rate, ROC, Gini, or KS
(Kolmogorov-Smirnov).
• Incorporate prior probabilities into
the model development process.
• Supports binary, nominal, ordinal
and interval inputs and targets.
• Easy access to score code and all
partitioned data sources.
• Score code generation.
• Principal components:
• Calculate Eigenvalues and
Eigenvectors from correlation and
covariance matrices.
• Plots include: principal compo-
nents coeicients, principal
components matrix, Eigenvalue,
Log Eigenvalue and Cumulative
Proportional Eigenvalue.
• Interactively choose the number
of components to be retained.
• Mine selected principal compo-
nents using predictive modeling
techniques.
• Variable clustering:
• Divide variables into disjoint or
hierarchical clusters.
• Eigenvalue or principal compo-
nents learning.
• Includes class variable support.
• Dendrogram tree of the clusters.
• Selected variables table with
cluster and correlation statistics.
• Cluster network and R-square plot.
• Interactive user override of
selected variables.
• Time series mining:
• Reduce transactional data into
a time series using several
accumulation methods and
transformations.
• Analysis methods include
seasonal, trend, time domain, and
seasonal decomposition.
• Mine the reduced time series
using clustering and predictive
modeling techniques.
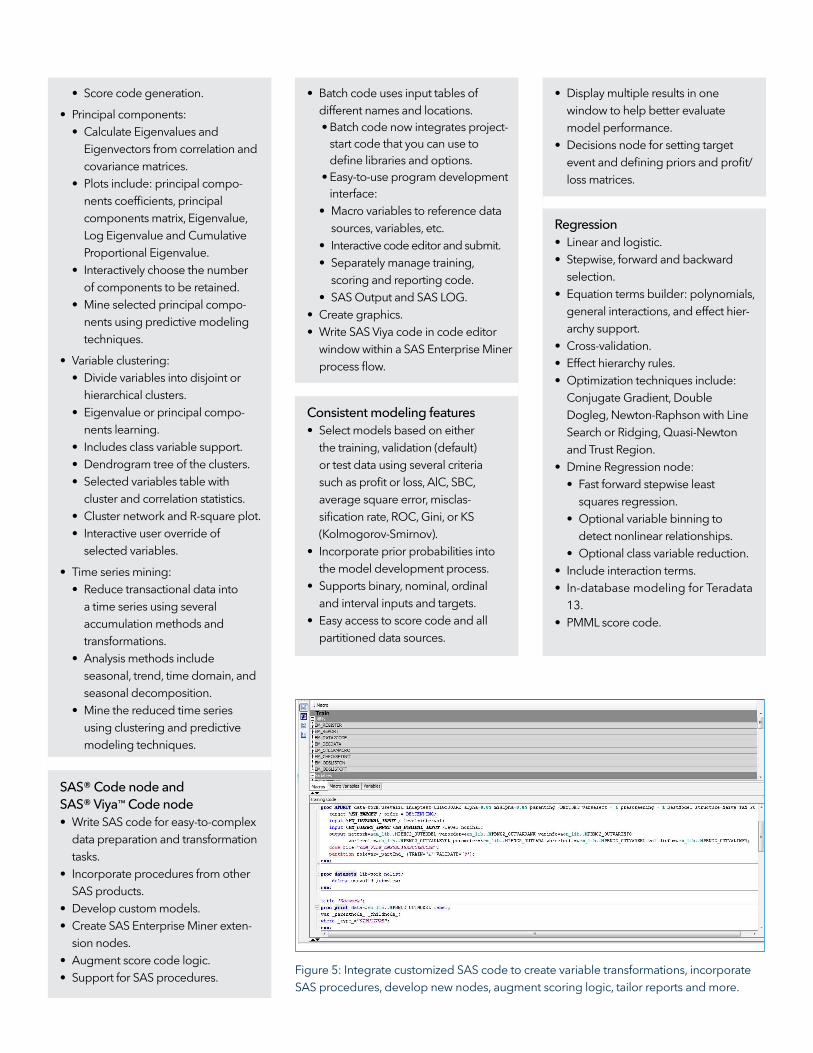
SAS® Code node and
SAS® Viya™ Code node
• Write SAS code for easy-to-complex
data preparation and transformation
tasks.
• Incorporate procedures from other
SAS products.
• Develop custom models.
• Create SAS Enterprise Miner exten-
sion nodes.
• Augment score code logic.
• Support for SAS procedures.Figure 5: Integrate customized SAS code to create variable transformations, incorporate
SAS procedures, develop new nodes, augment scoring logic, tailor reports and more.

• Choose from ive cross-validation
strategies.
• Supports variable selection.
Rule induction
• Recursive predictive modeling
technique.
• Especially useful for modeling rare
events.
Two-stage modeling
• Sequential and concurrent modeling
for both the class and interval target.
• Choose a decision tree, regression
or neural network model for each
stage.
• Control how the class prediction is
applied to the interval prediction.
• Accurately estimate customer value.
Memory-based reasoning
• k-nearest neighbor technique to
categorize or predict observations.
• Patented Reduced Dimensionality
Tree and Scan.
Model ensembles
• Combine model predictions to form
a potentially better solution.
Neural networks
• Neural Network node:
• Flexible network architectures
with combination and activation
functions.
• 10 training techniques.
• Preliminary optimization.
• Automatic standardization of inputs.
• Supports direction connections.
• Autoneural Neural node:
• Automated multilayer perceptron
building searches for optimal
coniguration.
• Type and activation function
selected from four diferent types
of architectures.
• PMML score code.
• DM Neural node:
• Model building with dimension
reduction and function selection.
• Fast training; linear and nonlinear
estimation.
Partial Least Squares node
• Especially useful for extracting fac-
tors from a large number of potential
correlated variables.
• Performs principal components regres-
sion and reduced rank regression.
• User or automated selection of the
number of the factors.
Decision trees
• Methodologies:
• CHAID, classiication and
regression trees, bagging and
boosting, gradient boosting,
and bootstrap forest.
• Tree selection based on proit
or lift objectives and ability to
prune accordingly.
• K-fold cross-validation.
• Splitting criterion: Prob Chi-square
test, Prob F-test, Gini, Entropy and
variance reduction.
• Switch targets for designing multi-
objective segmentation strategies.
• Automatically output leaf IDs as
inputs for modeling and group
processing.
• Displays English rules.
• Calculates variable importance for
preliminary variable selection and
model interpretation.
• Display variable precision values in
the split branches and nodes.
• Unique consolidated tree map
representation of the tree diagram.
• Interactive tree capabilities:
• Interactive growing/pruning
of trees; expand/collapse tree
nodes.
• Incorporates validation data to
evaluate tree stability.
• Deine customized split points,
including binary or multiway
splits.
• Split on any candidate variable.
• Copy split.
• Tables and plots are dynamically
linked to better evaluate the tree
performance.
• Easy-to-print tree diagrams on
a single page or across multiple
pages.
• Interactive subtree selection.
• User-speciied display of text and
statistics in the Tree node.
• User-controlled sample size within
interactive trees.
• Based on the fast ARBORETUM
procedure.
• PMML score code.
Figure 6: Fit highly complex nonlinear relationships using the Neural Network node.
• Cross-correlation:
• Provides autocorrelation and
cross-correlation analysis for time-
stamped data.
• The Time Series Correlation node
outputs time-domain statistics
based on whether autocorrelation
or cross-correlation is performed.
• Seasonal decomposition.
Survival analysis
• Discrete time to event regression
with additive logistic regression.
• Event probability for time efect is
modeled using cubic splines.
• Users can now enter the cubic spline
basis functions as part of the step-
wise variable selection procedure in
addition to the main efects.
• User-deined time intervals for speci-
fying how to analyze the data and
handle censoring.
• Automatically expands the data with
optional sampling.
• Supports non-time varying covariates.
• Computes similarity measures
between the target and input
series, or among input time series.
• Similarity matrix for all combina-
tions of the series.
• Hierarchical clustering using the
similarity matrix with dendrogram
results.
• Constellation plot for evaluating
the clusters.
• Exponential smoothing:
• Control weights decay using one
or more smoothing parameters.
• Best-itting smoothing method
(simple, double, linear, damped
trend, seasonal or Winters’ method)
is selected automatically.
• Dimension reduction:
• Supports ive time series dimen-
sion reduction techniques:
Discrete Wavelet Transform,
Discrete Fourier Transform,
Singular Value Decomposition,
Line Segment Approximation
with the Mean, and Line Segment
Approximation with the Sum.
• Methods include: Averaging, Voting
and Maximum.
Open Source Integration node
• Write code in the R language inside
of SAS Enterprise Miner.
• SAS Enterprise Miner data and
metadata are available to your R
code with R results returned to SAS
Enterprise Miner.
• Train and score supervised and
unsupervised R models. The node
allows for data transformation and
exploration.
• Generate model comparisons and
SAS score code for supported models.
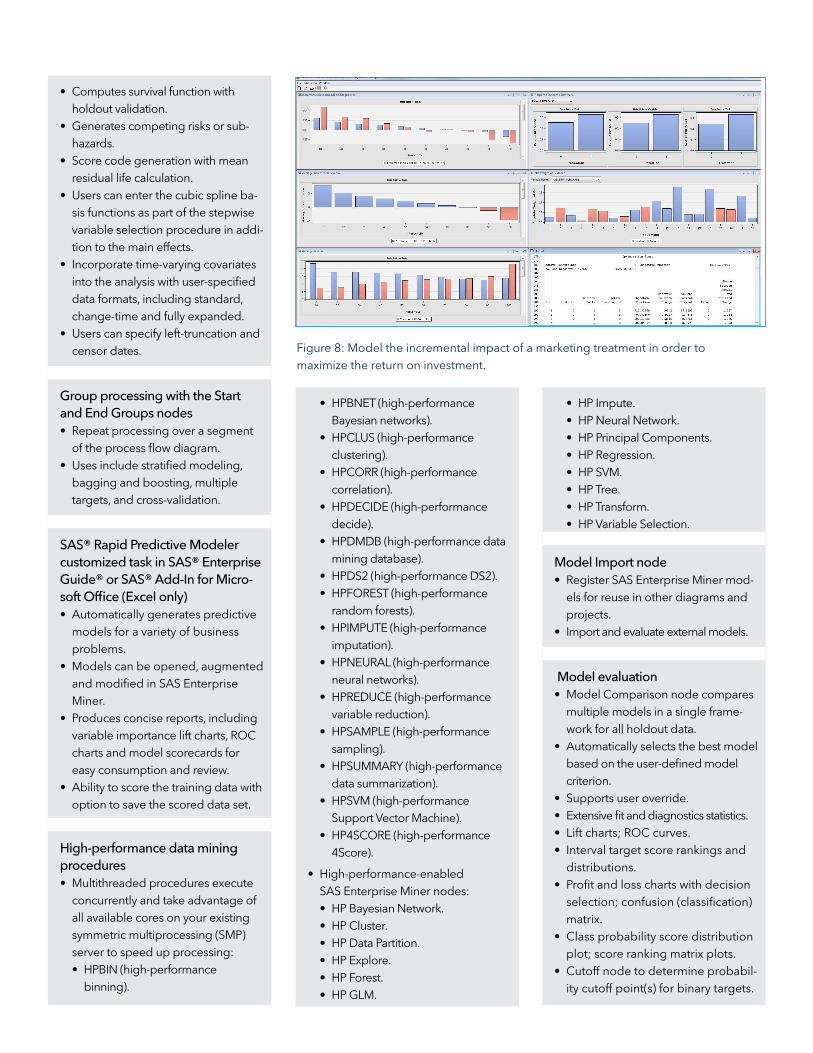
Incremental response/net lift
models
• Net treatment vs. control models.
• Binary and interval targets.
• Stepwise selection.
• Fixed or variable revenue calcula-
tions.
• Net information value variable selec-
tion.
• User can specify the treatment level
of the treatment variable.
• User can specify a cost variable in
addition to a constant cost.
• Penalized Net Information Value
(PNIV) for variable selection.
• Separate model selection options
available for an incremental sales
model.
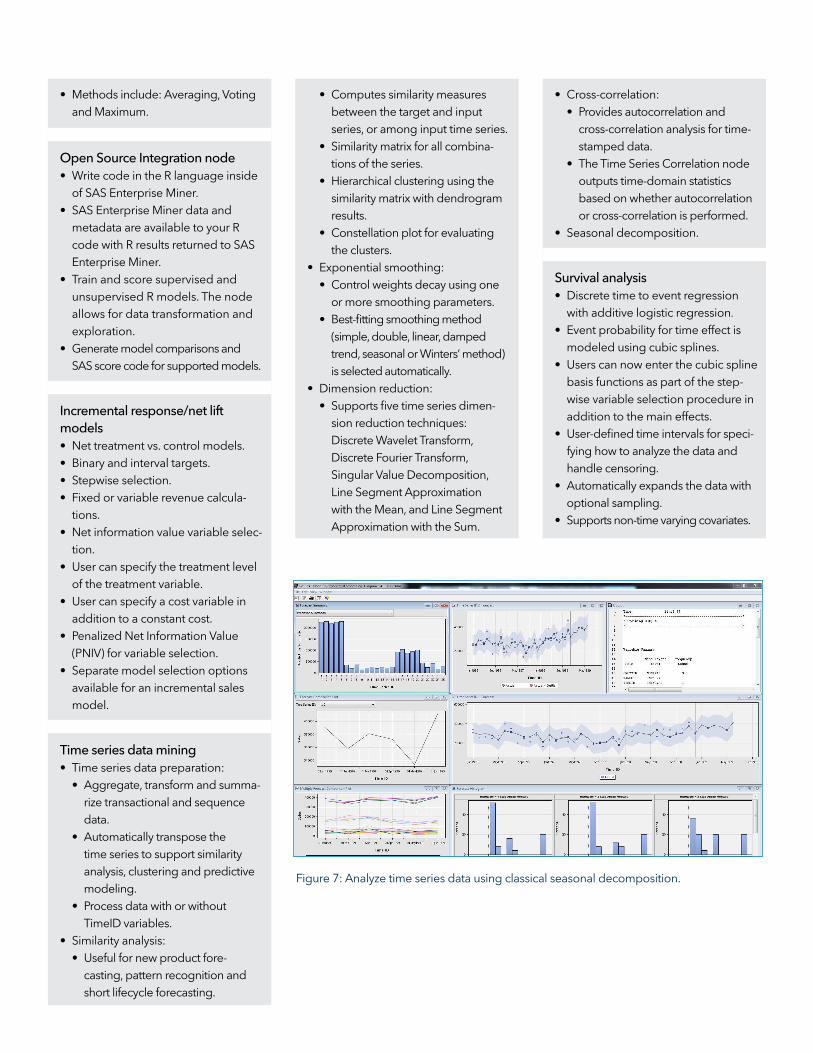
Time series data mining
• Time series data preparation:
• Aggregate, transform and summa-
rize transactional and sequence
data.
• Automatically transpose the
time series to support similarity
analysis, clustering and predictive
modeling.
• Process data with or without
TimeID variables.
• Similarity analysis:
• Useful for new product fore-
casting, pattern recognition and
short lifecycle forecasting.
Figure 7: Analyze time series data using classical seasonal decomposition.
• HP Impute.
• HP Neural Network.
• HP Principal Components.
• HP Regression.
• HP SVM.
• HP Tree.
• HP Transform.
• HP Variable Selection.
Model Import node
• Register SAS Enterprise Miner mod-
els for reuse in other diagrams and
projects.
• Import and evaluate external models.
Model evaluation
• Model Comparison node compares
multiple models in a single frame-
work for all holdout data.
• Automatically selects the best model
based on the user-deined model
criterion.
• Supports user override.
• Extensive it and diagnostics statistics.
• Lift charts; ROC curves.
• Interval target score rankings and
distributions.
• Proit and loss charts with decision
selection; confusion (classiication)
matrix.
• Class probability score distribution
plot; score ranking matrix plots.
• Cutof node to determine probabil-
ity cutof point(s) for binary targets.
• HPBNET (high-performance
Bayesian networks).
• HPCLUS (high-performance
clustering).
• HPCORR (high-performance
correlation).
• HPDECIDE (high-performance
decide).
• HPDMDB (high-performance data
mining database).
• HPDS2 (high-performance DS2).
• HPFOREST (high-performance
random forests).
• HPIMPUTE (high-performance
imputation).
• HPNEURAL (high-performance
neural networks).
• HPREDUCE (high-performance
variable reduction).
• HPSAMPLE (high-performance
sampling).
• HPSUMMARY (high-performance
data summarization).
• HPSVM (high-performance
Support Vector Machine).
• HP4SCORE (high-performance
4Score).
• High-performance-enabled
SAS Enterprise Miner nodes:
• HP Bayesian Network.
• HP Cluster.
• HP Data Partition.
• HP Explore.
• HP Forest.
• HP GLM.
• Computes survival function with
holdout validation.
• Generates competing risks or sub-
hazards.
• Score code generation with mean
residual life calculation.
• Users can enter the cubic spline ba-
sis functions as part of the stepwise
variable selection procedure in addi-
tion to the main efects.
• Incorporate time-varying covariates
into the analysis with user-speciied
data formats, including standard,
change-time and fully expanded.
• Users can specify left-truncation and
censor dates.
Group processing with the Start
and End Groups nodes
• Repeat processing over a segment
of the process low diagram.
• Uses include stratiied modeling,
bagging and boosting, multiple
targets, and cross-validation.
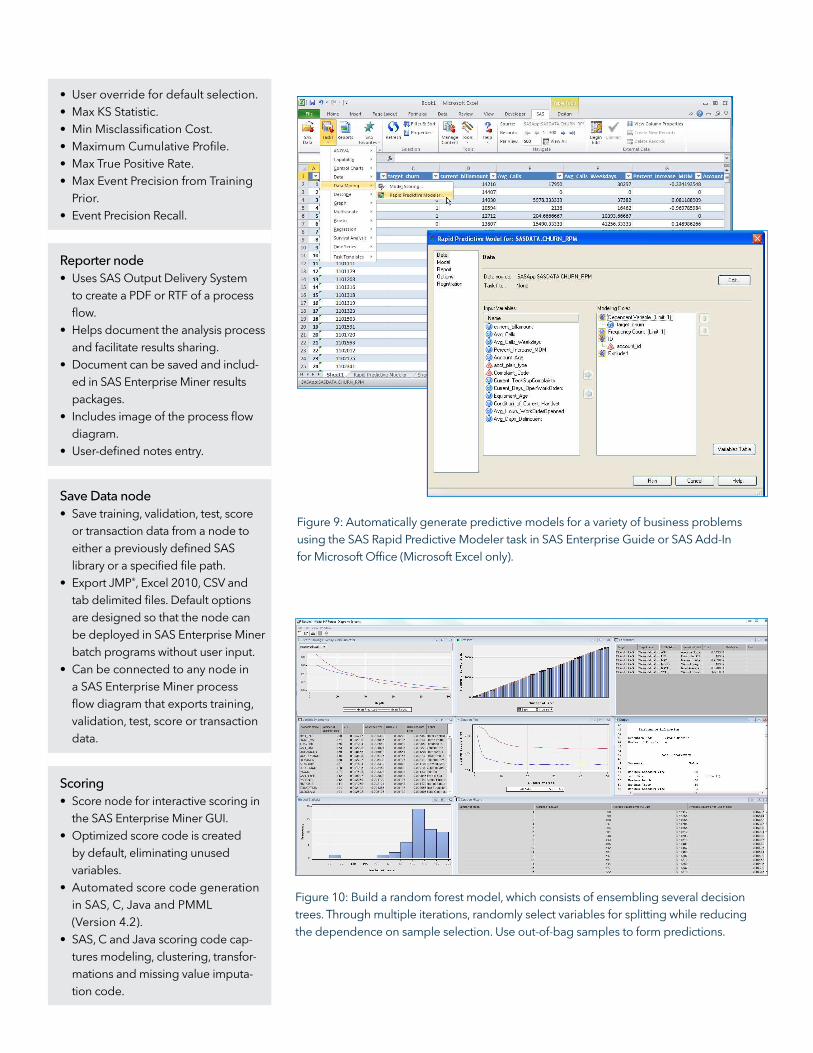
SAS® Rapid Predictive Modeler
customized task in SAS® Enterprise
Guide® or SAS® Add-In for Micro-
soft Oice (Excel only)
• Automatically generates predictive
models for a variety of business
problems.
• Models can be opened, augmented
and modiied in SAS Enterprise
Miner.
• Produces concise reports, including
variable importance lift charts, ROC
charts and model scorecards for
easy consumption and review.
• Ability to score the training data with
option to save the scored data set.
High-performance data mining
procedures
• Multithreaded procedures execute
concurrently and take advantage of
all available cores on your existing
symmetric multiprocessing (SMP)
server to speed up processing:
• HPBIN (high-performance
binning).
Figure 8: Model the incremental impact of a marketing treatment in order to
maximize the return on investment.
• User override for default selection.
• Max KS Statistic.
• Min Misclassiication Cost.
• Maximum Cumulative Proile.
• Max True Positive Rate.
• Max Event Precision from Training
Prior.
• Event Precision Recall.
Reporter node
• Uses SAS Output Delivery System
to create a PDF or RTF of a process
low.
• Helps document the analysis process
and facilitate results sharing.
• Document can be saved and includ-
ed in SAS Enterprise Miner results
packages.
• Includes image of the process low
diagram.
• User-deined notes entry.
Save Data node
• Save training, validation, test, score
or transaction data from a node to
either a previously deined SAS
library or a speciied ile path.
• Export JMP®, Excel 2010, CSV and
tab delimited iles. Default options
are designed so that the node can
be deployed in SAS Enterprise Miner
batch programs without user input.
• Can be connected to any node in
a SAS Enterprise Miner process
low diagram that exports training,
validation, test, score or transaction
data.
Scoring
• Score node for interactive scoring in
the SAS Enterprise Miner GUI.
• Optimized score code is created
by default, eliminating unused
variables.
• Automated score code generation
in SAS, C, Java and PMML
(Version 4.2).
• SAS, C and Java scoring code cap-
tures modeling, clustering, transfor-
mations and missing value imputa-
tion code.
Figure 9: Automatically generate predictive models for a variety of business problems
using the SAS Rapid Predictive Modeler task in SAS Enterprise Guide or SAS Add-In
for Microsoft Oice (Microsoft Excel only).
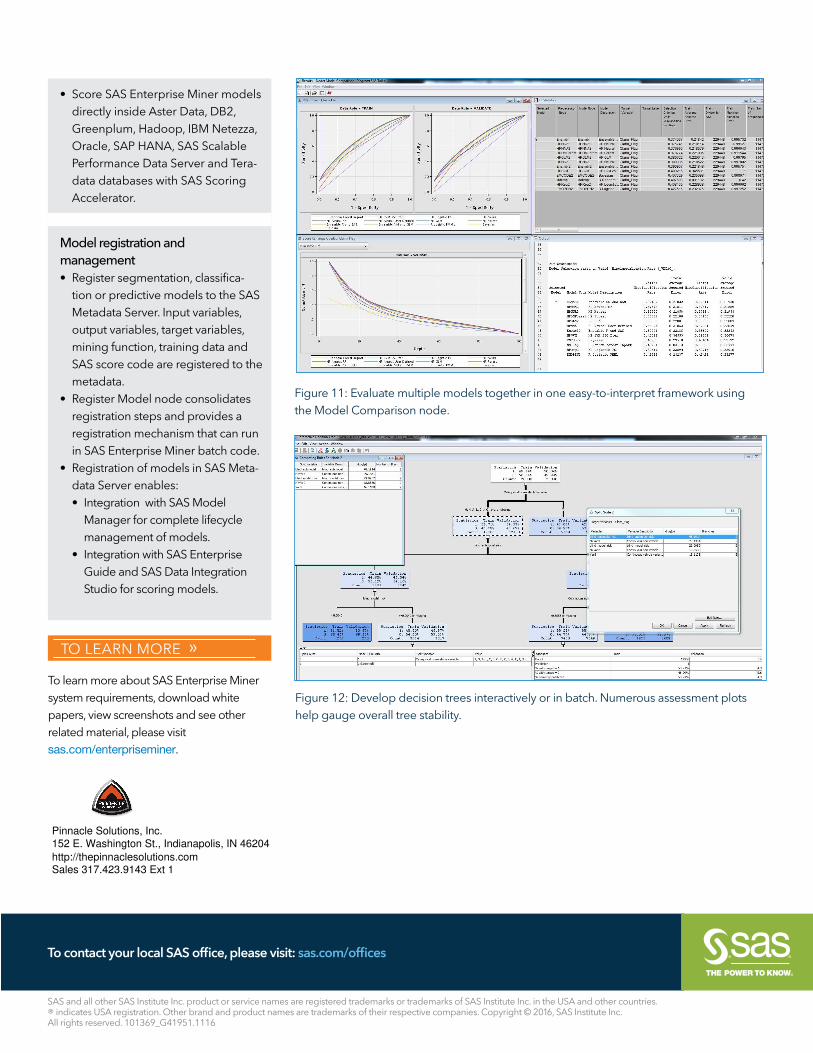
Figure 10: Build a random forest model, which consists of ensembling several decision
trees. Through multiple iterations, randomly select variables for splitting while reducing
the dependence on sample selection. Use out-of-bag samples to form predictions.
• Score SAS Enterprise Miner models
directly inside Aster Data, DB2,
Greenplum, Hadoop, IBM Netezza,
Oracle, SAP HANA, SAS Scalable
Performance Data Server and Tera-
data databases with SAS Scoring
Accelerator.
Model registration and
management
• Register segmentation, classiica-
tion or predictive models to the SAS
Metadata Server. Input variables,
output variables, target variables,
mining function, training data and
SAS score code are registered to the
metadata.
• Register Model node consolidates
registration steps and provides a
registration mechanism that can run
in SAS Enterprise Miner batch code.
• Registration of models in SAS Meta-
data Server enables:
• Integration with SAS Model
Manager for complete lifecycle
management of models.
• Integration with SAS Enterprise
Guide and SAS Data Integration
Studio for scoring models.
To learn more about SAS Enterprise Miner
system requirements, download white
papers, view screenshots and see other
related material, please visit
sas.com/enterpriseminer.
Figure 11: Evaluate multiple models together in one easy-to-interpret framework using
the Model Comparison node.
Figure 12: Develop decision trees interactively or in batch. Numerous assessment plots
help gauge overall tree stability.
SAS and all other SAS Institute Inc. product or service names are registered trademarks or trademarks of SAS Institute Inc. in the USA and other countries.
® indicates USA registration. Other brand and product names are trademarks of their respective companies. Copyright © 2016, SAS Institute Inc. All rights reserved. 101369_G41951.1116
To contact your local SAS oice, please visit: sas.com/oices
TO LEARN MORE »
http://thepinnaclesolutions.com
152 E. Washington St., Indianapolis, IN 46204
Pinnacle Solutions, Inc.
Sales 317.423.9143 Ext 1