sars outbreaks in ontario, hong kong and...
TRANSCRIPT

Gerardo Chowell
Mathematical Modeling and Analysis & Center for Nonlinear StudiesLos Alamos National Laboratory
Los Alamos, New Mexico
SARS Outbreaks in Ontario, Hong Kong andSingapore
DIMACS Workshop on Facing the Challenge of Infectious Diseases in Africa: TheRole of Mathematical Modeling September 25-27, 2006

Outline
SARS and its epidemiology A mathematical model for SARS The dynamics of SARS in Toronto, Hong Kong andSingapore Estimates of the basic reproduction number forSARS Comparison of the reproduction number with that ofseasonal and pandemic influenza Conclusions

SARS
• Severe acute Respiratory Syndrome(SARS) is a new respiratory diseasewhich was first identified inGuangdong’s province of China.
• The outbreak of SARS was firstidentified in Vietnam by Dr. CarloUrbani, a WHO expert in communicablediseases who succumbed to the disease.
• The causative agent of SARS is a newcoronavirus (Drosten et al. And Ksiazeket al. 2003)
• WHO for the first time in history issueda global warning about the disease inMarch 2003.
Coronavirus from SARSisolated in FRhK-4 cells.Department ofMicrobiology,The University of HongKong and theGovernment Virus Unit.
The public image ofSARS in Hong Kong

Epidemiology of SARS
• SARS is believed to be transmitted by close contact with aninfectious individuals (droplets).
• An individual exposed to SARS may become infectious after anincubation period of 2-7 days.
• Infectious individuals experience similar symptoms topneumonia including high fever, shortness of breath, dry cough,headache, stiff or achy muscles, fatigue and diarrhea.
• Most infected individuals recover typically after 7-10 days.
• The case fatality rate for patients younger than 60 years is13.2% while for patients ages 60 or older is 43.3%.

Modeling the transmission dynamics of SARS
• To account for differences in susceptibility in the population,we introduce two susceptibles classes: S1 and S2. S1 is themost susceptible class and S2 is less so. For the case of HongKong, this can be illustrated with the following graph:
Age distribution ofresidents in Hong Kong(blue) and age-specificSARS incidence (red).Donnelly et al. (2003)

S1
S2
E I DJ
C
R
)(N
lJqEI ++!
k!
1!
2!
!
!
!
)(N
lJqEIp
++!
• E (exposed).Asymptomatic, possiblyinfectious individuals.
• I (infectious). Infected,symptomatic not yetdiagnosed individuals.
• J (diagnosed). Diagnosed(hospitalized) individuals.
• R (recovered). Individualswho recovered from thedisease.
• D (dead). Individuals whodied from the disease.
Compartmental model
Chowell et al. (2003), Lipsitch et al.(2003), Riley et al. (2003), Gumel et al.(2004), Lloyd-Smith (2004), Hsie et al.(2004).

Parameter definitions and estimates
Parameter definitions and values that fit the cumulative number of“diagnosed” cases for Hong Kong.

Intervention measures
•Rapid diagnosis of patients
•Strict isolation procedures
Before After
Diagnostic period ~ 6 days
Infectious individuals were notbeing properly isolated inhospitals
Diagnostic period ~ 3 days
Isolation effectiveness wasroughly 10 times better!
The image of SARS in hospitals

Isolation effectiveness (l)
• is a measure of the effectiveness of theisolation procedures implemented in hospital wards(i.e appropriate nursing-barrier techniques, etc.)
• 94% of SARS cases in Taiwan occurrred inhospital wards.
10 << l
l = 0(Perfectisolation)
Actual isolationeffectiveness
l = 1(no isolation)

The cases of Hong Kong and Singapore
Data
Model
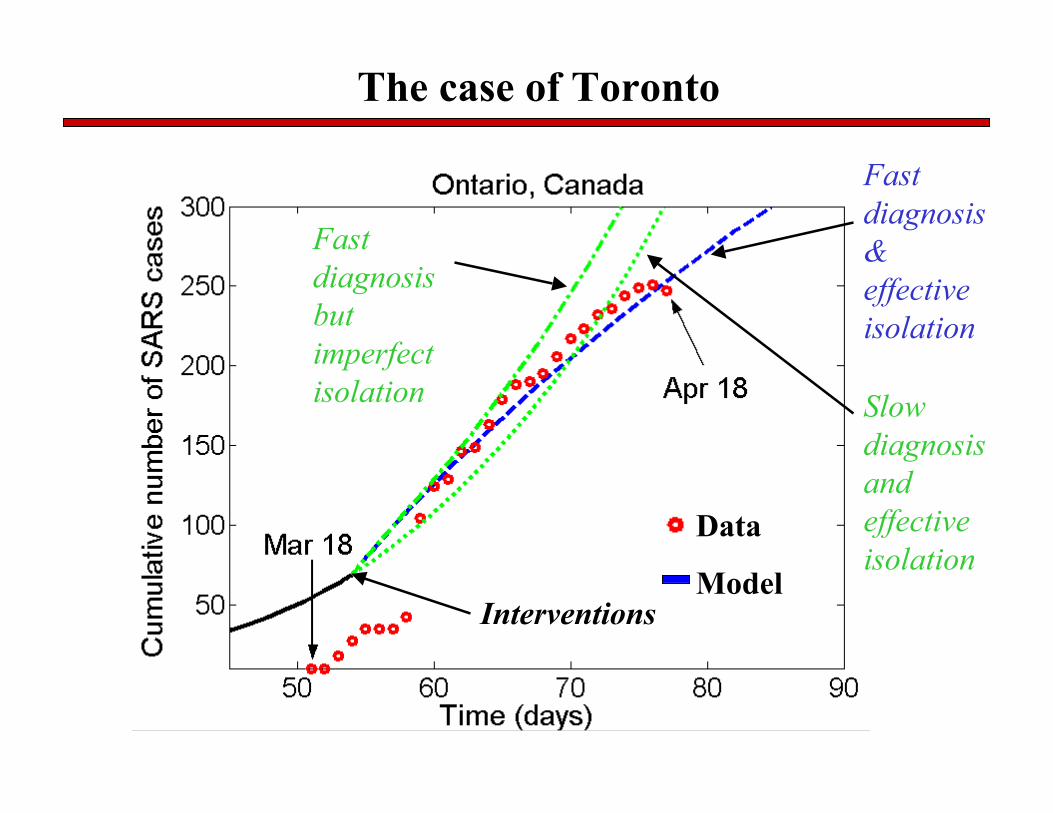
The case of Toronto
Data
Model
Slowdiagnosisandeffectiveisolation
Fastdiagnosisbutimperfectisolation
Interventions
Fastdiagnosis&effectiveisolation

The Basic reproduction number R0
The number of secondary cases generated by a primaryinfectious case during its period of infectiousness in anentirely susceptible population is known as the basicreproduction number R0.
A more practical quantity is the reproduction number (R)which measures the transmissibility in a partially immunepopulation, where a fraction of individuals is effectivelyprotected against infection before the start of the epidemic,because of residual immunity from previous exposure toinfluenza, or vaccination. For example, if a proportion p ofa completely susceptible population is successfullyimmunized prior to an epidemic, the relation between thebasic and the effective reproductive number is R = (1-p) R0.

R0 for SARS
• Following the second generation approach(Diekmann and Heesterbeek, 2000), we can obtainthe following expression for the basic reproductivenumber:
• For Hong Kong R0 = 1.2 and R0 = 1.1 forSingapore.

Parameter distributions (Donnelly et al. 2003)
Uncertainty analysis for R0
• Under perfect isolation, 25%of the R0 distribution lies atR0 > 1. This highlights theimportance of simultaneouslyapplying more than onemethod of control.
• For Hong Kong, R0 = 1.8(0.5, 2.5) and R0 = 1.7 (0.4,2.3) for Singapore.
• Lipstich et al. (2003), Rileyet al. (2003) R0 ~ 2-3,assuming an exponentialepidemic growth phase (mayoverestimate initial growthrate, Razum et al. 2003).Chowell, Castillo-Chavez, Fenimore, Kribs-Zaleta,
Arriola, Hyman, Emerging Infectious Diseases(2004).

Seasonal influenza
• We find similar averagereproduction numbers forinter-pandemic influenza inthe three countries: 1.3 inthe US (95% ConfidenceInterval (CI) 1.2-1.4),[Wilcoxon test for betweencountry differences,P>0.87].
• Estimates of thereproduction number usingmorbidity data for Franceand the greater Paris areaare in close agreement withthose obtained usingmortality data.
Chowell, Miller, Viboud. Transmission of Seasonal Influenza in the UnitedStates, France, and Australia, and prospects for control (in revision).

US mortality in 20th century
Source: CDC
Spanish Flu (1918)

2.083.00.093.753.252nd wave
2.059.70.021.490.71st wave
S. D. Reporting (%)Reporting (%)S.D.R
RCasefatality (%)
Flu wave
Chowell, Ammon, Hengartner, Hyman,J Theor Biol (2006).
Influenza pandemic in Geneva, Switzerland
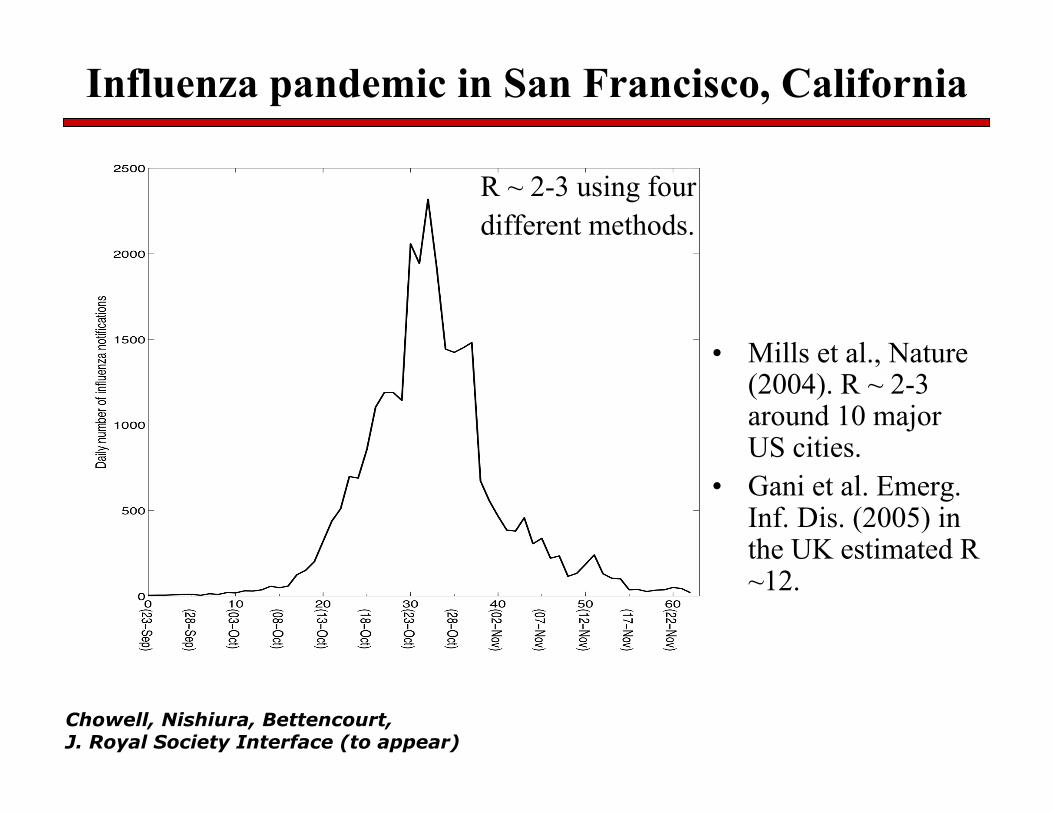
Influenza pandemic in San Francisco, California
Chowell, Nishiura, Bettencourt,J. Royal Society Interface (to appear)
• Mills et al., Nature(2004). R ~ 2-3around 10 majorUS cities.
• Gani et al. Emerg.Inf. Dis. (2005) inthe UK estimated R~12.
R ~ 2-3 using fourdifferent methods.

Conclusions
• A model that considers the effect of average infectiousness in anheterogeneous population has been introduced to explore the role ofpatient isolation and diagnostic rate in controlling a SARS outbreak.
• By examining two cases with relatively clean exponential growthcurves we are able to calibrate the SEIJR model. We then use ourSEIJR model to study the non-exponential dynamics of the TorontoOutbreak where the rapid slowing in the growth of new recognizedcases, robustly constrain the SEIJR model by requiring thatand days-1.
• The fitting of data shows that initial rates of SARS growth arequite similar in most regions leading to mean estimates of R0 1.7-1.8
05.0!l
3/1>!

• In our model "good control" means (a) at least a factor of 10reduction in l (effectiveness of isolation) and (b) simultaneously amaximum diagnostic period of 3 days. The model is sensitive tothese parameters, so they should be treated as absolutely minimalrequirements: better is better.
• The reproduction number of the Spanish Flu pandemic isapproximately twice larger than that of seasonal flu (R~R0).
• The reproduction number of the first (herald) pandemic wave isin agreement with that of seasonal flu.
Conclusions, cont’