saral gyan hidden gem - aug 2016
TRANSCRIPT

UNEXPLORED MULTIBAGGER SMALL CAP STOCKS
EQUITY RESEARCH REPORT
STERLING TOOLS LTD.
BSE CODE: 530759 NSE CODE: STERTOOLS
Industry: Fasteners CMP: Rs. 746.35 (18/09/2016)
Market Cap: 510.85 (INR in Crore) Target Price: Rs. 1400 Date: September 18, 2016 Time Period: 12 – 24 months
Saral Gyan Capital Services
An Independent Equity Research Firm www.saralgyan.in | www.saralgyan.com

HIDDEN GEMS – AUGUST 2016
- 2 - SARAL GYAN CAPITAL SERVICES
TABLE OF CONTENT
S.No Content Page No.
1. Company Background 03
2. Recent Developments 05
3. Financial Performance 07
4. Peer Group Comparison 09
5. Key Concerns / Risks 09
6. Saral Gyan Recommendation 10
7. Disclaimer 12

HIDDEN GEMS – AUGUST 2016
- 3 - SARAL GYAN CAPITAL SERVICES
1. Company Background
Sterling Tools Ltd was established in 1979 and is engaged in the manufacturing and marketing of high tensile cold forged fasteners. Over the years, the company has become one of the leading OEM suppliers in India with a client base that spans leading automotive companies in India, Europe and USA.
With the expertise of over two decades, company’s manufacturing facility today includes state-of-the-art annealing, cold forging, inline rolling, heat treatment, finishing/coating, CNC turning, centre less grinding, circular thread rolling and other secondary operations. In addition, Sterling Tools also introduced a complete range of multi station headers with automatic motorised adjustment systems that facilitate smooth and fast job changes Sterling Tools caters to all segments of the automobile industry. Two wheelers and commercial vehicle account for the largest chunk of its sales, followed by passenger vehicles and farm equipment vehicles, replacement market contribution is around 12% while export account for 3% of total sales. Sterling Tools is the largest supplier of high tensile fasteners to Honda Motorcycle and the second largest supplier to Maruti Suzuki India and Tata Motors. The company’s other customers include Ashok Leyland, Daimler, Fiat, Hero Motocorp, Mahindra & Mahindra, Volvo, Eicher, TAFE and General Motors. Company’s product portfolio includes special fasteners, standard fasteners, surface treatment and coatings, chassis fasteners and engine fasteners. Its product range includes over 2,000 types of fasteners ranging from 5mm to 24mm in diameter. The company has three manufacturing plants in Faridabad, Ballabhgarh and Haryana with a total capacity of 41,600 MT and has over 1,000 employees. The Company has one Joint Venture Company named Sterling Fabory India Pvt. Ltd.- a Joint Venture on 50:50 basis with a Netherland based Company named Fabory Masters in Fasteners Group B.V.

HIDDEN GEMS – AUGUST 2016
- 4 - SARAL GYAN CAPITAL SERVICES
Product Range: Sterling Tools product range encompasses a wide variety of fasteners as mentioned below: Special Fasteners: Special fasteners are manufactured to suit unique customer specifications. Available in a variety of surface protection coatings, these fasteners are proof of the fact that the company’s provide complete customizable solutions. Standard Fasteners: Range of standard fasteners include socket head cap screws, hexagonal head bolts, studs, hexagon nuts and weld nuts. The dual benefits of better fatigue resistance and superior strength have made these fasteners a popular choice Chassis Fasteners: Range of chassis fasteners include hub/wheel bolts, hub nuts, wheel studs, suspension bolts, propeller shaft bolts/nuts, centre bolts, track shoe bolts/nuts, rivets and two wheeler spindles/wheel axles. These are widely used in the undercarriage of automobiles and heavy earth moving equipments. Engine Fasteners: Engine fasteners include cylinder head bolts/screws, fly wheel nuts/bolts, connecting rod bolts/nuts, balance weight bolts and main bearing cap bolts. These are widely used in internal combustion engines. Manufacturing – Engineering & Testing Facilities: Company’s manufacturing facilities are all TS 16949 and ISO 14001 certified. Some of the key features of company’s manufacturing process includes Induction hardening of critical fasteners, use of sophisticated in-line hardening and tempering furnaces with auto-load, pre-wash and post-washers, and the manufacture of special fasteners with very close tolerance. Sterling Tools engineering department is led by a team of highly experienced leaders. Equipped with the latest in CAD and simulation softwares and armed with the knowledge of an extensive library, company’s engineering team is extremely competent, especially in the manufacture of precision parts. Manufacturing feedback for improving the overall machine effectiveness (O.E.E), APQP (Advanced Product Quality Planning) through cross functional teams and in-house testing facilities like the SCHATZ torque testing machine helps company to understand and meet client needs consistently. In order to ensure consistent quality of the final product, the company has harnessed the power of several high accuracy specialised instruments. These include the Contour graph, Metrology-fisher scope, Tri-roll guages for thread checking, Torque wrench, Vicker hardness tester, Eddy current tester, Spectrometer, Microscope (with image analyser), Universal tensile machine and the Charpy tester. By identifying potential problems and flaws early, company ensures that its fasteners reduce operating and replacement costs and ensure greater operating safety.

HIDDEN GEMS – AUGUST 2016
- 5 - SARAL GYAN CAPITAL SERVICES
2. Recent Developments Sterling Tools is engaged in manufacturing of high tensile cold forged fasteners used in automobiles. Thus the performance of the company is mainly dependent on the growth of automobile sector. As per Society of Indian Automobile Manufacturers (SIAM), the Indian Automotive Industry is one of the largest automotive markets in the world. The automotive industry is an engine of growth for the Indian economy, with manufacturing for domestic market as well as for export market. The Industry accounts for 7.1 per cent of the country’s Gross Domestic Product (GDP). The Two Wheelers segment with 81 per cent market share is the leader of the Indian Automobile market owing to a growing middle class and a young population. Moreover, the growing interest of the companies in exploring the rural markets further aided the growth of the sector. The overall Passenger Vehicle (PV) segment has 13 per cent market share. Over the years, the auto components/auto ancillary industry has adopted well to the changes in the policy and regulatory environment and the needs of its customers. Globally, the Auto Ancillary Industry is expected to grow at a steady pace due to the rising demand from automobile sector and huge growth potential of the manufacturing sector worldwide. SIAM has forecast a positive outlook for sales across all vehicle categories for 2016-17: According to SIAM, passenger vehicle sales are projected to grow between 6-8 percent, M&HCVs at 12-15 percent, Intermediate CVs at 7-9 percent and SCVs at 0 percent. In the two-wheeler segment, motorcycle sales are forecast to grow between 0-3 percent and scooters between 17-19 percent. Driving this growth will be the overall GDP of the country that is pitted to grow at a faster 7.9 percent during FY’17 while industry GDP would grow at 7.6 percent, a spin-off on account of the improvement in domestic demand, with support from public spending and the impact of policy reforms that would begin to show results. With normal monsoon during the year, agricultural GDP is expected to experience a faster growth pace at 4 percent on a low base placing more disposable income in the hands of the rural populace and a consequent pick-up in sales of LCVs, three-wheelers and motorcycles dependent on the rural markets. As per a Nielsen report, the general sentiment is improving and India leads in the consumer confidence index with 131 points. An improvement in the investment climate

HIDDEN GEMS – AUGUST 2016
- 6 - SARAL GYAN CAPITAL SERVICES
with FDI inflows of $39.3 billion during January-December 2015, compared to $29 billion in January-December 2014 coupled with the impetus given to public transport. Passenger Vehicles sales to see an uptick: Against this improved background, passenger vehicle sales are pitted to get a leg-up in FY’17. The 7th Pay Commission announcement of wage hikes would provide a boost to consumer spending which in turn is expected to positively impact passenger vehicles sales. This is also expected to propel the replacement of cars bought five years ago. New model launches and competitive pricing in the crossover and compact UV segments would give a further fillip to utility vehicle sales. Continued growth for M&HCVs, LCV sales to speed up: LCV demand is also expected to pick up due to improved consumption demand and ease of financing. This would be led by recovery in urban spending, lower commodity and oil prices, pay commission wage hikes, lower inflation and interest rates to stimulate demand, a normal monsoon that would drive strong agricultural freight demand during the Kharif harvest season. Sales are also expected to be advanced in Q4 FY17 due to the pan-India BS-IV implementation from April 1, 2017. As consumption expenditure picks up and availability of redistribution freight improves, non-performing assets are expected to decline easing the financing scenario by the first half of FY’17. All this would enable M&HCV sales to notch double-digit growth. The bus segment is expected to grow on the back of demand for staff and school buses as also for buses for the tourism sector. STU sales are also expected to pick up further catering to delayed replacement of over-aged vehicles. JNNURM II orders for about 2,000-2,500 buses are expected to be completed during this fiscal. Motorcycle sales, which faced a decline during FY’16, are envisioned to see mild recovery due to higher urban incomes as the domestic economy recovers. Further, the advent of a normal monsoon will give a fillip to commuter bike sales in rural India. This will considerably boost demand for mass market commuter bikes, sales of which have considerably reduced in the past 18 months. The well-performing scooter sector will continue its accelerating sales act, riding on new model launches and aggressive manufacturing capacity expansion as well as dealership expansion in semi-urban and rural areas. Three-wheeler sales are also estimated to recover with rising urbanisation and migration to cities boosting intra-city transportation. Three-wheeler manufacturers are pushing further into rural areas as small CVs try to encroach on traditional three- heeler markets.

HIDDEN GEMS – AUGUST 2016
- 7 - SARAL GYAN CAPITAL SERVICES
3. Financial Performance Sterling Tools standalone net profit rises 54.62% in the June 2016 quarter Net profit of Sterling Tools rose 54.62% to Rs 9.37 crore in the quarter ended June 2016 as against Rs 6.06 crore during the previous quarter ended June 2015. Sales rose 14.33% to Rs 94.30 crore in the quarter ended June 2016 as against Rs 82.48 crore during the previous quarter ended June 2015. Sterling Tools standalone net profit declines 1.48% in the March 2016 quarter Net profit of Sterling Tools declined 1.48% to Rs 7.33 crore in the quarter ended March 2016 as against Rs 7.44 crore during the previous quarter ended March 2015. Sales rose 9.32% to Rs 101.34 crore in the quarter ended March 2016 as against Rs 92.91 crore during the previous quarter ended March 2015. For the full year, net profit rose 33.93% to Rs 28.42 crore in the year ended March 2016 as against Rs 21.22 crore during the previous year ended March 2015. Sales rose 9.54% to Rs 364.34 crore in the year ended March 2016 as against Rs 332.62 crore during the previous year ended March 2015.
1 2 3 4 5 6
Total Sales 92.91 83.29 95.09 87.27 101.34 94.3
Net Profit 7.44 6.06 8.24 6.78 7.33 9.37
92.91
83.29
95.09
87.27
101.3494.3
7.44 6.06 8.24 6.78 7.33 9.37
0
20
40
60
80
100
120
Rs in
Cro
res
Mar 15 Jun 15 Sep 15 Dec 15 Mar 16 Jun 16
Last 6 Quarters Net Sales & Profit
HIDDEN GEMS – AUGUST 2016
- 8 - SARAL GYAN CAPITAL SERVICES
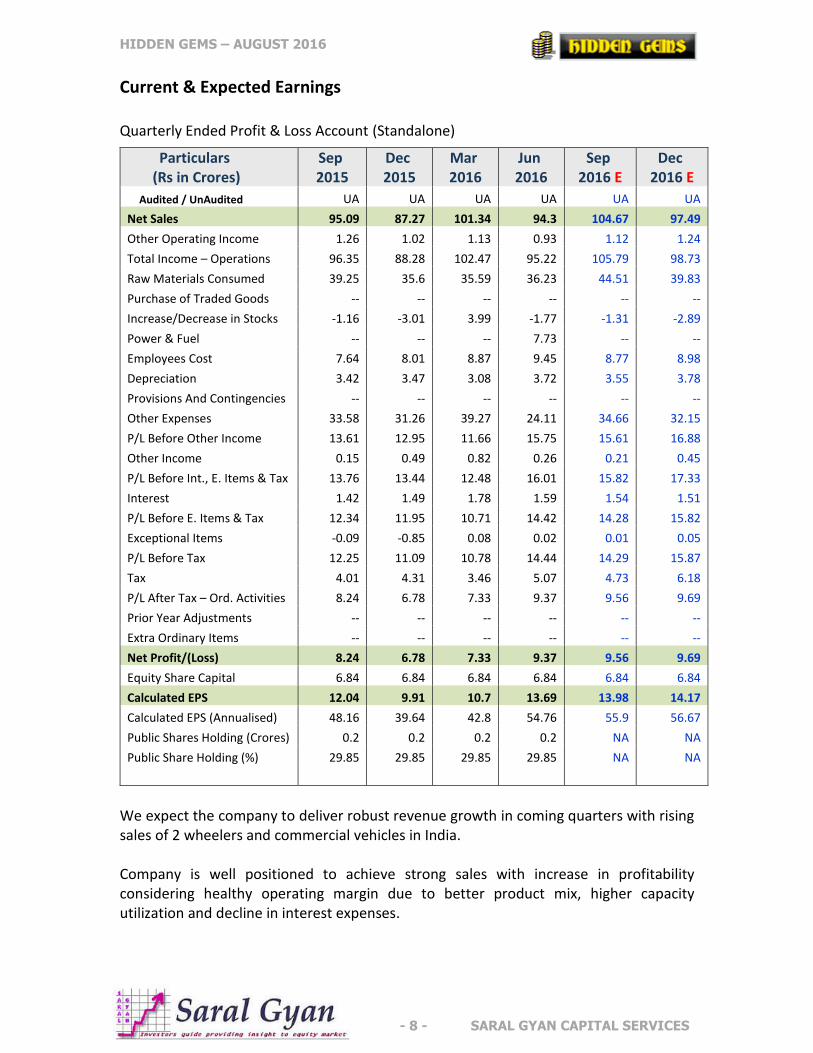
Current & Expected Earnings Quarterly Ended Profit & Loss Account (Standalone)
We expect the company to deliver robust revenue growth in coming quarters with rising sales of 2 wheelers and commercial vehicles in India. Company is well positioned to achieve strong sales with increase in profitability considering healthy operating margin due to better product mix, higher capacity utilization and decline in interest expenses.
Particulars (Rs in Crores)
Sep 2015
Dec 2015
Mar 2016
Jun 2016
Sep 2016 E
Dec 2016 E
Audited / UnAudited UA UA UA UA UA UA
Net Sales 95.09 87.27 101.34 94.3 104.67 97.49
Other Operating Income 1.26 1.02 1.13 0.93 1.12 1.24
Total Income – Operations 96.35 88.28 102.47 95.22 105.79 98.73
Raw Materials Consumed 39.25 35.6 35.59 36.23 44.51 39.83
Purchase of Traded Goods -- -- -- -- -- --
Increase/Decrease in Stocks -1.16 -3.01 3.99 -1.77 -1.31 -2.89
Power & Fuel -- -- -- 7.73 -- --
Employees Cost 7.64 8.01 8.87 9.45 8.77 8.98
Depreciation 3.42 3.47 3.08 3.72 3.55 3.78
Provisions And Contingencies -- -- -- -- -- --
Other Expenses 33.58 31.26 39.27 24.11 34.66 32.15
P/L Before Other Income 13.61 12.95 11.66 15.75 15.61 16.88
Other Income 0.15 0.49 0.82 0.26 0.21 0.45
P/L Before Int., E. Items & Tax 13.76 13.44 12.48 16.01 15.82 17.33
Interest 1.42 1.49 1.78 1.59 1.54 1.51
P/L Before E. Items & Tax 12.34 11.95 10.71 14.42 14.28 15.82
Exceptional Items -0.09 -0.85 0.08 0.02 0.01 0.05
P/L Before Tax 12.25 11.09 10.78 14.44 14.29 15.87
Tax 4.01 4.31 3.46 5.07 4.73 6.18
P/L After Tax – Ord. Activities 8.24 6.78 7.33 9.37 9.56 9.69
Prior Year Adjustments -- -- -- -- -- --
Extra Ordinary Items -- -- -- -- -- --
Net Profit/(Loss) 8.24 6.78 7.33 9.37 9.56 9.69
Equity Share Capital 6.84 6.84 6.84 6.84 6.84 6.84
Calculated EPS 12.04 9.91 10.7 13.69 13.98 14.17
Calculated EPS (Annualised) 48.16 39.64 42.8 54.76 55.9 56.67
Public Shares Holding (Crores) 0.2 0.2 0.2 0.2 NA NA
Public Share Holding (%) 29.85 29.85 29.85 29.85 NA NA

HIDDEN GEMS – AUGUST 2016
- 9 - SARAL GYAN CAPITAL SERVICES
4. Peer Group Comparison
PEER GROUP
STERLING TOOLS
SUNDRAM FASTENERS
LAKSHMI PREC. SCREWS
CMP 746.35 313.20 37.05
52 W L/H 310.00/775.00 135.00/329.00 28.65/64.00
Market Cap 510.85 6563.36 42.62
Results (in Crores) Jun-16 Jun-16 Jun-16
Net Sales 94.30 701.88 67.63
PAT 9.37 75.55 -10.70
Equity 6.84 21.01 10.94
EPS (TTM) 46.35 11.63 -16.55
P/E 16.10 26.86 0.00
Sterling Tools is trading at trailing PE multiple of 16.1 and looks attractive while comparing with valuation of peer group companies. Sundram Fasteners (larger peer with market capital of Rs. 6563 crores) is quoting at PE multiple of 26.9 on standalone basis. Moreover, Sterling Tools has better financial ratios as compared to Sundram Fasteners. Market capital to sales ratio of Sterling Tools is 1.4, whereas the same for Sundram Fasteners is 2.1
5. Key Concerns / Risks Any increase in input costs (i.e steel, iron etc) can negatively impact the operating
margins of the company.
As the company’s business is directly linked to automobile sector, downturn in automobile sector can affect business growth and profitability.

HIDDEN GEMS – AUGUST 2016
- 10 - SARAL GYAN CAPITAL SERVICES
6. Saral Gyan Recommendation
The Indian auto ancillary industry is well poised to achieve strong growth in the coming years considering the overall improvement in demand in the domestic and export markets with Indian automobile OEMs expanding presence in new geographical regions. Higher urban spending, lower commodity and oil prices, pay commission wage hikes, lower inflation and interest rates , better monsoon (which will stimulate rural demand) will lead to an overall improvement in 2 wheelers and passenger vehicles volumes in India.
Sterling Tools is one of the top 3 manufactures of fasteners in India and become a major supplier to the leaders in the automobile industry. The company caters to varied and customized demand of clients. It is a largest supplier of HT (high tensile) fasteners to Honda and second-largest supplier to Maruti Suzuki and Tata Motors. Company’s other customers include Ashok Leyland, Daimler, FIAT, Hero Motocorp, Mahindra & Mahindra, Volvo, Eicher, TAFE and General Motors.
Sterling Tools is a major supplier to Honda with almost 25% of revenues from the
company. Honda motors has doubled its market share to 27% in the last four years and continue to gain further ground in the two wheeler market in India. Honda has already launched 5 new products in 2016 and expects to register strong growth with upward sales trend during the year. We believe Sterling Tools revenue will increase in line with increasing sales of Honda two wheelers. Moreover, as company supplies to Ashok Leyland and Tata Motors as well, it will be the direct beneficiary with expected double digit growth in M&HCV segment going forward.
Sterling Tools has now become a specialty manufacturer of engine & special fasteners
and supplier of special fasteners to leading auto companies worldwide. The company has transformed itself from a manufacturer to a value chain partner on account of continuous up gradation and enhancement of process capabilities.
Company has registered sales CAGR of 9.35% and profit CAGR of 41.03% with ROE of
19.76%. Debt to Equity ratio is improved from 1.14% to 0.5% in last 5 years resulting in higher net profit margins. Working capital cycle has reduced from 84 days in FY12 to 50 Days in FY16. We expect company to continue reporting improvement in its ROE and ROCE with improvement in profitability with strong sales and better working capital management.
Key Financial Parameters Mar 2012 Mar 2013 Mar 2014 Mar 2015 Mar 2016
Return on Equity (%) 20.13 12.19 17.06 18.26 19.48
ROCE (%) 13.77 9.92 12.76 13.70 16.81
Operating Profit Margin (%) 13.09 12.94 14.15 14.04 17.10
Net Profit Margin (%) 5.04 3.85 5.18 6.19 7.69
Debt to Equity (%) 1.14 0.99 0.65 0.62 0.52
Working Capital Days 84 80 61 52 50

HIDDEN GEMS – AUGUST 2016
- 11 - SARAL GYAN CAPITAL SERVICES
To push replacement market sales, the company is focusing on increasing dealerships for its products. Currently, the company has more than 60 dealers and continuously increasing its penetration to new geographies across country to reach out to more no. the customers to further strengthen its position in replacement market.
As of Jun’16, promoter’s shareholding in the company is at 70.15% without any change in holding since last 2 years. However, promoters have increased their stake by 0.96% in last 5 years, from 69.19% in Sep’11 to 70.15% in Jun’14. The company has not pledged any shares, Institution shareholding in the company is negligible at 0.42%.
Management has rewarded shareholders by paying regular dividend since last 9 years. The company has paid total dividend of Rs. 15 for FY15-16 and dividend yield at current share price is 2%. Dividend is increased from Rs. 5 to Rs. 15 during last 5 years with healthy dividend payout of 26%.
YEAR Mar'12 Mar'13 Mar'14 Mar'15 Mar'16
EPS 21.56 15.89 22.83 31.00 41.51
Dividend / Share (In Rs) 5.00 10.00 5.00 5.00 15.00
As per our estimates, Sterling Tools can deliver PAT of 43.60 crores for full financial
year 2017-18, annualized EPS of Rs 63.74 with forward P/E ratio of 11.7X for FY17-18. Company’s valuation looks attractive considering strong balance sheet with improving financials, better return ratios and robust growth outlook of fastener industry with significant pick up expected in automobiles production in the country.
On equity of Rs. 6.84 crore, the estimated annualized EPS for FY17-18 works out to Rs. 63.74 and the Book Value per share is Rs. 208.67. At current market price of Rs. 746.35, stock price to book value is 3.58.
Considering positive outlook for fastener industry, company’s focus on expanding its reach to drive growth in replacement market, expected improvement in operating margins due to better product mix and higher capacity utilization, and company’s superior fundamentals with attractive valuations compared to peers, Saral Gyan team recommends “Buy” on Sterling Tools Ltd at current market price of Rs. 746.35 for target of Rs. 1400 over a period of 12 to 24 months. Buying Strategy:
70% at current market price of 746.35 30% at price range of 520 - 570 (in case of correction in stock price in near term)
Portfolio Allocation: 3% of your equity portfolio.

HIDDEN GEMS – AUGUST 2016
- 12 - SARAL GYAN CAPITAL SERVICES
7. Disclaimer Important Notice: Saral Gyan Capital Services is an Independent Equity Research Company.
© SARAL GYAN CAPITAL SERVICES
DISCLOSURE WITH REGARDS TO OWNERSHIP AND MATERIAL CONFLICTS OF INTEREST:
a. 'subject company' is a company on which a buy/sell/hold view or target price is given/changed in this Research Report b. Neither Saral Gyan, it's Associates, Research Analyst or his/her relative have any financial interest in the subject
company. c. Neither Saral Gyan, it's Associates, Research Analyst or his/her relative have actual/beneficial ownership of one percent
or more securities of the subject company d. Neither Saral Gyan, it's Associates, Research Analyst or his/her relative have any other material conflict of interest at
the time of publication of the research report.
DISCLOSURE WITH REGARDS TO RECEIPT OF COMPENSATION:
a. Neither Saral Gyan nor it's Associates have received any compensation from the subject company in the past twelve months.
b. Neither Saral Gyan nor it's Associates have managed or co-managed public offering of securities for the subject company in the past twelve months.
c. Neither Saral Gyan nor it's Associates have received any compensation for investment banking or merchant banking or brokerage services from the subject company in the past twelve months.
d. Neither Saral Gyan nor it's Associates have received any compensation for products or services from the subject company.
e. Neither Saral Gyan nor it's Associates have received any compensation or other benefits from the subject company or third party in connection with the research report.
GENERAL DISCLOSURES:
a. The Research Analyst has not served as an officer, director or employee of the subject company. b. Saral Gyan or the Research Analyst has not been engaged in market making activity for the subject company.
Definitions of Terms Used:
a. Buy recommendation: This means that the investor could consider buying the concerned stock at current market price keeping in mind the tenure and objective of the recommendation service.
b. Hold recommendation: This means that the investor could consider holding on to the shares of the company until further update and not buy more of the stock at current market price.
c. Buy at lower price: This means that the investor should wait for some correction in the market price so that the stock can be bought at more attractive valuations keeping in mind the tenure and the objective of the service.
d. Sell recommendation: This means that the investor could consider selling the stock at current market price keeping in mind the objective of the recommendation service.
LEGAL DISCLAIMER: Nothing published herein or on www.saralgyan.in / www.saralgyan.com should be considered as personalized investment advice. Although our employees may answer your general customer service questions, they are not licensed under laws to address your particular investment situation. No communication by our employees to you should be deemed as personalized investment advice. This document prepared by our research analysts does not constitute an offer or solicitation for the purchase or sale of any financial instrument or as an official confirmation of any transaction. It should be noted that the information contained herein is from publicly available data or other sources believed to be reliable. Neither Saral Gyan, nor any person connected with it accepts any liability arising from the use of this document. This document is prepared for assistance only and is not intended to be and must not be taken as the basis for any investment decision. The investment discussed or views expressed may not be suitable for all investors. The user assumes the entire risk of any use made of this information. The recipients of Saral Gyan material should rely on their own investigations and take their own professional advice. Each recipient of Saral Gyan should make such investigations as it deems necessary to arrive at an independent evaluation of an investment referred to in this document (including the merits and risks involved), and should consult its own advisers to determine the merits and risks of such an investment. Price and value of the investments referred to in this material may go up or down.