sarah lambart - 2016 - mygeologypagemygeologypage.ucdavis.edu/lambart/teaching/igpet-16.… · ·...
TRANSCRIPT

Sarah Lambart - 2016

Recap Lecture 14-15: Trace elements
• Less than 1% in the bulk composition • Much more sensitive to the igneous
processes • Potential tracers of the source composition

Recap Lecture 14-15: Trace elements
C0: Bulk composition CL: liquid composition F: melt fraction Bulk D = ∑DiXi
CL/C0 = 1/(F + D(1-F))
Batch Melting

Recap Lecture 14-15: Trace elements
REE diagrams • All incompatible (D<1) • Continuous variation of the degree of
incompatibility: DLREE < DMREE < DHREE <1
⇒negative slope ⇒higher slope for lower F

Recap Lecture 14-15: Trace elements
REE diagrams • All incompatible (D<1) • Continuous variation of the degree of
incompatibility: DLREE < DMREE < DHREE <1
Application to igneous processes: • Depth of melting (in the mantle):
• DEuplg >1 ⇒ negative anomaly in Eu
• DYbgt >>1 ⇒ stronger negative slope

Recap Lecture 14-15: Trace elements
REE diagrams • All incompatible (D<1) • Continuous variation of the degree of
incompatibility: DLREE < DMREE < DHREE <1
Application to igneous processes: • Depth of melting (in the mantle): • Source composition:
• D=1 ⇒ CL (magma) = C0 (source) • D=0 ⇒ C0 = F*CL • Da = Db ⇒ CL
a/CLb = C0
a/C0b

Isotopes: definition
Same # of protons (atomic number) Different # of neutrons (protons + neutrons = elemental mass)

Radioactive and Radiogenic Isotopes
Radioactive isotope
Radiogenic isotope
père fils

Radioactive and Radiogenic Isotopes
Radioactive isotope
Radiogenic & Radioactive
isotope
Radiogenic isotope
Decay chain

Isotopic systems • Used for dating
• K-Ar • Rb-Sr • Sm-Nd • U-Pb
• Used as tracers • Sm-Nd • Rb-Sr • Pb-Pb • Lu-Hf • Re-Os
Next Thursday

Example: the Rb-Sr system
• 87Rb decays to 87Sr (t1/2 = 48.8 x 10⁹ yr); both are referenced to 86Sr, which is a stable isotope
• 87Sr/86Sr ratio in present-day sample = initial ratio [(87Sr/86Sr)0], plus any radiogenic 87Sr that has formed since then
€
87Sr=87Sro+87Rbλt
λ = 1/t1/2 : decay constant

Example: the Rb-Sr system
Primitive Mantle/BSE
Crust evolution High Rb/Sr
4.55 b.y. Time -> today
Low Rb/Sr Depleted mantle evolution
melting event
Continental Crust
Mantle
€
87Sr86Sr
• DRb<0 ⇒ 87Sr/86Srcc > 87Sr/86Srmantle

Example: the Rb-Sr system
Primitive Mantle/BSE
Crust evolution High Rb/Sr
4.55 b.y. Time -> today
Low Rb/Sr Depleted mantle evolution
melting event
Mantle
€
87Sr86Sr
• DRb<0 ⇒ 87Sr/86Srcc > 87Sr/86Srmantle
DMM
o.c.
c.c.
⇒ 87Sr/86Sroc > 87Sr/86Srmantle

Ex: 147Sm → 143Nd system
DSm> 0
Fig. 9.15 in Winters
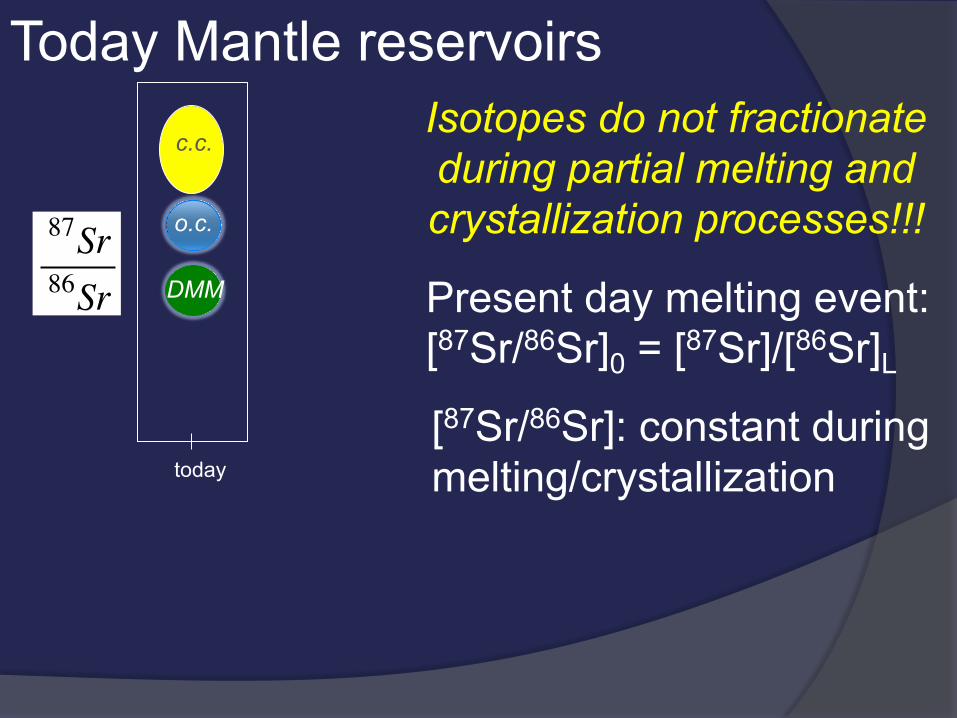
Today Mantle reservoirs Isotopes do not fractionate during partial melting and crystallization processes!!!
Present day melting event: [87Sr/86Sr]0 = [87Sr]/[86Sr]L
[87Sr/86Sr]: constant during melting/crystallization today €
87Sr86Sr DMM
o.c.
c.c.

Today Mantle reservoirs Isotopes do not fractionate during partial melting and crystallization processes!!!
Present day melting event: [143Nd/144Nd]0 = [143Nd/144Nd]L
[143Nd/144Nd]: constant during melting/crystallization today
143Nd144Nd
DMM
o.c.
c.c.

Today Mantle reservoirs
€
87Sr86Sr
DMM
o.c.
c.c.
Isotopes do not fractionate during partial melting and crystallization processes!!! 143Nd
144Nd
Today
isotopes are confined to 208Pbp/206Pbp, and theranges of isotope ratios are even greater (althoughnot dramatically so) for OIBs than MORBs. Thereis one important difference, however, namely, asignificant shift in all of these ratios betweenMORBs and OIBs. To be sure, there is extensiveoverlap between the two populations, but OIBs aresystematically more radiogenic in strontium andless radiogenic in neodymium and hafniumisotopes. In lead isotopes, OIBs overlap theMORB field completely but extend to moreextreme values in 206Pb/204Pb, 207Pb/204Pb, and208Pb/204Pb. As was true for MORBs, OIBisotopic composition can be “mapped,” andcertain oceanic islands or island groups can be
characterized by specific isotopic characteristics.Recognition of this feature has led to the well-known concept of end-member compositions or“mantle components” initially identified byWhite (1985) and subsequently labeled HIMU,PREMA, EM-1, and EM-2 by Zindler and Hart(1986). These acronyms refer to mantle sourcescharacterized by high m values (HIMU; m !(238U/204Pb)t!0), “prevalent mantle” (PREMA),“enriched mantle-1” (EM-1), and “enriched man-tle-2” (EM-2). “PREMA” has, in recent years,fallen into disuse. It has been replaced by threenew terms, namely, “FOZO” (for “focal zone,”Hart et al. (1992)), “C” (for “common” com-ponent, Hanan and Graham (1996)), or “PHEM”
Figure 15 (a) 87Sr/86Sr versus 1(Nd) for OIB (excluding island arcs). The islands or island groups selected arechosen to represent extreme isotopic compositions in isotope diagrams. They are the “type localities” for HIMU(Cook-Austral Islands and St. Helena), EM-1 (Pitcairn-Gambier and Tristan), EM-2 (Society Islands, Samoa,Marquesas), and PREMA (Hawaiian Islands and Iceland). See text for explanations of the acronyms. (b) 207Pb/204Pbversus 206Pb/204Pb for the same OIB as plotted in (a). Note that the 207Pb/204Pb ratios of St. Helena and Cook-Australs are similar but not identical, whereas they overlap completely in the other isotope diagrams. (c) 208Pb/204Pbversus 206Pb/204Pb for the same OIB as plotted in (a). (d) 206Pb/204Pb versus 87Sr/86Sr for the same OIB as plotted in(a). Note that correlations are either absent (e.g., for the EM-2 basalts from Samoa, the Society Islands andMarquesas) or point in rather different directions, a situation that is similar to the MORB data (Figure 6(a)).(e) 208Pbp/206Pbp versus 1(Nd) for the same OIB as plotted in (a). Essentially all island groups display significantnegative correlations, again roughly analogous to the MORB data. Data were assembled from the GEOROC
database (htpp://georoc.mpch-mainz.gwdg.de).
Sampling Mantle Heterogeneity through Oceanic Basalts82
OIB compilation: Hofmann, 2003

Mantle reservoirs flavors
isotopes are confined to 208Pbp/206Pbp, and theranges of isotope ratios are even greater (althoughnot dramatically so) for OIBs than MORBs. Thereis one important difference, however, namely, asignificant shift in all of these ratios betweenMORBs and OIBs. To be sure, there is extensiveoverlap between the two populations, but OIBs aresystematically more radiogenic in strontium andless radiogenic in neodymium and hafniumisotopes. In lead isotopes, OIBs overlap theMORB field completely but extend to moreextreme values in 206Pb/204Pb, 207Pb/204Pb, and208Pb/204Pb. As was true for MORBs, OIBisotopic composition can be “mapped,” andcertain oceanic islands or island groups can be
characterized by specific isotopic characteristics.Recognition of this feature has led to the well-known concept of end-member compositions or“mantle components” initially identified byWhite (1985) and subsequently labeled HIMU,PREMA, EM-1, and EM-2 by Zindler and Hart(1986). These acronyms refer to mantle sourcescharacterized by high m values (HIMU; m !(238U/204Pb)t!0), “prevalent mantle” (PREMA),“enriched mantle-1” (EM-1), and “enriched man-tle-2” (EM-2). “PREMA” has, in recent years,fallen into disuse. It has been replaced by threenew terms, namely, “FOZO” (for “focal zone,”Hart et al. (1992)), “C” (for “common” com-ponent, Hanan and Graham (1996)), or “PHEM”
Figure 15 (a) 87Sr/86Sr versus 1(Nd) for OIB (excluding island arcs). The islands or island groups selected arechosen to represent extreme isotopic compositions in isotope diagrams. They are the “type localities” for HIMU(Cook-Austral Islands and St. Helena), EM-1 (Pitcairn-Gambier and Tristan), EM-2 (Society Islands, Samoa,Marquesas), and PREMA (Hawaiian Islands and Iceland). See text for explanations of the acronyms. (b) 207Pb/204Pbversus 206Pb/204Pb for the same OIB as plotted in (a). Note that the 207Pb/204Pb ratios of St. Helena and Cook-Australs are similar but not identical, whereas they overlap completely in the other isotope diagrams. (c) 208Pb/204Pbversus 206Pb/204Pb for the same OIB as plotted in (a). (d) 206Pb/204Pb versus 87Sr/86Sr for the same OIB as plotted in(a). Note that correlations are either absent (e.g., for the EM-2 basalts from Samoa, the Society Islands andMarquesas) or point in rather different directions, a situation that is similar to the MORB data (Figure 6(a)).(e) 208Pbp/206Pbp versus 1(Nd) for the same OIB as plotted in (a). Essentially all island groups display significantnegative correlations, again roughly analogous to the MORB data. Data were assembled from the GEOROC
database (htpp://georoc.mpch-mainz.gwdg.de).
Sampling Mantle Heterogeneity through Oceanic Basalts82
OIB compilation: Hofmann, 2003
Isotopically enriched reservoirs (EM-1, EM-2, and HIMU): too enriched for mantle ⇒ crustal rocks and/or sediments
• HIMU – (enriched in 206Pb/204Pb, 207Pb/204Pb, 208Pb/204Pb, depleted in 87Sr/86Sr) Origin: a) recycled oceanic crust, which has lost alkalis (Rb) during alteration and subduction b) metasomatically enriched oceanic lithosphere • EM-1 (slightly enriched in 87Sr/86Sr, but not in Pb, very low 143Nd/143Nd) Origin: a) recycling of delaminated subcontinental lithosphere b) recycling of subducted ancient pelagic sediment • EM-2 (more enriched, especially in 87Sr/86Sr and radiogenic Pb Origin: a) recycled ocean crust and small amount of subducted sediment b) recycling of melt-impregnated oceanic lithosphere

Oceanic basalts
Chapter 10