sara m. anis spectrophotometric, atomic … no3... · figure 2. conductometric titration curve of...
TRANSCRIPT
Available on line at
Association of the Chemical Engineers of Serbia AChE www.ache.org.rs/CICEQ
Chem. Ind. Chem. Eng. Q. 17 (3) 269−282 (2011) CI&CEQ
269
SARA M. ANIS
MERVAT M. HOSNY HISHAM E. ABDELLATEF
MOHAMED N. EL-BALKINY
Analytical Chemistry Department, Faculty of Pharmacy, Zagazig
University, Zagazig, Egypt
SCIENTIFIC PAPER
UDC 661’8038:546:543.422.3
DOI 10.2298/CICEQ101206012A
SPECTROPHOTOMETRIC, ATOMIC ABSORPTION AND CONDUCTOMETRIC ANALYSIS OF TRAMADOL HYDROCHLORIDE
Six simple and sensitive spectroscopic and conductometric procedures (A-F) were developed for the determination of tramadol hydrochloride. Methods A, B and C are based on the reaction of cobalt (II) thiocyanate with tramadol to form a stable ternary complex, which could be measured by spectrophotometric (method A), atomic absorption (method B) or conductometric (method C) pro-cedures. Methods D and E depend on the reaction of molybdenum thiocyanate with tramadol to form a stable ternary complex, measured by spectrophoto-metric means (method D) or by atomic absorption procedures (method E), while method F depends on the formation of an ion pair complex between the studied drug and bromothymol blue which is extractable into methylene chlo-ride. Tramadol hydrochloride could be assayed in the range of 80-560 and 40-–220 μg ml-1, 1-15 mg ml-1 and 2.5-22.5, 1.25-11.25 and 5-22 μg ml-1 using me-thods A,B,C,D,E and F, respectively. Various experimental conditions were studied. The results obtained showed good recoveries. The proposed procedu-res were applied successfully to the analysis of tramadol in its pharmaceutical preparations and the results were favorably comparable with the official method. Key words: cobalt thiocyanate; molybdenum thiocyanate; bromothymol blue; spectrophotometry; conductometry.
Tramadol ((±)-trans-2-(dimethylaminomethyl)-1- -(3-methoxyphenyl)-cyclohexanol hydrochloride) is an opoid analgesic used for moderate to severe pain[1]. Different methods for the analysis of the selected drug have been reviewed. The BP [2] specifies non- -aqueous titration technique detecting the end point potentiometrically for its determination. The literature reveals several methods for the determination of the mentioned drug in biological fluids and in pharmaceu-tical preparations. Among these methods are spectro-photometry [3-5], HPLC [6-8], GC [9], LC-MS/MS [10], capillary electrophoresis [11], voltammetry [12] and potentiometry [13-18].
An inspection of the previous methods for the determination of the cited drug revealed that only a few spectrophotometric ones have been reported. Al-though atomic absorption spectrometry (AAS) is a ra-pid technique and has a low detection limit, it has not
Correspondening author: H.E. Abdellatef, Analytical Chemistry Department, Faculty of Pharmacy, Zagazig University, Zagazig, Egypt. E-mail: [email protected] Paper received: 6 December, 2010 Paper revised: 16 February, 2011 Paper accepted: 23 March, 2011
been yet applied to the determination of tramadol, the same case being with the conductometric procedures which proved to be simple, sensitive, reliable, very convenient and simple procedures.
Cobalt(II) thiocyanate reacts with tramadol to form a stable ternary complex extractable with me-thylene chloride. The complex was determined either spectrophotometrically (method A) by measuring the greenish blue extractable color at 625 nm or by ato-mic absorption spectrometry (method B) indirectly using the aqueous acidic extract of the combined co-balt(II) in the ternary complex or by measuring the change in the conductance (method C) following the titration of tramadol with cobalt(II) thiocyanate. Similar procedures using molybdenum thiocyanate were ap-plied for determining tramadol either by spectrophoto-metric means (method D) or by atomic absorption spectrometry (method E), while method F depends on the reaction of bromothymol blue with tramadol at pH 3.7 to form a stable ion association complex extrac-table with methylene chloride, the complex has maxi-mum absorbance at 411 nm.
S.M. ANIS et al.: SPECTROPHOTOMETRIC, ATOMIC ABSORPTION… CI&CEQ 17 (3) 269−282 (2011)
270
EXPERIMENTAL
Apparatus
Shimadzu UV-260 double beam recording spec-trometer with a 1 cm cell holder; Shimadzu atomic absorption flame spectrophotometer model AA-640-13; conductometer model CM-1K, Tokyo TOA electronics Ltd., Japan; Chemocadet pH meter.
Materials and reagents
All materials and reagent used were of analytical grade, solvents were of spectroscopic grade and bi-distilled water was used. Tramadol hydrochloride pure drug and tramal capsules (labelled to contain 50 mg tramadol hydrochloride per capsule) were obtained from Minapharm, Egypt, under licence of Grunenthal, Germany. Tetrathiocyanato cobalt(II) solution (1), pre-pared by dissolving 56.25 g of NH4SCN and 13.80 g of CoCl2⋅6H2O in water to give 100 ml of the solution [19]. 2.5×10⁻² M tetrathiocyanato cobalt(II) solution (2) prepared by dissolving 0.025 mol of cobalt, as CoCl2⋅6H2O and the required amount of ammonium thiocyanate (0.1 mol), in 100 ml bidistilled water. Sodium molybdate (Fluka AG, Switzerland), 10-2 M solution, prepared by dissolving 0.2419 gm in 100 ml bi-distilled water. Ascorbic acid (El-Nasr pharm. Chem. Co., Egypt) prepared as 10% w/v solution in bi-dis-tilled water. Ammonium thiocyanate (Belami Fine Chem., India), prepared as 10% w/v solution in bi-dis-tilled water. Bromothymol blue (BDH Chemicals Ltd., Poole, England) was prepared as 0.05% solution in bidistilled water. Acetate buffer, pH 3.7 was prepared
by dissolving 10 g of anhydrous sodium acetate in 300 ml water, adjusting pH to 3.7 with glacial acetic acid and diluting to 1000 ml with water. If necessary, pH was readjusted to the value of 3.7 with glacial acetic acid or anhydrous sodium acetate as required before use [2].
Standard drug solutions
Aqueous solution of 0.1 and 4 mg ml-1 tramadol hydrochloride was prepared by dissolving 10 and 400 mg of the pure drug in 100 ml distilled water, respec-tively. Working solutions of lower concentrations were prepared by appropriate dilution of the standard so-lutions.
Construction of calibration curves
Spectrophotometric procedures (method A)
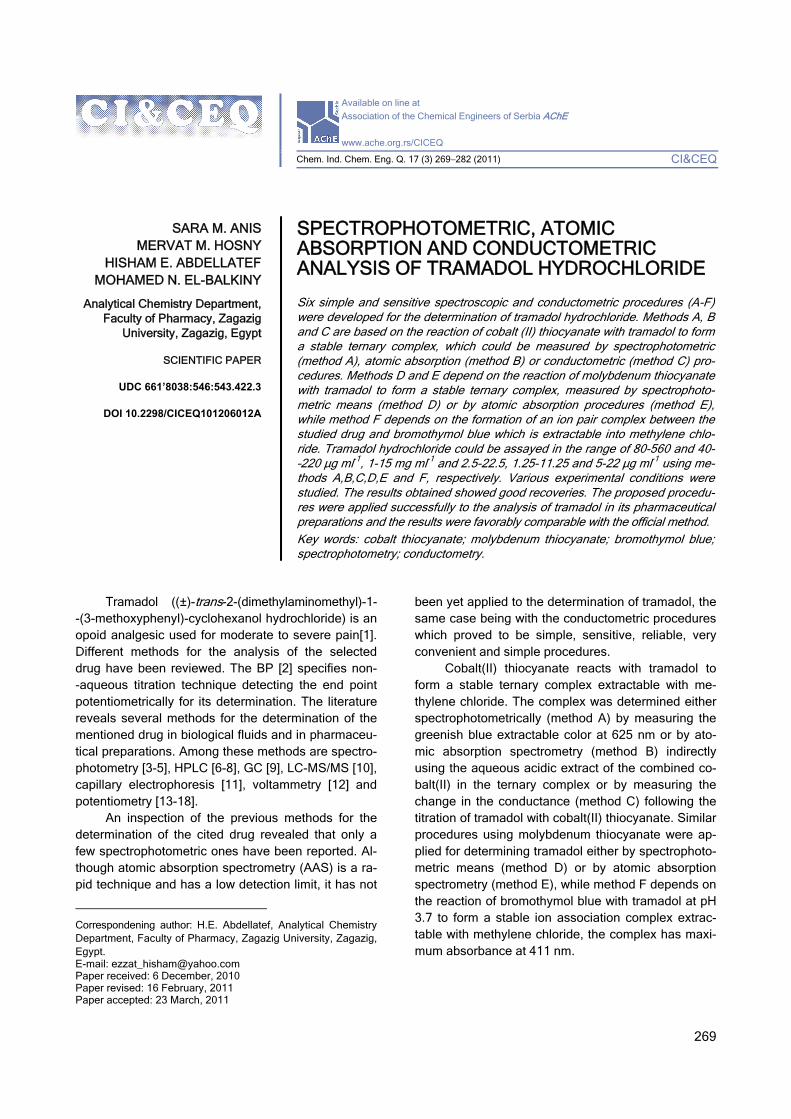
Into 125 ml separating funnels, transfer aliquots containing 0.8-5.6 mg of tramadol drug solution, add 3 ml of cobalt thiocyanate (solution 1), mix, extract the aqueous solution with an equal volume of methylene chloride and shake for 45 s, then allow the mixture to separate into two phases. Collect the organic layer and dry with anhydrous sodium sulfate, complete to 10 ml with methylene chloride, measure the absor-bance of the extracts at 625 nm, against a reagent blank prepared according to the same treatment (Fi-gure 1).
Atomic absorption spectrometric procedures (method B)
Procedures were performed the same as for the spectrophotometric method as far as “complete to 10 ml with methylene chloride”. The organic layer was
-0.05
0.1
0.25
0.4
0.55
0.7
550 600 650 700
Wavelength (nm)
Ab
sorb
ance
Figure 1. Absorption Spectra of the ternary complex formed through reaction of: 400 μg ml-1 tramadol HCl with cobalt thiocyante (),400 μg ml-1 tramadol HCl with cobalt chloride (), 400 μg ml-1 tramadol HCl with ammonium thiocyanate () and blank solution ().
S.M. ANIS et al.: SPECTROPHOTOMETRIC, ATOMIC ABSORPTION… CI&CEQ 17 (3) 269−282 (2011)
271
evaporated to dryness, the residue was dissolved in 1 ml 1N HCl and the volume was completed to 10 ml with bidistilled water. Aspirate in a suitable atomic ab-sorption spectrometer under the following conditions: analysis line wavelength: 2407 Å, lamp current: 9 mA, slit width: 1.9 Å, burner height: 6 mm, burner slot/ /flame: 10 cm (air-C2H2), support gas flow: 10 l min-1, fuel gas flow: 2.5 l min-1 and absorption sensitivity: 0.16 ppm.
The concentration of the consumed cobalt was calculated from calibration graph of standard cobalt chloride solution.
Conductometric procedures (method C)
Transfer-suitable aliquot of sample solution con-taining 1-15 mg of drug to a 50 ml calibrated flask and make up to the mark with bi-distilled water. Transfer the contents of the calibrated flask to a beaker and immerse the conductivity cell. Titrate using 2.5×10⁻² M cobalt thiocyanate (solution 2). Measure the conduc-tance subsequent to each addition of reagent solution and after thorough stirring for two minutes, correct it for dilution effects [20] by means of the following equa-tion, assuming that conductivity is a linear function of dilution:
Ω−1correct = Ω−1
obs((v1+v2)/v1)
where Ω–1obs is the observed electrolytic conductivity,
v1 is the initial volume and v2 is the volume of reagent added.
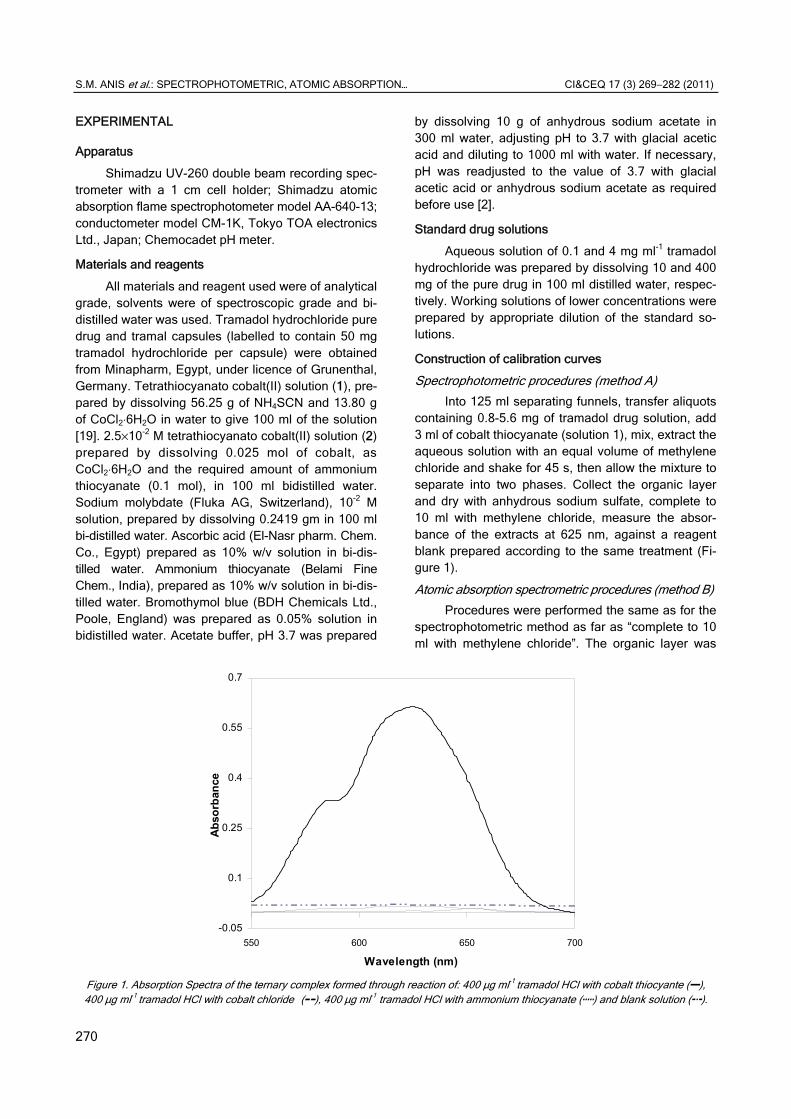
Construct a graph of corrected conductivity ver-sus the volume of added titrant and determine the end-point (Figure 2).
Spectrophotometric procedures (method D)
Into 125 ml separating funnels mix 2 ml of 10-2 M sodium molybdate solution, 1 ml of 5 M HCl, 0.5 ml of 10% NH4SCN and 0.5 ml of 10% ascorbic acid, and allow the mixture to stand for 10 min at room tempe-rature (20±5 °C). Add aliquots containing 0.025-0.225 mg of tramadol drug solution to the mixture, and stand for another 5 min, extract the formed complex with an equal volume of methylene chloride and shake for 75 s, allow the mixture to separate into two phases.
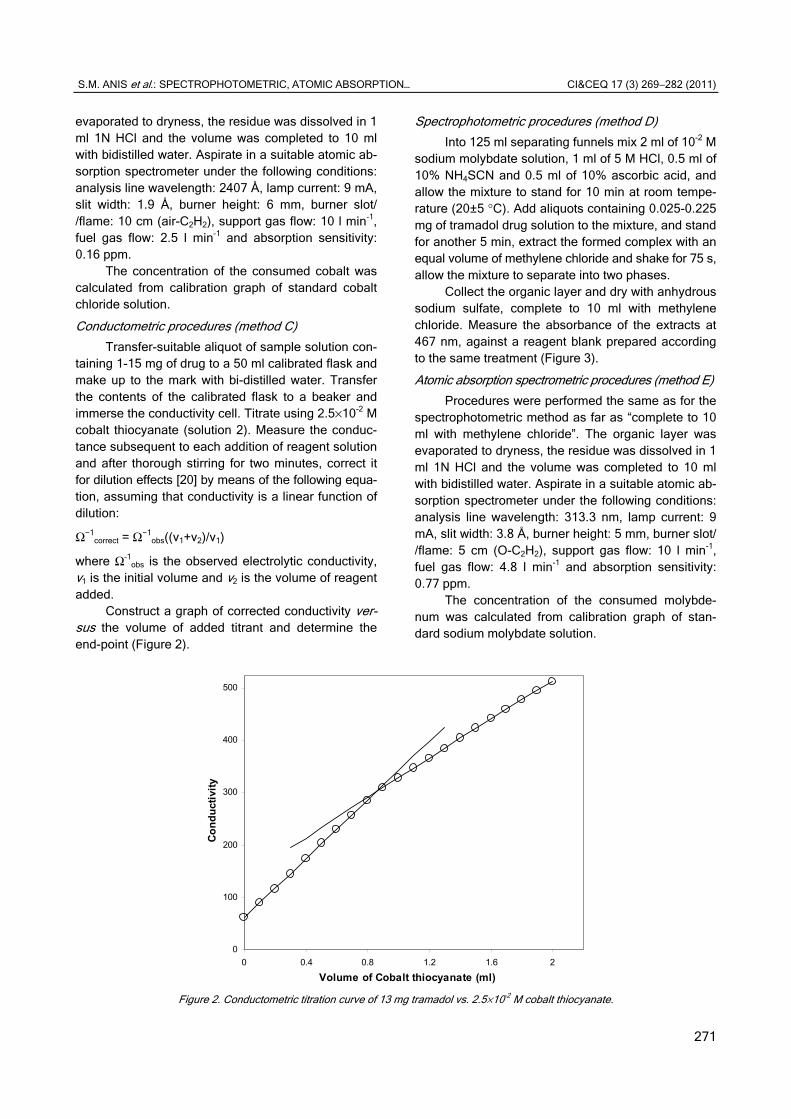
Collect the organic layer and dry with anhydrous sodium sulfate, complete to 10 ml with methylene chloride. Measure the absorbance of the extracts at 467 nm, against a reagent blank prepared according to the same treatment (Figure 3).
Atomic absorption spectrometric procedures (method E)
Procedures were performed the same as for the spectrophotometric method as far as “complete to 10 ml with methylene chloride”. The organic layer was evaporated to dryness, the residue was dissolved in 1 ml 1N HCl and the volume was completed to 10 ml with bidistilled water. Aspirate in a suitable atomic ab-sorption spectrometer under the following conditions: analysis line wavelength: 313.3 nm, lamp current: 9 mA, slit width: 3.8 Å, burner height: 5 mm, burner slot/ /flame: 5 cm (O-C2H2), support gas flow: 10 l min-1, fuel gas flow: 4.8 l min-1 and absorption sensitivity: 0.77 ppm.
The concentration of the consumed molybde-num was calculated from calibration graph of stan-dard sodium molybdate solution.
0
100
200
300
400
500
0 0.4 0.8 1.2 1.6 2
Volume of Cobalt thiocyanate (ml)
Co
nd
uct
ivit
y
Figure 2. Conductometric titration curve of 13 mg tramadol vs. 2.5×10⁻² M cobalt thiocyanate.
S.M. ANIS et al.: SPECTROPHOTOMETRIC, ATOMIC ABSORPTION… CI&CEQ 17 (3) 269−282 (2011)
272
Ion pair procedures using bromothymol blue (method F)
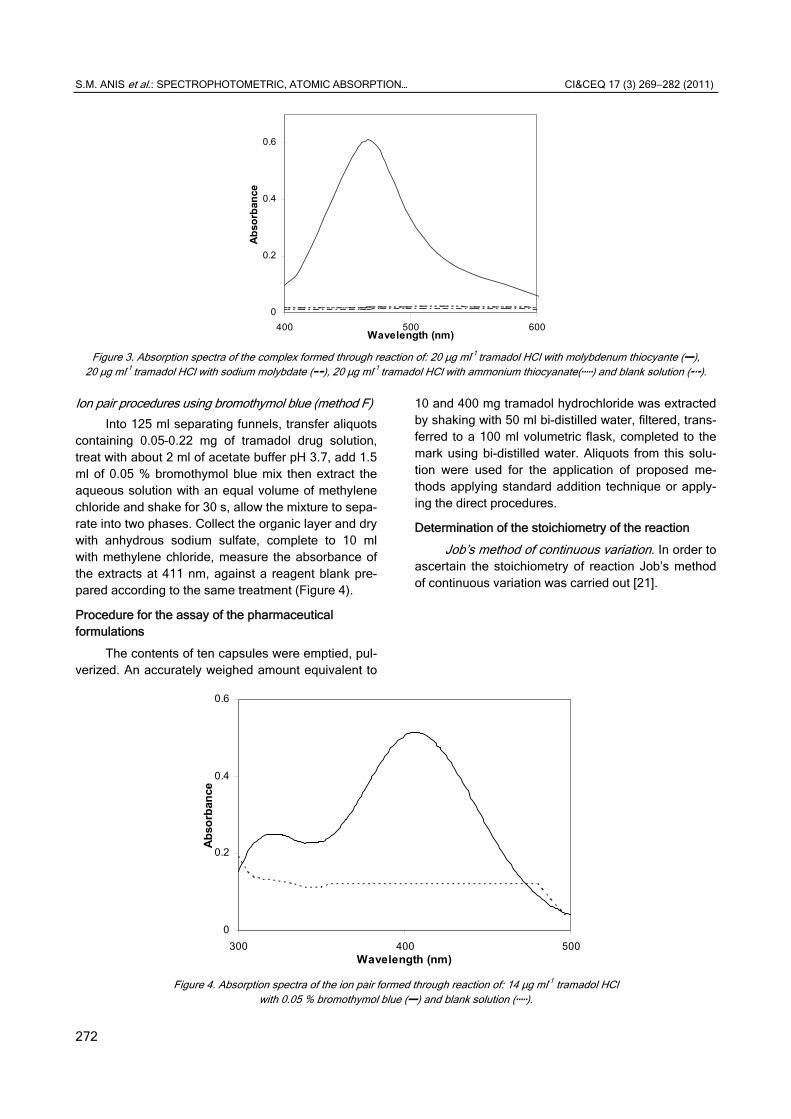
Into 125 ml separating funnels, transfer aliquots containing 0.05–0.22 mg of tramadol drug solution, treat with about 2 ml of acetate buffer pH 3.7, add 1.5 ml of 0.05 % bromothymol blue mix then extract the aqueous solution with an equal volume of methylene chloride and shake for 30 s, allow the mixture to sepa-rate into two phases. Collect the organic layer and dry with anhydrous sodium sulfate, complete to 10 ml with methylene chloride, measure the absorbance of the extracts at 411 nm, against a reagent blank pre-pared according to the same treatment (Figure 4).
Procedure for the assay of the pharmaceutical formulations
The contents of ten capsules were emptied, pul-verized. An accurately weighed amount equivalent to
10 and 400 mg tramadol hydrochloride was extracted by shaking with 50 ml bi-distilled water, filtered, trans-ferred to a 100 ml volumetric flask, completed to the mark using bi-distilled water. Aliquots from this solu-tion were used for the application of proposed me-thods applying standard addition technique or apply-ing the direct procedures.
Determination of the stoichiometry of the reaction
Job’s method of continuous variation. In order to ascertain the stoichiometry of reaction Job’s method of continuous variation was carried out [21].
0
0.2
0.4
0.6
400 500 600Wavelength (nm)
Ab
sorb
ance
Figure 3. Absorption spectra of the complex formed through reaction of: 20 μg ml-1 tramadol HCl with molybdenum thiocyante (), 20 μg ml-1 tramadol HCl with sodium molybdate (), 20 μg ml-1 tramadol HCl with ammonium thiocyanate() and blank solution ().
0
0.2
0.4
0.6
300 400 500Wavelength (nm)
Ab
sorb
ance
Figure 4. Absorption spectra of the ion pair formed through reaction of: 14 μg ml-1 tramadol HCl with 0.05 % bromothymol blue () and blank solution ().

S.M. ANIS et al.: SPECTROPHOTOMETRIC, ATOMIC ABSORPTION… CI&CEQ 17 (3) 269−282 (2011)
273
RESULTS AND DISCUSSION
Spectrophotometric procedures using cobalt thiocyanate (method A)
Ternary complexes have been widely used in spectrophotometric analysis of many pharmaceutical compounds [22-24]. In this work, the formed ternary complex consists of the studied drug tramadol hydro-chloride as the main ligand, thiocyanate as the se-cond ligand and the metal ions, cobalt(II). This triple complex is extractable with methylene chloride with absorption maximum at 625 nm, whereas the binary systems (metal/drug), (metal/thiocyanate) and (drug/ /thiocyanate) have no absorbance in the visible region (Figure 1). The effects of the reagent concentrations, pH, extraction time, organic solvent type and aqueous to organic phase ratio with respect to maximum sen-sitivity, adherence to Beer’s law and stability, have been studied through control experiments. The opti-mum conditions were established by varying one va-riable at a time and observing its effect on the absor-bance of colored species.
Effect of cobalt thiocyanate concentration
A high concentration of [Co(SCN)4]-2 was neces-
sary for quantitative complex formation, 3 ml of cobalt thiocyanate (solution 1), was found sufficient for tra-madol, more than this optimal concentration would decrease the absorbance of the ternary complex (Figure 5).
Effect of buffer pH
Variation of the pH of the aqueous phase in the range from 2-11, had no effect on the intensity of the absorbance of the complex.
Effect of extraction time and times of extractions
It was found that a single extraction of the ter-nary complex for 45 s was sufficient for quantitative extraction (Figure 6).
Effect of organic solvent type
Chloroform, methylene chloride, diethyl ether and benzene were all tried. Methylene chloride was found to be most convenient solvent as it gave the best results and the results were stable.
0.35
0.45
0.55
0.65
0 1 2 3 4 5Reagent Volume
Ab
sorb
ance
Figure 5. Effect of volume of cobalt thiocyanate (solution 1) on the reaction of cobalt thiocyanate with 400 μg ml-1 tramadol.
0.3
0.5
0.7
20 40 60 80Extraction time (sec)
Ab
so
rba
nc
e
Figure 6. Effect of extraction time on the reaction of cobalt thiocyanate with 400 μg ml-1 tramadol.
S.M. ANIS et al.: SPECTROPHOTOMETRIC, ATOMIC ABSORPTION… CI&CEQ 17 (3) 269−282 (2011)
274
Effect of aqueous to organic phase ratio
Varying the ratio from 2:1 to 1:2 did not cause any reasonable change in the results so an 1:1 ratio was used.
Atomic absorption procedures using cobalt thiocyanate (method B)
It was not practical to aspirate the organic sol-vent of the ternary complex in the atomic absorption spectrometer, because the high chlorine/carbon ratio would lead to the formation of a large quantity of HCl in the flame, which would damage the instrument [25- -26]. It was better to extract the ternary complex with an organic solvent (methylene chloride), evaporate, and then dissolve the ternary complex residue with HCl, which could be aspirated directly in the atomic absorption spectrometer. The effects of the reagent concentrations (cobalt thiocyanate, solution 1), pH, extraction time, solvents with respect to maximum sensitivity, minimum blank and adherence to Beer’s law have been studied through control experiments. The optimum conditions were established by varying one variable and observing its effect on the absor-bance of metal ion. It was found that the optimum experimental conditions were the same as in the ex-tractive spectrophotometric procedures and incorpo-rated into the general procedures.
Conductometric procedures using cobalt thiocyanate (method C)
Conductometric analysis can be used in many titration procedures when ionic solutions are involved. As the conductance of a solution is related to the total ionic content, it can be applied to follow reactions that result in a change in this quantity. Conductance mea-surements are used successfully in quantitative titra-tion of systems in which the conductance of the solu-tion varies before and after the equivalence point.
In these cases, the titration curve can be repre-sented by two lines intersecting at the end point.
Investigations were carried out to establish the most favorable conditions for the ion associates for-mation of tramadol with cobalt thiocyanate to achieve sharp end point. The influence of some variables on the reaction has been tested as follow. The optimum conditions for performing the titration in a quantitative manner were elucidated as described below.
Titrations in different media were attempted to obtain the best results. Preliminary experiments in: i) aqueous drug solution with aqueous reagent solution, ii) ethanol drug solution with ethanol reagent solution, iii) drug solution with reagent solution, both in ethanol– –water (50%, v/v) mixture, iv) methanol drug solution with methanol reagent solution, v) drug solution with
reagent solution, both in methanol–water (50%, v/v) mixture, vi) acetone drug solution with acetone re-agent solution and vii) drug solution with reagent so-lution, both in acetone–water (50%, v/v) mixture.
Preliminary experiments showed that procedure in aqueous media was the most suitable for success-ful results, because in other procedures a turbid solu-tion was formed which, causing some errors.
Reagent’s concentration. Different concentra-tions of cobalt thiocyanate solution were tried ranging from 2×10⁻¹ to 5×10⁻³ M solution. The optimum con-centration of the reagent was 2.5×10⁻² M in titration of the studied drug to achieve a constant and highly stable conductance reading within 1-2 min of mixing. Concentrations lower than these limits led to unstable readings and more time was needed to obtain cons-tant conductance values.
The representative titration curve is shown in Figure 2. Two straight lines are obtained, intersecting at the end-point, the first branch ascending the se-cond one.
The conductance measured before the addition of the titrant (volume of NH4[Co(SCN)4] equals zero) is related to the slight dissociation of the drug cations and chloride ions. Up to the equivalence point, the tit-ration involves the gradual dissociation of the proto-nated cation drug as a result of the formation of ion-pair in the solution releasing Cl- into the medium. This increase of the conductance is due to the mobility of Cl-, causing an increase in the slope of the conducto-metric curve (first branch of the curve). After the equi-valence point, the measured conductance is mainly due to NH4
+ present in the solution. As the mobility of those ions is smaller than that of Cl-, there is a de-crease in the slope of the second section of the tit-ration curve. The equivalence point is defined as the point of intersection of the two straight segments.
The shape of the titration curve depends on all the species present during the titration process and other factors such as viscosity, dielectric constant, solvation, ion-pair association and proton transfer.
The conductometric titrations of different volu-mes of 2.5×10⁻² M cobalt thiocyanate solution was performed. The results show an obvious maximum in the conductance curve at drug-reagent molar ratio of 2:1. The reactions may be represented by the equa-tion:
2TRM⋅HCl + (NH4)2[Co(SCN)4] → → (TRM)2⋅[Co(SCN)4] + 2NH4
+ + 2Cl-
The optimum concentration ranges for determi-nation of tramadol was in the range of 1-15 mg. At such range, distinct inflections (Figure 2) and stable conductance reading were obtained.
S.M. ANIS et al.: SPECTROPHOTOMETRIC, ATOMIC ABSORPTION… CI&CEQ 17 (3) 269−282 (2011)
275
Spectrophotometric procedures using molybdenum thiocyanate (method D)
Molybdenum(V) formed by the reduction of mo-lybdenum(VI) by ascorbic acid or by thiocyanate in presence of 5 M hydrochloric acid, it then combines with ammonium– thiocyanate to form a red binary mo-lybdenum(V)–thiocyanate complex, the complex is non-extractable with methylene chloride:
Ascorbic, 5 M HCl 6SCN6Mo(VI) Mo(V) [Mo(SCN) ]
− −⎯⎯⎯⎯⎯⎯⎯→ ⎯⎯⎯⎯→
Upon addition of the investigated drug solution, an orange red complex is formed and extractable with methylene chloride, and had an absorption maximum at 467 nm against a reagent blank.
Effect of acidity. The formation of a ternary com-plex was only achieved in acidic medium, the com-plex was not formed in acetic or perchloric acid me-dium, but it was formed in hydrochloric, sulphuric or nitric acids medium. 1 ml of 5 M HCl was sufficient for maximum absorbance and the formation of Mo(V)– –thiocyanate-drug complex.
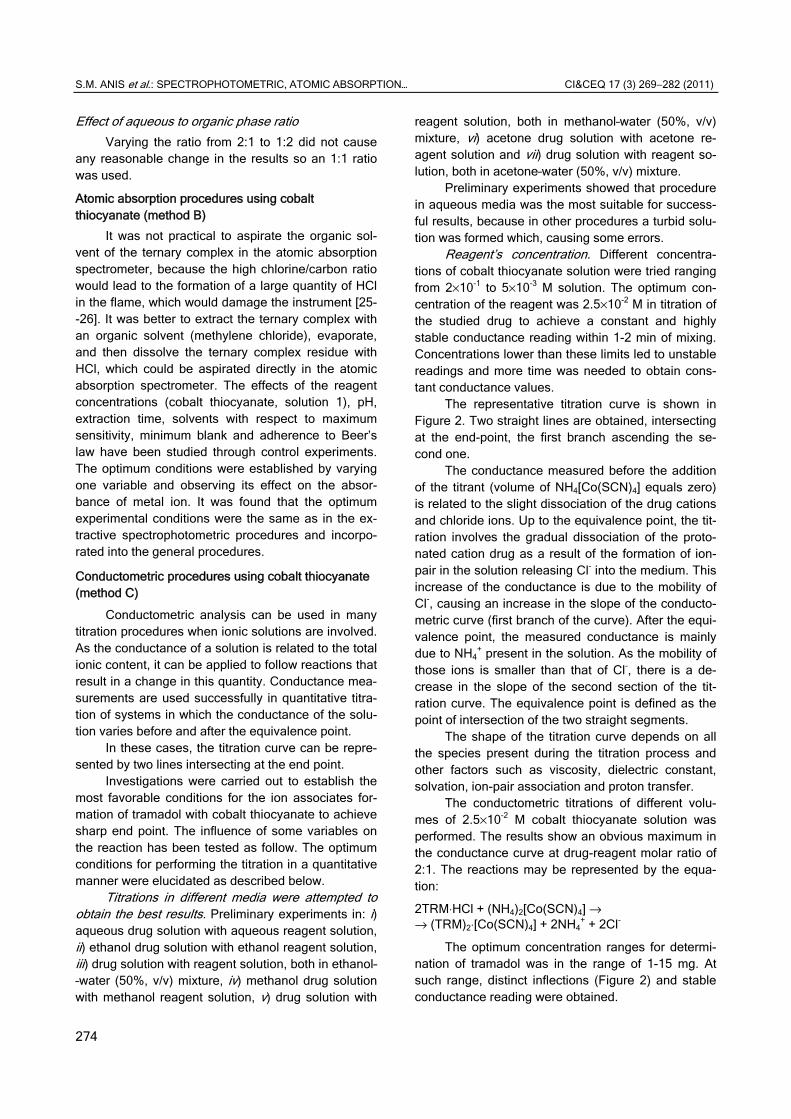
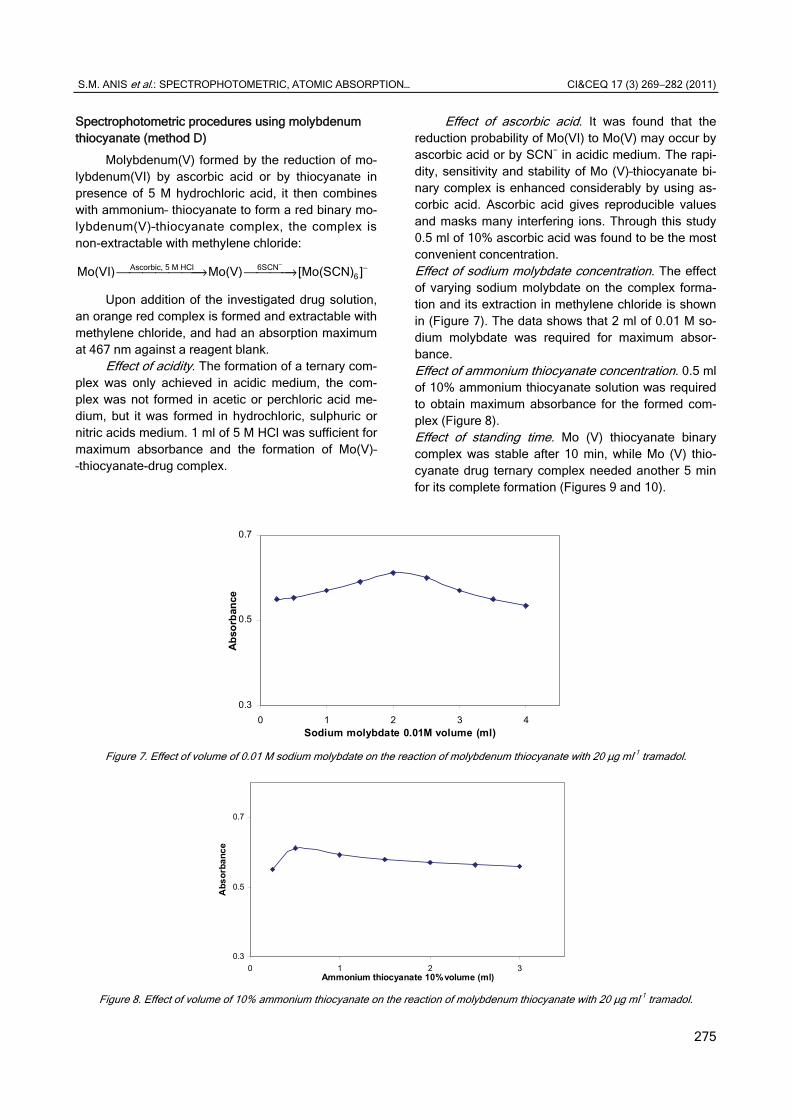
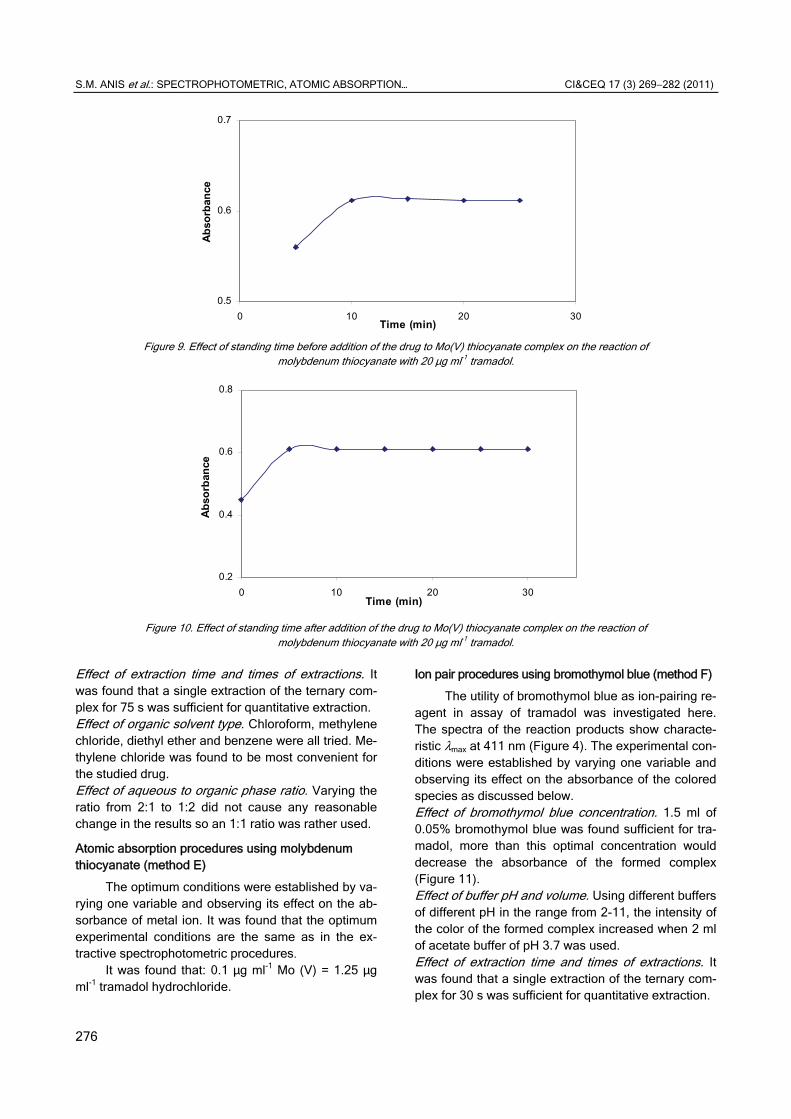
Effect of ascorbic acid. It was found that the reduction probability of Mo(VI) to Mo(V) may occur by ascorbic acid or by SCN− in acidic medium. The rapi-dity, sensitivity and stability of Mo (V)–thiocyanate bi-nary complex is enhanced considerably by using as-corbic acid. Ascorbic acid gives reproducible values and masks many interfering ions. Through this study 0.5 ml of 10% ascorbic acid was found to be the most convenient concentration. Effect of sodium molybdate concentration. The effect of varying sodium molybdate on the complex forma-tion and its extraction in methylene chloride is shown in (Figure 7). The data shows that 2 ml of 0.01 M so-dium molybdate was required for maximum absor-bance. Effect of ammonium thiocyanate concentration. 0.5 ml of 10% ammonium thiocyanate solution was required to obtain maximum absorbance for the formed com-plex (Figure 8). Effect of standing time. Mo (V) thiocyanate binary complex was stable after 10 min, while Mo (V) thio-cyanate drug ternary complex needed another 5 min for its complete formation (Figures 9 and 10).
0.3
0.5
0.7
0 1 2 3 4Sodium molybdate 0.01M volume (ml)
Ab
sorb
ance
Figure 7. Effect of volume of 0.01 M sodium molybdate on the reaction of molybdenum thiocyanate with 20 μg ml-1 tramadol.
0.3
0.5
0.7
0 1 2 3Ammonium thiocyanate 10% volume (ml)
Ab
so
rba
nc
e
Figure 8. Effect of volume of 10% ammonium thiocyanate on the reaction of molybdenum thiocyanate with 20 μg ml-1 tramadol.
S.M. ANIS et al.: SPECTROPHOTOMETRIC, ATOMIC ABSORPTION… CI&CEQ 17 (3) 269−282 (2011)
276
Effect of extraction time and times of extractions. It was found that a single extraction of the ternary com-plex for 75 s was sufficient for quantitative extraction. Effect of organic solvent type. Chloroform, methylene chloride, diethyl ether and benzene were all tried. Me-thylene chloride was found to be most convenient for the studied drug. Effect of aqueous to organic phase ratio. Varying the ratio from 2:1 to 1:2 did not cause any reasonable change in the results so an 1:1 ratio was rather used.
Atomic absorption procedures using molybdenum thiocyanate (method E)
The optimum conditions were established by va-rying one variable and observing its effect on the ab-sorbance of metal ion. It was found that the optimum experimental conditions are the same as in the ex-tractive spectrophotometric procedures.
It was found that: 0.1 μg ml-1 Mo (V) = 1.25 μg ml-1 tramadol hydrochloride.
Ion pair procedures using bromothymol blue (method F)
The utility of bromothymol blue as ion-pairing re-agent in assay of tramadol was investigated here. The spectra of the reaction products show characte-ristic λmax at 411 nm (Figure 4). The experimental con-ditions were established by varying one variable and observing its effect on the absorbance of the colored species as discussed below. Effect of bromothymol blue concentration. 1.5 ml of 0.05% bromothymol blue was found sufficient for tra-madol, more than this optimal concentration would decrease the absorbance of the formed complex (Figure 11). Effect of buffer pH and volume. Using different buffers of different pH in the range from 2-11, the intensity of the color of the formed complex increased when 2 ml of acetate buffer of pH 3.7 was used. Effect of extraction time and times of extractions. It was found that a single extraction of the ternary com-plex for 30 s was sufficient for quantitative extraction.
0.5
0.6
0.7
0 10 20 30Time (min)
Ab
sorb
ance
Figure 9. Effect of standing time before addition of the drug to Mo(V) thiocyanate complex on the reaction of molybdenum thiocyanate with 20 μg ml-1 tramadol.
0.2
0.4
0.6
0.8
0 10 20 30Time (min)
Ab
sorb
ance
Figure 10. Effect of standing time after addition of the drug to Mo(V) thiocyanate complex on the reaction of molybdenum thiocyanate with 20 μg ml-1 tramadol.

S.M. ANIS et al.: SPECTROPHOTOMETRIC, ATOMIC ABSORPTION… CI&CEQ 17 (3) 269−282 (2011)
277
Effect of organic solvent type. Chloroform, methylene chloride, diethyl ether and benzene were all tried. Me-thylene chloride was found to be most convenient sol-vent for dissolving the formed precipitate other sol-vents are not suitable owing to the limited solubility of the precipitate in these solvents. Effect of aqueous to organic phase ratio. Varying the ratio of aqueous phase to organic phase didn’t cause any reasonable change in the results so a (1:1) ratio was rather used.
Stoichiometric relationship
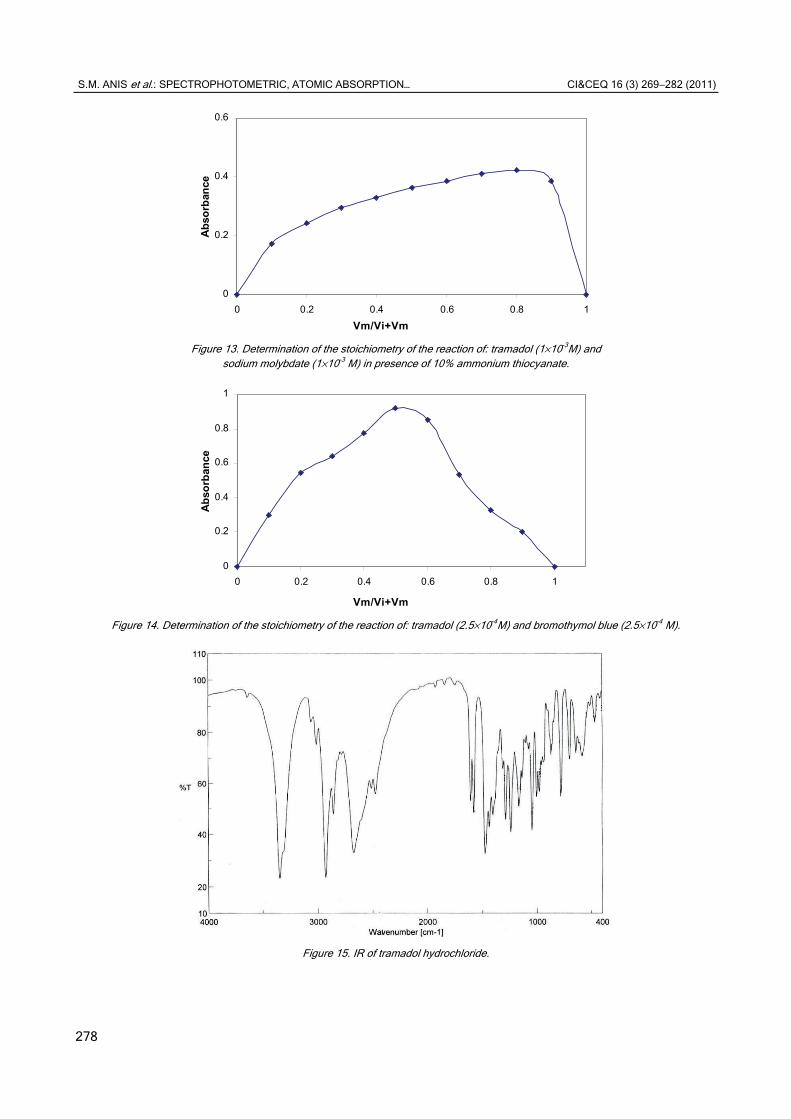
Using Job’s method of continuous variation, the molar ratio of tramadol to cobalt thiocyanate and mo-lybdenum thiocyanate was found to be 2:1 and 4:1, respectively, while for bromothymol blue it was found to be 1:1 (Figures 12-14).
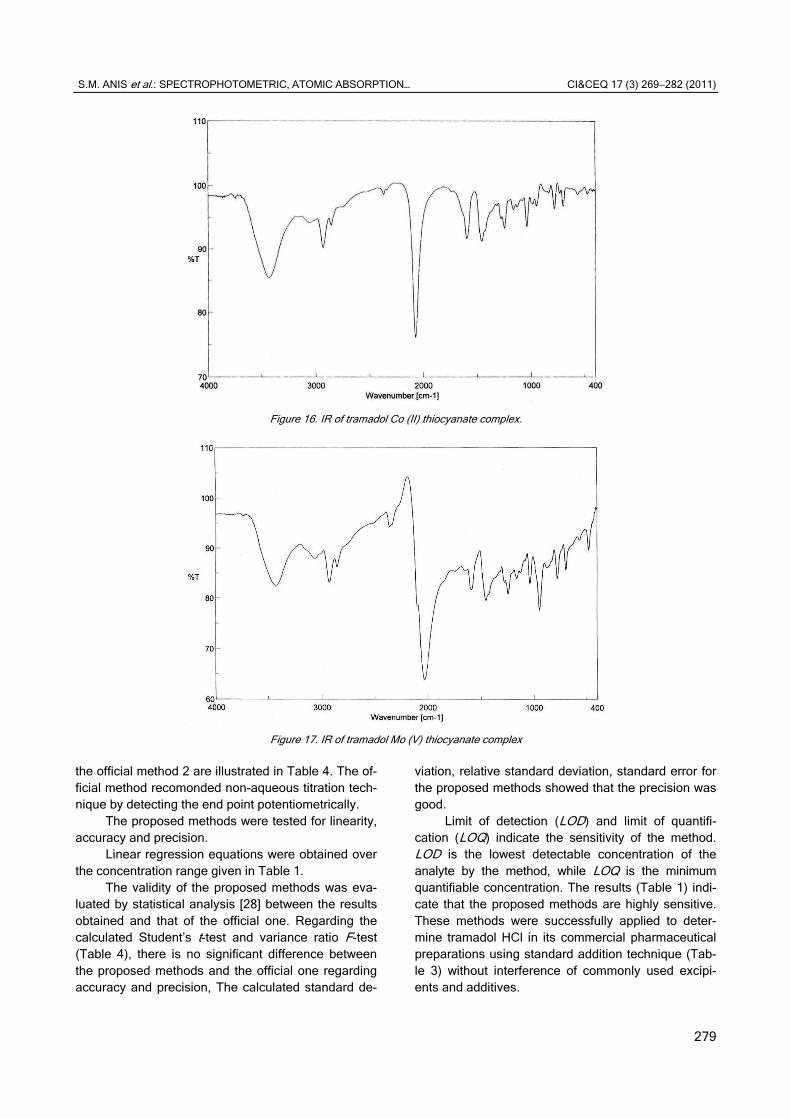
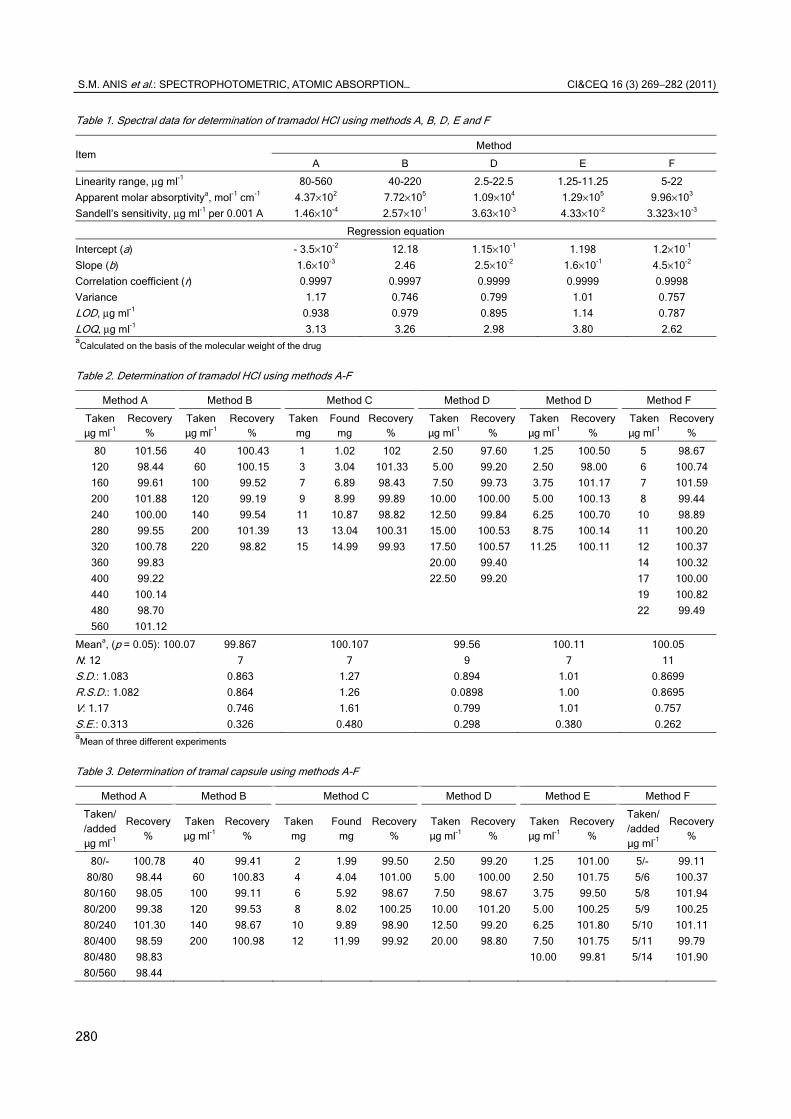
IR Charts
The ternary complexes formed from applying procedures A and D were isolated and subjected to
structural elucidation by means of infra red (IR). Tra-madol gave principal peaks at 2672.86, 2858.95, 2928.38, 3011.3, 3059.51, 3344.93, when the com-plexes were isolated, they gave the same peaks but with low intensity, in addition to the appearance of peak at 2071.17 or 2036.46 due to the presence of C=N group in the products (Figures 15-17).
Methods validation
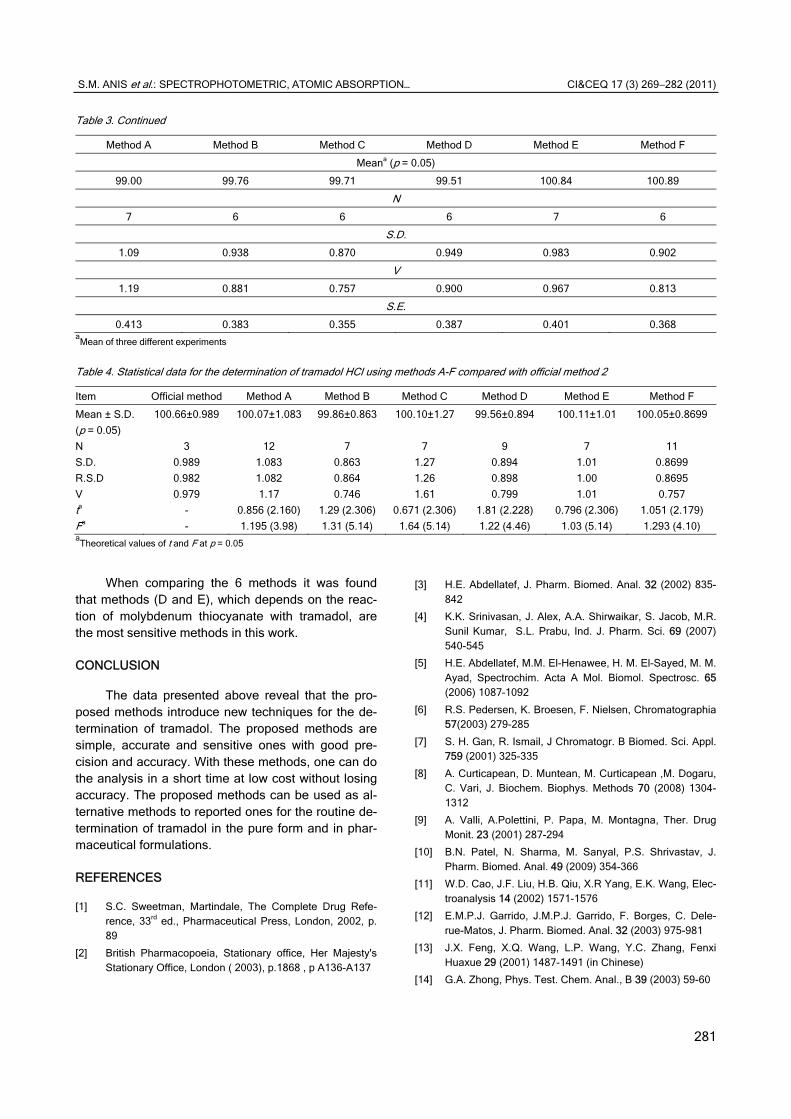
Under the experimental conditions described above the optical characteristics such as Beer’s law limits, Sandell’s sensitivity and molar absorptivity [27] were calculated for the proposed methods and the re-sults are summarized in Table 1.
Regression equations, intercepts, slopes and correlation coefficients for the calibration data are pre-sented also in the same table while standard devia-tion, relative standard deviation and standard error are summarized in Tables 2 and 3.
The percent recoveries of the pure drug using the proposed methods compared with that given by
0.25
0.35
0.45
0.55
0.25 0.75 1.25 1.75 2.25 2.75Reagent Volume
Ab
sorb
ance
Figure 11. Effect of volume of bromothymol blue on the reaction of bromothymol blue with 14 μg ml-1 tramadol.
0
0.2
0.4
0.6
0.8
1
0 0.2 0.4 0.6 0.8 1
Vm/Vi+Vm
Ab
sorb
ance
Figure 12. Determination of the stoichiometry of the reaction of: tramadol (2.5×10⁻²M) and CoCl2 (2.5×10⁻² M) in presence of NH4SCN (3 M).
S.M. ANIS et al.: SPECTROPHOTOMETRIC, ATOMIC ABSORPTION… CI&CEQ 16 (3) 269−282 (2011)
278
0
0.2
0.4
0.6
0 0.2 0.4 0.6 0.8 1
Vm/Vi+Vm
Ab
sorb
ance
Figure 13. Determination of the stoichiometry of the reaction of: tramadol (1×10⁻³M) and sodium molybdate (1×10⁻³ M) in presence of 10% ammonium thiocyanate.
0
0.2
0.4
0.6
0.8
1
0 0.2 0.4 0.6 0.8 1
Vm/Vi+Vm
Ab
sorb
ance
Figure 14. Determination of the stoichiometry of the reaction of: tramadol (2.5×10⁻⁴M) and bromothymol blue (2.5×10⁻⁴ M).
Figure 15. IR of tramadol hydrochloride.
S.M. ANIS et al.: SPECTROPHOTOMETRIC, ATOMIC ABSORPTION… CI&CEQ 17 (3) 269−282 (2011)
279
Figure 16. IR of tramadol Co (II) thiocyanate complex.
Figure 17. IR of tramadol Mo (V) thiocyanate complex
the official method 2 are illustrated in Table 4. The of-ficial method recomonded non-aqueous titration tech-nique by detecting the end point potentiometrically.
The proposed methods were tested for linearity, accuracy and precision.
Linear regression equations were obtained over the concentration range given in Table 1.
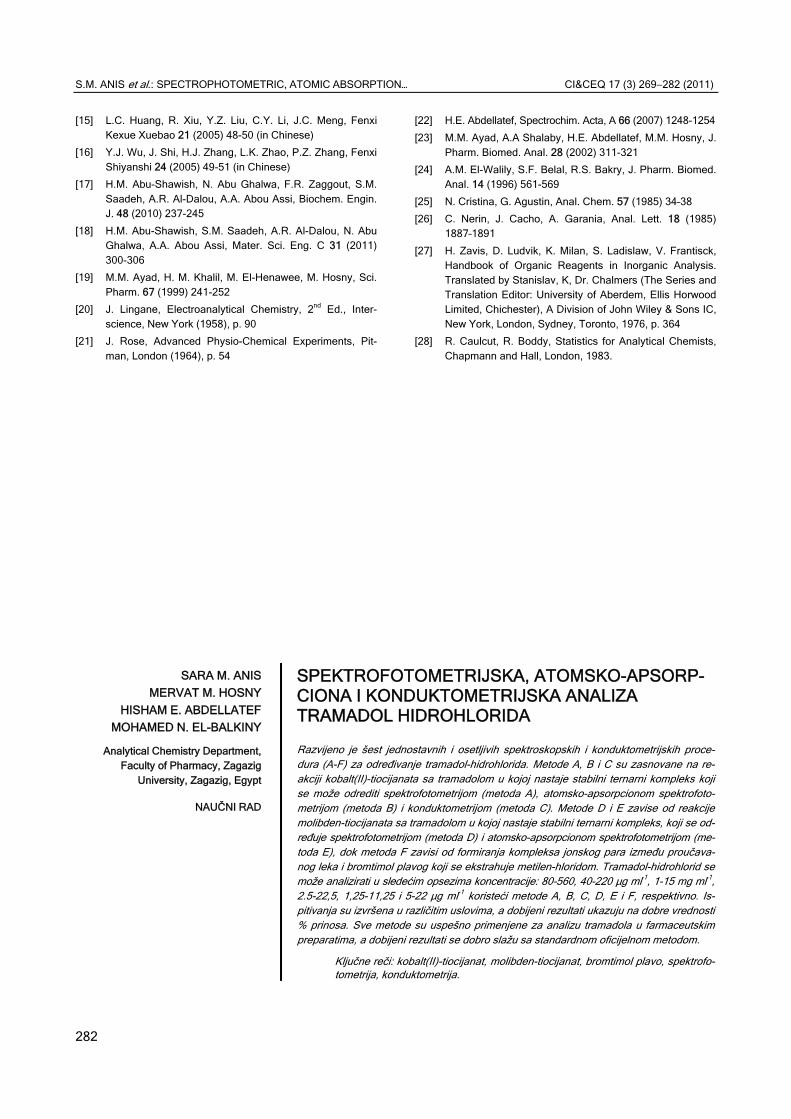
The validity of the proposed methods was eva-luated by statistical analysis [28] between the results obtained and that of the official one. Regarding the calculated Student’s t-test and variance ratio F-test (Table 4), there is no significant difference between the proposed methods and the official one regarding accuracy and precision, The calculated standard de-
viation, relative standard deviation, standard error for the proposed methods showed that the precision was good.
Limit of detection (LOD) and limit of quantifi-cation (LOQ) indicate the sensitivity of the method. LOD is the lowest detectable concentration of the analyte by the method, while LOQ is the minimum quantifiable concentration. The results (Table 1) indi-cate that the proposed methods are highly sensitive. These methods were successfully applied to deter-mine tramadol HCl in its commercial pharmaceutical preparations using standard addition technique (Tab-le 3) without interference of commonly used excipi-ents and additives.
S.M. ANIS et al.: SPECTROPHOTOMETRIC, ATOMIC ABSORPTION… CI&CEQ 16 (3) 269−282 (2011)
280
Table 1. Spectral data for determination of tramadol HCl using methods A, B, D, E and F
Item Method
A B D E F
Linearity range, μg ml-1
Apparent molar absorptivitya, mol-1 cm-1
Sandell’s sensitivity, μg ml-1 per 0.001 A
80-560
4.37×10²
1.46×10⁻⁴
40-220
7.72×10⁵
2.57×10⁻¹
2.5-22.5
1.09×10⁴
3.63×10⁻³
1.25-11.25
1.29×10⁵
4.33×10⁻²
5-22
9.96×10³
3.323×10⁻³
Regression equation
Intercept (a)
Slope (b)
Correlation coefficient (r)
Variance
LOD, μg ml-1
LOQ, μg ml-1
- 3.5×10⁻²
1.6×10⁻³
0.9997
1.17
0.938
3.13
12.18
2.46
0.9997
0.746
0.979
3.26
1.15×10⁻¹
2.5×10⁻²
0.9999
0.799
0.895
2.98
1.198
1.6×10⁻¹
0.9999
1.01
1.14
3.80
1.2×10⁻¹
4.5×10⁻²
0.9998
0.757
0.787
2.62 aCalculated on the basis of the molecular weight of the drug
Table 2. Determination of tramadol HCl using methods A-F
Method A Method B Method C Method D Method D Method F
Taken μg ml-1
Recovery %
Taken μg ml-1
Recovery %
Taken mg
Foundmg
Recovery%
Takenμg ml-1
Recovery%
Takenμg ml-1
Recovery %
Takenμg ml-1
Recovery%
80
120
160
200
240
280
320
360
400
440
480
560
101.56
98.44
99.61
101.88
100.00
99.55
100.78
99.83
99.22
100.14
98.70
101.12
40
60
100
120
140
200
220
100.43
100.15
99.52
99.19
99.54
101.39
98.82
1
3
7
9
11
13
15
1.02
3.04
6.89
8.99
10.87
13.04
14.99
102
101.33
98.43
99.89
98.82
100.31
99.93
2.50
5.00
7.50
10.00
12.50
15.00
17.50
20.00
22.50
97.60
99.20
99.73
100.00
99.84
100.53
100.57
99.40
99.20
1.25
2.50
3.75
5.00
6.25
8.75
11.25
100.50
98.00
101.17
100.13
100.70
100.14
100.11
5
6
7
8
10
11
12
14
17
19
22
98.67
100.74
101.59
99.44
98.89
100.20
100.37
100.32
100.00
100.82
99.49
Meana, (p = 0.05): 100.07
N: 12
S.D.: 1.083
R.S.D.: 1.082
V: 1.17
S.E.: 0.313
99.867
7
0.863
0.864
0.746
0.326
100.107
7
1.27
1.26
1.61
0.480
99.56
9
0.894
0.0898
0.799
0.298
100.11
7
1.01
1.00
1.01
0.380
100.05
11
0.8699
0.8695
0.757
0.262 aMean of three different experiments
Table 3. Determination of tramal capsule using methods A-F
Method A Method B Method C Method D Method E Method F
Taken/ /added μg ml-1
Recovery %
Taken μg ml-1
Recovery %
Taken mg
Foundmg
Recovery%
Takenμg ml-1
Recovery%
Takenμg ml-1
Recovery %
Taken//addedμg ml-1
Recovery%
80/-
80/80
80/160
80/200
80/240
80/400
80/480
80/560
100.78
98.44
98.05
99.38
101.30
98.59
98.83
98.44
40
60
100
120
140
200
99.41
100.83
99.11
99.53
98.67
100.98
2
4
6
8
10
12
1.99
4.04
5.92
8.02
9.89
11.99
99.50
101.00
98.67
100.25
98.90
99.92
2.50
5.00
7.50
10.00
12.50
20.00
99.20
100.00
98.67
101.20
99.20
98.80
1.25
2.50
3.75
5.00
6.25
7.50
10.00
101.00
101.75
99.50
100.25
101.80
101.75
99.81
5/-
5/6
5/8
5/9
5/10
5/11
5/14
99.11
100.37
101.94
100.25
101.11
99.79
101.90
S.M. ANIS et al.: SPECTROPHOTOMETRIC, ATOMIC ABSORPTION… CI&CEQ 17 (3) 269−282 (2011)
281
Table 3. Continued
Method A Method B Method C Method D Method E Method F
Meana (p = 0.05)
99.00 99.76 99.71 99.51 100.84 100.89
N
7 6 6 6 7 6
S.D.
1.09 0.938 0.870 0.949 0.983 0.902
V
1.19 0.881 0.757 0.900 0.967 0.813
S.E.
0.413 0.383 0.355 0.387 0.401 0.368 aMean of three different experiments
Table 4. Statistical data for the determination of tramadol HCl using methods A-F compared with official method 2
Item Official method Method A Method B Method C Method D Method E Method F
Mean ± S.D.
(p = 0.05)
N
S.D.
R.S.D
V
ta
Fa
100.66±0.989
3
0.989
0.982
0.979
-
-
100.07±1.083
12
1.083
1.082
1.17
0.856 (2.160)
1.195 (3.98)
99.86±0.863
7
0.863
0.864
0.746
1.29 (2.306)
1.31 (5.14)
100.10±1.27
7
1.27
1.26
1.61
0.671 (2.306)
1.64 (5.14)
99.56±0.894
9
0.894
0.898
0.799
1.81 (2.228)
1.22 (4.46)
100.11±1.01
7
1.01
1.00
1.01
0.796 (2.306)
1.03 (5.14)
100.05±0.8699
11
0.8699
0.8695
0.757
1.051 (2.179)
1.293 (4.10) aTheoretical values of t and F at p = 0.05
When comparing the 6 methods it was found
that methods (D and E), which depends on the reac-tion of molybdenum thiocyanate with tramadol, are the most sensitive methods in this work.
CONCLUSION
The data presented above reveal that the pro-posed methods introduce new techniques for the de-termination of tramadol. The proposed methods are simple, accurate and sensitive ones with good pre-cision and accuracy. With these methods, one can do the analysis in a short time at low cost without losing accuracy. The proposed methods can be used as al-ternative methods to reported ones for the routine de-termination of tramadol in the pure form and in phar-maceutical formulations.
REFERENCES
[1] S.C. Sweetman, Martindale, The Complete Drug Refe-rence, 33rd ed., Pharmaceutical Press, London, 2002, p. 89
[2] British Pharmacopoeia, Stationary office, Her Majesty's Stationary Office, London ( 2003), p.1868 , p A136-A137
[3] H.E. Abdellatef, J. Pharm. Biomed. Anal. 32 (2002) 835-842
[4] K.K. Srinivasan, J. Alex, A.A. Shirwaikar, S. Jacob, M.R. Sunil Kumar, S.L. Prabu, Ind. J. Pharm. Sci. 69 (2007) 540-545
[5] H.E. Abdellatef, M.M. El-Henawee, H. M. El-Sayed, M. M. Ayad, Spectrochim. Acta A Mol. Biomol. Spectrosc. 65 (2006) 1087–1092
[6] R.S. Pedersen, K. Broesen, F. Nielsen, Chromatographia 57(2003) 279-285
[7] S. H. Gan, R. Ismail, J Chromatogr. B Biomed. Sci. Appl. 759 (2001) 325-335
[8] A. Curticapean, D. Muntean, M. Curticapean ,M. Dogaru, C. Vari, J. Biochem. Biophys. Methods 70 (2008) 1304-1312
[9] A. Valli, A.Polettini, P. Papa, M. Montagna, Ther. Drug Monit. 23 (2001) 287-294
[10] B.N. Patel, N. Sharma, M. Sanyal, P.S. Shrivastav, J. Pharm. Biomed. Anal. 49 (2009) 354-366
[11] W.D. Cao, J.F. Liu, H.B. Qiu, X.R Yang, E.K. Wang, Elec-troanalysis 14 (2002) 1571-1576
[12] E.M.P.J. Garrido, J.M.P.J. Garrido, F. Borges, C. Dele-rue-Matos, J. Pharm. Biomed. Anal. 32 (2003) 975-981
[13] J.X. Feng, X.Q. Wang, L.P. Wang, Y.C. Zhang, Fenxi Huaxue 29 (2001) 1487-1491 (in Chinese)
[14] G.A. Zhong, Phys. Test. Chem. Anal., B 39 (2003) 59-60
S.M. ANIS et al.: SPECTROPHOTOMETRIC, ATOMIC ABSORPTION… CI&CEQ 17 (3) 269−282 (2011)
282
[15] L.C. Huang, R. Xiu, Y.Z. Liu, C.Y. Li, J.C. Meng, Fenxi Kexue Xuebao 21 (2005) 48-50 (in Chinese)
[16] Y.J. Wu, J. Shi, H.J. Zhang, L.K. Zhao, P.Z. Zhang, Fenxi Shiyanshi 24 (2005) 49-51 (in Chinese)
[17] H.M. Abu-Shawish, N. Abu Ghalwa, F.R. Zaggout, S.M. Saadeh, A.R. Al-Dalou, A.A. Abou Assi, Biochem. Engin. J. 48 (2010) 237-245
[18] H.M. Abu-Shawish, S.M. Saadeh, A.R. Al-Dalou, N. Abu Ghalwa, A.A. Abou Assi, Mater. Sci. Eng. C 31 (2011) 300-306
[19] M.M. Ayad, H. M. Khalil, M. El-Henawee, M. Hosny, Sci. Pharm. 67 (1999) 241-252
[20] J. Lingane, Electroanalytical Chemistry, 2nd Ed., Inter-science, New York (1958), p. 90
[21] J. Rose, Advanced Physio-Chemical Experiments, Pit-man, London (1964), p. 54
[22] H.E. Abdellatef, Spectrochim. Acta, A 66 (2007) 1248-1254
[23] M.M. Ayad, A.A Shalaby, H.E. Abdellatef, M.M. Hosny, J. Pharm. Biomed. Anal. 28 (2002) 311-321
[24] A.M. El-Walily, S.F. Belal, R.S. Bakry, J. Pharm. Biomed. Anal. 14 (1996) 561-569
[25] N. Cristina, G. Agustin, Anal. Chem. 57 (1985) 34–38
[26] C. Nerin, J. Cacho, A. Garania, Anal. Lett. 18 (1985) 1887–1891
[27] H. Zavis, D. Ludvik, K. Milan, S. Ladislaw, V. Frantisck, Handbook of Organic Reagents in Inorganic Analysis. Translated by Stanislav, K, Dr. Chalmers (The Series and Translation Editor: University of Aberdem, Ellis Horwood Limited, Chichester), A Division of John Wiley & Sons IC, New York, London, Sydney, Toronto, 1976, p. 364
[28] R. Caulcut, R. Boddy, Statistics for Analytical Chemists, Chapmann and Hall, London, 1983.
SARA M. ANIS
MERVAT M. HOSNY
HISHAM E. ABDELLATEF
MOHAMED N. EL-BALKINY
Analytical Chemistry Department, Faculty of Pharmacy, Zagazig
University, Zagazig, Egypt
NAUČNI RAD
SPEKTROFOTOMETRIJSKA, ATOMSKO-APSORP-CIONA I KONDUKTOMETRIJSKA ANALIZA TRAMADOL HIDROHLORIDA
Razvijeno je šest jednostavnih i osetljivih spektroskopskih i konduktometrijskih proce-dura (A-F) za određivanje tramadol-hidrohlorida. Metode A, B i C su zasnovane na re-akciji kobalt(II)-tiocijanata sa tramadolom u kojoj nastaje stabilni ternarni kompleks koji se može odrediti spektrofotometrijom (metoda A), atomsko-apsorpcionom spektrofoto-metrijom (metoda B) i konduktometrijom (metoda C). Metode D i E zavise od reakcije molibden-tiocijanata sa tramadolom u kojoj nastaje stabilni ternarni kompleks, koji se od-ređuje spektrofotometrijom (metoda D) i atomsko-apsorpcionom spektrofotometrijom (me-toda E), dok metoda F zavisi od formiranja kompleksa jonskog para između proučava-nog leka i bromtimol plavog koji se ekstrahuje metilen-hloridom. Tramadol-hidrohlorid se može analizirati u sledećim opsezima koncentracije: 80-560, 40-220 μg ml-1, 1-15 mg ml-1, 2.5-22,5, 1,25-11,25 i 5-22 μg ml-1 koristeći metode A, B, C, D, E i F, respektivno. Is-pitivanja su izvršena u različitim uslovima, a dobijeni rezultati ukazuju na dobre vrednosti % prinosa. Sve metode su uspešno primenjene za analizu tramadola u farmaceutskim preparatima, a dobijeni rezultati se dobro slažu sa standardnom oficijelnom metodom.
Ključne reči: kobalt(II)-tiocijanat, molibden-tiocijanat, bromtimol plavo, spektrofo-tometrija, konduktometrija.